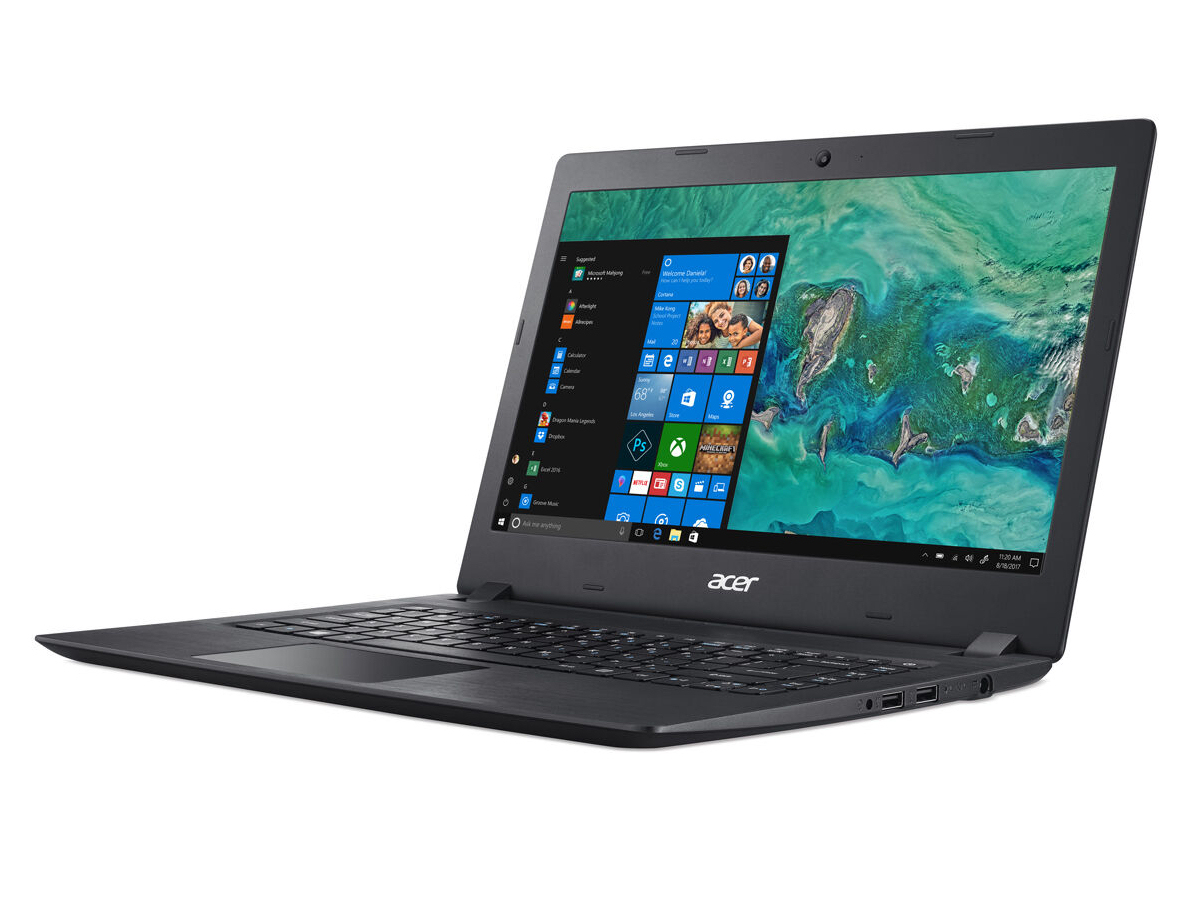
Acer Aspire 1 A114-32 (Pentium Silver N5000, eMMC, FHD) Laptop Review

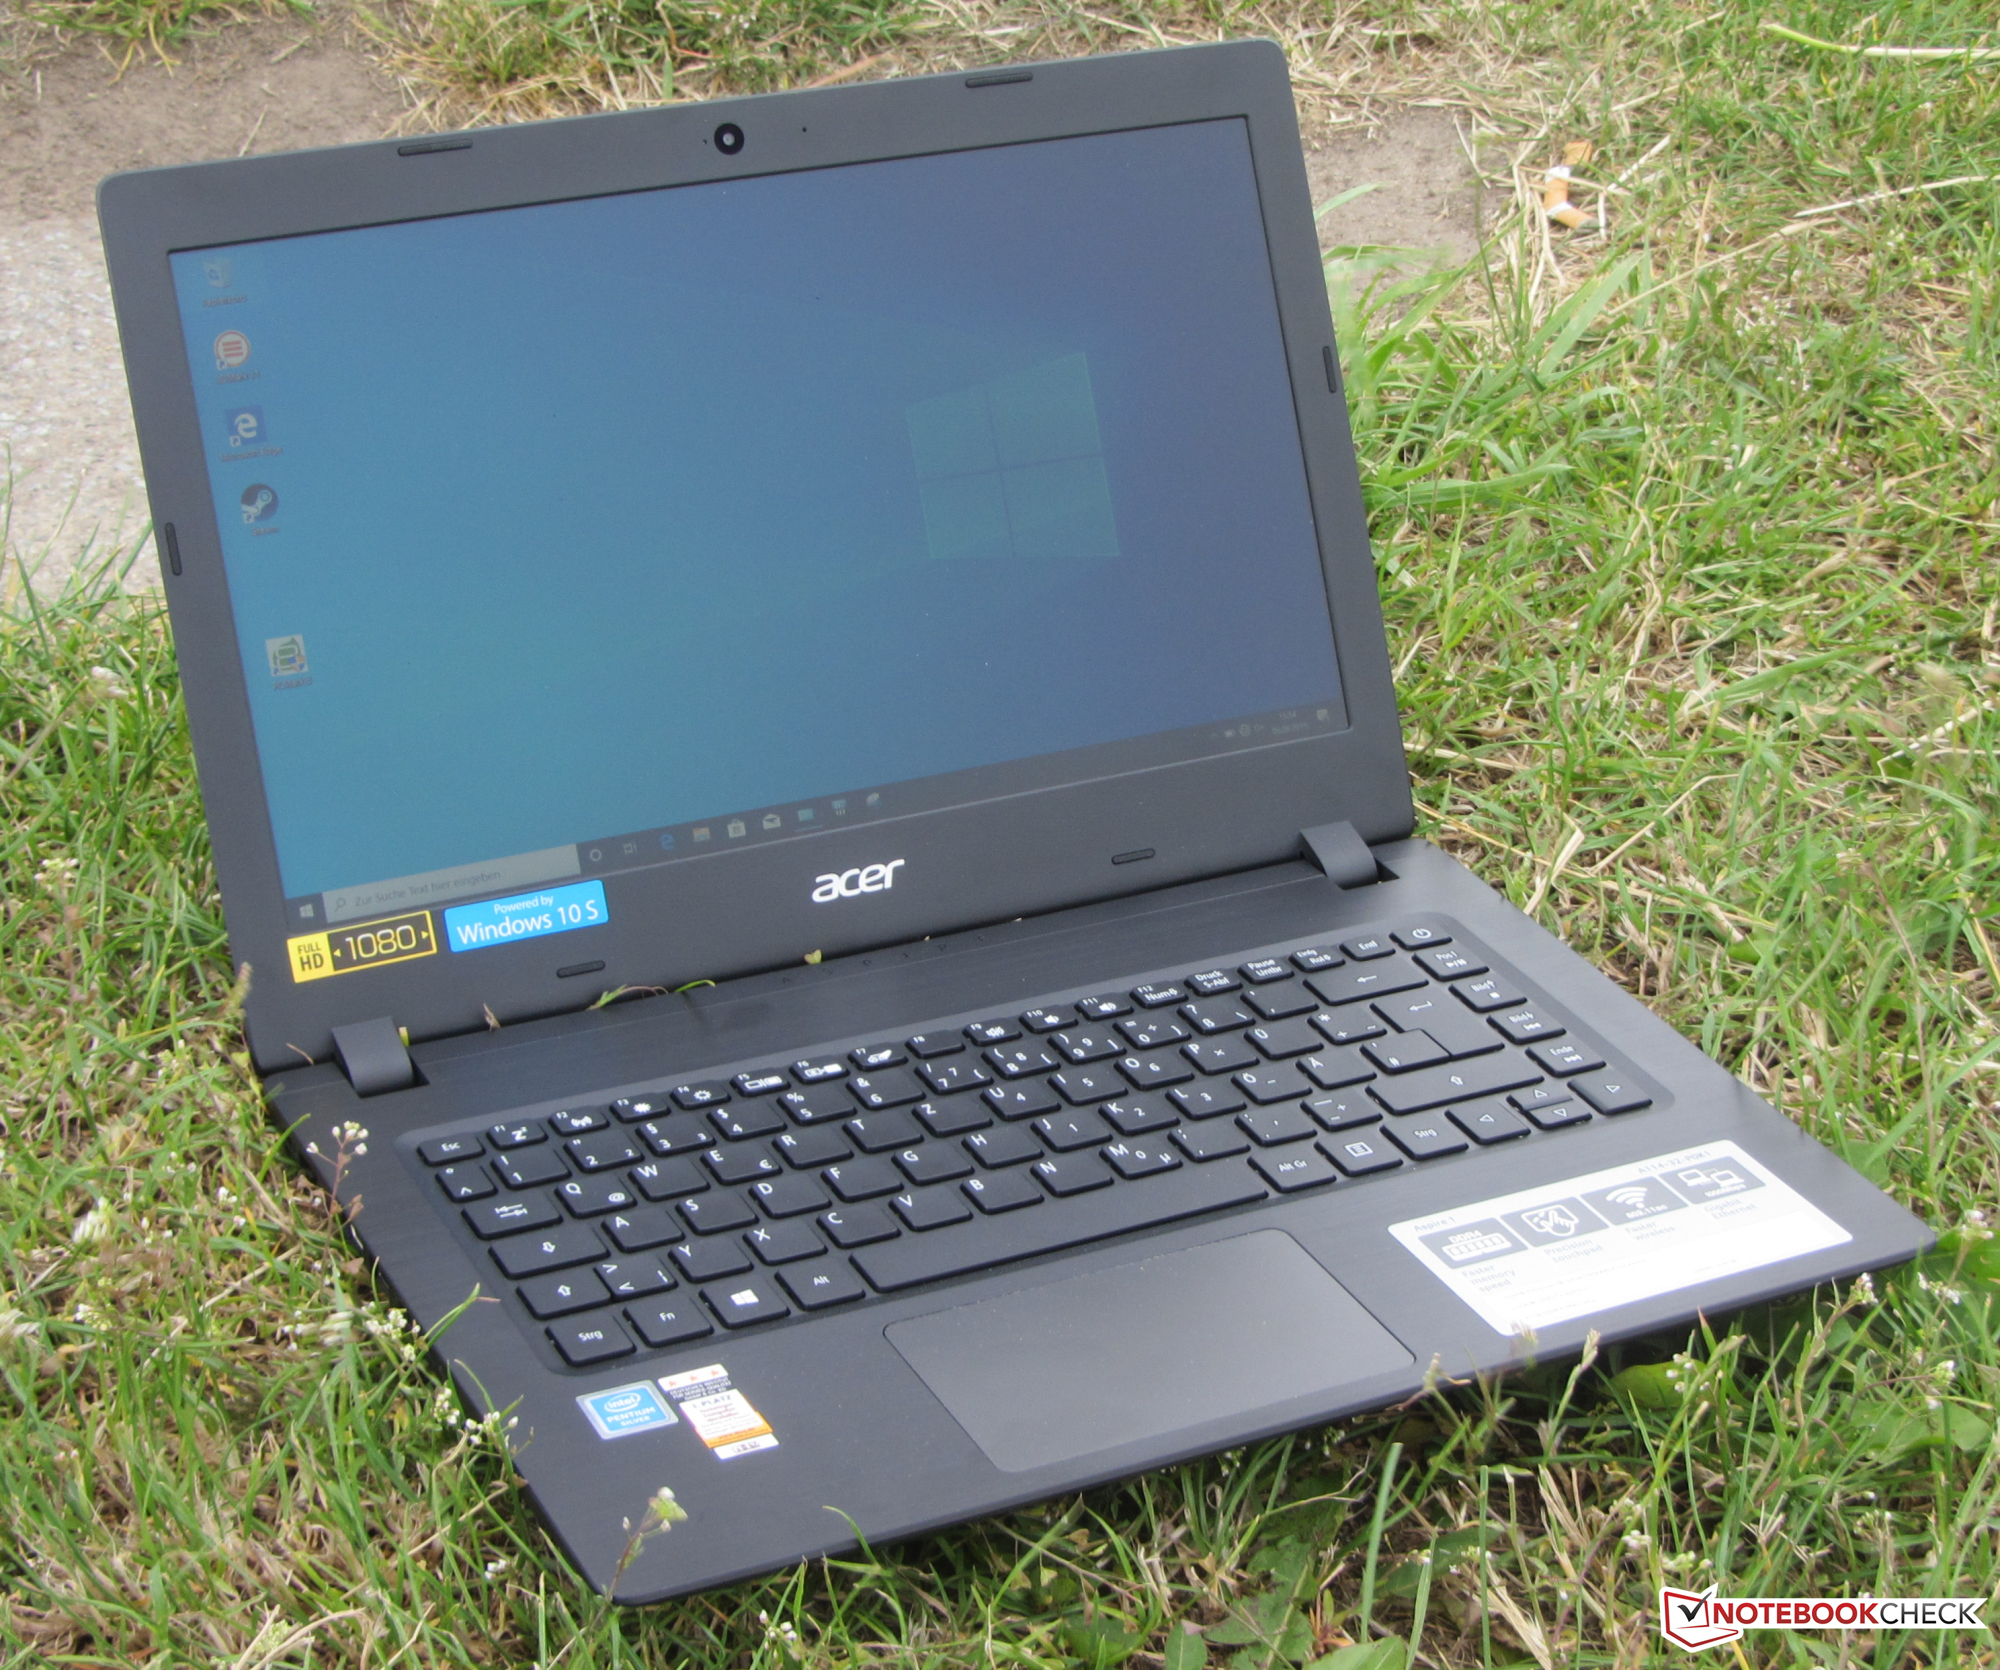
The Aspire 1 A114-32 is among the simple office laptops that come in a 14-inch format. The operating system is Windows 10 S in this case. Microsoft offers a free upgrade to Windows 10 Pro though. We did this upgrade in order to be able to conduct our review. The Aspire is not an unknown device to us. We have already reviewed the identically built A114-31 predecessor, which was configured with an Apollo Lake processor. Our current review device has a Gemini Lake processor on board. The Lenovo V130-14IGM, the Trekstor Primebook C13, the Chuwi LapBook SE, the HP 14, the Chuwi HeroBook 14 and the HP Chromebook 14 G5 are among the competitors.
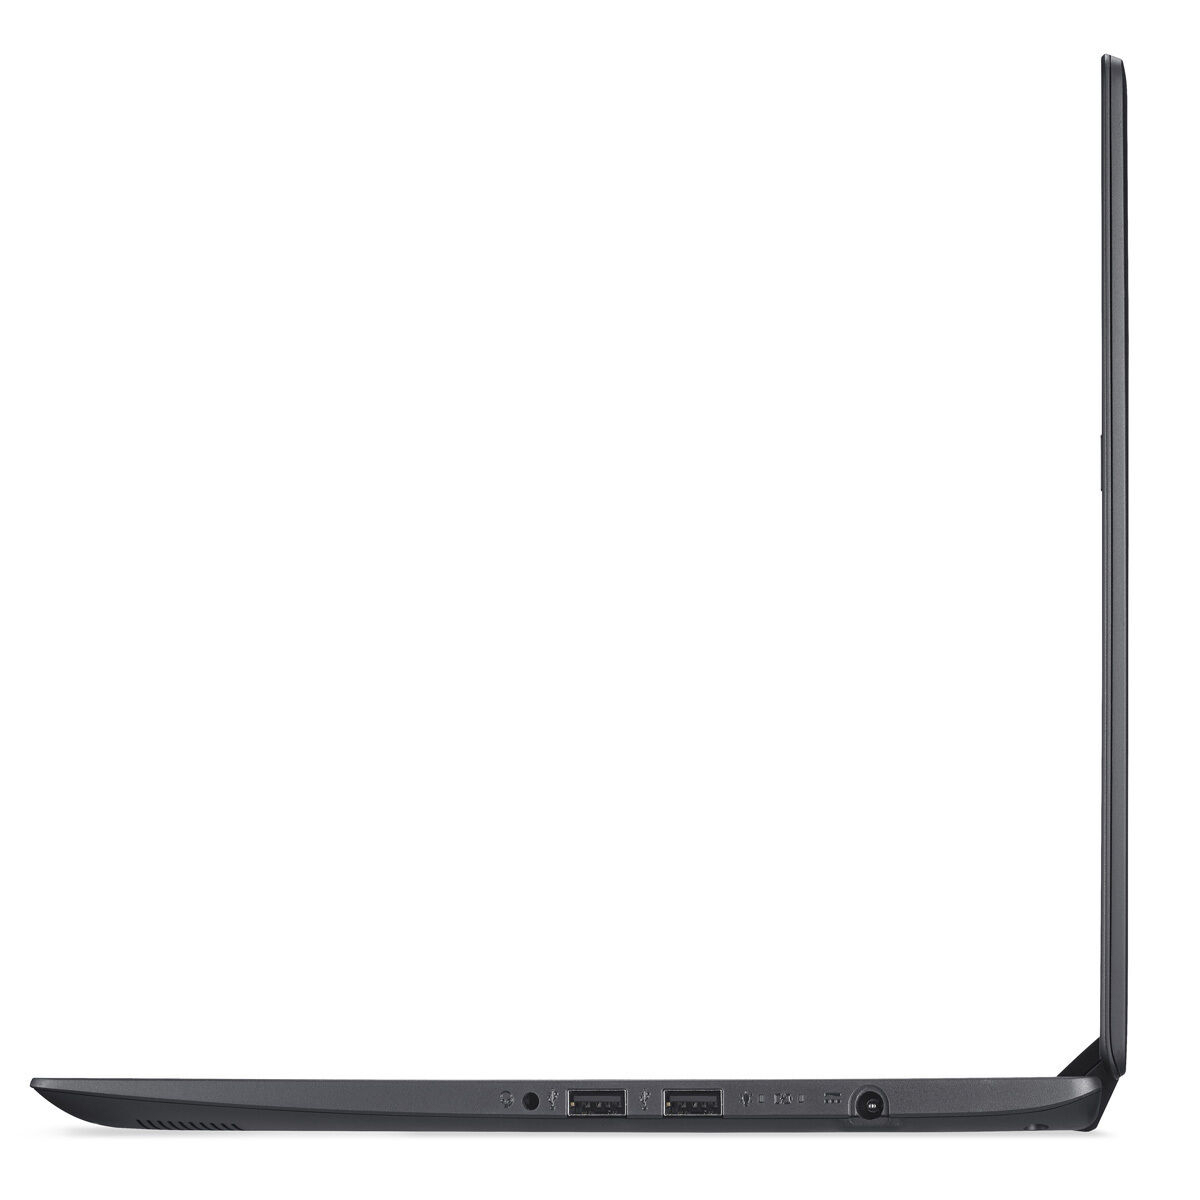
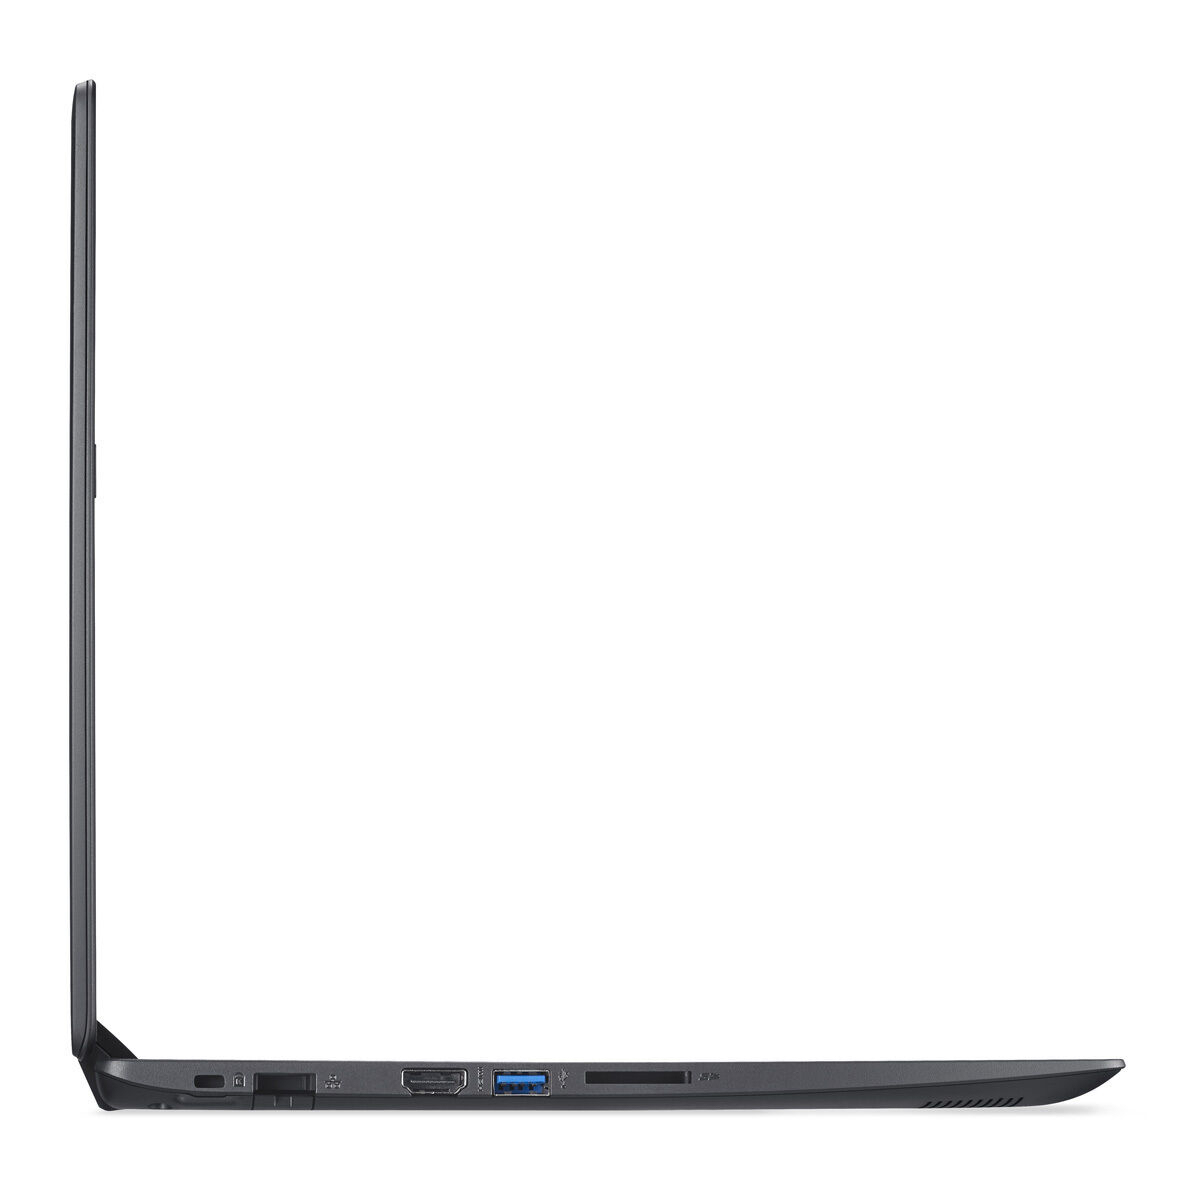
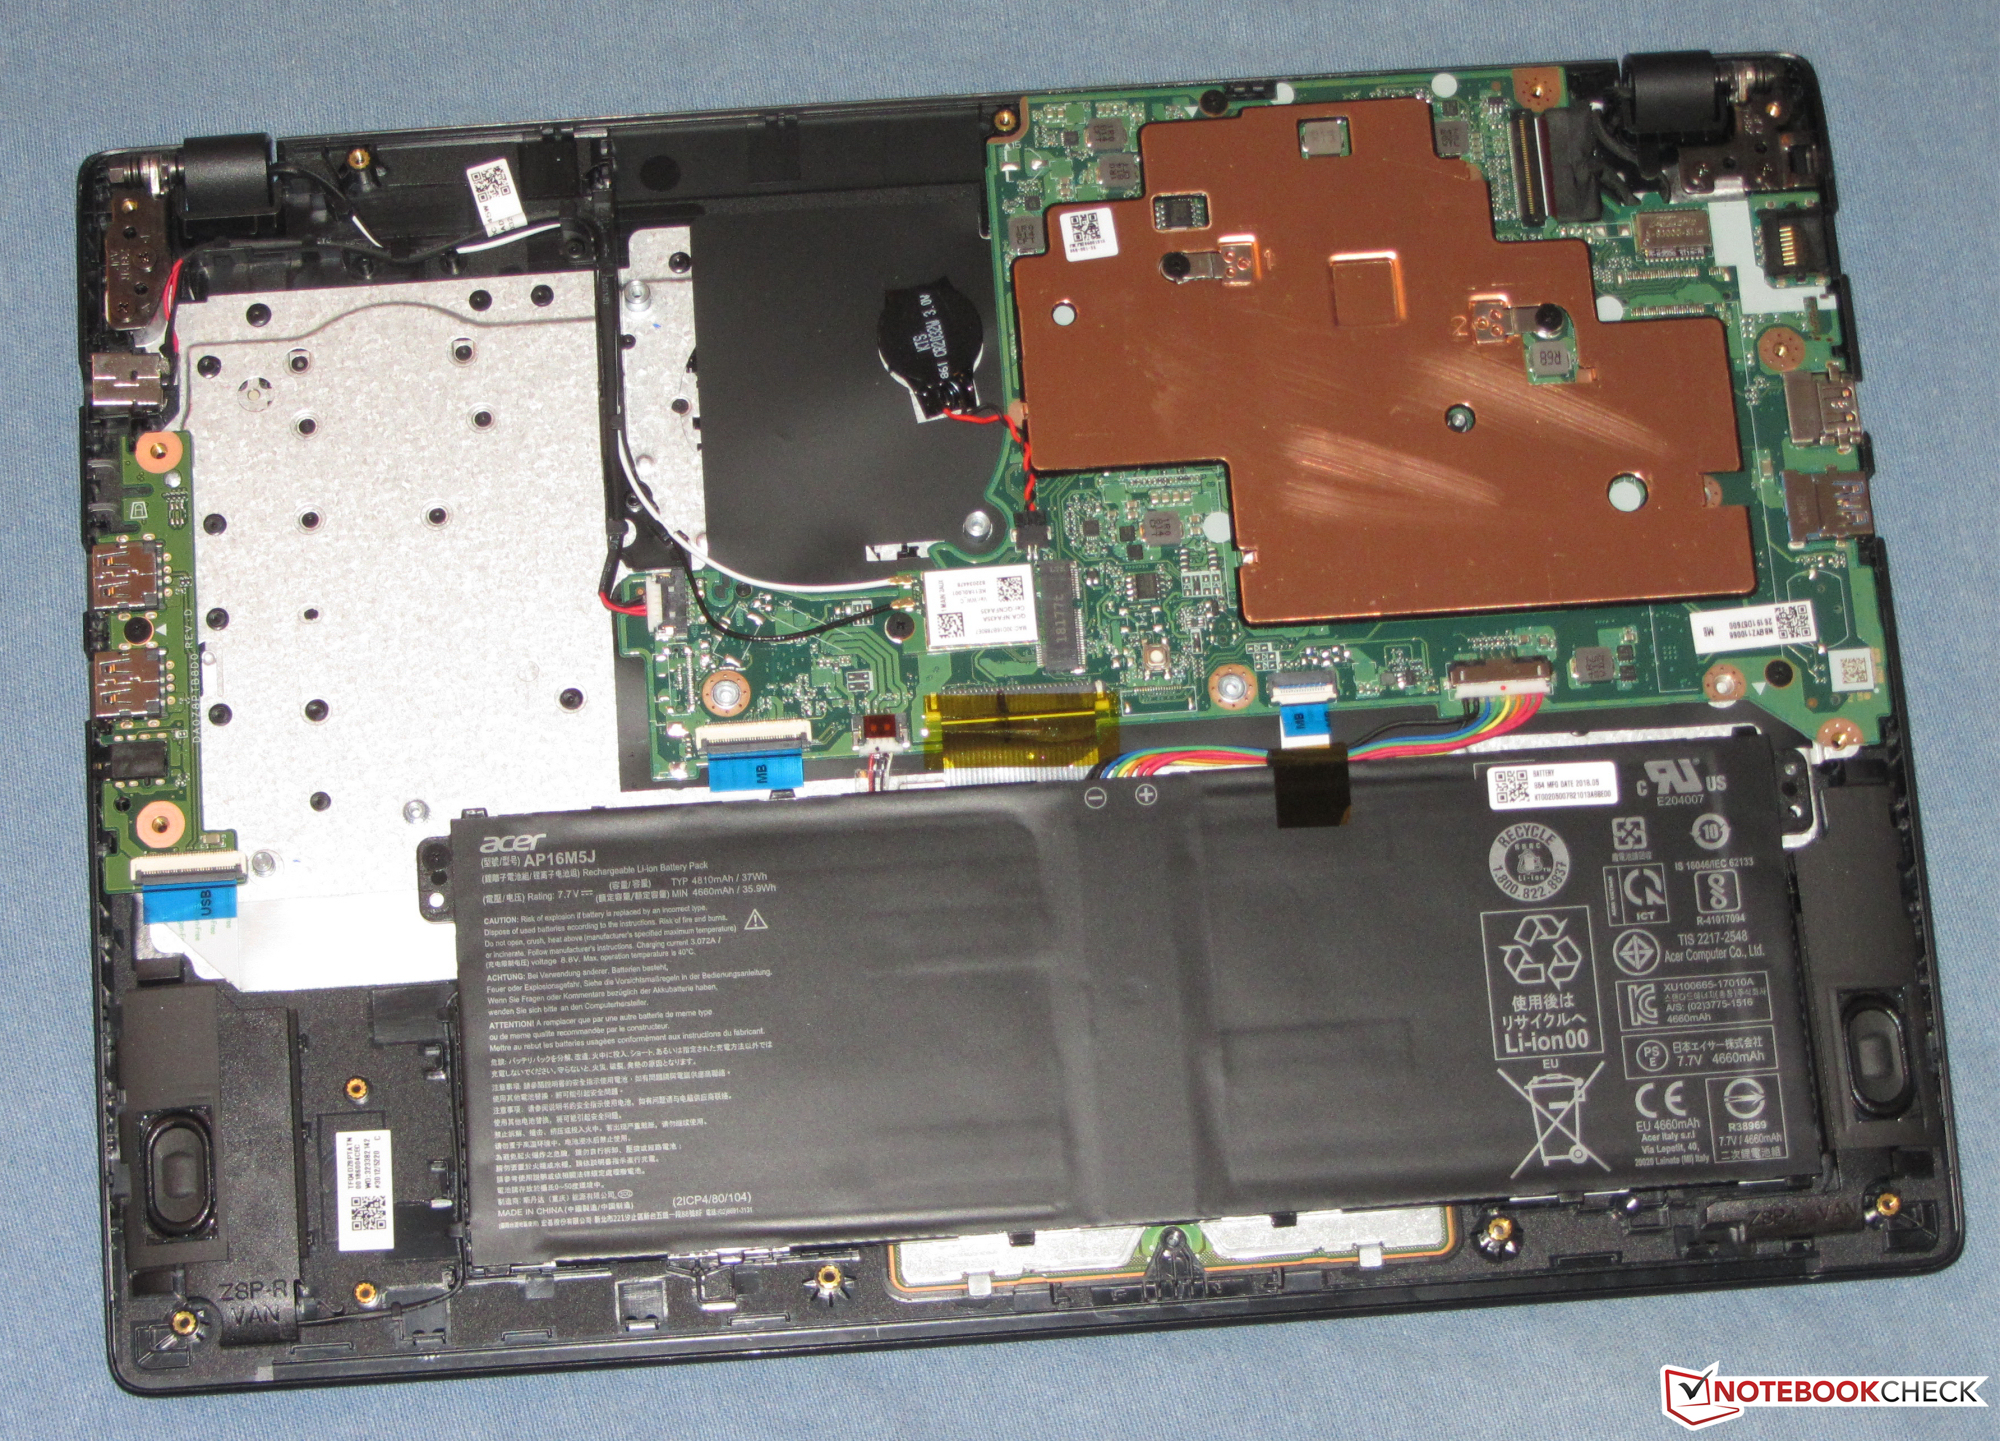
Since the A114-32 and the A114-31 are built identically, we won't go over the case, connectivity, input devices or speakers. The corresponding information can be found in our Aspire 1 A114-31 laptop review (in German).
| SD Card Reader | |
| average JPG Copy Test (av. of 3 runs) | |
| Acer Aspire 1 A114-31-C472 (Toshiba Exceria Pro SDXC 64 GB UHS-II) | |
| Acer Aspire 1 A114-32-P0K1 (Toshiba Exceria Pro SDXC 64 GB UHS-II) | |
| Average of class Office (19.8 - 198.5, n=21, last 2 years) | |
| HP 14-bp001ng (Toshiba Exceria Pro SDXC 64 GB UHS-II) | |
| Chuwi LapBook SE | |
| Trekstor Primebook C13 (Toshiba Exceria Pro M501 microSDXC 64GB) | |
| Chuwi HeroBook 14 (Toshiba Exceria Pro M501 64 GB UHS-II) | |
| maximum AS SSD Seq Read Test (1GB) | |
| Acer Aspire 1 A114-31-C472 (Toshiba Exceria Pro SDXC 64 GB UHS-II) | |
| Acer Aspire 1 A114-32-P0K1 (Toshiba Exceria Pro SDXC 64 GB UHS-II) | |
| Average of class Office (27.4 - 249, n=20, last 2 years) | |
| HP 14-bp001ng (Toshiba Exceria Pro SDXC 64 GB UHS-II) | |
| Trekstor Primebook C13 (Toshiba Exceria Pro M501 microSDXC 64GB) | |
| Chuwi LapBook SE | |
| Chuwi HeroBook 14 (Toshiba Exceria Pro M501 64 GB UHS-II) | |
| Lenovo V130-14IGM (Toshiba Exceria Pro SDXC 64 GB UHS-II) | |
| Networking | |
| iperf3 transmit AX12 | |
| Trekstor Primebook C13 | |
| Lenovo V130-14IGM | |
| Acer Aspire 1 A114-32-P0K1 | |
| Chuwi LapBook SE | |
| Acer Aspire 1 A114-31-C472 | |
| HP 14-bp001ng | |
| Chuwi HeroBook 14 | |
| iperf3 receive AX12 | |
| Acer Aspire 1 A114-31-C472 | |
| Acer Aspire 1 A114-32-P0K1 | |
| Trekstor Primebook C13 | |
| Chuwi LapBook SE | |
| Lenovo V130-14IGM | |
| Chuwi HeroBook 14 | |
| HP 14-bp001ng | |
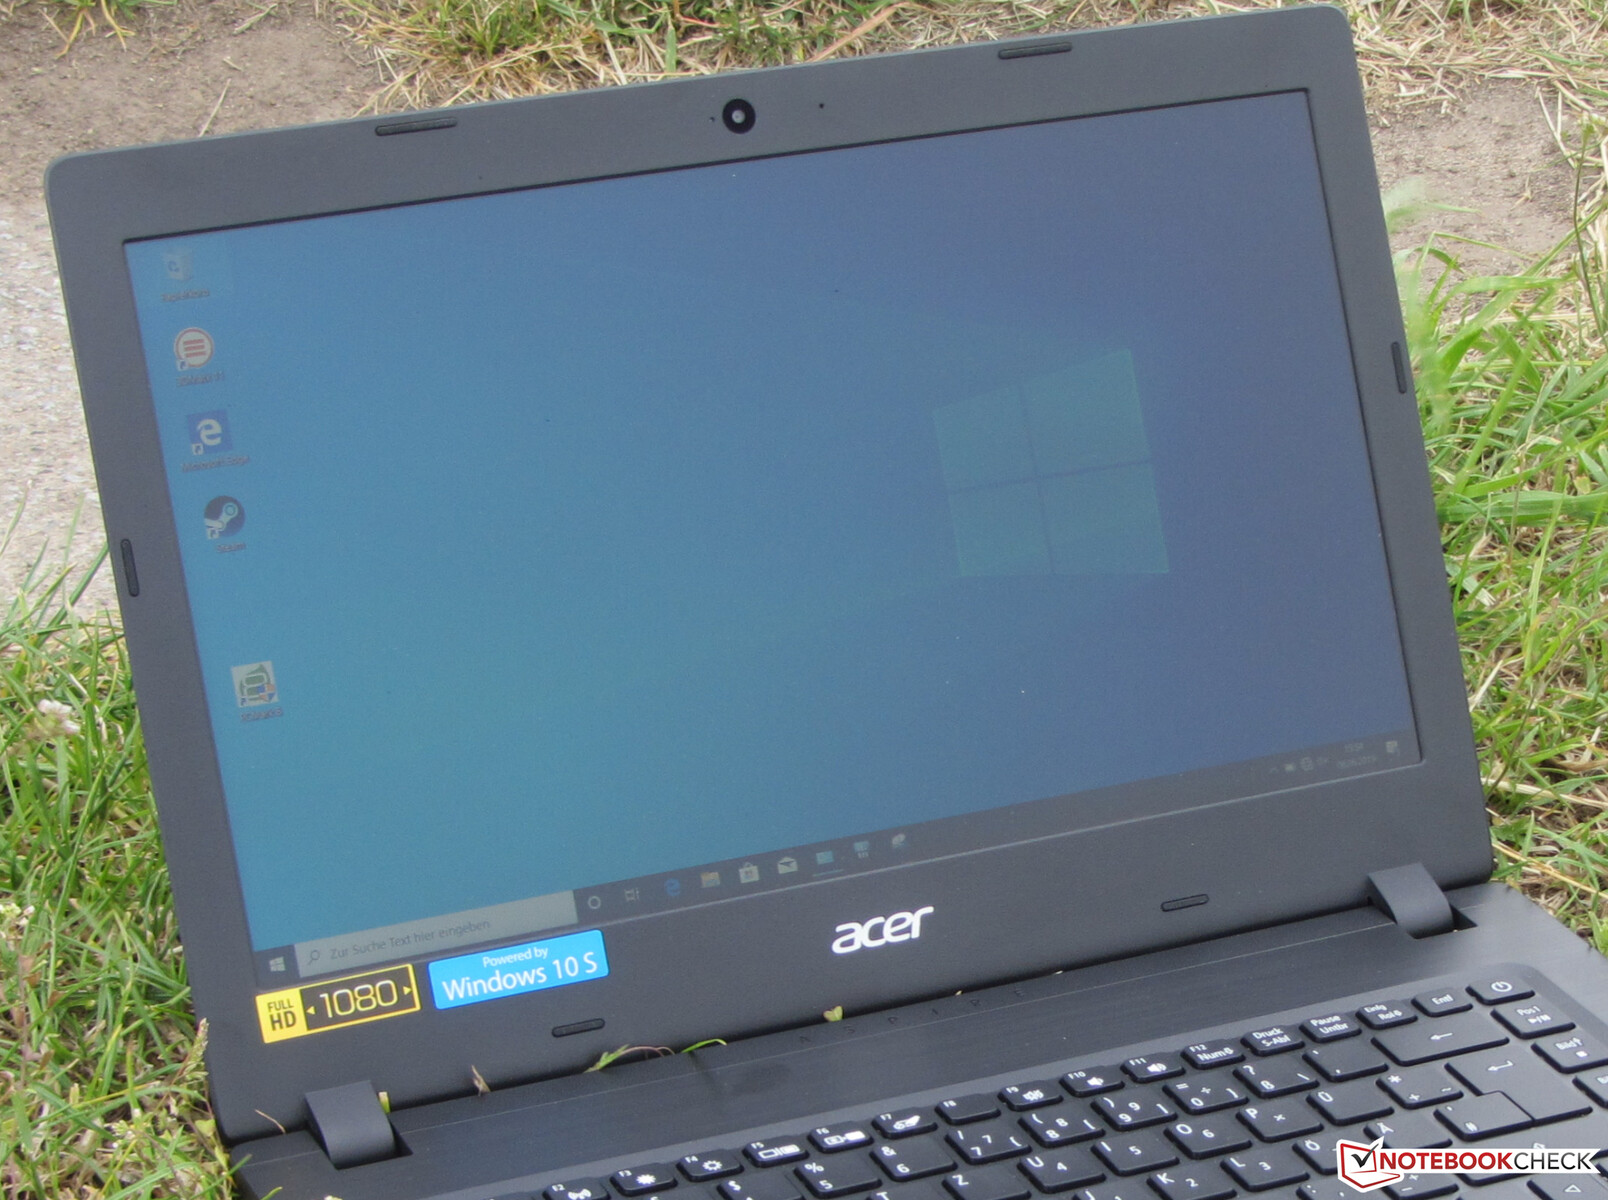
Display - Dim, poor contrast, unstable viewing angles
The matte 14-inch display in the A114-32 has a native resolution of 1920x1080 pixels. The brightness (192.4 cd/m²) and contrast (507:1) are too low. We find values beyond 300 cd/m² and 1000:1, respectively, to be good. However, these values aren't expected of devices at this price point. No laptop in our test field is able to reach the brightness target; the contrast target is only surpassed by two laptops. Unfortunately, the display in the Aspire shows flickering at a frequency of 250 Hz on brightness levels of 20% and below. The comparatively low frequency could lead to headaches and/or eye strain for sensitive users.
| |||||||||||||||||||||||||
Brightness Distribution: 85 %
Center on Battery: 208 cd/m²
Contrast: 507:1 (Black: 0.41 cd/m²)
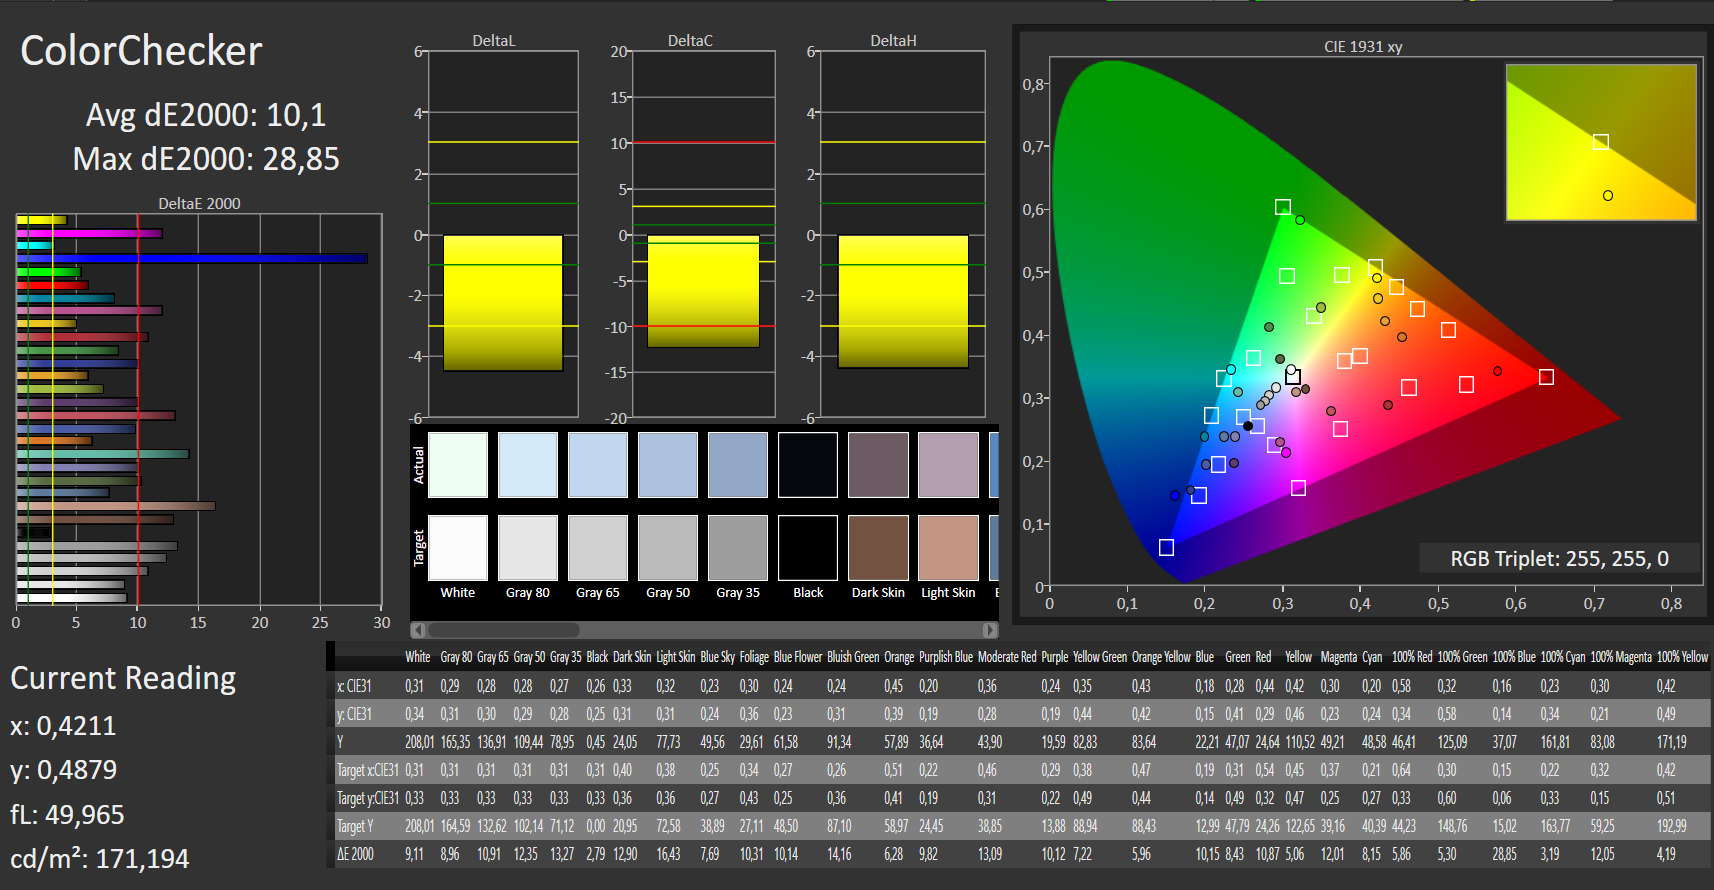
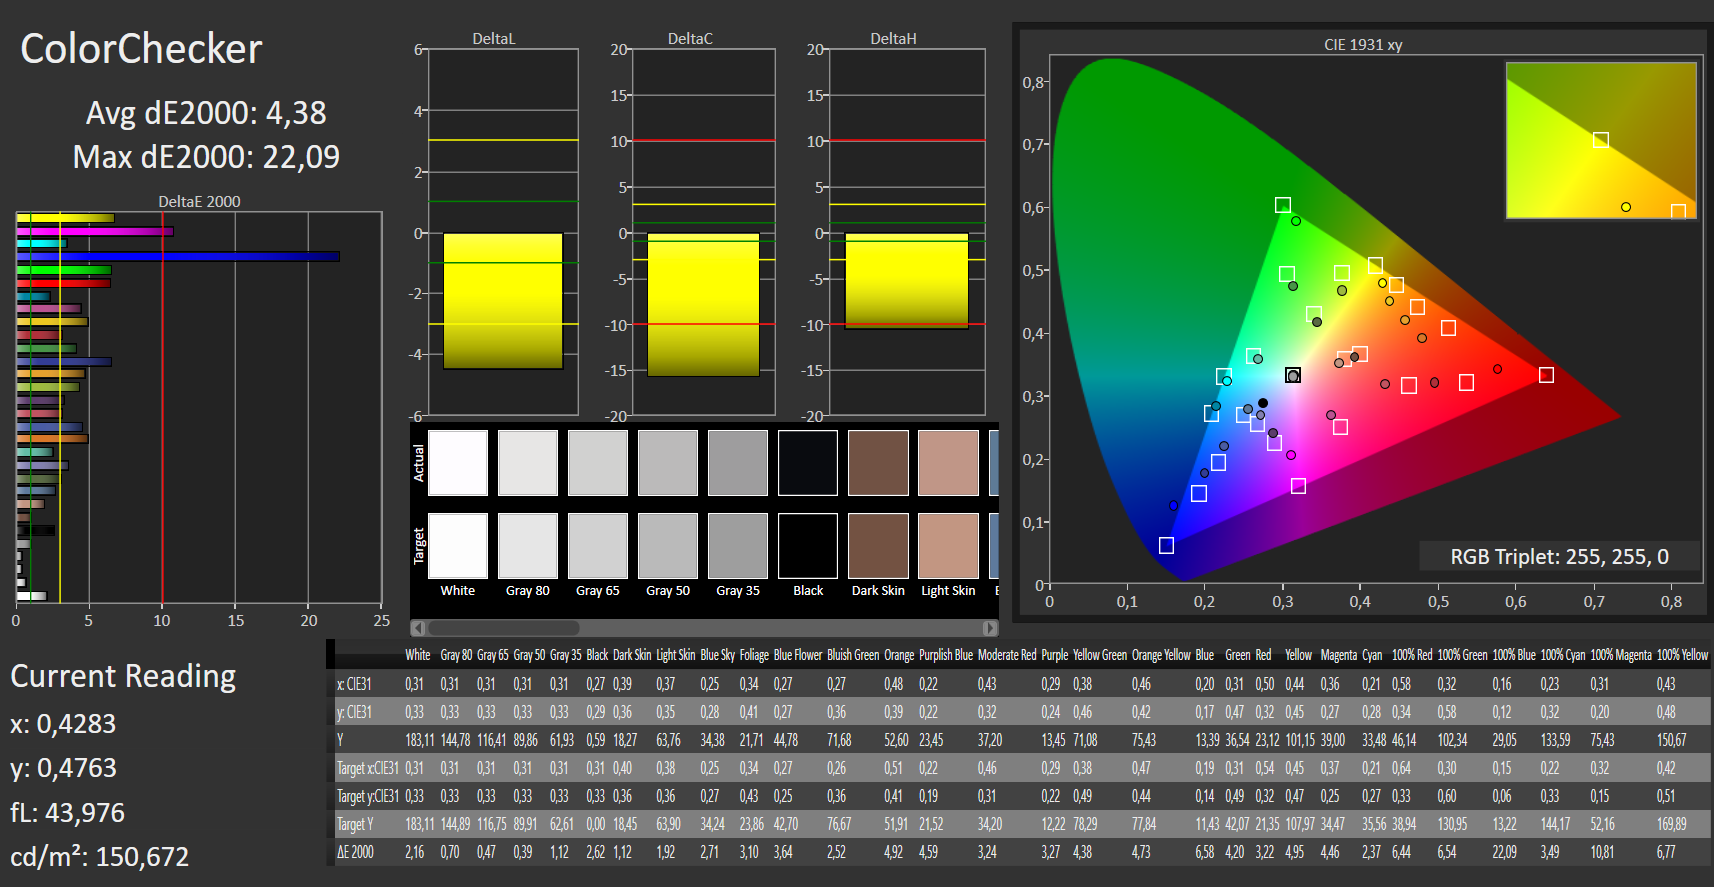
ΔE ColorChecker Calman: 10.1 | ∀{0.5-29.43 Ø4.72}
calibrated: 4.38
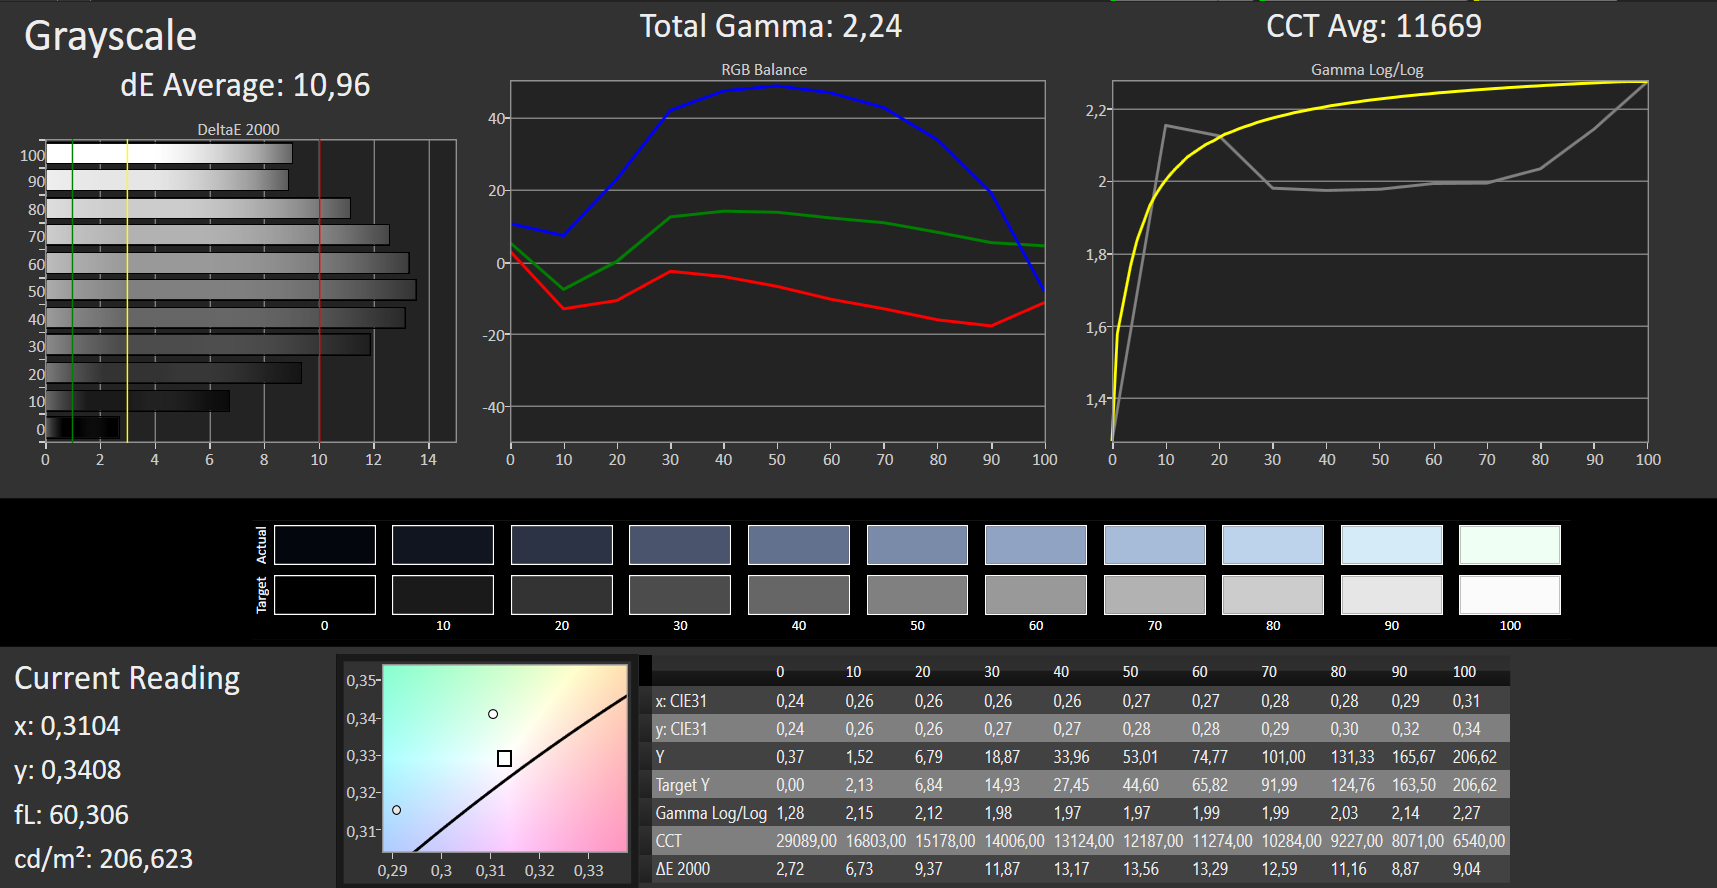
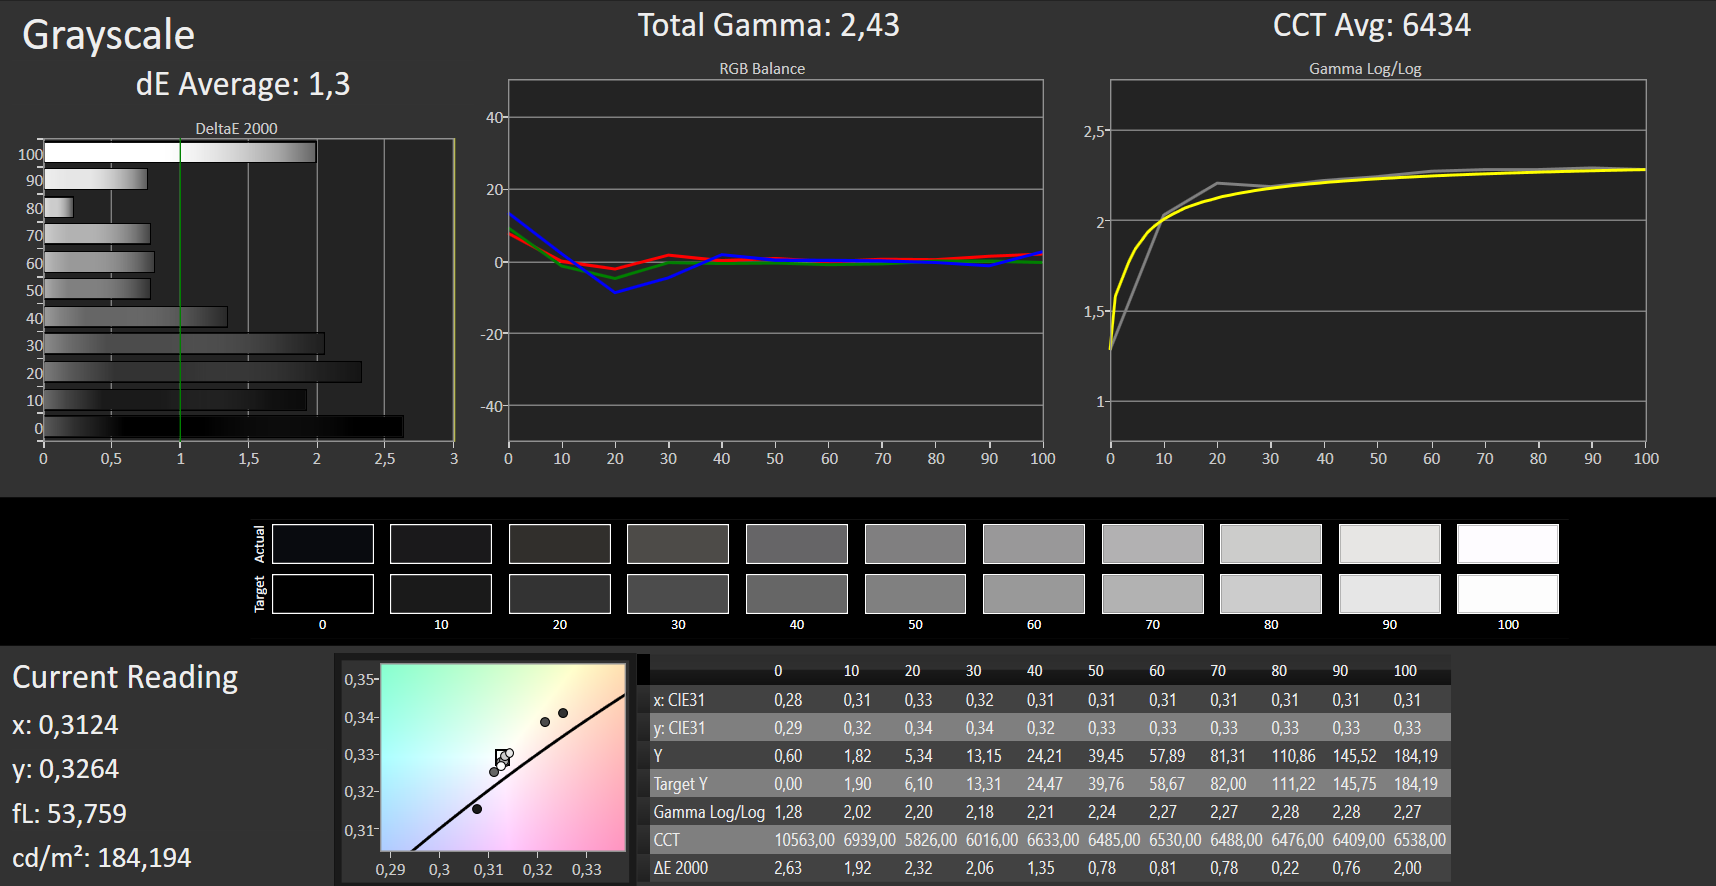
ΔE Greyscale Calman: 10.96 | ∀{0.09-98 Ø4.97}
59% sRGB (Argyll 1.6.3 3D)
38% AdobeRGB 1998 (Argyll 1.6.3 3D)
41.71% AdobeRGB 1998 (Argyll 3D)
60.3% sRGB (Argyll 3D)
40.35% Display P3 (Argyll 3D)
Gamma: 2.24
CCT: 11669 K
| Acer Aspire 1 A114-32-P0K1 TN LED, 1920x1080, 14" | Acer Aspire 1 A114-31-C472 TN LED, 1366x768, 14" | HP Chromebook 14 G5 IPS, 1920x1080, 14" | Lenovo V130-14IGM TN LED, 1366x768, 14" | Trekstor Primebook C13 IPS, 1920x1080, 13.3" | Chuwi LapBook SE 1920x1080, 13.3" | HP 14-bp001ng TN LED, 1366x768, 14" | Chuwi HeroBook 14 IPS, 1920x1080, 14" | |
|---|---|---|---|---|---|---|---|---|
| Display | 2% | -10% | 59% | 59% | 0% | -5% | ||
| Display P3 Coverage (%) | 40.35 | 41.31 2% | 36.23 -10% | 65.4 62% | 65 61% | 40.43 0% | 38.43 -5% | |
| sRGB Coverage (%) | 60.3 | 61.7 2% | 54.5 -10% | 93.3 55% | 94.8 57% | 60.8 1% | 57.8 -4% | |
| AdobeRGB 1998 Coverage (%) | 41.71 | 42.72 2% | 37.44 -10% | 66.9 60% | 66.5 59% | 41.77 0% | 39.72 -5% | |
| Response Times | -8% | -86% | -11% | -61% | -52% | -4% | -68% | |
| Response Time Grey 50% / Grey 80% * (ms) | 43 ? | 40 ? 7% | 44 ? -2% | 52 ? -21% | 39 ? 9% | 39.2 ? 9% | 43 ? -0% | 35.6 ? 17% |
| Response Time Black / White * (ms) | 13 ? | 16 ? -23% | 35 ? -169% | 13 ? -0% | 30 ? -131% | 27.7 ? -113% | 14 ? -8% | 32.8 ? -152% |
| PWM Frequency (Hz) | 250 ? | 1000 ? | 1000 ? | 990 ? | 200 ? | 200 ? | 521 ? | |
| Screen | 8% | 69% | -6% | 38% | 22% | -5% | 29% | |
| Brightness middle (cd/m²) | 208 | 206 -1% | 253 22% | 234 13% | 201 -3% | 227 9% | 189 -9% | 213.6 3% |
| Brightness (cd/m²) | 192 | 187 -3% | 232 21% | 216 13% | 207 8% | 210 9% | 190 -1% | 197 3% |
| Brightness Distribution (%) | 85 | 82 -4% | 87 2% | 83 -2% | 88 4% | 89 5% | 88 4% | 82 -4% |
| Black Level * (cd/m²) | 0.41 | 0.34 17% | 0.15 63% | 0.51 -24% | 0.22 46% | 0.44 -7% | 0.53 -29% | 0.18 56% |
| Contrast (:1) | 507 | 606 20% | 1687 233% | 459 -9% | 914 80% | 516 2% | 357 -30% | 1187 134% |
| Colorchecker dE 2000 * | 10.1 | 10.01 1% | 11.84 -17% | 6.6 35% | 6.6 35% | 11.85 -17% | 5.78 43% | |
| Colorchecker dE 2000 max. * | 28.85 | 16.72 42% | 25.17 13% | 12.39 57% | 12.2 58% | 20.61 29% | 19.89 31% | |
| Colorchecker dE 2000 calibrated * | 4.38 | 1.9 57% | 4.2 4% | |||||
| Greyscale dE 2000 * | 10.96 | 11.11 -1% | 3.04 72% | 13.97 -27% | 7.73 29% | 7.9 28% | 13.6 -24% | 4.6 58% |
| Gamma | 2.24 98% | 2.43 91% | 2.21 100% | 2.13 103% | 2.46 89% | 2.16 102% | 2.49 88% | 2 110% |
| CCT | 11669 56% | 12726 51% | 7015 93% | 18080 36% | 7864 83% | 8879 73% | 16588 39% | 7481 87% |
| Color Space (Percent of AdobeRGB 1998) (%) | 38 | 39 3% | 35 -8% | 61 61% | 49 29% | 36.5 -4% | ||
| Color Space (Percent of sRGB) (%) | 59 | 62 5% | 55 -7% | 93 58% | 61 3% | 57.5 -3% | ||
| Total Average (Program / Settings) | 1% /
5% | -9% /
30% | -9% /
-7% | 12% /
29% | 10% /
19% | -3% /
-3% | -15% /
11% |
* ... smaller is better
Display Response Times
| ↔ Response Time Black to White | ||
|---|---|---|
| 13 ms ... rise ↗ and fall ↘ combined | ↗ 9 ms rise | 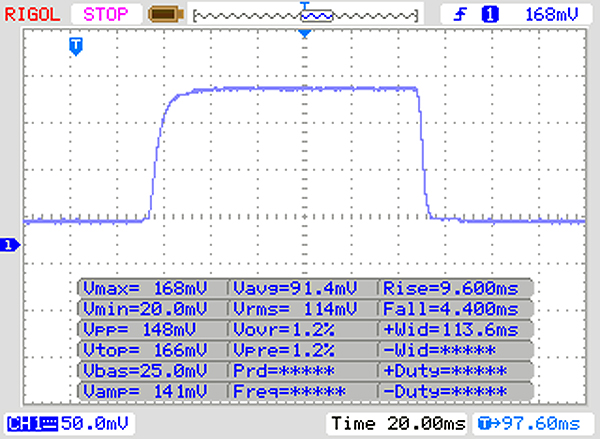 |
| ↘ 4 ms fall | ||
| The screen shows good response rates in our tests, but may be too slow for competitive gamers. In comparison, all tested devices range from 0.1 (minimum) to 240 (maximum) ms. » 33 % of all devices are better. This means that the measured response time is better than the average of all tested devices (19.8 ms). | ||
| ↔ Response Time 50% Grey to 80% Grey | ||
| 43 ms ... rise ↗ and fall ↘ combined | ↗ 23 ms rise | 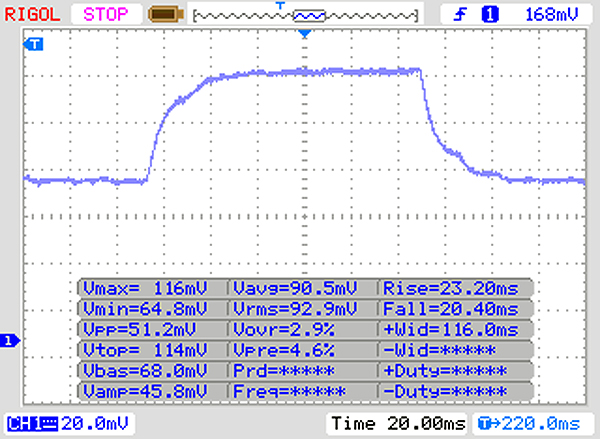 |
| ↘ 20 ms fall | ||
| The screen shows slow response rates in our tests and will be unsatisfactory for gamers. In comparison, all tested devices range from 0.165 (minimum) to 636 (maximum) ms. » 71 % of all devices are better. This means that the measured response time is worse than the average of all tested devices (31 ms). | ||
Screen Flickering / PWM (Pulse-Width Modulation)
| Screen flickering / PWM detected | 250 Hz | ≤ 20 % brightness setting | 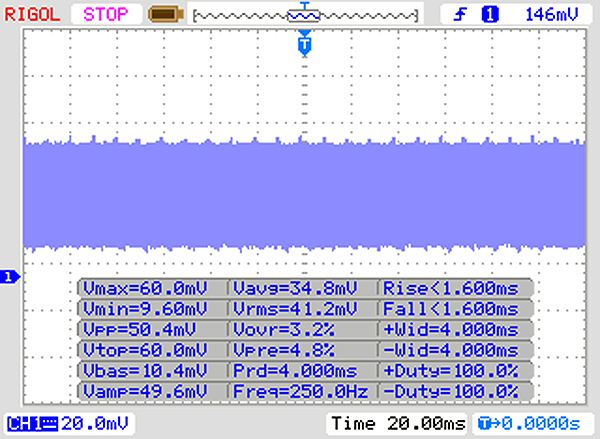 |
The display backlight flickers at 250 Hz (worst case, e.g., utilizing PWM) Flickering detected at a brightness setting of 20 % and below. There should be no flickering or PWM above this brightness setting. The frequency of 250 Hz is relatively low, so sensitive users will likely notice flickering and experience eyestrain at the stated brightness setting and below. In comparison: 52 % of all tested devices do not use PWM to dim the display. If PWM was detected, an average of 7763 (minimum: 5 - maximum: 343500) Hz was measured. | |||
The color reproduction out of the box isn't convincing. With a DeltaE-2000 color deviation of 10.1, the target value (DeltaE smaller than 3) is far away. In addition, the display suffers from a visible blue tint. An improvement can be achieved through calibration. In this way, the color deviation drops to a value of 4.38, and the blue tint disappears.
Through the color profile that we have provided, the display's color reproduction can be improved by matching it to our calibration. It's important to make sure that the same display model (manufacturer + model number) as in our review device is built in. Otherwise, the color reproduction can become worse instead of being improved. It's common for laptops of the same model series to use displays from different manufacturers.

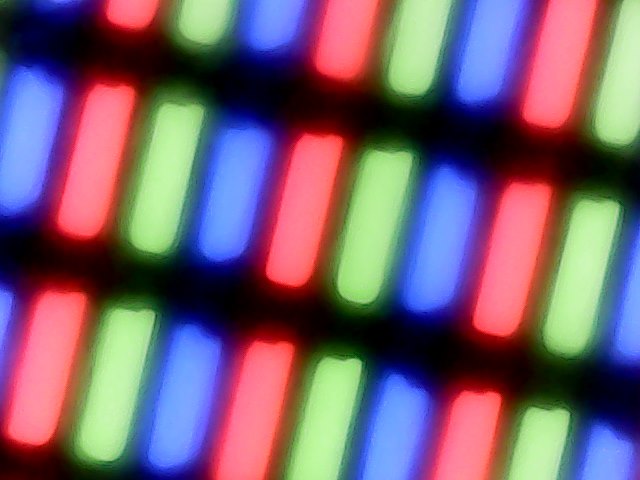
Acer has put a TN panel with unstable viewing angles in the Aspire. This results in the screen not being readable from every direction. The display is only readable outdoors when there's no sunshine.
Performance - Below its potential
Acer has a 14-inch office laptop in its range with the Aspire 1 A114-32, which provides enough processing power for office and Internet applications. Our review device can be obtained for around 290 Euros (~$328) to 300 Euros (~$340). Other configuration variants are also available.
Processor
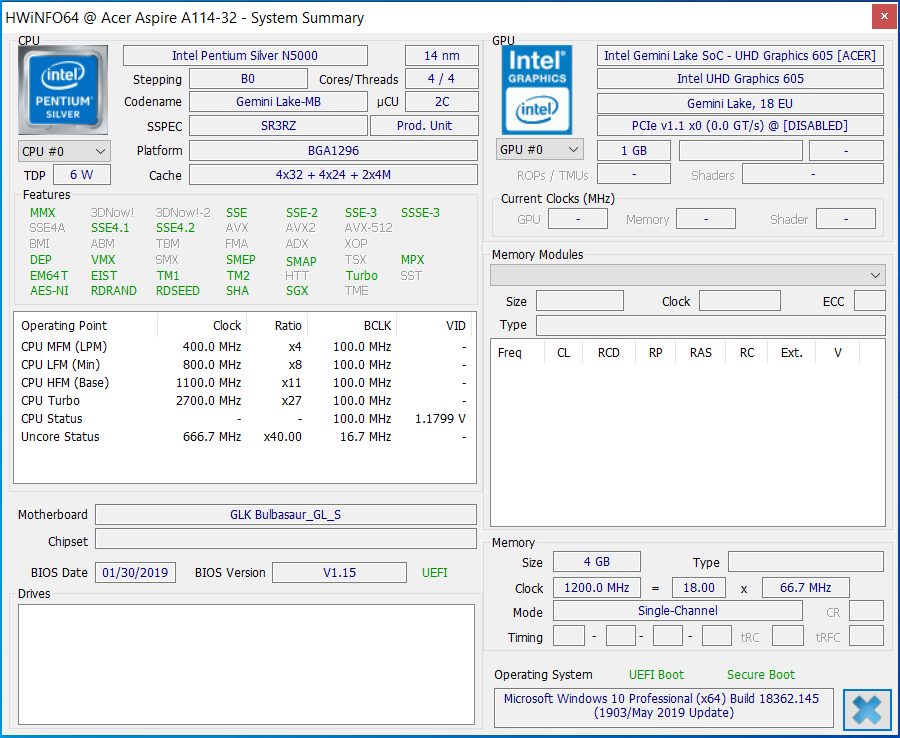
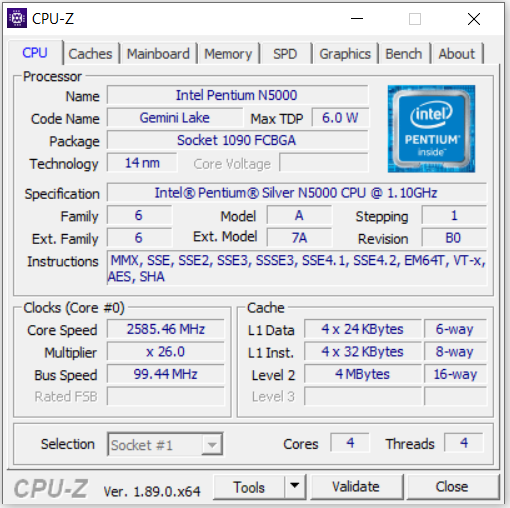
The Aspire 1 is equipped with a Pentium Silver N5000 quad-core processor. The CPU is based on Intel's Gemini Lake platform. Thanks to a low TDP of 6 watts, the SoC can be cooled passively. The processor runs at a base speed of 1.1 GHz. An increase to up to 2.6 GHz (four cores) and 2.7 GHz (one core), respectively, is possible through Turbo.
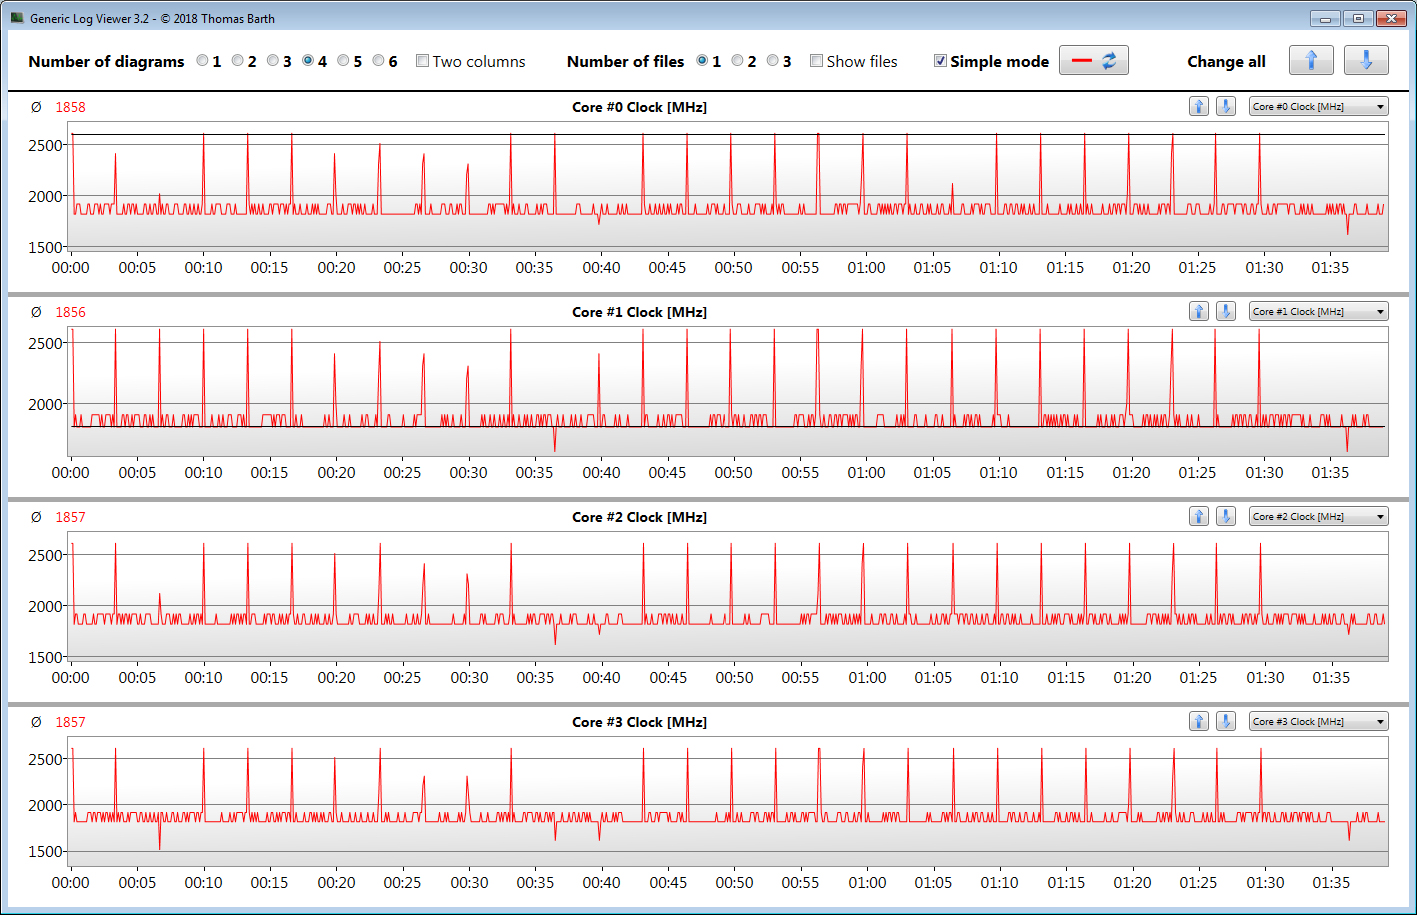
The Cinebench benchmark's multithread tests conducted by us were processed by the Pentium at 2.6 GHz for a few seconds. The speed then drops to 1.8 to 1.9 GHz. A similar behavior is observed with the single-thread tests: The CPU starts running at 2.6 GHz. Later, the speed range slowly and gradually expands to 1.8 to 2.6 GHz. The results are identical both on battery power and when plugged in.
We test whether the CPU's Turbo is used consistently by running Cinebench's R15 multithread test continuously in a loop for a minimum of 30 minutes. The results drop a bit from the first to the second run, and then they remain at a constant level. Turbo is in use.
However, the Pentium Silver N5000 lags slightly behind its potential. Other N5000 devices that we've reviewed can run through the CB15 loop with somewhat higher Turbo speeds. It doesn't matter if the devices are actively or passively cooled.
| Cinebench R15 | |
| CPU Single 64Bit | |
| Average of class Office (99.5 - 312, n=74, last 2 years) | |
| Lenovo V130-14IGM | |
| Acer Aspire 1 A114-32-P0K1 | |
| Average Intel Pentium Silver N5000 (73 - 80, n=12) | |
| Chuwi LapBook SE | |
| Acer Aspire 1 A114-31-C472 | |
| Trekstor Primebook C13 | |
| HP 14-bp001ng | |
| Chuwi HeroBook 14 | |
| CPU Multi 64Bit | |
| Average of class Office (250 - 3380, n=74, last 2 years) | |
| Lenovo V130-14IGM | |
| Average Intel Pentium Silver N5000 (210 - 284, n=12) | |
| Acer Aspire 1 A114-32-P0K1 | |
| Chuwi LapBook SE | |
| Acer Aspire 1 A114-31-C472 | |
| HP 14-bp001ng | |
| Chuwi HeroBook 14 | |
| Trekstor Primebook C13 | |
| Geekbench 3 | |
| 32 Bit Multi-Core Score | |
| Lenovo V130-14IGM | |
| Average Intel Pentium Silver N5000 (5045 - 5868, n=6) | |
| Acer Aspire 1 A114-32-P0K1 | |
| 32 Bit Single-Core Score | |
| Lenovo V130-14IGM | |
| Average Intel Pentium Silver N5000 (1707 - 1876, n=6) | |
| Acer Aspire 1 A114-32-P0K1 | |
| Mozilla Kraken 1.1 - Total | |
| Chuwi LapBook SE (Edge 42) | |
| Chuwi LapBook SE (Chrome 82) | |
| HP Chromebook 14 G5 (Chrome OS 74.0.3729.159) | |
| Acer Aspire 1 A114-32-P0K1 (Edge 44) | |
| Average Intel Pentium Silver N5000 (2251 - 2871, n=5) | |
| Average of class Office (391 - 1297, n=75, last 2 years) | |
| Octane V2 - Total Score | |
| Average of class Office (49011 - 126830, n=19, last 2 years) | |
| Average Intel Pentium Silver N5000 (13075 - 14601, n=4) | |
| Acer Aspire 1 A114-32-P0K1 (Edge 44) | |
| HP Chromebook 14 G5 (Chrome OS 74.0.3729.159) | |
| Chuwi LapBook SE (Edge 42) | |
| WebXPRT 3 - Overall | |
| Average of class Office (129.9 - 444, n=74, last 2 years) | |
| Acer Aspire 1 A114-32-P0K1 (Edge 44) | |
| Average Intel Pentium Silver N5000 (88.2 - 90, n=2) | |
| Chuwi LapBook SE (Edge) | |
| Chuwi LapBook SE (Chrome 82) | |
| HP Chromebook 14 G5 (Chrome OS 74.0.3729.159) | |
| Speedometer 2.0 - Result 2.0 | |
| Average of class Office (173 - 640, n=17, last 2 years) | |
| HP Chromebook 14 G5 (Chrome OS 74.0.3729.159) | |
| Acer Aspire 1 A114-32-P0K1 (Edge 44) | |
| Average Intel Pentium Silver N5000 (n=1) | |
| JetStream 1.1 - 1.1 Total | |
| Lenovo V130-14IGM (Edge 44) | |
| Average Intel Pentium Silver N5000 (104.4 - 109.8, n=6) | |
| Acer Aspire 1 A114-32-P0K1 (Edge 44) | |
| Chuwi LapBook SE (Edge 42) | |
| HP Chromebook 14 G5 (Chrome OS 74.0.3729.159) | |
| Acer Aspire 1 A114-31-C472 (Firefox 53.0.3) | |
| Trekstor Primebook C13 | |
| HP 14-bp001ng | |
| Chuwi HeroBook 14 (Edge 42.17134.1.0) | |
* ... smaller is better
System Performance
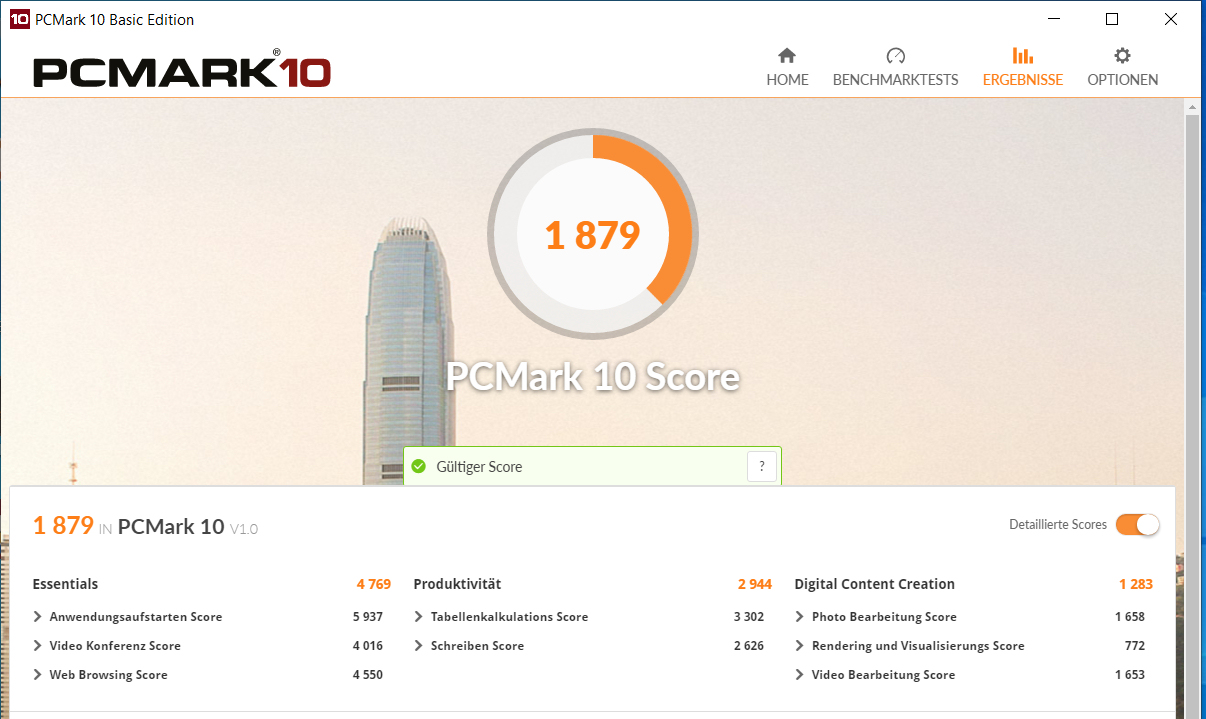
The system operates decently and smoothly. We didn't experience any issues. The processing power of the Pentium Silver N5000 is enough for office and Internet applications. The results of the PCMark benchmarks are a bit behind the potential found in devices with the N5000, since the CPU isn't able to use Turbo as strongly in multithread applications as is possible with comparable devices, and the GPU rarely reaches its maximum speed, sometimes never at all.
In addition, the lack of dual-channel mode results in the loss of a bit of performance. This mode can't be activated later since the device's RAM is soldered. There are no RAM slots. Thus RAM runs permanently in single-channel mode.
| PCMark 8 Home Score Accelerated v2 | 1933 points | |
| PCMark 8 Creative Score Accelerated v2 | 1936 points | |
| PCMark 8 Work Score Accelerated v2 | 3120 points | |
| PCMark 10 Score | 1879 points | |
Help | ||
| PCMark 8 - Home Score Accelerated v2 | |
| Average of class Office (n=1last 2 years) | |
| Lenovo V130-14IGM | |
| Average Intel Pentium Silver N5000, Intel UHD Graphics 605 (1933 - 2393, n=9) | |
| Acer Aspire 1 A114-32-P0K1 | |
| Acer Aspire 1 A114-31-C472 | |
| HP 14-bp001ng | |
| Trekstor Primebook C13 | |
| Chuwi HeroBook 14 | |
Storage
An eMMC storage module is provided as system drive, which has an overall capacity of 64 GB. Out of this, just under 44 GB is freely usable out of the box. The remaining storage space is used by the recovery partition and the Windows installation. Transfer rates are at a normal level for eMMC storage.
Storage space can be expanded through the use of an SD card. But this wouldn't be very practical since the card reader doesn't fit SD cards completely (about 15 mm sticks out) nor locks them in place.

| Acer Aspire 1 A114-32-P0K1 64 GB eMMC Flash | Acer Aspire 1 A114-31-C472 Hynix HBG4a2 32 GB eMMC | Lenovo V130-14IGM SK Hynix HFS128G32TND | Trekstor Primebook C13 SanDisk DF4064 | Chuwi LapBook SE SanDisk DF4032 | HP 14-bp001ng Toshiba MQ01ABF050 | Chuwi HeroBook 14 SanDisk DF4064 | Average 64 GB eMMC Flash | Average of class Office | |
|---|---|---|---|---|---|---|---|---|---|
| CrystalDiskMark 5.2 / 6 | 16% | 184% | -20% | -31% | -71% | -27% | -17% | 1584% | |
| Write 4K (MB/s) | 24.08 | 31.55 31% | 68.6 185% | 13.16 -45% | 11.17 -54% | 0.955 -96% | 15.35 -36% | 16 ? -34% | 153.5 ? 537% |
| Read 4K (MB/s) | 11.48 | 10.58 -8% | 28.73 150% | 5.04 -56% | 7.2 -37% | 0.367 -97% | 10.86 -5% | 11 ? -4% | 73.3 ? 539% |
| Write Seq (MB/s) | 149.7 | 148.5 -1% | 252.3 69% | 117 -22% | 87.7 -41% | 92.5 -38% | 92.1 -38% | 109 ? -27% | 2454 ? 1539% |
| Read Seq (MB/s) | 271.2 | 272 0% | 444 64% | 264.7 -2% | 247 -9% | 101.5 -63% | 146.2 -46% | 207 ? -24% | 3229 ? 1091% |
| Write 4K Q32T1 (MB/s) | 23.87 | 49.07 106% | 123.2 416% | 16.58 -31% | 12.29 -49% | 0.951 -96% | 15.19 -36% | 22.4 ? -6% | 428 ? 1693% |
| Read 4K Q32T1 (MB/s) | 30.76 | 31.92 4% | 135.1 339% | 33.3 8% | 32.46 6% | 0.734 -98% | 33.62 9% | 31.5 ? 2% | 513 ? 1568% |
| Write Seq Q32T1 (MB/s) | 137.2 | 139 1% | 246.1 79% | 111.2 -19% | 92 -33% | 93.1 -32% | 87.9 -36% | 104.6 ? -24% | 4083 ? 2876% |
| Read Seq Q32T1 (MB/s) | 205.1 | 196.3 -4% | 557 172% | 226.3 10% | 150.1 -27% | 102 -50% | 142.8 -30% | 166.5 ? -19% | 6007 ? 2829% |
Graphics card
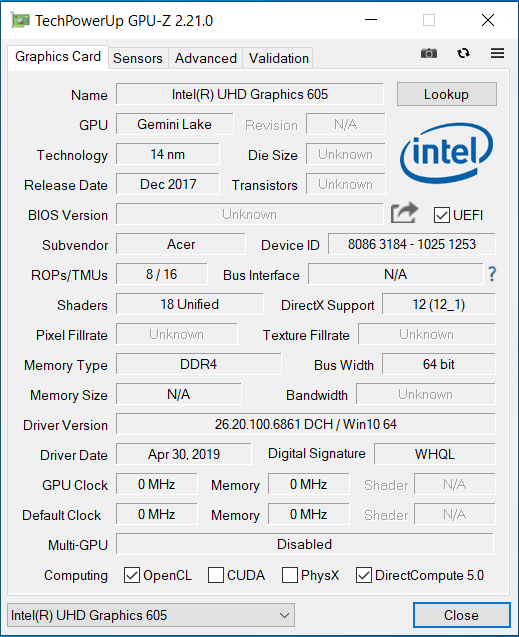
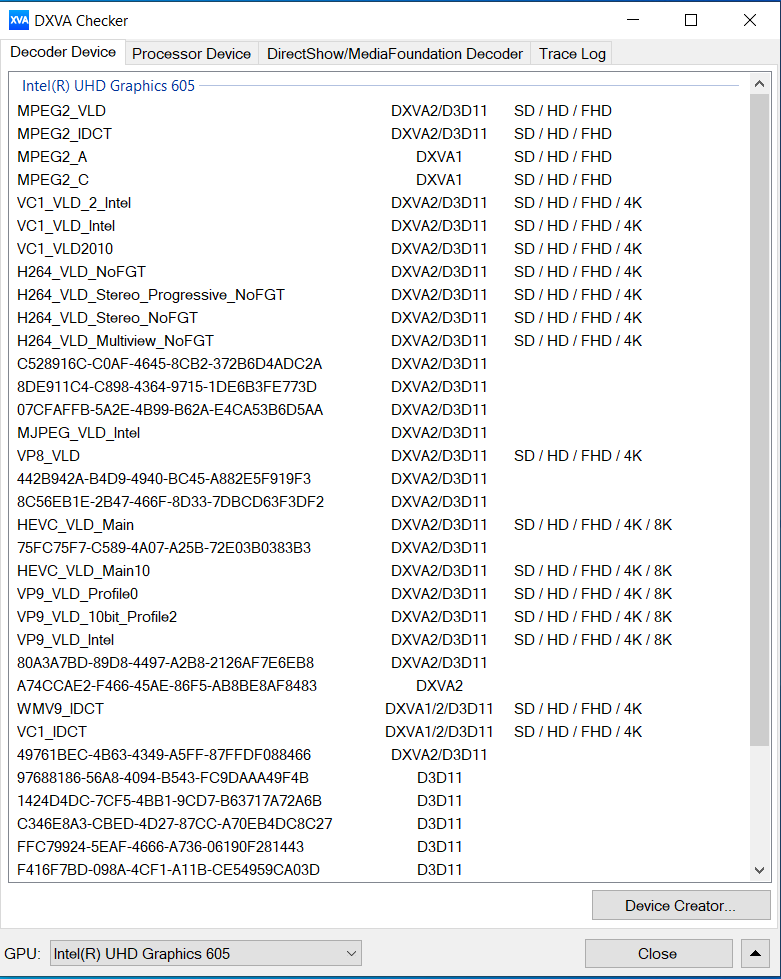
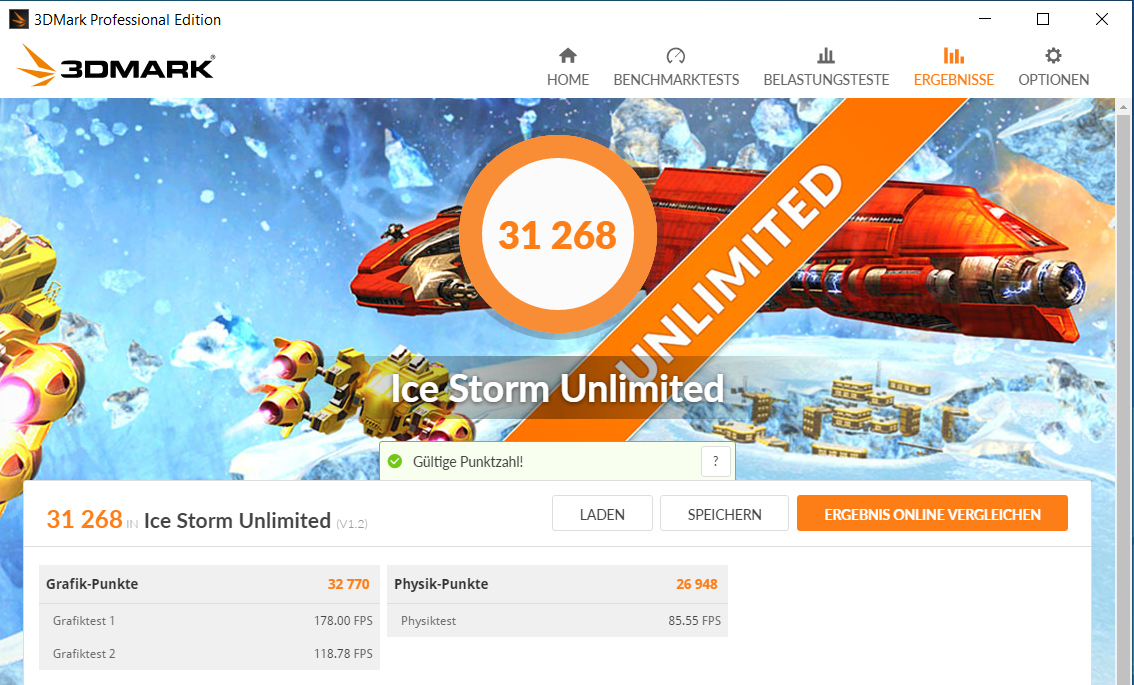
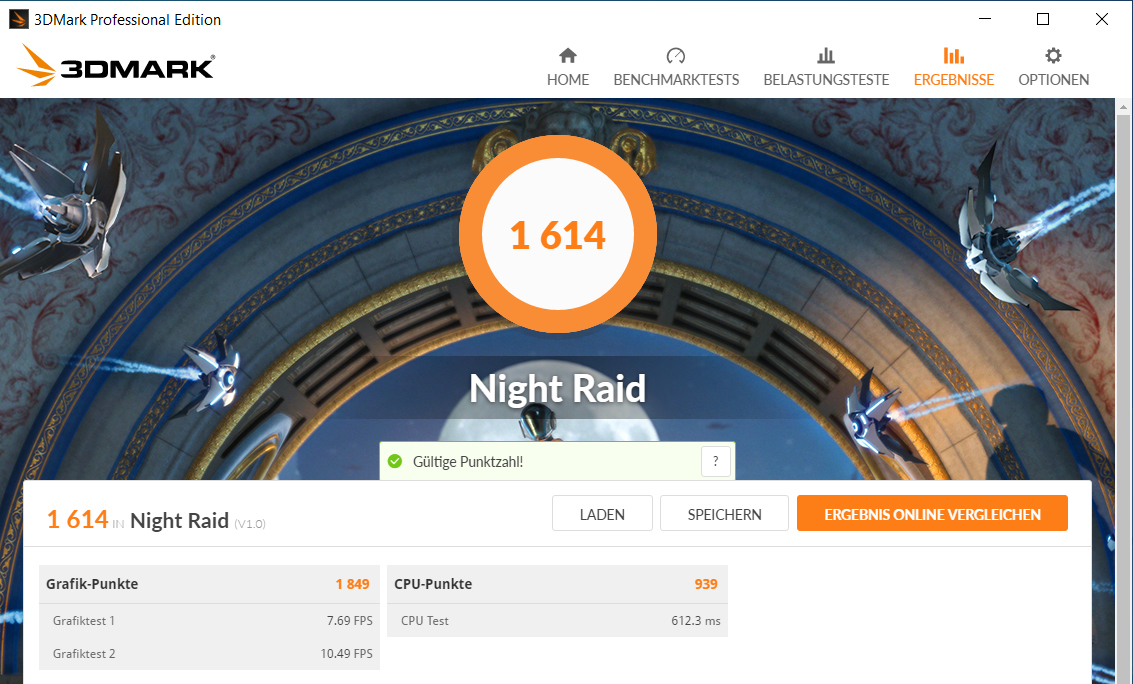
The integrated UHD Graphics 605 graphics unit from Intel takes care of the graphics output. It supports DirectX 12 and runs at speeds of up to 720 MHz. However, the maximum speed can only be sustained for a short time. Most of the time, the GPU runs at lower speeds. As a consequence, the results observed on the 3DMark benchmark are clearly behind the graphics unit's potential. To be more exact, the model that's in use here delivers the worst results we've measured so far for this GPU. The decoder integrated in the GPU can take load off of the processor when playing videos. Therefore the usage of streaming services doesn't pose any issues.

| 3DMark 11 Performance | 664 points | |
| 3DMark Cloud Gate Standard Score | 2670 points | |
| 3DMark Fire Strike Score | 393 points | |
Help | ||
| 3DMark 11 - 1280x720 Performance GPU | |
| Average of class Office (2551 - 18313, n=70, last 2 years) | |
| Average Intel UHD Graphics 605 (588 - 902, n=14) | |
| Lenovo V130-14IGM | |
| Acer Aspire 1 A114-32-P0K1 | |
| Trekstor Primebook C13 | |
| Chuwi LapBook SE | |
| HP 14-bp001ng | |
| Acer Aspire 1 A114-31-C472 | |
| Chuwi HeroBook 14 | |
| 3DMark | |
| 1920x1080 Fire Strike Graphics | |
| Average of class Office (736 - 21871, n=73, last 2 years) | |
| Lenovo V130-14IGM | |
| Average Intel UHD Graphics 605 (411 - 576, n=10) | |
| Acer Aspire 1 A114-32-P0K1 | |
| 1280x720 Cloud Gate Standard Graphics | |
| Average of class Office (11640 - 118515, n=38, last 2 years) | |
| Average Intel UHD Graphics 605 (2874 - 4485, n=10) | |
| Lenovo V130-14IGM | |
| Acer Aspire 1 A114-32-P0K1 | |
| Chuwi LapBook SE | |
| Chuwi HeroBook 14 | |
| 2560x1440 Time Spy Graphics | |
| Average of class Office (493 - 6679, n=68, last 2 years) | |
| Average Intel UHD Graphics 605 (113 - 183, n=2) | |
| Chuwi LapBook SE | |
| 1280x720 offscreen Ice Storm Unlimited Graphics Score | |
| Average of class Office (208077 - 324978, n=4, last 2 years) | |
| Lenovo V130-14IGM | |
| Average Intel UHD Graphics 605 (32770 - 55453, n=9) | |
| Acer Aspire 1 A114-32-P0K1 | |
| HP Chromebook 14 G5 | |
| Chuwi LapBook SE | |
Gaming Performance
The hardware in use is made for playing casual games and browser games, respectively. Modern 3D games, as found in our database, can only be run smoothly by the hardware in particular occasions - at low resolution and low quality settings.
| low | med. | high | ultra | |
|---|---|---|---|---|
| BioShock Infinite (2013) | 14.8 | 11.1 | 9.5 | 3.3 |
Emissions and energy - Silent operation
Noise emissions
The A114 doesn't have a fan or a mechanical drive, and therefore it operates silently.
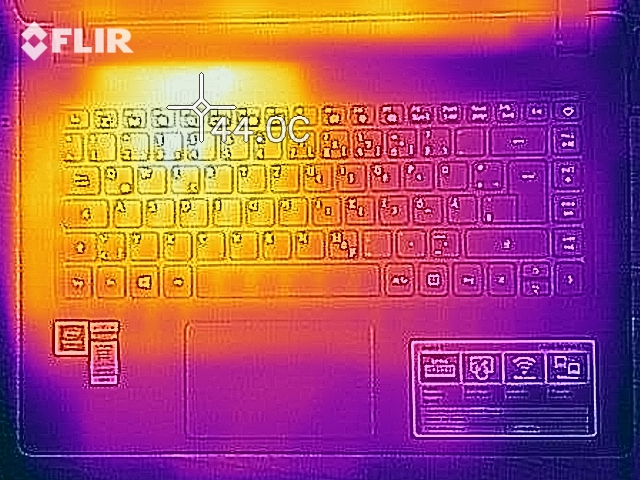
Temperature
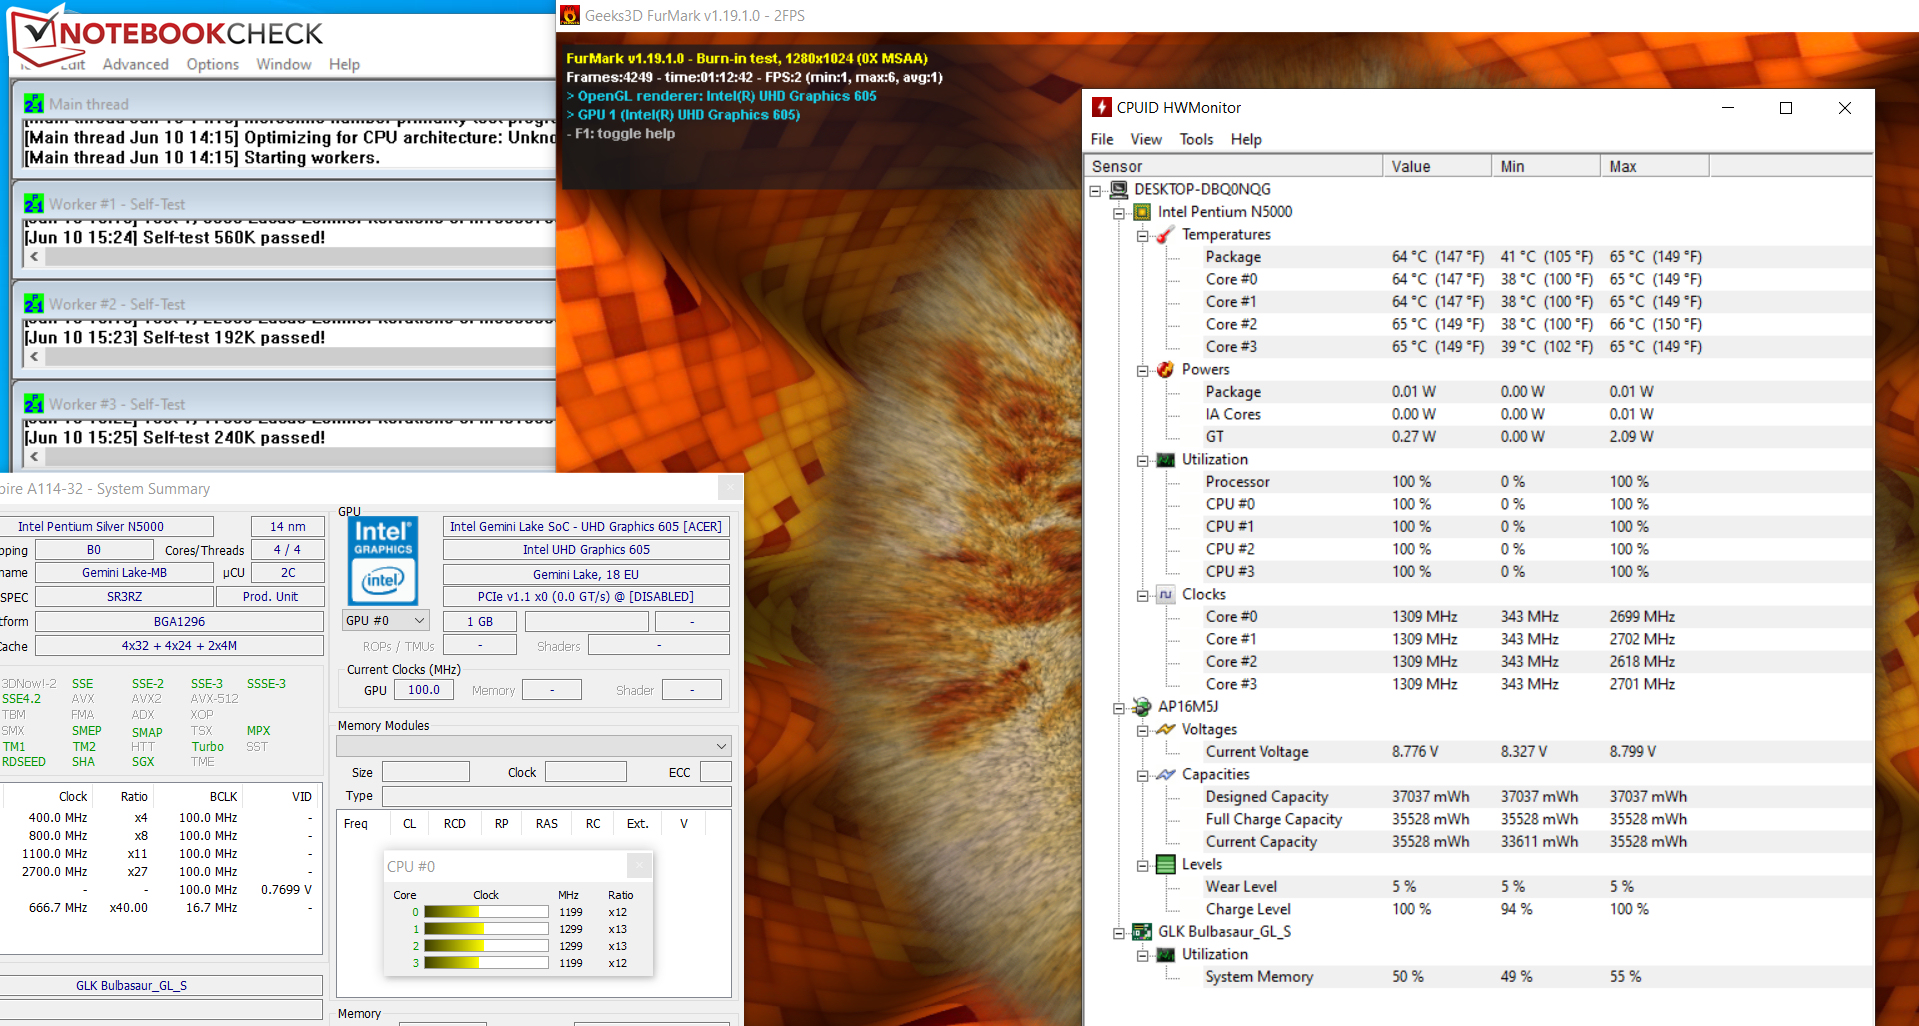
The A114 works through our stress test (Prime95 and Furmark run for a minimum of one hour) in the same way when it's plugged in as it does on battery power. The processor runs at speeds between 600 and 1.3 GHz, and the graphics unit between 100 and 200 MHz. The stress test represents an extreme scenario, which doesn't come up in everyday use. Through this test, we verify that the system also remains stable under full load.
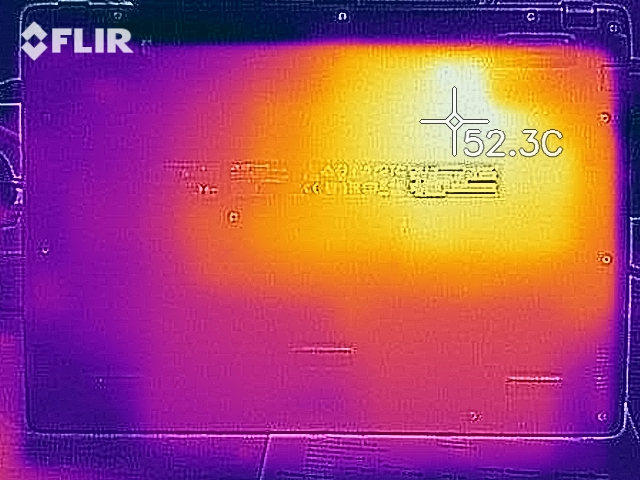
The laptop doesn't get excessively hot despite the passive cooling. During our stress test we registered temperatures above 40 °C (~104 °F) at two measuring points on the bottom. The device shouldn't necessarily be placed on the thighs. In idle usage and under little load, the temperatures are in the green area.
(+) The maximum temperature on the upper side is 38.5 °C / 101 F, compared to the average of 34.3 °C / 94 F, ranging from 21.2 to 62.5 °C for the class Office.
(-) The bottom heats up to a maximum of 45.4 °C / 114 F, compared to the average of 36.8 °C / 98 F
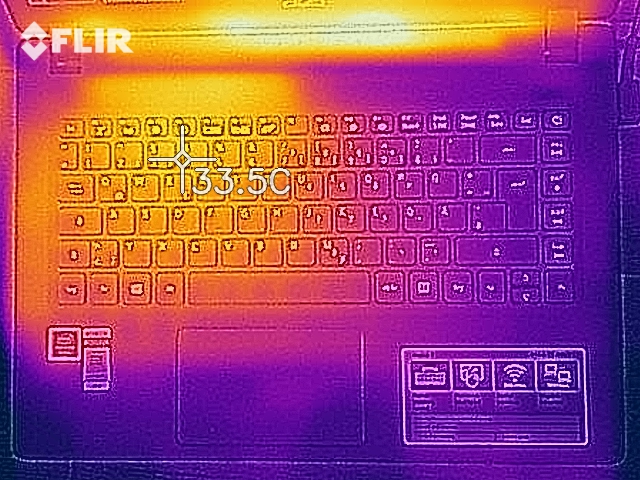
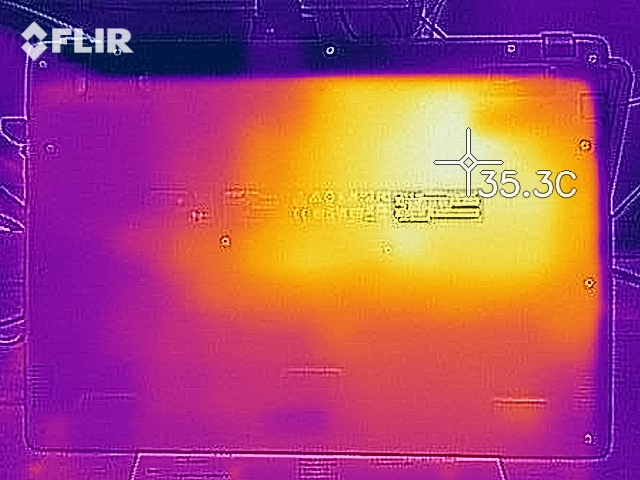
(+) In idle usage, the average temperature for the upper side is 25.3 °C / 78 F, compared to the device average of 29.5 °C / 85 F.
(+) The palmrests and touchpad are cooler than skin temperature with a maximum of 25.9 °C / 78.6 F and are therefore cool to the touch.
(±) The average temperature of the palmrest area of similar devices was 27.5 °C / 81.5 F (+1.6 °C / 2.9 F).
Speakers
Acer Aspire 1 A114-32-P0K1 audio analysis
(-) | not very loud speakers (68.5 dB)
Bass 100 - 315 Hz
(-) | nearly no bass - on average 28.5% lower than median
(±) | linearity of bass is average (9.3% delta to prev. frequency)
Mids 400 - 2000 Hz
(±) | reduced mids - on average 6.7% lower than median
(±) | linearity of mids is average (9.8% delta to prev. frequency)
Highs 2 - 16 kHz
(+) | balanced highs - only 3.7% away from median
(+) | highs are linear (4% delta to prev. frequency)
Overall 100 - 16.000 Hz
(±) | linearity of overall sound is average (28.1% difference to median)
Compared to same class
» 88% of all tested devices in this class were better, 3% similar, 9% worse
» The best had a delta of 7%, average was 21%, worst was 53%
Compared to all devices tested
» 85% of all tested devices were better, 3% similar, 12% worse
» The best had a delta of 4%, average was 23%, worst was 134%
Energy consumption
That the Aspire A114 doesn't require much energy is not surprising. After all, there's a low-power CPU in the computer. We registered a maximum consumption of 6.2 watts in idle usage. This value increases to up to 13.5 watts during the stress test (Prime95 and Furmark run for at least an hour). The rated output for the power adapter is 45 watts.
| Off / Standby | |
| Idle | |
| Load |
|
Key:
min: | |
Battery life
Our practical Wi-Fi test simulates the load caused by accessing websites through the use of a script. The "Balanced" profile is active, the power-saving functions are disabled, and the display brightness is set to around 150 cd/m². The Acer laptop reaches a runtime of 6:23 h.
| Battery Runtime - WiFi Websurfing | |
| Average of class Office (3.83 - 31.5, n=75, last 2 years) | |
| HP Chromebook 14 G5 | |
| Chuwi LapBook SE | |
| Lenovo V130-14IGM | |
| HP 14-bp001ng | |
| Acer Aspire 1 A114-32-P0K1 | |
| Chuwi HeroBook 14 | |
| Trekstor Primebook C13 | |
| Acer Aspire 1 A114-31-C472 | |
Pros
Cons
Verdict
Acer's 14-incher sports a Pentium Silver N5000 processor, which provides enough processing power for office and Internet applications. Thanks to the decoder integrated into the GPU, the usage of streaming services doesn't pose any issues either. It takes load off of the processor when playing videos. The device is passively cooled and therefore offers a silent operation.
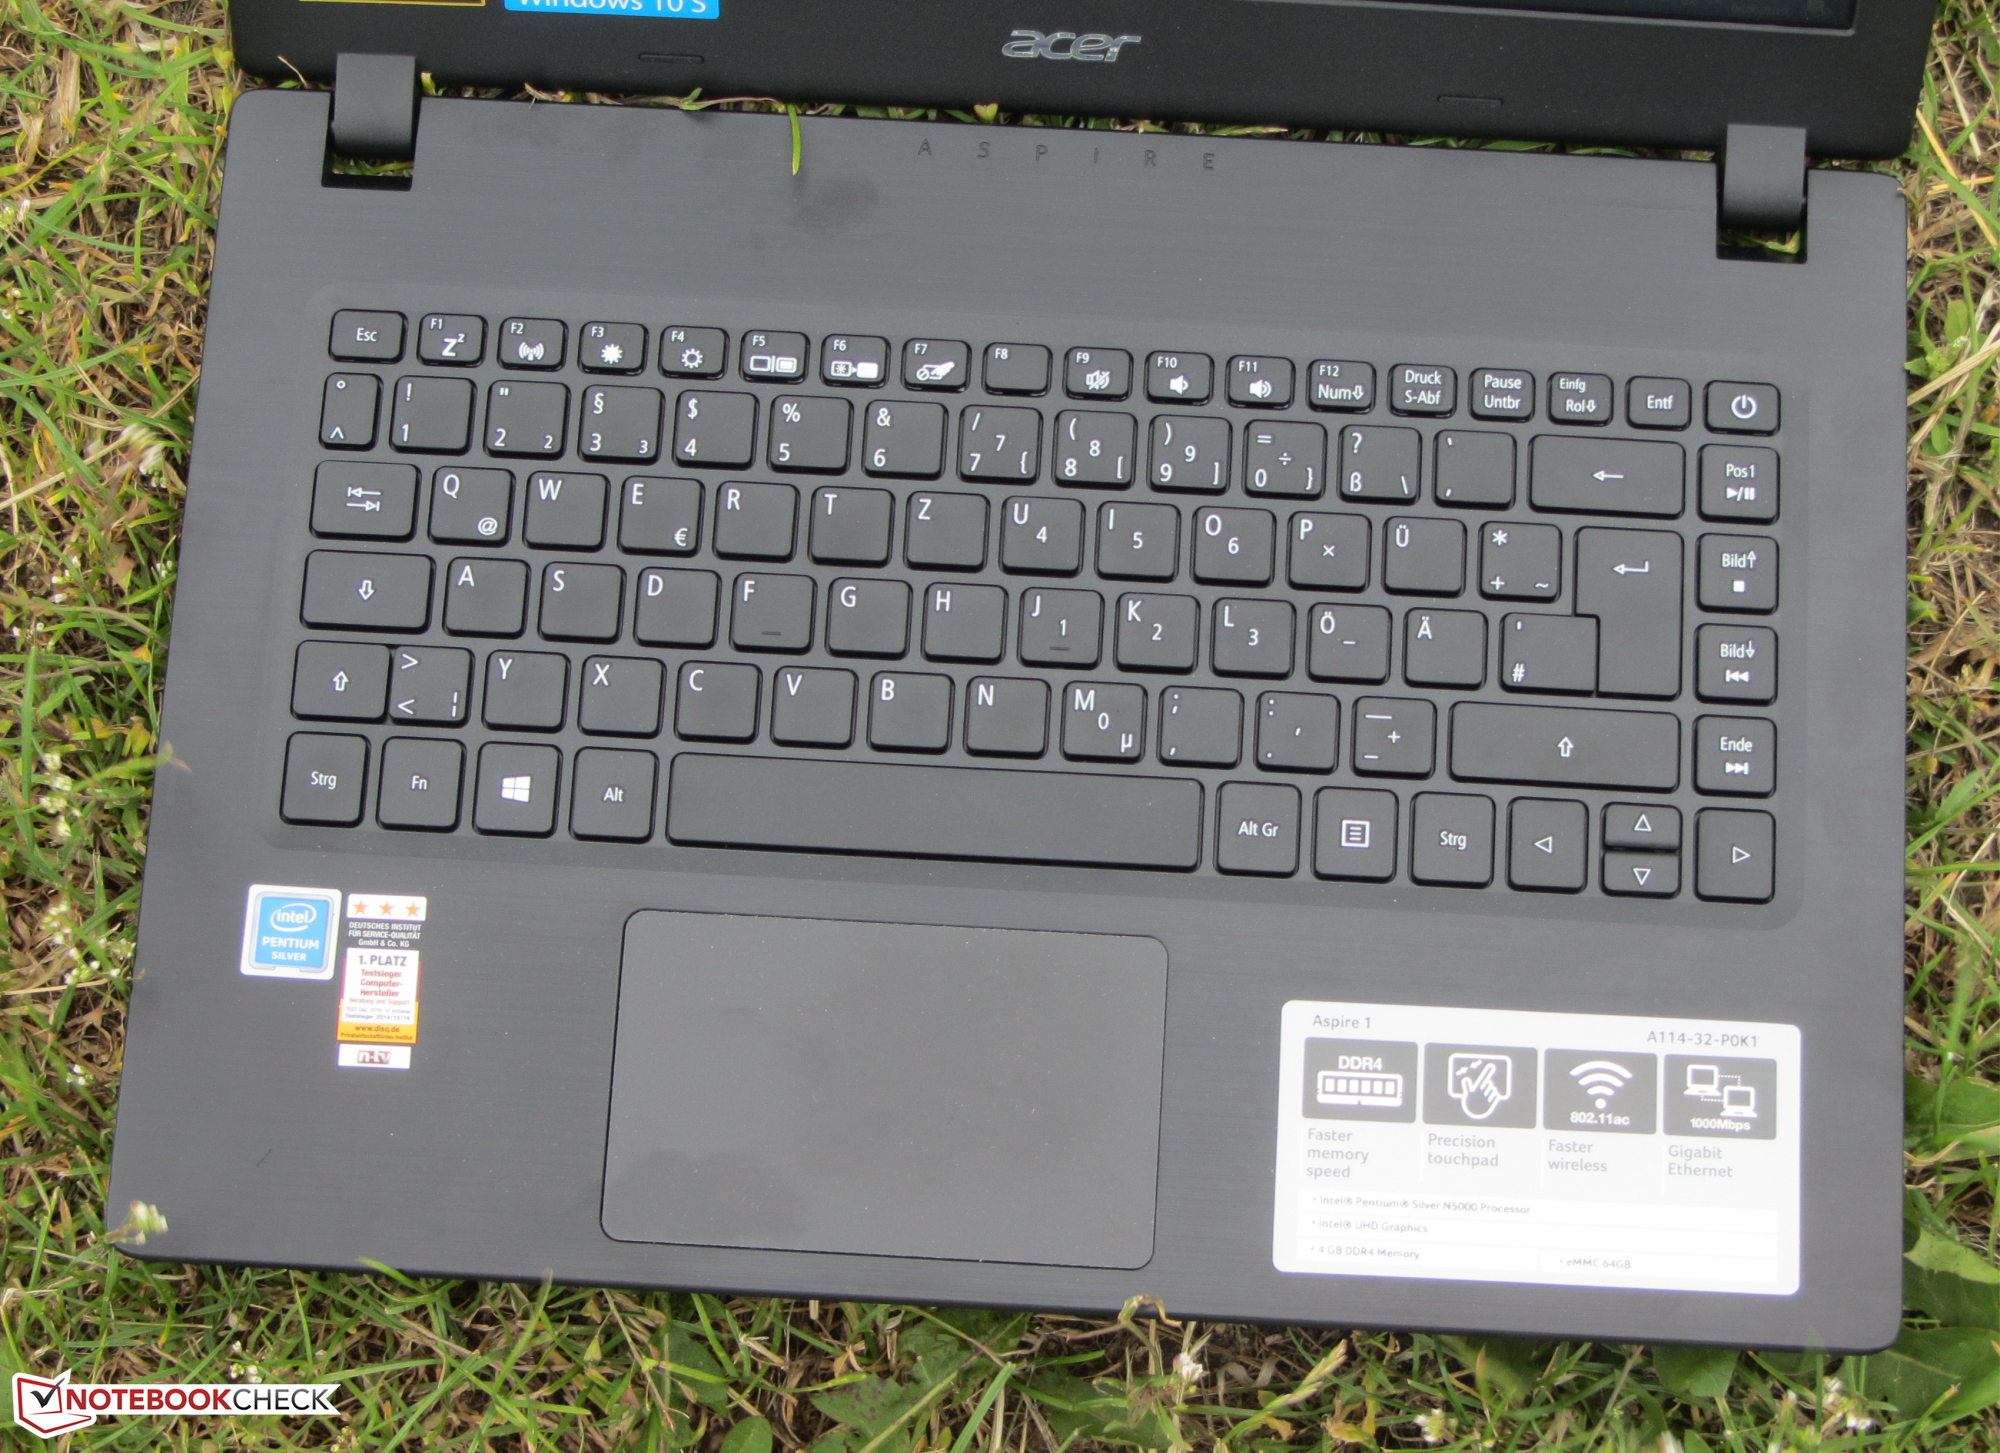
The available storage space is not very abundant. Acer uses a 64 GB eMMC module here. Out of this, just under 44 GB is usable out of the box. The space available for applications is therefore limited. Expanding the storage space via an SD card wouldn't be very practical since corresponding cards stick out of the reading device and aren't locked in place. The keyboard proved to be suitable for everyday use. There is no keyboard backlighting. The battery life is average at best. The device manages a runtime of 6:23 h in our Wi-Fi test. A less powerful 14-incher like the Aspire should last 2 to 3 hours longer.
With the Aspire 1 A114-32 Acer delivers a simple writing and surfing device in the 14-inch format.
The matte Full HD display is unable to convince in any category. It produces dim images with poor contrast and a slight pale look. In addition, this model provides unstable viewing angles. The Aspire comes with Windows 10 S preinstalled. The free upgrade to Windows 10 Pro is recommended to any buyer of the Aspire. Otherwise, only applications found in the Microsoft Store can be used.
During our review we found the Aspire model that was provided to us for a price just under 200 Euros (~$227) with one retailer. You can pull the purchase trigger with confidence at this price. However, most of the other retailers list the device at prices of around 290 Euros (~$329) to 300 Euros (~$340). The buying decision becomes harder here since the Aspire doesn't offer anything that makes it stand out from the crowd. For around 100 Euros (~$113) more, there's the clearly more convincing Acer Swift 1 SF114-32, which has an IPS display, USB Type-C and significantly better battery life.
Acer Aspire 1 A114-32-P0K1
- 09/26/2019 v7 (old)
Sascha Mölck
Price comparison
