Notebookcheck Logo

AMD strikes back: Ryzen 9 7945HX beats Intel Core i9-13980HX despite much lower power consumption

AMD's new Ryzen 9 7945HX in review (Symbolic image, source: AMD)
AMD's Zen 4 CPUs for laptops have finally arrived and the new Ryzen 9 7945HX shows an impressive multi-core performance in our initial benchmarks. Intel's Raptor lake Core i9-13980HX is beaten, even though AMD's new CPU consumes significantly less power. Update: Performance at lower TDP levels

We finally have the opportunity to test the first mobile Zen 4 processor from AMD. It is the new high-end chip Ryzen 9 7945HX with 16 full-fledged Zen 4 cores including hyper threading, which means the chip can execute up to 32 threads simultaneously. We have listed all the specs in our Tech section and we will also publish a comprehensive analyses als well as comparison article at a later point, but we still want to share our initial impressions with you. The full review of the new Asus Zephyrus Duo 16 with the Ryzen 9 7945HX and the Nvidia GeForce RTX 4090 Laptop will also follow soon. For this article, however, we will focus on the CPU performance with some synthetic processor benchmarks as well as some gaming tests.

Single-Core Performance

The new Ryzen 9 7945HX can reach up to 5.4 GHz on a single core and we can confirm this value during our benchmarks. All in all, AMD can almost close the gap to Intel, only the Core i9-13980HX still has a slightly advantage thanks to its high single-core turbo of up to 5.6 GHz. However, AMD is better in terms of power consumption: We measure 27W for the cores, while the performance cores in the Intel Core i9-13980HX consume between 34-36 Watts. 

The performance advantage over the old Ryzen 9 6900HX with the Zen3+ cores is also impressive and we see an average advantage of 27 % in our single-core benchmarks.

CPU Performance Rating: Percent
Cinebench R23: Single Core
Cinebench R20: CPU (Single Core)
Cinebench R15: CPU Single 64Bit
7-Zip 18.03: 7z b 4 -mmt1
Geekbench 5.5: Single-Core
CPU Performance Rating
Intel Core i9-13980HX
Titan GT77 HX 13VI
99.2 pt
Intel Core i9-13950HX
Titan GT77 HX 13VI
96 pt
AMD Ryzen 9 7945HX
Zephyrus Duo 16 GX650PY-NM006W
95.8 pt
Intel Core i9-13900HX
Legion Pro 7 16IRX8H
95.4 pt
Intel Core i9-13900HX
XMG Neo 16 Raptor Lake
93.7 pt
Intel Core i9-13950HX
Blade 16 Early 2023
88.7 pt
Intel Core i9-12900HX
Titan GT77 12UHS
88.4 pt
AMD Ryzen 9 6900HX
ROG Zephyrus Duo 16 GX650RX
75.4 pt
Apple M2 Max -1!
MacBook Pro 16 2023 M2 Max
74.9 pt
Cinebench R23 / Single Core
Intel Core i9-13980HX
Titan GT77 HX 13VI
2169 Points +12%
Intel Core i9-13950HX
Titan GT77 HX 13VI
2100 Points +8%
Intel Core i9-13900HX
XMG Neo 16 Raptor Lake
2055 Points +6%
Intel Core i9-13900HX
Legion Pro 7 16IRX8H
2043 Points +5%
Intel Core i9-13950HX
Blade 16 Early 2023
2029 Points +5%
AMD Ryzen 9 7945HX
Zephyrus Duo 16 GX650PY-NM006W
1940 Points
Intel Core i9-12900HX
Titan GT77 12UHS
1913 Points -1%
Apple M2 Max
MacBook Pro 16 2023 M2 Max
1625 Points -16%
AMD Ryzen 9 6900HX
ROG Zephyrus Duo 16 GX650RX
1566 Points -19%
Cinebench R20 / CPU (Single Core)
Intel Core i9-13980HX
Titan GT77 HX 13VI
825 Points +9%
Intel Core i9-13950HX
Titan GT77 HX 13VI
803 Points +6%
Intel Core i9-13900HX
Legion Pro 7 16IRX8H
788 Points +4%
Intel Core i9-13900HX
XMG Neo 16 Raptor Lake
756 Points 0%
AMD Ryzen 9 7945HX
Zephyrus Duo 16 GX650PY-NM006W
756 Points
Intel Core i9-13950HX
Blade 16 Early 2023
742 Points -2%
Intel Core i9-12900HX
Titan GT77 12UHS
738 Points -2%
AMD Ryzen 9 6900HX
ROG Zephyrus Duo 16 GX650RX
595 Points -21%
Apple M2 Max
MacBook Pro 16 2023 M2 Max
460 Points -39%
Cinebench R15 / CPU Single 64Bit
Intel Core i9-13980HX
Titan GT77 HX 13VI
312 Points +2%
AMD Ryzen 9 7945HX
Zephyrus Duo 16 GX650PY-NM006W
307 Points
Intel Core i9-13900HX
Legion Pro 7 16IRX8H
301 Points -2%
Intel Core i9-13950HX
Titan GT77 HX 13VI
300 Points -2%
Intel Core i9-13900HX
XMG Neo 16 Raptor Lake
295 Points -4%
Intel Core i9-13900HX
XMG Neo 16 Raptor Lake
294 Points -4%
Intel Core i9-12900HX
Titan GT77 12UHS
278 Points -9%
Intel Core i9-13950HX
Blade 16 Early 2023
274 Points -11%
AMD Ryzen 9 6900HX
ROG Zephyrus Duo 16 GX650RX
249 Points -19%
Apple M2 Max
MacBook Pro 16 2023 M2 Max
239 Points -22%
7-Zip 18.03 / 7z b 4 -mmt1
AMD Ryzen 9 7945HX
Zephyrus Duo 16 GX650PY-NM006W
7319 MIPS
Intel Core i9-13900HX
Legion Pro 7 16IRX8H
7035 MIPS -4%
Intel Core i9-13980HX
Titan GT77 HX 13VI
7018 MIPS -4%
Intel Core i9-13950HX
Titan GT77 HX 13VI
6897 MIPS -6%
Intel Core i9-13900HX
XMG Neo 16 Raptor Lake
6800 MIPS -7%
Intel Core i9-13950HX
Blade 16 Early 2023
6445 MIPS -12%
Intel Core i9-12900HX
Titan GT77 12UHS
6256 MIPS -15%
AMD Ryzen 9 6900HX
ROG Zephyrus Duo 16 GX650RX
5727 MIPS -22%
Geekbench 5.5 / Single-Core
Intel Core i9-13980HX
Titan GT77 HX 13VI
2139 Points 0%
AMD Ryzen 9 7945HX
Zephyrus Duo 16 GX650PY-NM006W
2132 Points
Intel Core i9-13950HX
Titan GT77 HX 13VI
2043 Points -4%
Intel Core i9-13900HX
Legion Pro 7 16IRX8H
2025 Points -5%
Intel Core i9-13900HX
XMG Neo 16 Raptor Lake
2023 Points -5%
Apple M2 Max
MacBook Pro 16 2023 M2 Max
1978 Points -7%
Intel Core i9-12900HX
Titan GT77 12UHS
1923 Points -10%
Intel Core i9-13950HX
Blade 16 Early 2023
1805 Points -15%
AMD Ryzen 9 6900HX
ROG Zephyrus Duo 16 GX650RX
1594 Points -25%

Multi-Core Performance

The multi-core performance is really impressive and the Ryzen 9 7945HX is sitting at the top of our comparison charts, even ahead of the latest Raptor Lake HX CPUs from intel. The advantage over the old Ryzen 9 6900HX in the previous Zephyrus Duo 16 (at 80W though) is also impressive.

CPU Performance Rating: Percent
Cinebench R23: Multi Core
Cinebench R20: CPU (Multi Core)
Cinebench R15: CPU Multi 64Bit
Blender: v2.79 BMW27 CPU
7-Zip 18.03: 7z b 4
Geekbench 5.5: Multi-Core
CPU Performance Rating
AMD Ryzen 9 7945HX
Zephyrus Duo 16 GX650PY-NM006W
91.8 pt
Intel Core i9-13950HX
Titan GT77 HX 13VI
88.4 pt
Intel Core i9-13980HX
Titan GT77 HX 13VI
87.4 pt
Intel Core i9-13900HX
Legion Pro 7 16IRX8H
83.6 pt
Intel Core i9-13900HX
XMG Neo 16 Raptor Lake
81.4 pt
Intel Core i9-13950HX
Blade 16 Early 2023
73.1 pt
Intel Core i9-12900HX
Titan GT77 12UHS
61.5 pt
Apple M2 Max -2!
MacBook Pro 16 2023 M2 Max
45.8 pt
AMD Ryzen 9 6900HX
ROG Zephyrus Duo 16 GX650RX
36.4 pt
Cinebench R23 / Multi Core
AMD Ryzen 9 7945HX
Zephyrus Duo 16 GX650PY-NM006W
34521 (32987.6min - 34521.3max) Points
Intel Core i9-13950HX
Titan GT77 HX 13VI
33277 Points -4%
Intel Core i9-13980HX
Titan GT77 HX 13VI
33052 Points -4%
Intel Core i9-13900HX
Legion Pro 7 16IRX8H
30162 Points -13%
Intel Core i9-13900HX
XMG Neo 16 Raptor Lake
28707 (26191.7min - 28706.8max) Points -17%
Intel Core i9-13900HX
XMG Neo 16 Raptor Lake
28010 (26406.1min - 28009.8max) Points -19%
Intel Core i9-13900HX
XMG Neo 16 Raptor Lake
26703 Points -23%
Intel Core i9-13950HX
Blade 16 Early 2023
26736 (22394.1min - 26736.1max) Points -23%
Intel Core i9-12900HX
Titan GT77 12UHS
22982 Points -33%
Apple M2 Max
MacBook Pro 16 2023 M2 Max
14767 Points -57%
AMD Ryzen 9 6900HX
ROG Zephyrus Duo 16 GX650RX
14085 Points -59%
Cinebench R20 / CPU (Multi Core)
AMD Ryzen 9 7945HX
Zephyrus Duo 16 GX650PY-NM006W
13457 Points
Intel Core i9-13950HX
Titan GT77 HX 13VI
12648 Points -6%
Intel Core i9-13980HX
Titan GT77 HX 13VI
12437 Points -8%
Intel Core i9-13900HX
Legion Pro 7 16IRX8H
11500 Points -15%
Intel Core i9-13900HX
XMG Neo 16 Raptor Lake
11289 Points -16%
Intel Core i9-13950HX
Blade 16 Early 2023
8697 Points -35%
Intel Core i9-12900HX
Titan GT77 12UHS
8667 Points -36%
AMD Ryzen 9 6900HX
ROG Zephyrus Duo 16 GX650RX
5489 Points -59%
Apple M2 Max
MacBook Pro 16 2023 M2 Max
4044 Points -70%
Cinebench R15 / CPU Multi 64Bit
AMD Ryzen 9 7945HX
Zephyrus Duo 16 GX650PY-NM006W
5554 (5255.55min - 5554.01max) Points
Intel Core i9-13950HX
Titan GT77 HX 13VI
5227 (4889.98min - 5226.71max) Points -6%
Intel Core i9-13980HX
Titan GT77 HX 13VI
5172 (4917.63min - 5171.97max) Points -7%
Intel Core i9-13900HX
XMG Neo 16 Raptor Lake
4913 Points -12%
Intel Core i9-13900HX
XMG Neo 16 Raptor Lake
4875 (4298.3min - 4875.08max) Points -12%
Intel Core i9-13900HX
Legion Pro 7 16IRX8H
4819 (4429.68min - 4819.28max) Points -13%
Intel Core i9-13950HX
Blade 16 Early 2023
4529 (4463.29min - 4528.99max) Points -18%
Intel Core i9-12900HX
Titan GT77 12UHS
3570 (3259.45min - 3569.52max) Points -36%
AMD Ryzen 9 6900HX
ROG Zephyrus Duo 16 GX650RX
2292 Points -59%
Apple M2 Max
MacBook Pro 16 2023 M2 Max
2074 (2068.47min, 2068.57P1 - 2081.27max) Points -63%
Blender / v2.79 BMW27 CPU
AMD Ryzen 9 6900HX
ROG Zephyrus Duo 16 GX650RX
220 Seconds * -137%
Intel Core i9-12900HX
Titan GT77 12UHS
147 Seconds * -58%
Intel Core i9-13950HX
Blade 16 Early 2023
114 Seconds * -23%
Intel Core i9-13900HX
XMG Neo 16 Raptor Lake
111 Seconds * -19%
Intel Core i9-13900HX
Legion Pro 7 16IRX8H
105 Seconds * -13%
Intel Core i9-13980HX
Titan GT77 HX 13VI
101 Seconds * -9%
Intel Core i9-13950HX
Titan GT77 HX 13VI
100 Seconds * -8%
AMD Ryzen 9 7945HX
Zephyrus Duo 16 GX650PY-NM006W
93 Seconds *
7-Zip 18.03 / 7z b 4
AMD Ryzen 9 7945HX
Zephyrus Duo 16 GX650PY-NM006W
135927 MIPS
Intel Core i9-13950HX
Titan GT77 HX 13VI
127295 MIPS -6%
Intel Core i9-13980HX
Titan GT77 HX 13VI
125720 MIPS -8%
Intel Core i9-13900HX
Legion Pro 7 16IRX8H
122254 MIPS -10%
Intel Core i9-13900HX
XMG Neo 16 Raptor Lake
118715 MIPS -13%
Intel Core i9-13950HX
Blade 16 Early 2023
109330 MIPS -20%
Intel Core i9-12900HX
Titan GT77 12UHS
86234 MIPS -37%
AMD Ryzen 9 6900HX
ROG Zephyrus Duo 16 GX650RX
64457 MIPS -53%
Geekbench 5.5 / Multi-Core
Intel Core i9-13900HX
Legion Pro 7 16IRX8H
21058 Points +8%
Intel Core i9-13900HX
XMG Neo 16 Raptor Lake
20784 Points +6%
Intel Core i9-13950HX
Titan GT77 HX 13VI
20634 Points +5%
Intel Core i9-13980HX
Titan GT77 HX 13VI
20329 Points +4%
AMD Ryzen 9 7945HX
Zephyrus Duo 16 GX650PY-NM006W
19583 Points
Intel Core i9-13950HX
Blade 16 Early 2023
18152 Points -7%
Intel Core i9-12900HX
Titan GT77 12UHS
16250 Points -17%
Apple M2 Max
MacBook Pro 16 2023 M2 Max
15348 Points -22%
AMD Ryzen 9 6900HX
ROG Zephyrus Duo 16 GX650RX
10167 Points -48%

* ... smaller is better

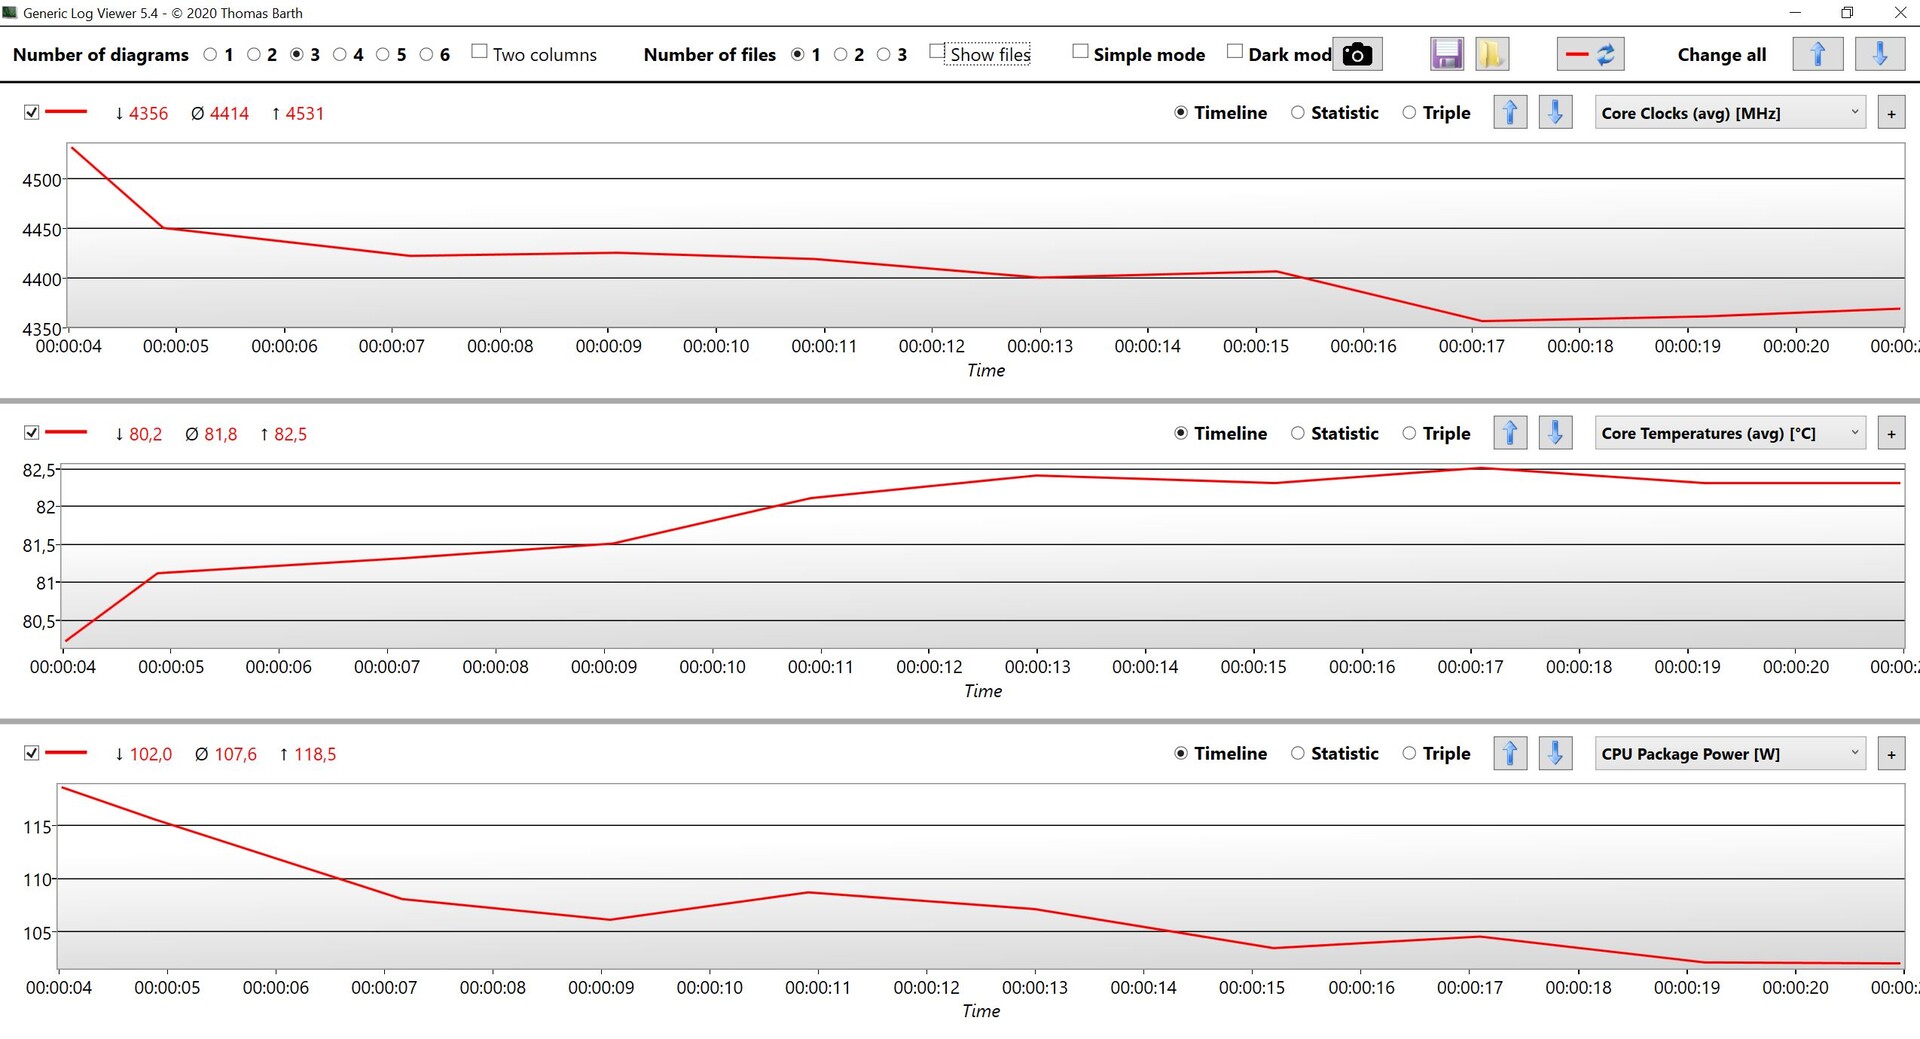
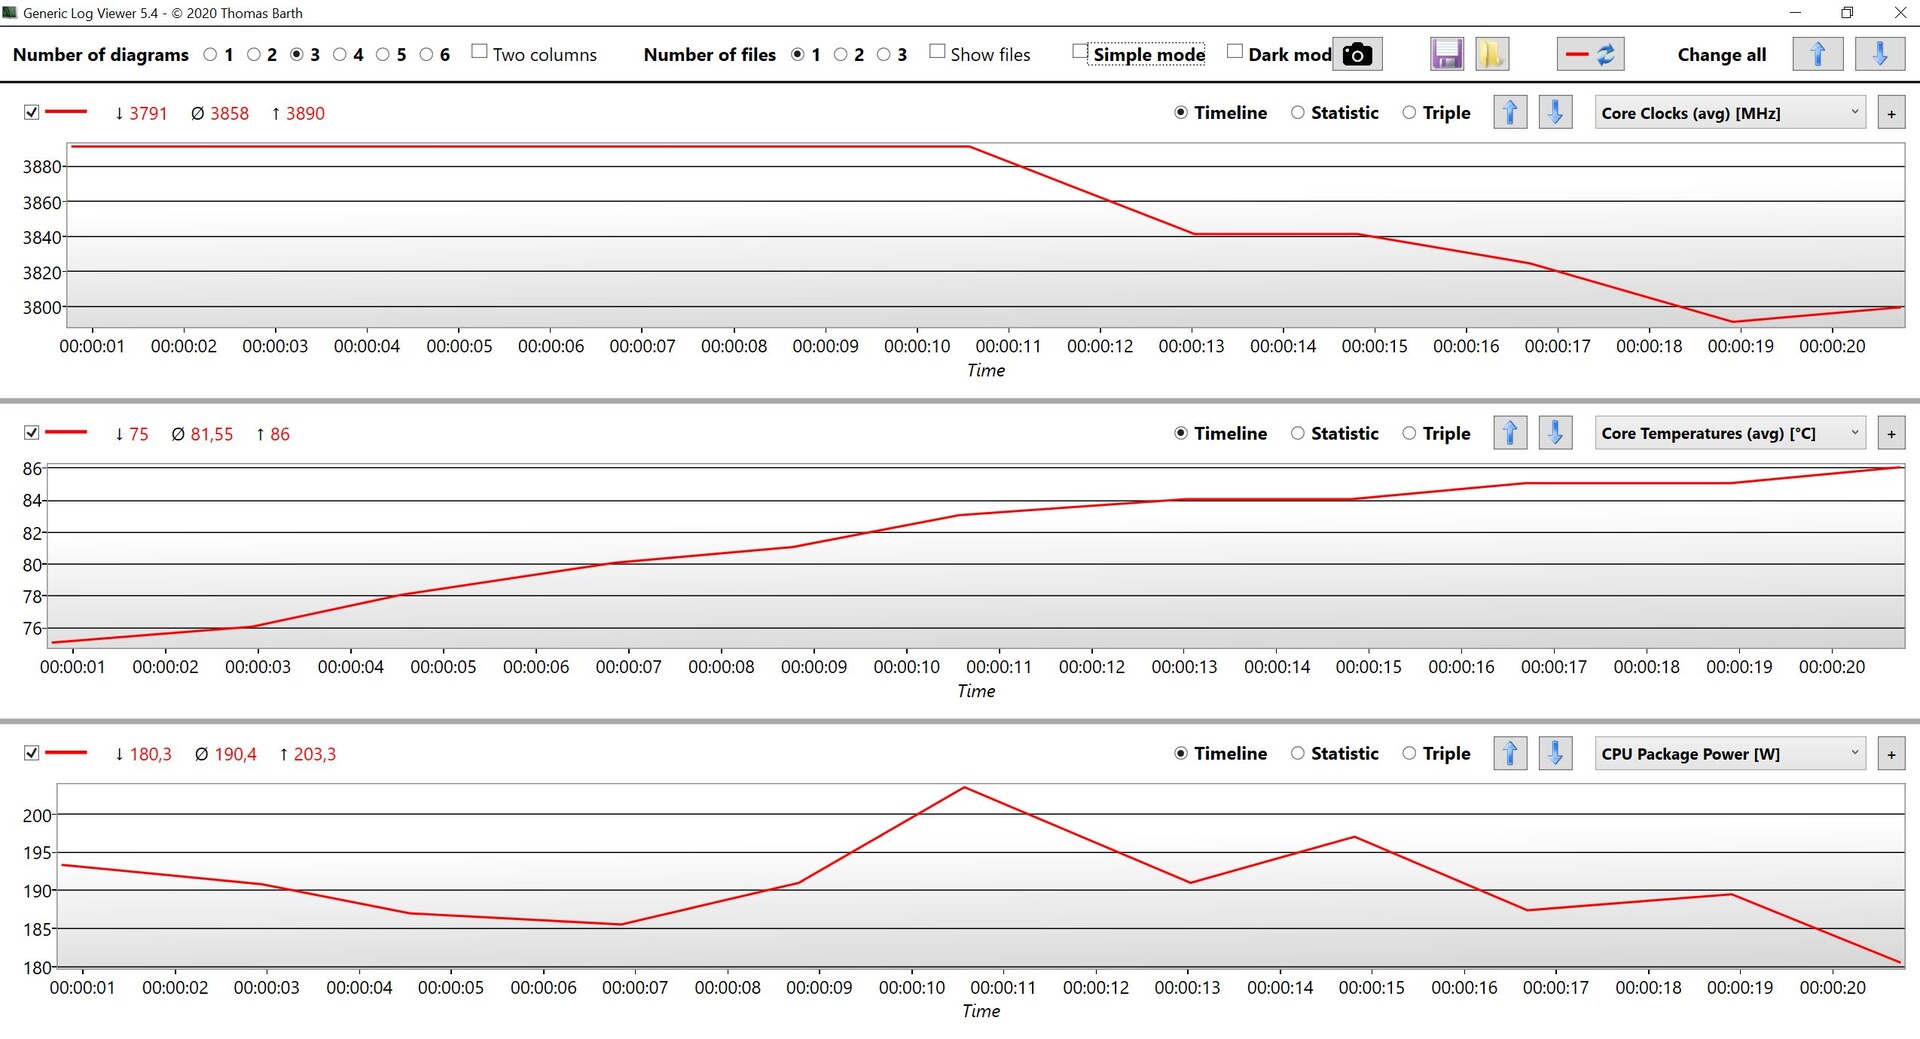
The performance of the new Zen 4 processor is even more impressive when you look at the power consumption. All the Intel HX rivals usually consume much more than 150 Watts, but the Ryzen 9 7945HX tops out at 120 Watts. The two following pictures show the CPU data of the Ryzen 9 7945HX as well as the Core i9-13980HX in a single Cinebench R23 Multi run. We also limited the Core i9-13980HX to 120 Watts and got 28333 point sin CB R23 Multi compared to 34521 points for the Ryzen 9 7945HX. This means the new Zen 4 chip is roughly 22 % faster (in multi-core tests) at the same power consumption.

CPU data Cinebench R23 (AMD Ryzen 9 7945HX)
CPU data Cinebench R23 (Intel Core i9-13980HX)

Gaming Performance

We have already performed some gaming benchmarks and the initial results for the Ryzen 9 7945HX look good, but we want to collect more data before we can give a final verdict on the gaming performance.

Performance Rating - Percent
MSI Titan GT77 HX 13VI
Intel Core i9-13950HX, NVIDIA GeForce RTX 4090 Laptop GPU
97 pt
SCHENKER XMG Neo 16 Raptor Lake
Intel Core i9-13900HX, NVIDIA GeForce RTX 4090 Laptop GPU
95.9 pt
Razer Blade 16 Early 2023
Intel Core i9-13950HX, NVIDIA GeForce RTX 4080 Laptop GPU
91.5 pt
Lenovo Legion Pro 7 16IRX8H
Intel Core i9-13900HX, NVIDIA GeForce RTX 4080 Laptop GPU
90.4 pt
Asus Zephyrus Duo 16 GX650PY-NM006W
AMD Ryzen 9 7945HX, NVIDIA GeForce RTX 4090 Laptop GPU
88.8 pt
MSI Titan GT77 12UHS
Intel Core i9-12900HX, NVIDIA GeForce RTX 3080 Ti Laptop GPU
76.7 pt
Average of class Gaming
 
64.2 pt
Asus ROG Zephyrus Duo 16 GX650RX
AMD Ryzen 9 6900HX, NVIDIA GeForce RTX 3080 Ti Laptop GPU
57 pt
The Witcher 3 - 1920x1080 Ultra Graphics & Postprocessing (HBAO+)
SCHENKER XMG Neo 16 Raptor Lake
Intel Core i9-13900HX, NVIDIA GeForce RTX 4090 Laptop GPU
216.4 (5.6P0.1, 144.3P1) fps +21%
MSI Titan GT77 HX 13VI
Intel Core i9-13950HX, NVIDIA GeForce RTX 4090 Laptop GPU
198.9 (190min, 191P1) fps +11%
Asus Zephyrus Duo 16 GX650PY-NM006W
AMD Ryzen 9 7945HX, NVIDIA GeForce RTX 4090 Laptop GPU
178.6 (172min, 173P1) fps
Lenovo Legion Pro 7 16IRX8H
Intel Core i9-13900HX, NVIDIA GeForce RTX 4080 Laptop GPU
178 (151min) fps 0%
Razer Blade 16 Early 2023
Intel Core i9-13950HX, NVIDIA GeForce RTX 4080 Laptop GPU
176.8 (159min) fps -1%
MSI Titan GT77 12UHS
Intel Core i9-12900HX, NVIDIA GeForce RTX 3080 Ti Laptop GPU
129.3 (110min, 111.14P1) fps -28%
Average of class Gaming
  (8.61 - 216, n=238, last 2 years)
115.1 fps -36%
Asus ROG Zephyrus Duo 16 GX650RX
AMD Ryzen 9 6900HX, NVIDIA GeForce RTX 3080 Ti Laptop GPU
111.1 (30min, 41.5P0.1, 74.7P1) fps -38%
GTA V - 1920x1080 Highest Settings possible AA:4xMSAA + FX AF:16x
Lenovo Legion Pro 7 16IRX8H
Intel Core i9-13900HX, NVIDIA GeForce RTX 4080 Laptop GPU
145.5 (3.79min, 100P1) fps +9%
MSI Titan GT77 HX 13VI
Intel Core i9-13950HX, NVIDIA GeForce RTX 4090 Laptop GPU
140.9 (3.54min, 83.3P1) fps +5%
Razer Blade 16 Early 2023
Intel Core i9-13950HX, NVIDIA GeForce RTX 4080 Laptop GPU
140.7 (3.02min, 100P1) fps +5%
SCHENKER XMG Neo 16 Raptor Lake
Intel Core i9-13900HX, NVIDIA GeForce RTX 4090 Laptop GPU
137.5 (3.4min, 100P1) fps +3%
Asus Zephyrus Duo 16 GX650PY-NM006W
AMD Ryzen 9 7945HX, NVIDIA GeForce RTX 4090 Laptop GPU
134 (7.27min, 90.9P1) fps
MSI Titan GT77 12UHS
Intel Core i9-12900HX, NVIDIA GeForce RTX 3080 Ti Laptop GPU
131.8 (6.21min, 90.9P1) fps -2%
Average of class Gaming
  (6.38 - 167.7, n=227, last 2 years)
106.3 fps -21%
Asus ROG Zephyrus Duo 16 GX650RX
AMD Ryzen 9 6900HX, NVIDIA GeForce RTX 3080 Ti Laptop GPU
101.5 (21.1min, 71.4P1) fps -24%
Final Fantasy XV Benchmark - 1920x1080 High Quality
MSI Titan GT77 HX 13VI
Intel Core i9-13950HX, NVIDIA GeForce RTX 4090 Laptop GPU
187.4 fps +10%
SCHENKER XMG Neo 16 Raptor Lake
Intel Core i9-13900HX, NVIDIA GeForce RTX 4090 Laptop GPU
180.7 (119min, 128.92P1) fps +7%
Asus Zephyrus Duo 16 GX650PY-NM006W
AMD Ryzen 9 7945HX, NVIDIA GeForce RTX 4090 Laptop GPU
169.6 fps
Lenovo Legion Pro 7 16IRX8H
Intel Core i9-13900HX, NVIDIA GeForce RTX 4080 Laptop GPU
162.4 fps -4%
Razer Blade 16 Early 2023
Intel Core i9-13950HX, NVIDIA GeForce RTX 4080 Laptop GPU
157.8 fps -7%
MSI Titan GT77 12UHS
Intel Core i9-12900HX, NVIDIA GeForce RTX 3080 Ti Laptop GPU
137.6 fps -19%
Average of class Gaming
  (9.13 - 194.9, n=237, last 2 years)
109.6 fps -35%
Asus ROG Zephyrus Duo 16 GX650RX
AMD Ryzen 9 6900HX, NVIDIA GeForce RTX 3080 Ti Laptop GPU
108 fps -36%
Strange Brigade - 1920x1080 ultra AA:ultra AF:16
MSI Titan GT77 HX 13VI
Intel Core i9-13950HX, NVIDIA GeForce RTX 4090 Laptop GPU
373 (29.9min, 272P1) fps +12%
SCHENKER XMG Neo 16 Raptor Lake
Intel Core i9-13900HX, NVIDIA GeForce RTX 4090 Laptop GPU
350 (32.1min, 230P1) fps +5%
Asus Zephyrus Duo 16 GX650PY-NM006W
AMD Ryzen 9 7945HX, NVIDIA GeForce RTX 4090 Laptop GPU
333 (38min, 227P1) fps
Razer Blade 16 Early 2023
Intel Core i9-13950HX, NVIDIA GeForce RTX 4080 Laptop GPU
323 (61.7min, 222P1) fps -3%
Lenovo Legion Pro 7 16IRX8H
Intel Core i9-13900HX, NVIDIA GeForce RTX 4080 Laptop GPU
318 (29.2min, 228P1) fps -5%
MSI Titan GT77 12UHS
Intel Core i9-12900HX, NVIDIA GeForce RTX 3080 Ti Laptop GPU
219 (67.8min, 154.6P1) fps -34%
Average of class Gaming
  (14.6 - 421, n=235, last 2 years)
203 fps -39%
Asus ROG Zephyrus Duo 16 GX650RX
AMD Ryzen 9 6900HX, NVIDIA GeForce RTX 3080 Ti Laptop GPU
182.4 (66.8min, 132.6P1) fps -45%
Dota 2 Reborn - 1920x1080 ultra (3/3) best looking
Razer Blade 16 Early 2023
Intel Core i9-13950HX, NVIDIA GeForce RTX 4080 Laptop GPU
194.7 (160min) fps +8%
MSI Titan GT77 HX 13VI
Intel Core i9-13950HX, NVIDIA GeForce RTX 4090 Laptop GPU
185.9 (157.5min) fps +3%
Asus Zephyrus Duo 16 GX650PY-NM006W
AMD Ryzen 9 7945HX, NVIDIA GeForce RTX 4090 Laptop GPU
179.7 (153.7min) fps
Lenovo Legion Pro 7 16IRX8H
Intel Core i9-13900HX, NVIDIA GeForce RTX 4080 Laptop GPU
179 (152.4min) fps 0%
SCHENKER XMG Neo 16 Raptor Lake
Intel Core i9-13900HX, NVIDIA GeForce RTX 4090 Laptop GPU
177.3 (150.3min) fps -1%
MSI Titan GT77 12UHS
Intel Core i9-12900HX, NVIDIA GeForce RTX 3080 Ti Laptop GPU
170.5 (148.2min) fps -5%
Average of class Gaming
  (26.9 - 220, n=248, last 2 years)
141.2 fps -21%
Asus ROG Zephyrus Duo 16 GX650RX
AMD Ryzen 9 6900HX, NVIDIA GeForce RTX 3080 Ti Laptop GPU
111.3 (96.1min) fps -38%
X-Plane 11.11 - 1920x1080 high (fps_test=3)
Razer Blade 16 Early 2023
Intel Core i9-13950HX, NVIDIA GeForce RTX 4080 Laptop GPU
137 fps +16%
SCHENKER XMG Neo 16 Raptor Lake
Intel Core i9-13900HX, NVIDIA GeForce RTX 4090 Laptop GPU
137 fps +16%
SCHENKER XMG Neo 16 Raptor Lake
Intel Core i9-13900HX, NVIDIA GeForce RTX 4090 Laptop GPU
135.7 fps +15%
SCHENKER XMG Neo 16 Raptor Lake
Intel Core i9-13900HX, NVIDIA GeForce RTX 4090 Laptop GPU
135.5 fps +15%
MSI Titan GT77 HX 13VI
Intel Core i9-13950HX, NVIDIA GeForce RTX 4090 Laptop GPU
134.2 fps +14%
MSI Titan GT77 HX 13VI
Intel Core i9-13950HX, NVIDIA GeForce RTX 4090 Laptop GPU
134.1 fps +14%
Lenovo Legion Pro 7 16IRX8H
Intel Core i9-13900HX, NVIDIA GeForce RTX 4080 Laptop GPU
131.8 fps +12%
MSI Titan GT77 12UHS
Intel Core i9-12900HX, NVIDIA GeForce RTX 3080 Ti Laptop GPU
123.8 fps +5%
Asus Zephyrus Duo 16 GX650PY-NM006W
AMD Ryzen 9 7945HX, NVIDIA GeForce RTX 4090 Laptop GPU
117.8 fps
Average of class Gaming
  (12.4 - 166.2, n=253, last 2 years)
100.8 fps -14%
Asus ROG Zephyrus Duo 16 GX650RX
AMD Ryzen 9 6900HX, NVIDIA GeForce RTX 3080 Ti Laptop GPU
78.2 fps -34%
The Witcher 3 - 1920x1080 Ultra Graphics & Postprocessing (HBAO+)
SCHENKER XMG Neo 16 Raptor Lake
Intel Core i9-13900HX, NVIDIA GeForce RTX 4090 Laptop GPU
216.4 (5.6P0.1, 144.3P1) fps +21%
MSI Titan GT77 HX 13VI
Intel Core i9-13950HX, NVIDIA GeForce RTX 4090 Laptop GPU
198.9 (190min, 191P1) fps +11%
Average NVIDIA GeForce RTX 4090 Laptop GPU
  (139.2 - 216, n=31)
197.5 fps +11%
Asus Zephyrus Duo 16 GX650PY-NM006W
AMD Ryzen 9 7945HX, NVIDIA GeForce RTX 4090 Laptop GPU
178.6 (172min, 173P1) fps
Lenovo Legion Pro 7 16IRX8H
Intel Core i9-13900HX, NVIDIA GeForce RTX 4080 Laptop GPU
178 (151min) fps 0%
Razer Blade 16 Early 2023
Intel Core i9-13950HX, NVIDIA GeForce RTX 4080 Laptop GPU
176.8 (159min) fps -1%
MSI Titan GT77 12UHS
Intel Core i9-12900HX, NVIDIA GeForce RTX 3080 Ti Laptop GPU
129.3 (110min, 111.14P1) fps -28%
Average of class Gaming
  (8.61 - 216, n=238, last 2 years)
115.1 fps -36%
Asus ROG Zephyrus Duo 16 GX650RX
AMD Ryzen 9 6900HX, NVIDIA GeForce RTX 3080 Ti Laptop GPU
111.1 (30min, 41.5P0.1, 74.7P1) fps -38%
Cyberpunk 2077 1.6 - 1920x1080 Ultra Preset
MSI Titan GT77 HX 13VI
Intel Core i9-13950HX, NVIDIA GeForce RTX 4090 Laptop GPU
135 fps +3%
Asus Zephyrus Duo 16 GX650PY-NM006W
AMD Ryzen 9 7945HX, NVIDIA GeForce RTX 4090 Laptop GPU
130.6 (34.83min) fps
Average NVIDIA GeForce RTX 4090 Laptop GPU
  (91 - 159.7, n=20)
124 fps -5%
SCHENKER XMG Neo 16 Raptor Lake
Intel Core i9-13900HX, NVIDIA GeForce RTX 4090 Laptop GPU
122.8 (25.64min) fps -6%
Razer Blade 16 Early 2023
Intel Core i9-13950HX, NVIDIA GeForce RTX 4080 Laptop GPU
106.2 (47.5min) fps -19%
MSI Titan GT77 12UHS
Intel Core i9-12900HX, NVIDIA GeForce RTX 3080 Ti Laptop GPU
99.4 (40.7min) fps -24%
Asus ROG Zephyrus Duo 16 GX650RX
AMD Ryzen 9 6900HX, NVIDIA GeForce RTX 3080 Ti Laptop GPU
99.1 (29min) fps -24%
Average of class Gaming
  (16.7 - 159.7, n=108, last 2 years)
86.4 fps -34%
The Witcher 3 v4.00 - 1920x1080 Ultra Preset / On AA:FX
MSI Titan GT77 HX 13VI
Intel Core i9-13950HX, NVIDIA GeForce RTX 4090 Laptop GPU
150 fps +12%
SCHENKER XMG Neo 16 Raptor Lake
Intel Core i9-13900HX, NVIDIA GeForce RTX 4090 Laptop GPU
141.8 fps +6%
Average NVIDIA GeForce RTX 4090 Laptop GPU
  (120.4 - 150, n=6)
137.7 fps +3%
Asus Zephyrus Duo 16 GX650PY-NM006W
AMD Ryzen 9 7945HX, NVIDIA GeForce RTX 4090 Laptop GPU
133.9 fps
Lenovo Legion Pro 7 16IRX8H
Intel Core i9-13900HX, NVIDIA GeForce RTX 4080 Laptop GPU
125.3 (35.5min, 57.7P0.1, 92.5P1) fps -6%
Average of class Gaming
  (25.9 - 150, n=15, last 2 years)
91.5 fps -32%
Shadow of the Tomb Raider - 1920x1080 Highest Preset AA:T
MSI Titan GT77 HX 13VI
Intel Core i9-13950HX, NVIDIA GeForce RTX 4090 Laptop GPU
214 fps +3%
Asus Zephyrus Duo 16 GX650PY-NM006W
AMD Ryzen 9 7945HX, NVIDIA GeForce RTX 4090 Laptop GPU
208 fps
SCHENKER XMG Neo 16 Raptor Lake
Intel Core i9-13900HX, NVIDIA GeForce RTX 4090 Laptop GPU
207 (140min) fps 0%
Average NVIDIA GeForce RTX 4090 Laptop GPU
  (143.7 - 271, n=14)
197.2 fps -5%
Razer Blade 16 Early 2023
Intel Core i9-13950HX, NVIDIA GeForce RTX 4080 Laptop GPU
176 (117min) fps -15%
Average of class Gaming
  (27 - 271, n=31, last 2 years)
160.3 fps -23%

Update - Performance at lower TDP levels

In addition to the default power levels, we also checked the performance of the new Ryzen 9 7945HX at lower TDP values and the results are extremely good, which is visivible in the following table. We also included the results for the Intel Core i9-13980HX at the same power levels.

Cinebench R23 Multi Score
TDP Core i9-13980HX Ryzen 9 7945HX Difference
unlimited 33052 34521 +4 %
100 Watts 26507 33487 +26 %
80 Watts 23766 31588 +33 %
55 Watts 19478 26191 +34 %

It is very obvious that Intel's best Raptor Lake mobile processor does not stand a chance against the new Zen 4 CPU at similar TDP levels. The sweet spot for the Ryzen 9 7945HX is definitely in the range between 80-100 Watts where we can only see a minor performance deficit.

Initial Verdict: AMD has the best mobile processor

The benchmark results above obviously do not give us a full picture yet, but the initial results are extremely positive. AMD managed to close the gap in terms of single-core performance with lower power consumption. The new Zen 4 chip is even faster in multi-core benchmarks and still consumes considerably less power at just 120 Watts, which means laptop manufacturer get more headroom for the cooling of the GPU, for example.

We are currently working on a comprehensive analysis article as well as the review of the new Asus Zephyrus Duo 16 with the Ryzen 9 7945HX in combination with the new Nvidia GeForce RTX 4090 Laptop. It seems AMD's Zen 4 chips have an advantage over Intel, but we also have to wait and see if there will be a sufficient number of laptop models with the new CPUs. AMD already offered the best mobile CPU for thin and light notebooks with the Ryzen 7 6800U, but the availability was very limited and customers often did not have an alaternative to Intel CPUs.

Read all 20 comments / answer
static version load dynamic
Loading Comments
Comment on this article
Please share our article, every link counts!
> Expert Reviews and News on Laptops, Smartphones and Tech Innovations > News > News Archive > Newsarchive 2023 03 > AMD strikes back: Ryzen 9 7945HX beats Intel Core i9-13980HX despite much lower power consumption
Andreas Osthoff, 2023-03- 1 (Update: 2023-03- 2)