Notebookcheck Logo

GRID Autosport Benchmarked

Pedal to the metal. In line with the current trend, racing-game expert Codemasters follows up successful games with sequels and releases at least one flagship product every year. The latest addition to the simulator series, GRID Autosport, is intended to be a very comprehensive package which offers a lot of variety. Our review is predominantly aimed at notebook users who would like to know how much horsepower is actually needed to guarantee a smooth gaming experience.

Technology

For the original German article, see here.

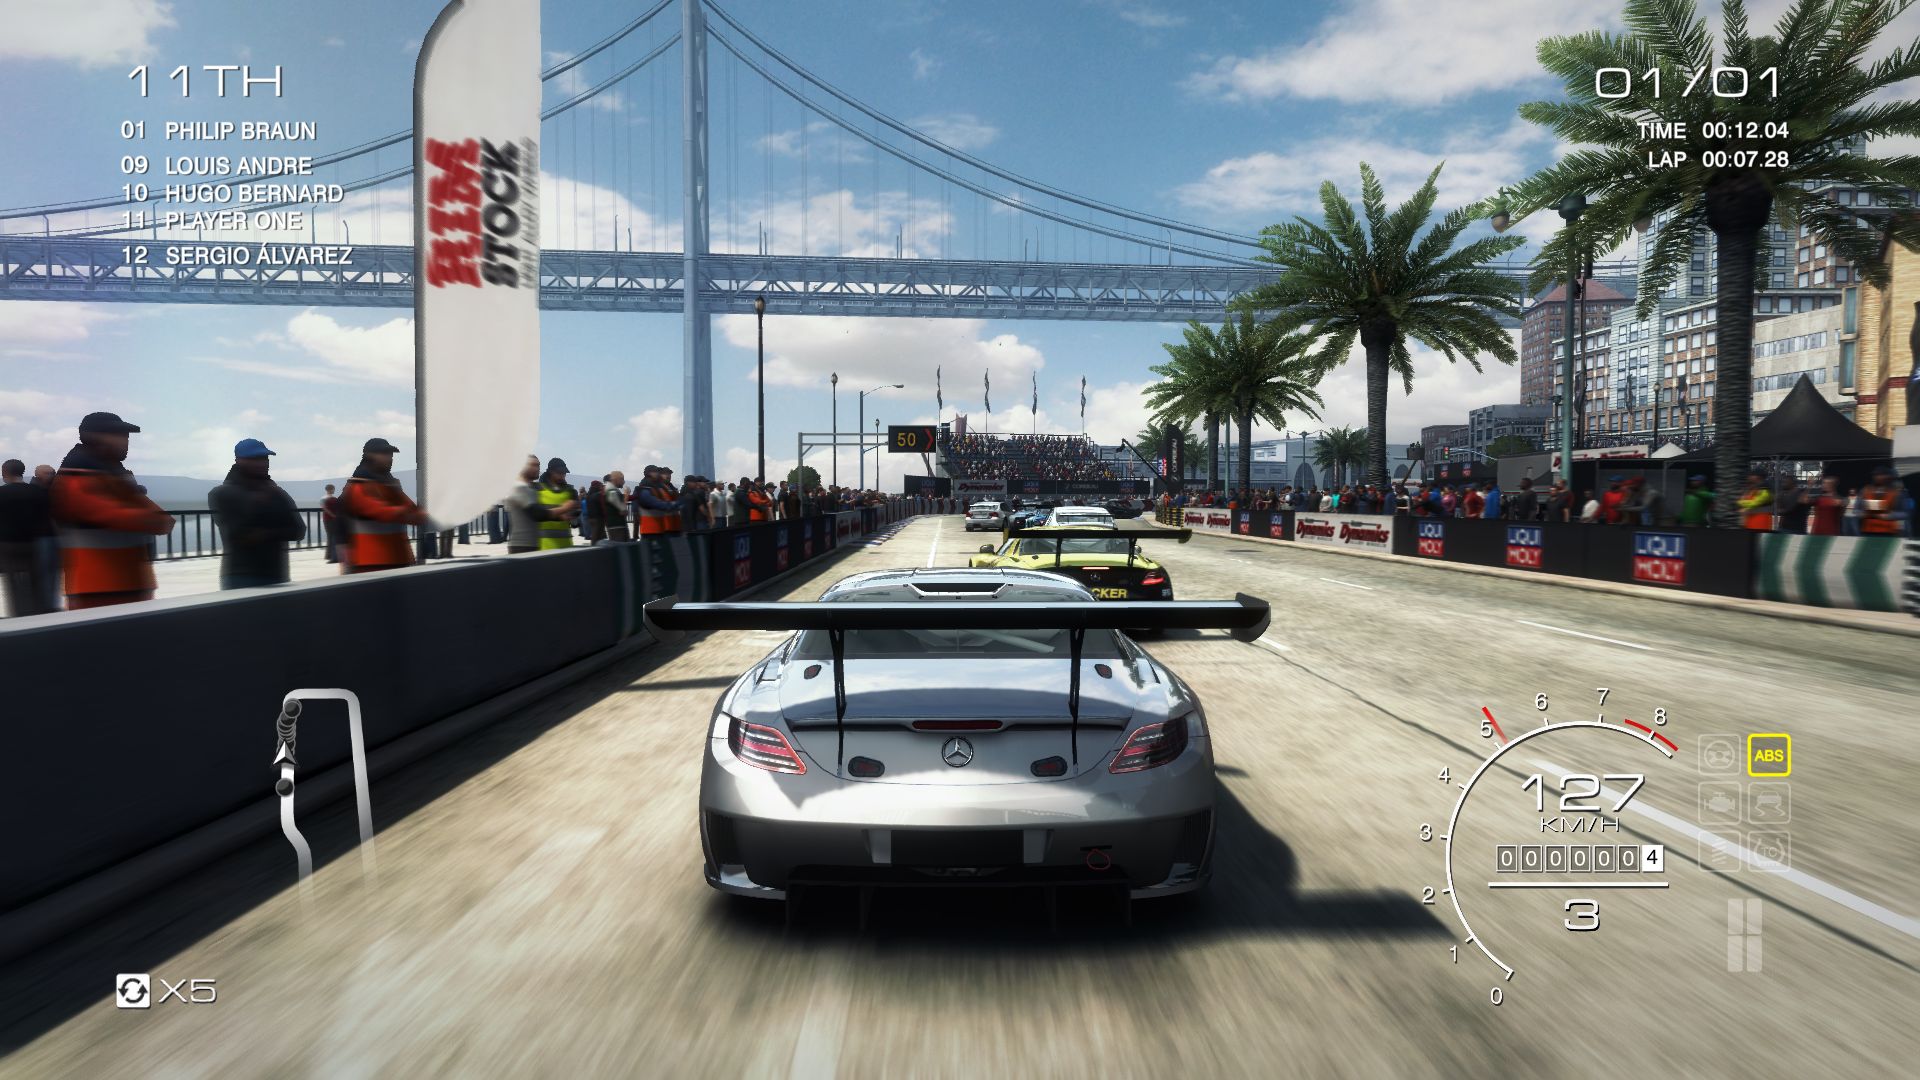
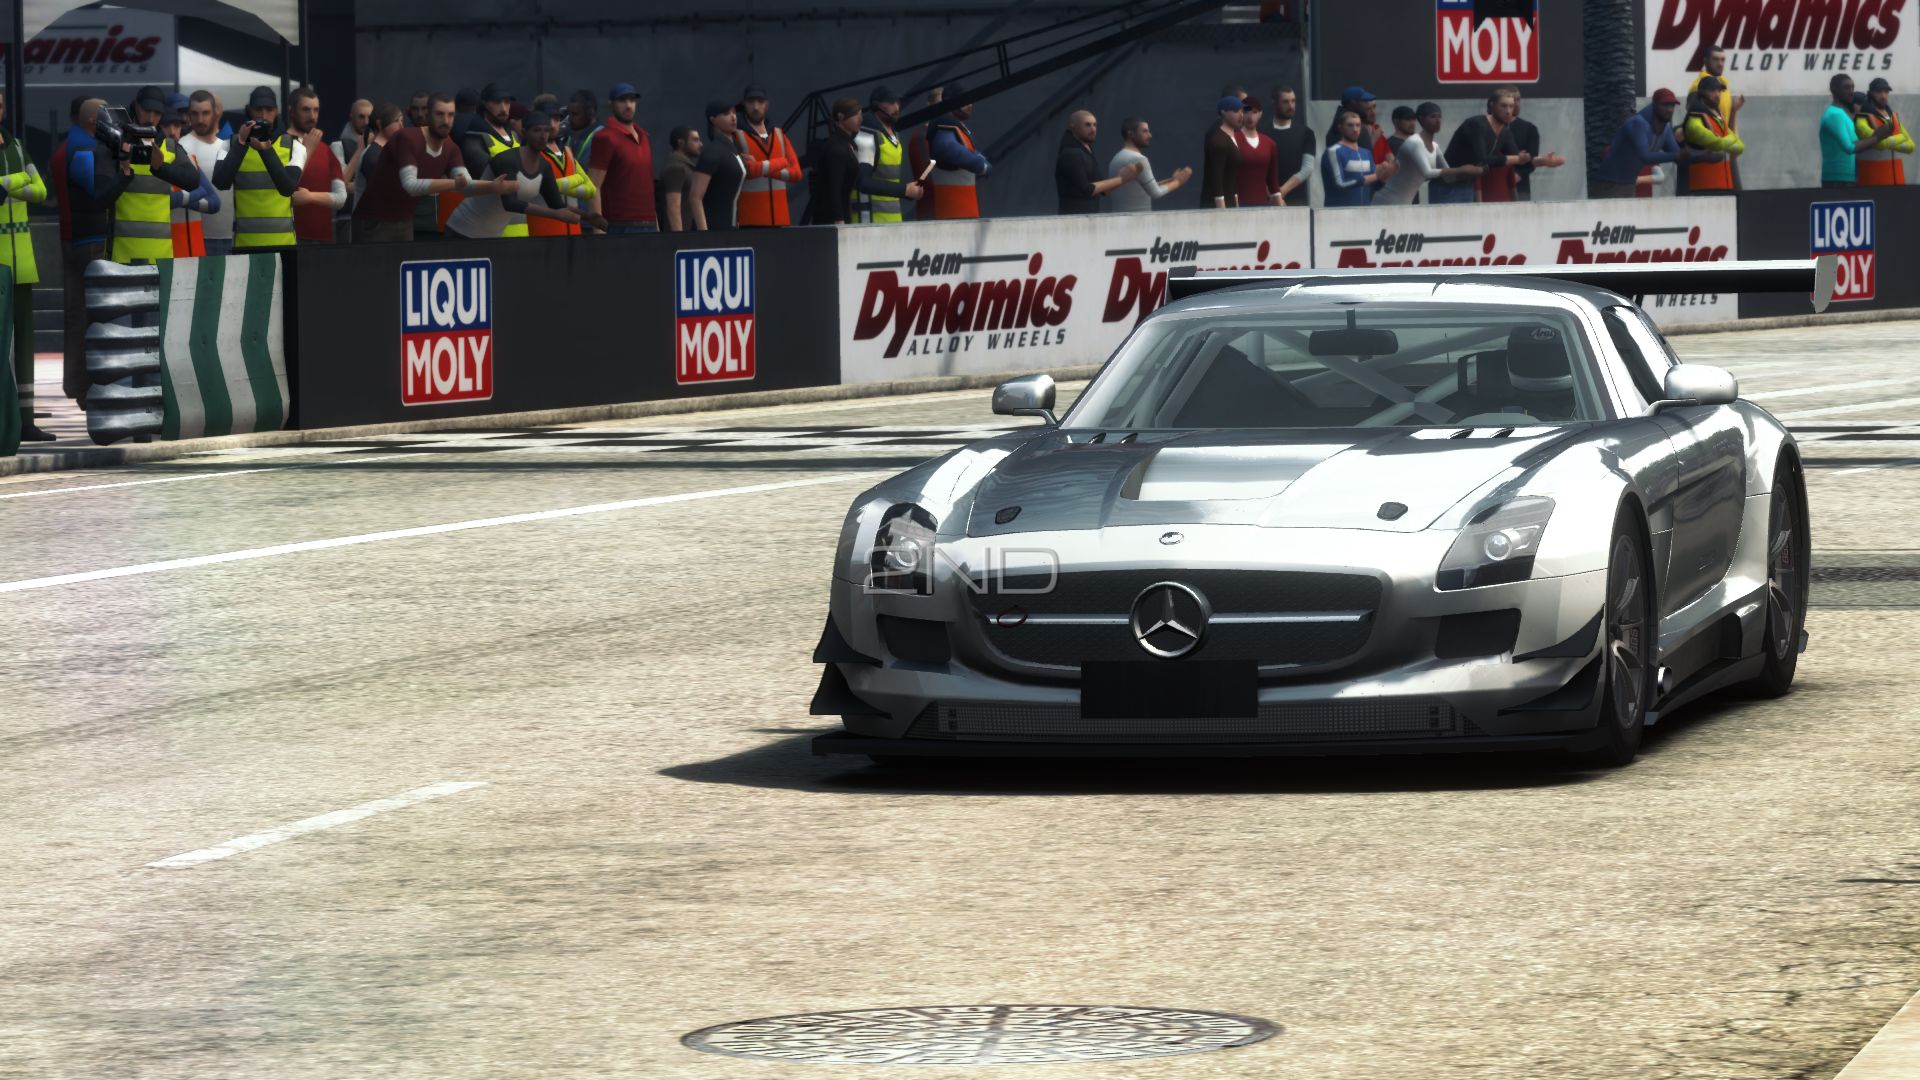
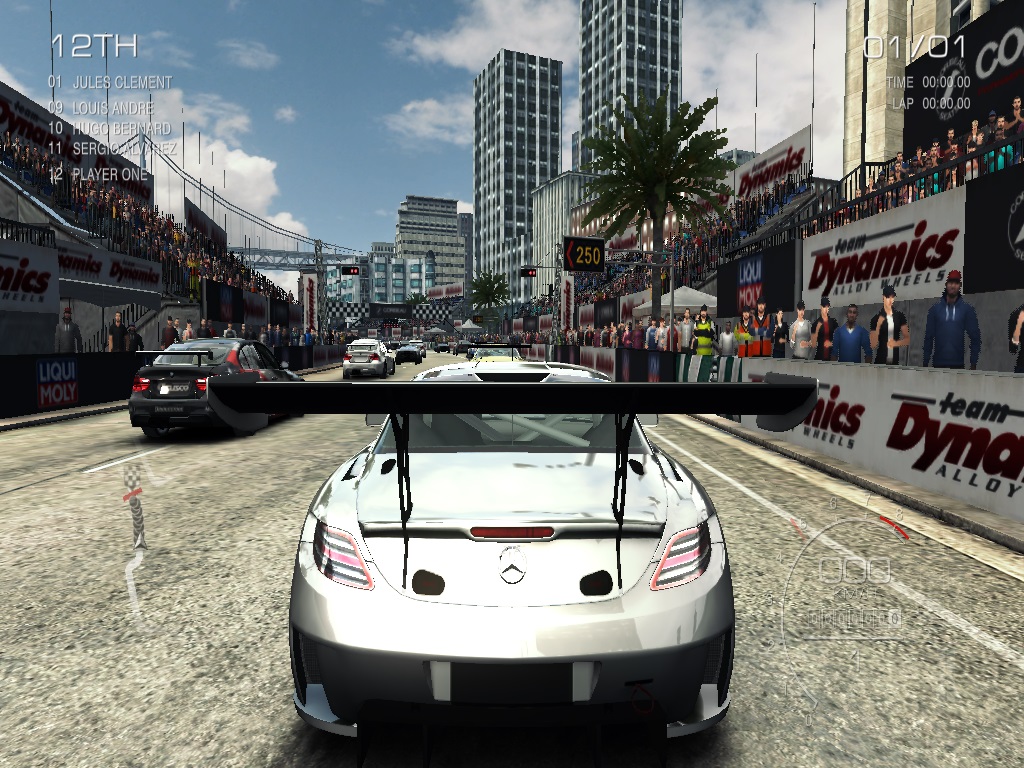
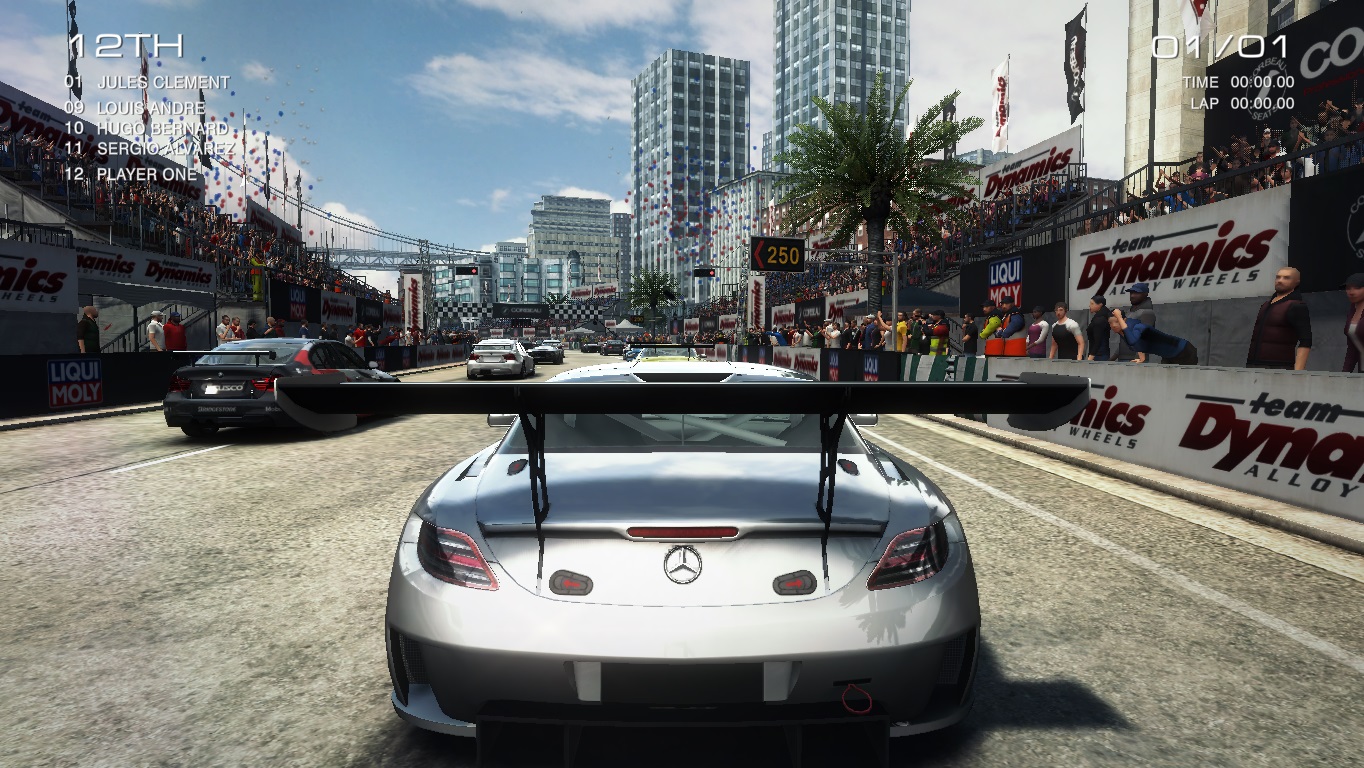
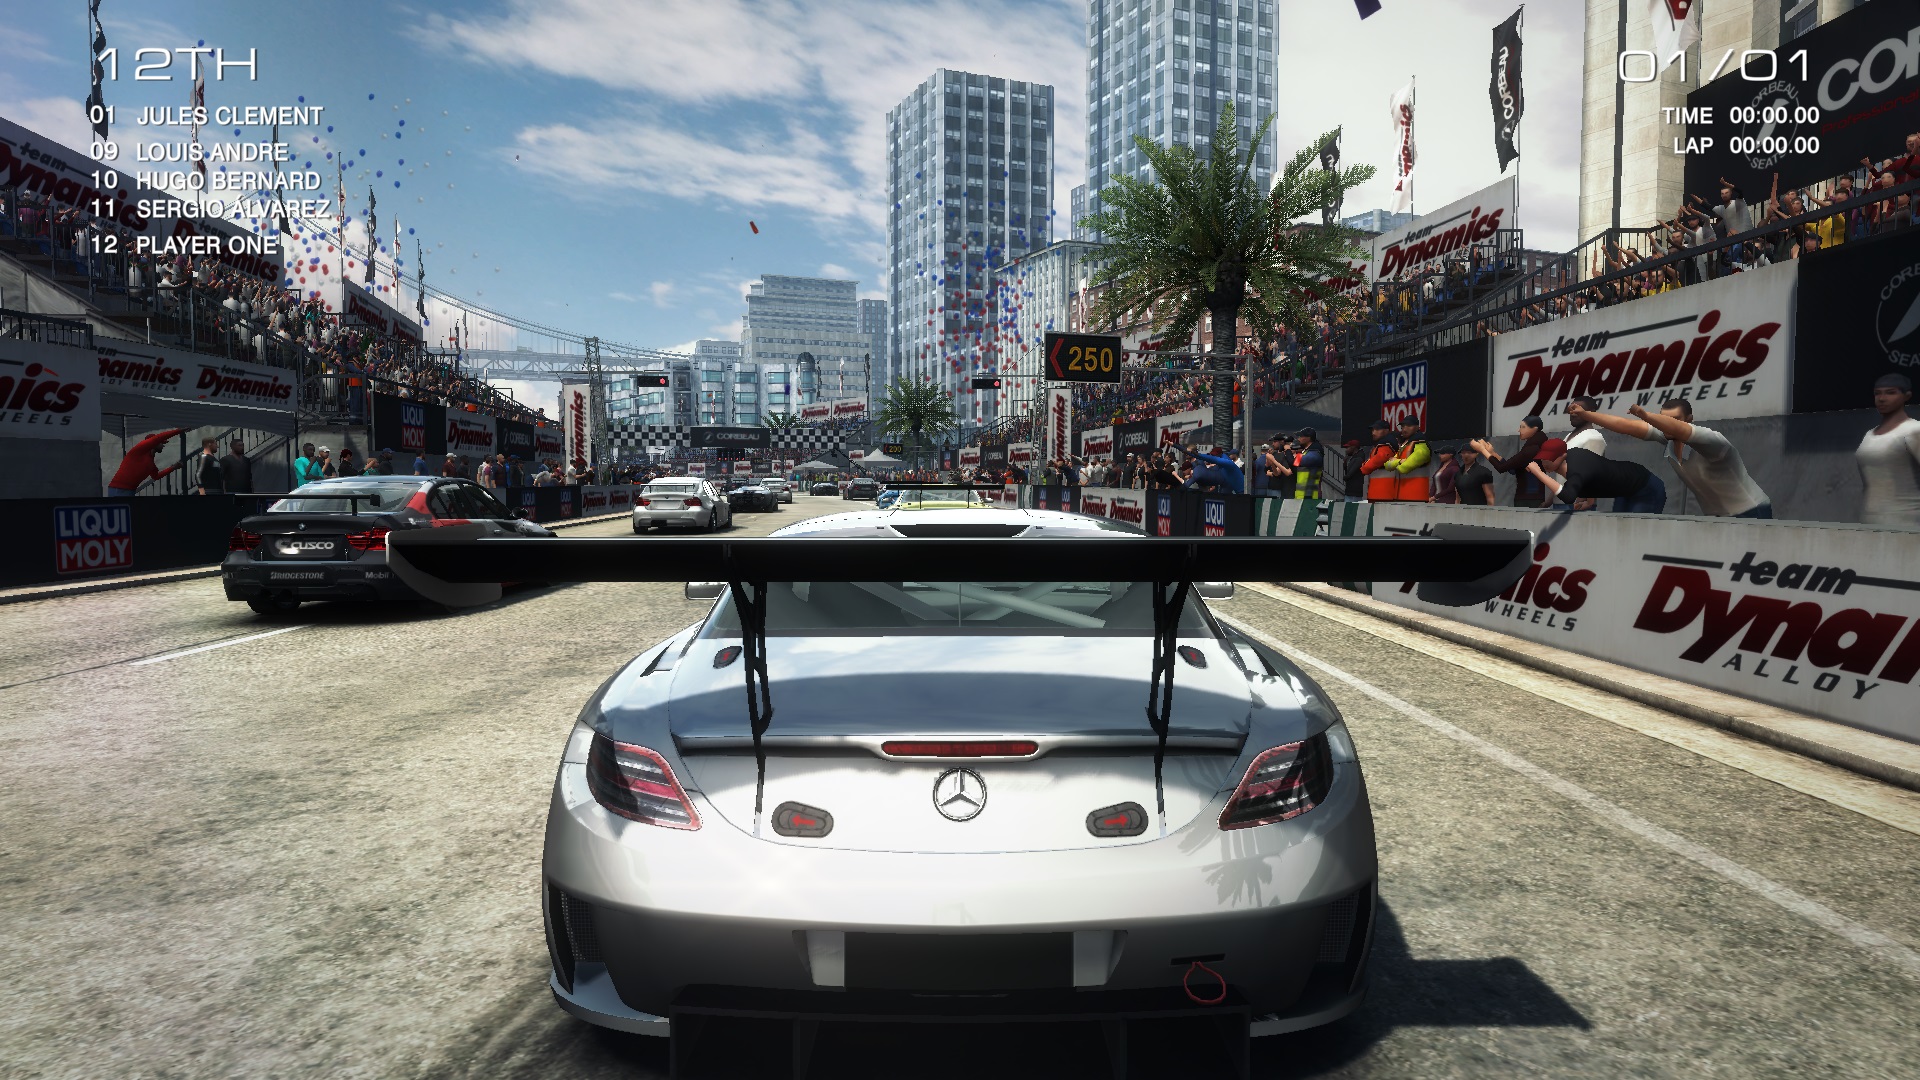
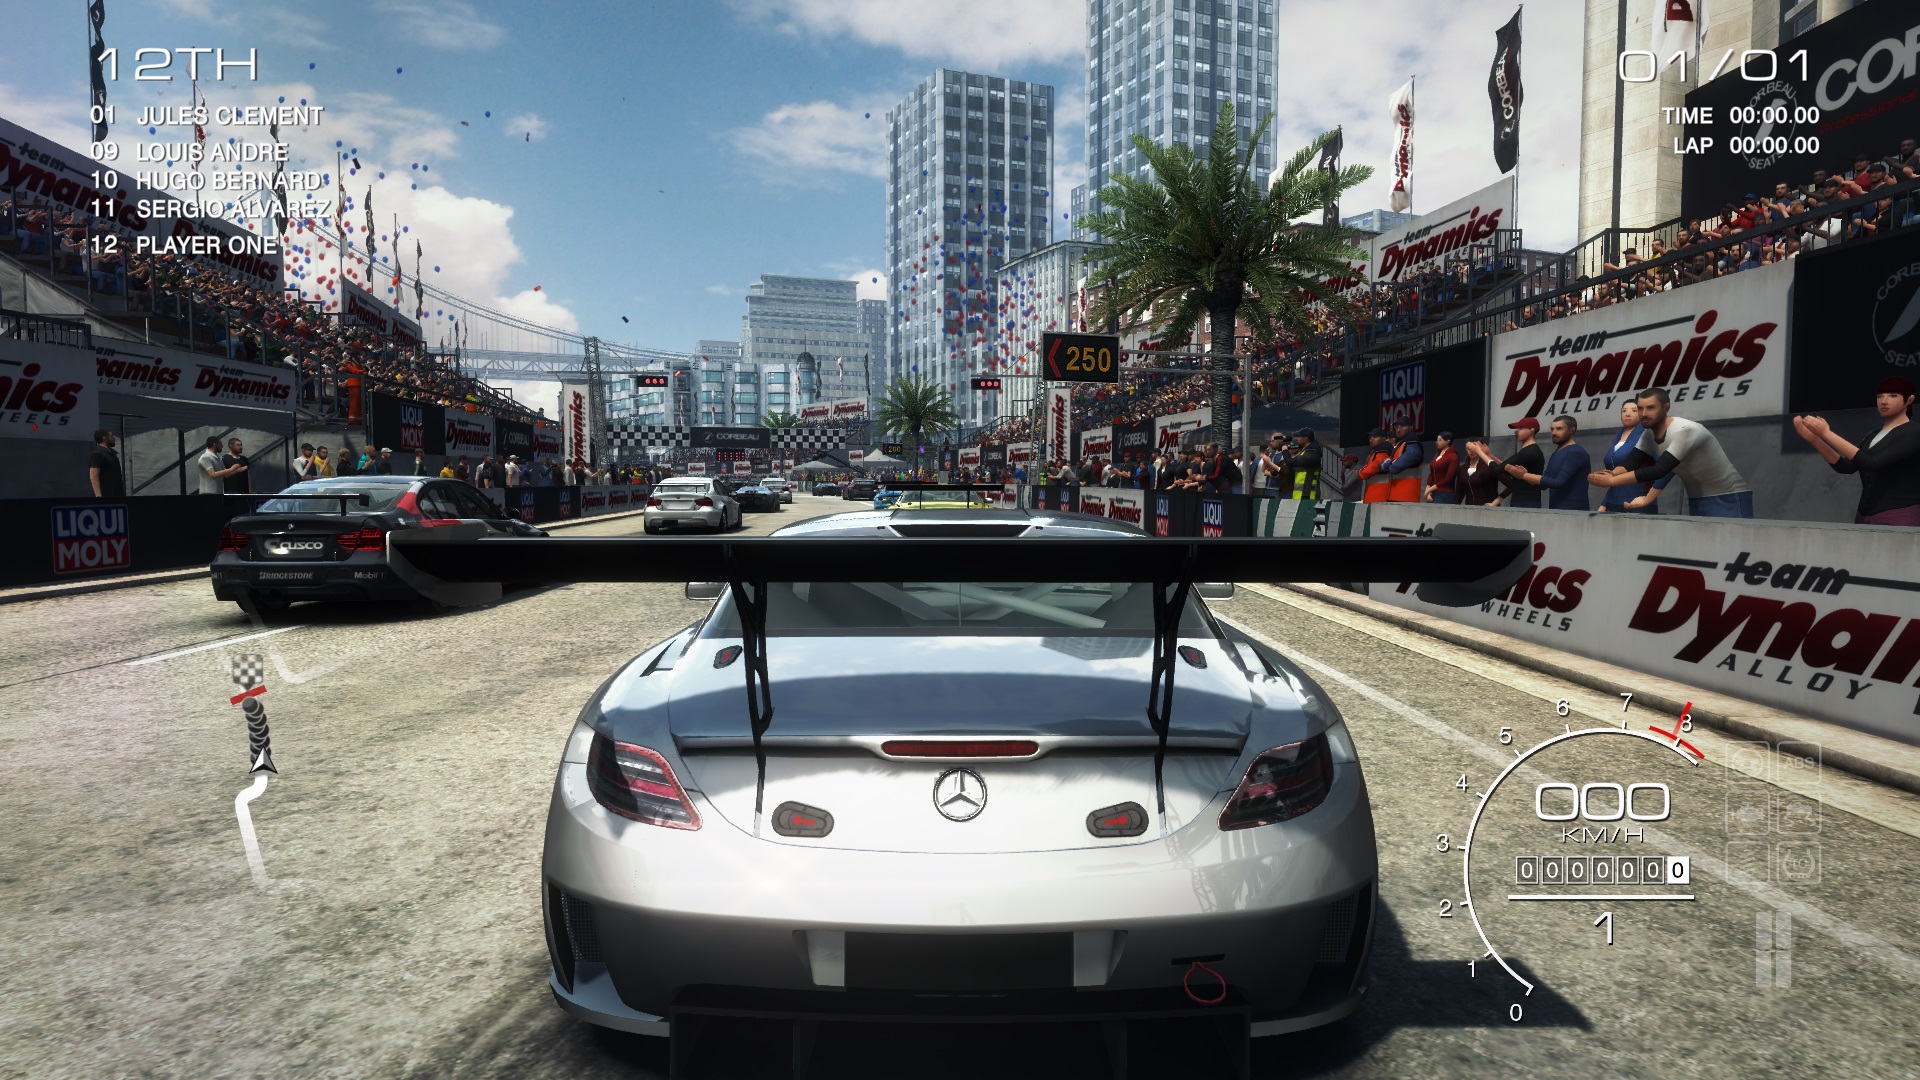
GRID Autosport is based on Codemasters' own EGO engine (now in version 3), which has seen many improvements and optimizations over the years.  Although there aren't really any obvious differences between the new game and the previous generation at first glance (GRID 2 had very similar hardware requirements as well), the overall visual appearance doesn't have to hide from the competition.

In addition to various textures as well as light and shadow effects, most of the different race cars compare well to those offered by the competing racing game Need for Speed Rivals from 2013. There's no question that there is still room for improvement in some areas, however.

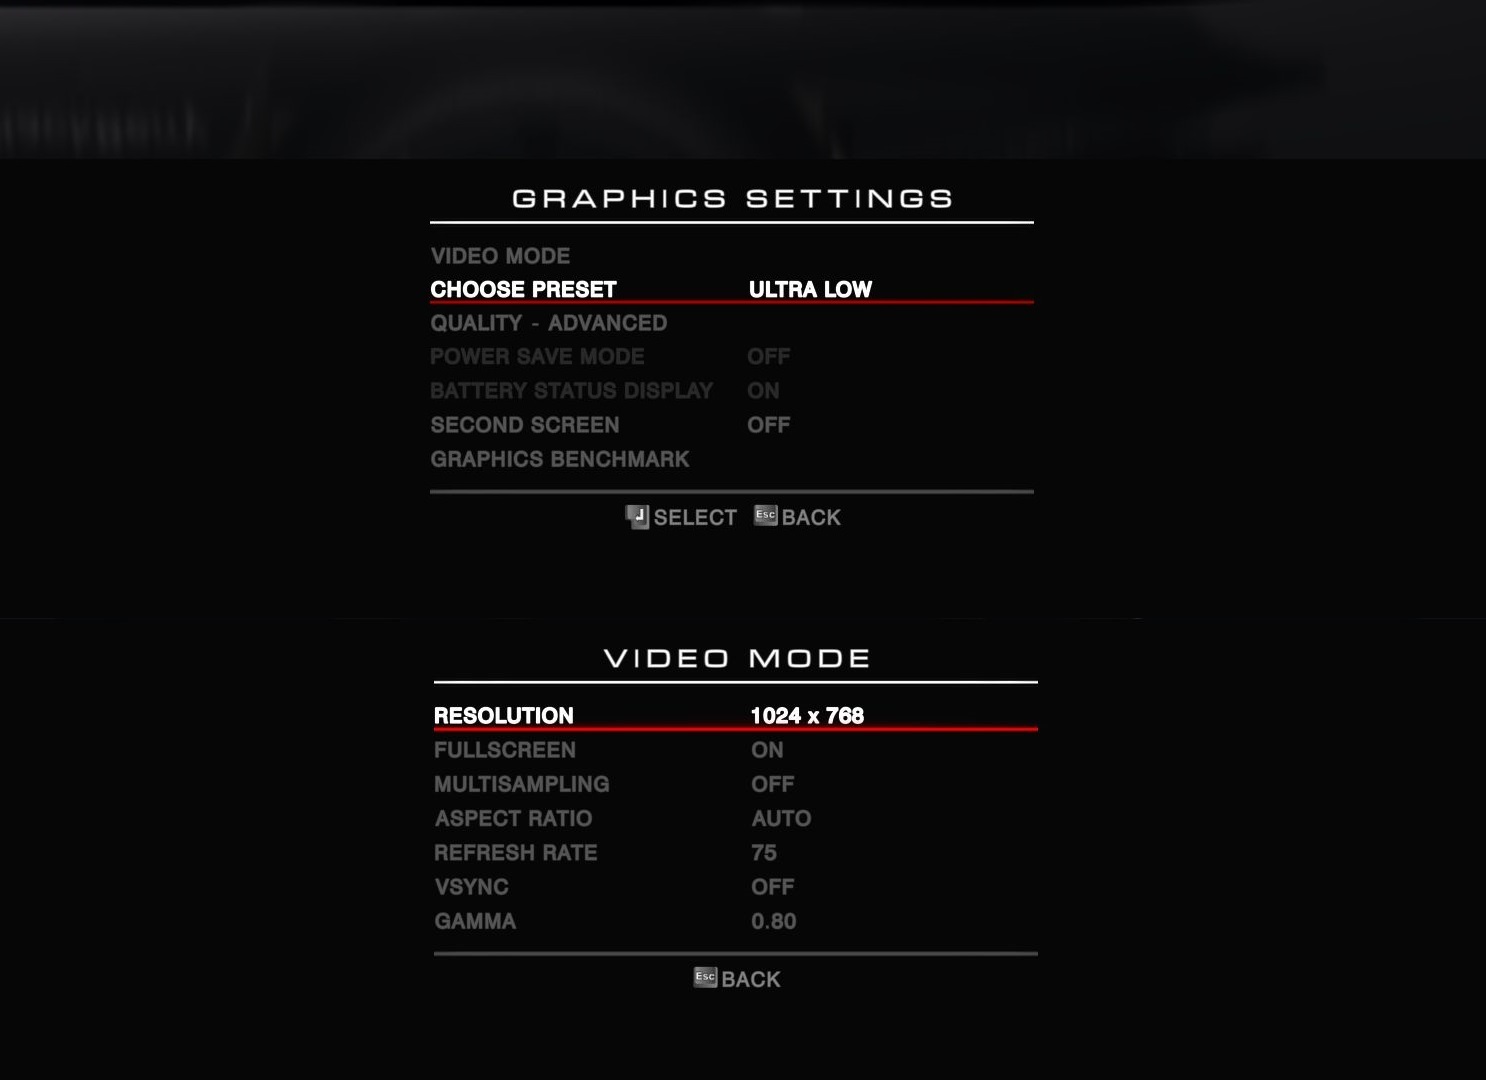
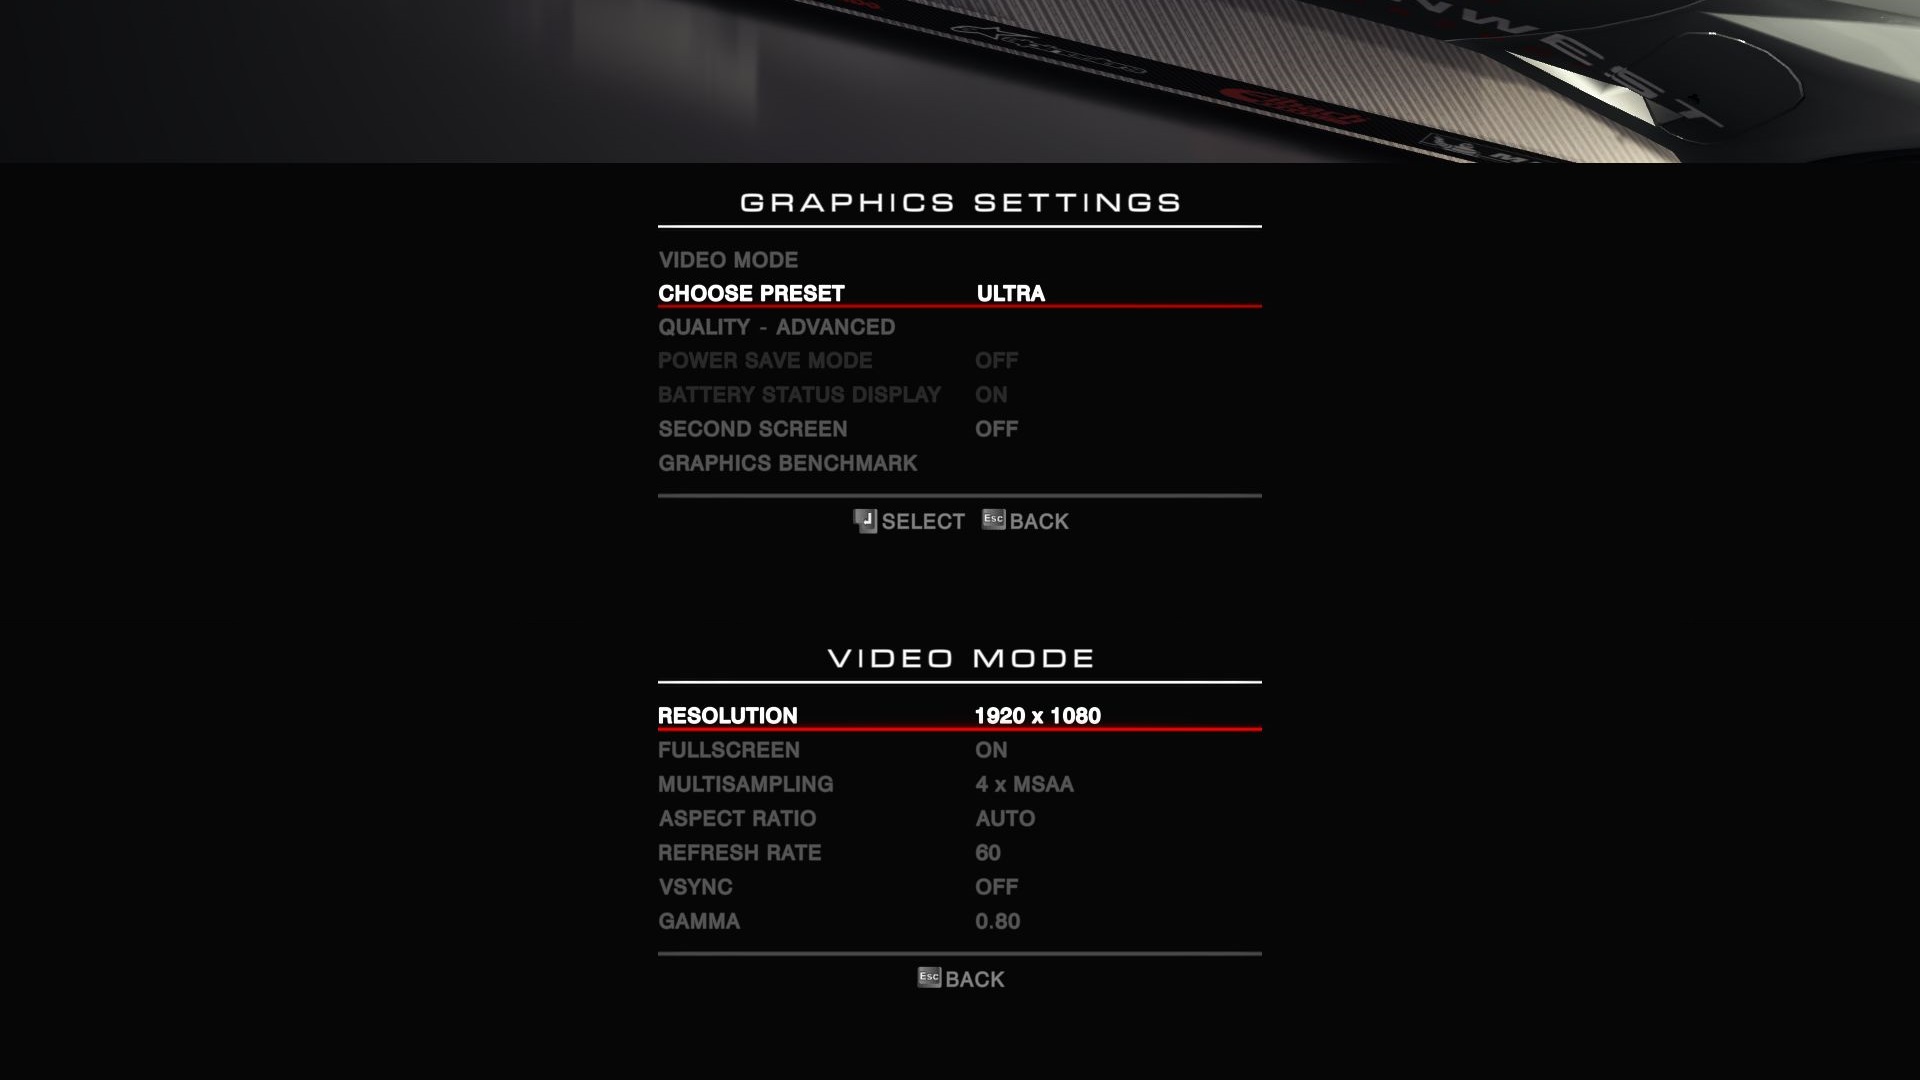
The standout feature and a major plus of GRID Autosport is the highly adjustable graphics menu. While Need for Speed Rivals only offers a handful of options, Codemasters' product has more than 20 of them, which allow the user to tailor the game to his or her liking. In addition, there are 5 presets (Ultra Low to Ultra) and several anti-aliasing options. Aside from CMAA and MSAA, GRID Autosport also supports (Q)CSAA and EQAA, although the latter two options are reserved for  Nvidia and AMD, respectively.

Great: since all graphics options can be adjusted on the fly, the user doesn't have to stop and restart the game after each and every adjustment. We don't really like the fact that the menus are nested within each other, however. Although we've seen this practice in the past, it makes operation a bit convoluted and not as smooth as it could be.

Aside from a few software crashes and freezes in some scenes, which we weren't able to reproduce, the technology seems up to par. AMD notebooks therefore shouldn't have start-up issues like we experienced with F1 2013.

Considering the game was released this year, the hardware requirements are actually pretty modest. Although the visual appearance of the game has undergone subtle improvements, Autosport runs smoother than GRID 2 with the settings on low. High settings do require a certain amount of power, but overall the graphics engine certainly isn't a resource hog.

A dual-core CPU and a middle-class GPU are enough for a decent race track experience. On the Intel side, a quad-core CPU only has advantages as long as the settings are on low (see the results for the GT 750M and the GTX 850M). Only with very potent GPUs the CPU performance can become a limiting factor.

Low Settings
Low Settings
Medium Settings
Medium Settings
High Settings
High Settings
Ultra Settings
Ultra Settings
Low Settings
Low Settings
Medium Settings
Medium Settings
High Settings
High Settings
Ultra Settings
Ultra Settings

Benchmark

Just like previous Codemasters products, GRID Autosports contains an integrated benchmark, which is accessible directly via the graphics menu. The AI then completes a lap at the Grand Prix in San Francisco in about 2 minutes and 30 seconds.

Since the benchmark sequence is not always identical, but varies during each run (placement, duration, etc.), the results are also not consistent. Multiple repeats of the benchmark test resulted in variations of up to 15 %. In some cases, a weaker GPU might thus place ahead of a more powerful one.

Results

Thanks to support from both AMD and Nvidia we were able to extend our inventory of graphics cards with a few current desktop models. The GeForce GTX 780 Ti managed a frame rate of 123 fps and easily outperforms all single-GPU notebooks with the settings on ultra. The most powerful mobile GPU provides similar performance to a middle-class desktop card: the GeForce GTX 880M, for example, reaches 77 fps on ultra and is thus quite comparable to the GeForce GTX 760 (73 fps), which sells for 200-300 Euro ($275-$410). All things considered, even a GeForce GTX 860M (doesn't matter if Kepler or Maxwell) can guarantee a smooth gaming experience.

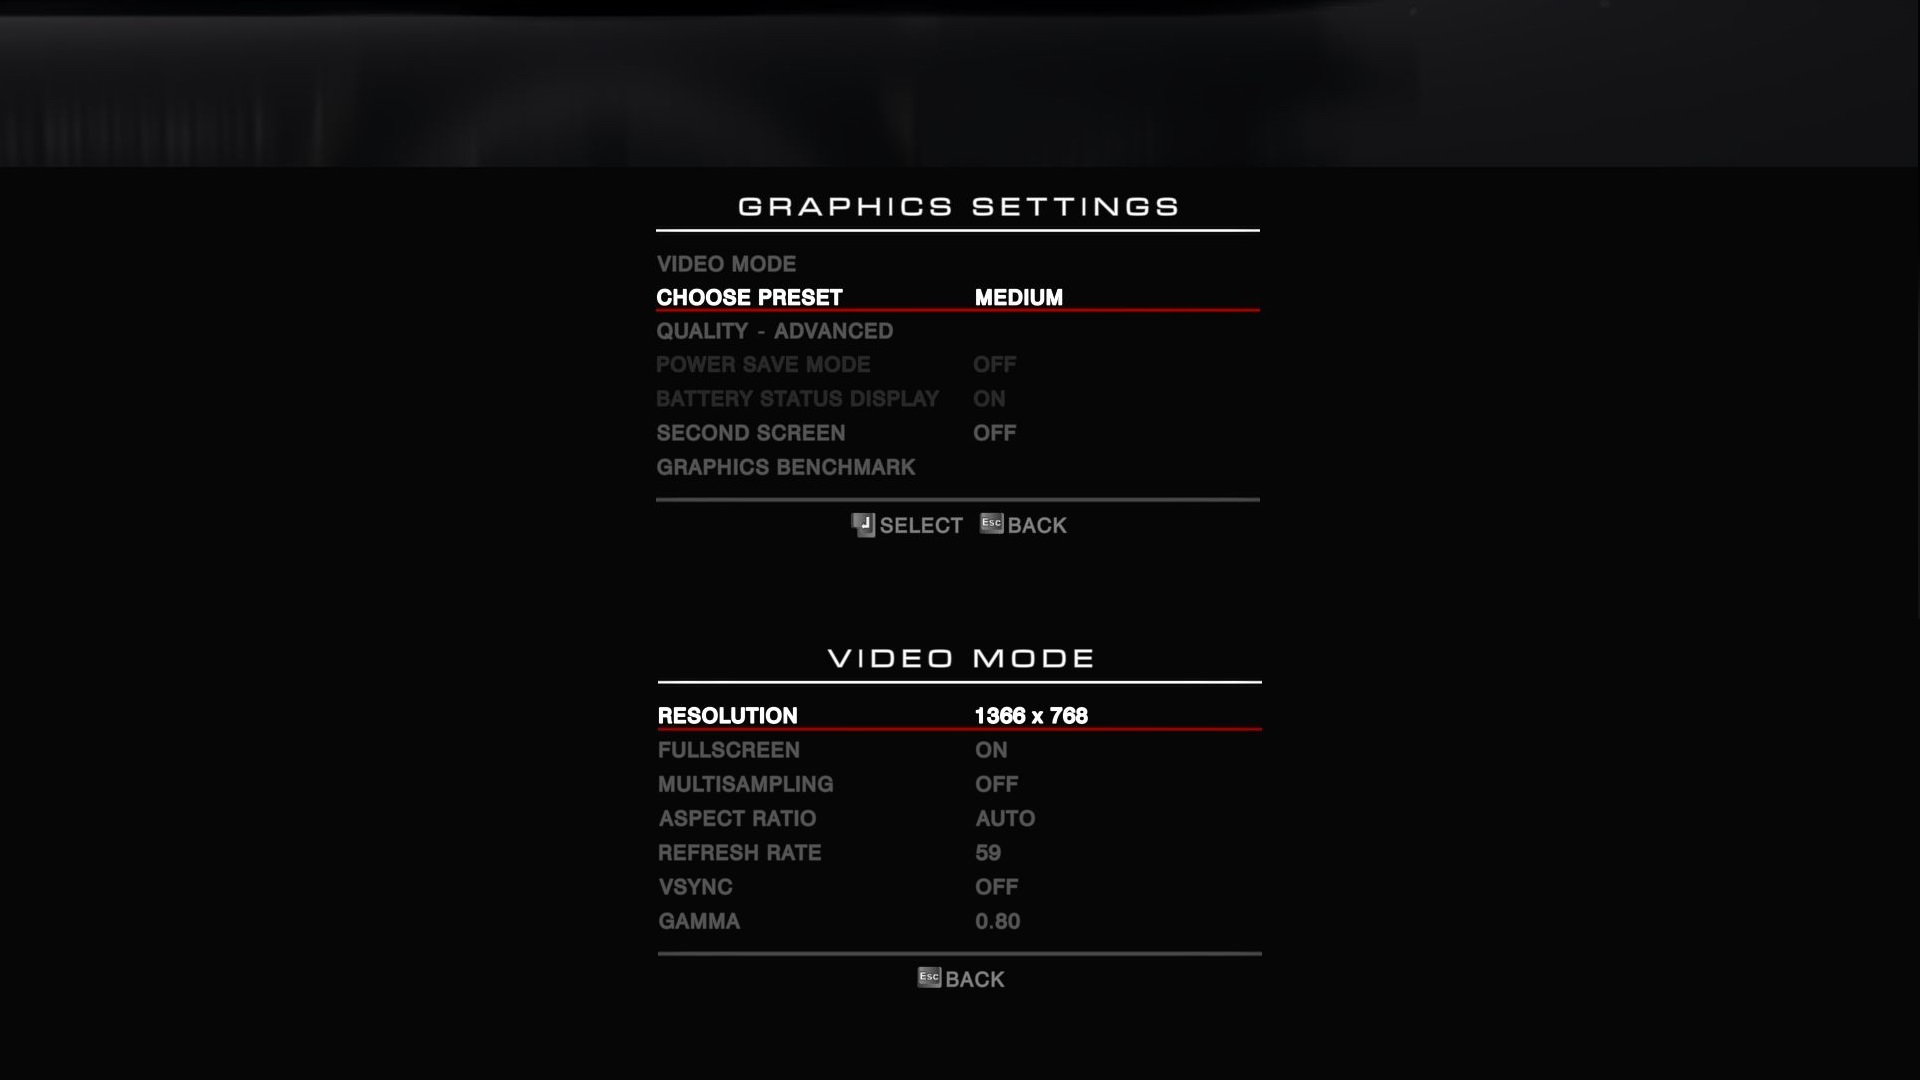
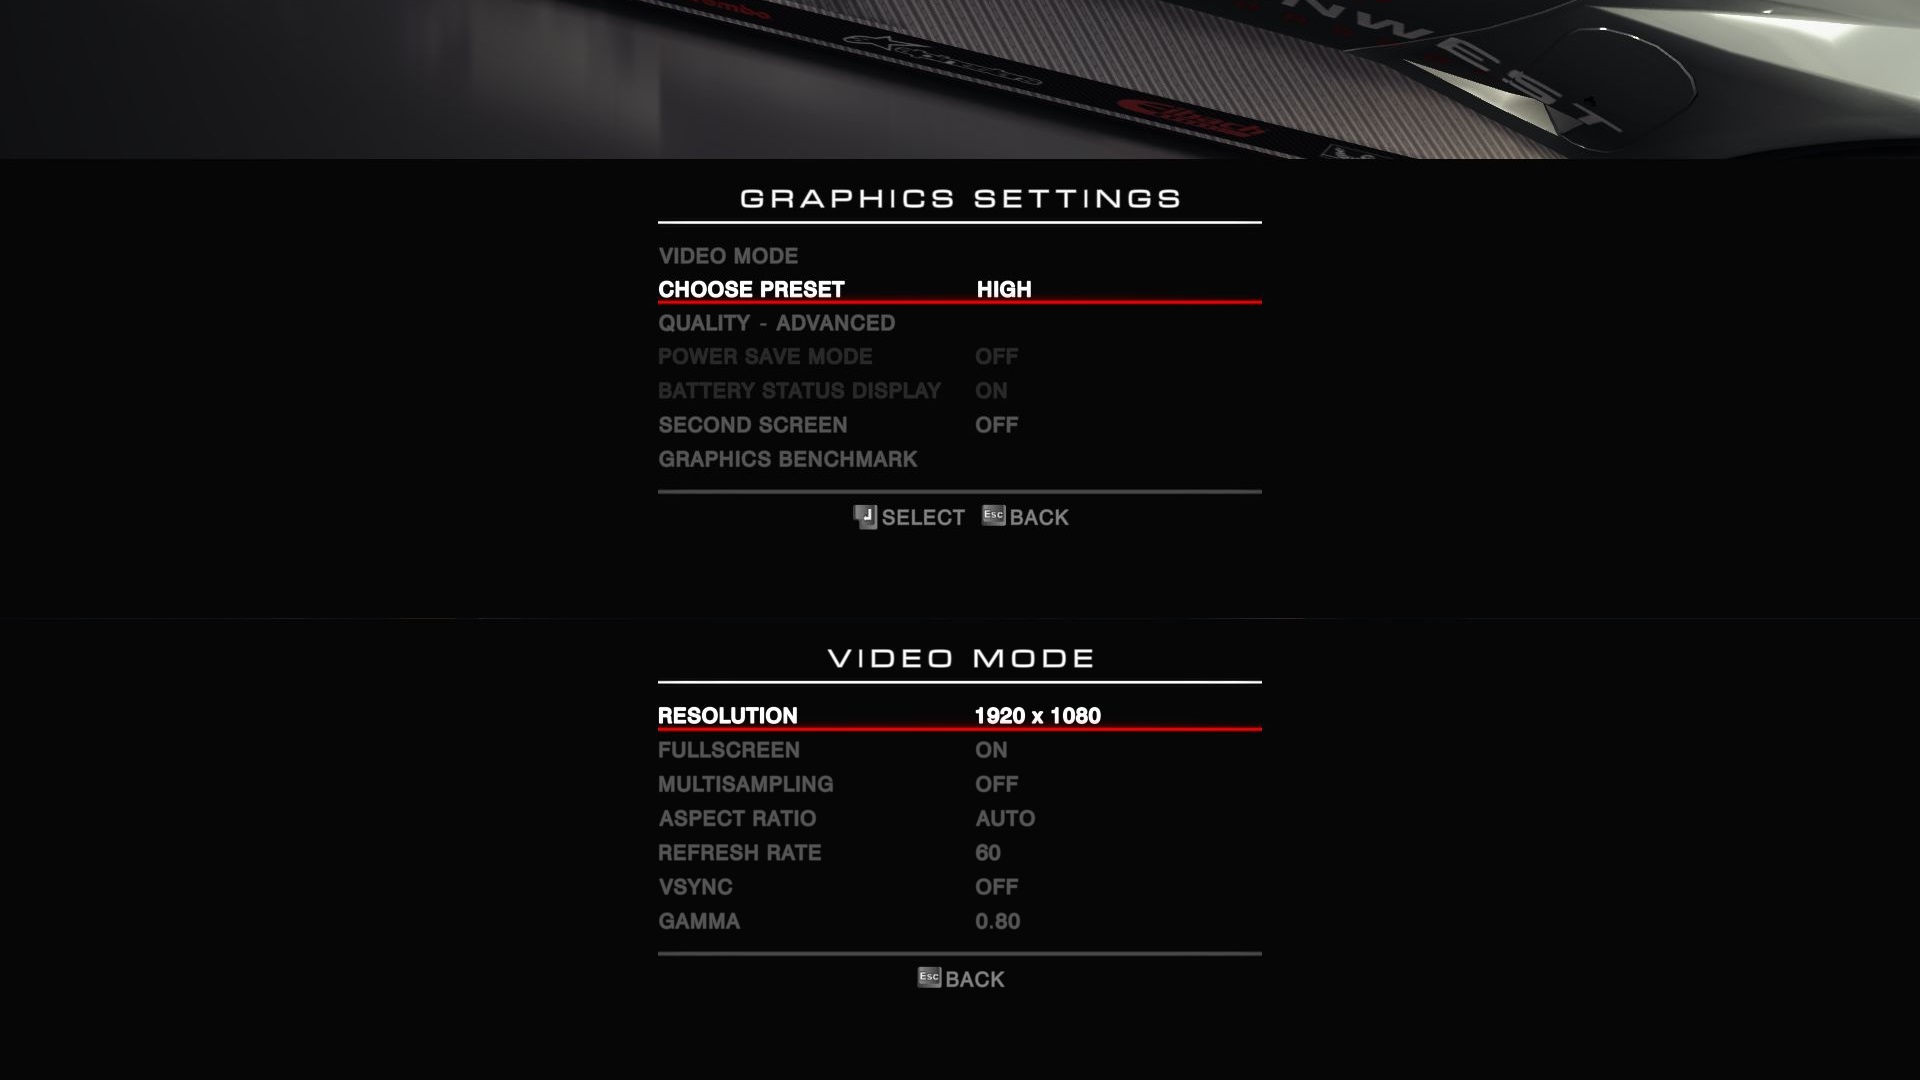
A typical allrounder-notebook is powerful enough to support a resolution of 1920 x 1080 pixels, provided that 4x MSAA is not checked. Even with the DDR3 version of the GeForce GT 750M, we still measured frame rates of just above 40 fps. With the normal preset and a resolution of 1366 x 768 pixels, low-end GPUs from the Intel HD Graphics 4600 on up are sufficient. Only users stuck with very old or weak GPUs might have to resort to the lowest settings.

Please note: at this time, the integrated benchmark is not able to record frame rates below 12.5 fps.

GRID: Autosport
    1920x1080 Ultra Preset AA:4x MS     1920x1080 High Preset     1366x768 Medium Preset     1024x768 Ultra Low Preset
GeForce GTX 780 Ti, 3770K
Desktop-PC
122.6 (89min) fps ∼82%
139.4 (104min) fps ∼69%
159.9 (119min) fps ∼69%
284.3 (213min) fps ∼66%
Radeon R9 290X, 2600K, Samsung SSD 840 Pro 256GB MZ7PD256HAFV-0Z000
Sapphire Tri-X R9 290X Desktop
92 (66min) fps ∼61%
118 (88min) fps ∼59%
129 (101min) fps ∼56%
253 (196min) fps ∼59%
Radeon R9 280X, 3770K
Desktop-PC
90.8 (73min) fps ∼61%
117.5 (92min) fps ∼59%
143.6 (109min) fps ∼62%
288.4 (212min) fps ∼67%
GeForce GTX 880M, 4700MQ
Schenker W504
76.8 (64min) fps ∼51%
114.9 (90min) fps ∼57%
139.6 (109min) fps ∼61%
226 (190min) fps ∼53%
GeForce GTX 760, 3770K
Desktop-PC
73.2 (60min) fps ∼49%
128.7 (107min) fps ∼64%
154.8 (124min) fps ∼67%
290.2 (222min) fps ∼68%
GeForce GTX 780M, 4700MQ
Schenker W503
70.9 (60min) fps ∼47%
108.1 (86min) fps ∼54%
127 (102min) fps ∼55%
197.1 (162min) fps ∼46%
GeForce GTX 870M, 4700MQ
Schenker W504
62.3 (53min) fps ∼42%
120 (91min) fps ∼60%
129.1 (103min) fps ∼56%
227.3 (189min) fps ∼53%
Radeon R9 M290X, 4700MQ
Schenker W504
62 (51min) fps ∼41%
95.7 (70min) fps ∼48%
112.6 (87min) fps ∼49%
211.5 (168min) fps ∼49%
GeForce GTX 750 Ti, 3770K
Desktop-PC
52.6 (42min) fps ∼35%
100.1 (78min) fps ∼50%
153.6 (117min) fps ∼67%
262.4 (200min) fps ∼61%
GeForce GTX 770M, 4700MQ
Schenker W503
46.5 (37min) fps ∼31%
92.6 (77min) fps ∼46%
130.3 (104min) fps ∼56%
199.6 (166min) fps ∼46%
GeForce GTX 860M, 4700MQ
Schenker W504
42.6 (35min) fps ∼28%
95.6 (77min) fps ∼48%
123.1 (98min) fps ∼53%
232.4 (183min) fps ∼54%
GeForce GTX 850M, 4340M
Schenker M504
36.1 (27min) fps ∼24%
73.4 (51min) fps ∼37%
109.8 (88min) fps ∼48%
175.5 (144min) fps ∼41%
GeForce GTX 765M, 4700MQ
Schenker W503
34.8 (29min) fps ∼23%
74.1 (59min) fps ∼37%
130.7 (99min) fps ∼57%
191.9 (156min) fps ∼45%
GeForce GT 750M, 4702MQ
Schenker M503
20.1 (16min) fps ∼13%
43 (31min) fps ∼21%
88 (73min) fps ∼38%
186.2 (149min) fps ∼43%
Radeon R7 512 Cores (Kaveri Desktop), A10-7850K, Samsung SSD 470 Series MZ-5PA256/EU
A10-7850K Asus A88-XM-PLUS
17.5 (13min) fps ∼12%
37 (30min) fps ∼18%
71 (60min) fps ∼31%
151 (116min) fps ∼35%
GeForce GT 640M, 2637M, Lite-On LMT-256M3M
Acer Aspire M3-581TG
16.2 (13min) fps ∼11%
32.8 (25min) fps ∼16%
68 (51min) fps ∼29%
120 (93min) fps ∼28%
GeForce GT 740M, 4200M
HP Envy 15-j011sg
14.4 (13min) fps ∼10%
30.7 (22min) fps ∼15%
64.4 (52min) fps ∼28%
141.4 (120min) fps ∼33%
Iris Pro Graphics 5200, 4750HQ, Intel SSD 525 Series SSDMCEAC180B3
SCHENKER S413
14.3 (13min) fps ∼10%
33.4 (27min) fps ∼17%
60 (49min) fps ∼26%
140 (112min) fps ∼33%
GeForce GT 720M, 4200M, WDC Scorpio Blue WD10JPVX-22JC3T0
MSI CX61-i572M
12.5 (0min) fps ∼8%
15.6 (0min) fps ∼8%
32.5 (0min) fps ∼14%
82.9 (0min) fps ∼19%
HD Graphics 4600, 4700MQ
Schenker W503
12.5 (12.5min) fps ∼8%
19.7 (16min) fps ∼10%
45.8 (36min) fps ∼20%
119.5 (97min) fps ∼28%

Review Systems

Four of our review notebooks are from Schenker Technologies:

  • W504 (Core i7-4700MQ, 8 GB DDR3, GeForce GTX 860M, GTX 870M, GTX 880M, Radeon R9 M290X)
  • W503 (Core i7-4700MQ, 8 GB DDR3, GeForce GTX 765M, GTX 770M, GTX 780M)
  • M504 (Core i5-4340M, 8 GB DDR3, GeForce GTX 850M)
  • M503 (Core i7-4702MQ, 8 GB DDR3, GeForce GT 750M)

All these systems run 64-bit Windows 7. A special thanks goes out to Micron for sending us a 480 GByte Crucial M500 SSD.

An additional review notebook was provided by Nvidia:

  • HP Envy 15-j011sg (Core i5-4200M, 12 GB DDR3, GeForce GT 740M)

We used the following GPU drivers: Nvidia 340.43 Beta, AMD 14.6 RC2 Beta, Intel 10.18.10.3652 Beta.

We've also included benchmarks from other notebooks, which might make use of different drivers.

Results

Show Restrictions
PosModel< PrevNext >GRID: Autosport
 GRID: Autosport (2014)
low
1024x768
Ultra Low Preset
med.
1366x768
Medium Preset
high
1920x1080
High Preset
ultra
1920x1080
Ultra Preset
4x MSAA
NVIDIA GeForce GTX 1080 SLI (Laptop)
166
136
NVIDIA GeForce GTX 1080 Mobile
161
131
NVIDIA GeForce GTX 980 SLI (Laptop)
342
191.3
155.2
142.9
NVIDIA GeForce GTX 1070 Mobile
324.8
159
117.55n2
100.75n2
NVIDIA GeForce GTX 980M SLI
429.8
230.7
181.8n2
145.85n2
NVIDIA GeForce GTX 980
297.4
154.3
100.3n4
80.1n4
NVIDIA GeForce GTX 980 (Laptop)
315.9n2
178.9n2
156n2
129.4n2
NVIDIA GeForce GTX 970M SLI
374.1
207.4
165.7
118.8
NVIDIA GeForce GTX 1060 (Desktop)
366
215
183
150
NVIDIA Quadro P4000
153.8
106.3
96.9
84.5
NVIDIA GeForce GTX 1060 Mobile
141
120
NVIDIA GeForce GTX 780 Ti
284.3
159.9
139.4
122.6
NVIDIA GeForce GTX 970
403.8
216.2
187.8
126.8
AMD Radeon R9 290X
253
129
118
92
NVIDIA GeForce GTX 980M
279.4
166.9n2
142n5
103n5
NVIDIA Quadro M5000M
368
190
155
106
AMD Radeon R9 280X
288.4
143.6
117.5
90.8
NVIDIA GeForce GTX 960
327.5
173.4
149.1
85.5
NVIDIA GeForce GTX 1050 Ti Mobile
116.8
87
PosModel< PrevNext >GRID: Autosport
low med. high ultra
NVIDIA GeForce GTX 970M
229n5
129.3n6
110.45n8
80.65n8
NVIDIA GeForce GTX 860M SLI
253.6
146.1
68
33.3
NVIDIA GeForce GTX 680
233
143
125
86
AMD Radeon R9 M295X
164.8
88.3
63
52.7
NVIDIA Quadro M3000M
380
186
151
81
NVIDIA GeForce GTX 1050 Mobile
181.2n2
117n2
104.15n2
74.8n2
AMD FirePro W7170M
232
116
99
67
AMD Radeon R7 370
147.1
100.2
91.3
75
NVIDIA GeForce GTX 880M
210.75n2
129.7n2
113.4n3
70n3
NVIDIA GeForce GTX 950
312.3
151.7
132.4
74.4
NVIDIA GeForce GTX 760
290.2
154.8
128.7
73.2
NVIDIA GeForce GTX 780M
197.1
127
108.1
70.9
NVIDIA Quadro K5100M
319.7
176.3
119.4
58.8
NVIDIA GeForce GTX 965M
202.7n3
120.4n3
99.9n3
59.2n3
NVIDIA GeForce GTX 870M
227.3
129.1
120
62.3
AMD Radeon R9 M290X
211.5
112.6
95.7
62
AMD FirePro M6100
283
135
94
48
NVIDIA GeForce GTX 960M
217.3n7
109.7n7
83.6n7
49.85n8
NVIDIA GeForce GTX 750 Ti
262.4
153.6
100.1
52.6
NVIDIA GeForce GTX 770M
199.6
130.3
92.6
46.5
PosModel< PrevNext >GRID: Autosport
low med. high ultra
NVIDIA GeForce GTX 860M
176.4n4
100.2n7
74.7n9
43.6n9
NVIDIA GeForce GTX 950M
165.55n6
104.7n7
68.1n7
34n7
NVIDIA GeForce GTX 850M
175.5n3
99.3n5
68.3n5
34.7n5
NVIDIA Quadro M1000M
248
143
82
43
AMD Radeon R9 M280X
107
52
41
26.9
NVIDIA GeForce 945M
198.7
118.8
68.5
33.2
NVIDIA GeForce GTX 765M
191.9
130.7
74.1
34.8
NVIDIA Quadro K3100M
326.4
145.2
69.7
35.1
AMD Radeon R9 M370X
207.7
90.6
48.6
26.8
AMD Radeon R9 M275
81.2
42.9
31.1
18.7
AMD FirePro M5100
213
101
44
26
NVIDIA Quadro K2100M
202.5n2
88.5n2
41.5n2
21.5n2
AMD Radeon R9 M265X
69.35n2
40.2n2
23.65n2
AMD FirePro W4100
261
71
34
19
NVIDIA GeForce GT 750M
186.2
88
43
20.1
NVIDIA GeForce 940MX
137
70.9
27.15n2
16.9n2
NVIDIA Quadro K1100M
209.5n2
75.5n2
35.5n2
17n2
NVIDIA GeForce 940M
164.2
62.2n3
30.4n3
16.6n2
AMD Radeon R9 M375
91
47.4
30.1
20.6
NVIDIA Quadro K620M
151
76
32
18
PosModel< PrevNext >GRID: Autosport
low med. high ultra
NVIDIA GeForce 840M
117.7n4
59.5n4
29.75n4
15.7n3
AMD Radeon R7 M275DX
107.6
52.9
35
22.4
AMD Radeon R7 512 Cores (Kaveri Desktop)
151
71
37
17.5
Intel Iris Pro Graphics 5200
140
60
33.4
14.3
NVIDIA GeForce GT 740M
141.4
64.4
30.7
14.4
NVIDIA GeForce 930M
142.8n2
75.8n3
36.6n3
16.6n3
AMD Radeon 530
175.4
62.2
NVIDIA GeForce 830M
122.15n2
60.35n2
28.9n2
14.75n2
NVIDIA GeForce 920MX
176.6
68.4
30.7
14.9
AMD Radeon R7 M260X
128.3
50.7
26.6
NVIDIA GeForce GT 730M
155.1
53.8
25.2
13
AMD Radeon R7 M270
135.8n2
53.2n2
25.05n2
14.25n2
AMD Radeon R7 M265
55.8
24.3
21.5
14
AMD Radeon R7 (Bristol Ridge)
91.3
40.6
21.6
NVIDIA GeForce GT 640M
120
68
32.8
16.2
AMD Radeon R7 (Kaveri)
71.2
32
18.8
AMD Radeon R8 M365DX
69.5
36
23
14.8
AMD Radeon R7 M460
125.3
56.6
26
13.6
AMD Radeon R7 M360
104.95n2
48.05n2
26.7n2
13.75n2
NVIDIA GeForce 920M
122.55n4
53.9n4
25.96n4
12.5n3
PosModel< PrevNext >GRID: Autosport
low med. high ultra
AMD Radeon R7 M260
99.7n2
37.6n2
22.98
AMD Radeon R7 M340
138.5
56.3
27
13.8
AMD Radeon R6 M340DX
89.5
44.6
20.7
12.5
Intel HD Graphics 530
156.8n2
52.35n2
22.8n2
12.55n2
AMD Radeon R5 (Bristol Ridge)
70.1
27.3
15.5
12.5
Intel UHD Graphics 620
108n3
42n3
23n3
12.5n3
Intel HD Graphics 620
43.85n4
23.2n4
AMD Radeon R6 (Carrizo)
81
32.2
17
12.5
AMD Radeon R6 (Kaveri)
70.1
30.66
16.99
AMD FirePro W2100
187
62
23
14
Intel HD Graphics 5600
101.1
44.9
22.9
12.5
AMD Radeon HD 8670M
106.1
43.4
20
12.5
AMD Radeon R6 M255DX
66.2
26.9
19.2
AMD Radeon HD 8650G
100
43
20.5
12.7
NVIDIA GeForce GT 630M
141
47
19.4
12.5
AMD Radeon R5 M335
132
46.1
21.6
12.6
AMD Radeon R5 M330
104.5
38.9
AMD Radeon R5 M255
106.1
47.5
22.04
AMD Radeon RX Vega 3
145.7
50.6
24.1
13.7
NVIDIA GeForce 820M
111.8
43.4
20
12.5
PosModel< PrevNext >GRID: Autosport
low med. high ultra
Intel HD Graphics 520
105.1n11
41n11
21.1n10
12.5n4
Intel Iris Graphics 6100
93.5n2
35.25n2
21.3n2
13.45n2
NVIDIA GeForce GT 720M
82.9
32.5
15.6
12.5
AMD Radeon R5 M240
85.45n2
38.35n2
21.8
AMD Radeon R5 M230
106.95n2
40.5n2
19.1
7.3
AMD Radeon R5 (Stoney Ridge)
65.1
29.7
Intel HD Graphics 6000
94
32
22
13
Intel Iris Graphics 5100
94
34.6
21
12.5
Intel HD Graphics 4600
89.65n4
32.3n4
17.2n3
12.5n3
Intel HD Graphics 5500
68.95n18
25.35n18
14.6n16
12.5n13
Intel UHD Graphics 615
97.4
34.4
24.7
Intel HD Graphics 615
74.9
24.6
AMD Radeon R5 (Kaveri)
60.1
24.4
AMD Radeon HD 7660G
82
39
20
12.5
Intel HD Graphics 5000
85.7
30.2
14.9
12.5
AMD Radeon HD 8550G
93
39
17.1
Intel HD Graphics 515
86.5
26.3
14.9
12.5
Intel HD Graphics 610
106
32.7
Intel HD Graphics 4400
65.7n6
23.26n6
13.5n4
12.5n3
AMD Radeon HD 8610G
62.8
21.4
12.6
PosModel< PrevNext >GRID: Autosport
low med. high ultra
Intel HD Graphics 510
135.5
32.8
Intel UHD Graphics 605
58.5
16.5
12.5
Intel HD Graphics 505
51.5
19
Intel HD Graphics 5300
48.6n3
16.2n3
12.5n2
12.5
Intel HD Graphics 4000
83
25
14
AMD Radeon R4 (Stoney Ridge)
57
24.5
AMD Radeon R5 (Beema/Carrizo-L)
58.6
19.8
9.6
4.8
AMD Radeon R4 (Beema)
54.65n2
20.9n2
AMD Radeon R3 (Mullins/Beema)
55.5
22.6
12.5
AMD Radeon R2 (Stoney Ridge)
46
16.9
Intel HD Graphics (Broadwell)
57.6
22.6
Intel HD Graphics 4200
57.5
18.9
AMD Radeon HD 8450G
58
28
16.3
12.5
AMD Radeon HD 8400
68
22
12.6
AMD Radeon HD 8350G
57
23
13.3
12.5
AMD Radeon HD 8330
58
20.5
12.5
Intel UHD Graphics 600
66.8
18
12.5
Intel HD Graphics 500
43.8
19.1
Intel HD Graphics 405 (Braswell)
50.5
15
Intel HD Graphics (Braswell)
23
12.5
PosModel< PrevNext >GRID: Autosport
low med. high ultra
Intel HD Graphics 400 (Braswell)
28.9
12.5
Intel HD Graphics (Haswell)
58.2
19.6
AMD Radeon R2 (Mullins/Beema/Carrizo-L)
34.2n2
23.5
Intel HD Graphics (Cherry Trail)
24.65n2
13n2
Intel HD Graphics 3000
66.25n2
22.5n2
12.85n2
12.5
AMD Radeon HD 8210
12.85n2
Intel HD Graphics (Bay Trail)
36.7n2
12.5n2
(-) * Smaller values are better. / n123 Number of benchmarks for this median value / * Approximate position


Legend
5Stutters – This game is very likely to stutter and have poor frame rates. Based on all known benchmarks using the specified graphical settings, average frame rates are expected to fall below 25fps
May Stutter – This graphics card has not been explicitly tested on this game. Based on interpolated information from surrounding graphics cards of similar performance levels, stutters and poor frame rates are expected.
30Fluent – Based on all known benchmarks using the specified graphical settings, this game should run at or above 25fps
40Fluent – Based on all known benchmarks using the specified graphical settings, this game should run at or above 35fps
60Fluent – Based on all known benchmarks using the specified graphical settings, this game should run at or above 58fps
May Run Fluently – This graphics card has not been explicitly tested on this game. Based on interpolated information from surrounding graphics cards of similar performance levels, fluent frame rates are expected.
?Uncertain – This graphics card experienced unexpected performance issues during testing for this game. A slower card may be able to achieve better and more consistent frame rates than this particular GPU running the same benchmark scene.
Uncertain – This graphics card has not been explicitly tested on this game and no reliable interpolation can be made based on the performances of surrounding cards of the same class or family.
The value in the fields displays the average frame rate of all values in the database. Move your cursor over the value to see individual results.
Read all 2 comments / answer
static version load dynamic
Loading Comments
Comment on this article
Please share our article, every link counts!
Florian Glaser, 2014-07- 6 (Update: 2021-05-18)