Dell XPS 15 9550 (i7, 512GB, UHD) InfinityEdge Notebook Review

For the original German review, see here.
After the review of the entry-level version, we now have a look at the high-end configuration with UHD display (touch), Skylake Core i7, Samsung NVMe-SSD (512 GB) and 84-Wh battery. The review took quite a while; there were always delays due to bug fixes, new BIOS versions and drivers (Dell PremierColor, Intel HD Graphics). This is annoying, not so much for us as reviewers, but more for buyers or potential buyers, respectively. They will have to ask why such a desired premium notebook still suffers from so many bugs after the launch. They are fixed hectically one at a time, which is not very reassuring for the user.
What happened to Dell's quality control or did the manufacturer think that buyers of the advertised "High Performance Notebook" XPS 15 will just live with battery throttling to 1.6 GHz and a faulty Turbo control? You want to utilize the full performance of the processor when you pay from 1,600 (~$1756) to more than 2,000 Euros (~$2195) for a notebook. If the device cannot cool a 45-Watt processor besides a GTX 960M, then the manufacturer will just have to waive the concept of such a thin laptop.
The biggest issues of the i5/FHD/hybrid model were / are:
Performance
- i5 CPU cannot be fully utilized
- massive throttling when you stress CPU and GPU
- battery runtimes below expectations (54 Wh)
Display
- Mediocre color accuracy ex-works, but easy to calibrate
- PWM flickering at low brightness levels (FHD)
How does the more expensive i7/SSD/UHD model perform? Will potential buyers face the same bugs or did Dell's BIOS updates help and how is the quality of the 4K panel?
This is a review update of the XPS 15 i5/FHD, so we won't cover identical components in this article. More details about the build quality, input devices, connectivity and speakers are available in the review of the entry-level XPS 15.
Changelog
12/23/15 Dell PremierColor / BIOS recall 1.1.14
01/04/16 BIOS 1.1.15 for customers
01/07/16 Official – BIOS 1.1.15 and new IGP driver
BIOS Update 1.1.14/1.1.13

Our two versions of the XPS 15 were shipped with the BIOS revision 1.1.05. Dell will make version 1.1.14 available for its customers at the end of December; it is supposed to implement the following fixes: Improvements of the battery runtime with NVMe configurations (devSleep bug).
Update 12/23/15
We found out that BIOS 1.1.14 does not improve the battery runtimes in our review. Now, Dell recalls the – currently unreleased – 1.1.14 and asks reviewers to use the previous version (1.1.13) instead. Note: 1.1.13 is currently not released either. Dell is trying to launch a version for customers as quickly as possible:
We will work toward solving the issues we are seeing, and we will follow-up once we have line of sight to a permanent fix to re-enable the low-power C-states that gives back the hour+ battery life currently missing from light load work scenarios for XPS 15. And of course, we’re working on this with an eye for public distribution ASAP, but I’ll get it to you early whenever possible. Thank you for your patience!
Update 01/04/16
BIOS 1.1.15 is available for customers since January 3rd. The easiest way to get is is via the Device Manager (Firmware). The U.S. support site of the XPS 15 still only shows 01.00.07 (November 13th 2015). We do not have the review units here anymore, so we can just repeat reports we got from customers: The Turbo throttling (speed capping issue) in no problem for the i7 anymore. Processor SST and TPM are still not available. The SSD benchmarks like CrystalDiskMark remain unchanged according to users; one user measured 1718/936 MB/s (read/write) with CDM 5.1. Those results are not comparable with out test, because we always use the older version CDM 3.0 to ensure comparability between our review units.
Update 01/07/16
The new XPS 15 BIOS (version 1.1.15) besides a new WLAN as well as IPG driver is now available for download on Dell.com/support.
A new XPS 15 BIOS (version 1.1.15) has been created that fixes previous stability issues and restores power savings for NVMe drives when workload conditions are low to allow for low-power-level states. This BIOS will make a notable difference in battery life for light to moderate workload battery testing. In addition, there are two new drivers that are important to load for best performance and stability with XPS 15: a new wireless driver and a new Intel graphics driver (https://dell.app.box.com/xps15-updates).
Questions from our Readers (will be added)
- The BIOS screenshots do not show it – TPM yes/no? – No, there is no TPM module
Case
The display frame of the UHD touch version differs a bit from the matte FHD version. While the FHD TFT has a 5 mm thin plastic bezel with a surrounding plastic ring, the surface of the touch panel extends to the surrounding plastic ring. It is once again not a rubber lip, but plastic, which sits on the base unit when the lid is closed.
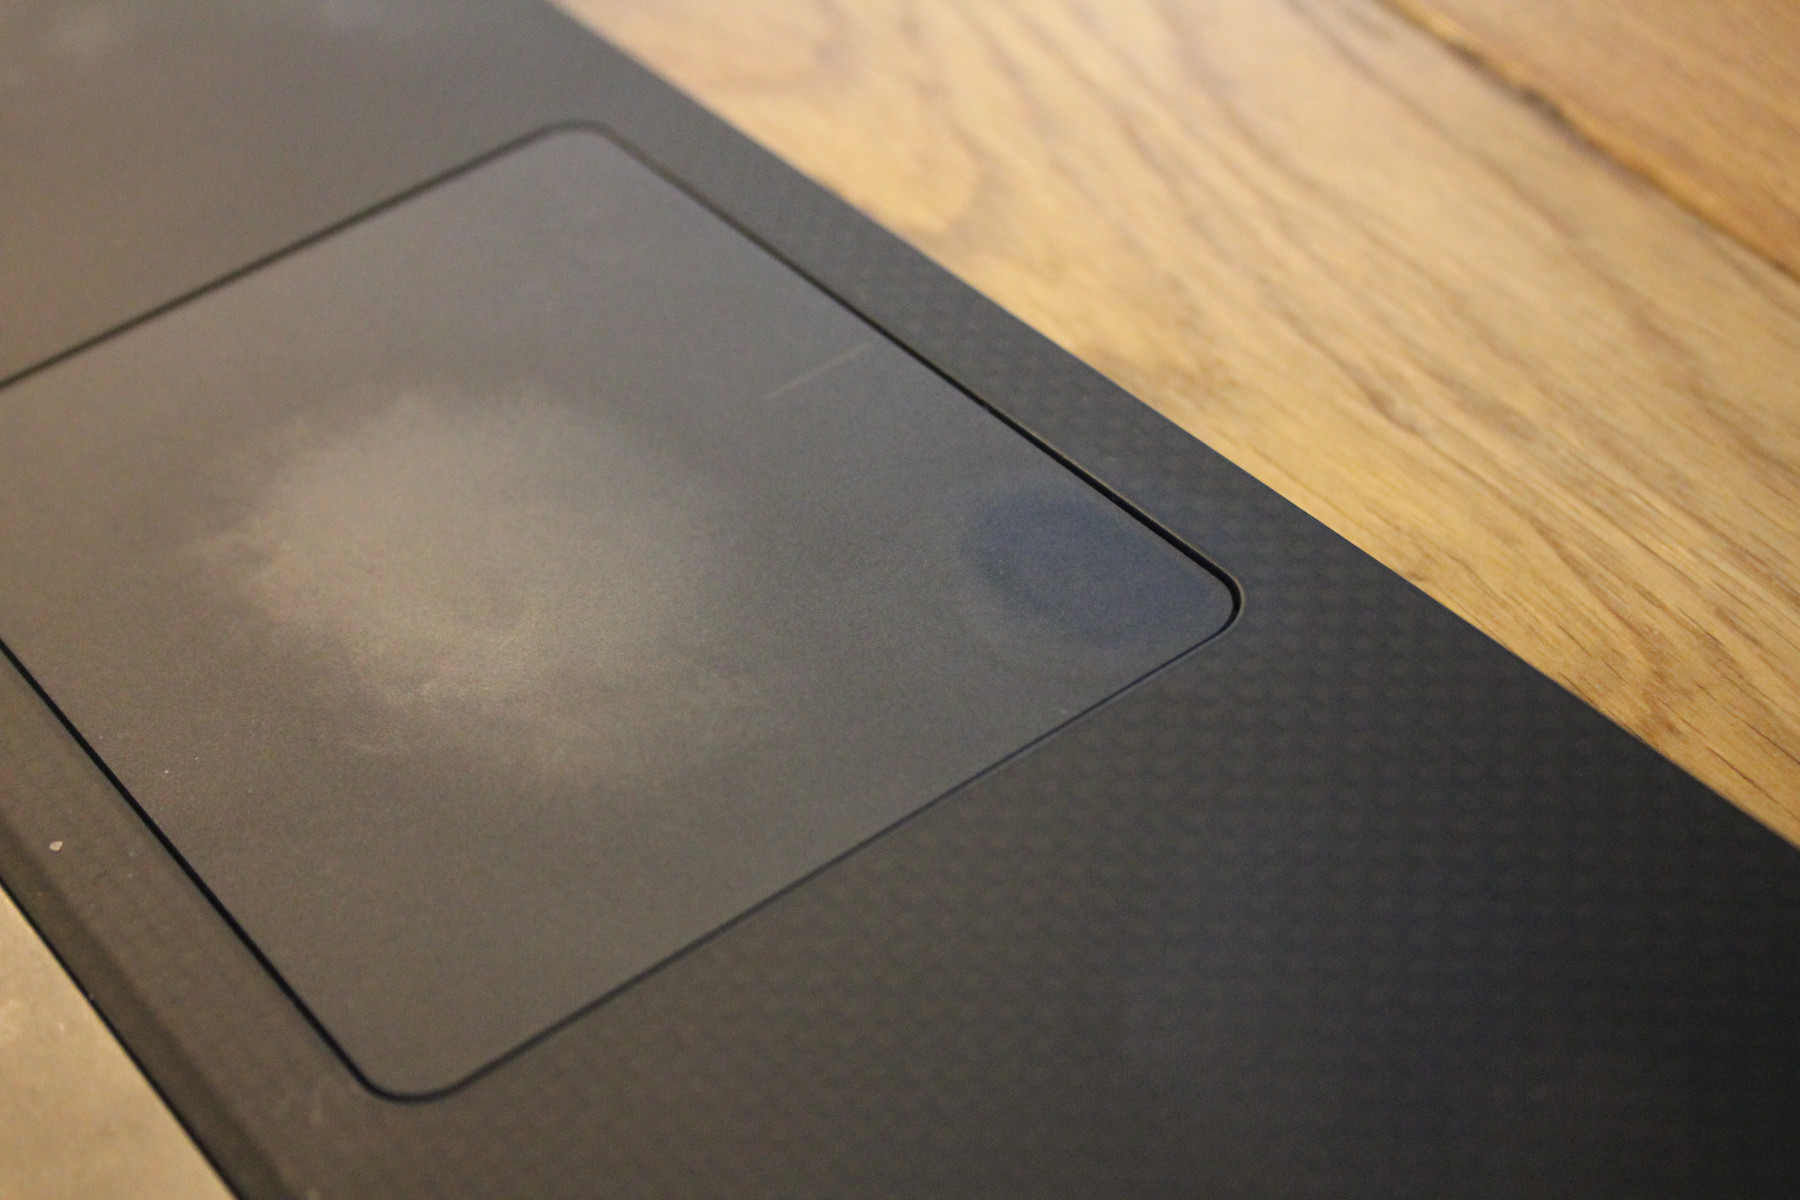
Grease is another persistent topic, because the soft-touch carbon surface is pretty prone to it. Unfortunately, a cleaning cloth will not remove those glossy stains. We tried it with some butter: You can polish them away dry or wet, but the result is marked by streaks and polishing traces. This means the expensive premium notebook becomes unsightly if you do not clean it extensively.
Input Devices
The touch panel is responsive up into the peripheral areas, basically as long as there is still a small part of the finger on the screen. The small frame is not touch-sensitive, but a finger can glide along the edge and move a window, for example.
The surface is called Hard Coating 3H in the spec sheet of the panel manufacturer. The surface is smooth but not greasy. There is no criticism for the reaction time. You can use up to ten fingers simultaneously for touch inputs, but this is standard and not that important for practice.
Display


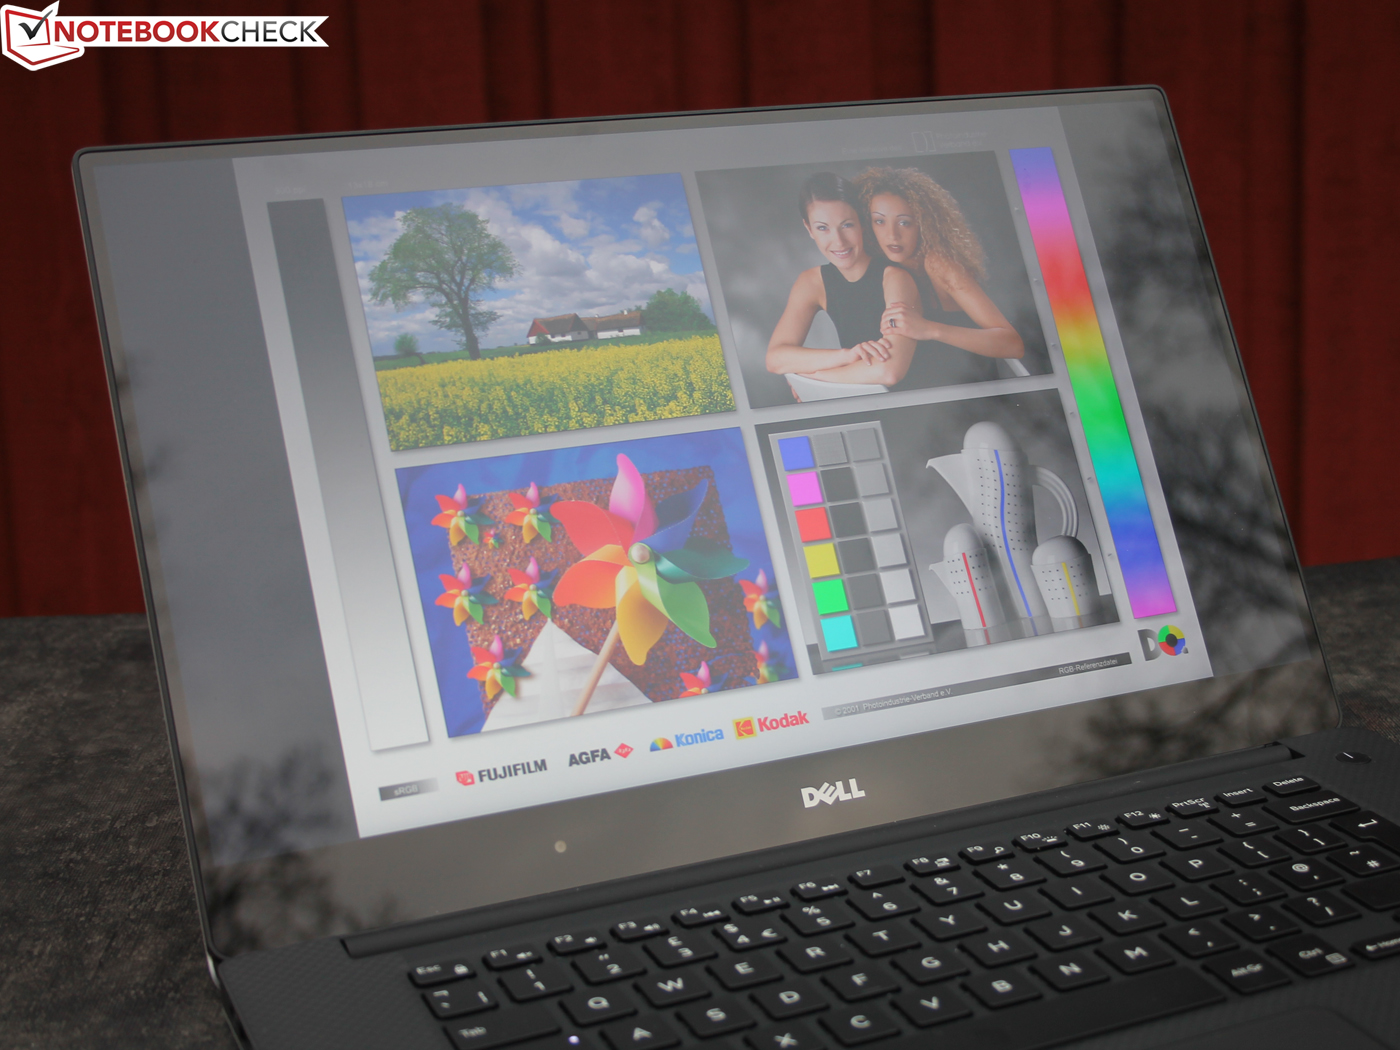
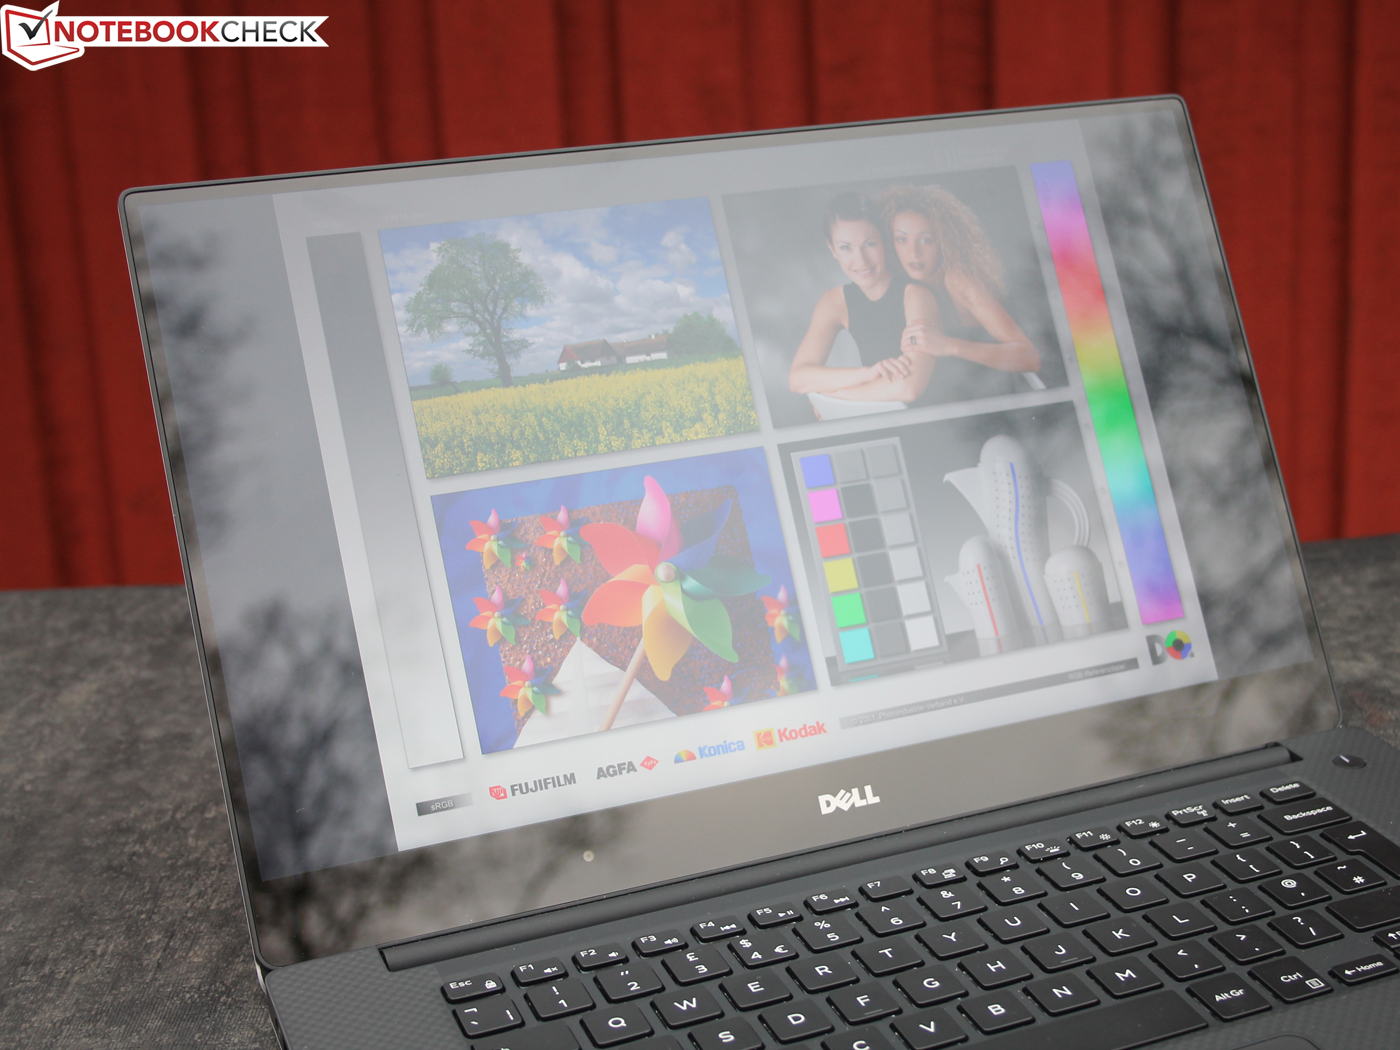
Dell targets professional users with the 4K panel, which is only available as a touchscreen. Photoshop tools or In-Design can utilize the 3840x2160 pixels. Older tools and Windows can sometimes still have scaling issues (power settings are always opened as a tiny window). But you don't want to go back to Full HD once you have worked with the 4K screen from Sharp.
It is an IGZO-TFT similar to the current XPS 13 4K Touch (SHP1421 LQ133Y1). It is a type of IPS panel where the amorphous silicon (aSi-TFT) is replaced with indium-gallium-zinc-oxide. This increases the electron mobility by multiple times and results in faster response times. At least in theory, because our measured response times are not what gamers would expect at 35 and 58 milliseconds, respectively (XPS 13 QHD 30 and 40).
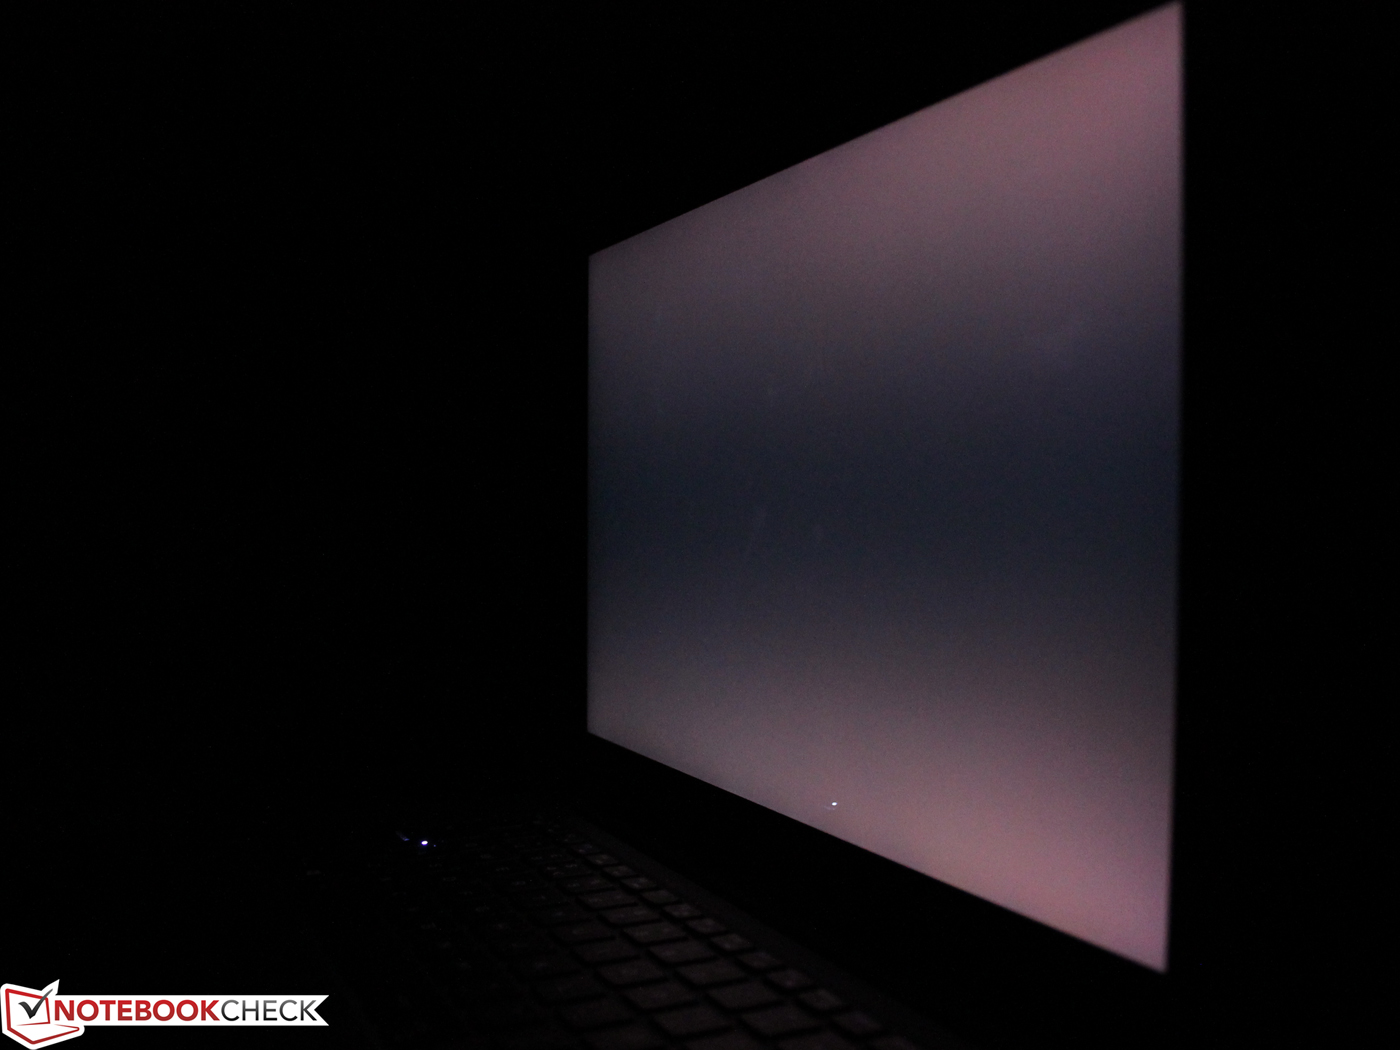
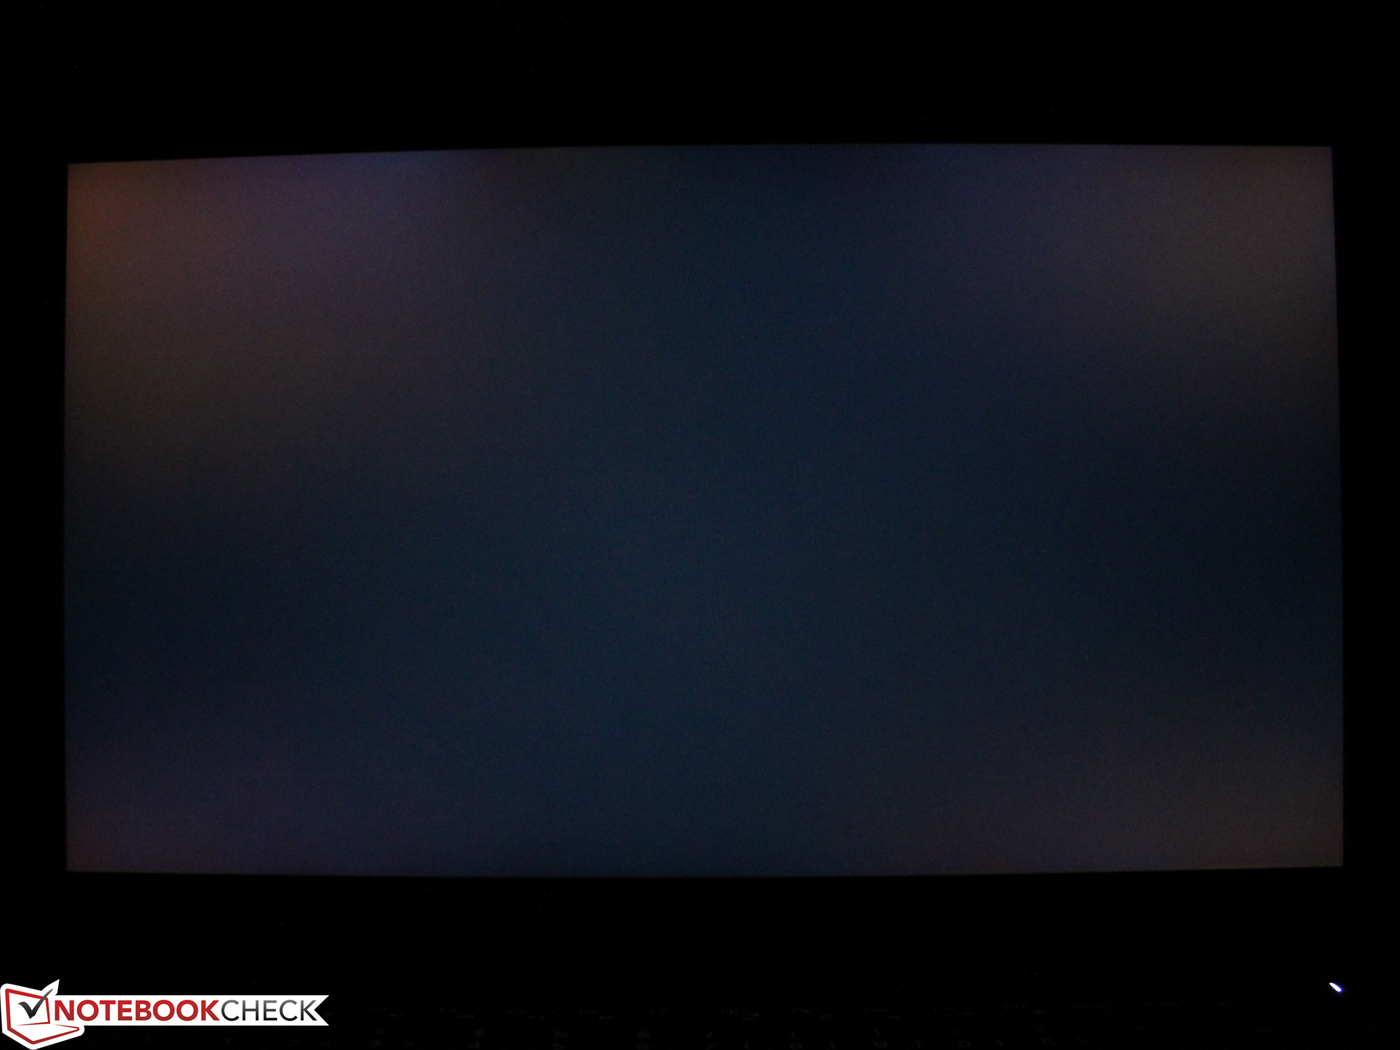
We can confirm the advertised panel specs (WLED 330 cd/m², 1000:1), luminance and contrast are on this level. There is no noteworthy backlight bleeding. Buyers of the UHD version report a red/purple hue, which is particularly visible with black and blue pictures. We also noticed this phenomenon for the FHD version, but similar to the UHD panel only from very wide angles from the side or above. Subjectively, we did not think that it was a big issue for our two test models, but the intensity seems to differ depending on the batch. There are readers' comments/pictures that report a massive distraction. This was not the case for our SHARP LQ156D1JX01.

| |||||||||||||||||||||||||
Brightness Distribution: 90 %
Center on Battery: 361 cd/m²
Contrast: 950:1 (Black: 0.38 cd/m²)
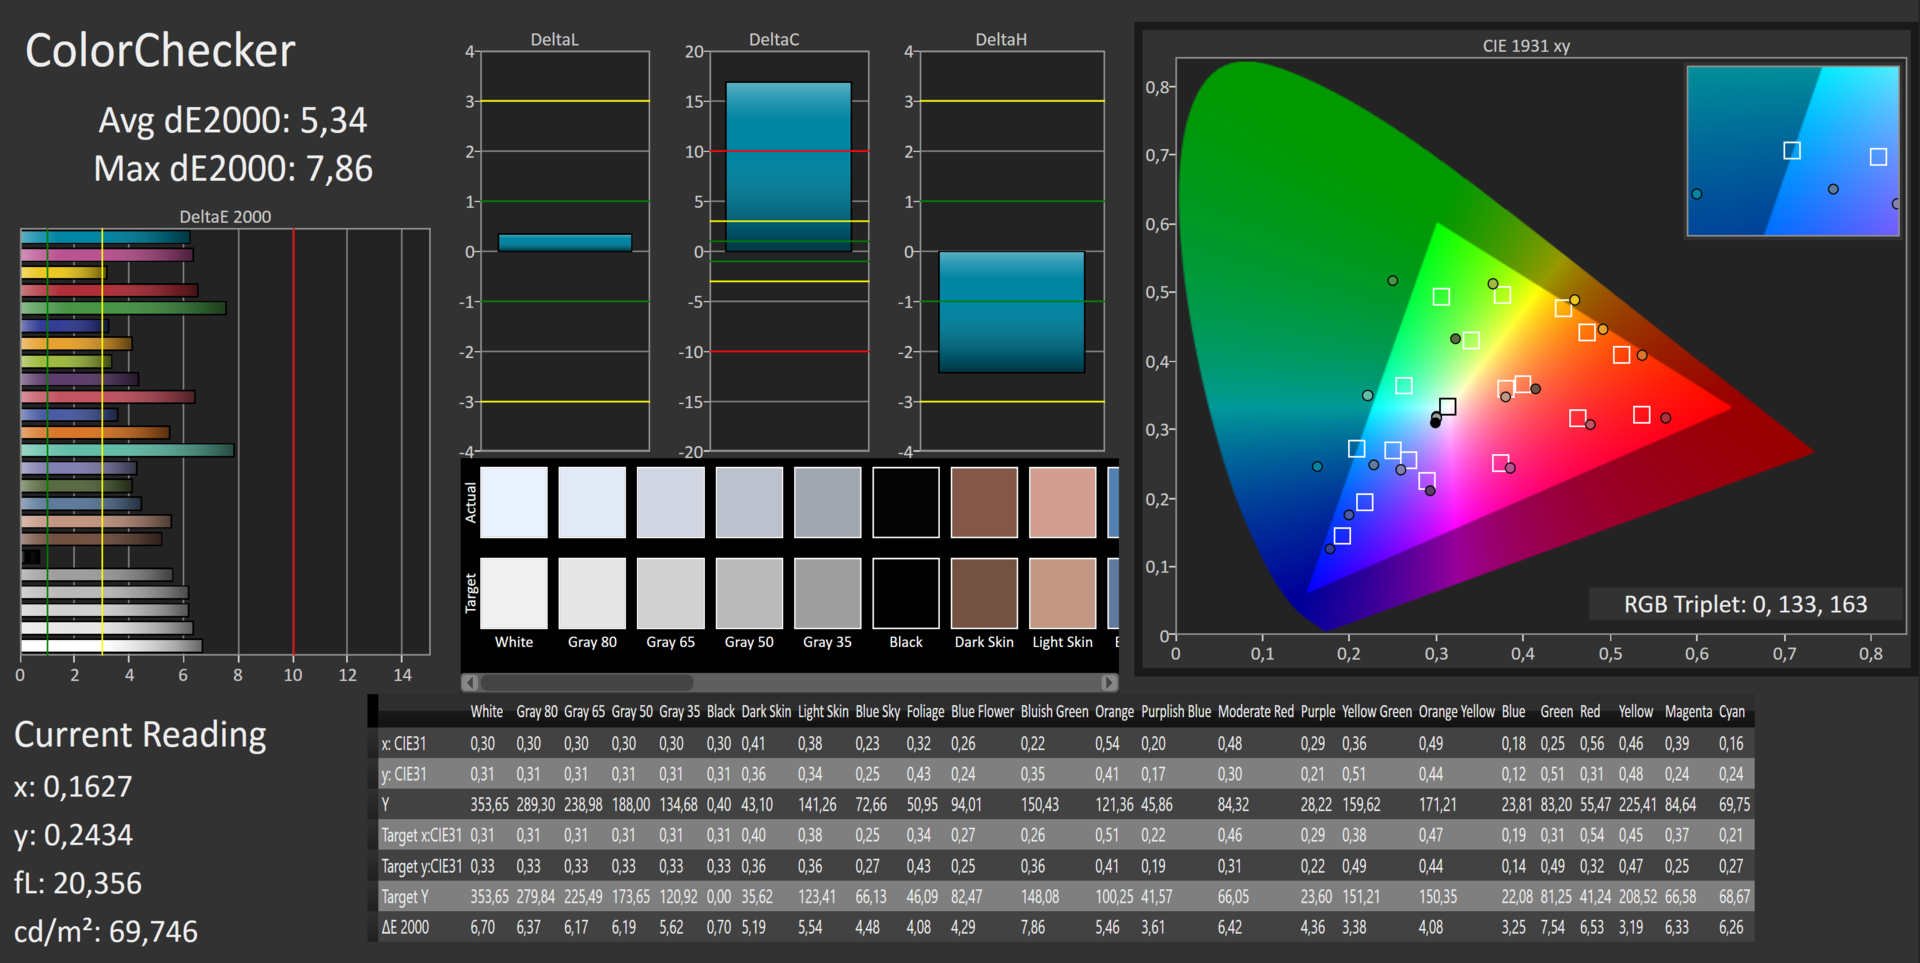
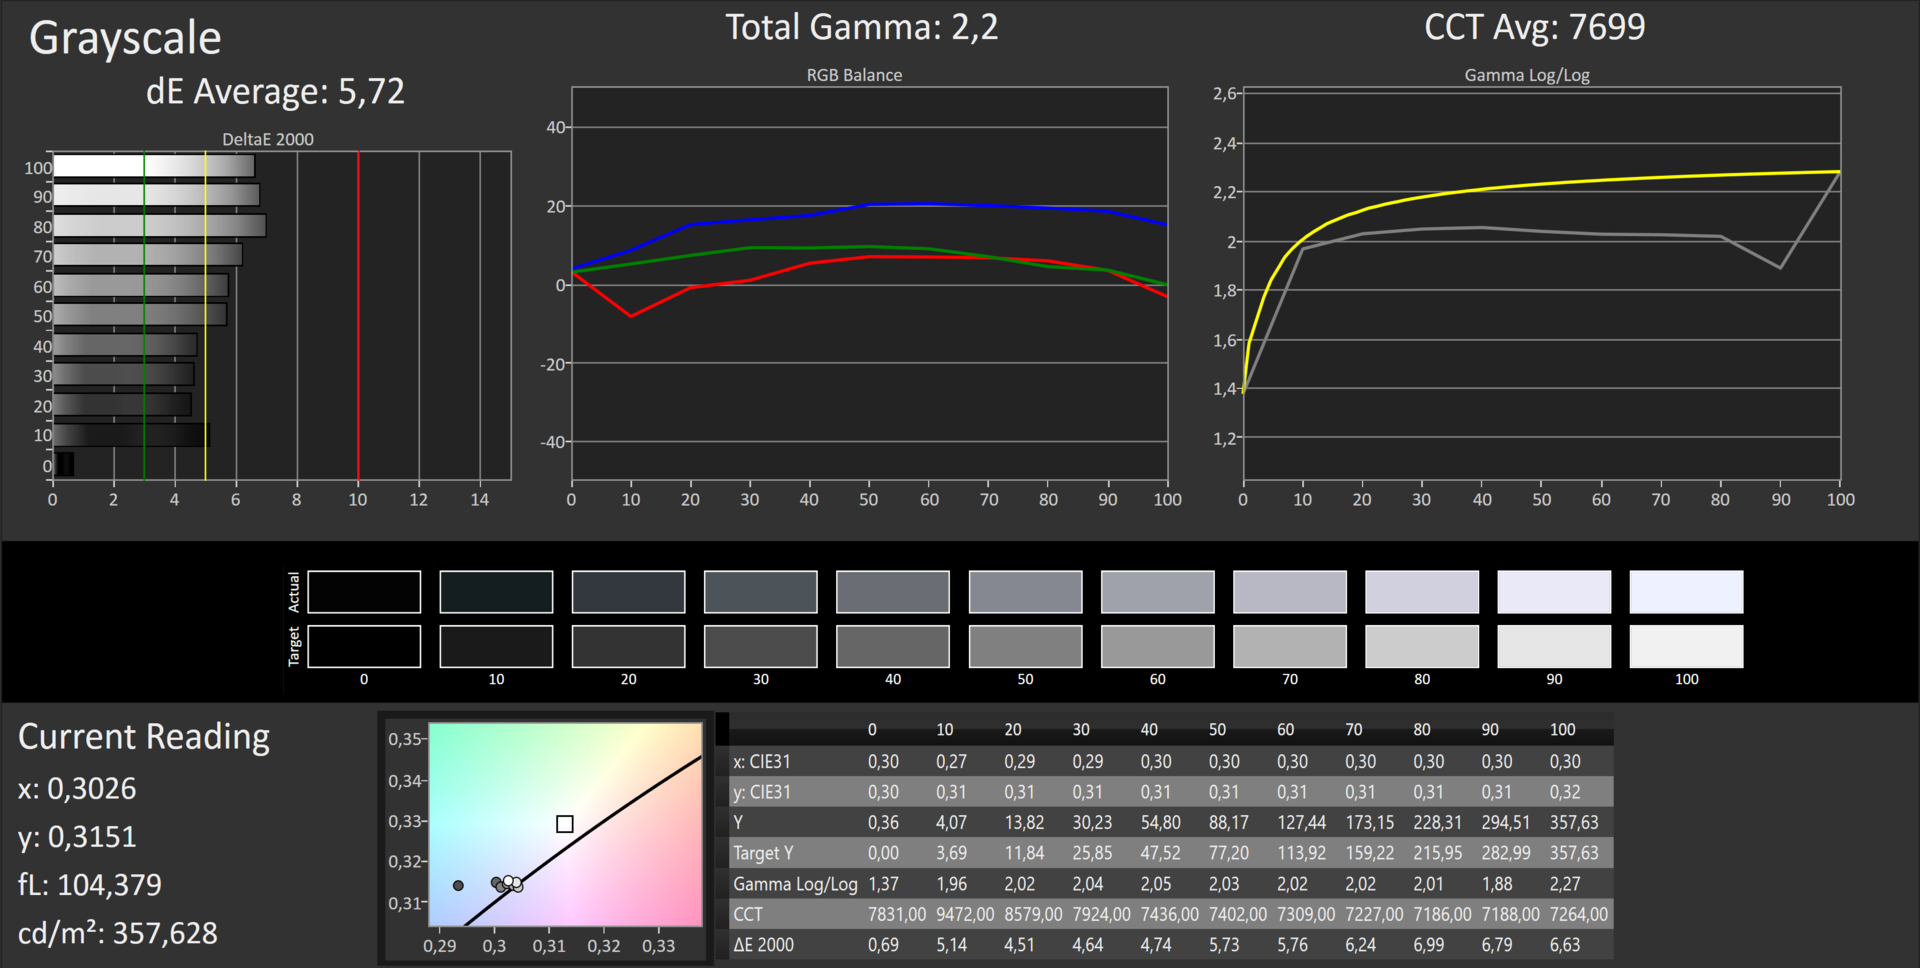
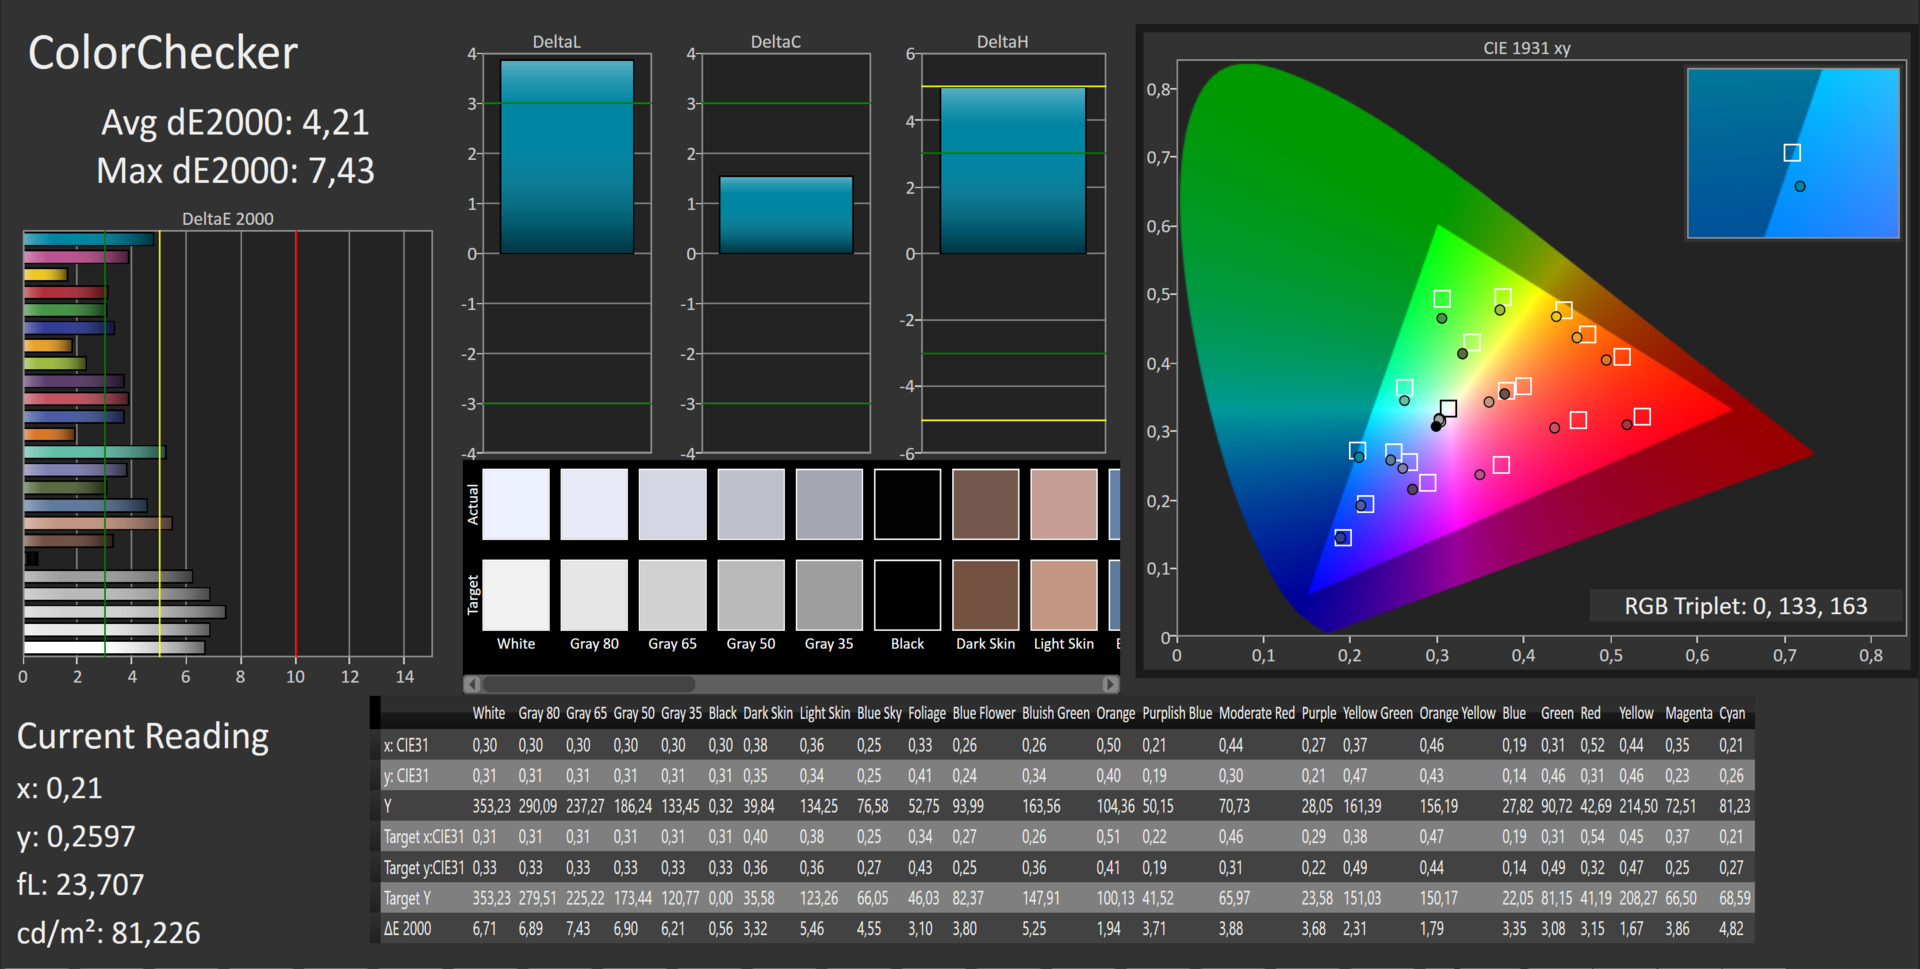
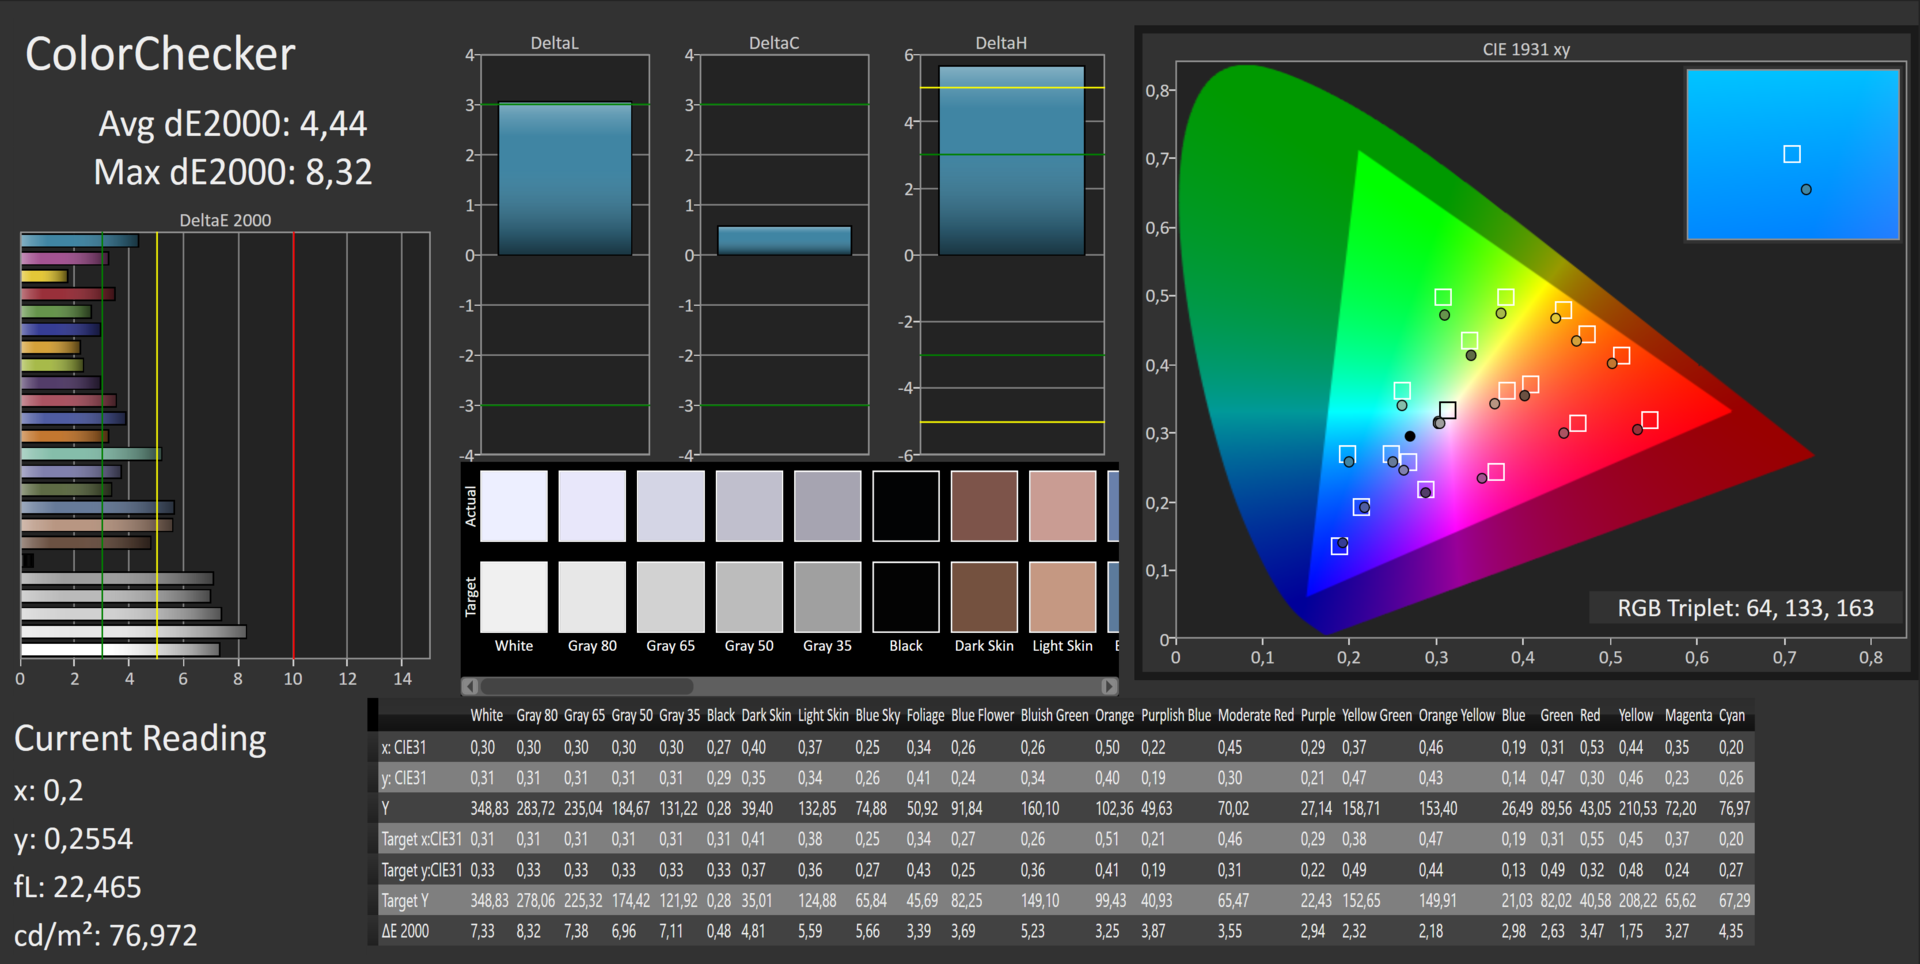
ΔE ColorChecker Calman: 5.34 | ∀{0.5-29.43 Ø4.72}
ΔE Greyscale Calman: 4.84 | ∀{0.09-98 Ø4.97}
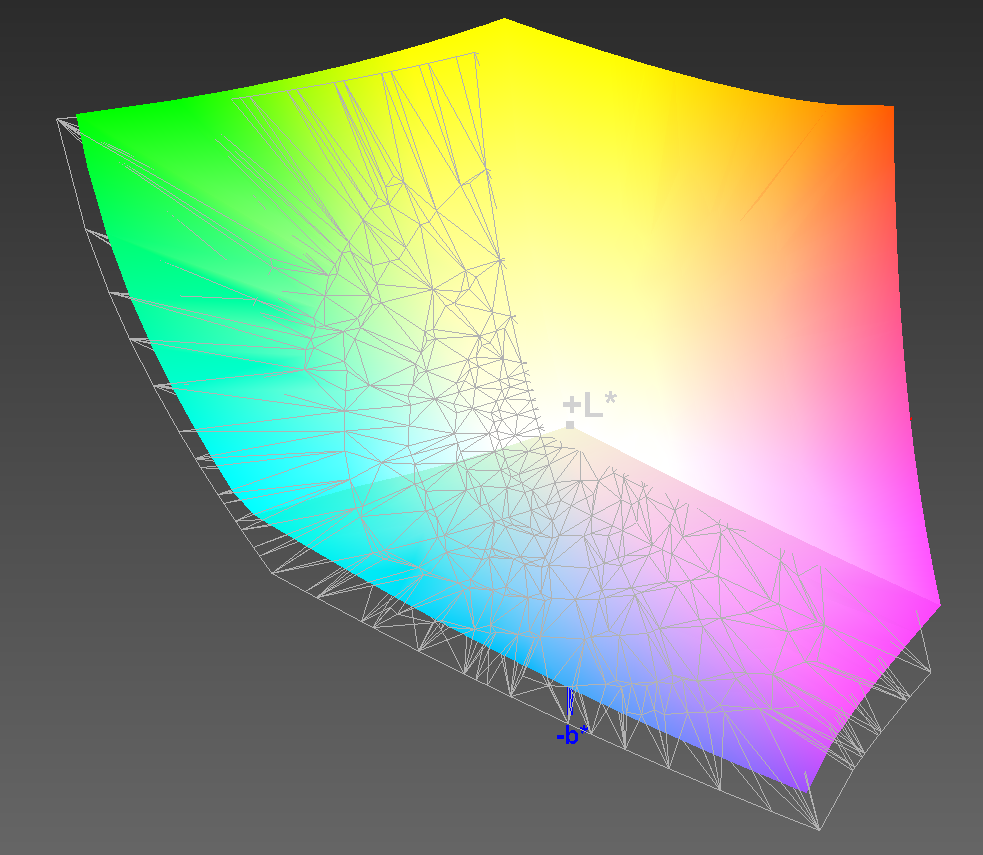
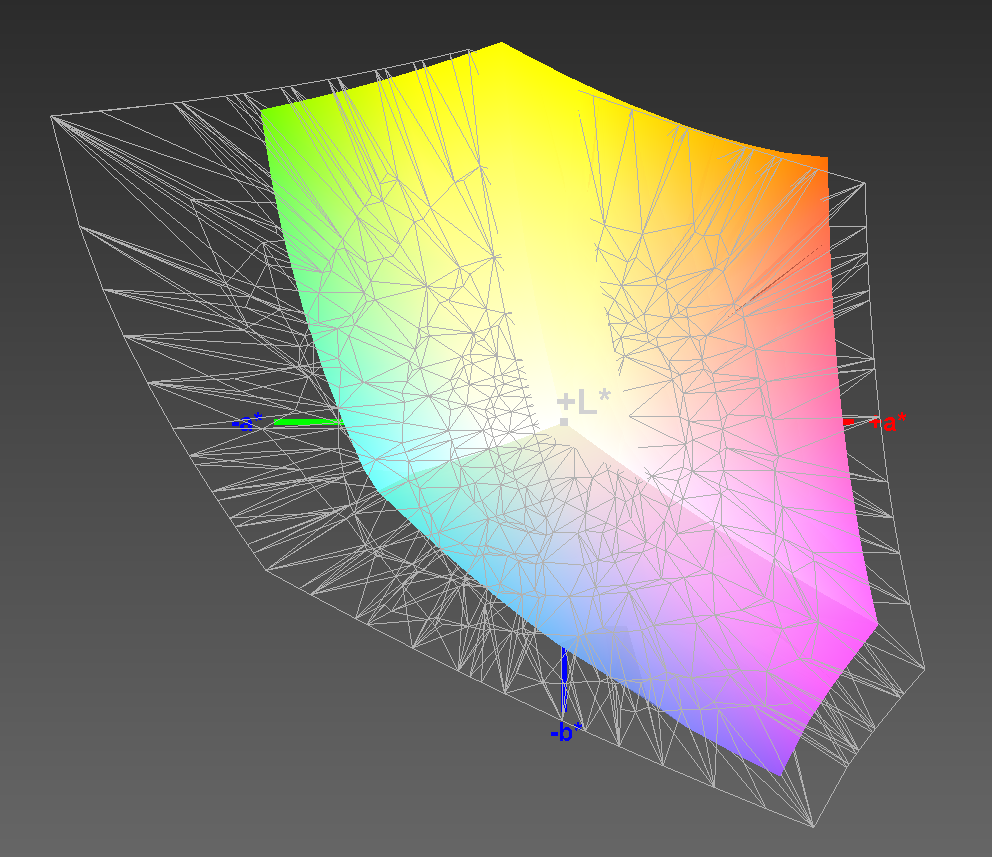
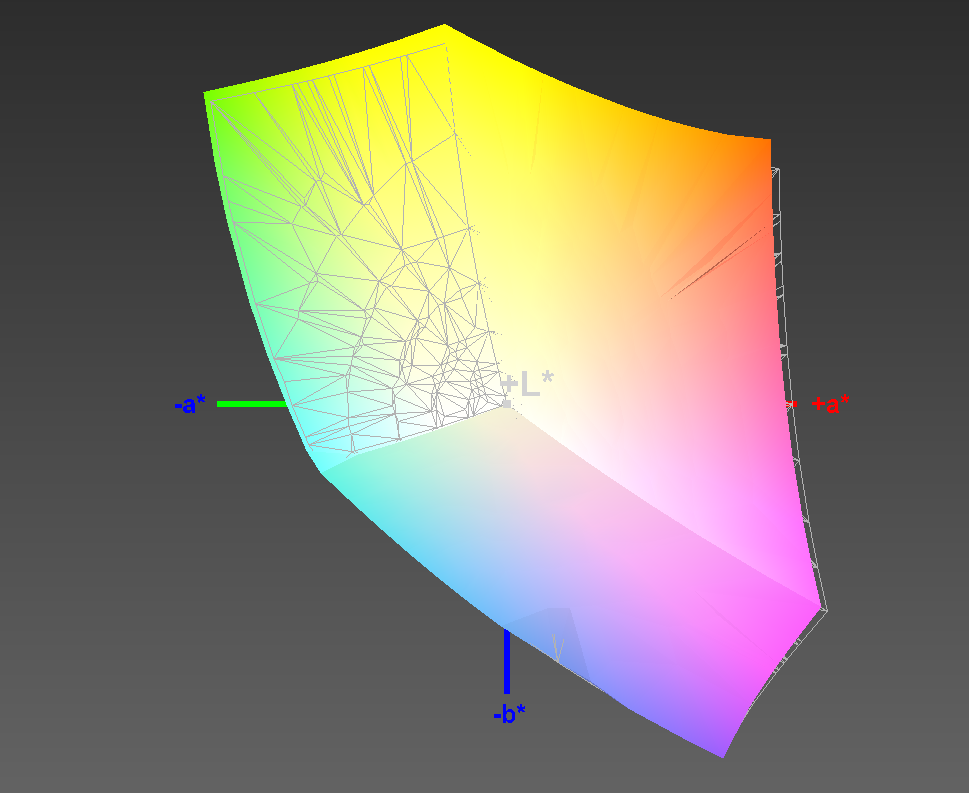
100% sRGB (Argyll 1.6.3 3D)
89% AdobeRGB 1998 (Argyll 1.6.3 3D)
99.4% AdobeRGB 1998 (Argyll 3D)
100% sRGB (Argyll 3D)
87.8% Display P3 (Argyll 3D)
Gamma: 2.21
CCT: 7395 K
| XPS 15 9550 UHD 3840x2160 LQ156D1JX01 IGZO | XPS 15 9550 FHD 1920x1080 SHP1453 LQ156M1 IPS | Apple MB Pro Retina 15 2015 2880x1800 APPA02E IPS | Asus Zenbook Pro UX501JW 3840x2160 SDC434B FL156FL02-101 IPS | XPS 13 2016 i7 QHD 3200x1800 SHP1421 LQ133Y1 IGZO | XPS 15 9530 3840x2160 SHP1431 LQ156D1 IPS | MSI PE60 1920x1080 SAMSUNG LTN156HL01 IPS True Color | Acer AS V Nitro VN7-792G 1920x1080 AUO B173HAN01 IPS | |
|---|---|---|---|---|---|---|---|---|
| Display | -18% | -25% | -42% | -23% | -21% | -19% | -22% | |
| Display P3 Coverage (%) | 87.8 | 68.8 -22% | 61.4 -30% | 47.47 -46% | 63.6 -28% | 64.9 -26% | 67.6 -23% | 67 -24% |
| sRGB Coverage (%) | 100 | 97.9 -2% | 90.8 -9% | 71.5 -28% | 93.6 -6% | 96.1 -4% | 97 -3% | 91.3 -9% |
| AdobeRGB 1998 Coverage (%) | 99.4 | 70.7 -29% | 62.9 -37% | 49.05 -51% | 65.5 -34% | 66.9 -33% | 69.8 -30% | 66.7 -33% |
| Response Times | -11% | 24% | 23% | 10% | ||||
| Response Time Grey 50% / Grey 80% * (ms) | 58 ? | 62 ? -7% | 43.2 ? 26% | 40 ? 31% | 58 ? -0% | |||
| Response Time Black / White * (ms) | 35 ? | 40 ? -14% | 27.2 ? 22% | 30 ? 14% | 28 ? 20% | |||
| PWM Frequency (Hz) | 362 ? | 4900 ? | ||||||
| Screen | 2% | 8% | -33% | 5% | 10% | 6% | 10% | |
| Brightness middle (cd/m²) | 361 | 399 11% | 341 -6% | 302 -16% | 285 -21% | 349 -3% | 300 -17% | 346 -4% |
| Brightness (cd/m²) | 344 | 394 15% | 315 -8% | 307 -11% | 281 -18% | 365 6% | 282 -18% | 326 -5% |
| Brightness Distribution (%) | 90 | 89 -1% | 82 -9% | 87 -3% | 90 0% | 87 -3% | 90 0% | 88 -2% |
| Black Level * (cd/m²) | 0.38 | 0.24 37% | 0.34 11% | 0.79 -108% | 0.18 53% | 0.282 26% | 0.35 8% | 0.32 16% |
| Contrast (:1) | 950 | 1663 75% | 1003 6% | 382 -60% | 1583 67% | 1238 30% | 857 -10% | 1081 14% |
| Colorchecker dE 2000 * | 5.34 | 5.95 -11% | 2.07 61% | 5.4 -1% | 4.89 8% | 2.65 50% | 1.8 66% | 4.01 25% |
| Greyscale dE 2000 * | 4.84 | 8.41 -74% | 1.9 61% | 5.99 -24% | 5.16 -7% | 3.77 22% | 2.18 55% | 3.58 26% |
| Gamma | 2.21 100% | 2.35 94% | 2.62 84% | 2.32 95% | 2.15 102% | 2.41 91% | 2.37 93% | 2.23 99% |
| CCT | 7395 88% | 7010 93% | 6514 100% | 6670 97% | 7106 91% | 6786 96% | 6837 95% | 6426 101% |
| Color Space (Percent of AdobeRGB 1998) (%) | 89 | 64 -28% | 58 -35% | 45 -49% | 59 -34% | 61.02 -31% | 64 -28% | |
| Color Space (Percent of sRGB) (%) | 100 | 98 -2% | 91 -9% | 71 -29% | 93 -7% | 96.1 -4% | 97 -3% | |
| Colorchecker dE 2000 max. * | 3.27 | |||||||
| Total Average (Program / Settings) | -9% /
-4% | -9% /
-0% | -17% /
-27% | 2% /
1% | -6% /
3% | -7% /
-0% | -1% /
2% |
* ... smaller is better
The panels of the FHD non-glare and UHD touch hardly differ in the most important core measurements, which is why the comparison table shows that both panels are on par (+2% for FHD). However, this first impression is misleading: UHD is slightly darker and has a lower contrast ratio, but the AdobeRGB1998 coverage is much better. This could be an important aspect for professional users, especially since the comparatively bad color accuracy (DeltaE) ex-works can be improved with calibration: DeltaE smaller 1 and 3.7 (Grayscale/ColorChecker), although the FHD could be well-calibrated, too. XPS 15 UHD owners can use the linked color profile (ICC file) to benefit from the improvements. The best results, however, can only be achieved with an individual calibration.

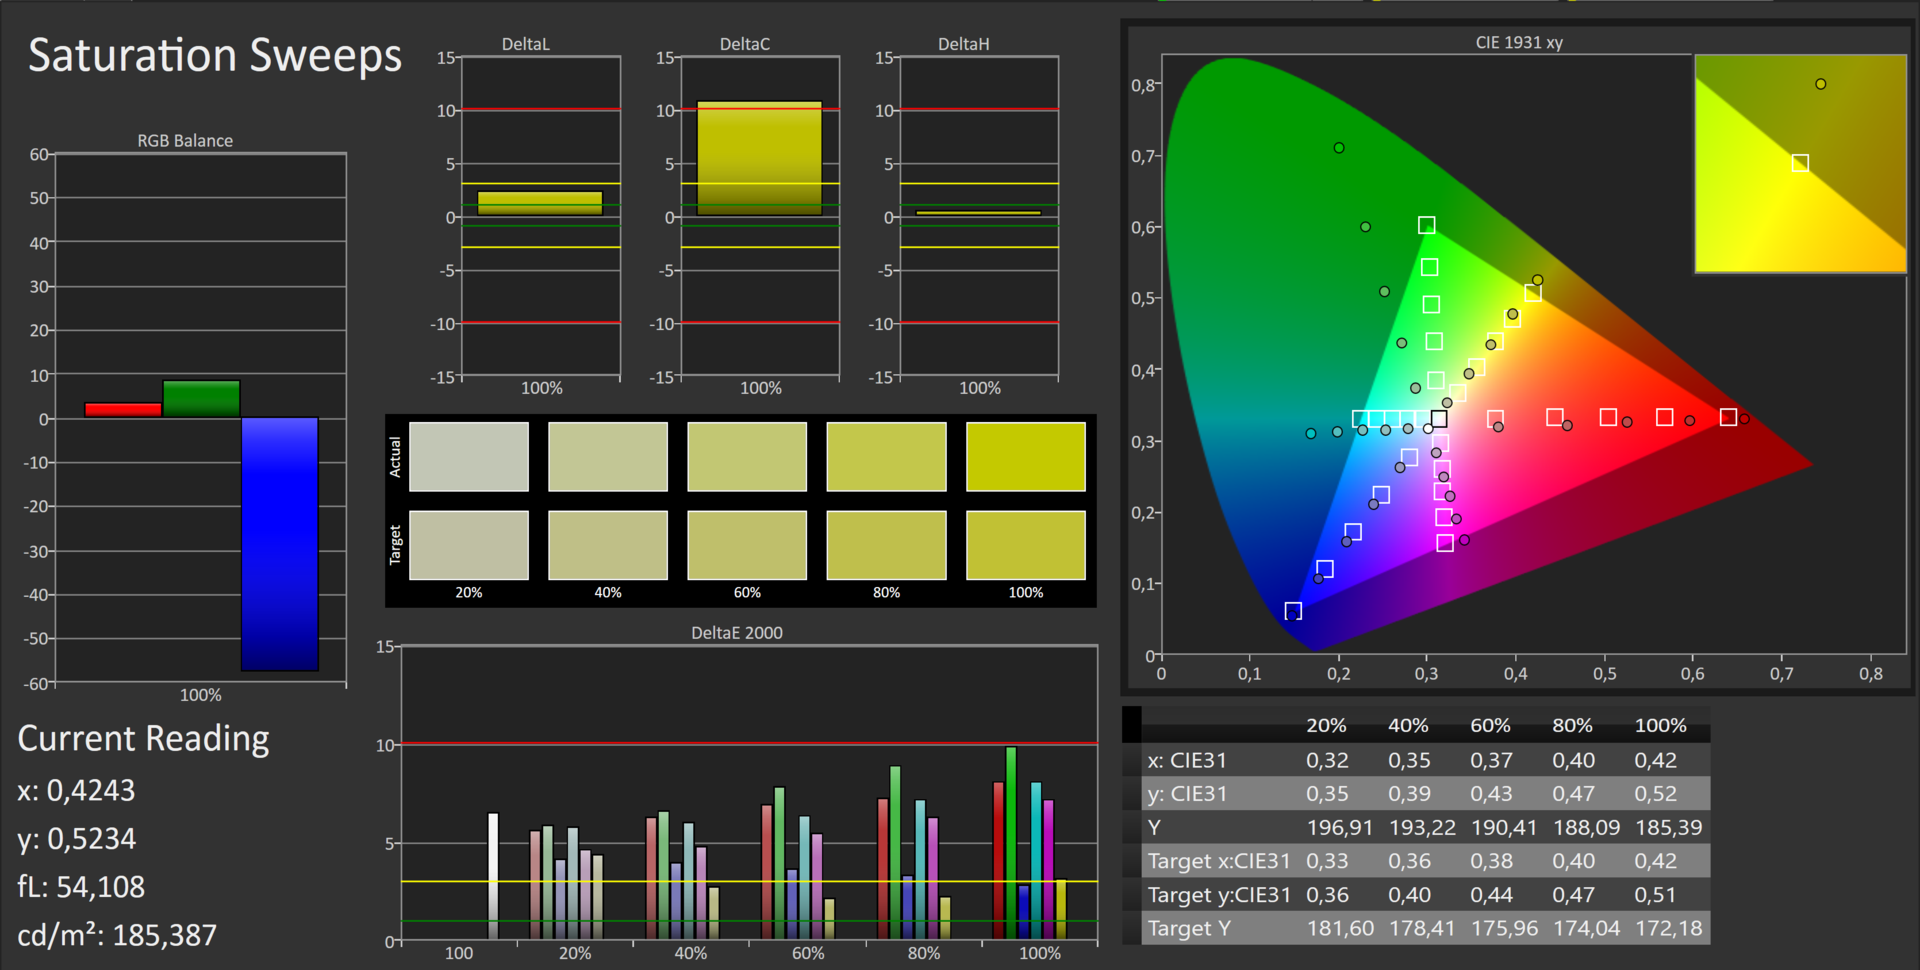
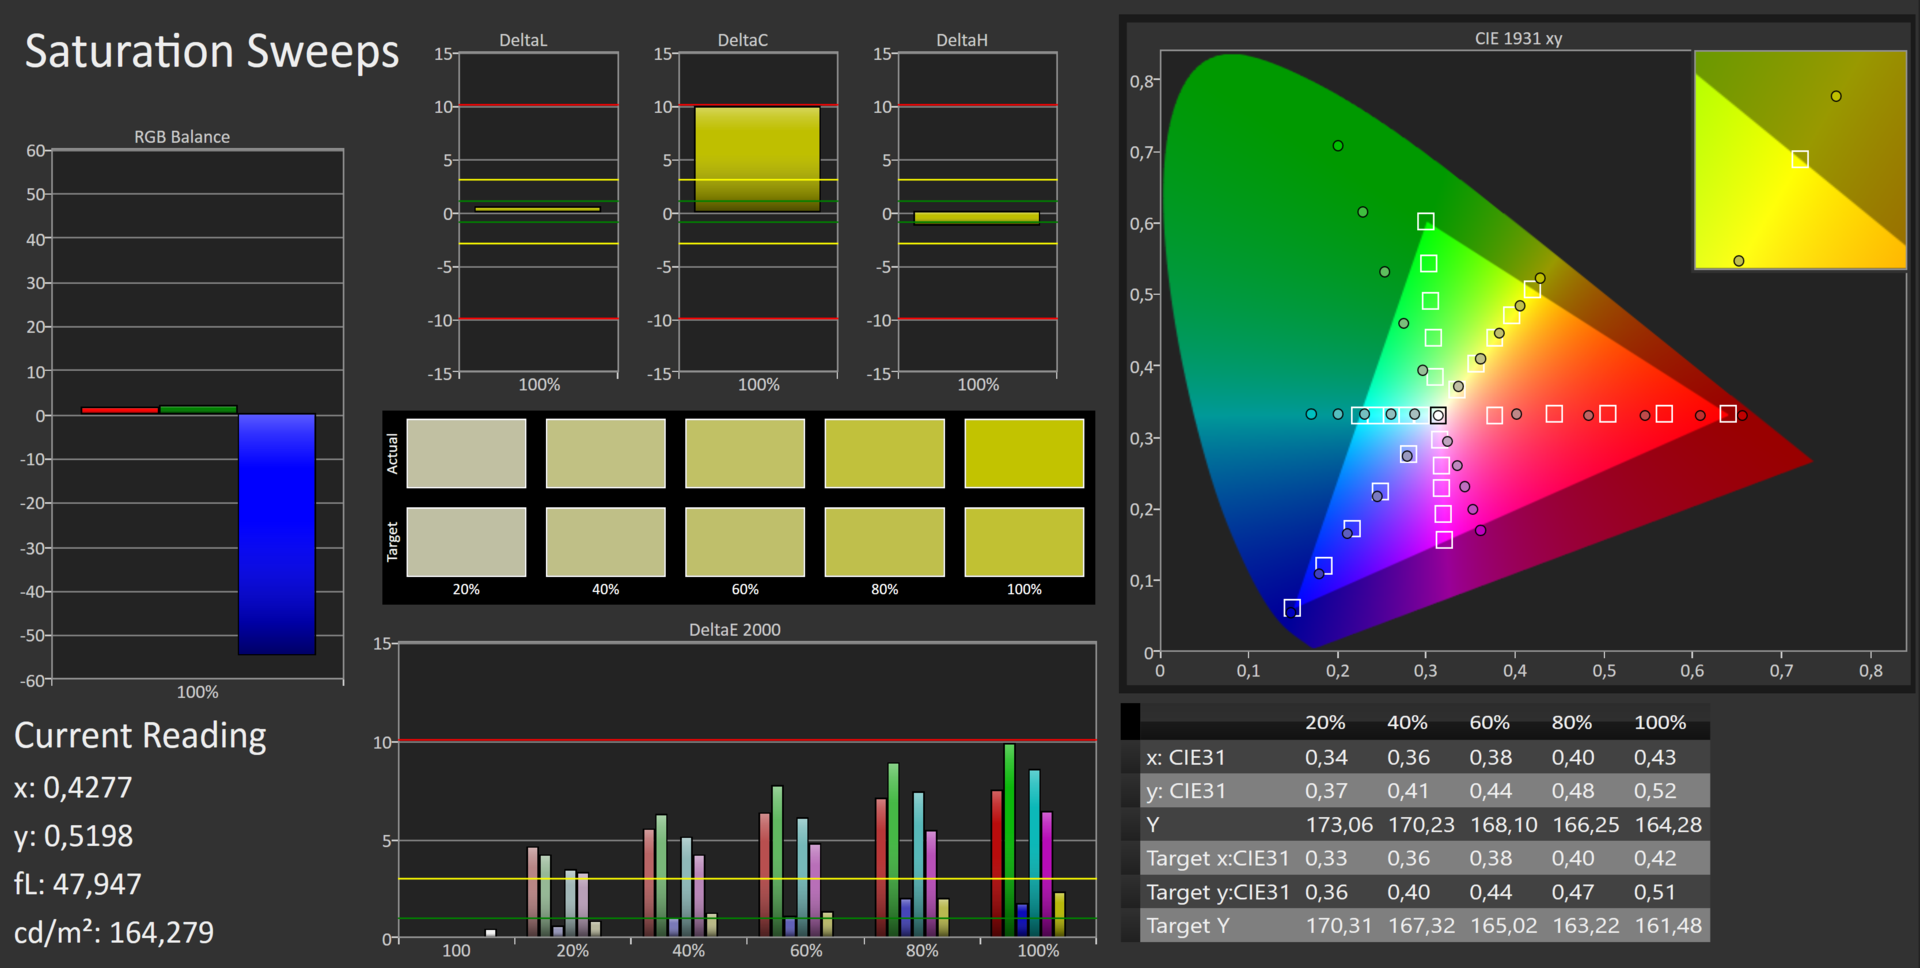


Update 12/23/15
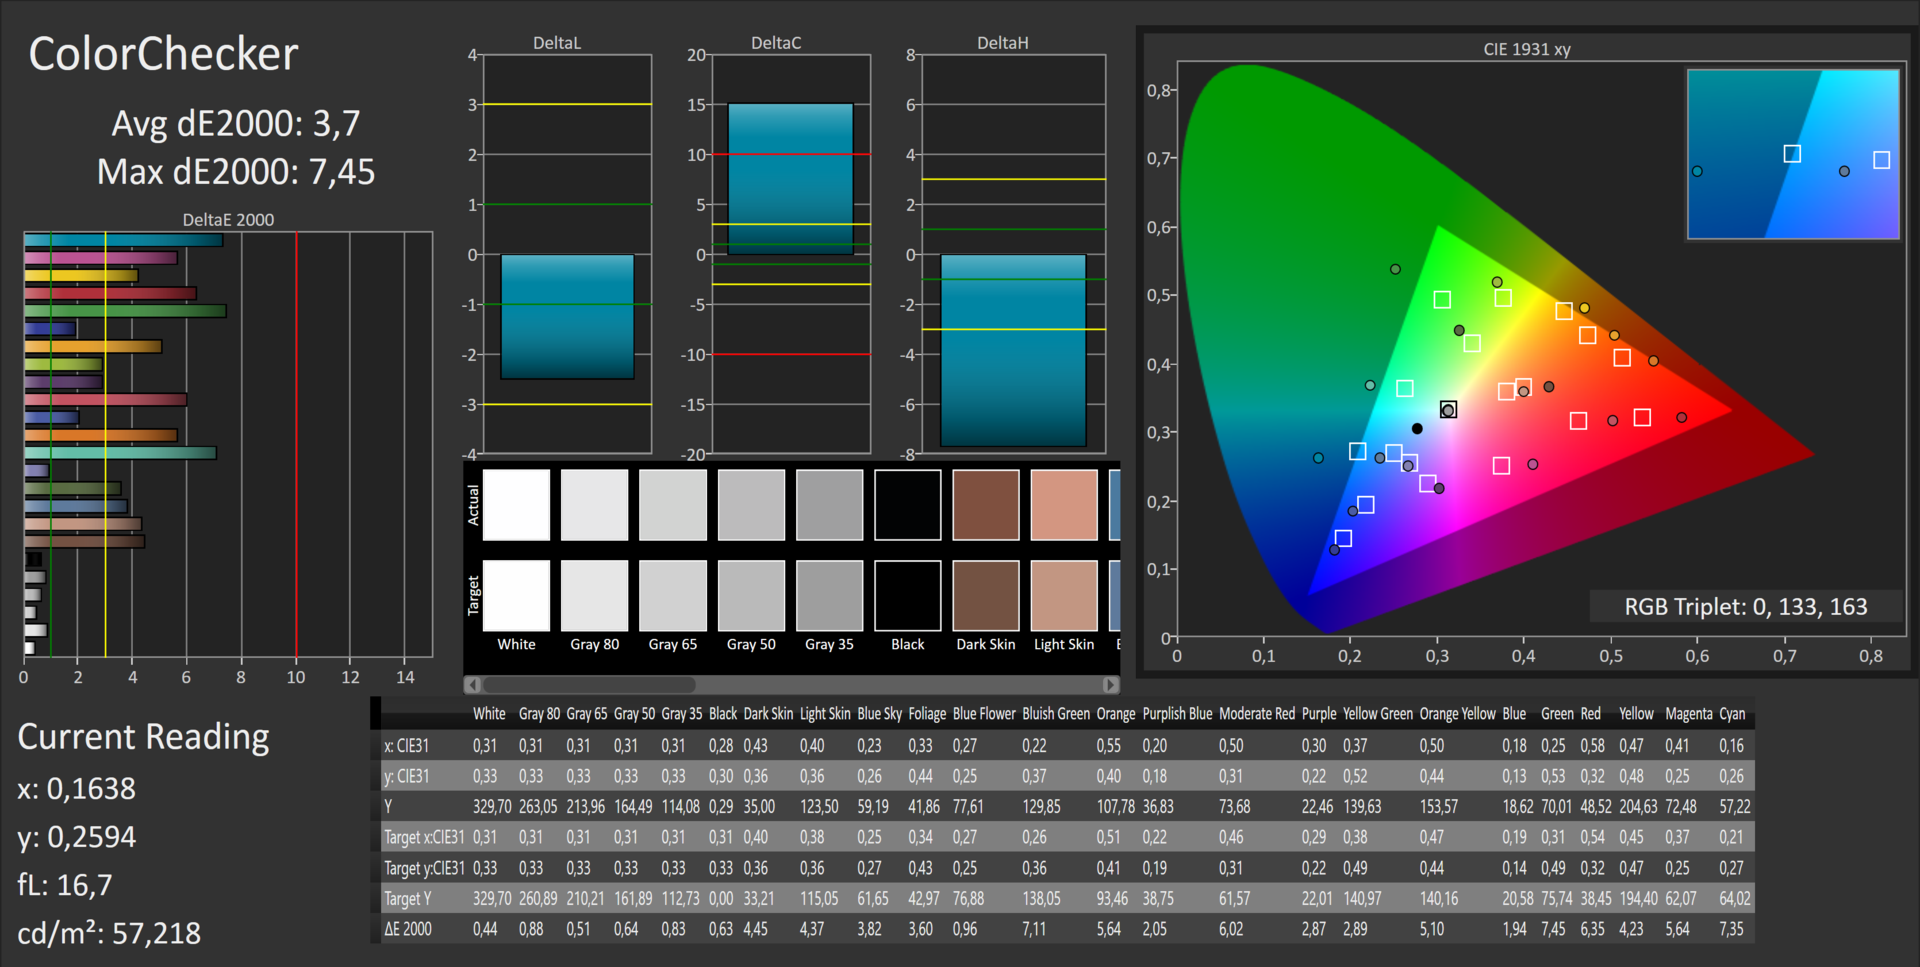
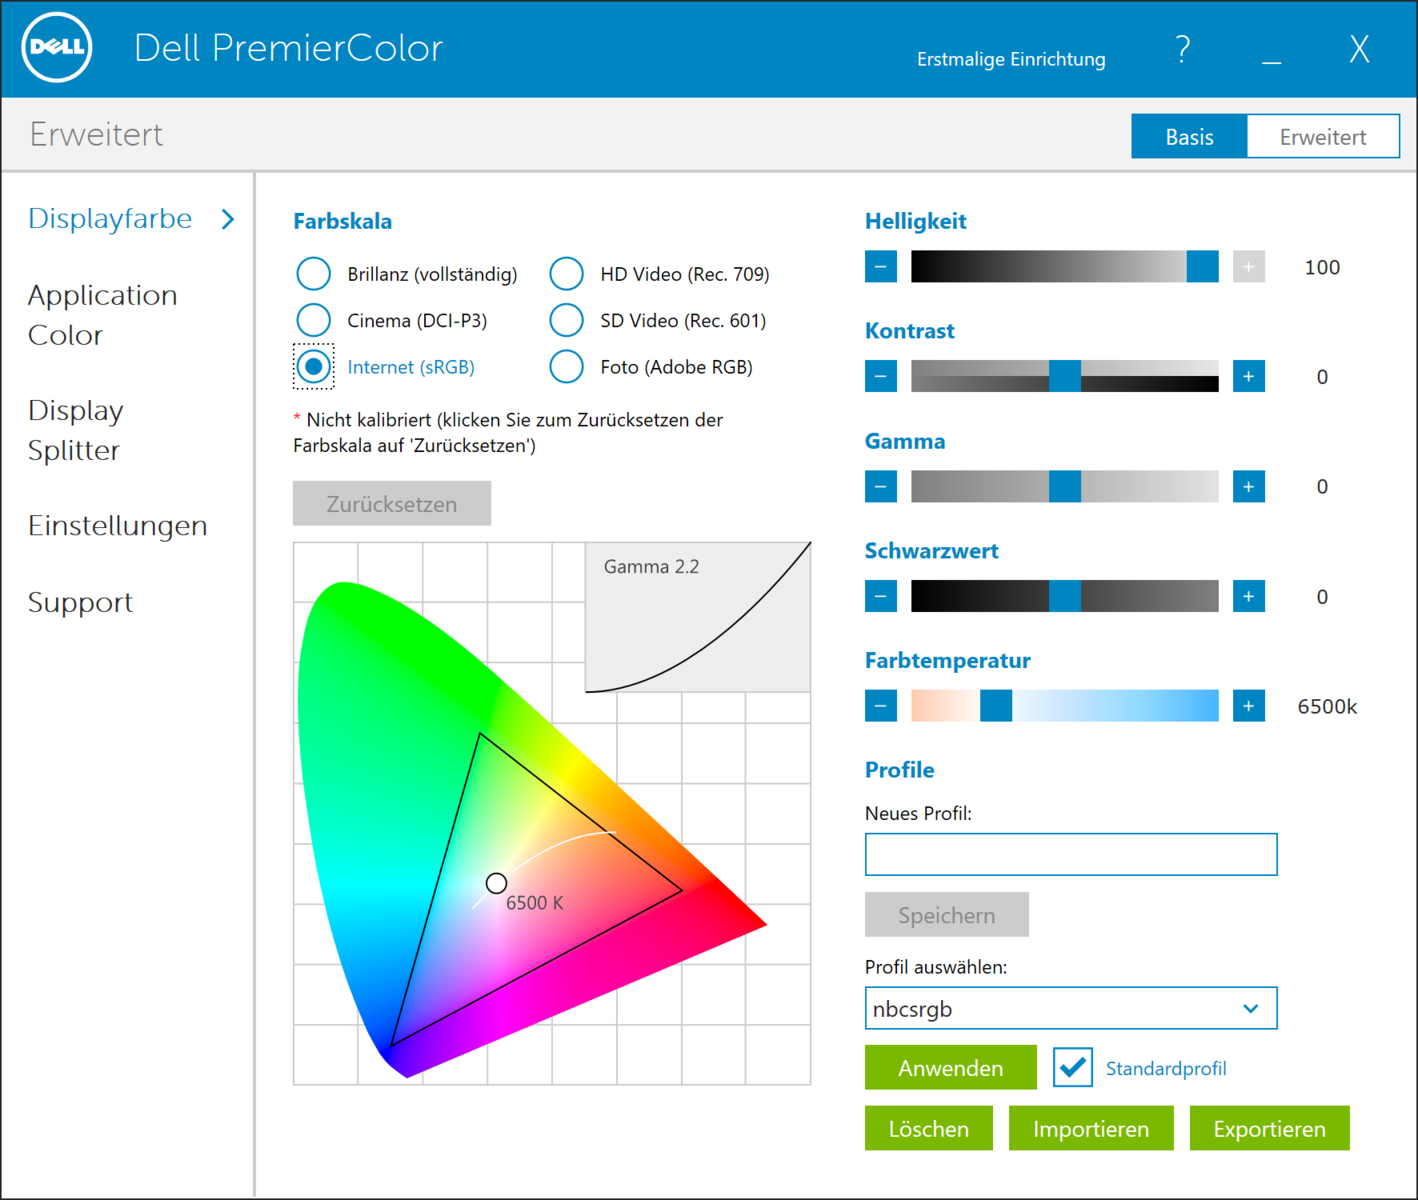
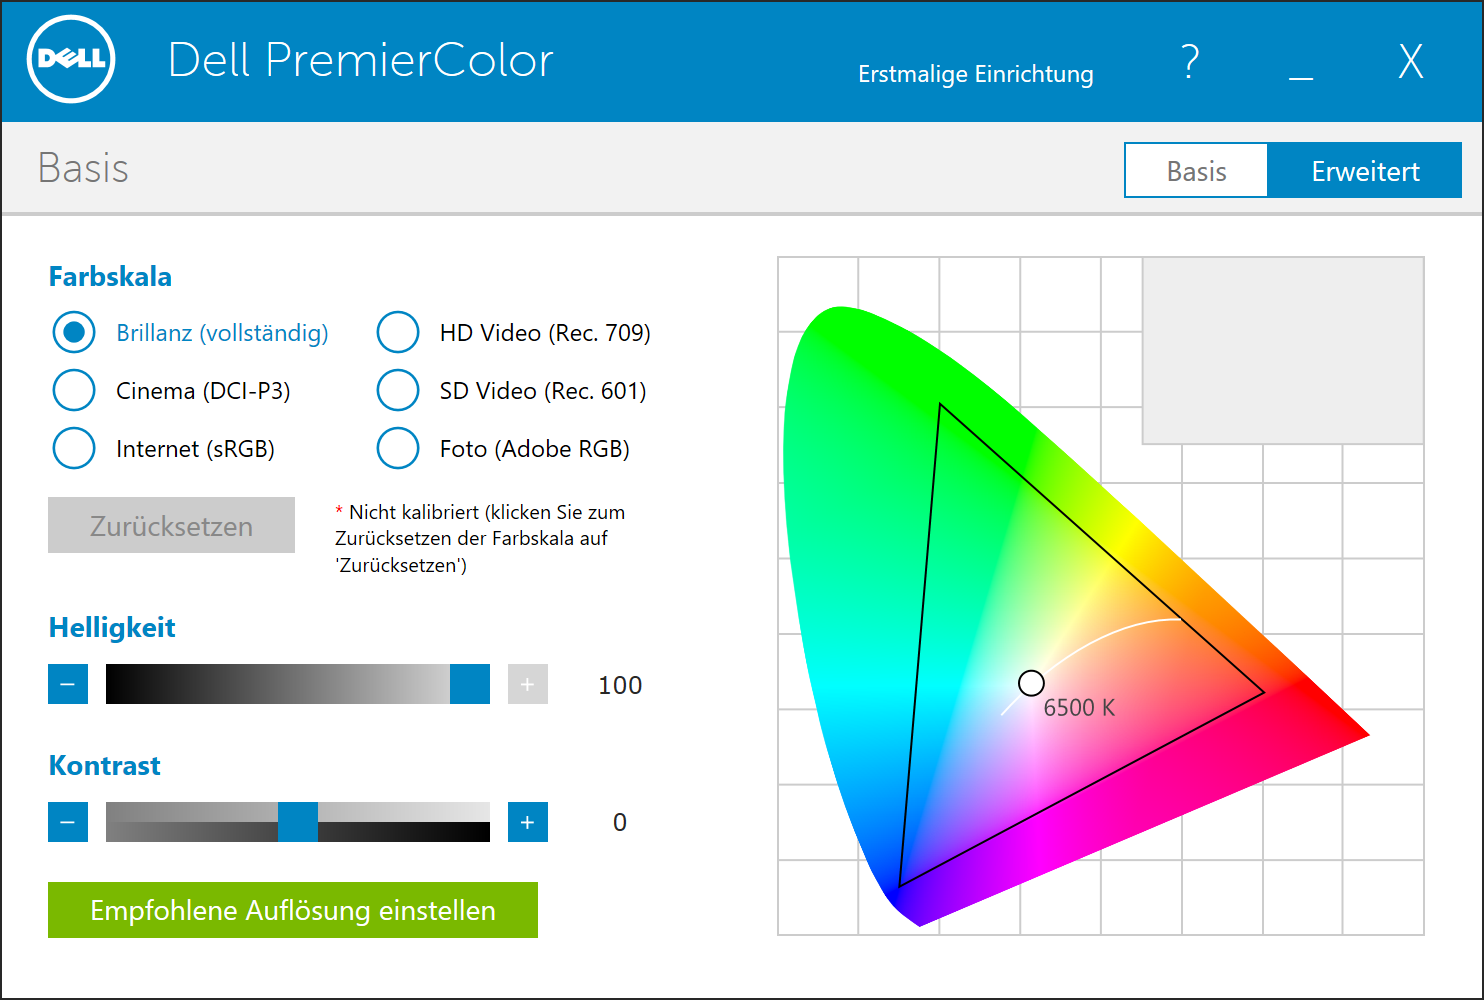
Contrary to our first assumption, there are display profiles for the XPS 15 from Dell. You have to use PremierColor (we could use it during the review period), which lets you choose between the color profiles very easily, and you can adjust the profiles in the enhanced settings. We checked both sRGB and AdobeRGB with a spectrophotometer (grayscale and ColorChecker). The sRGB profile – sRGB is our standard color space for the CalMAN measurements – only shows small differences compared to the factory settings without profile, where the DeltaE values for the grayscale and the colors are around 5 and 4, respectively. The AdobeRGB profile via PremierColor (and the target color space AdobeRGB for CalMAN) does not improve the situation, either: 6 and 4 (grayscale and colors), see screenshots. An individual calibration can therefore not be replaced by PremierColor and is necessary to get the excellent results that we mentioned above.


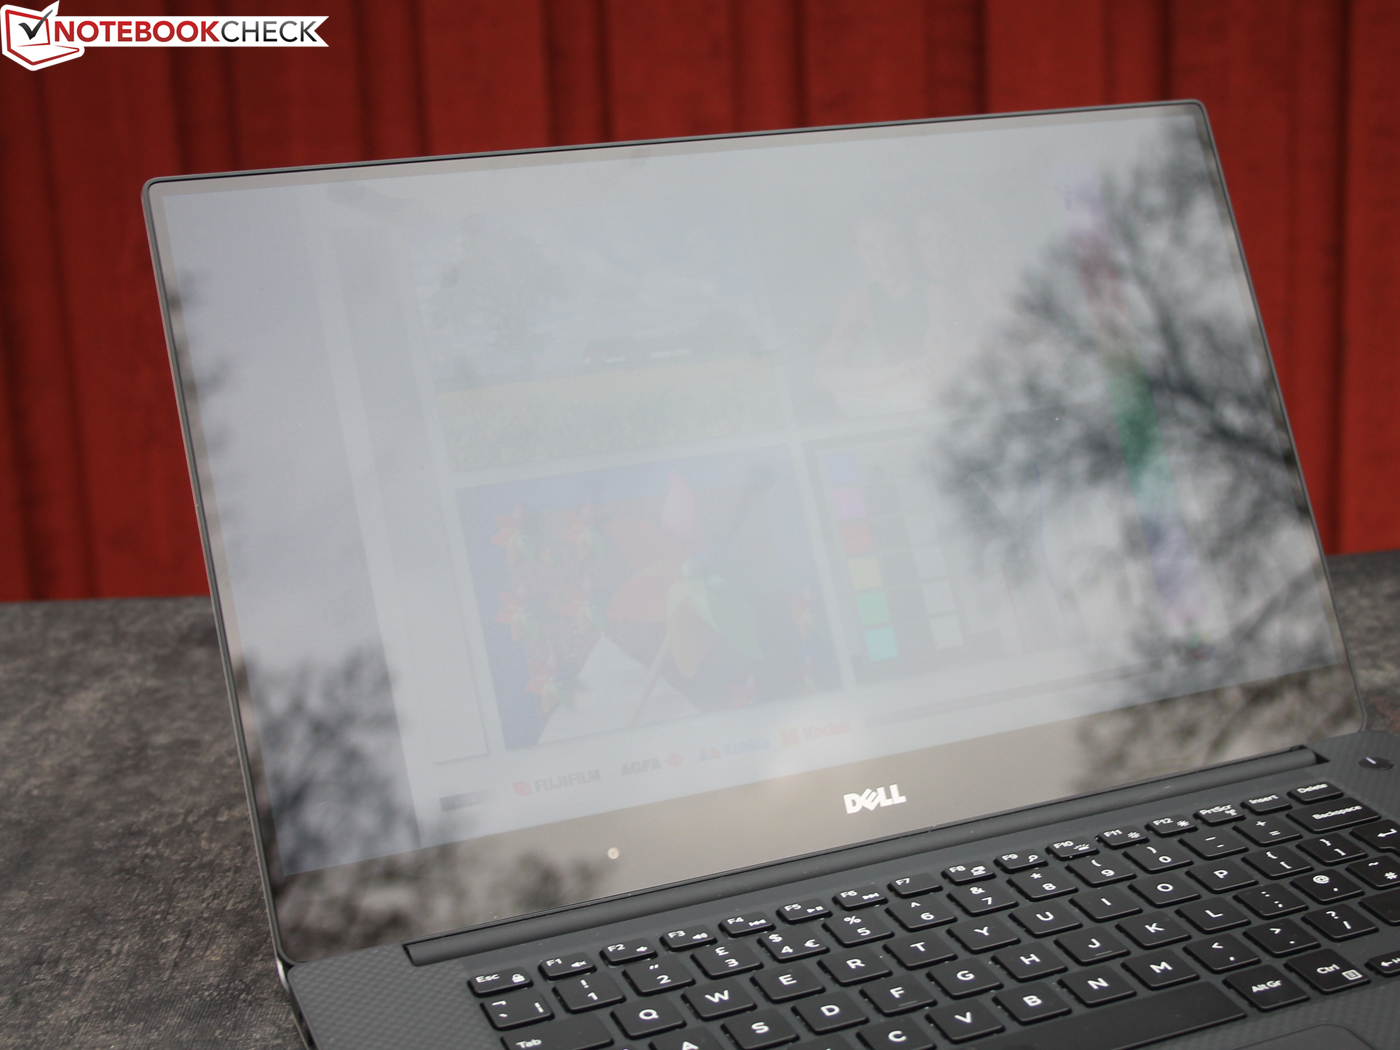
The outdoor capabilities of the glossy XPS are limited, cloudy days without light sources behind you are the best scenario.

Display Response Times
| ↔ Response Time Black to White | ||
|---|---|---|
| 35 ms ... rise ↗ and fall ↘ combined | ↗ 12 ms rise | 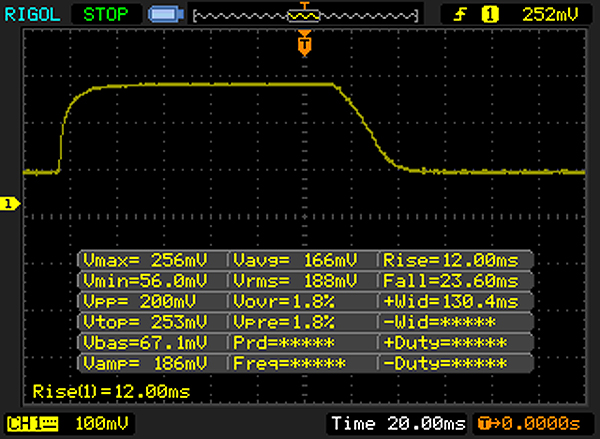 |
| ↘ 23 ms fall | ||
| The screen shows slow response rates in our tests and will be unsatisfactory for gamers. In comparison, all tested devices range from 0.1 (minimum) to 240 (maximum) ms. » 92 % of all devices are better. This means that the measured response time is worse than the average of all tested devices (19.8 ms). | ||
| ↔ Response Time 50% Grey to 80% Grey | ||
| 58 ms ... rise ↗ and fall ↘ combined | ↗ 21 ms rise | 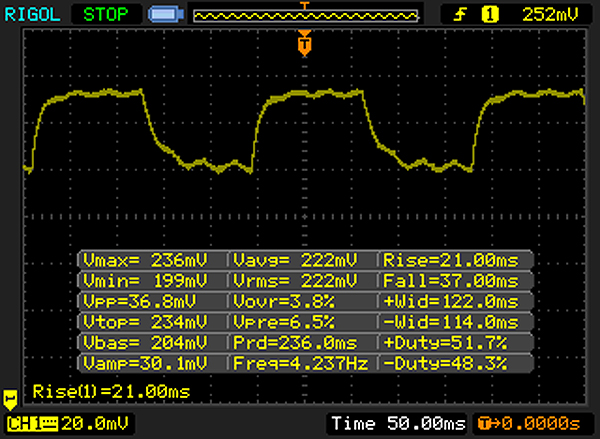 |
| ↘ 37 ms fall | ||
| The screen shows slow response rates in our tests and will be unsatisfactory for gamers. In comparison, all tested devices range from 0.165 (minimum) to 636 (maximum) ms. » 94 % of all devices are better. This means that the measured response time is worse than the average of all tested devices (31 ms). | ||
Screen Flickering / PWM (Pulse-Width Modulation)
| Screen flickering / PWM not detected | 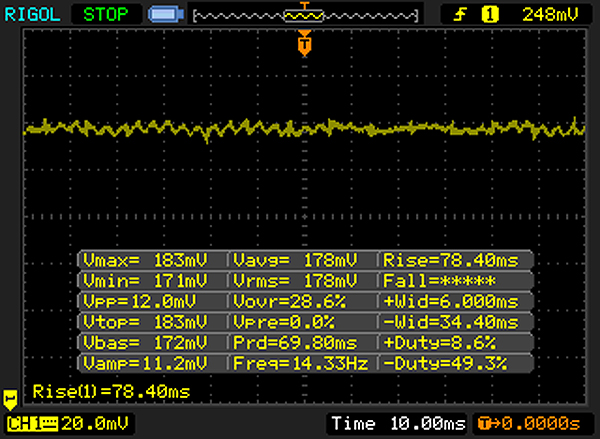  | ||
In comparison: 52 % of all tested devices do not use PWM to dim the display. If PWM was detected, an average of 7781 (minimum: 5 - maximum: 343500) Hz was measured. | |||
We noticed PWM flickering at low brightness levels (two lowest settings) of the FHD model. The UHD model did not have this problem, so there is no flickering at reduced brightness settings. The phenomenon is known as screen flickering, our UHD panel does not suffer from it.
Limited viewing angles, more precisely contrast shifts when you look from the sides, are no problem for the device. They are excellent, which is typical for an IPS panel. The previously mentioned color hue is also clearly visible in the viewing angle picture.


Performance
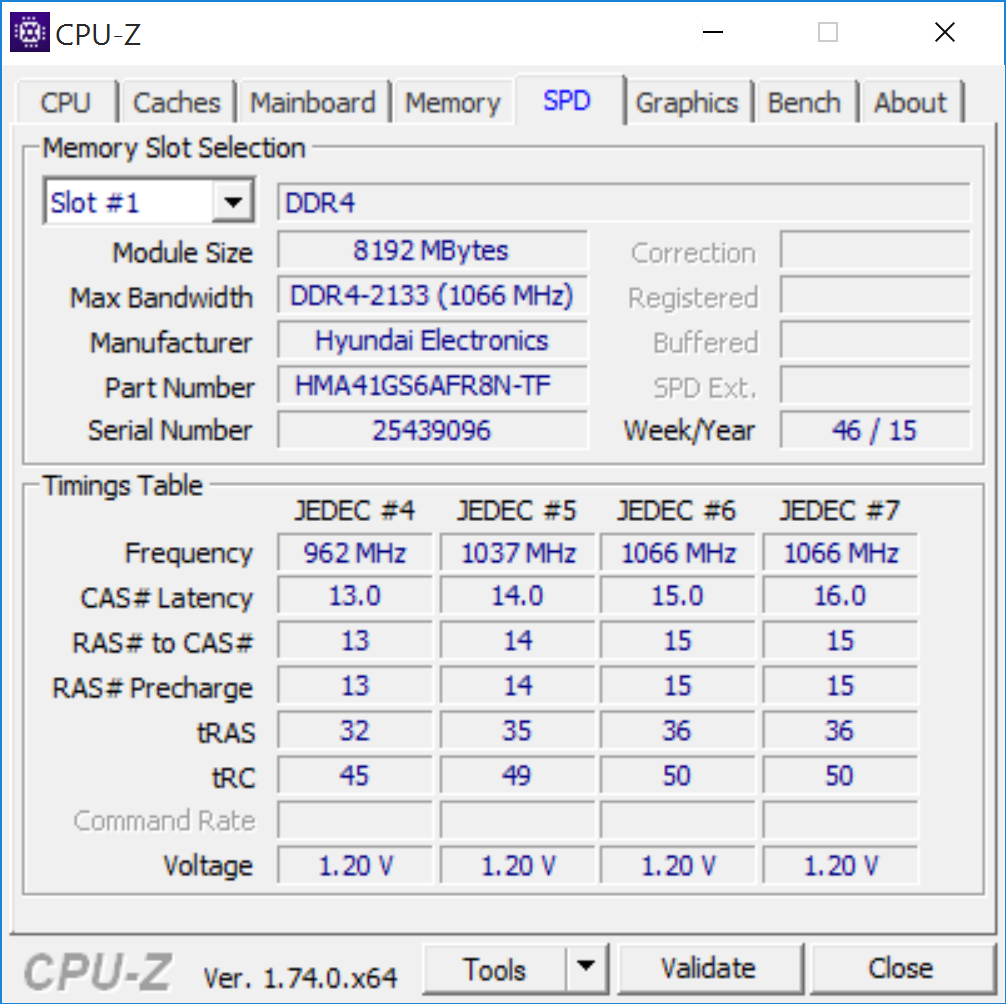
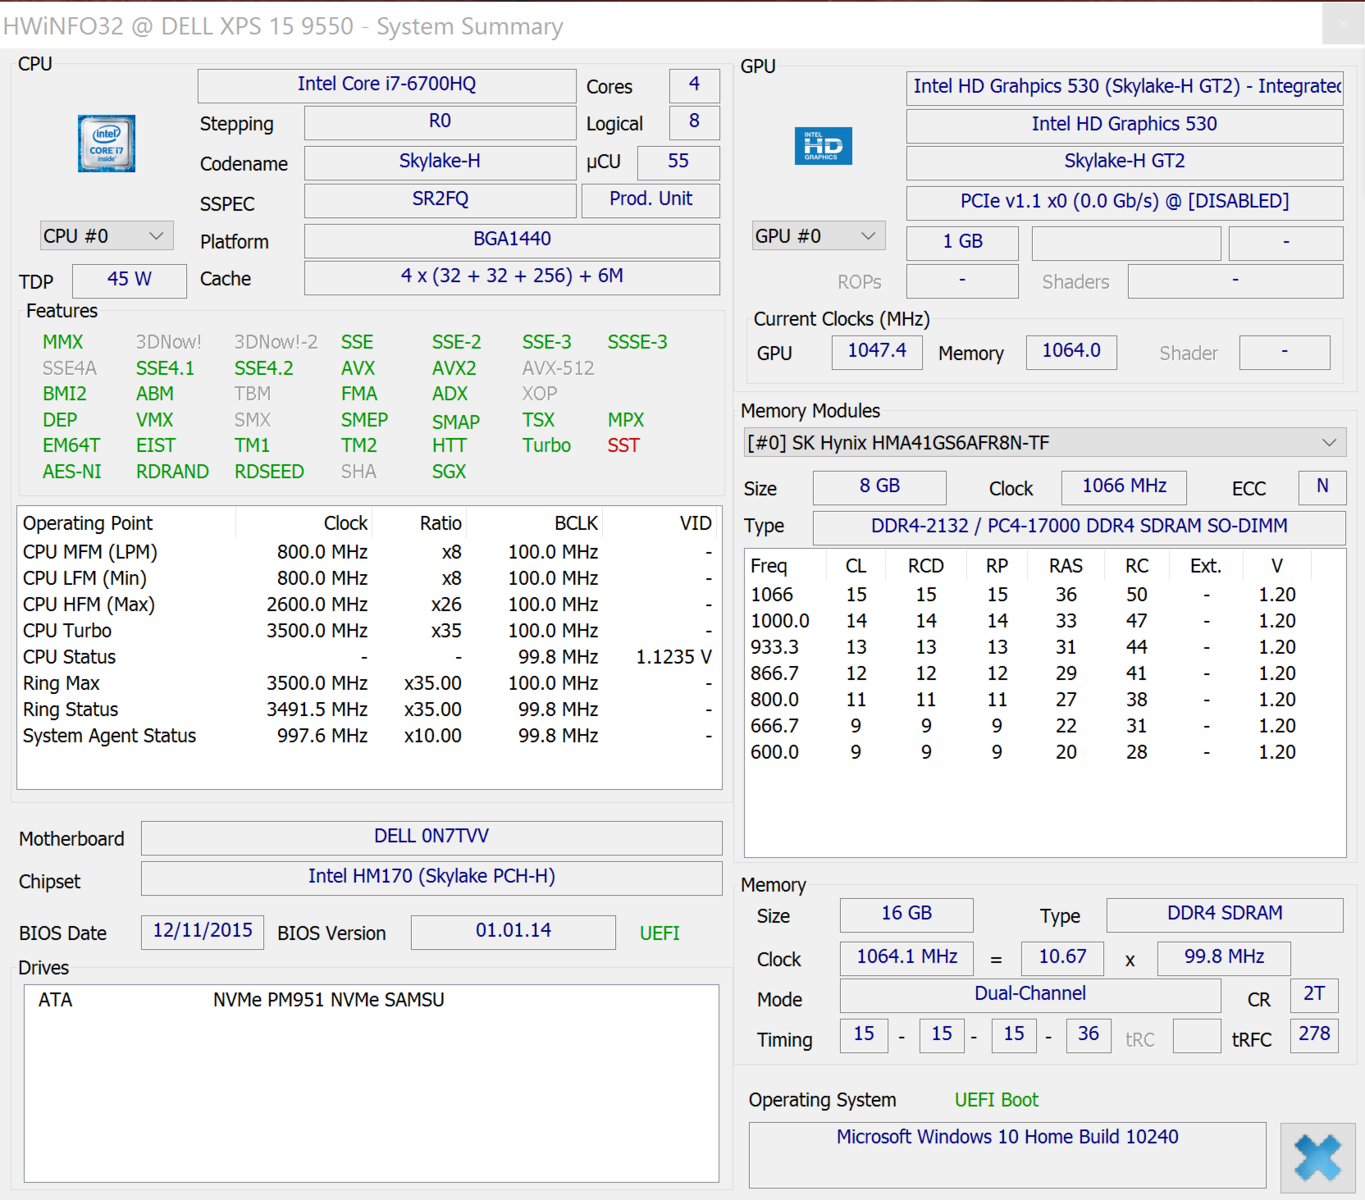
The Intel Core i7-6700HQ with a TDP of 45 Watts is one of the most powerful mobile processors that is currently available for a notebook. Dell advertises its XPS as the "world's lightest 15-inch performance-class laptop." The entry level version uses the i5-6300HQ and a hybrid HDD instead of a real SSD (even though the package manages very good read results). Our current review unit is equipped with a 512 GB NVMe-SSD from Samsung. There is no additional hard drive, because the space is occupied by the bigger 84-Wh battery.
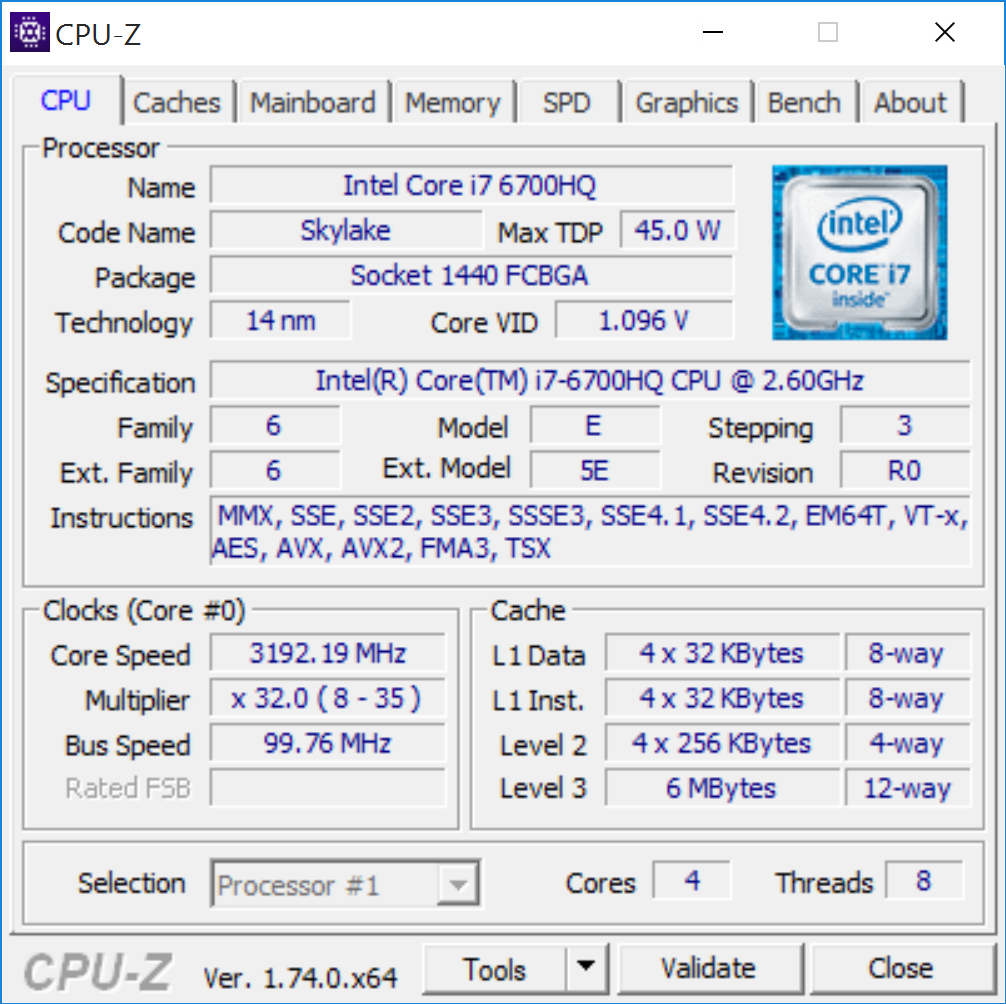
Processor
The mentioned combination of a 6700HQ and NVMe-SSD should also be sufficient for demanding calculations and massive data transfers. Users should be able to expect that for 2,000 Euros (~$2195) though, especially since you can already get the 6700HQ + GTX 960M for around 1,300 Euros (~$1426) in other good notebooks like the Acer Aspire V Nitro Black Edition VN7-792G-74Q4, for example.
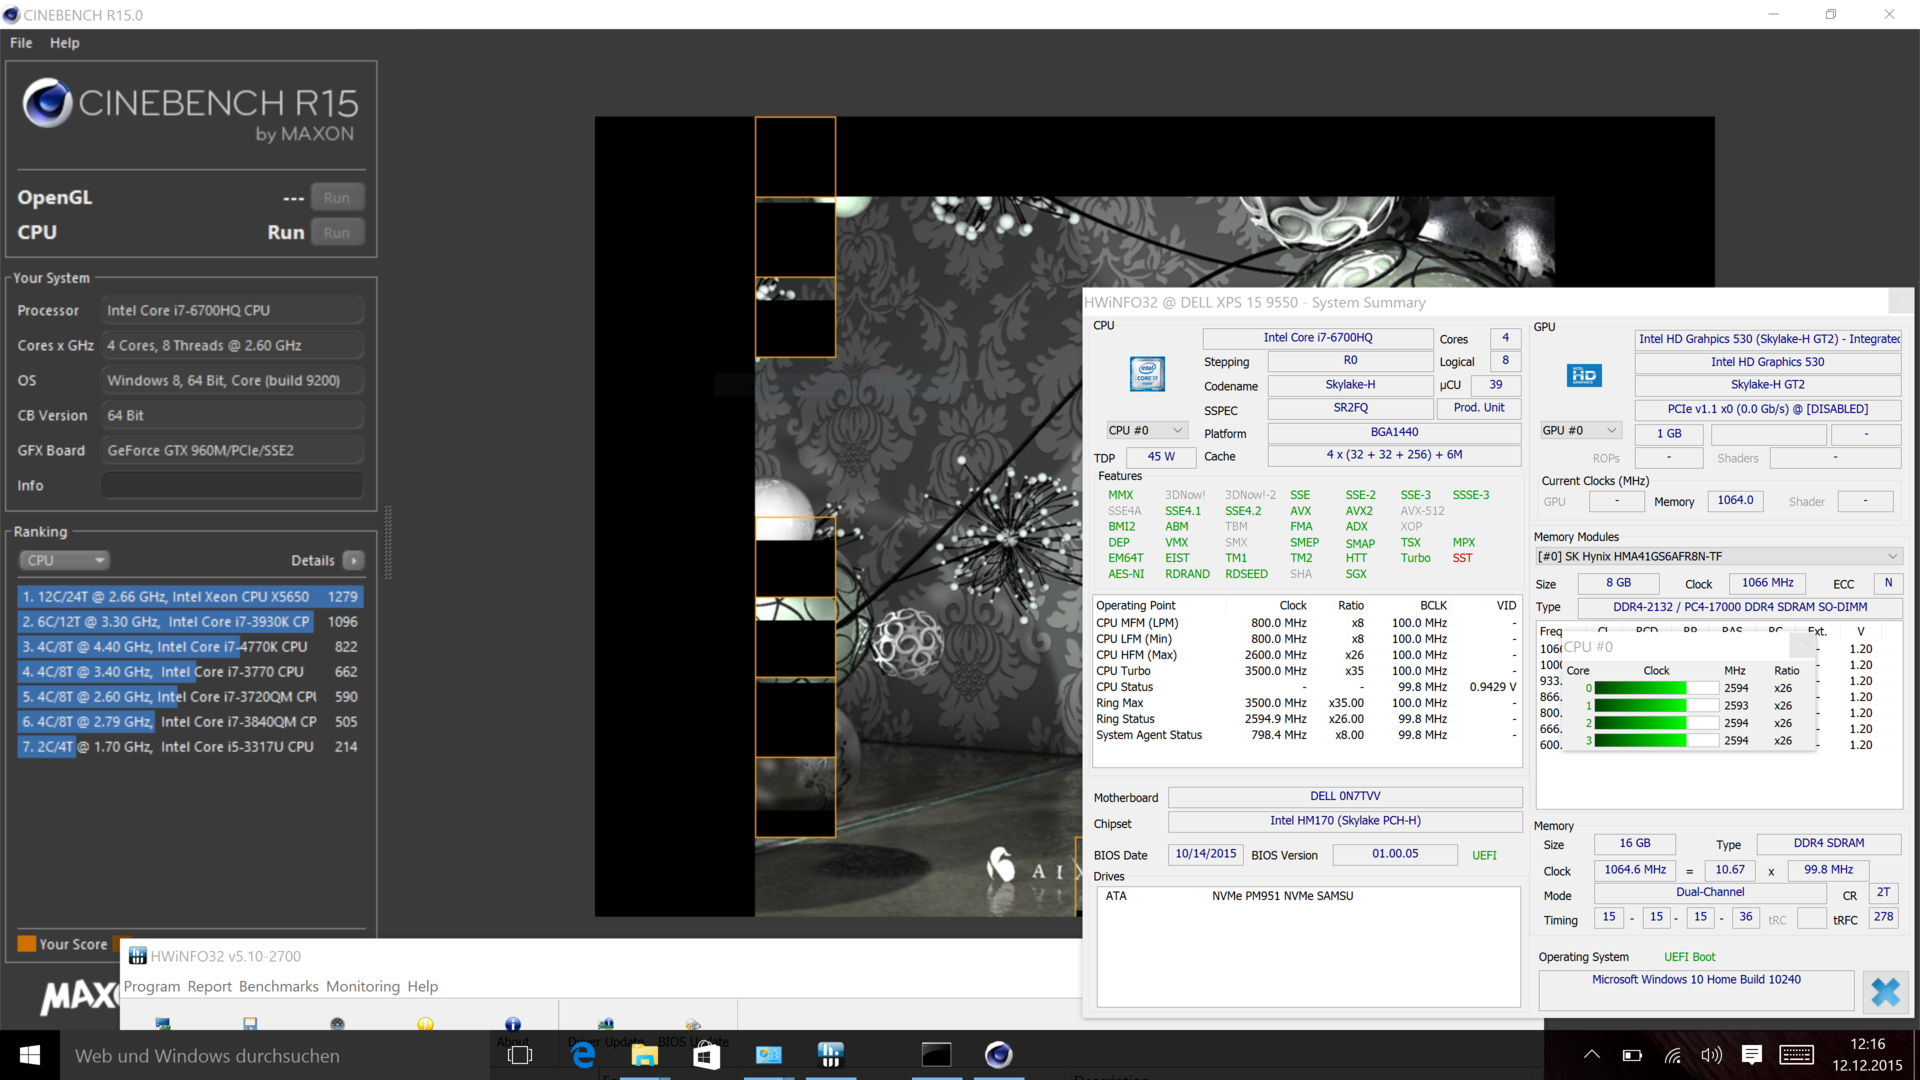
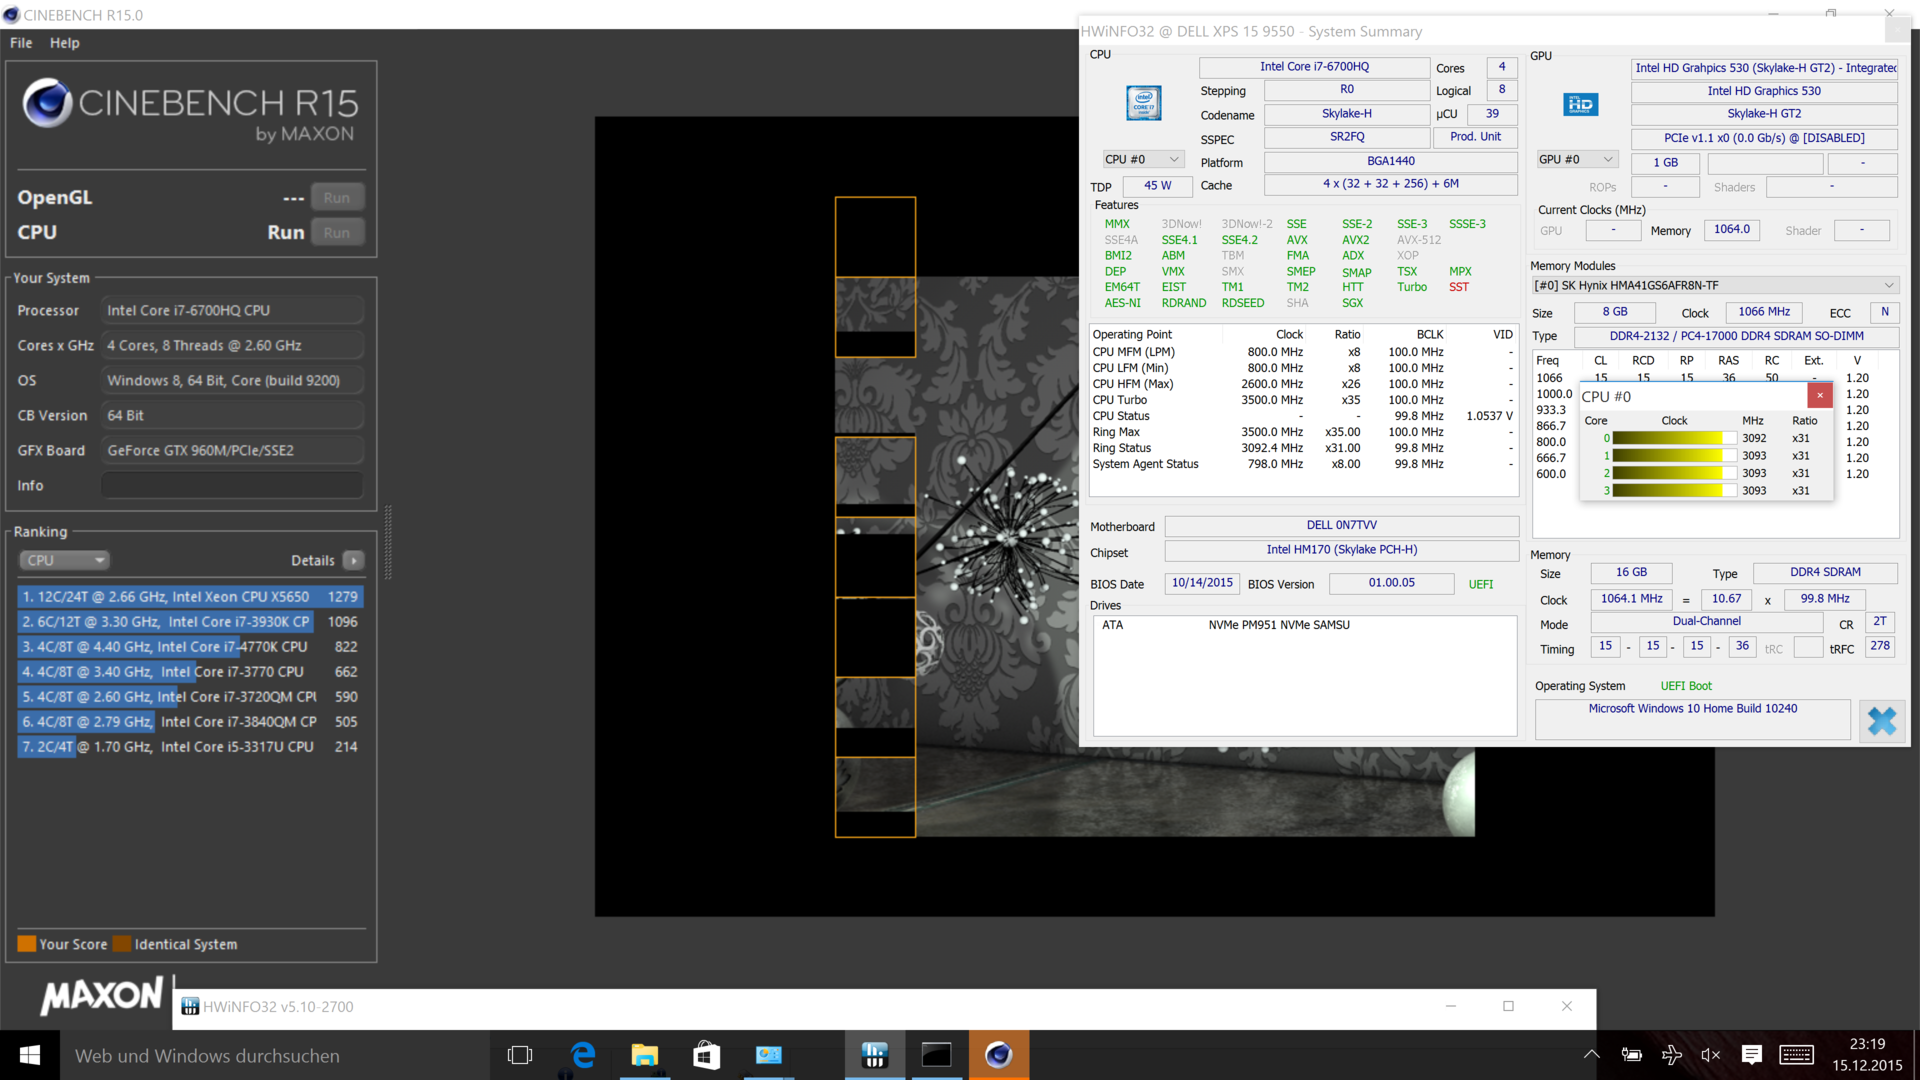
The XPS 15 with the i5-6300HQ obviously comes to mind, which only executed the Cinebench R15 loop at 2.8 GHz (Single and Multi), which shows a bad utilization of the single-core Turbo (-15%). The i5 also throttled to 1.6 GHz on battery power, which was unfortunately not lifted when the PSU was attached (only after standby or restart). Dell is already working on a fix according to the manufacturer.
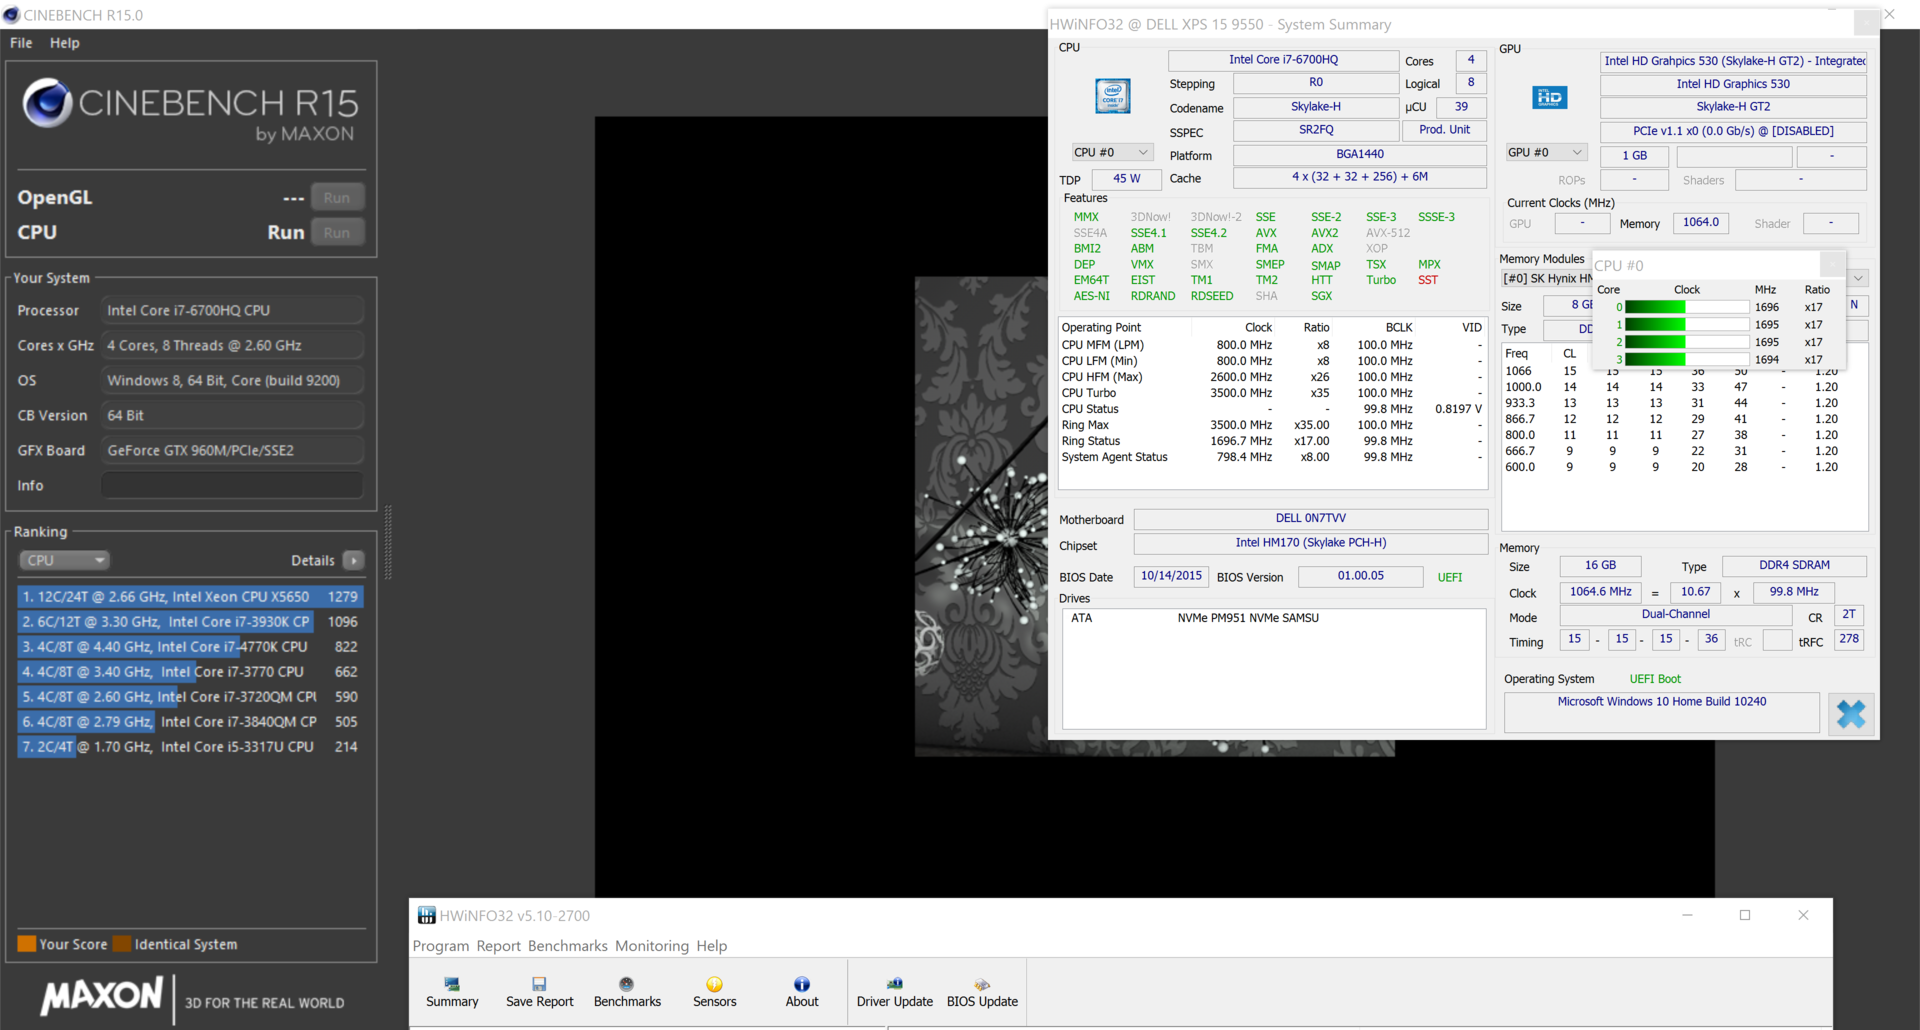
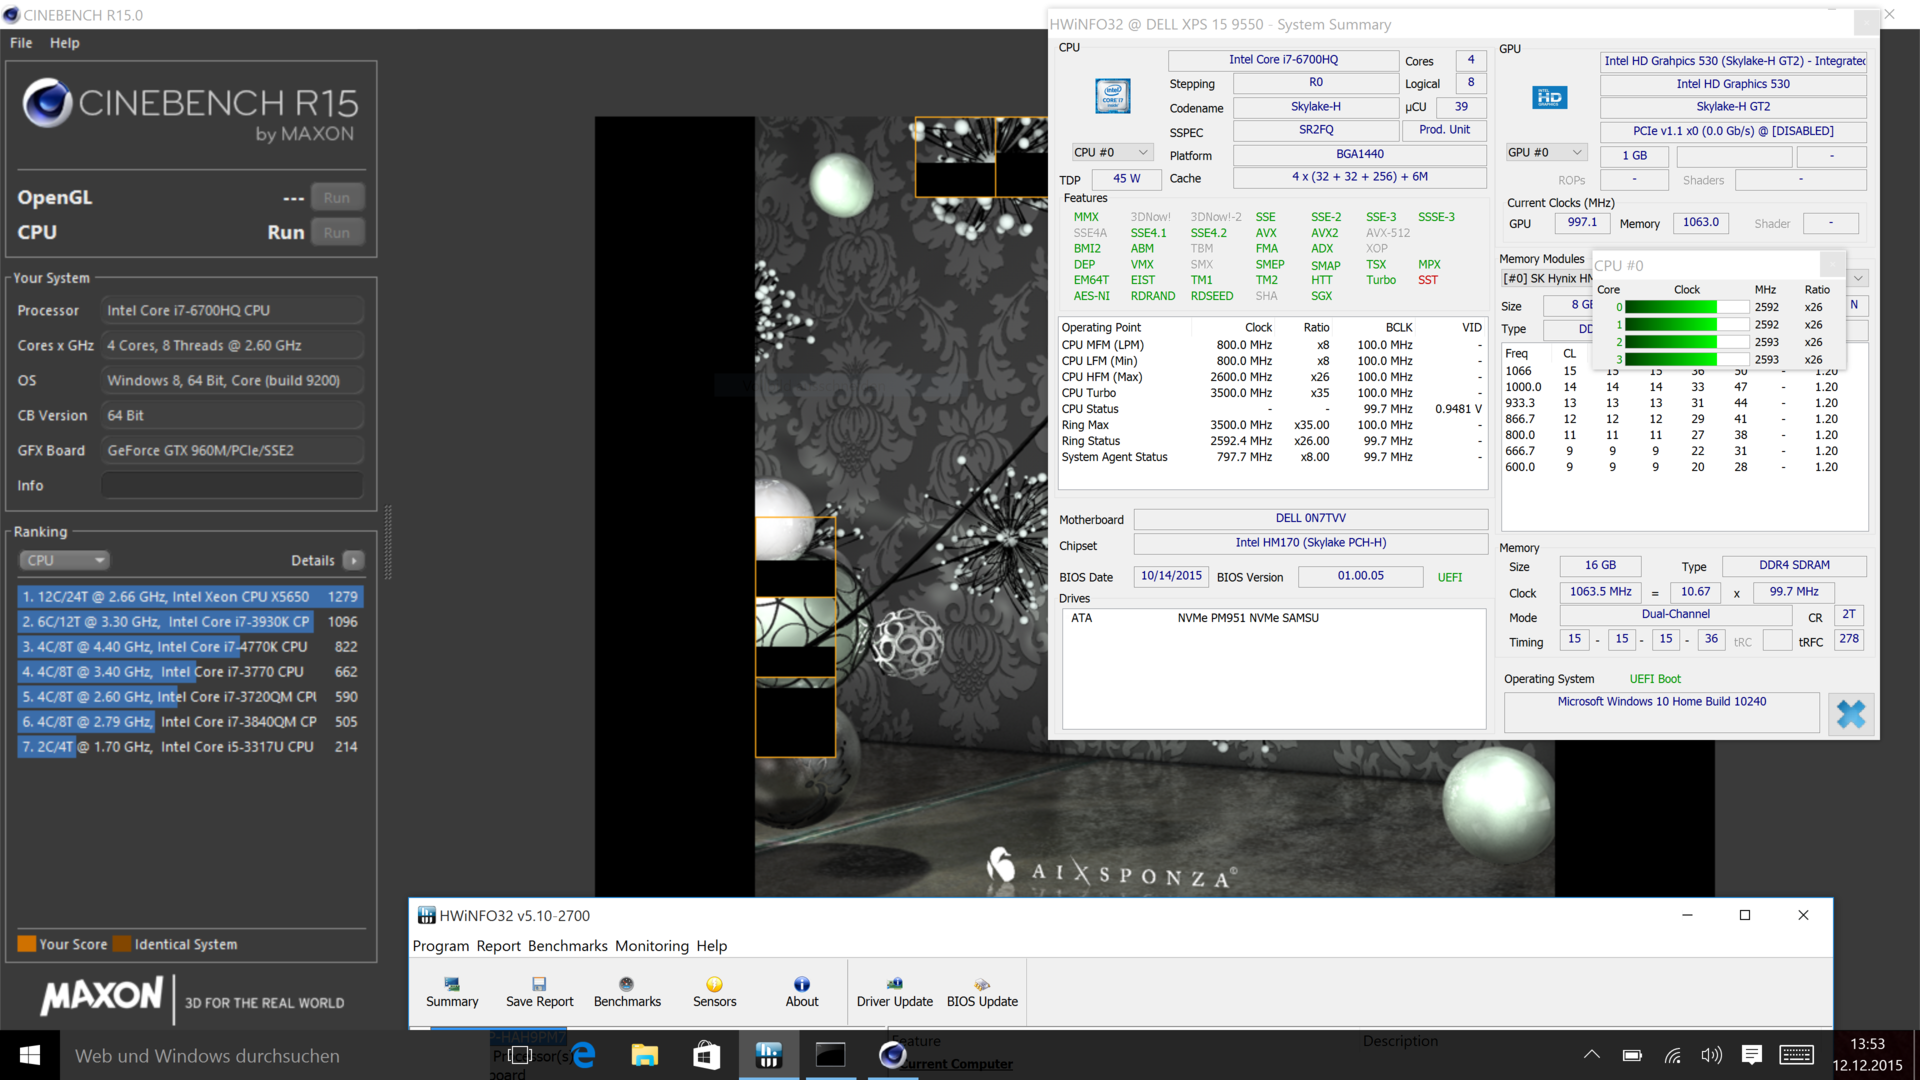
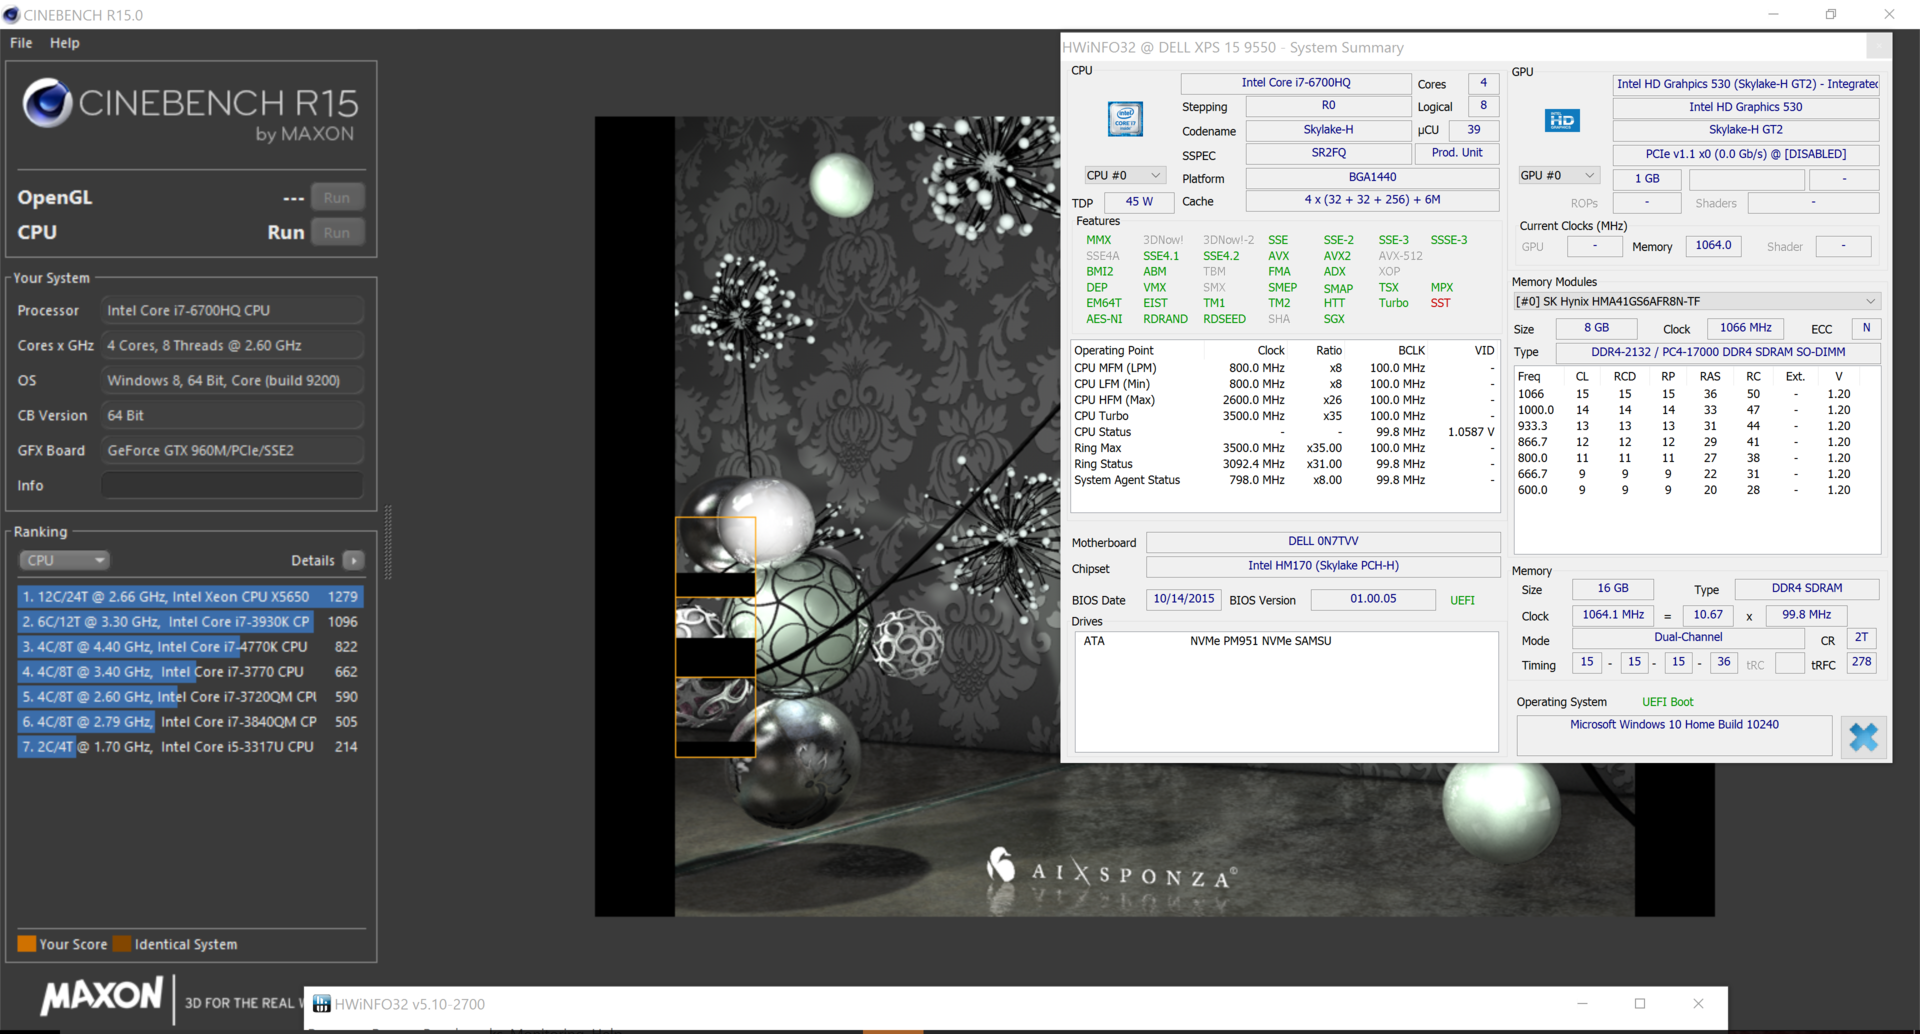
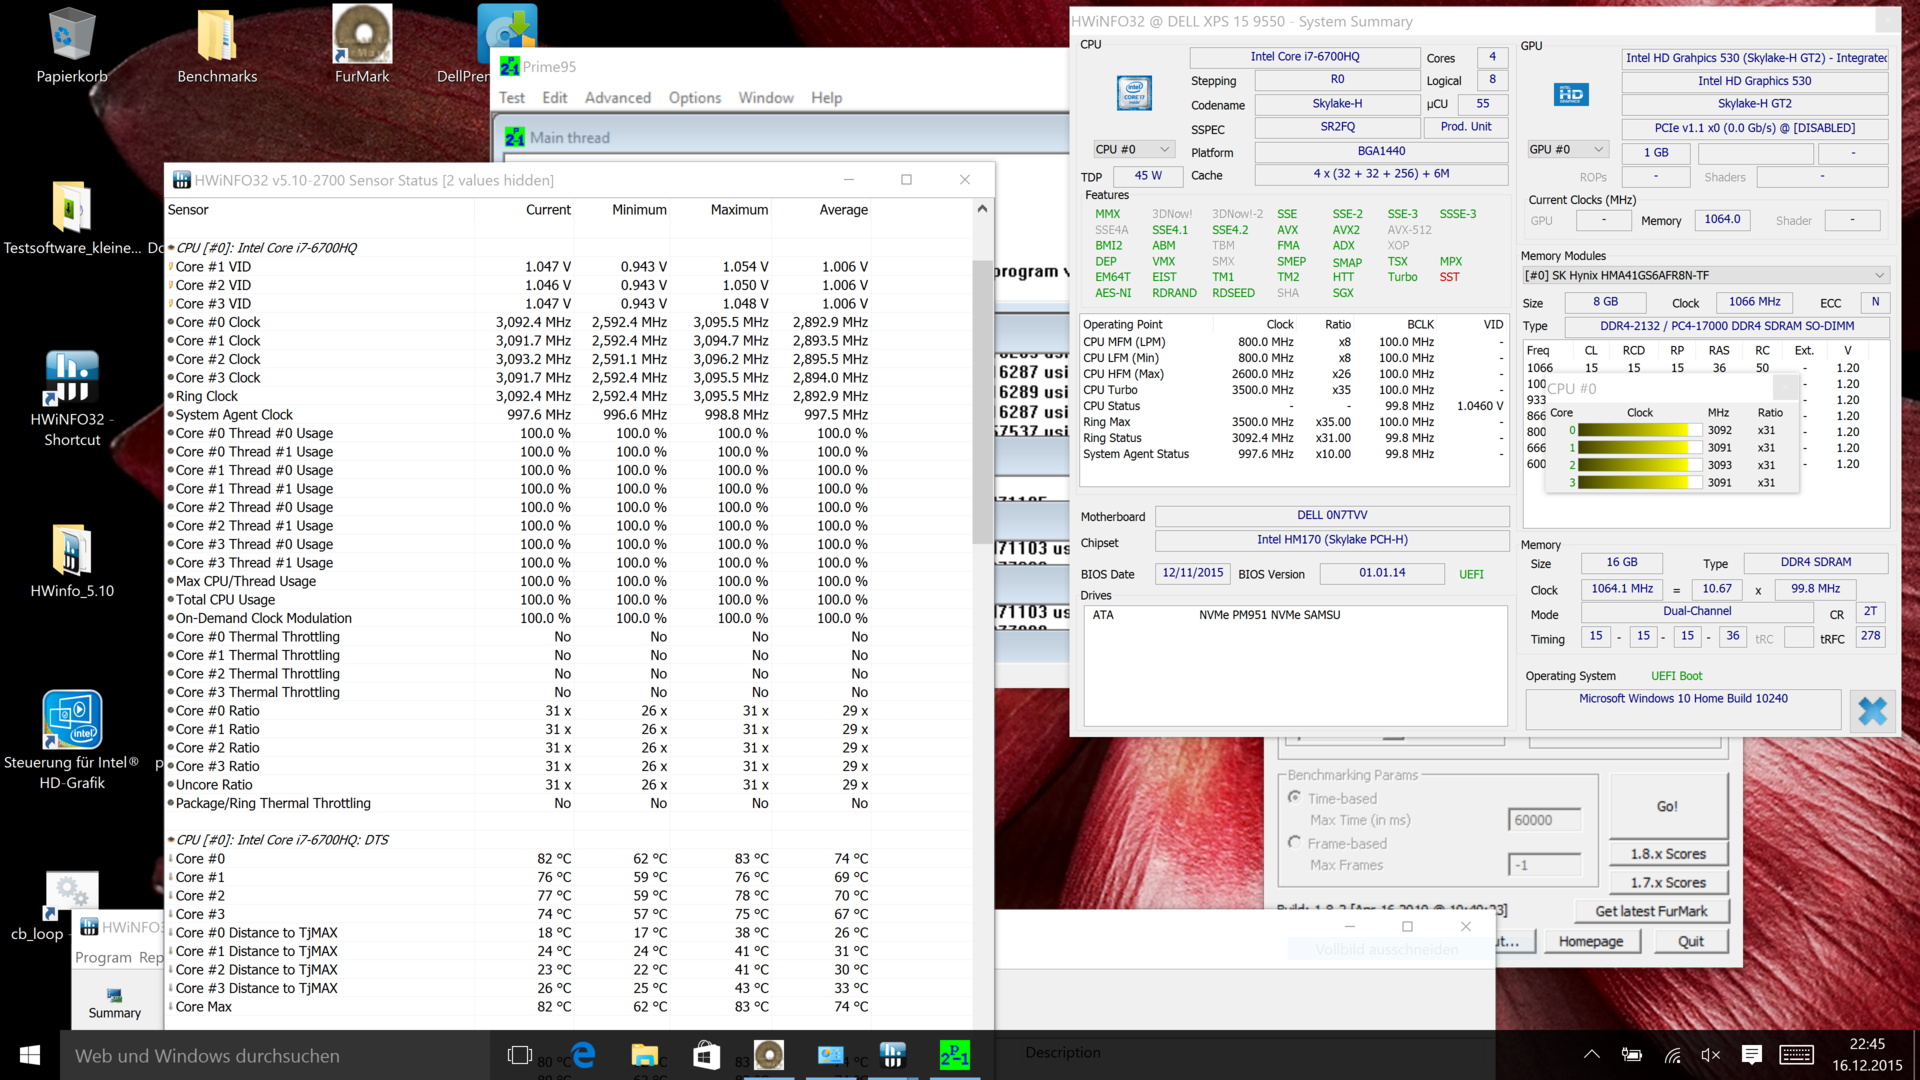
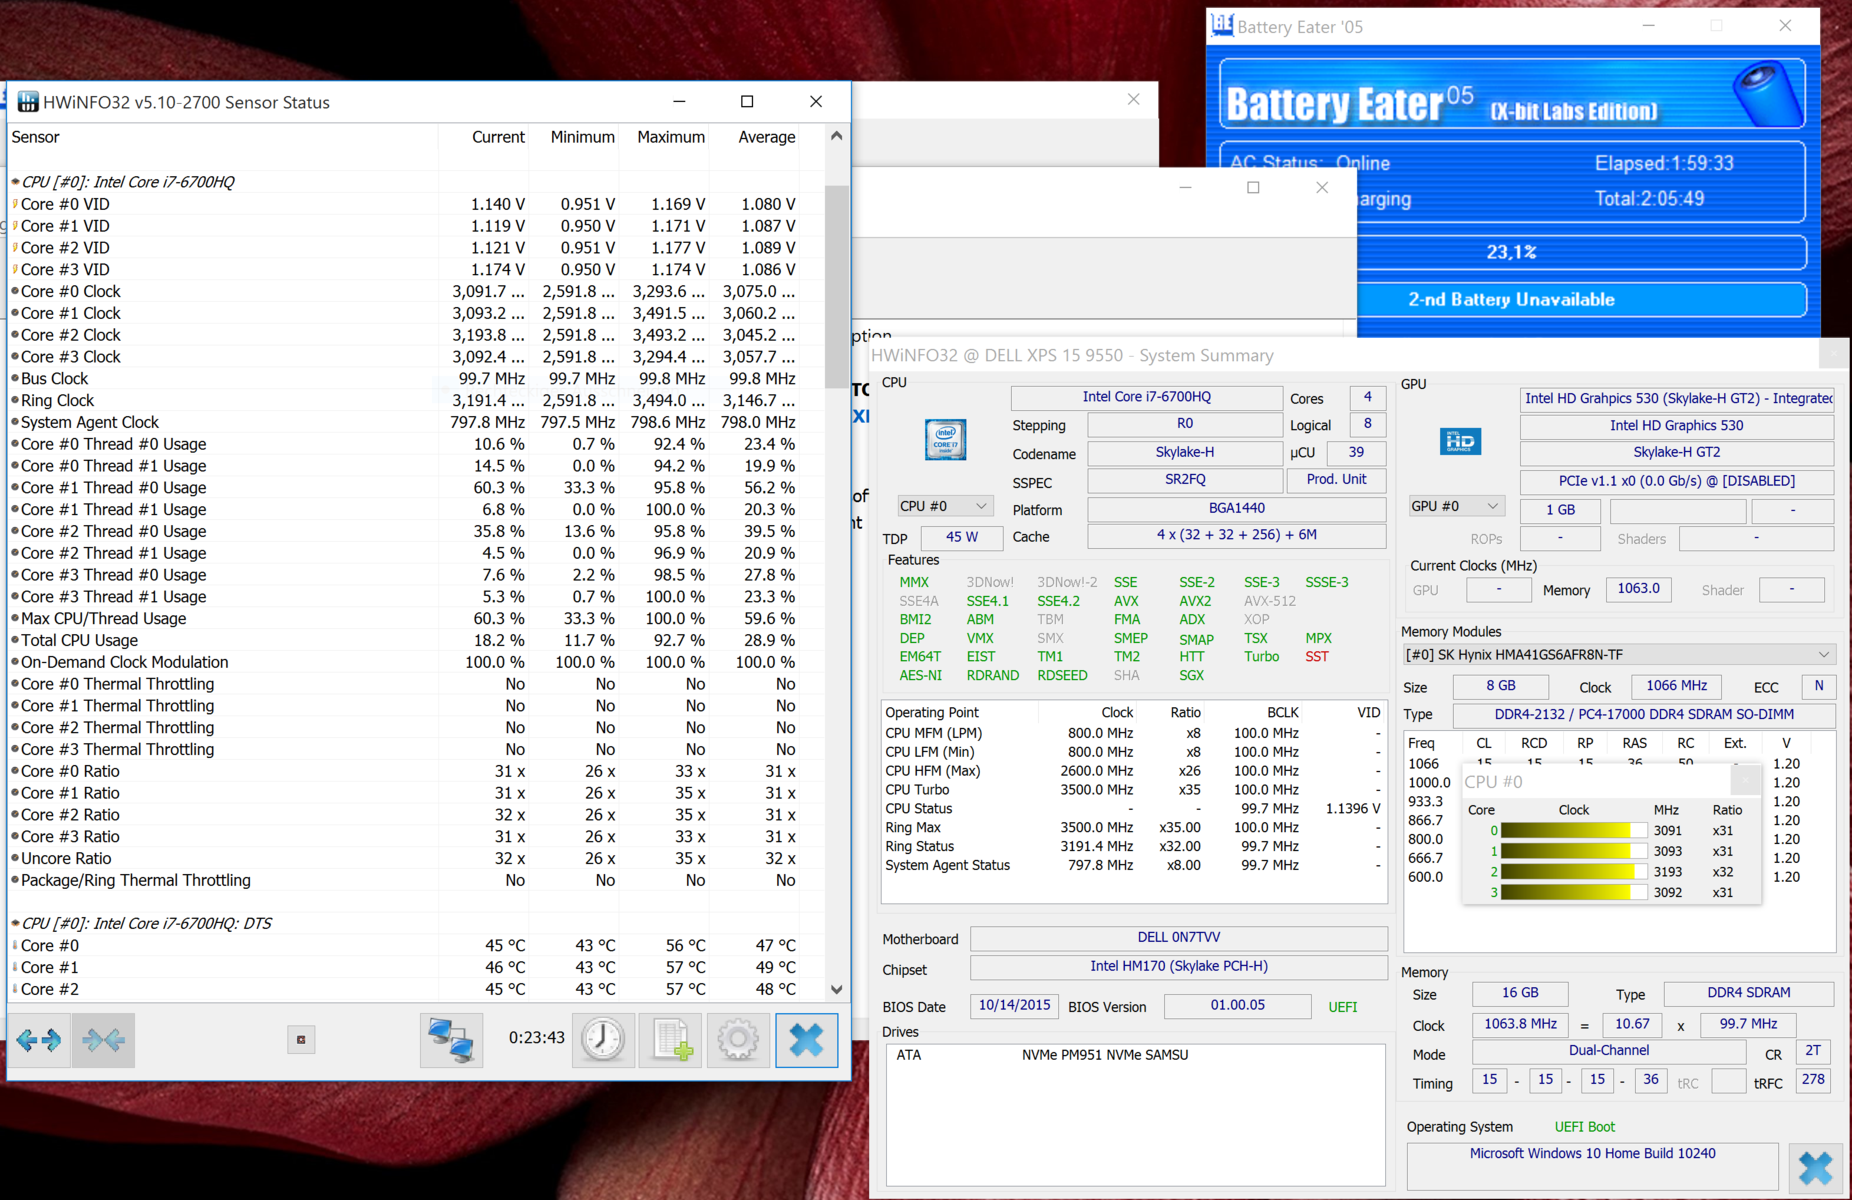
So how does the i7-6700HQ perform, which should be able to hit 3.5 GHz with the Turbo (single-core)? We can see a very agile processor, which not only beats the Haswell 4870HQ of the Apple MacBook Pro Retina 15 but also the identical 6700HQ in the Aspire V Nitro Black Edition VN7-792G-74Q4 (-5%). This is the case in all Cinebench Single-Tests. Our XPS is on par with the Nitro Black Edition in the Multi-Test; our tools show 3.1 GHz.
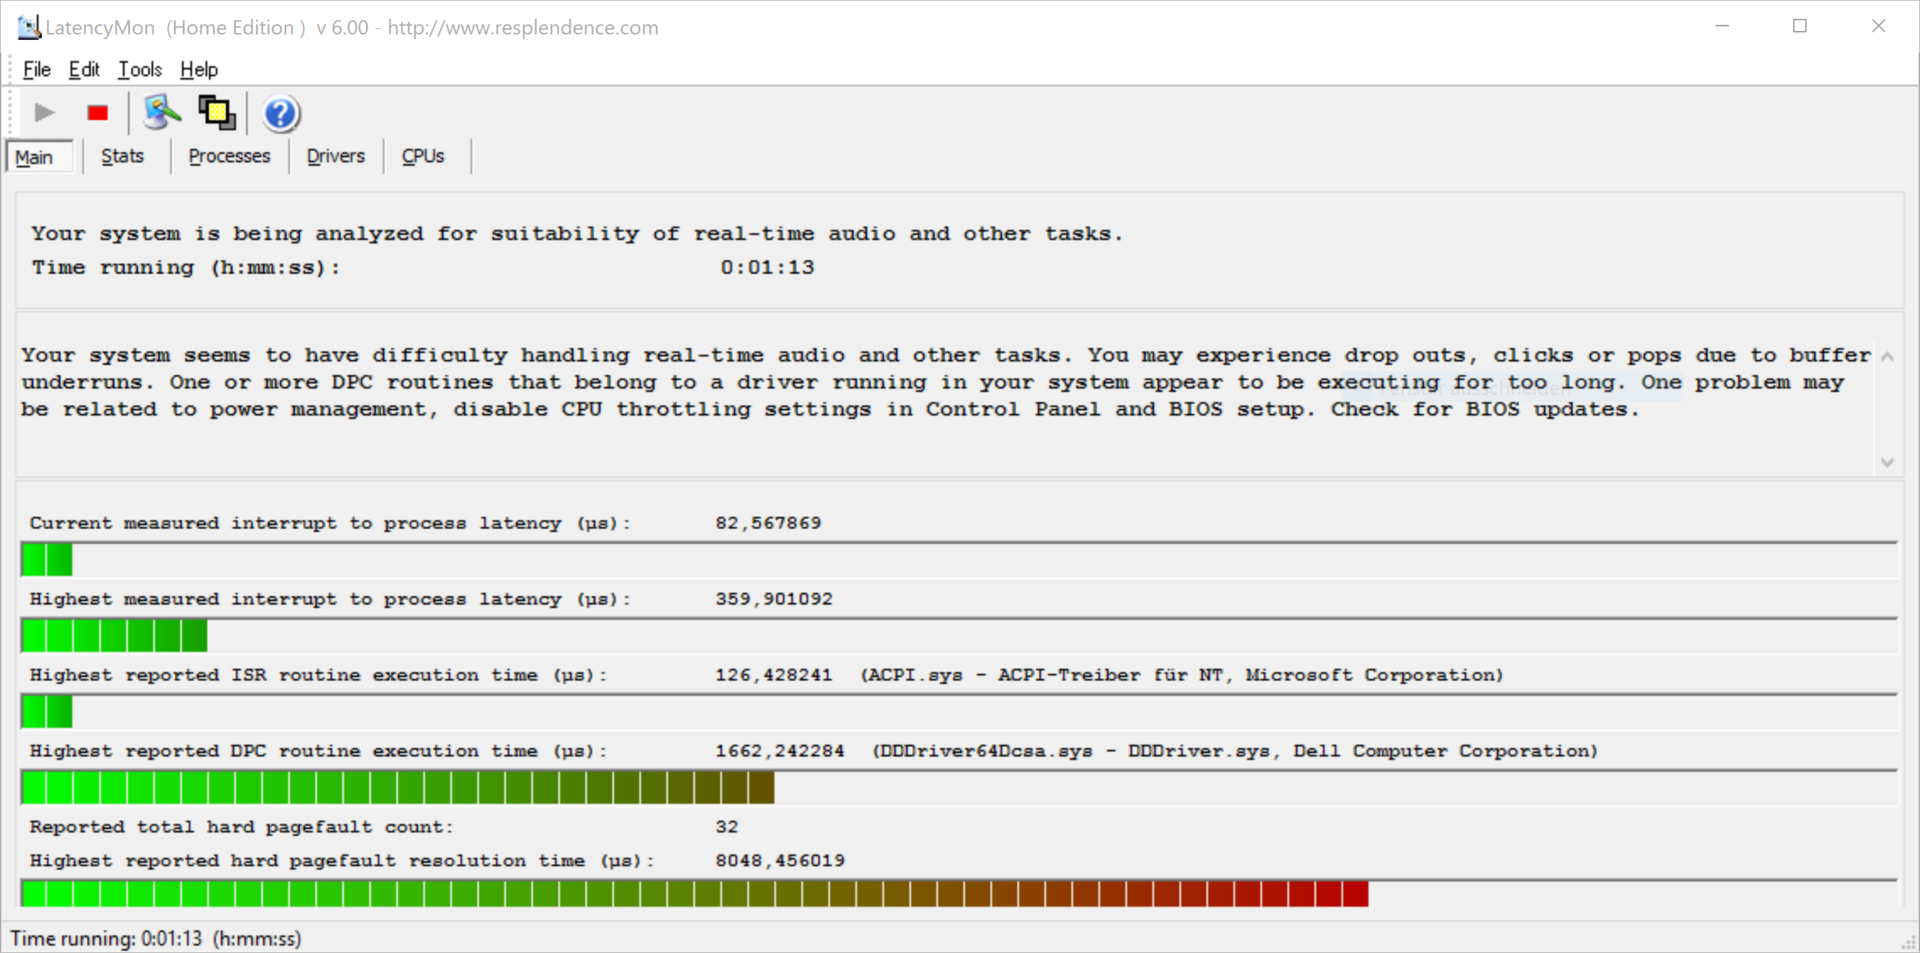
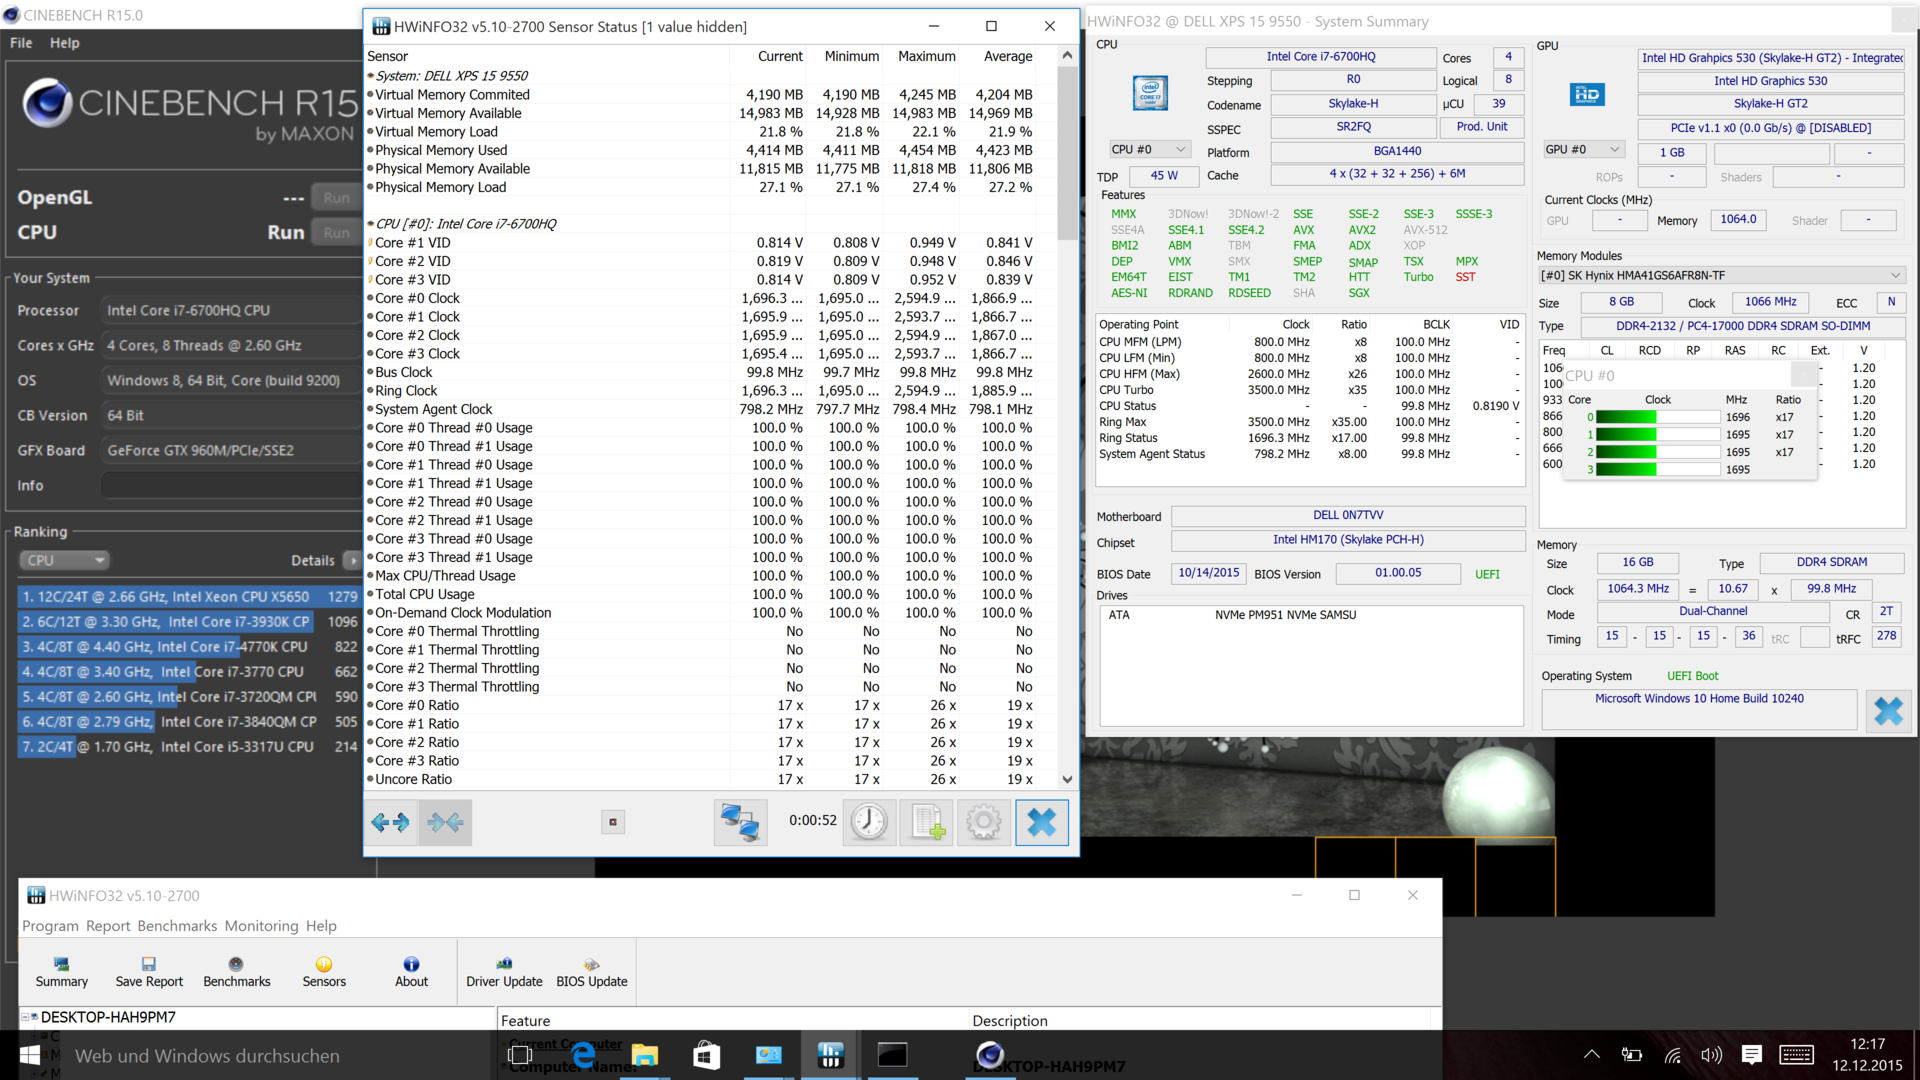
The i7 runs at the nominal clock of 2.6 GHz on battery power. Unfortunate, but still better than the i5 version with its throttled 1.6 GHz. The transition to mains (attach the connector) is, however, a bit bumpy. We have no other way to describe the following 1.6/1.7 GHz in this case. This is not related to temperature limits, because the throttled clock is quickly increased to 3.1 GHz after the stress test. More information about the stress test is available in the section "Emissions."
The clocks on battery power only change after the BIOS update to 1.1.14. The R15 Multi now runs at 3.1 until the battery is empty! This is the case after around one hour. Officially, the BIOS update only covers the NVMe sleep mode (should improve battery runtimes), but we only noticed an unlimited Turbo Boost. The return to the PSU is now as it should be as well: 800 MHz for one second, after that 3.1 GHz. The clock drops to 800 MHz after you pull the plug, just to climb back to 3.1 GHz step by step within 20 seconds.
System Performance
We use the PCMarks to evaluate the application performance. The impression is pretty mixed when we compare the results with the i5/hybrid model. As expected, PCMark 7 is pretty thrilled about any SSD. The review unit does not take the lead in every sub test, but it is on par with the leading devices Zenbook Pro UX501JW, Dell XPS 15 (9530-0538) and Apple MacBook Pro Retina 15. This is different in the sub-scores of PCMark 7, where the Dell XPS 15-9550 i7 can fall behind by 17%. By far the best device in PCMark 7 is the HP Omen Pro 15 with its Samsung SSD XP941. Noticeably bad is the Productivity score, where the Samsung PM951 NVMe is 56% behind the leader, which does not change when we repeat the test.
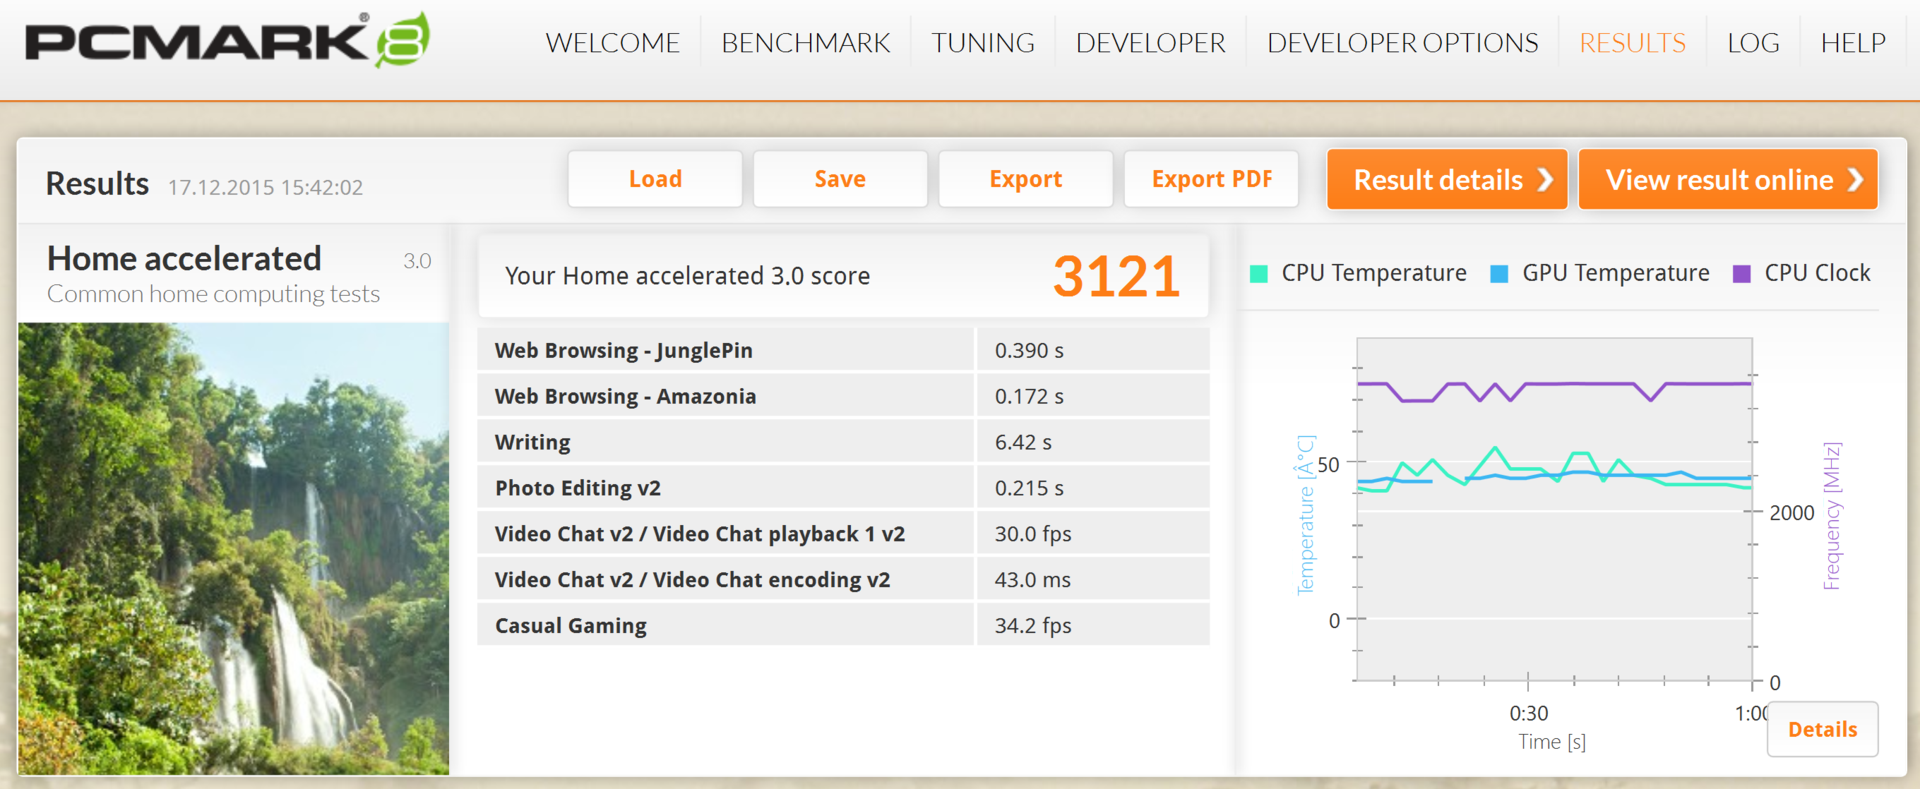
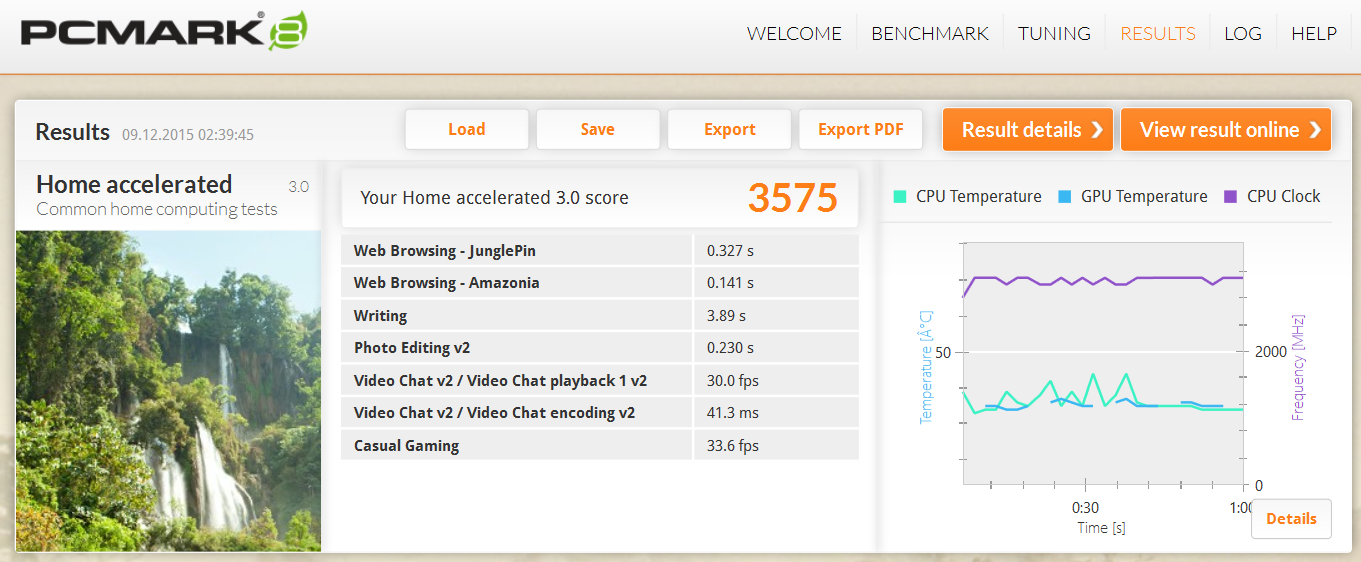
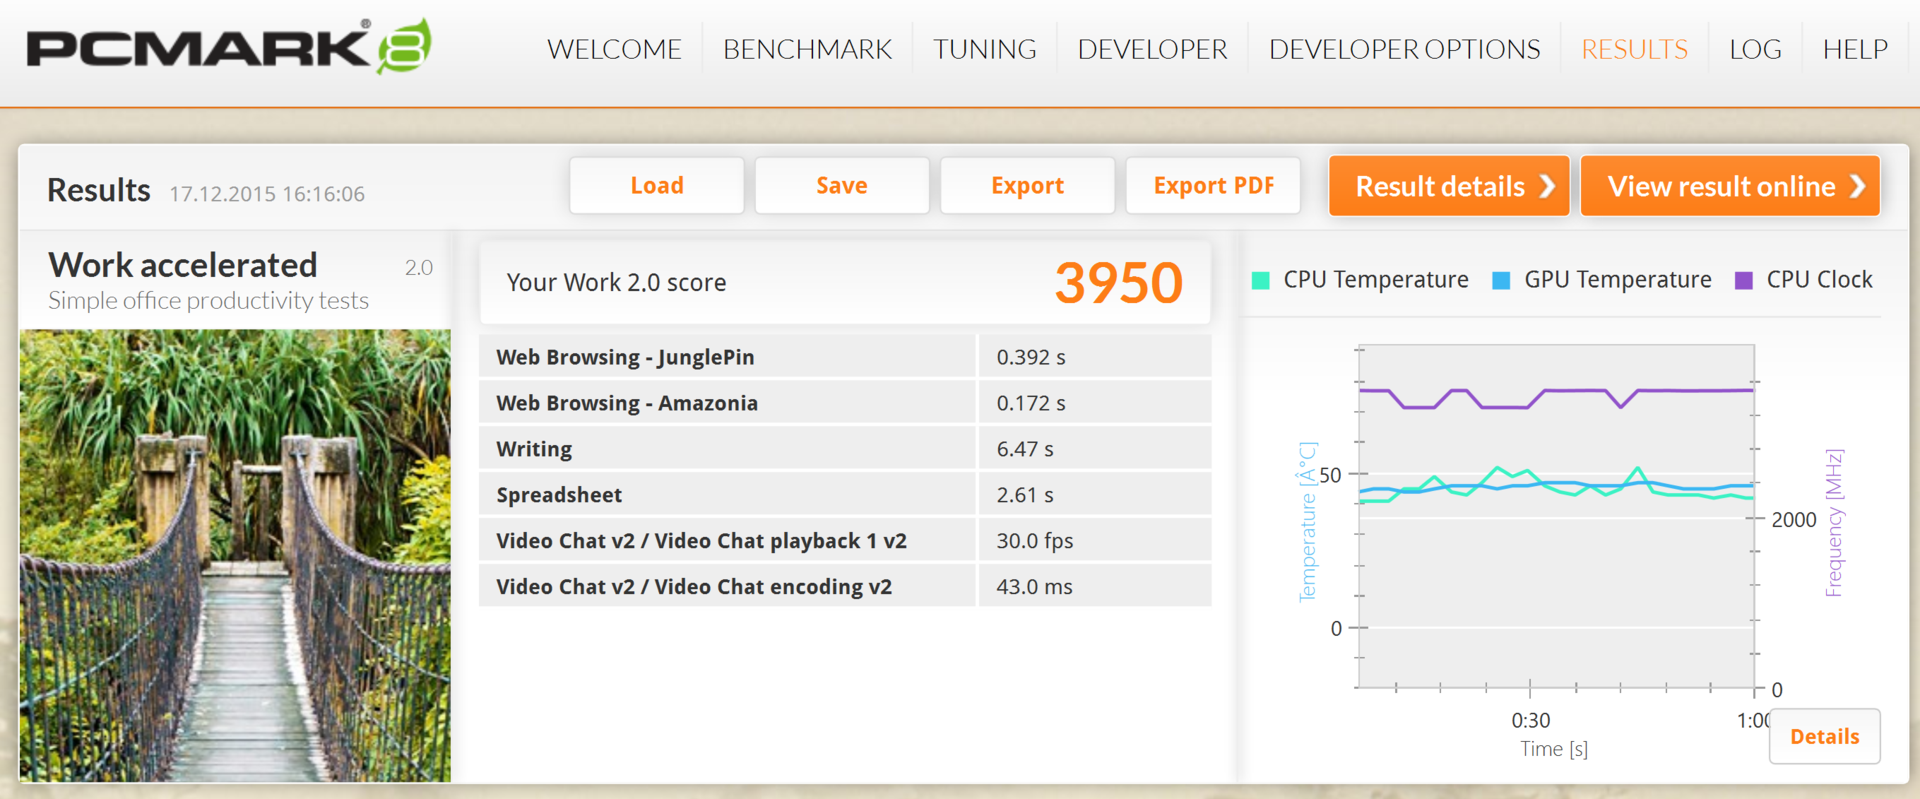
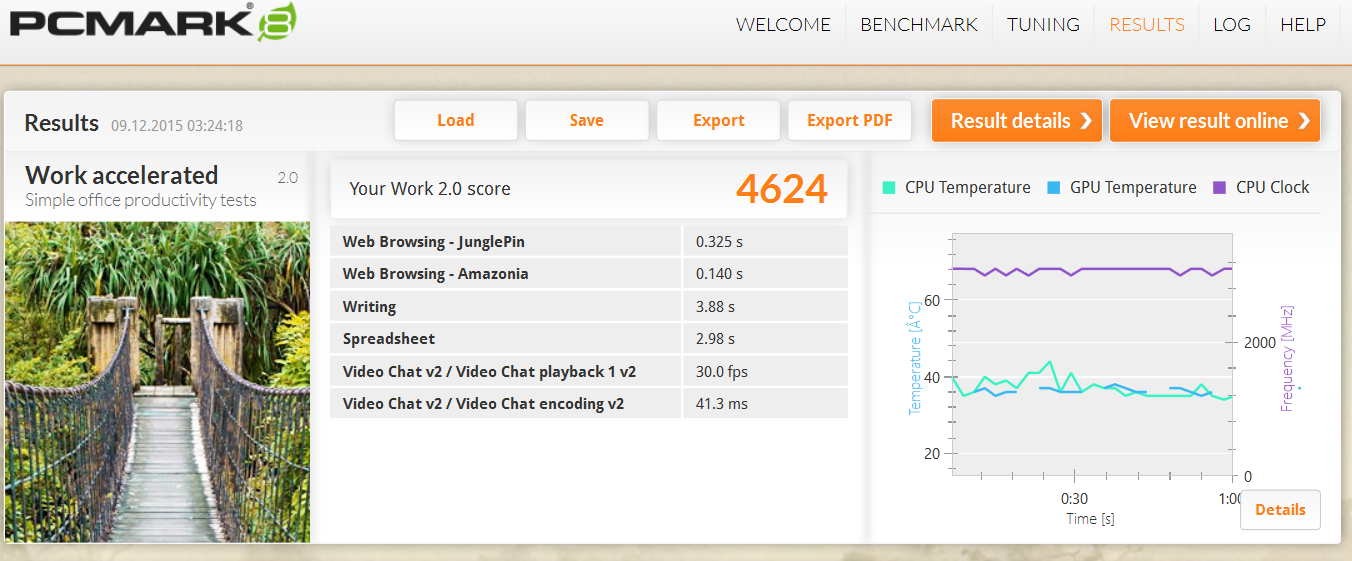
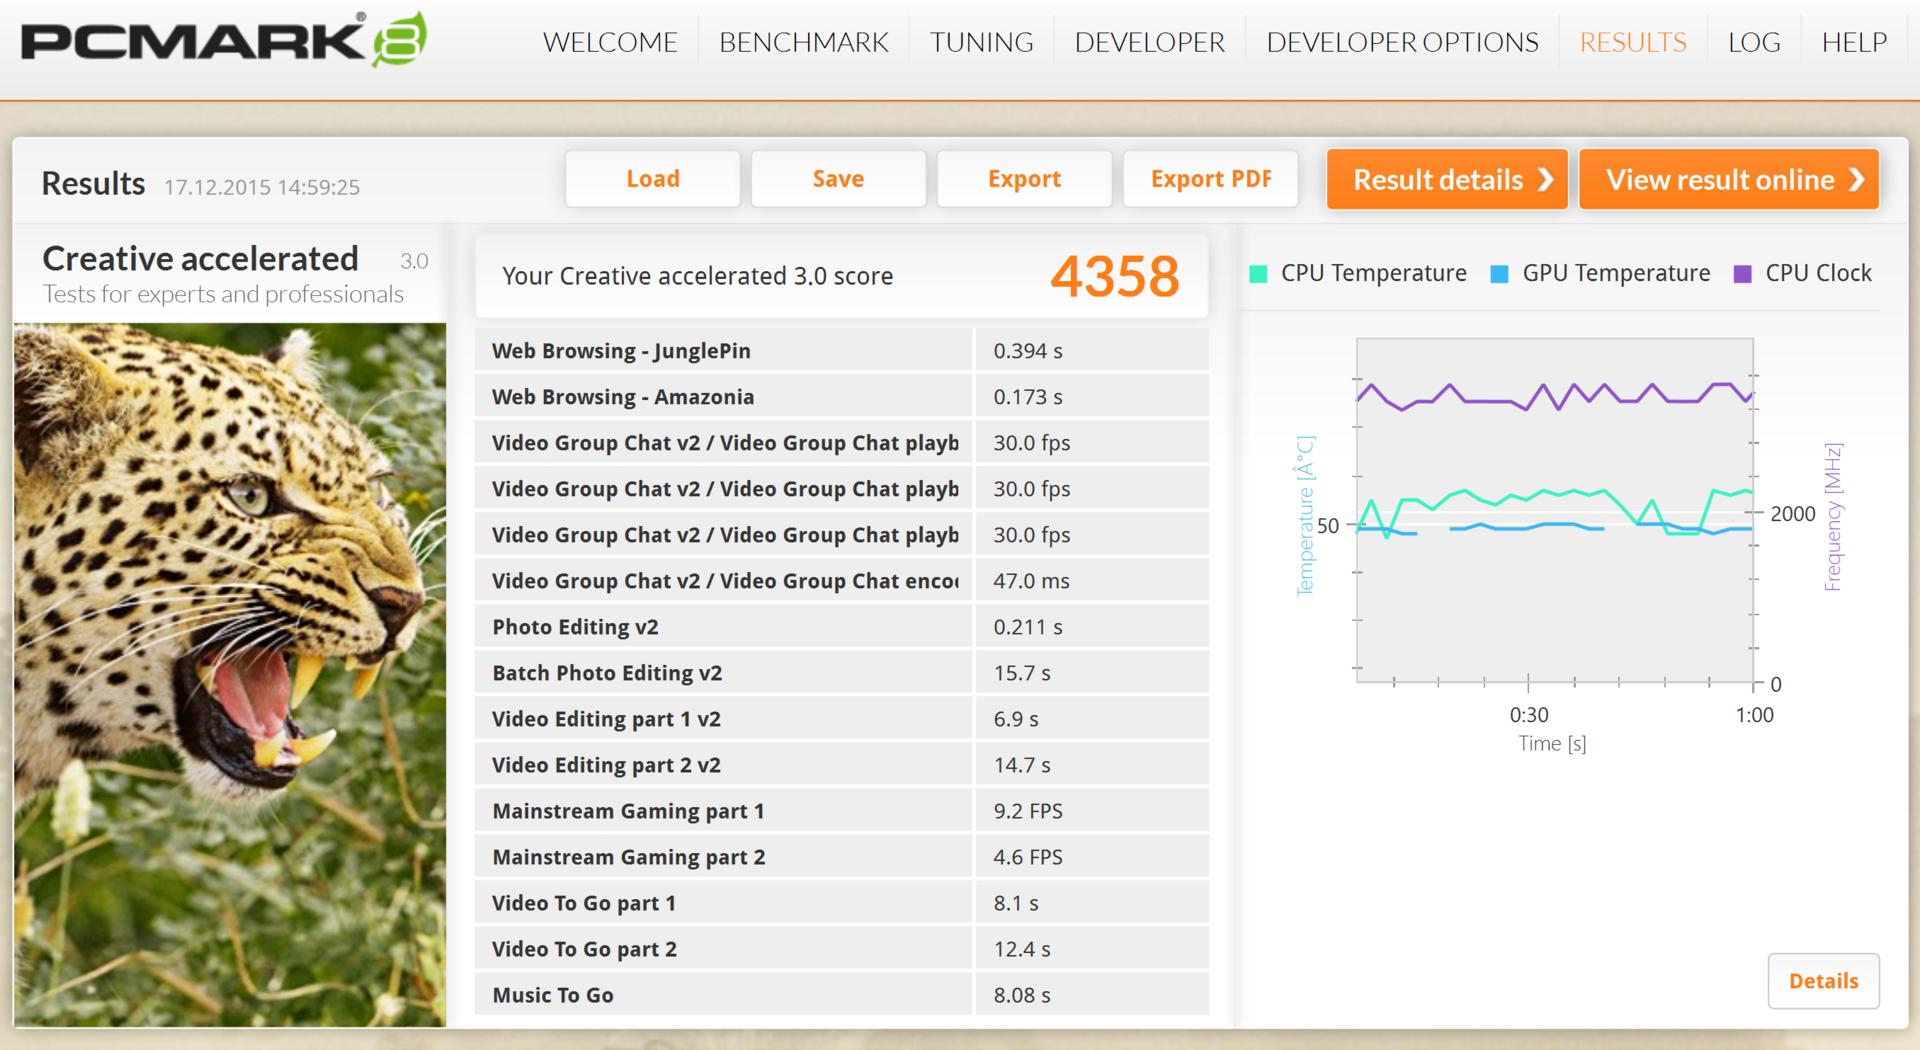
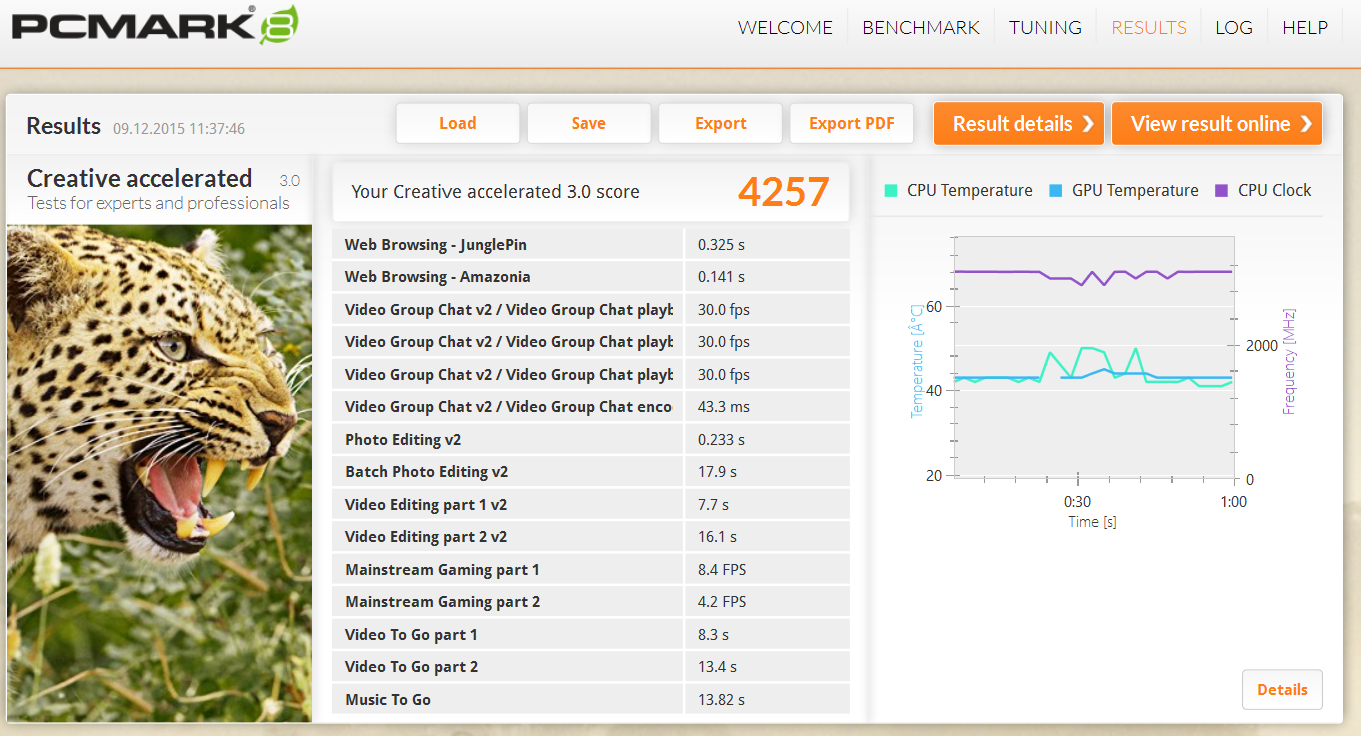
PCMark 8 was more balanced in the past; it showed a more harmonious picture between the SSD-based review units. The XPS 15 NVMe cannot take lead in this test, either, and it once again falls behind the HP Omen and Apple MacBook Pro Retina 15 (Productivity), respectively. The good result of the XPS 15 HDD hybrid model is interesting because it is only 11 and 18% behind the NVMe model in the Creative and Home scores. We already noticed the exceptionally good results of the entry-level version in the other review. Dell equipped the M.2 slot with a separate cache SSD and then called it a RAID array.
| PCMark 7 Score | 5480 points | |
| PCMark 8 Home Score Accelerated v2 | 3121 points | |
| PCMark 8 Creative Score Accelerated v2 | 4358 points | |
| PCMark 8 Work Score Accelerated v2 | 3950 points | |
Help | ||
Storage Devices
The Samsung PM951 NVMe (512 GB, AHCI PCIe M.2, MZHPV512HDGL) sits in the M.2 slot and is connected via PCI Express Gen3 x4. Samsung advertises read and write speeds of up to 2,150 and up to 1,500 MB/s for the PM951 NVMe. CrystalDiskMark 3.0 and AS SSD are not that optimistic, but 1,274 or 1,568 MB/s are still among the best results we've determined in a notebook so far. The superiority is also supported by the 4K tests, where the Samsung SSD can beat all the comparison devices. Even the HP Omen Pro, which leads the PCMark results together with the MacBook Pro Retina 15 (2015/05), is surpassed in AS SSD. We did not show the Omen here due to the lack of CrystalDiskMark scores.
The performance of the NVMe-SSD can drop on battery power, but only in the energy-saving mode. The results in AS SSD and CrystalDiskMark with the "High-Performance" power profile were identical within measuring tolerances.
| Dell XPS 15-9550 i7 GeForce GTX 960M, 6700HQ, Samsung PM951 NVMe 512 GB | Dell XPS 15 2016 9550 GeForce GTX 960M, 6300HQ, WDC WD10SPCX-75KHST0 + LiteON CS1-SP32-11 M.2 2242 32GB | Apple MacBook Pro Retina 15 inch 2015-05 Radeon R9 M370X, 4870HQ, Apple SSD SM0512G | Asus Zenbook Pro UX501JW-FI218H GeForce GTX 960M, 4720HQ, SanDisk SD7SN3Q128G1002 | Lenovo IdeaPad Y50-70-59441229 GeForce GTX 960M, 4710HQ, Samsung SSD PM851 256 GB MZ7TE256HMHP | Lenovo IdeaPad Y50-70 (59424712) GeForce GTX 860M, 4710HQ, Samsung SSD PM851 512 GB MZ7TE512HMHP | |
|---|---|---|---|---|---|---|
| CrystalDiskMark 3.0 | -60% | 29% | -37% | -38% | -35% | |
| Read Seq (MB/s) | 1274 | 238.6 -81% | 1442 13% | 471.9 -63% | 518 -59% | 480.1 -62% |
| Write Seq (MB/s) | 594 | 64 -89% | 1558 162% | 347 -42% | 264.8 -55% | 430.9 -27% |
| Read 4k (MB/s) | 37.02 | 31.36 -15% | 19.27 -48% | 31.19 -16% | 32.29 -13% | 24.36 -34% |
| Read 4k QD32 (MB/s) | 457.9 | 199.5 -56% | 403.1 -12% | 331.8 -28% | 341.2 -25% | 385.7 -16% |
| AS SSD | -94% | 22% | -46% | -52% | -47% | |
| Score Read (Points) | 1166 | 24 -98% | 793 -32% | 388 -67% | 420 -64% | 358 -69% |
| Score Write (Points) | 694 | 10 -99% | 517 -26% | 294 -58% | 185 -73% | 343 -51% |
| 4K Read (MB/s) | 34.63 | 1.53 -96% | 19.3 -44% | 29.14 -16% | 28.36 -18% | 22.69 -34% |
| 4K Write (MB/s) | 105.6 | 0.98 -99% | 29 -73% | 67.6 -36% | 64.5 -39% | 62.5 -41% |
| Seq Read (MB/s) | 1569 | 122.2 -92% | 1550 -1% | 485.9 -69% | 501 -68% | 495 -68% |
| Seq Write (MB/s) | 562 | 77.6 -86% | 1441 156% | 325.6 -42% | 249.4 -56% | 414.8 -26% |
| Copy ISO MB/s (MB/s) | 716 | 15.75 -98% | 1395 95% | 374.3 -48% | 329.1 -54% | 418.2 -42% |
| Copy Program MB/s (MB/s) | 318.4 | 42.24 -87% | 608 91% | 249.8 -22% | 200.6 -37% | 225.1 -29% |
| Copy Game MB/s (MB/s) | 785 | 66.4 -92% | 1014 29% | 375 -52% | 316.5 -60% | 261.3 -67% |
| Total Average (Program / Settings) | -77% /
-84% | 26% /
24% | -42% /
-43% | -45% /
-48% | -41% /
-44% |

GPU Performance
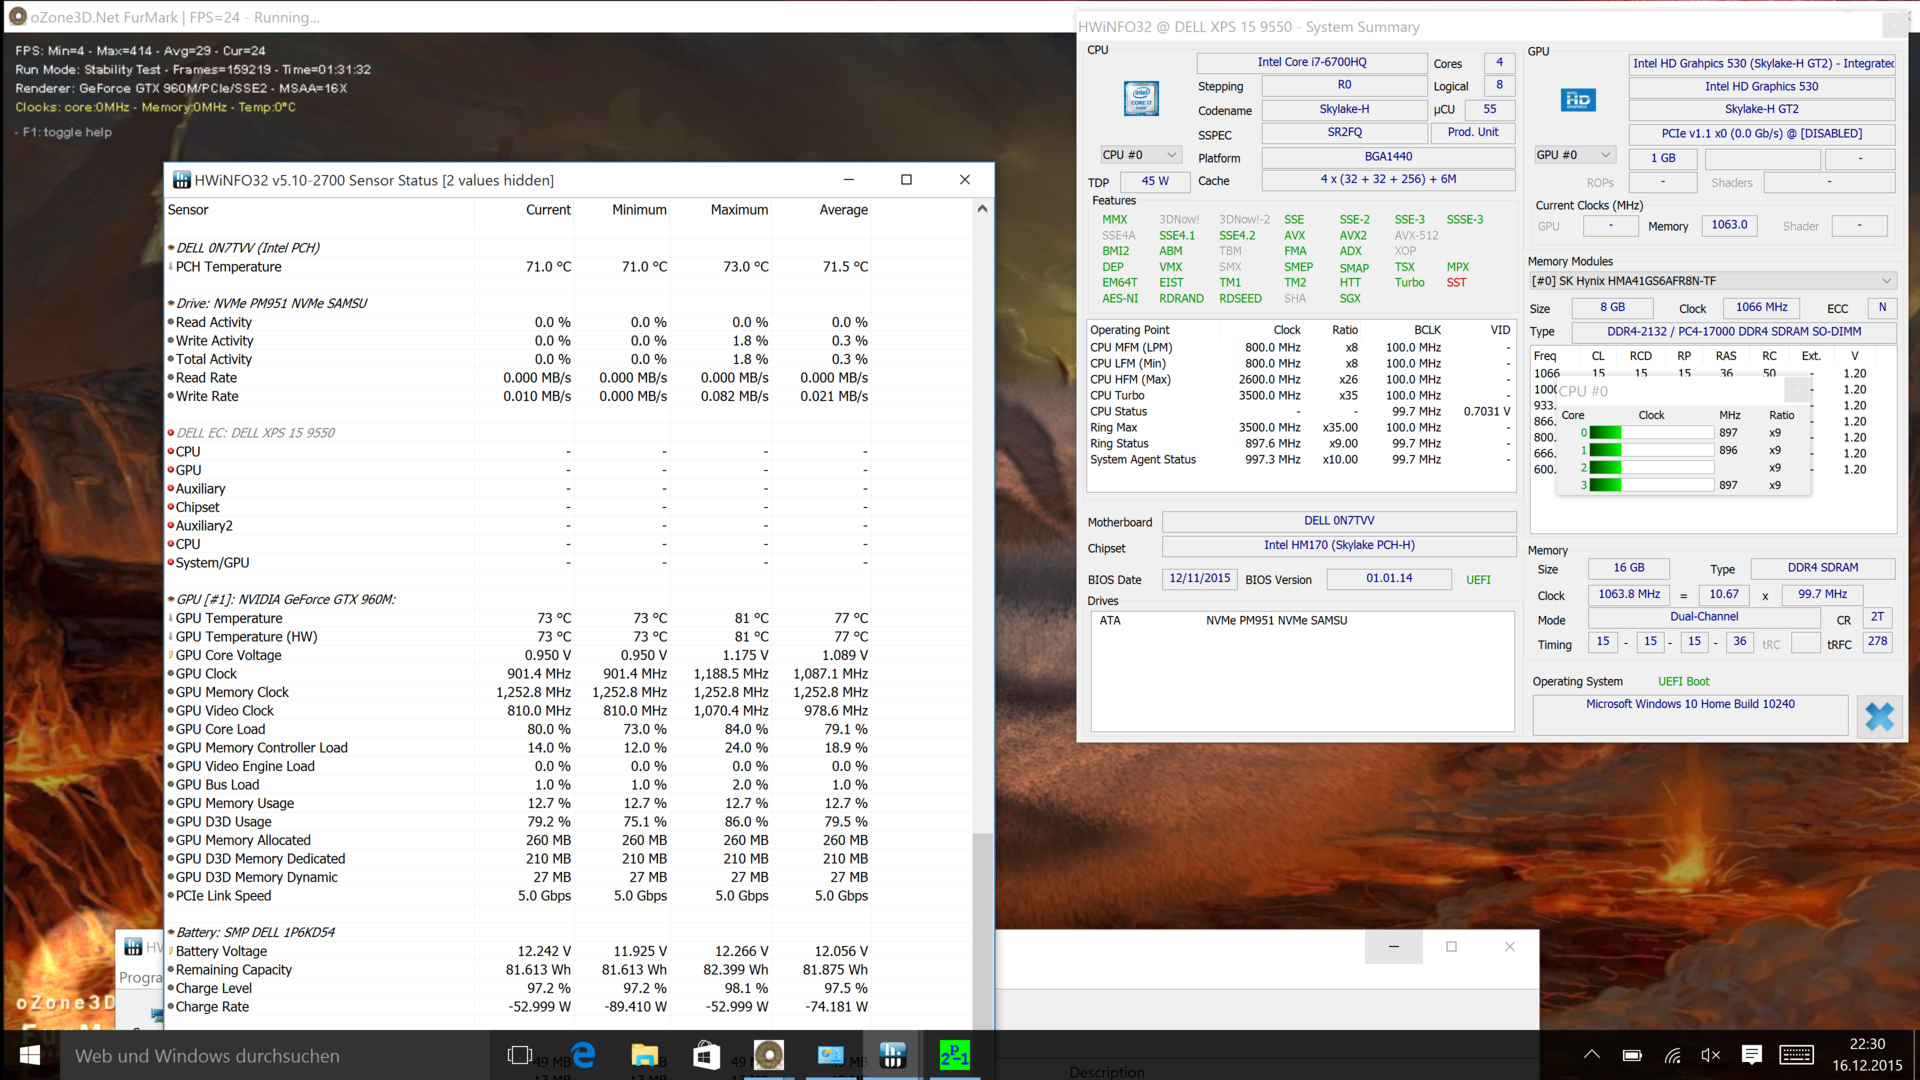
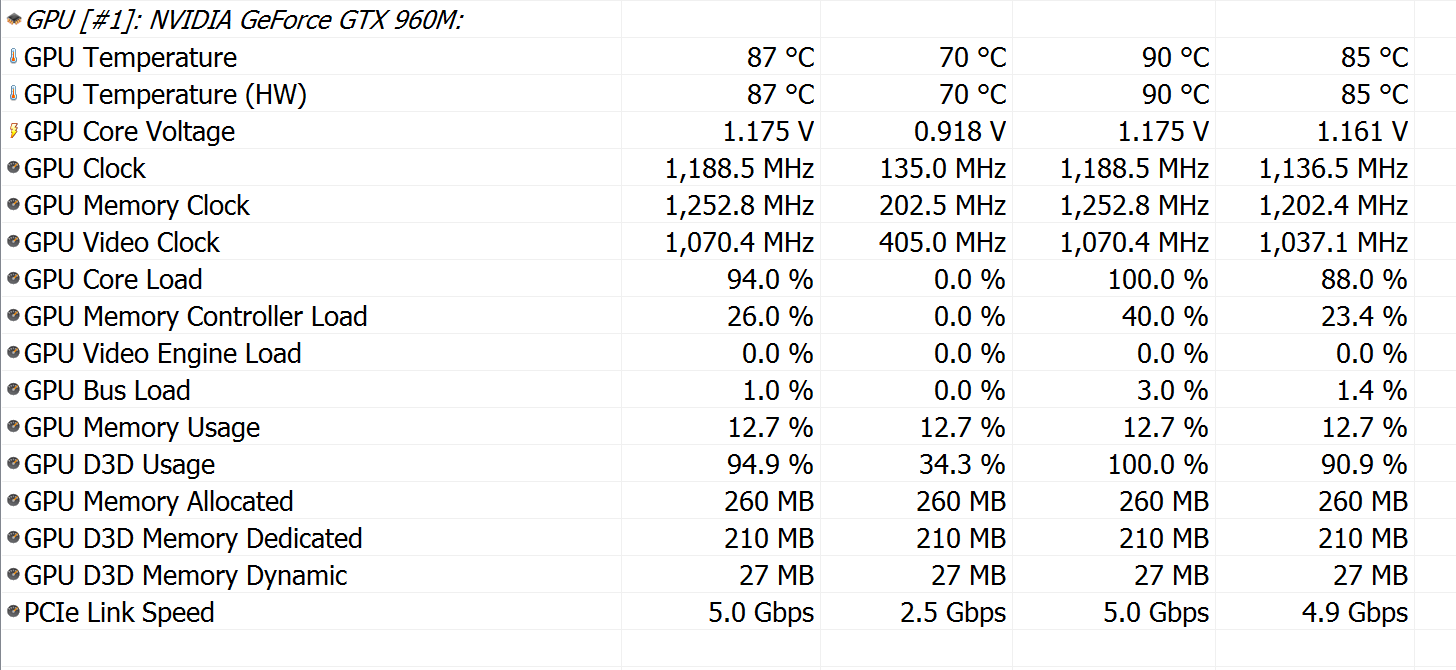
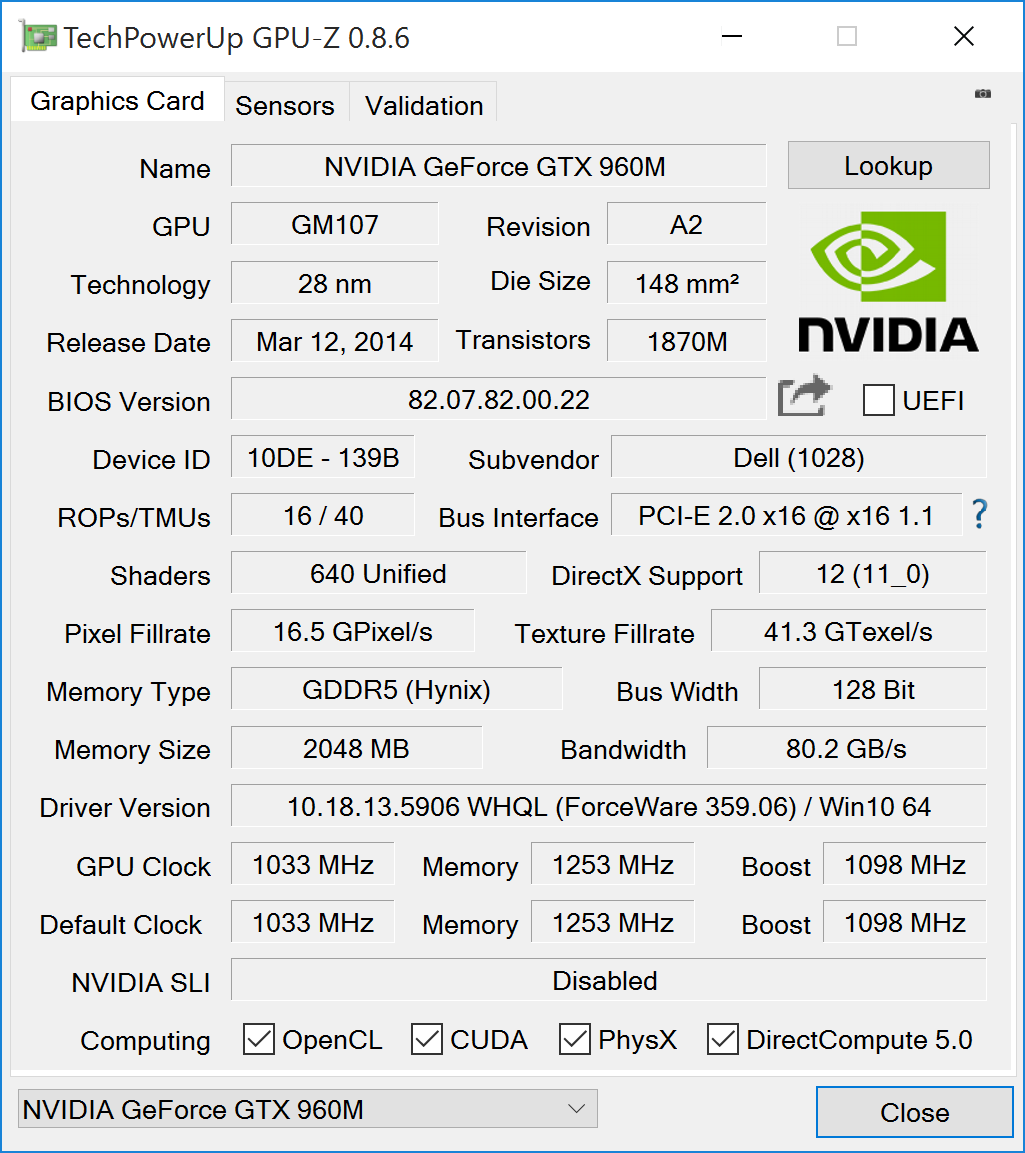
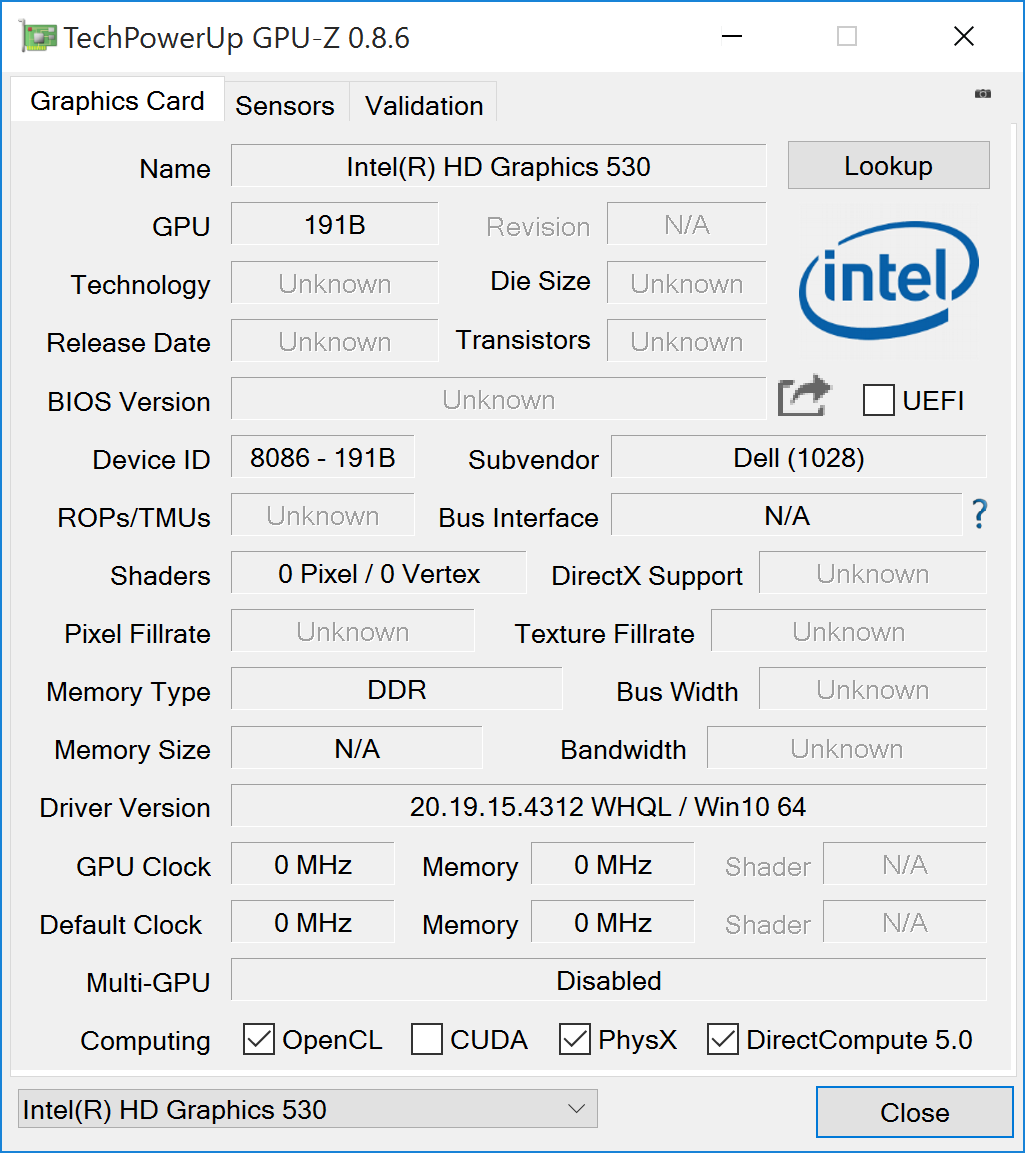
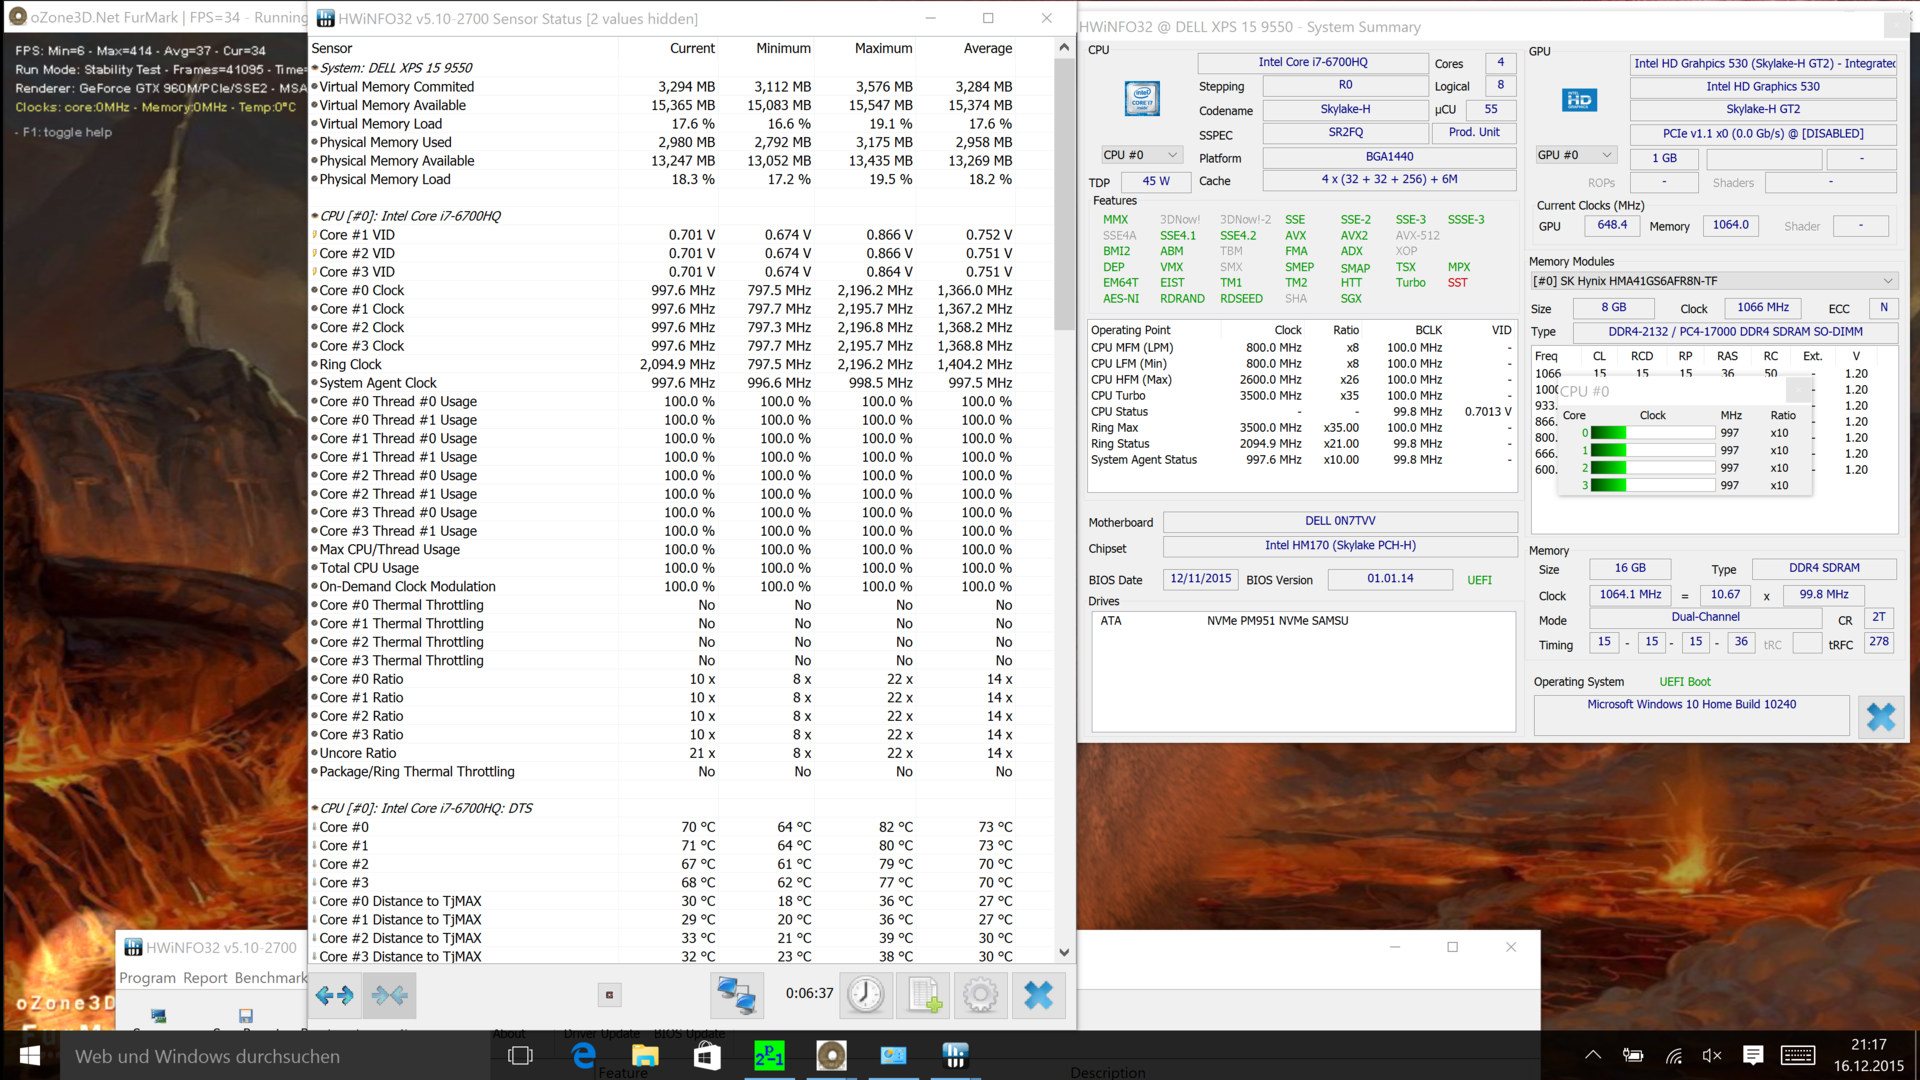
While the HD Graphics 530 of the processor handles simple tasks, the GeForce GTX 960M with 2 GB GDDR5-VRAM takes care of games or hardware-accelerated applications. The core is based on the GM107 chip (Maxwell) with 640 shaders and a 128-bit memory interface. The GeForce races up to 1,188 MHz on mains, even under sustained loads (FurMark GPU stress test).
The GPU Boost of 1,188 MHz is always fully utilized on mains power, even during the stress test and simultaneous stress for the CPU. The temperature is 87 °C in this case. The GPU is repeatedly slowed-down to 850 MHz in the stress test on battery power, but it is raised back to 1,188 MHz in intervals of 5 seconds. The temperature of the Nvidia chip drops to 68-75 °C in this case. The GPU is favored in the temperature table, which means the GPU Boost is raised first, before the CPU clock of 900 MHz is slightly increased to stay at one point, which does not create too much heat. This point is at 988 MHz (on average), for example, in the stress test – also see section "Emissions."
The situation is good for the 3DMarks and the scores are, as expected, on par with other GTX 960M notebooks. The XPS 15 i5 only falls behind in the Physics scores. Other GTX 960M notebooks are just beaten (ZenBook Pro, MSI PE60) or they are slightly faster (AS V Nitro VN7-792G, IdeaPad Y50-70). All in all, the performance utilization of the GTX is very good and on par with the best rivals. Is this also the case in real games?
| 3DMark 11 Performance | 5477 points | |
| 3DMark Ice Storm Standard Score | 48680 points | |
| 3DMark Cloud Gate Standard Score | 16529 points | |
| 3DMark Fire Strike Score | 3909 points | |
Help | ||
Gaming Performance
Our gaming benchmarks show that the GTX 960M performs similar to other systems with this GPU. The XPS 15 9550 i5 is on par, which is also the case for the Acer AS V Nitro VN7-792G. This is the right device if you want a lot of gaming performance. Almost every current title should be playable at maximum details, but not in the native 4K resolution. The FPS number will take a big hit in this case, which would require a GeForce GTX 980M.
| BioShock Infinite - 1920x1080 Ultra Preset, DX11 (DDOF) (sort by value) | |
| XPS 15 9550 i7 | |
| XPS 15 9550 i5 | |
| Apple MB Pro Retina 15 2015 | |
| XPS 13 2016 i7 QHD | |
| XPS 15 9530 | |
| Tomb Raider - 1920x1080 Ultra Preset AA:FX AF:16x (sort by value) | |
| XPS 15 9550 i7 | |
| Apple MB Pro Retina 15 2015 | |
| XPS 13 2016 i7 QHD | |
| Acer AS V Nitro VN7-792G | |
| Thief - 1920x1080 Very High Preset AA:FXAA & High SS AF:8x (sort by value) | |
| XPS 15 9550 i7 | |
| XPS 15 9550 i5 | |
| Apple MB Pro Retina 15 2015 | |
| Acer AS V Nitro VN7-792G | |
| Middle-earth: Shadow of Mordor - 1920x1080 Ultra Preset (HD Package) (sort by value) | |
| XPS 15 9550 i7 | |
| XPS 15 9550 i5 | |
| Evolve - 1920x1080 Very High Graphics Quality AA:1TX SM (sort by value) | |
| XPS 15 9550 i7 | |
| XPS 15 9550 i5 | |
| Apple MB Pro Retina 15 2015 | |
| MSI PE60 | |
| Dirt Rally - 3840x2160 High Preset (sort by value) | |
| XPS 15 9550 i7 | |
| Metal Gear Solid V - 3840x2160 High / On (sort by value) | |
| XPS 15 9550 i7 | |
| Call of Duty: Black Ops 3 - 3840x2160 High / On AA:FX (sort by value) | |
| XPS 15 9550 i7 | |
| Fallout 4 - 3840x2160 High Preset AA:T AF:16x (sort by value) | |
| XPS 15 9550 i7 | |
| low | med. | high | ultra | 4K | |
|---|---|---|---|---|---|
| Tomb Raider (2013) | 51.6 | ||||
| BioShock Infinite (2013) | 41.12 | ||||
| Thief (2014) | 50 | 26.7 | |||
| Middle-earth: Shadow of Mordor (2014) | 42.12 | 27.71 | |||
| Evolve (2015) | 37.1 | 31.9 | |||
| Dirt Rally (2015) | 32 | 15 | |||
| Metal Gear Solid V (2015) | 31.5 | 14.2 | |||
| Call of Duty: Black Ops 3 (2015) | 41.7 | 35.6 | 11.3 | ||
| Fallout 4 (2015) | 55.5 | 30.5 | 25 | 10.5 |
Emissions
System Noise
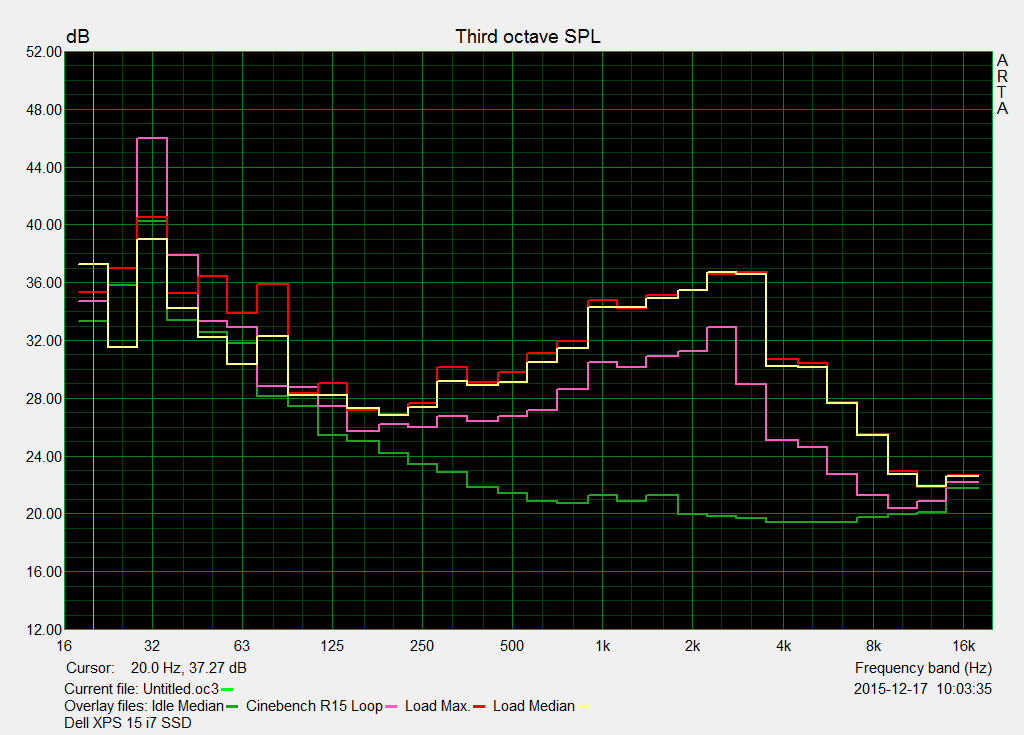

The system noise of the XPS 15 knows three different levels: Silent, high and annoying. The silent idle operation is shown by the green line in the chart. The noise during the stress test and gaming (3DMark06) hardly differs; it results in the highest fan speed and is already quite loud at 45 dB(A), but it is still reasonable considering the performance of the system. We also showed a CB R15 loop, which is more tolerable at 41 dB(A).
The i5 model showed a different behavior, because the load average was not identical to the maximum load. Games should therefore result in a lower noise on the i5 XPS.
Three levels do not mean that there aren't any graduations. The two fans will slowly increase and decrease their speed. The cooling solution will run for quite a long time after periods of load at 33.4 dB(A), so the user might be confronted with a fan that is always audible depending on the scenario. We did not notice coil whine, even when the fans were deactivated.
| Dell XPS 15-9550 i7 GTX 960M 6700HQ NVMe-SSD | Dell XPS 15 2016 9550 GTX 960M 6300HQ RAID HDD-SSD | Acer Aspire V Nitro VN7-792G-55SF 945M 6300HQ HDD | Apple MacBook Pro Retina 15 inch 2015-05 Radeon R9 M370X 4870HQ SSD | Asus Zenbook Pro UX501JW-FI218H GTX 960M 4720HQ SSD | Dell XPS 15 (9530-0538) GT 750M 4712HQ SSD | Lenovo IdeaPad Y50-70-59441229 GTX 960M 4710HQ SSD | MSI PE60-2QEi581 GTX 960M 4210H HDD | |
|---|---|---|---|---|---|---|---|---|
| Noise | 2% | 12% | 6% | 4% | 3% | 4% | -1% | |
| Idle Minimum * (dB) | 31.4 | 32.6 -4% | 30.1 4% | 28.9 8% | 32.2 -3% | 29.6 6% | 29.6 6% | 32.8 -4% |
| Idle Average * (dB) | 32.5 | 33.6 -3% | 30.1 7% | 28.9 11% | 32.3 1% | 31.6 3% | 30.7 6% | 32.8 -1% |
| Idle Maximum * (dB) | 33.6 | 33.6 -0% | 30.9 8% | 28.9 14% | 32.3 4% | 31.6 6% | 31.3 7% | 35.4 -5% |
| Load Average * (dB) | 45.2 | 37.1 18% | 33.6 26% | 46 -2% | 41.7 8% | 45.4 -0% | 43.1 5% | 42.3 6% |
| Load Maximum * (dB) | 46 | 47.5 -3% | 38.6 16% | 46 -0% | 42 9% | 45.4 1% | 47.6 -3% | 47.4 -3% |
* ... smaller is better
Noise level
| Idle |
| 31.4 / 32.5 / 33.6 dB(A) |
| Load |
| 45.2 / 46 dB(A) |
 | ||
30 dB silent 40 dB(A) audible 50 dB(A) loud |
||
min: | ||
Temperature
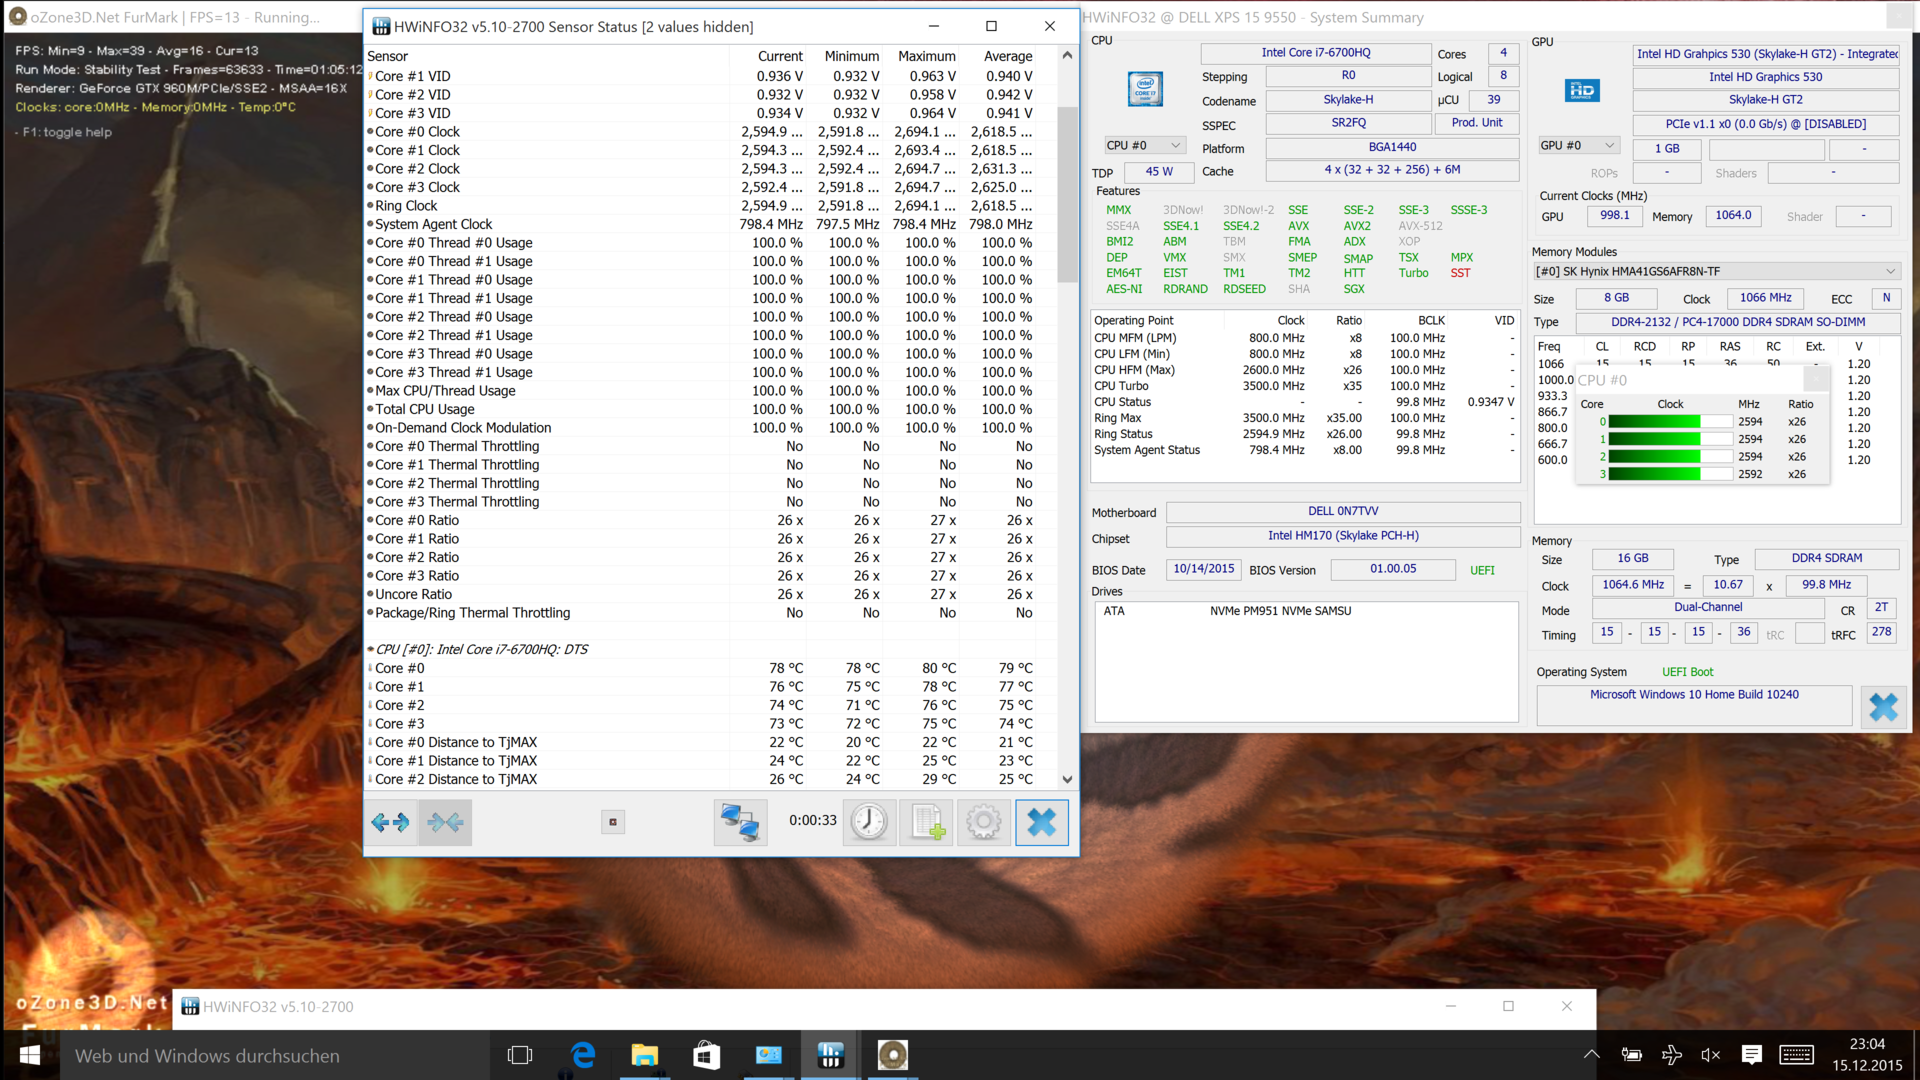
Our stress test clearly differs from the Cinebench test, GPU benchmarks and games above. We stress the CPU and GPU at the same time via Prime95 and FurMark, which brings the cooling solution to its limit. Our goal is to check the behavior under extreme conditions, but this does not represent practical scenarios.
We have a look at the temperatures first, where 56 °C at the top and 50 °C at the bottom of the base unit are good results under high load, and you can hardly notice the warming while idling. However, the reason for these low temperatures is throttling, because the processor fluctuates between 800 MHz and 1.6 GHz. Irritating: This happens with BIOS version 1.1.14, the clock was 2.6 GHz after one hour with the old BIOS.

| Dell XPS 15-9550 i7 GTX 960M 6700HQ NVMe-SSD | Dell XPS 15 2016 9550 GTX 960M 6300HQ RAID HDD-SSD | Acer Aspire V Nitro VN7-792G-55SF 945M 6300HQ HDD | Apple MacBook Pro Retina 15 inch 2015-05 Radeon R9 M370X 4870HQ SSD | Asus Zenbook Pro UX501JW-FI218H GTX 960M 4720HQ SSD | Dell XPS 15 (9530-0538) GT 750M 4712HQ SSD | Lenovo IdeaPad Y50-70-59441229 GTX 960M 4710HQ SSD | MSI PE60-2QEi581 GTX 960M 4210H HDD | |
|---|---|---|---|---|---|---|---|---|
| Heat | -18% | 2% | 8% | -5% | -30% | 5% | -6% | |
| Maximum Upper Side * (°C) | 55.9 | 62.5 -12% | 42.1 25% | 43.2 23% | 46.2 17% | 51.8 7% | 52.5 6% | 45.5 19% |
| Maximum Bottom * (°C) | 50 | 54.4 -9% | 42 16% | 39 22% | 52.5 -5% | 64.6 -29% | 47 6% | 37.5 25% |
| Idle Upper Side * (°C) | 28.1 | 33.5 -19% | 31.2 -11% | 30 -7% | 32 -14% | 38.4 -37% | 27.1 4% | 35.8 -27% |
| Idle Bottom * (°C) | 27.9 | 36.7 -32% | 34 -22% | 29.3 -5% | 32.7 -17% | 44.4 -59% | 27 3% | 38.7 -39% |
* ... smaller is better
(-) The maximum temperature on the upper side is 55.9 °C / 133 F, compared to the average of 36.8 °C / 98 F, ranging from 21 to 71 °C for the class Multimedia.
(-) The bottom heats up to a maximum of 50 °C / 122 F, compared to the average of 39.1 °C / 102 F
(+) In idle usage, the average temperature for the upper side is 26.2 °C / 79 F, compared to the device average of 31.3 °C / 88 F.
(+) The palmrests and touchpad are cooler than skin temperature with a maximum of 30.2 °C / 86.4 F and are therefore cool to the touch.
(±) The average temperature of the palmrest area of similar devices was 28.7 °C / 83.7 F (-1.5 °C / -2.7 F).
Microphone
There is good news about the microphone. The background noises of the i5/FHD version (probably HDD rotation) are gone. Recordings do not sound completely clean at first, but Dell's MaxxAudioPro can help to improve the quality. The recording, which was dull at first, improved when we deactivated the microphone enhancements.
Energy Management
Power Consumption
We notice the higher power consumption at the socket while idling. Our review configuration pulls significantly more power from the wall than the FHD/i5 version and 50% more than the Nitro Black Edition VN7-792G-74Q4 with the identical core components. We cannot explain how Acer manages that with the same Skylake platform; the 1920x1080 pixels cannot cause the big difference.
| Dell XPS 15-9550 i7 GTX 960M 6700HQ | Dell XPS 15 2016 9550 GTX 960M 6300HQ | Acer Aspire V Nitro VN7-792G-55SF 945M 6300HQ | Apple MacBook Pro Retina 15 inch 2015-05 Radeon R9 M370X 4870HQ | Asus Zenbook Pro UX501JW-FI218H GTX 960M 4720HQ | Dell XPS 15 (9530-0538) GT 750M 4712HQ | Lenovo IdeaPad Y50-70-59441229 GTX 960M 4710HQ | MSI PE60-2QEi581 GTX 960M 4210H | Acer Aspire V Nitro Black Edition VN7-792G-74Q4 GTX 960M 6700HQ | |
|---|---|---|---|---|---|---|---|---|---|
| Power Consumption | 21% | 37% | 32% | 7% | 5% | 35% | -25% | 29% | |
| Idle Minimum * (Watt) | 12.5 | 9.9 21% | 6.4 49% | 6 52% | 15.6 -25% | 14.6 -17% | 4.3 66% | 21.8 -74% | 5.8 54% |
| Idle Average * (Watt) | 19.6 | 12.6 36% | 10.9 44% | 12.8 35% | 20.5 -5% | 19.6 -0% | 7.8 60% | 26.1 -33% | 9 54% |
| Idle Maximum * (Watt) | 22.8 | 16.8 26% | 14.1 38% | 13.3 42% | 21.2 7% | 19.8 13% | 10.6 54% | 26.6 -17% | 14.7 36% |
| Load Average * (Watt) | 102 | 70 31% | 67.1 34% | 82.4 19% | 75.8 26% | 92 10% | 99.7 2% | 88.5 13% | 85 17% |
| Load Maximum * (Watt) | 107 | 114 -7% | 84.9 21% | 91.8 14% | 72.9 32% | 85.8 20% | 112.3 -5% | 119.7 -12% | 121.5 -14% |
* ... smaller is better
| Off / Standby | |
| Idle | |
| Load |
|
Key:
min: | |
Battery Runtime
The review unit is equipped with an 84-Wh battery, which replaces the 54-Wh module of the i5 model but occupies the space of the 2.5-inch SATA-HDD. The overall runtimes are disappointing, because they fall just behind the i5 hybrid model (54 Wh) in every test. We did not expect anything else due to the much higher power consumption though. The less expensive Nitro Black Edition VN7-792G is much more frugal while idling and manages 254 minutes (-18%) in the Wi-Fi test with its much smaller battery (52 Wh). The idle and the video tests show constant results, so we can rule out an incorrect measurement.
Contrary to all the promises, BIOS 1.1.14 did not improve the runtimes. 8:32 hours while idling, 5:10 in the Wi-Fi test and 5:00 during video playback (H.264). Those runtimes are even a couple of minutes shorter, but the results are within normal measuring tolerances. An interesting aspect is the significantly shorter runtime under load with 1:14 hours instead of the 2:05 hours with BIOS 1.1.05. It confirms that BIOS 1.1.14 enables higher clocks on battery power.
Update 01/04/16
BIOS 1.1.14, which was available for reviewers, was recalled on 12/23/15 and Dell asked reviewers to install 1.1.13. We did not have time for this. BIOS 1.1.15 is available for customers sind January 3rd, but only via the Device Manager (Firmware) as of 01/04/16, the official support page does not show an update yet.
| XPS 15 9550 UHD NVMe 6700HQ, GeForce GTX 960M, 84 Wh | XPS 15 9550 FHD Hybrid 6300HQ, GeForce GTX 960M, 56 Wh | XPS 15 9530 4712HQ, GeForce GT 750M, 88 Wh | XPS 13 2016 QHD 6500U, HD Graphics 520, 56 Wh | Apple MB Pro Retina 15 2015 4870HQ, Radeon R9 M370X, 100 Wh | Asus Zenbook Pro UX501JW 4720HQ, GeForce GTX 960M, 60 Wh | Acer AS V Nitro VN7-792G 6300HQ, GeForce 945M, 52 Wh | V Nitro Black Edition VN7-792G 6700HQ, GeForce GTX 960M, 53 Wh | MSI PE60 4210H, GeForce GTX 960M, 42 Wh | |
|---|---|---|---|---|---|---|---|---|---|
| Battery runtime | 8% | 0% | 23% | 38% | -48% | -8% | -14% | -38% | |
| Reader / Idle (h) | 8.8 | 9.1 3% | 13.1 49% | 17.3 97% | 10.2 16% | 6.8 -23% | 5.8 -34% | ||
| H.264 (h) | 5.3 | 6 13% | 6.9 30% | 3.9 -26% | 5.9 11% | ||||
| WiFi v1.3 (h) | 5.2 | 5.5 6% | 5.2 0% | 7.2 38% | 7.2 38% | 2.7 -48% | 4.6 -12% | 4.2 -19% | 2.8 -46% |
| Load (h) | 2.1 | 2.3 10% | 1.7 -19% | 1.8 -14% | 1.9 -10% | 1.6 -24% | 1.4 -33% |
Pros
Cons
Verdict
One bug after another? After the entry-level XPS 15 (FHD/i5/hybrid) could not meet the high expectations, we were careful with the more expensive and better-equipped XPS 15 with a UHD panel, NVMe-SSD and Core i7. Who wants to spend more than 2,000 Euros (~$2195) to be faced with CPU throttling, low runtimes or even PWM flickering? But we can soothe concerns after this review update – at least some of them. The CPU and GTX 960M can utilize their full performance and there is no PWM flickering, not even at the lowest brightness levels. The runtimes are disappointing though; they are still shorter compared to the 54-Wh FHD model even after the BIOS update 1.1.14 (NVMe SleepBug).
The 6700HQ lives up to its name and can even beat the Aspire Nitro Black Edition in the Cinebench tests on mains. The i7 can also utilize its Boost (3.1 GHz) on battery power. The latest BIOS is important; the XPS 15 was stuck at 2.6 GHz ex-works (BIOS Rev. 1.1.05) and had throttling issues during the transition to mains.
The lack of a mechanical drive also removes the annoying noises that affected microphone recordings of the entry-level XPS 15. One problem is the unsightly soft-touch surface of the palm rest. Now, after two weeks with both XPS 15 versions, we can see the whole splendor of hardly removable stains (also on the touchpad).
The Sharp UHD panel is one of the best of its kind, which is supported by the 89% AdobeRGB coverage and the very good results after calibration in particular. The color hue from the side with dark or brighter surfaces is a minor issue in our opinion; at least it would not prevent us from a purchase.
We can repeat our results from the first XPS 15 review when we look at the advantages: Excellent build quality combined with good maintainability and very compact dimensions. The cooling solution acts reasonably and performance fans won't be disappointed after the BIOS update. The good sound from the speakers and the future-proof Thunderbolt 3 complete the package.
All in all – if we ignore the initial bugs and confusion – the XPS 15 UHD is a great working tool with limited drawbacks. If you want perfection in every regard, you will already be disappointed with the webcam, but the runtimes will blow away any sympathies. If the contra points are not important for you, then you get a very good notebook in terms of the other aspects, which can keep up with the Apple MacBook Pro Retina 15 2015.
Update 12/23/15
We already determined it, BIOS 1.1.14 does not improve the runtimes. Dell now recalls version 1.1.14, which was not officially released yet, and it asks reviewers to use the previous version (1.1.13). Note: Version 1.1.13 is currently not yet released for users, either. Dell is working hard to release it as soon as possible. We will add the new runtimes, but not repeat the performance tests (clocks etc.) due to the immature BIOS revisions.
Update 01/04/16
BIOS 1.1.15 is available for customers since January 3rd, but only via the Device manager (Firmware) as of 01/04/16. The official support page does not offer the download yet.
Update 01/07/16
The new XPS 15 BIOS (version 1.1.15) besides a new WLAN as well as IPG driver is now available for download on Dell.com/support.
Dell XPS 15-9550 i7
- 12/09/2016 v6 (old)
Sebastian Jentsch
Price comparison

