Schenker XMG C506 (Gigabyte P35X v5) Notebook Review
For the original German review, see here.
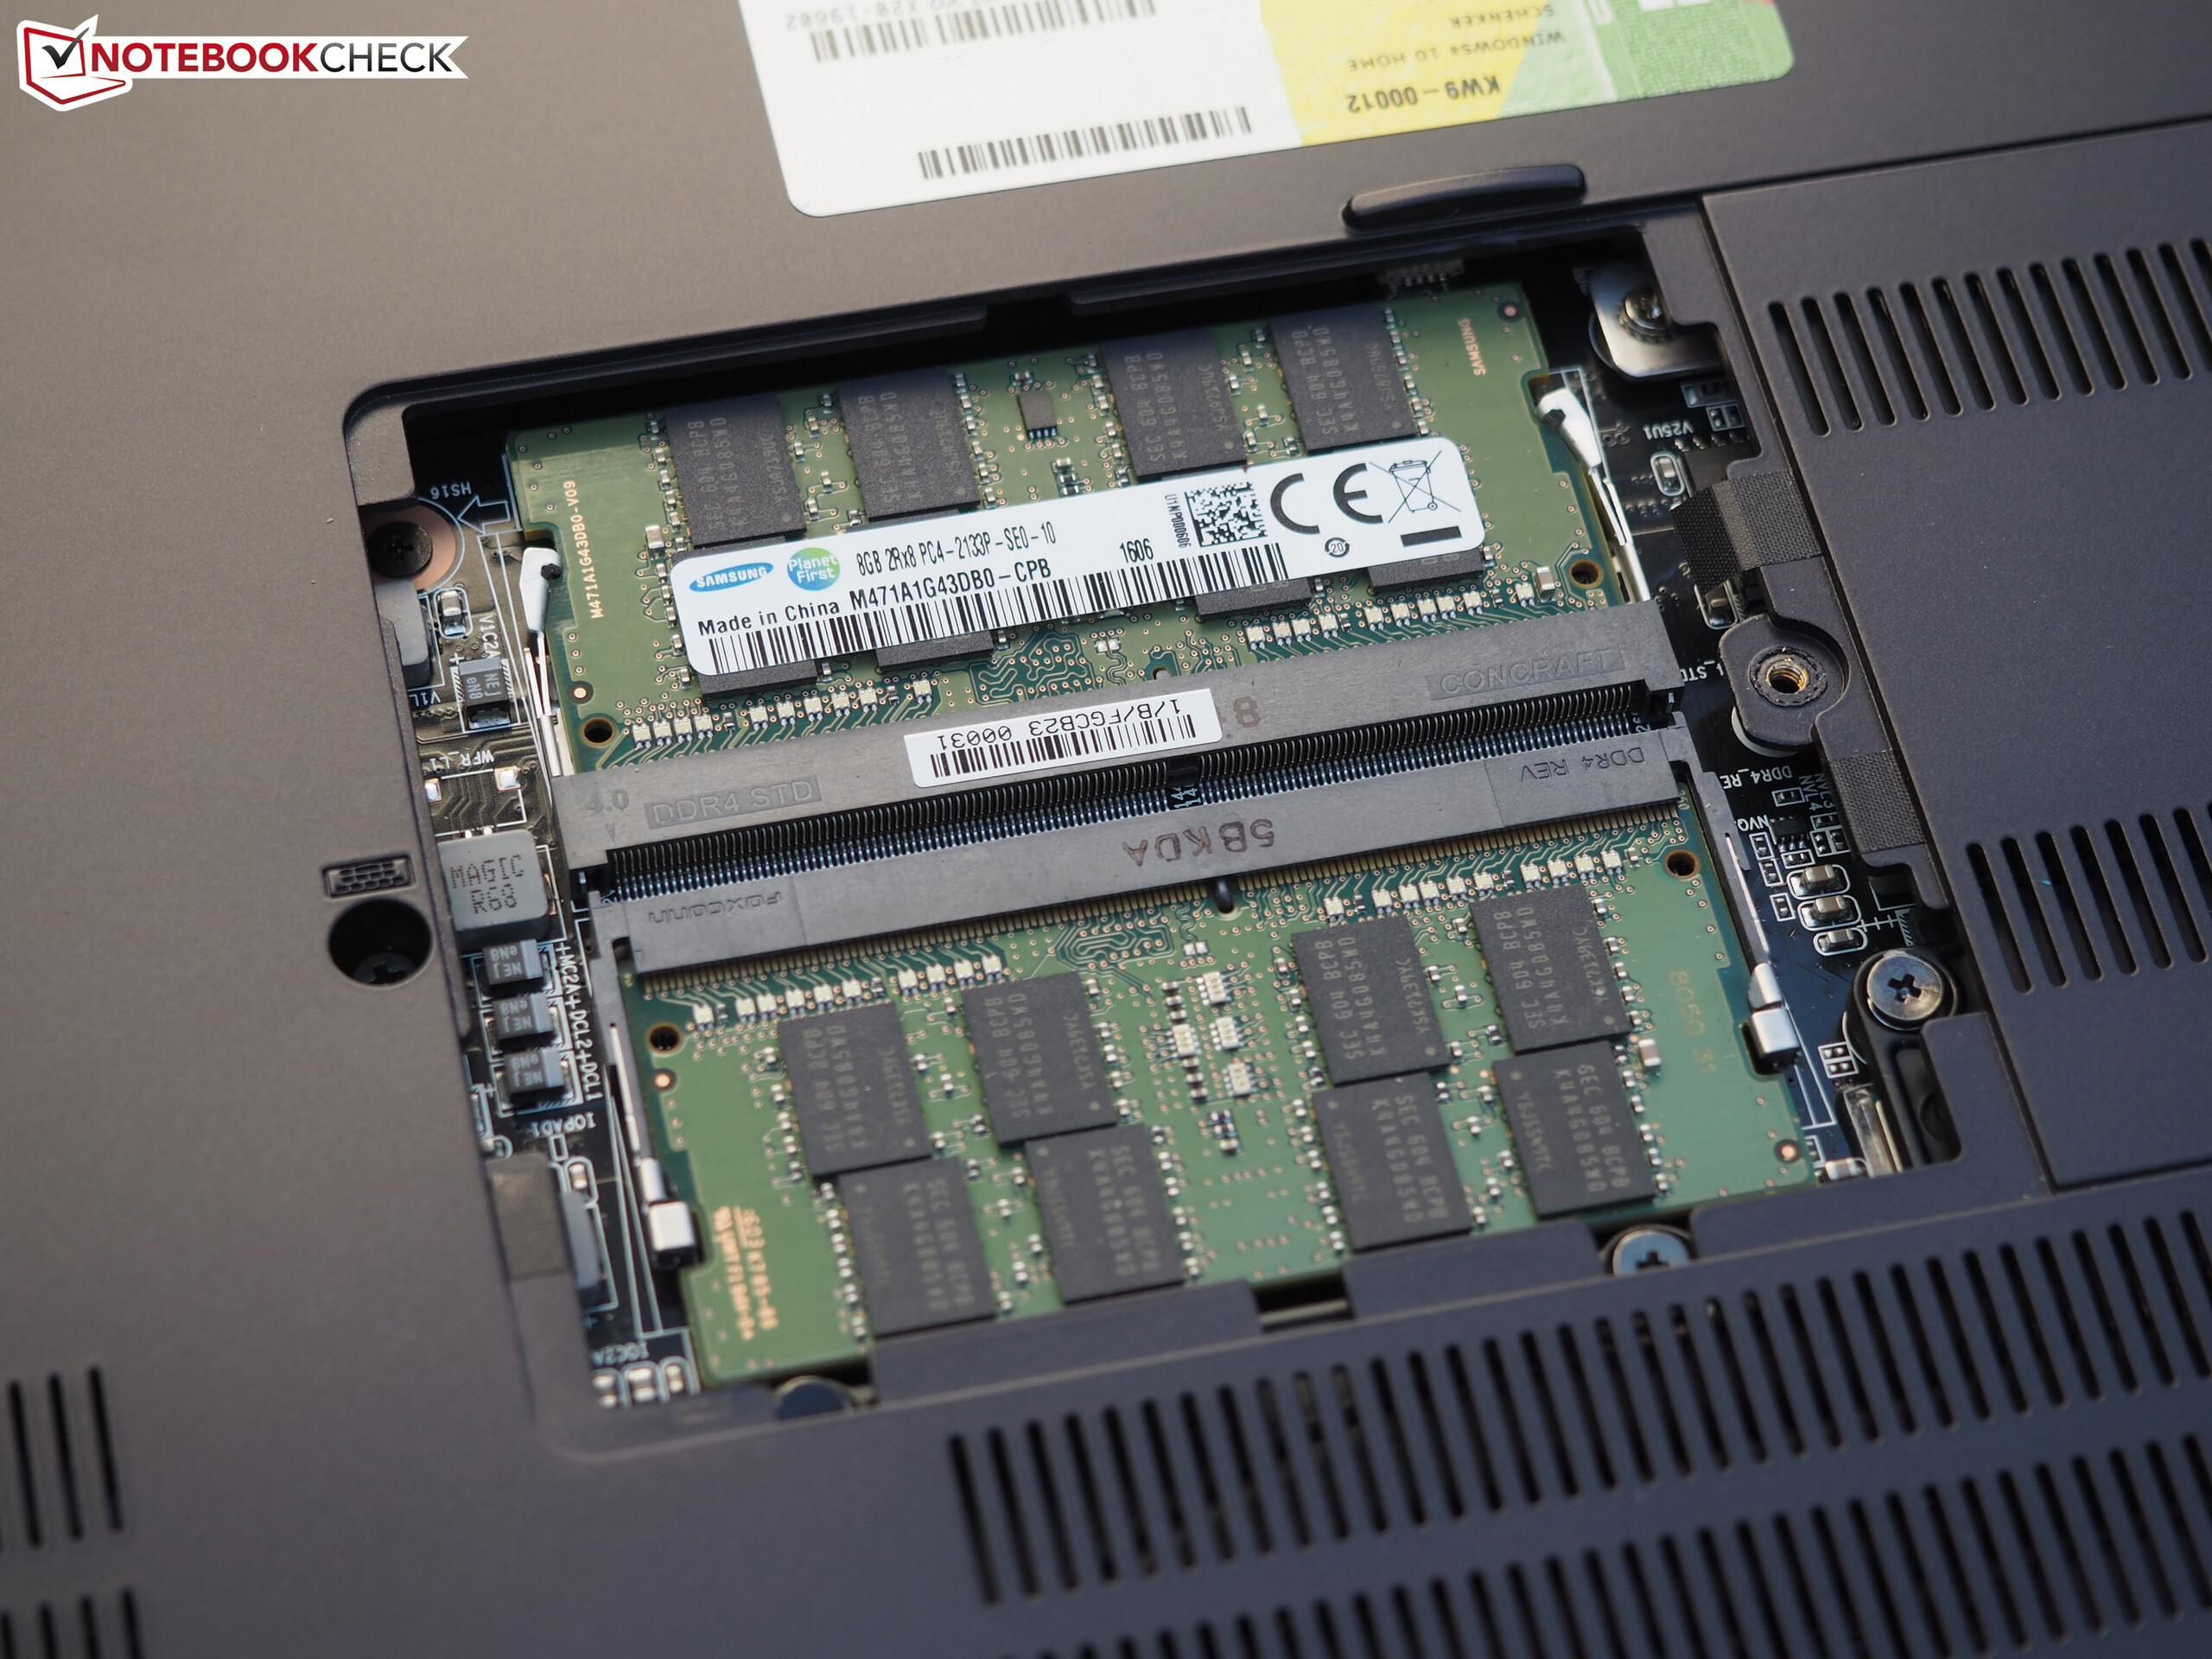
Schenker Technologies has established itself as an expert for gaming laptop on the German market. Unlike other manufacturers, the products can be adapted extensively on the company's homepage, which helps individuality. Although the XMG C506 generally carries a Core i7-6700HQ and Full HD IPS panel, there are more choices for the other components. Either a GeForce GTX 970M with 6 GB of VRAM or a GeForce GTX 980M with 8 GB of VRAM can be installed (some manufacturers only use 3 or 4 GB). The DDR4 working memory ranges from 8 to a maximum of 32 GB.
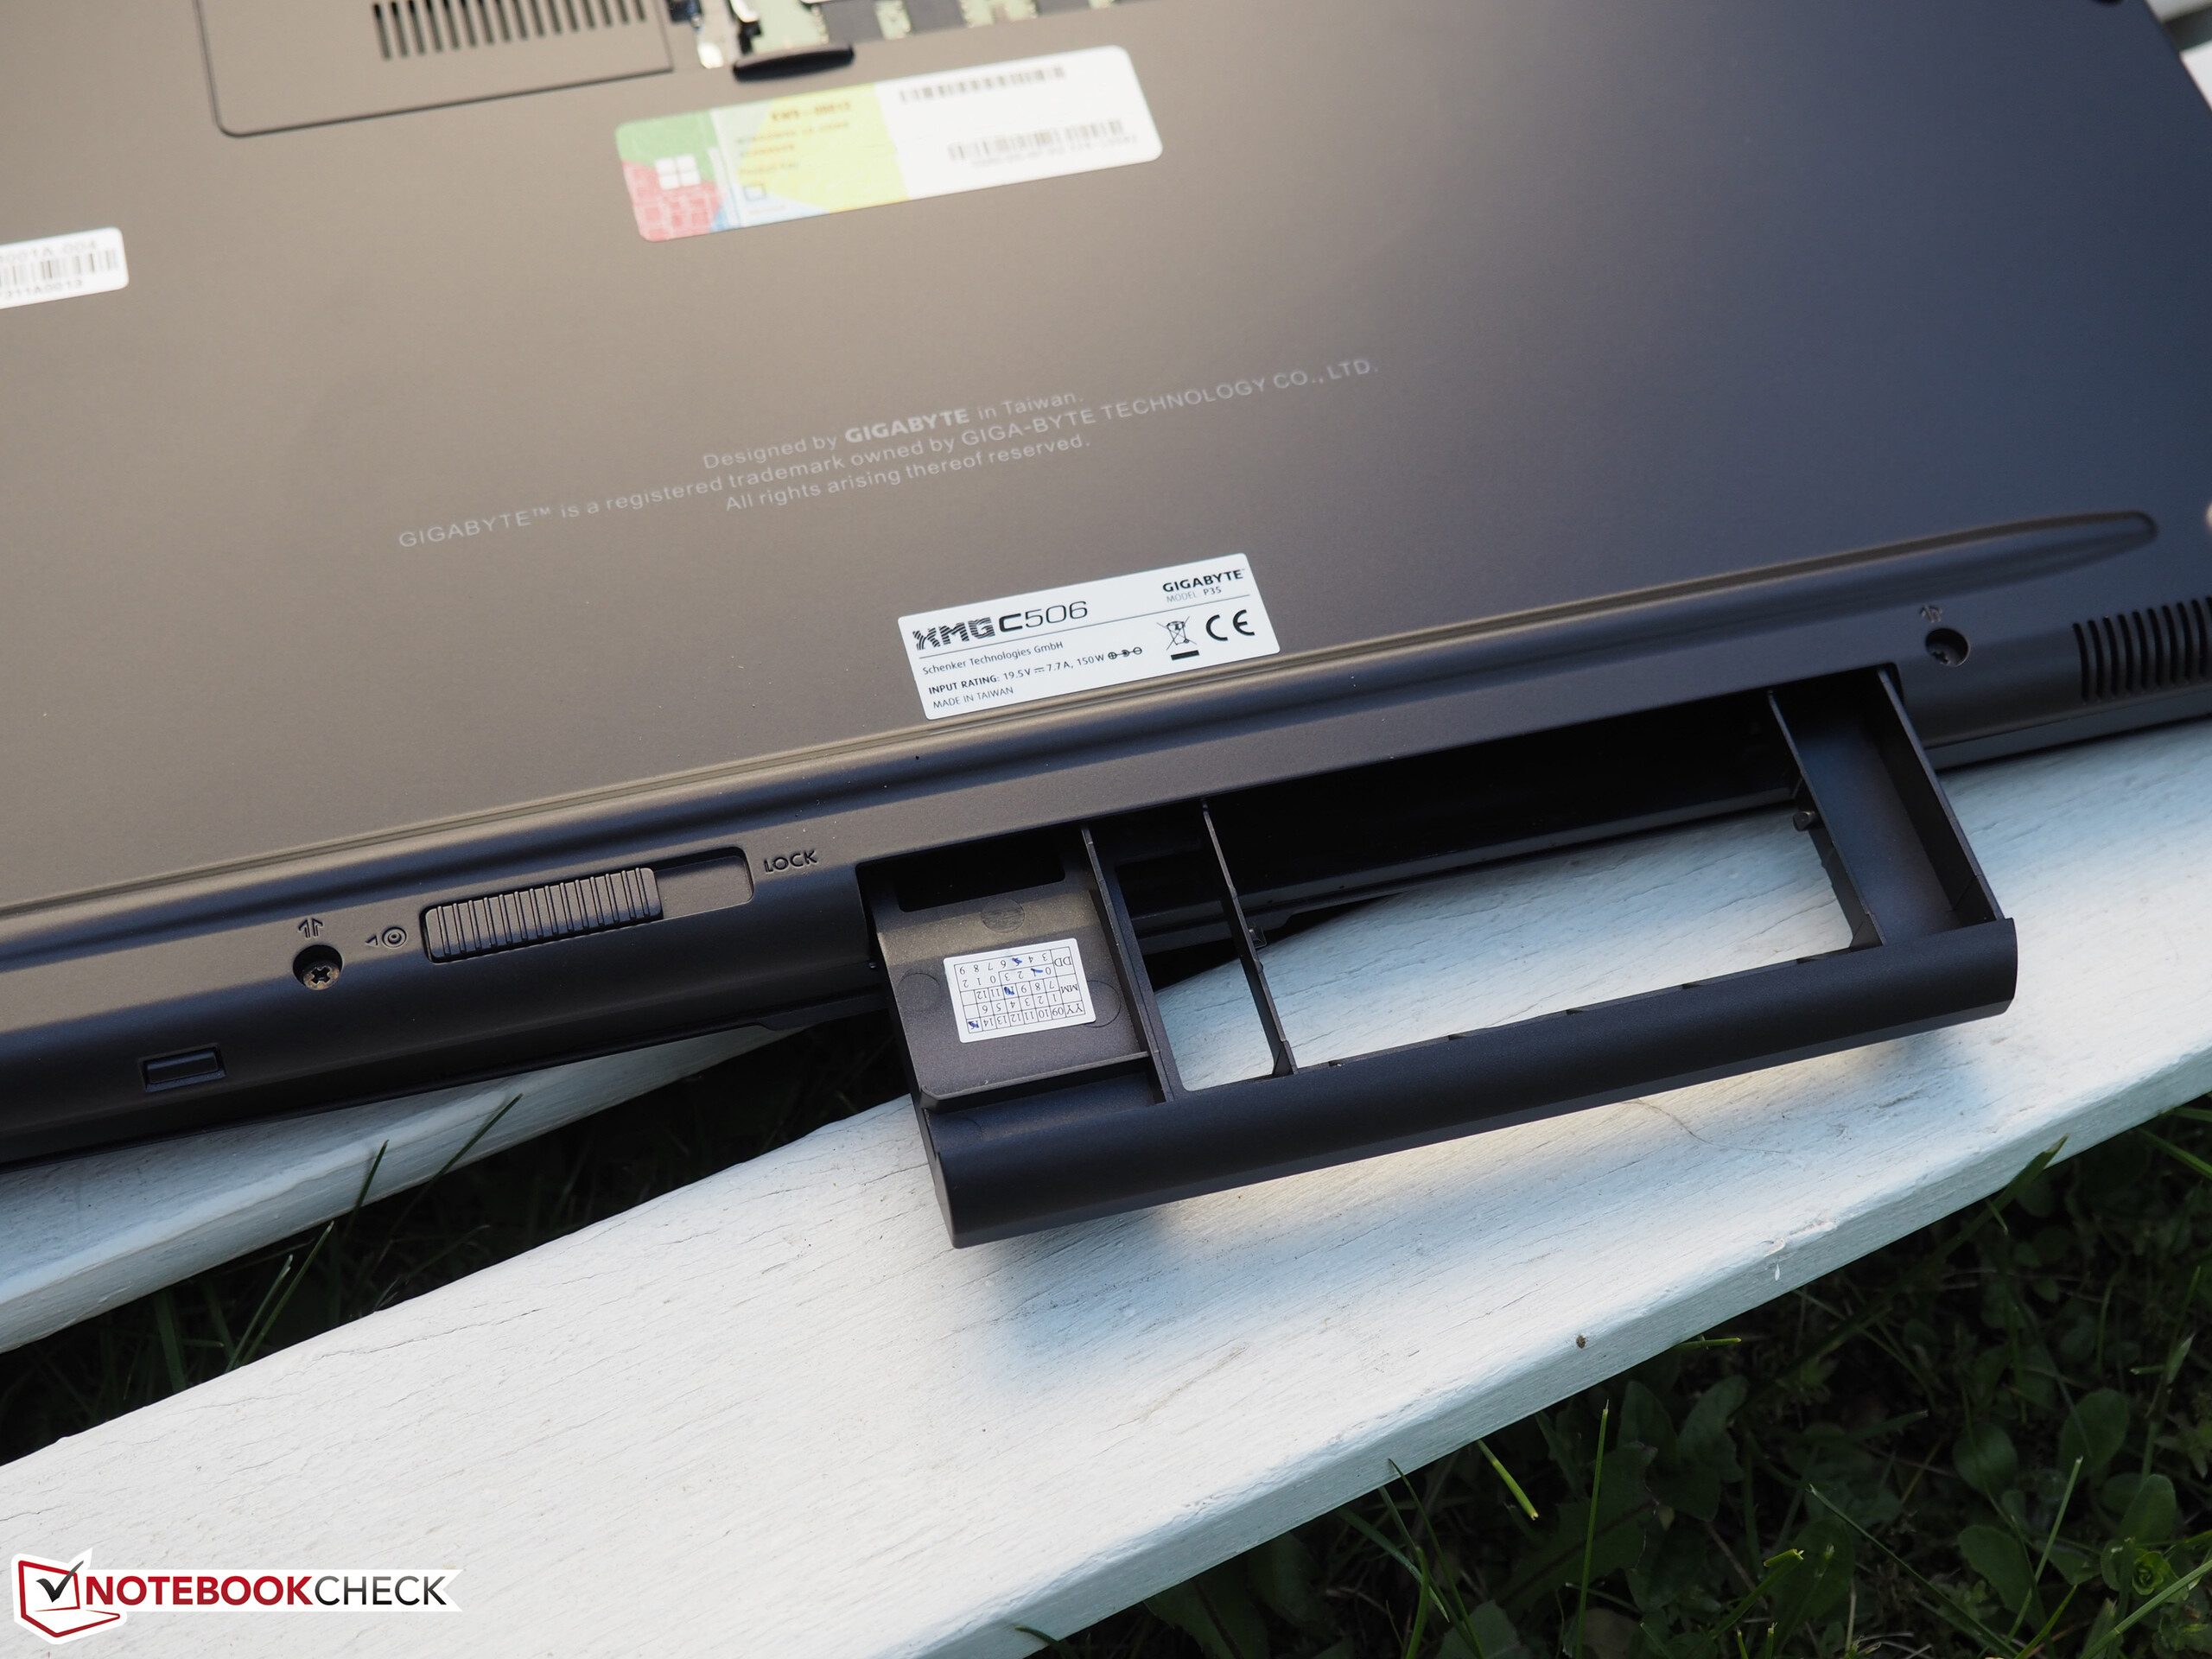
There is no lack of hard drives for the XMG C506, either. A total of four storage devices can be used when fitting the hot-swap slot on the front with an SSD or HDD instead of an optical drive (2x M.2 Type 2280 & 2x 2.5-inch). As expected from a modern laptop, the 15-inch device supports PCIe and NVMe technology respectively for particularly fast M.2 drives.
But back to the configuration: In addition to the listed hardware, the buyer has influence on the wireless module, keyboard language, warranty period and software. The XMG C506 starts at 1749 Euros (~$1981) without an operating system. However, users will find themselves in considerably higher price sector when on a binge on the website. Our review sample is priced at just over 2000 Euros (~$2265).
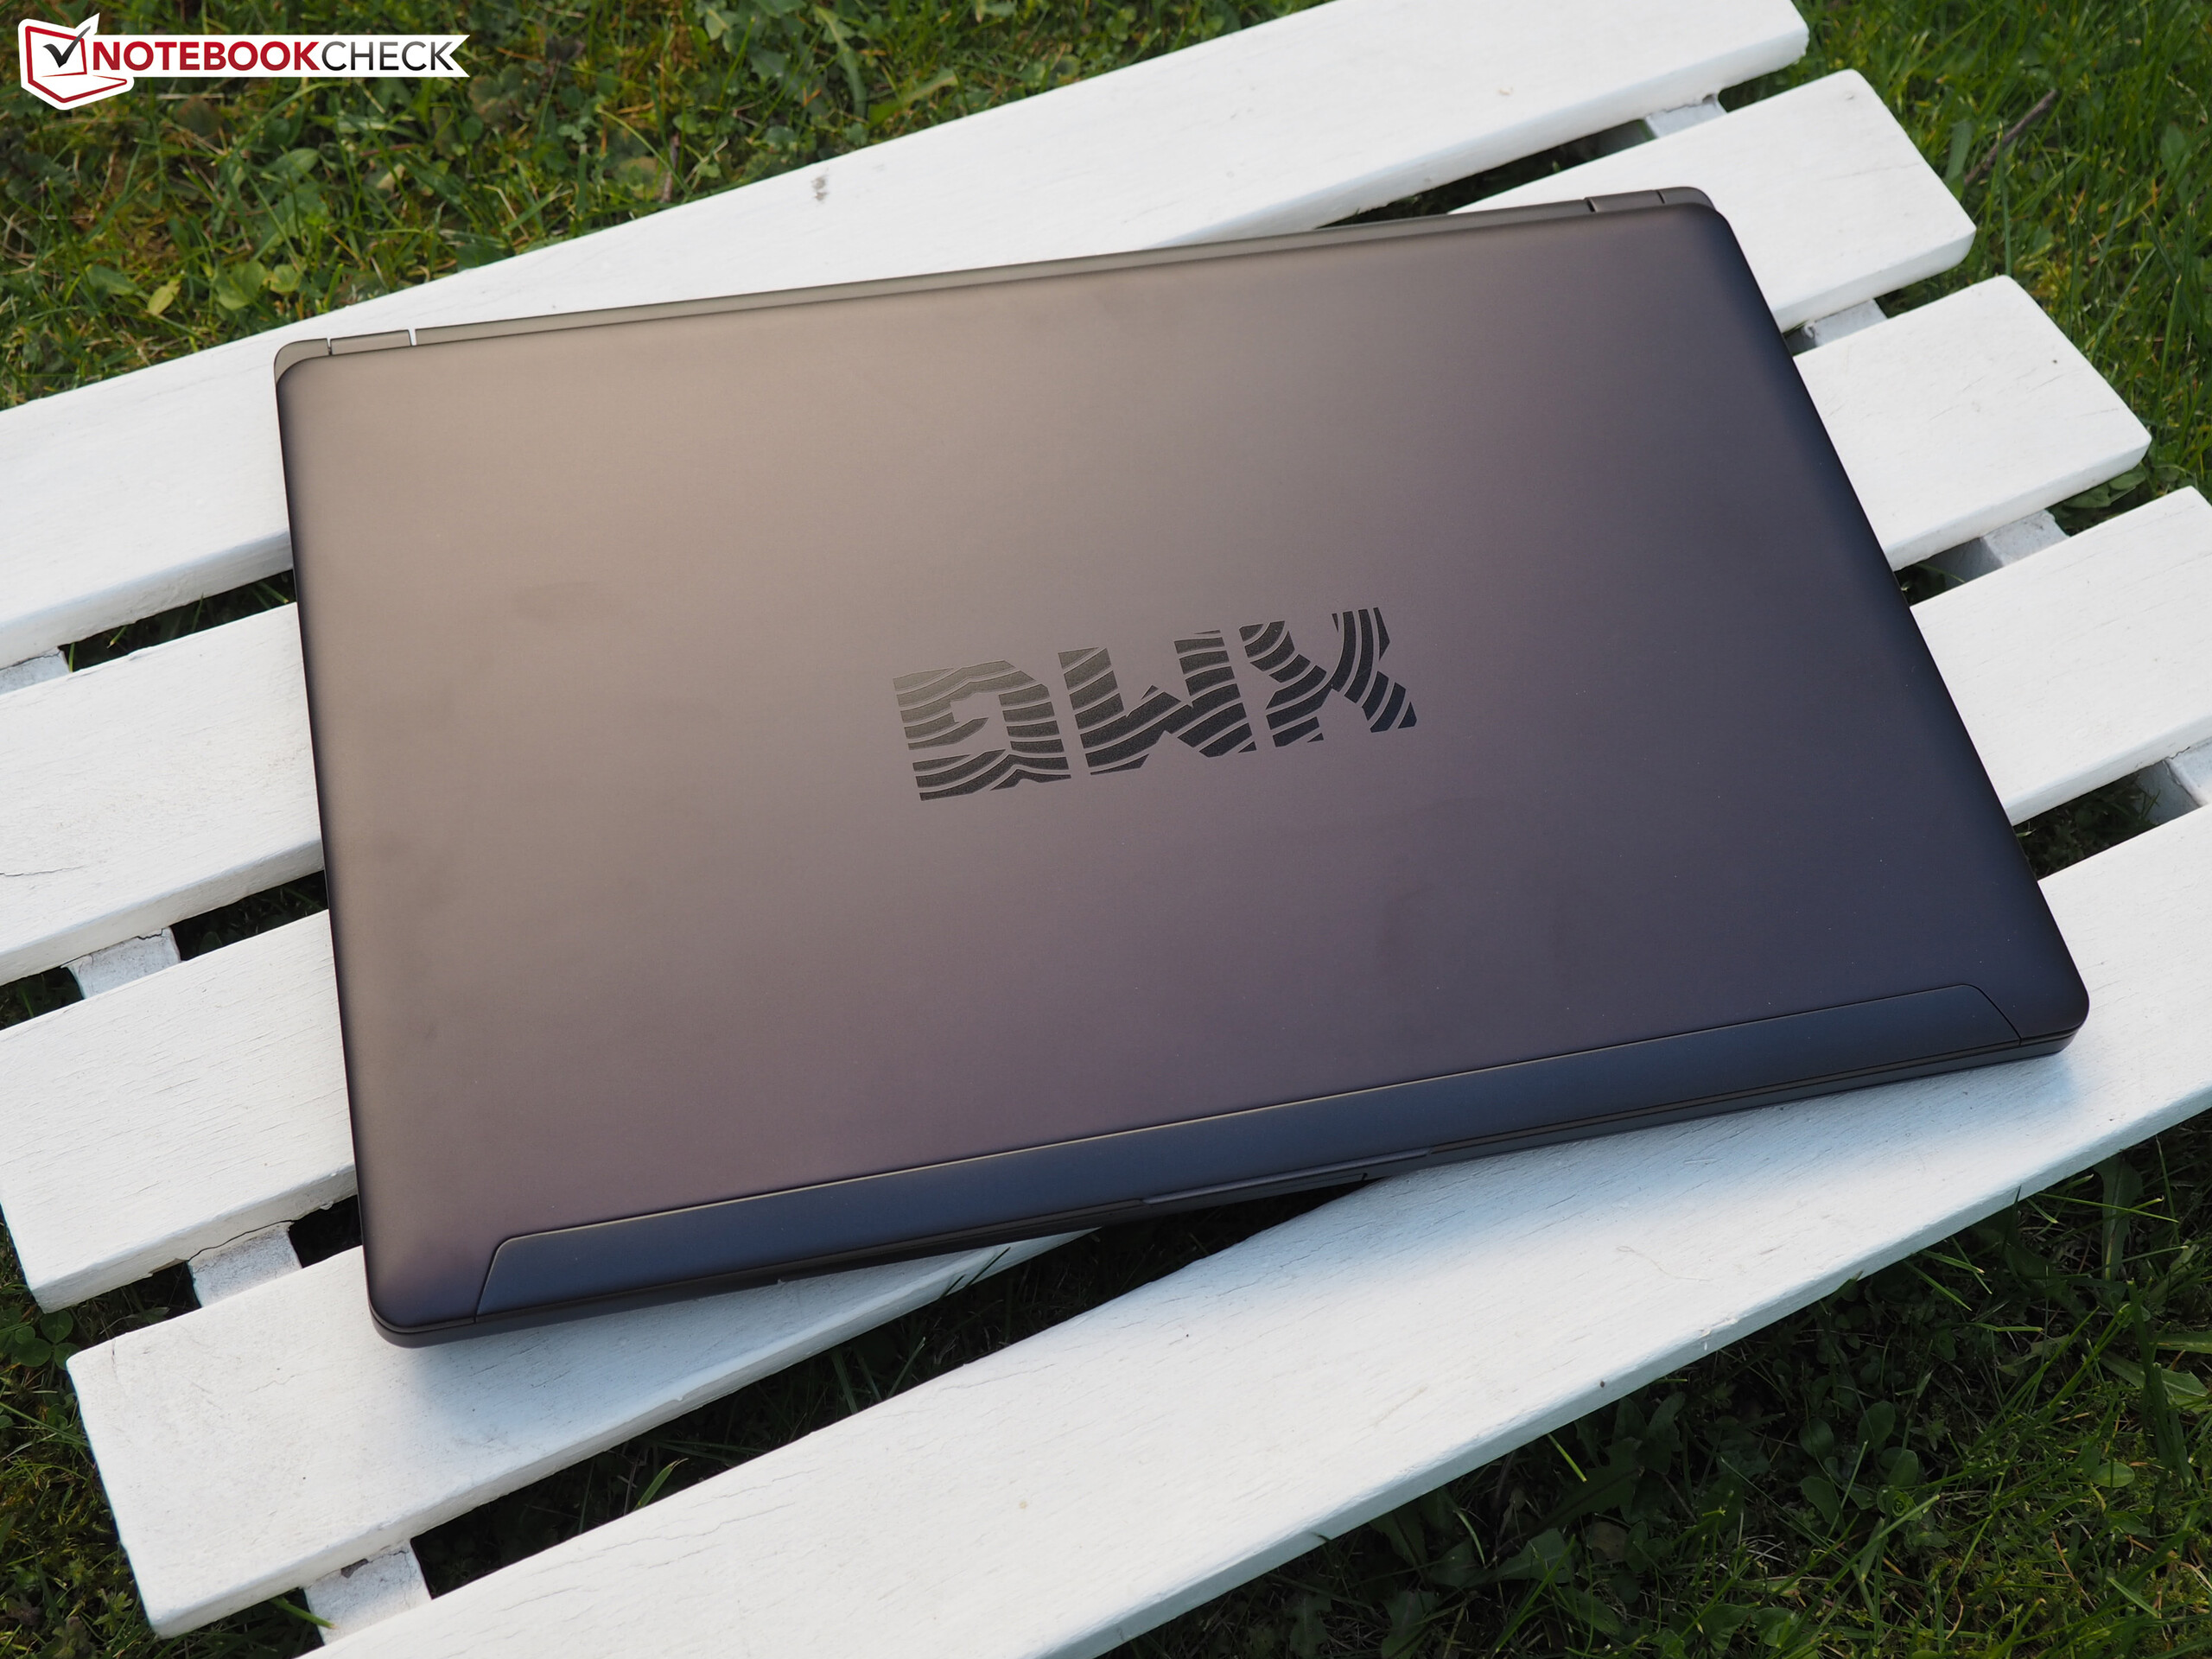
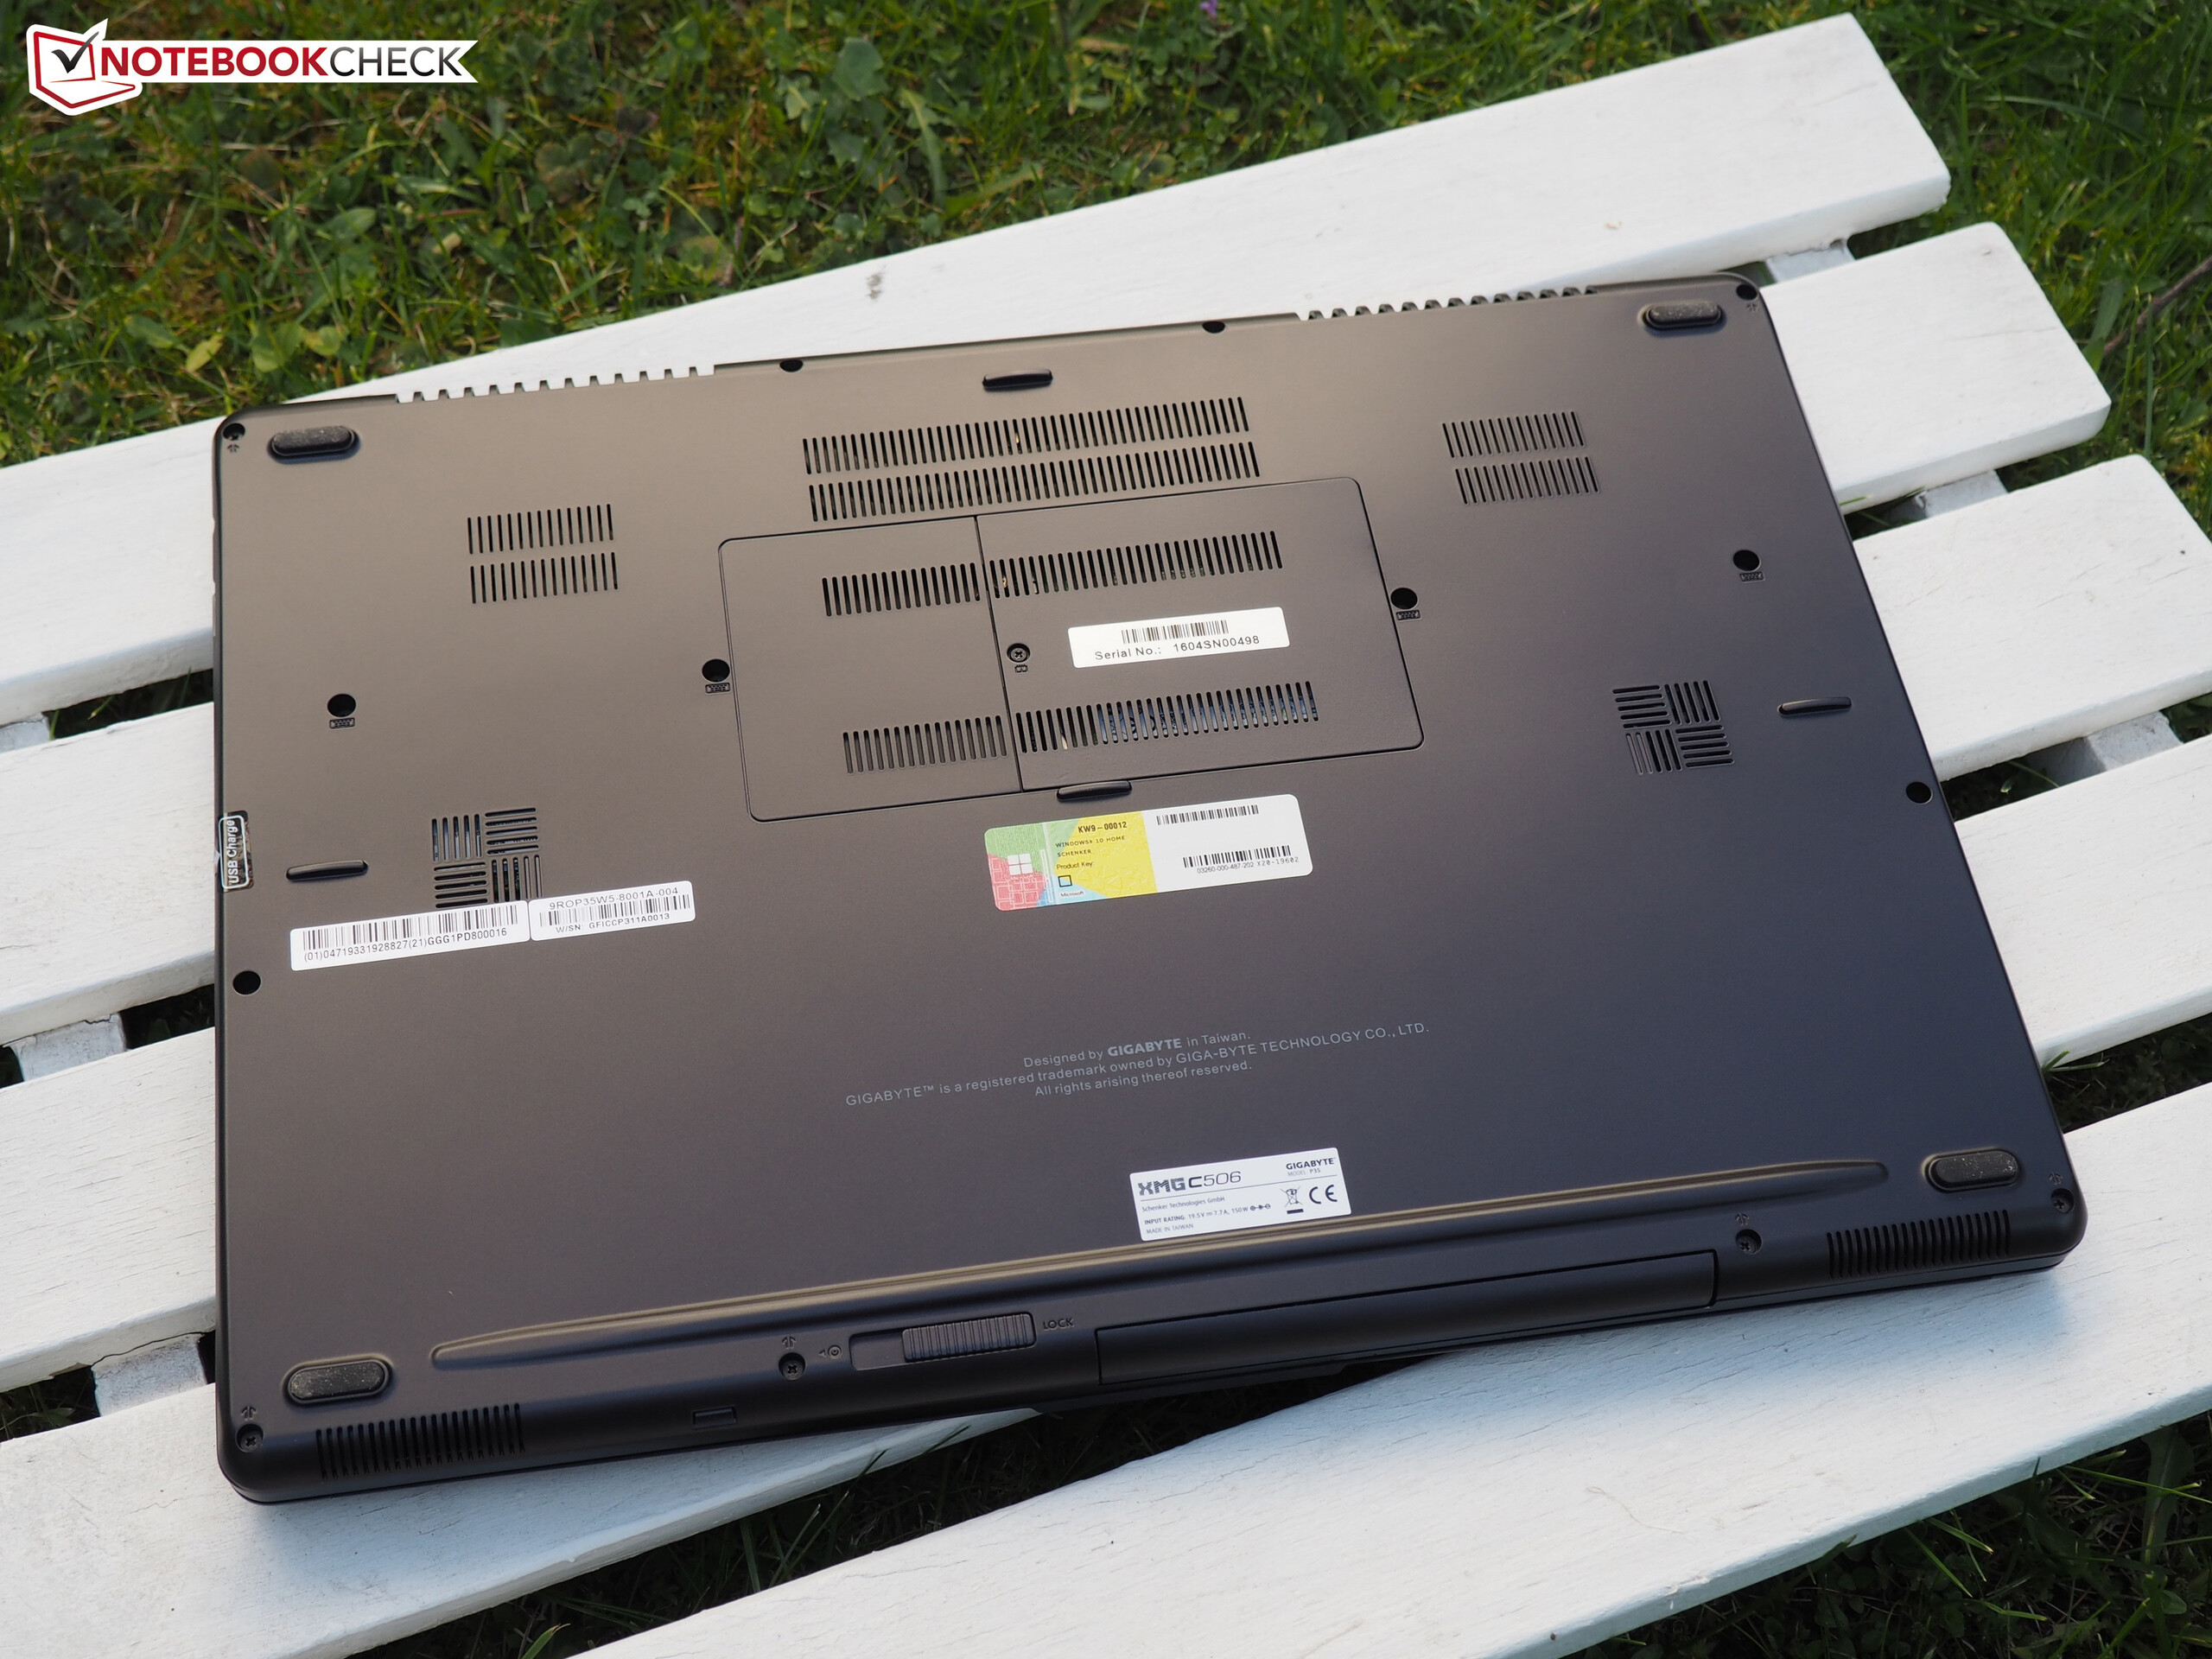
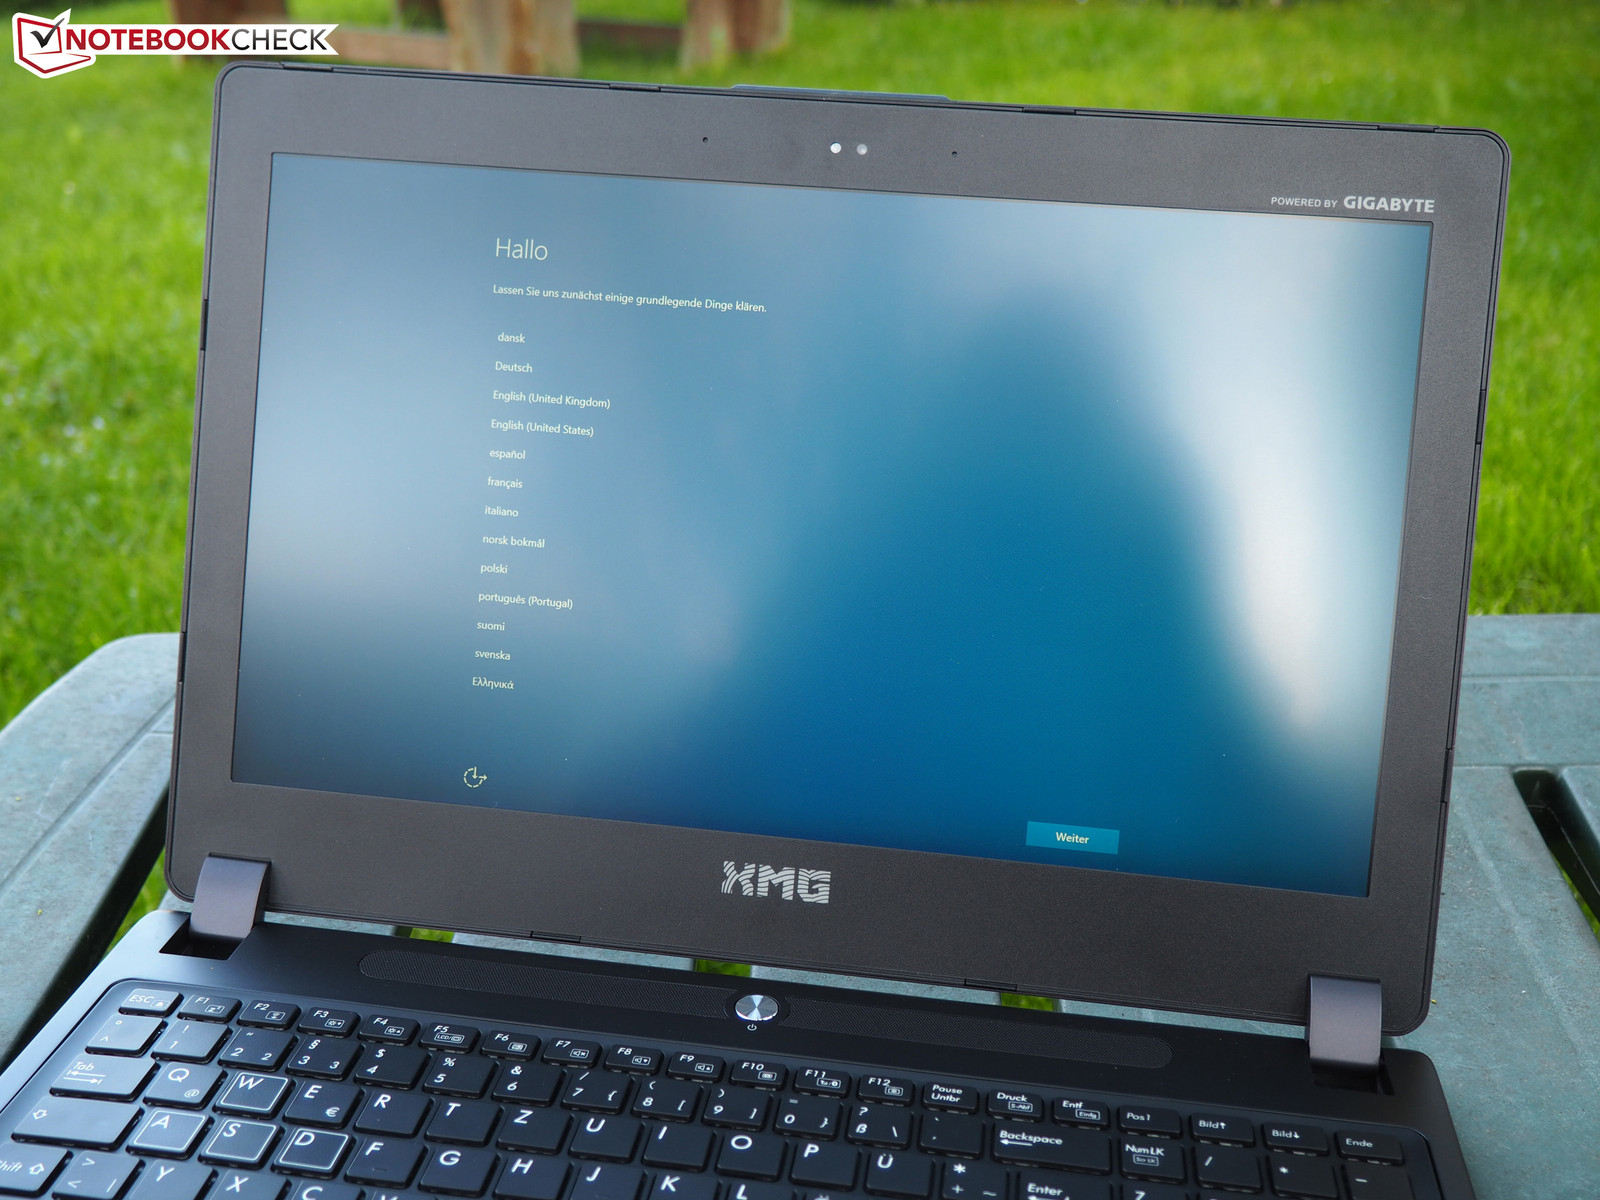
Case
Apart from its slightly different lid, the 15-inch device is identical to Gigabyte's original. As can be read in the review of the P35X v5, the chassis scores with high-quality materials, slim build and good stability. The design is relatively unobtrusive, which is also positive in the author's opinion. The build, as typical for Gigabyte, is on a mediocre level. Closer inspection reveals some slightly uneven transitions.
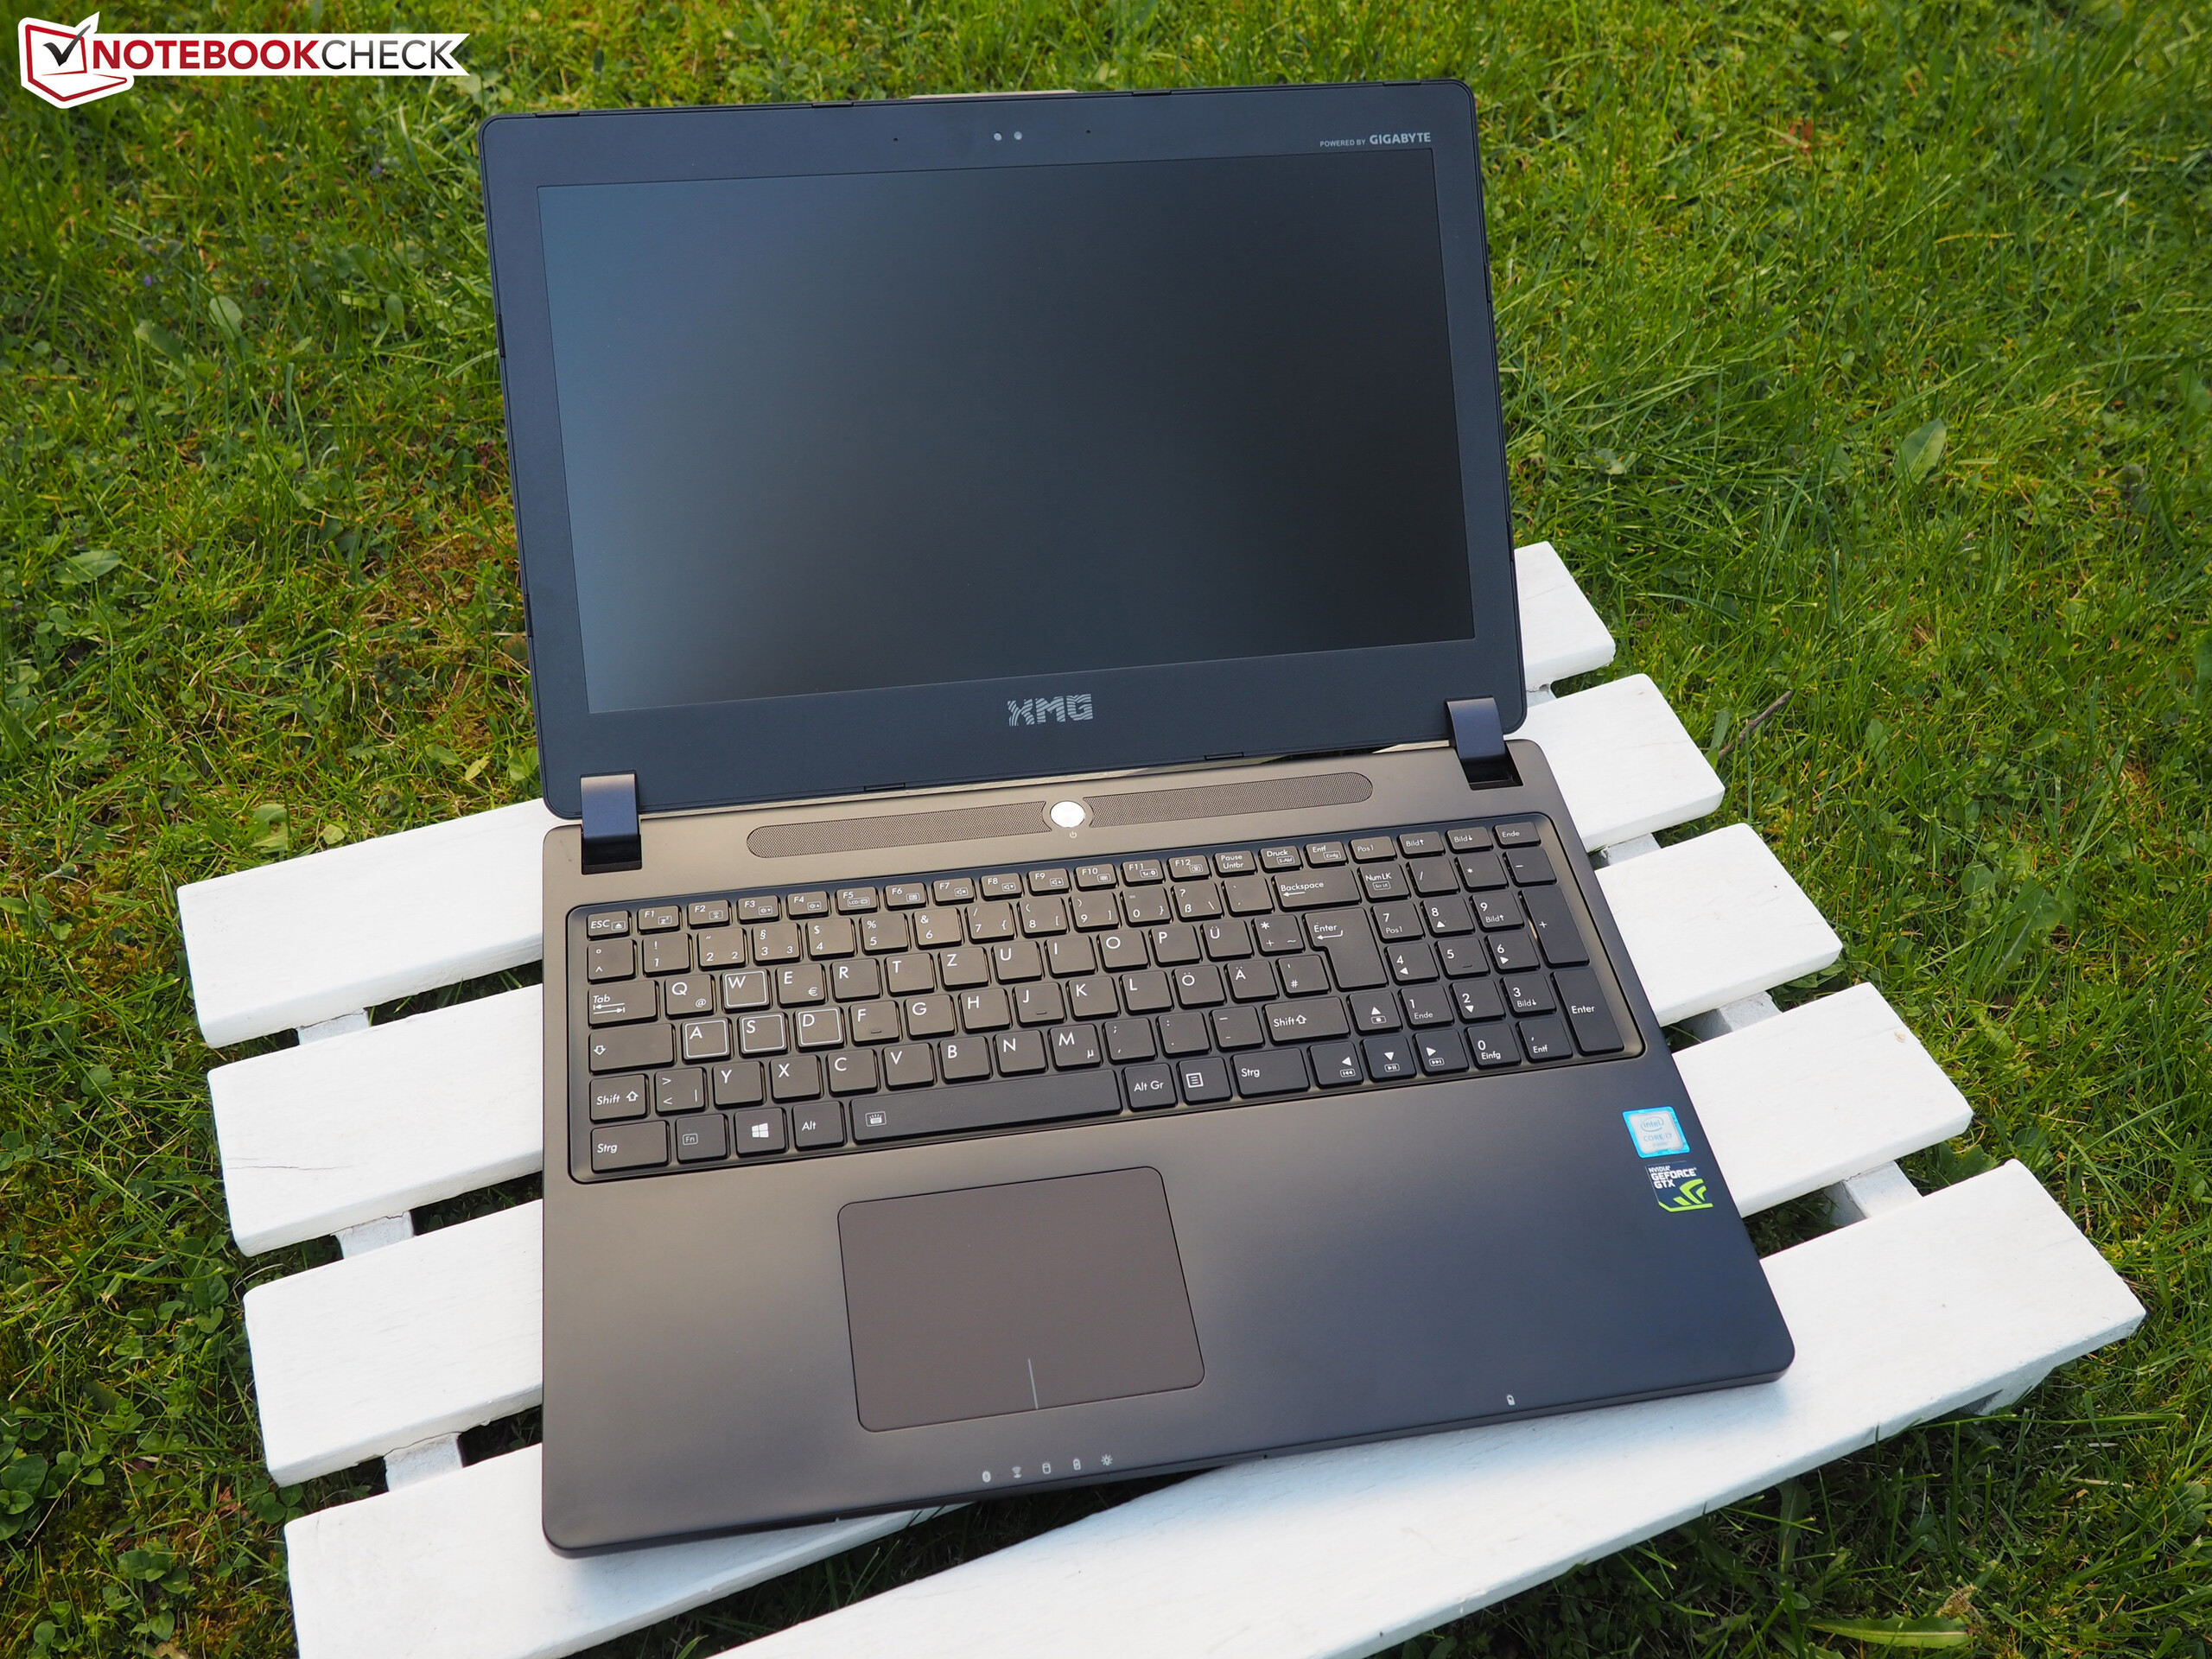
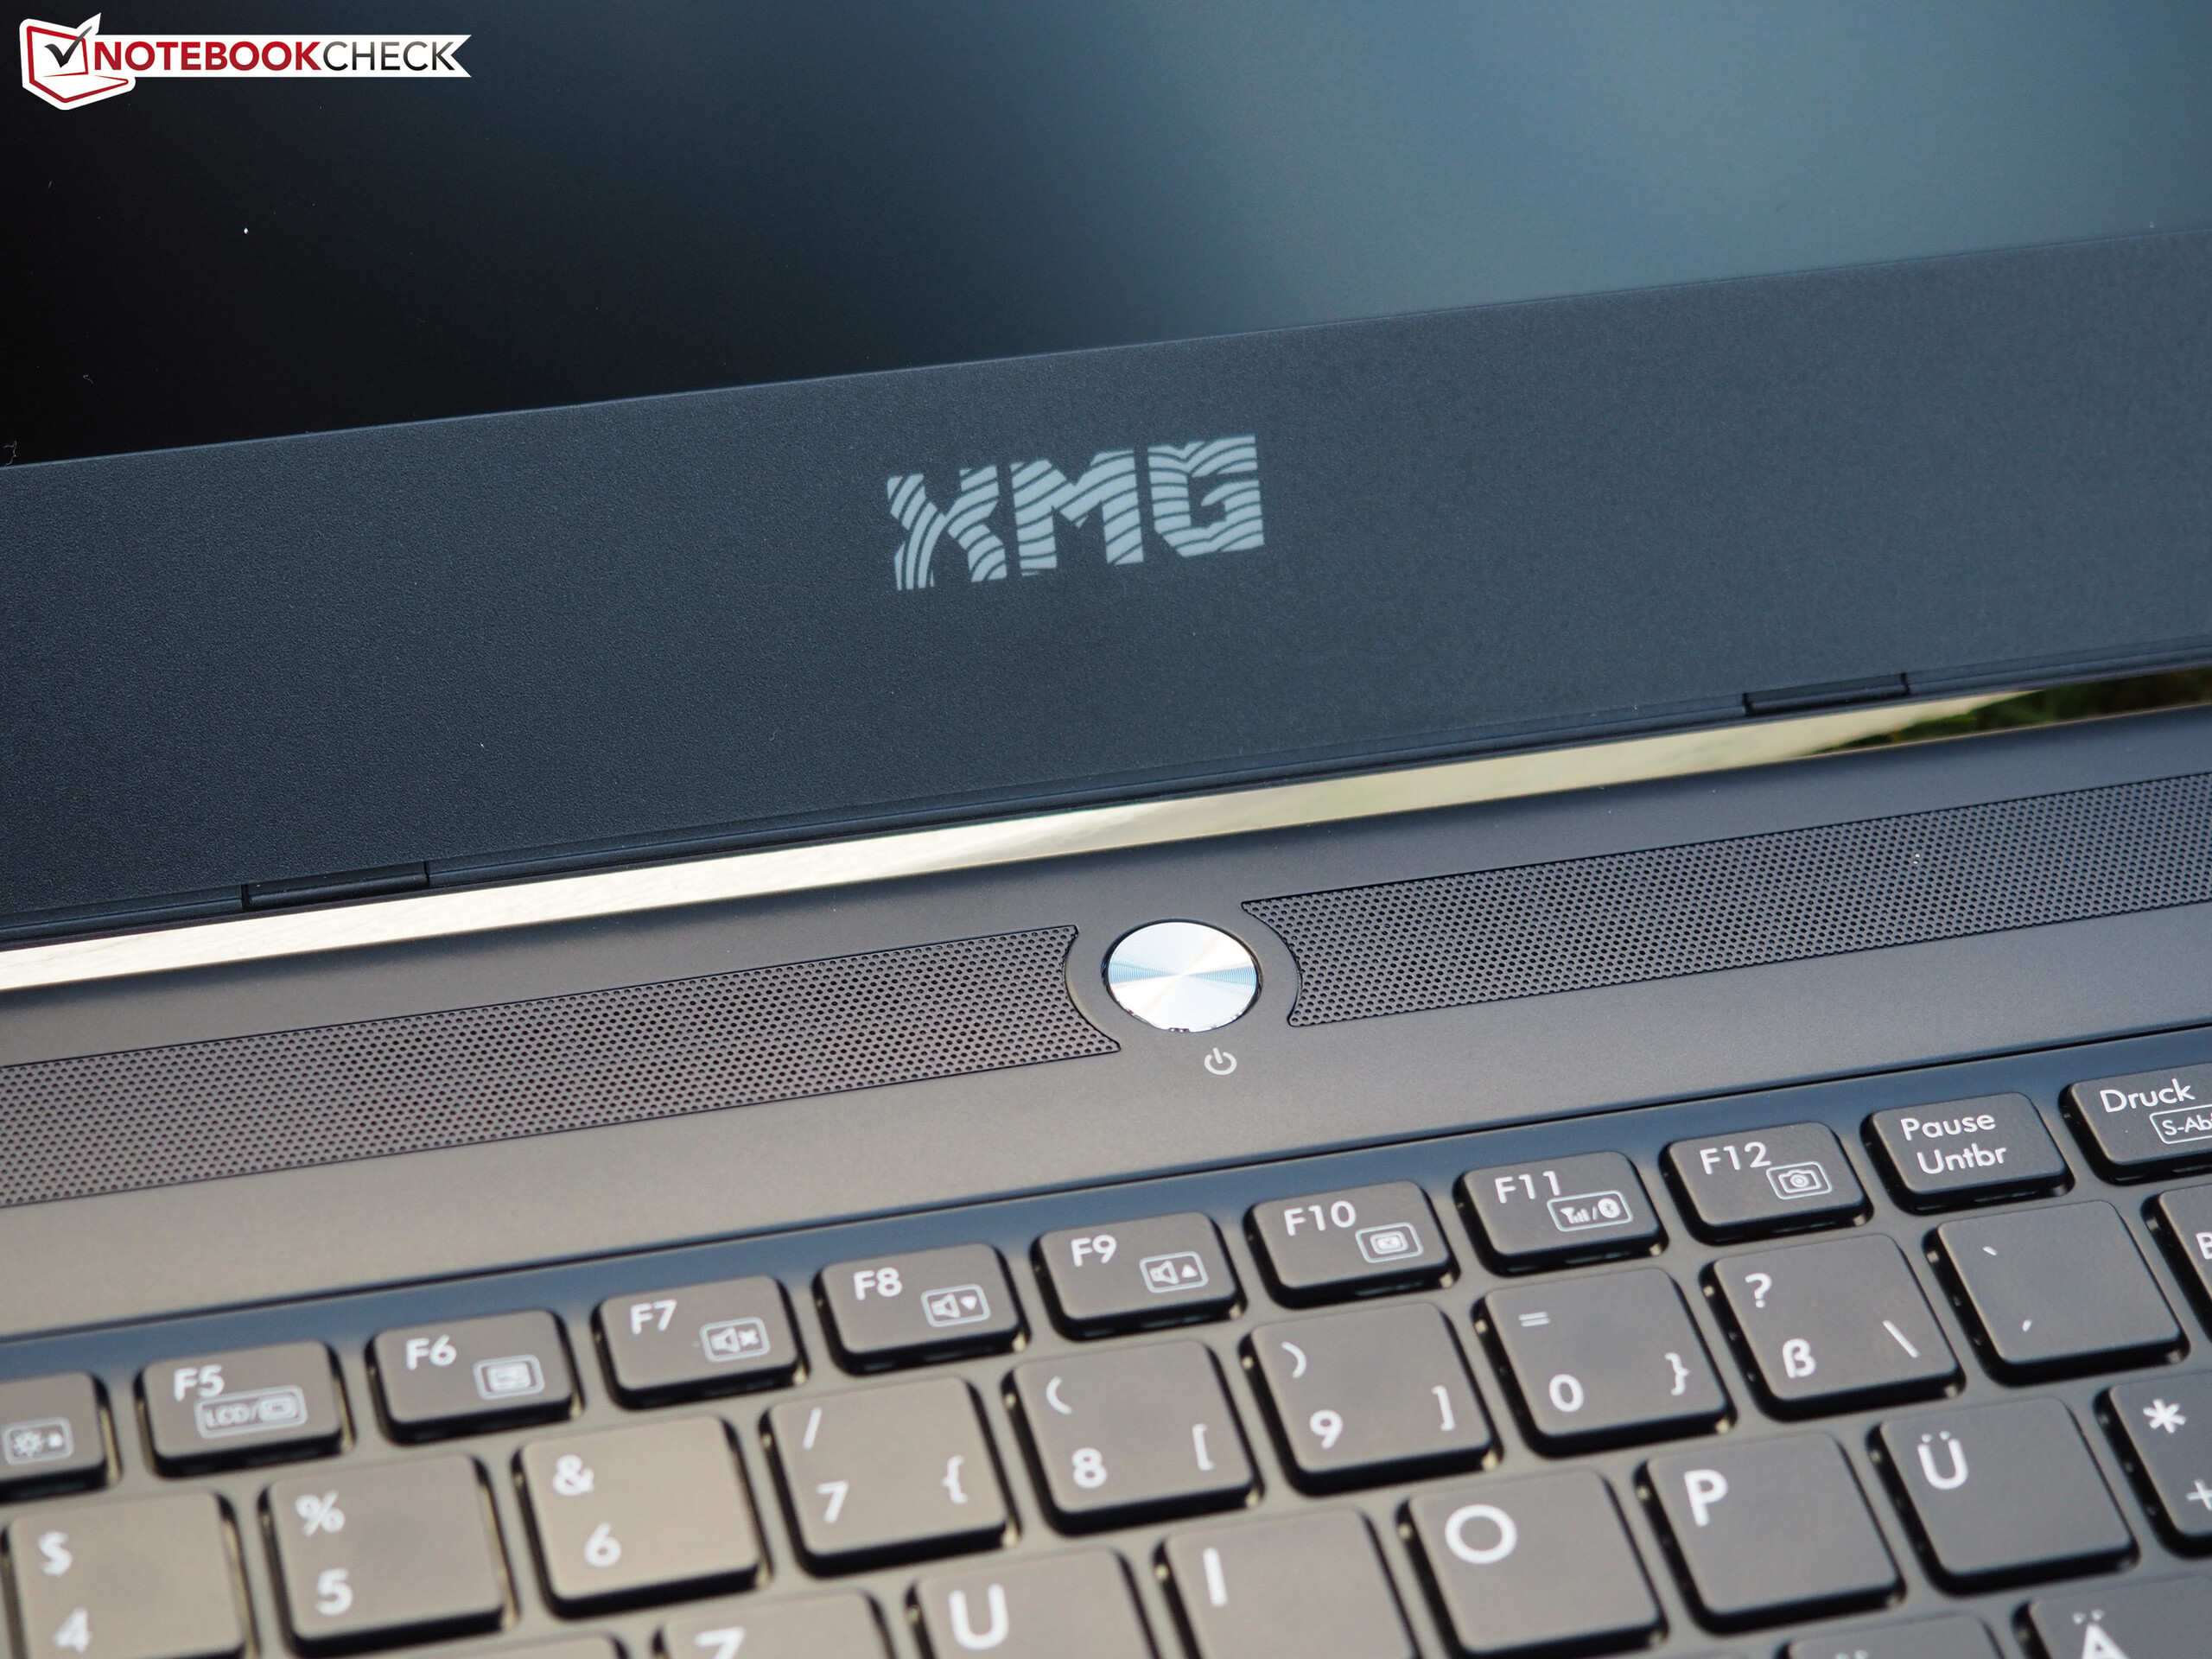
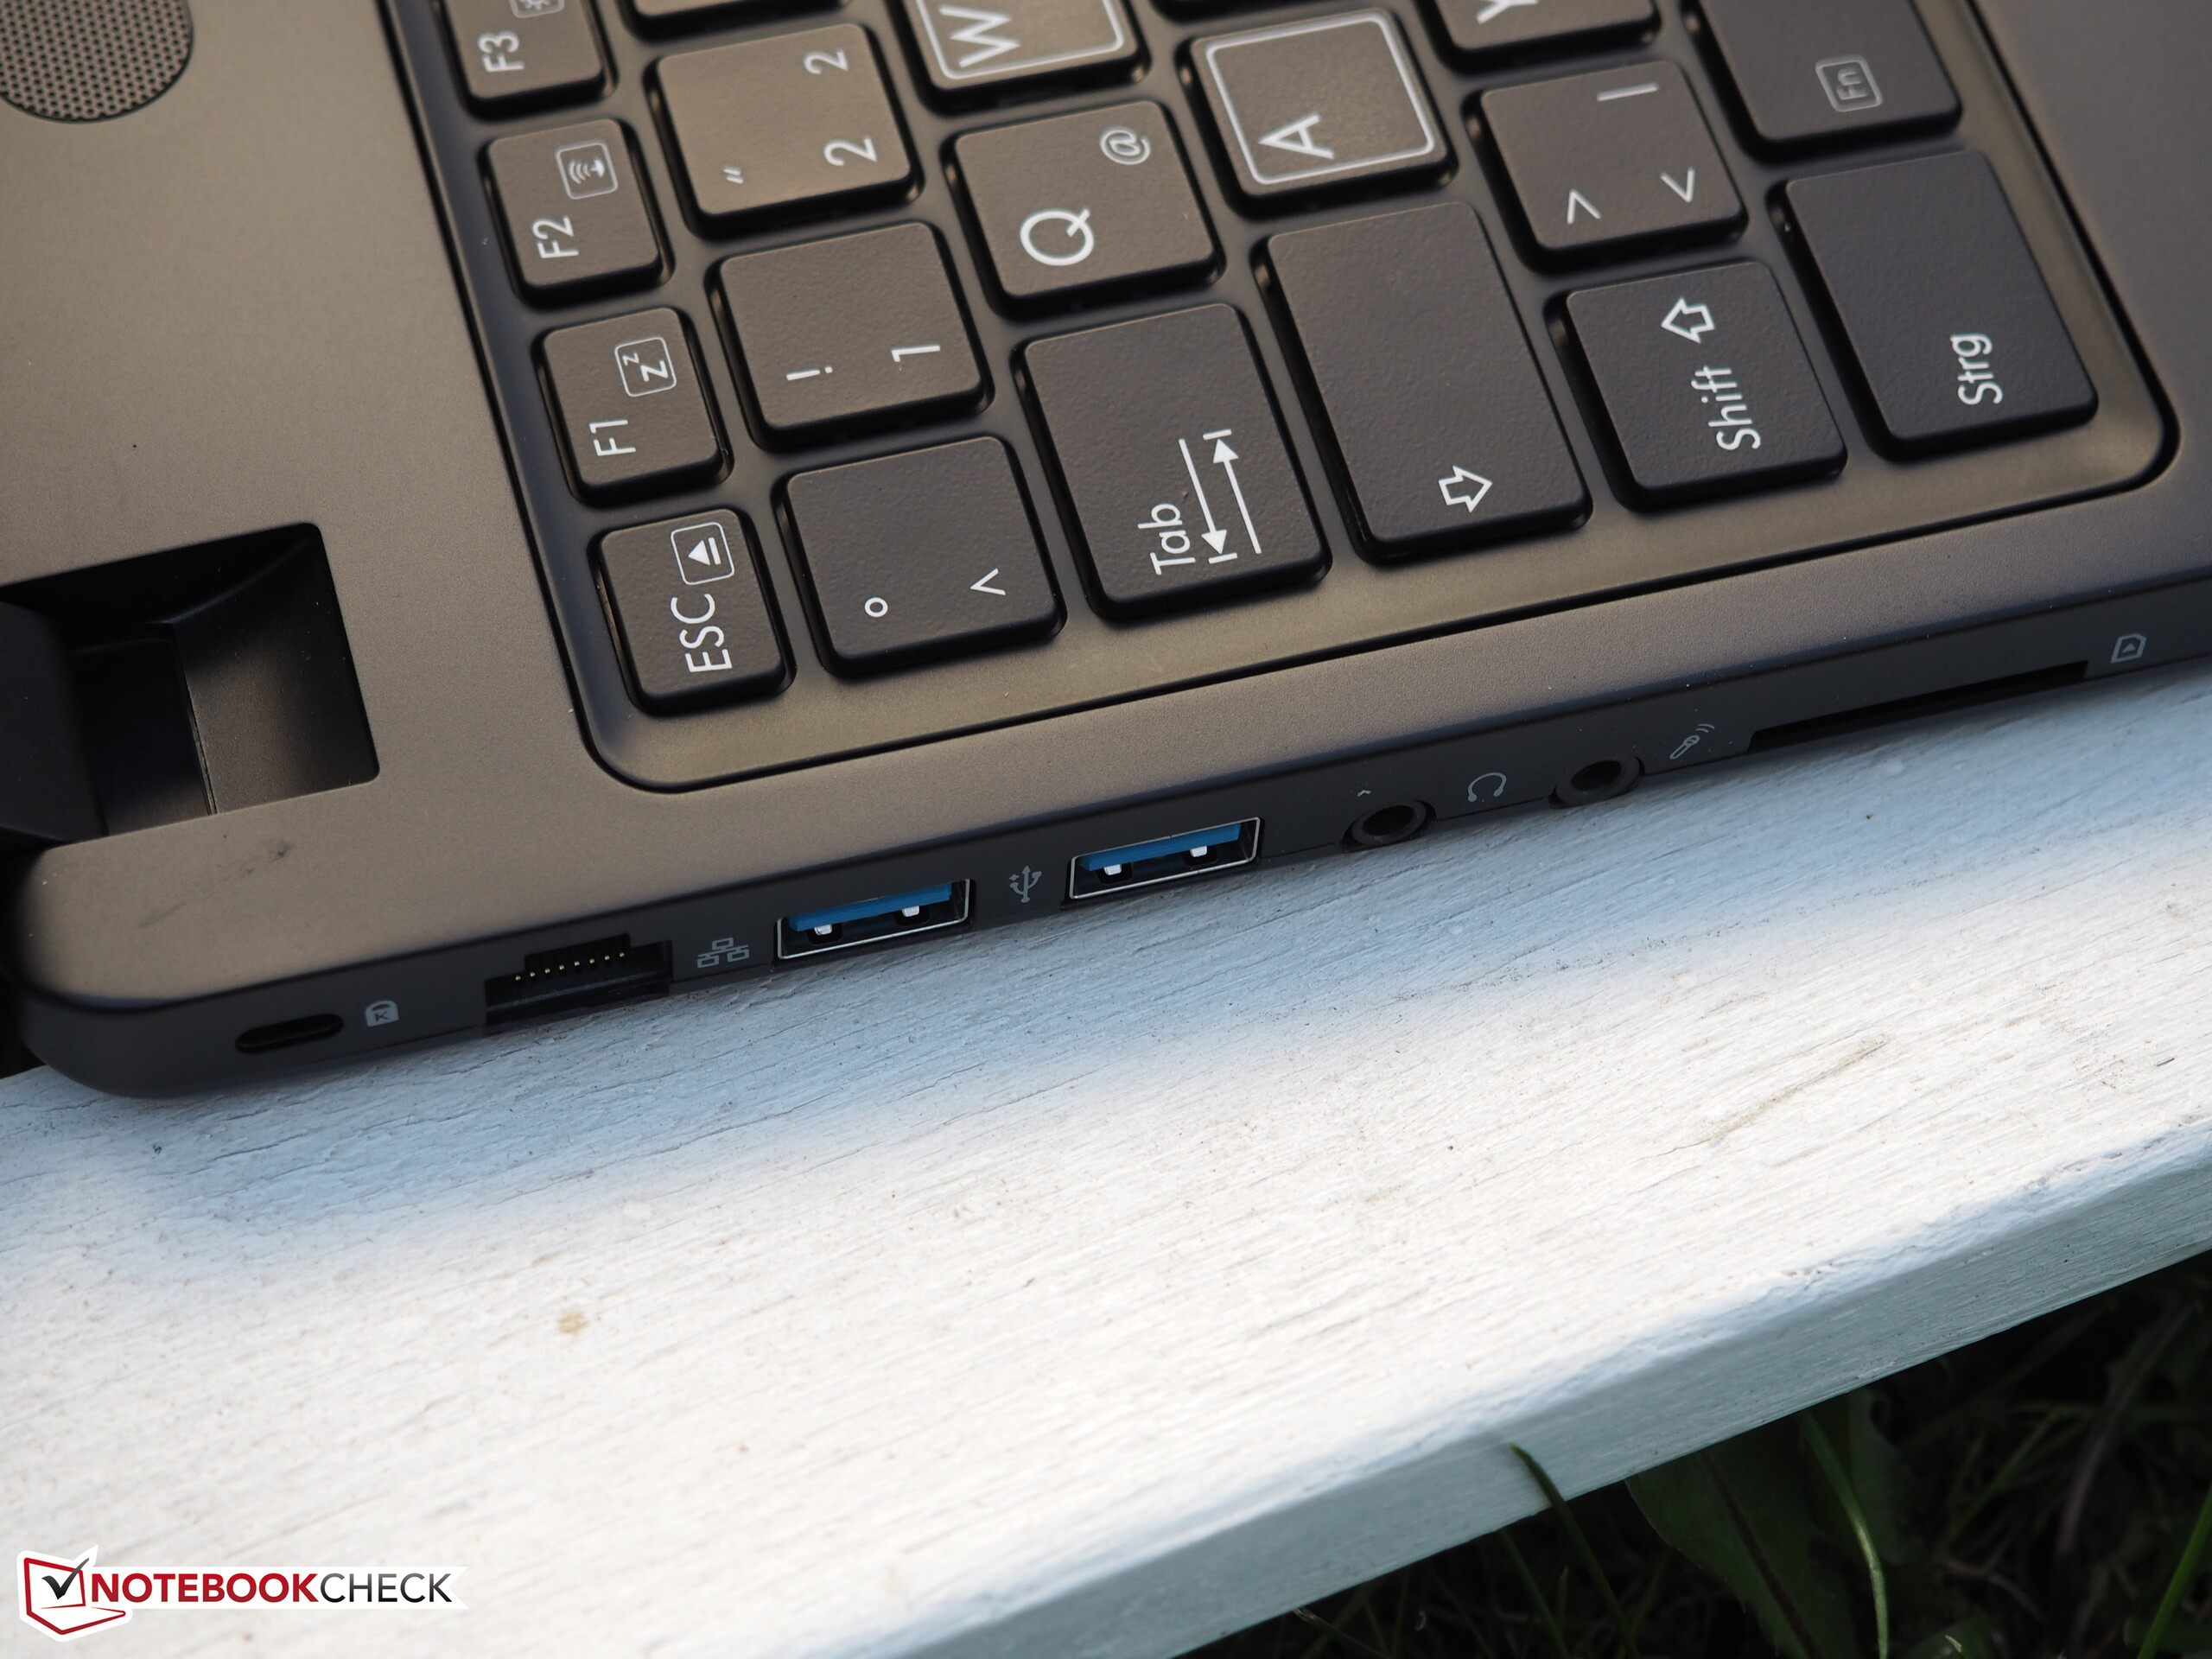
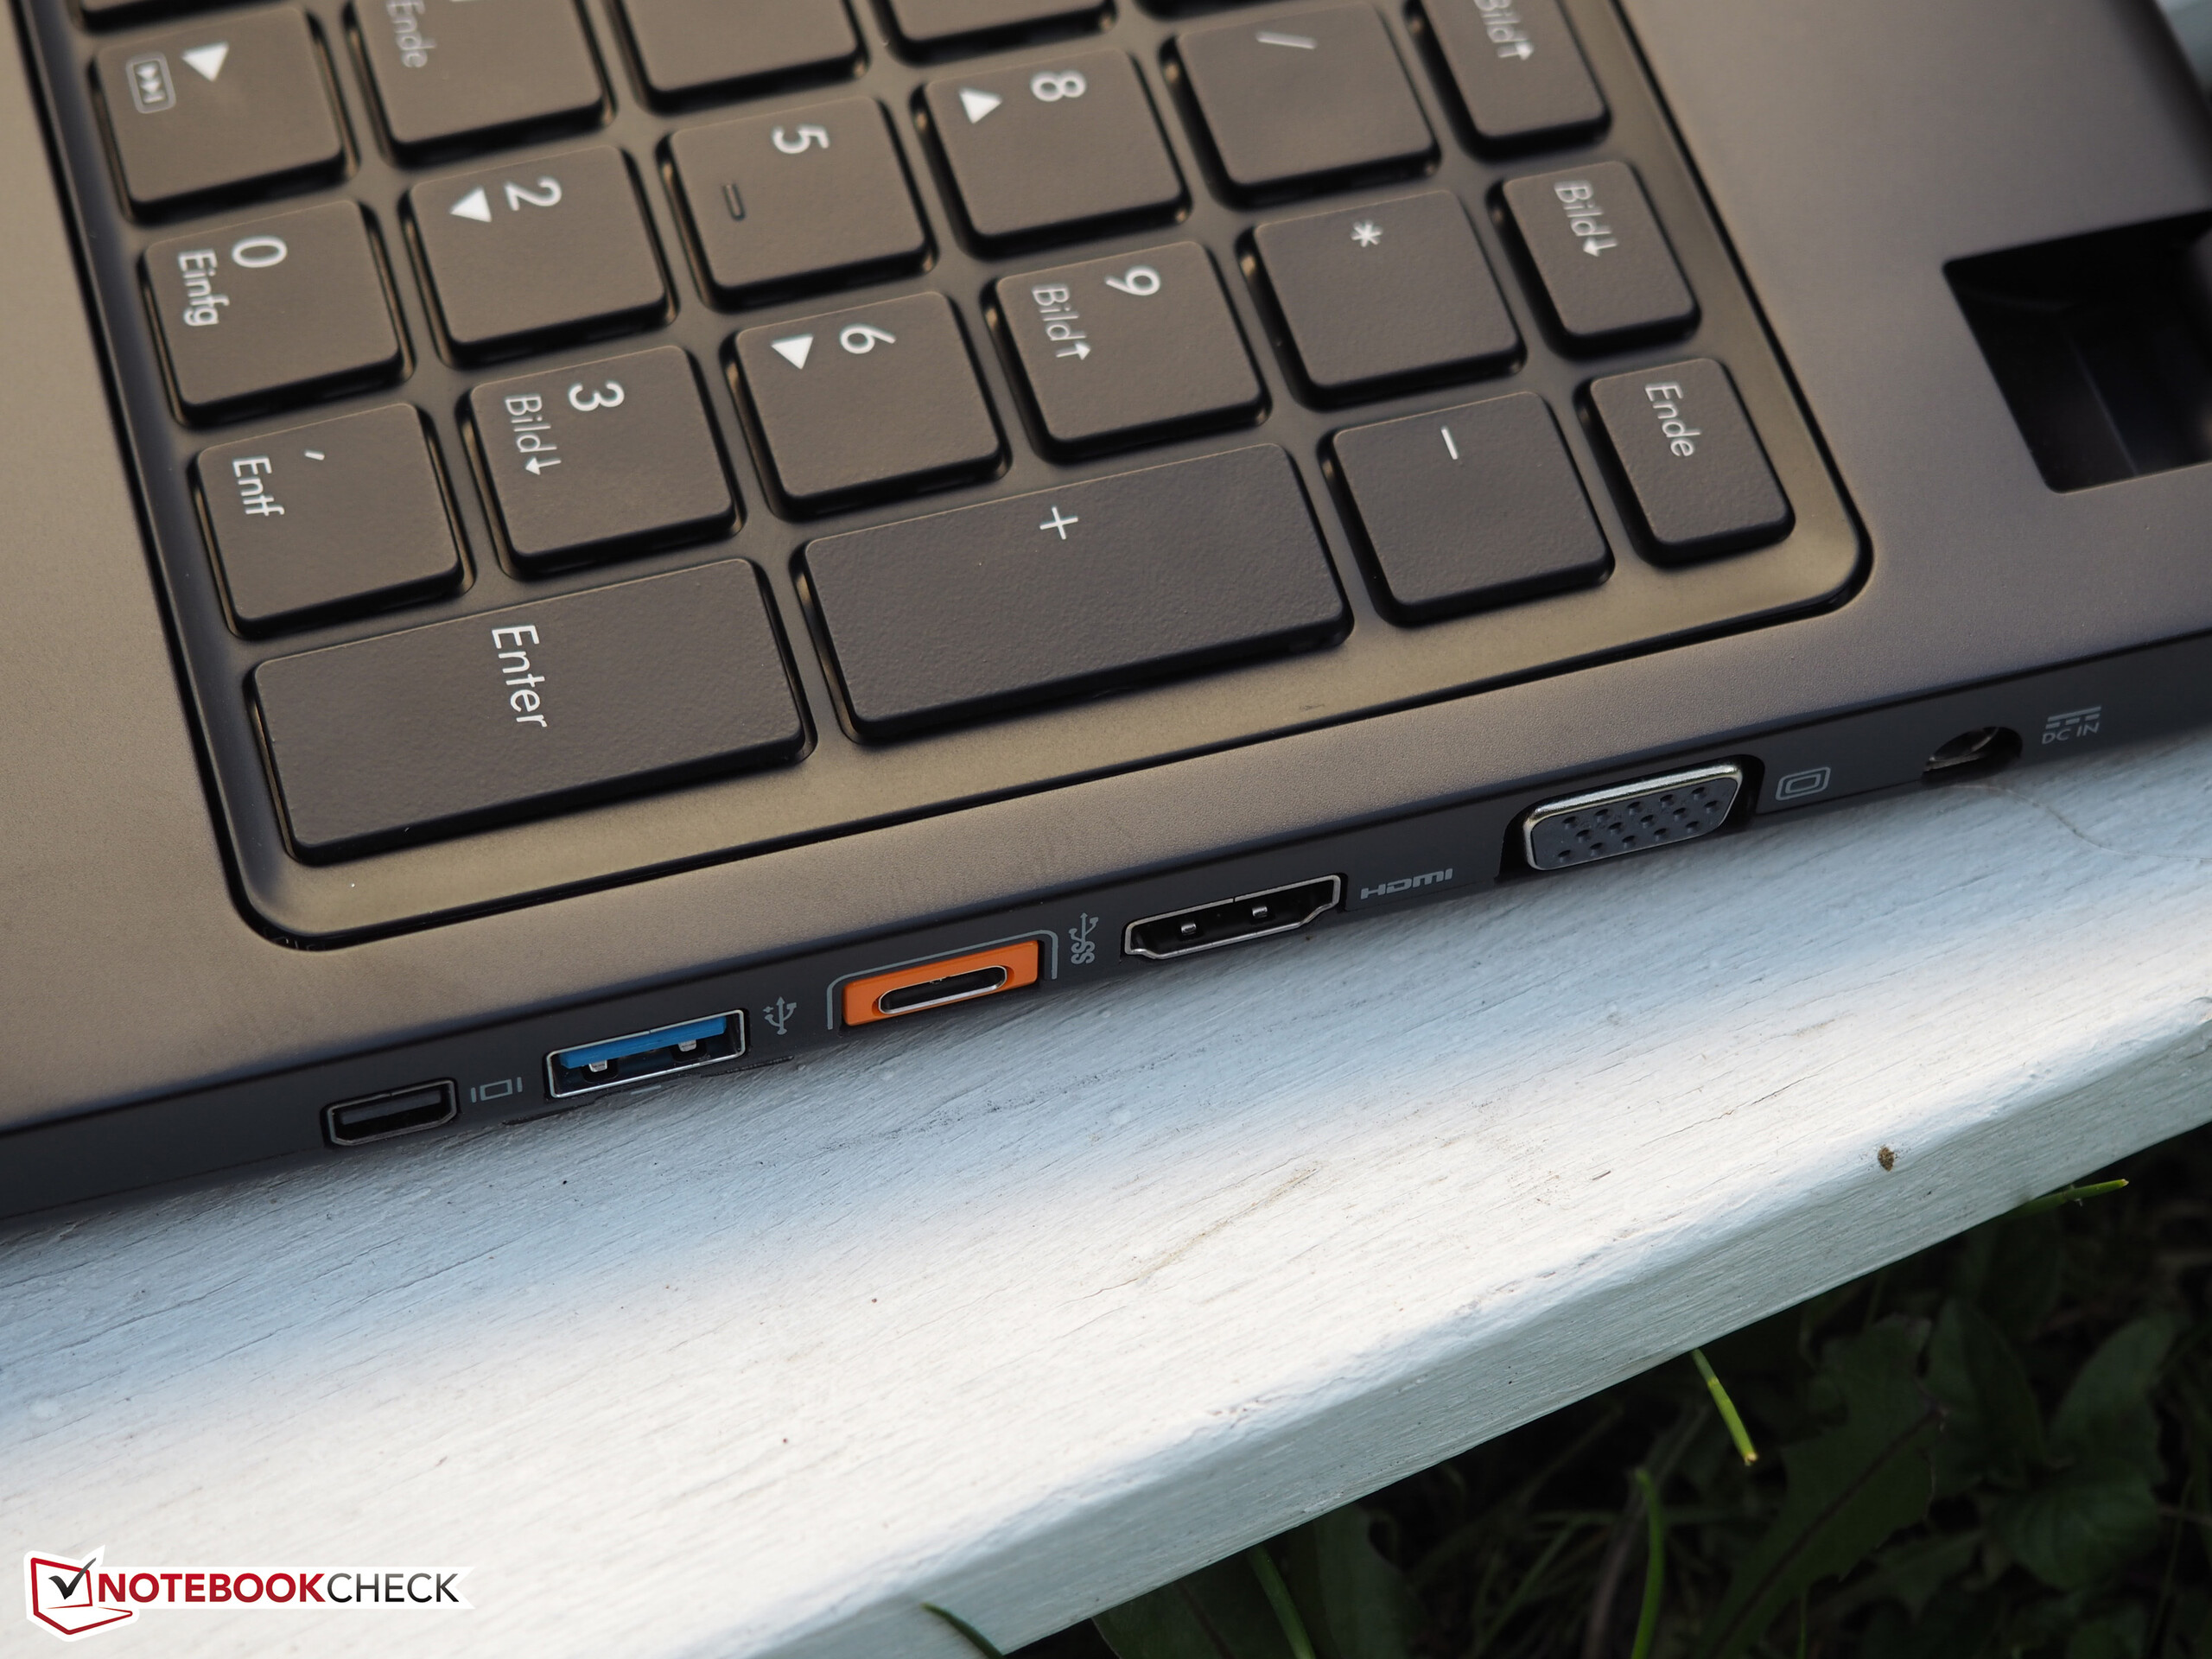
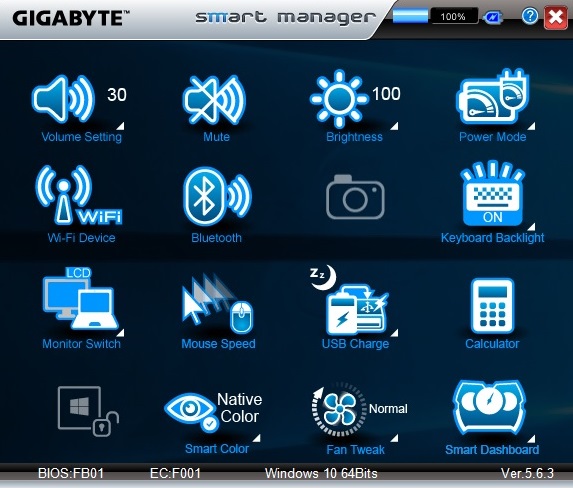
In return, the XMG C506 strikes with useful software. Above all, we would mention the "Smart Manager" with the "Fan Tweak" fan management (we used "Normal" for the tests), and system monitoring "Dashboard". The tool "Smart Update" also appealed to us. Owing to the relationship between Gigabyte's counterpart, the chapters concerning case, connectivity, input device and sound will be skipped in this test. More information can be found here in case of interest.
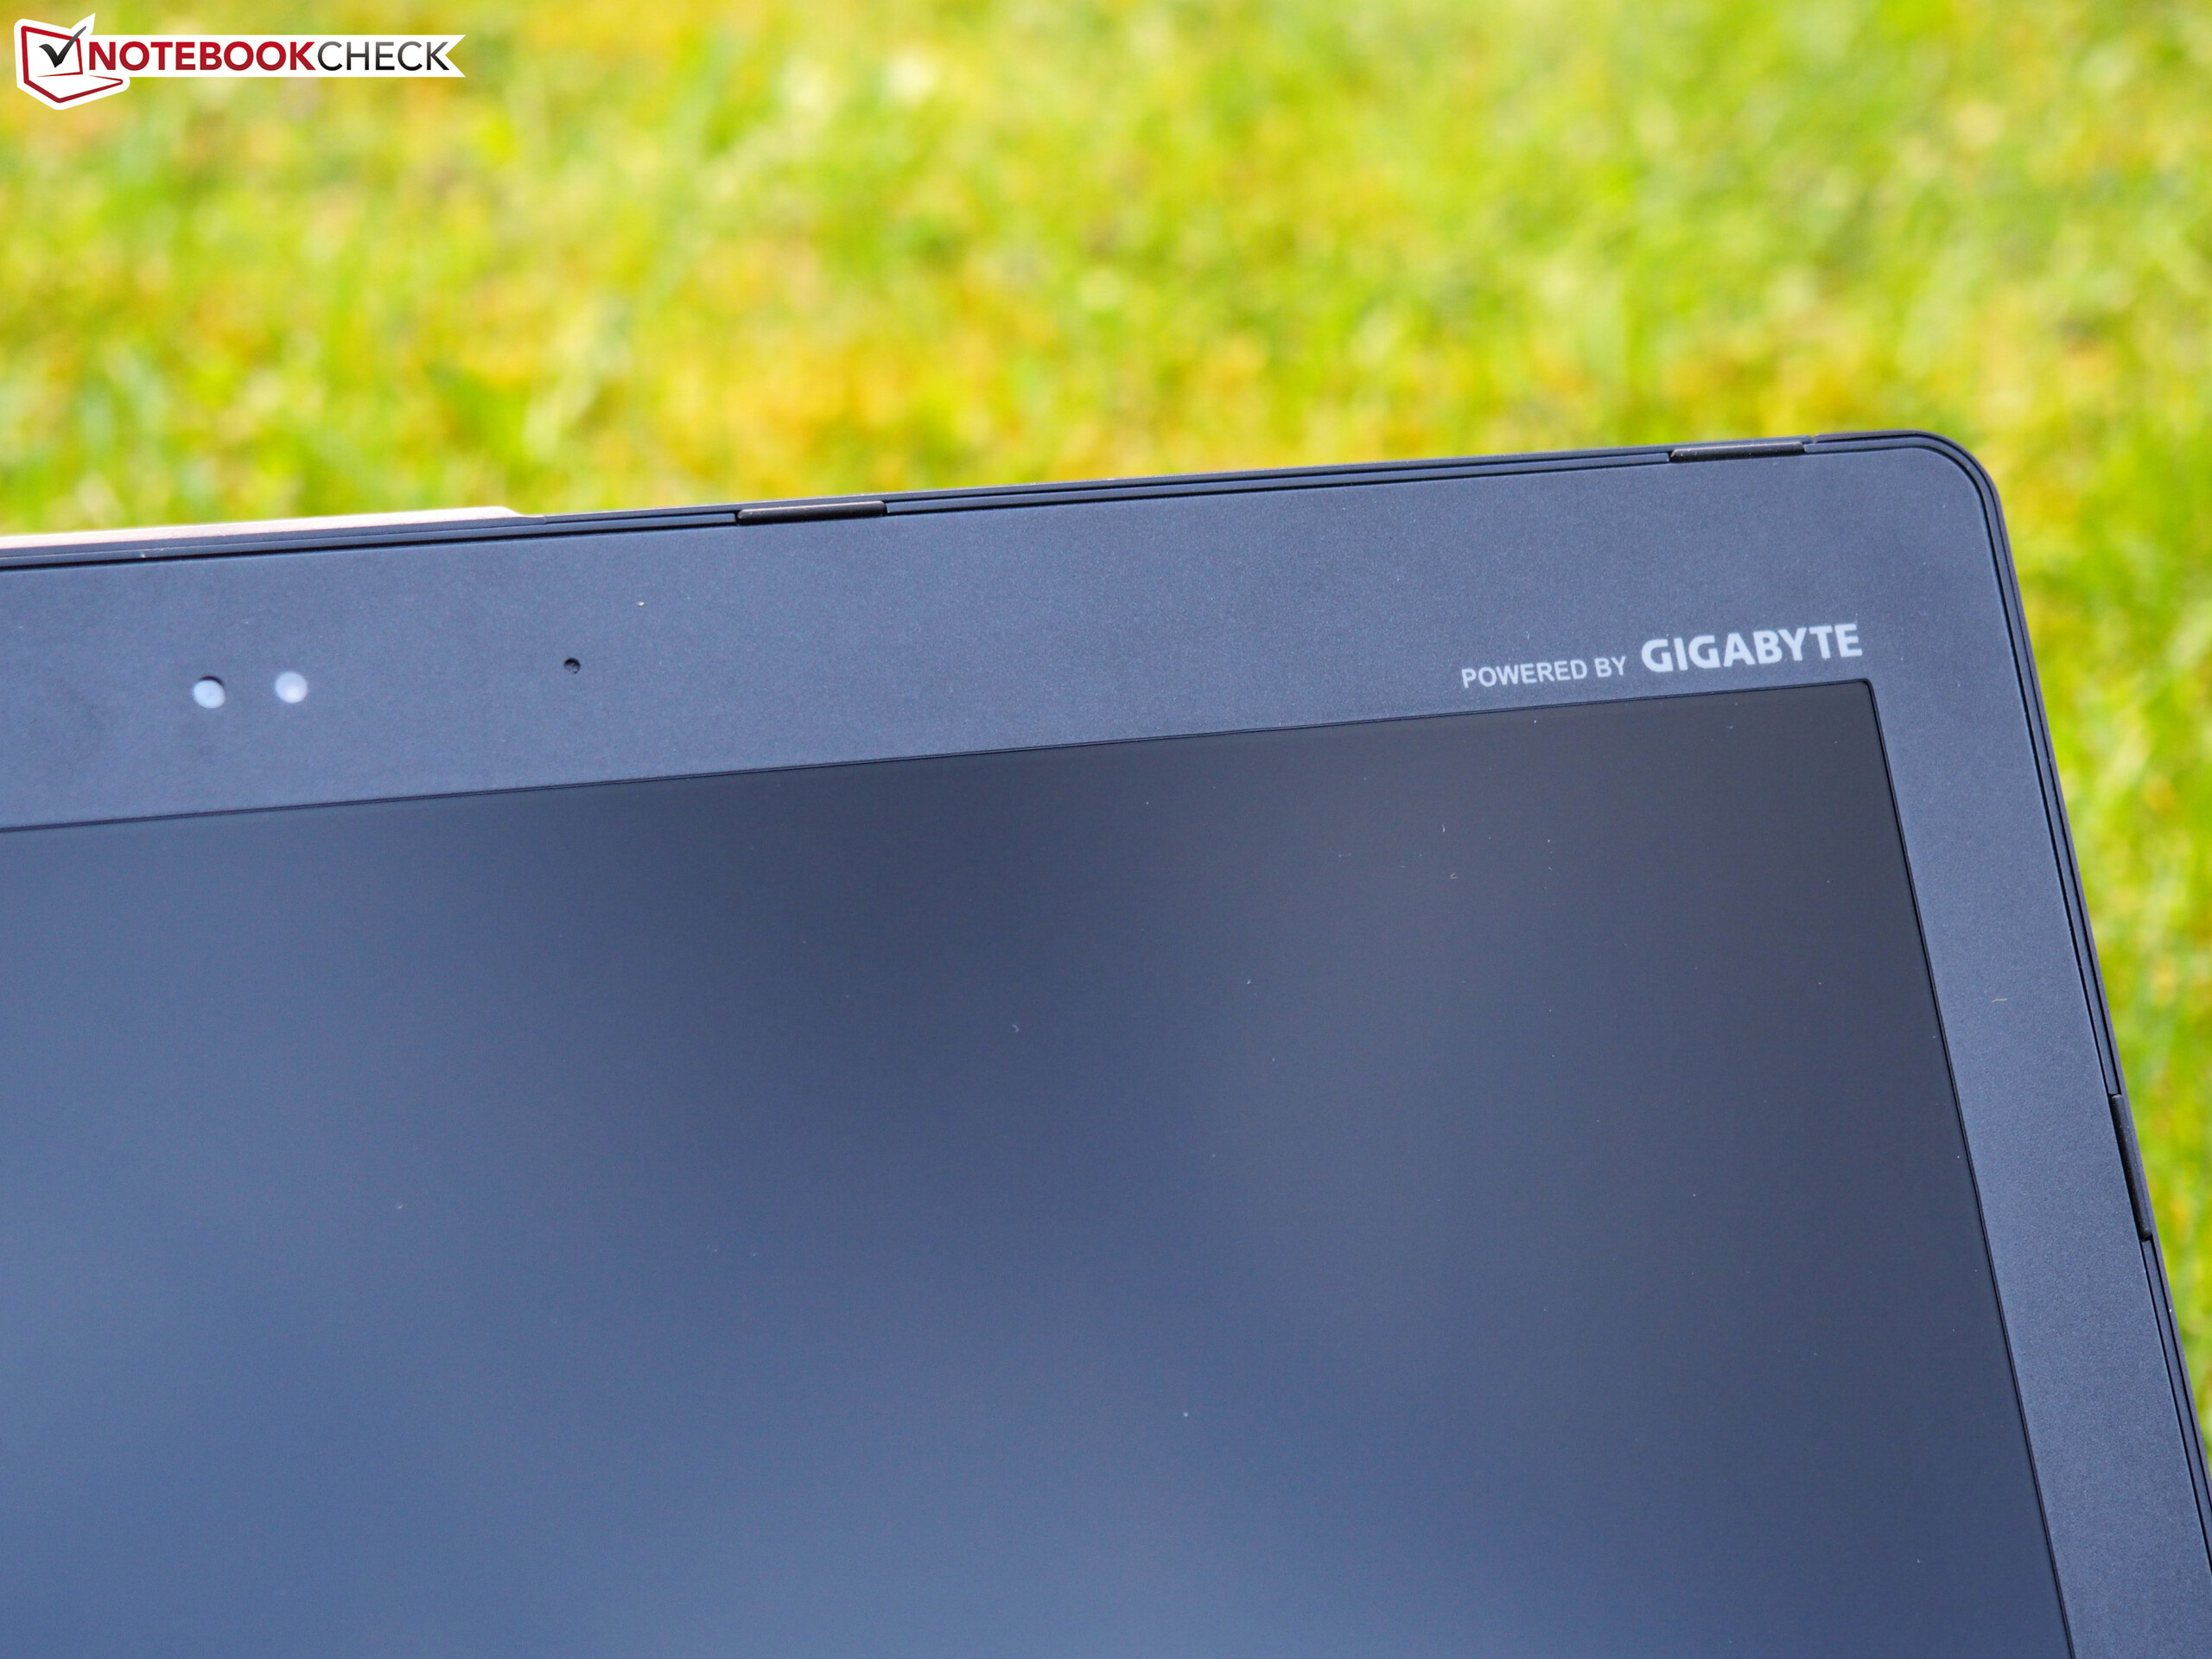
Display
While the review sample of the P35X v5 was equipped with a UHD screen (3840x2160 pixels), an FHD panel with 1920x1080 pixels is installed in the XMG C506. However, this is not a bad decision when looking at the computing requirement. Even the GTX 980M often finds its limits with 4K solutions.
| |||||||||||||||||||||||||
Brightness Distribution: 88 %
Center on Battery: 289 cd/m²
Contrast: 1112:1 (Black: 0.26 cd/m²)
ΔE ColorChecker Calman: 4.47 | ∀{0.5-29.43 Ø4.71}
ΔE Greyscale Calman: 3.05 | ∀{0.09-98 Ø4.96}
81% sRGB (Argyll 1.6.3 3D)
54% AdobeRGB 1998 (Argyll 1.6.3 3D)
59.6% AdobeRGB 1998 (Argyll 3D)
81.5% sRGB (Argyll 3D)
64.4% Display P3 (Argyll 3D)
Gamma: 2.51
CCT: 6684 K
| Schenker XMG C506 LG Philips LP156WF4 (LGD040E) | Schenker XMG A516 LG Philips LP156WF6 (LGD046F) | Gigabyte P55W v5 LG Philips LP156WF4-SPH1 | Gigabyte P35X v5 SHP144E | Schenker XMG P506 PRO LG Philips LP156WF6 (LGD046F) | |
|---|---|---|---|---|---|
| Display | 1% | -15% | 10% | 2% | |
| Display P3 Coverage (%) | 64.4 | 64.7 0% | 50.1 -22% | 64.8 1% | 65.1 1% |
| sRGB Coverage (%) | 81.5 | 83.2 2% | 73.5 -10% | 95.8 18% | 83.7 3% |
| AdobeRGB 1998 Coverage (%) | 59.6 | 60.8 2% | 51.2 -14% | 66.9 12% | 61.2 3% |
| Response Times | 13% | 4% | -26% | 15% | |
| Response Time Grey 50% / Grey 80% * (ms) | 48 ? | 41 ? 15% | 44 ? 8% | 51.2 ? -7% | 37 ? 23% |
| Response Time Black / White * (ms) | 27 ? | 24 ? 11% | 27 ? -0% | 39.2 ? -45% | 25 ? 7% |
| PWM Frequency (Hz) | 200 ? | ||||
| Screen | -6% | -7% | -25% | -2% | |
| Brightness middle (cd/m²) | 289 | 312 8% | 254 -12% | 278.9 -3% | 312 8% |
| Brightness (cd/m²) | 296 | 303 2% | 267 -10% | 272 -8% | 293 -1% |
| Brightness Distribution (%) | 88 | 92 5% | 89 1% | 80 -9% | 87 -1% |
| Black Level * (cd/m²) | 0.26 | 0.3 -15% | 0.28 -8% | 0.562 -116% | 0.32 -23% |
| Contrast (:1) | 1112 | 1040 -6% | 907 -18% | 496 -55% | 975 -12% |
| Colorchecker dE 2000 * | 4.47 | 5.11 -14% | 4.28 4% | 4.47 -0% | 4.45 -0% |
| Colorchecker dE 2000 max. * | 9.27 | 8.96 3% | 10.6 -14% | 8.64 7% | 8.5 8% |
| Greyscale dE 2000 * | 3.05 | 4.41 -45% | 2.77 9% | 6.13 -101% | 3.05 -0% |
| Gamma | 2.51 88% | 2.5 88% | 2.28 96% | 2.2 100% | 2.58 85% |
| CCT | 6684 97% | 6789 96% | 6284 103% | 7047 92% | 6495 100% |
| Color Space (Percent of AdobeRGB 1998) (%) | 54 | 55 2% | 47 -13% | 60.87 13% | 55 2% |
| Color Space (Percent of sRGB) (%) | 81 | 83 2% | 73 -10% | 95.43 18% | 84 4% |
| Total Average (Program / Settings) | 3% /
-2% | -6% /
-7% | -14% /
-18% | 5% /
1% |
* ... smaller is better
We would call the image quality of the installed LG Philips screen good to very good. A black level of 0.26 cd/m² is just as superb for laptop conditions as a contrast of almost 1110:1. The brightness of 300 cd/m² is also very high, although it clearly decreases from more slanted viewing angles. Other IPS panels do a better job here.
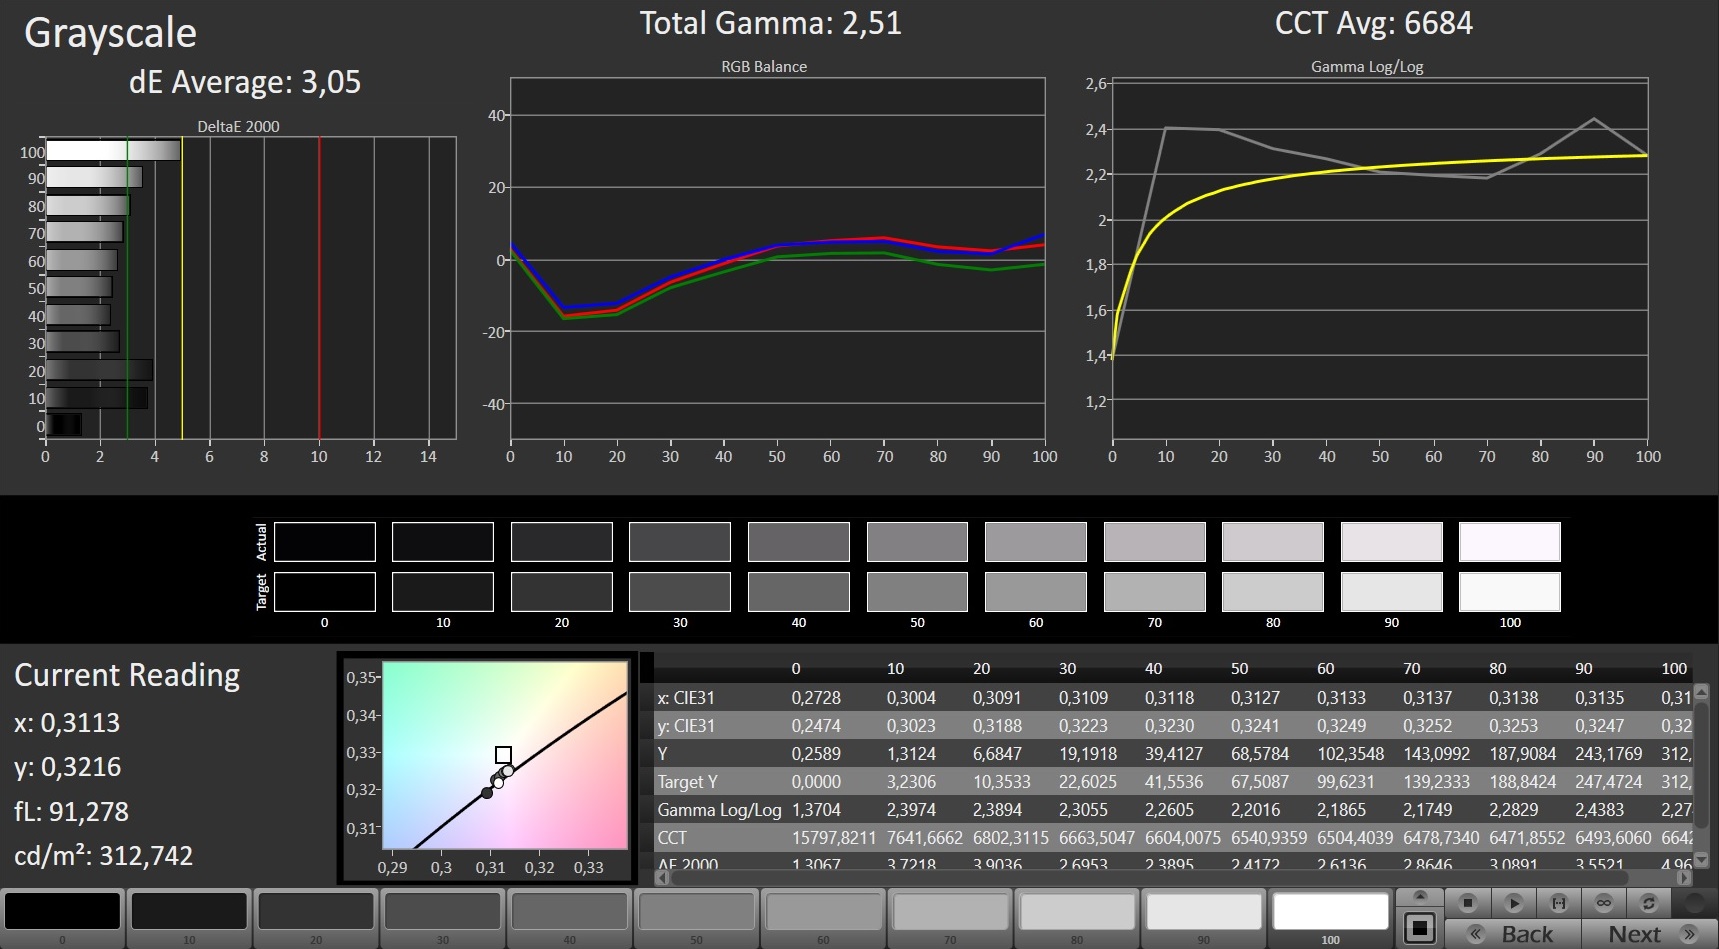
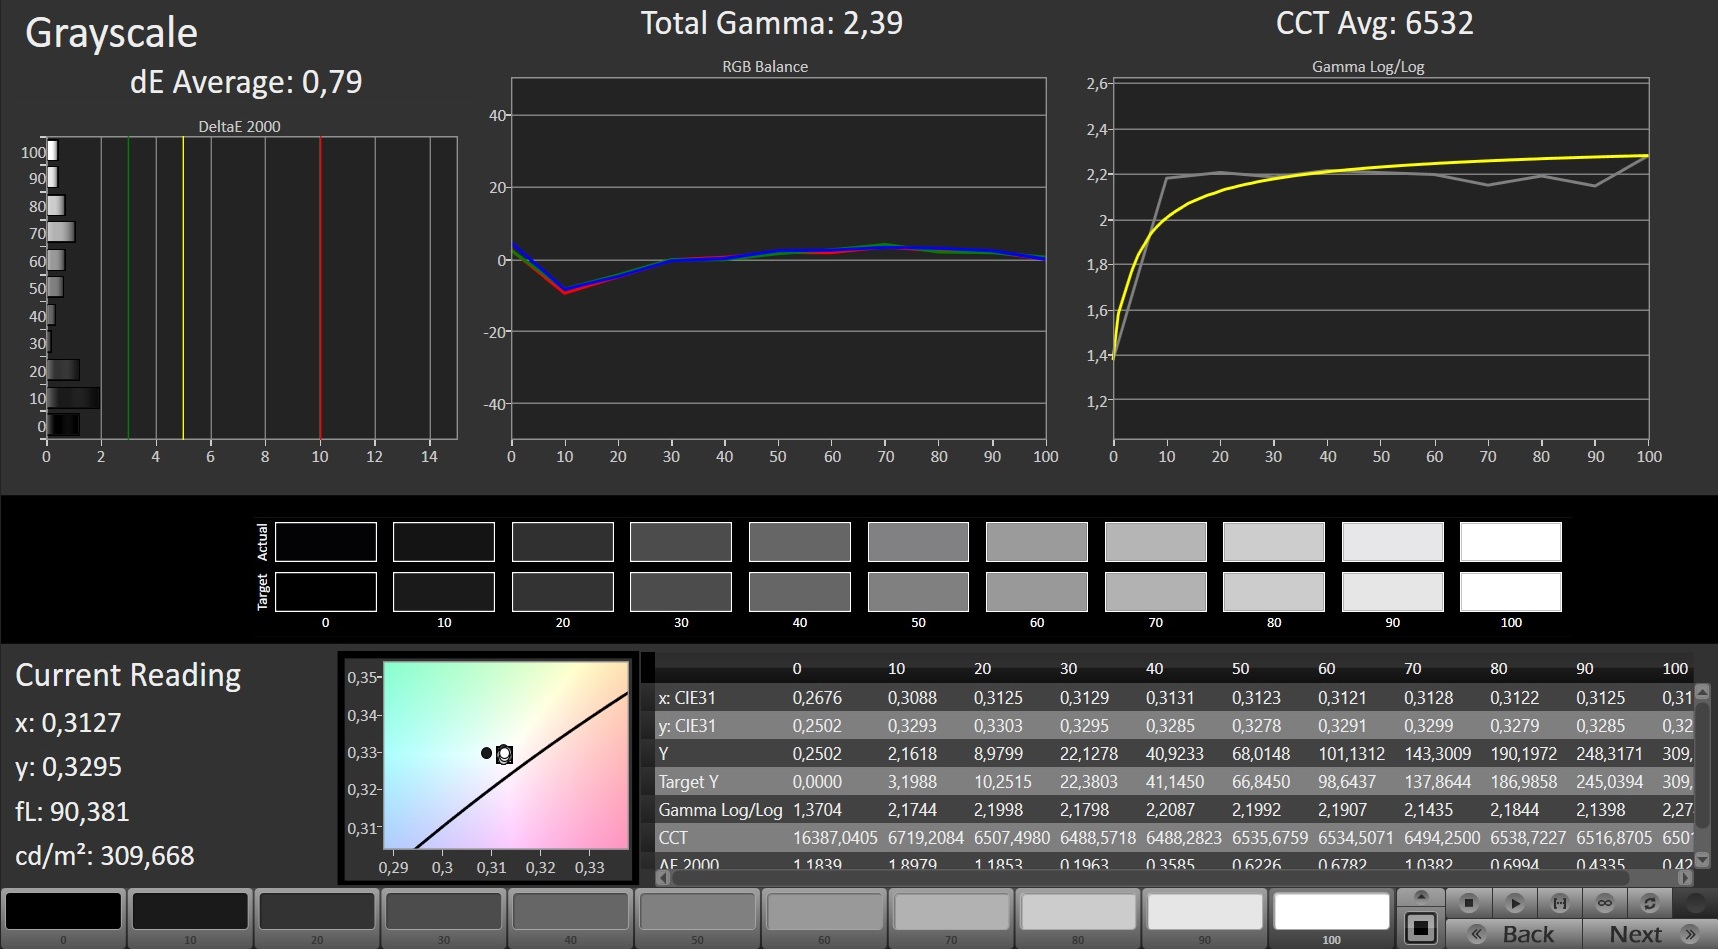
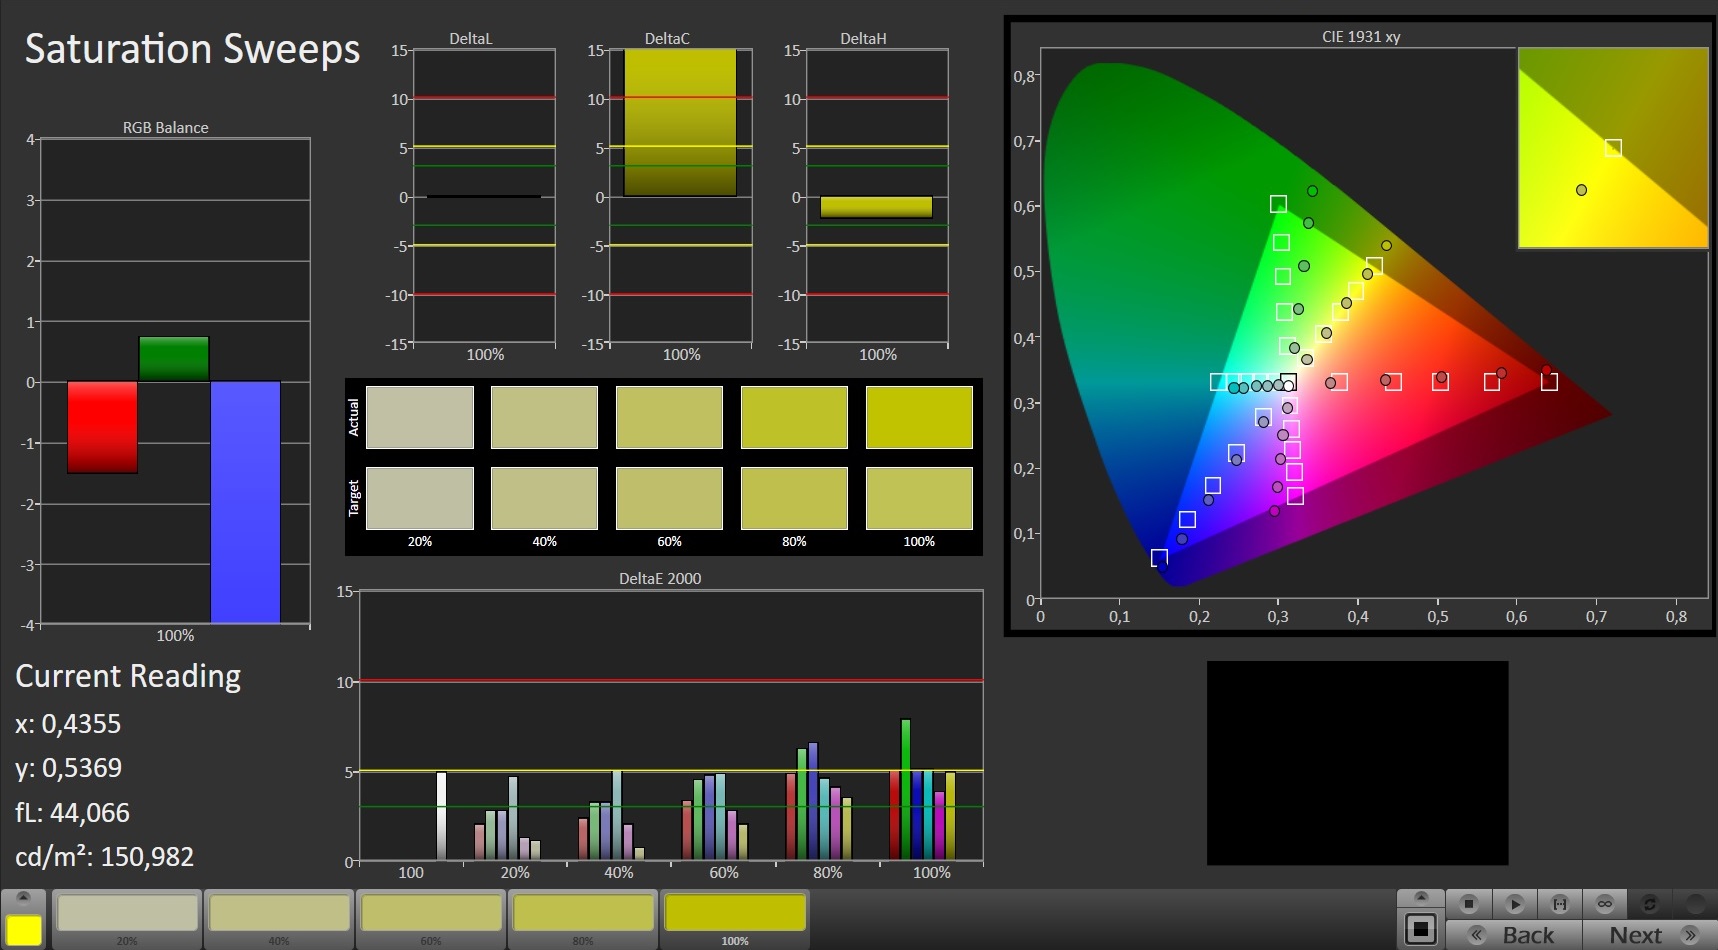
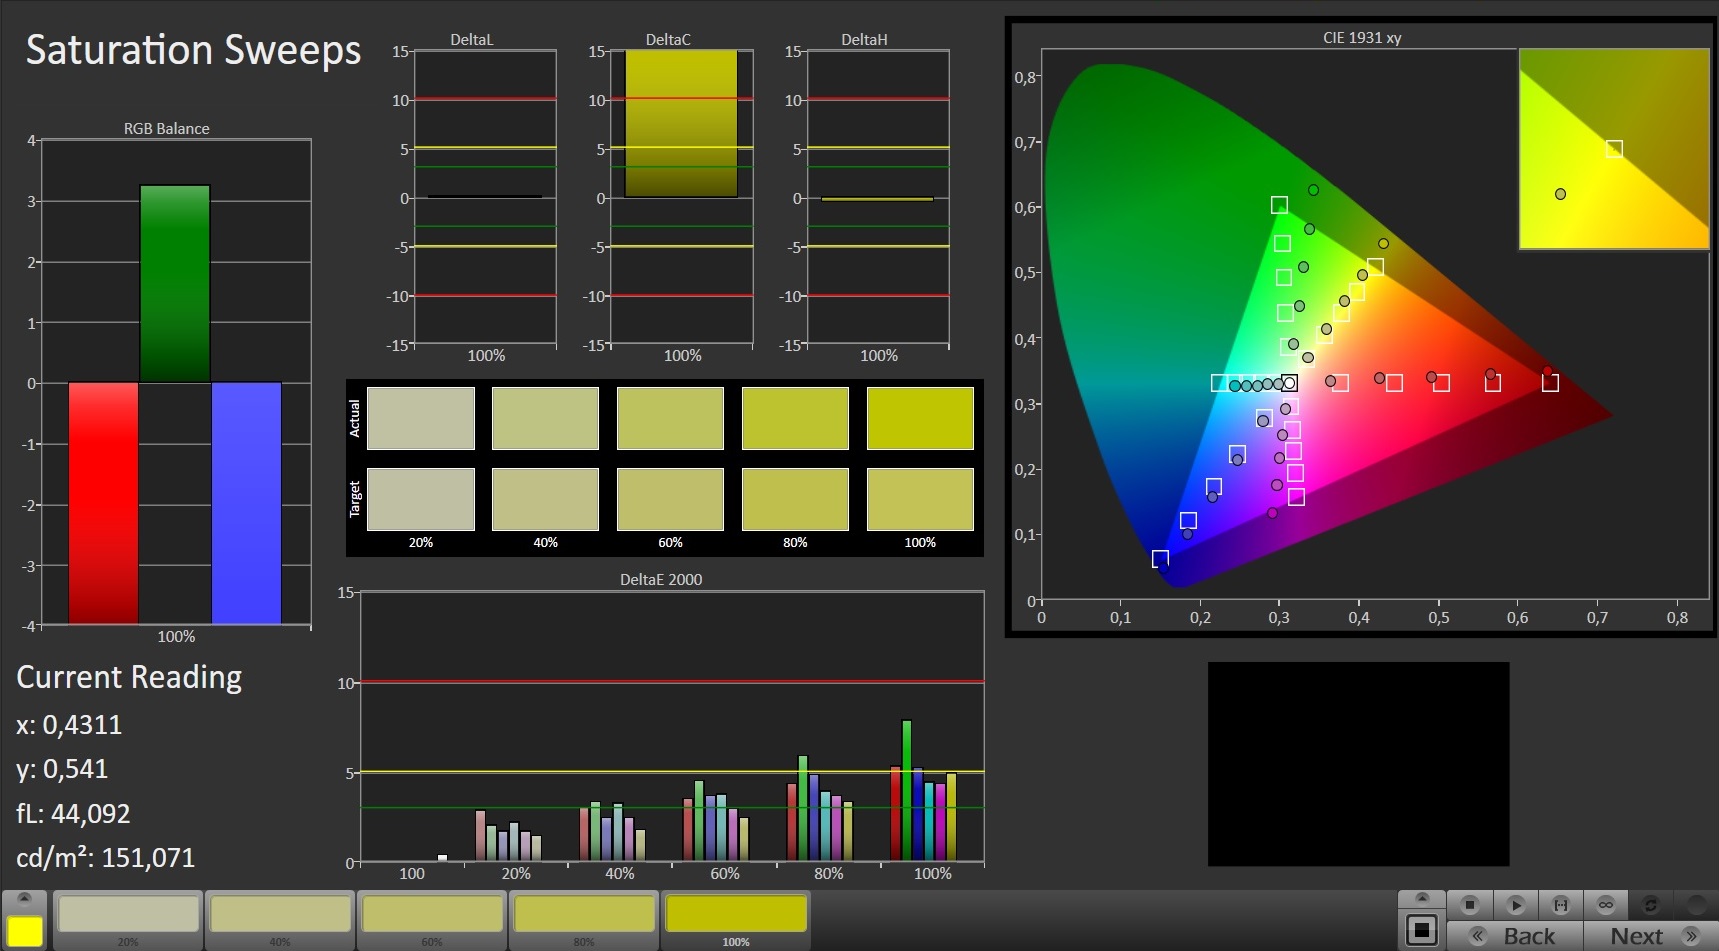
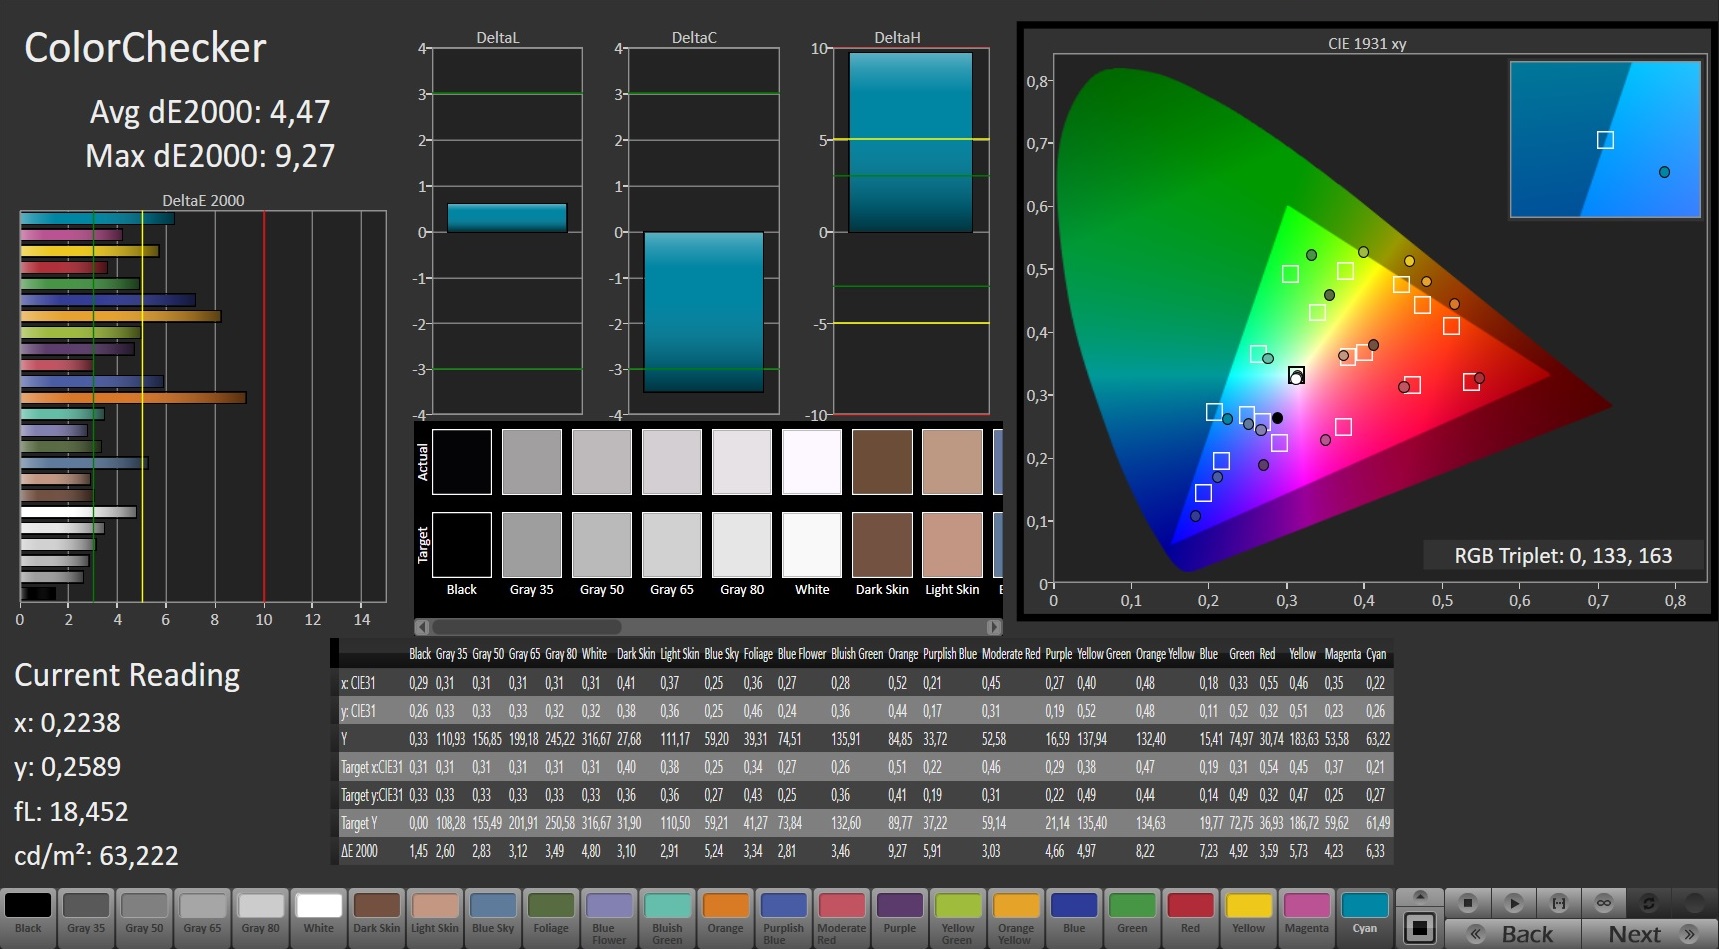
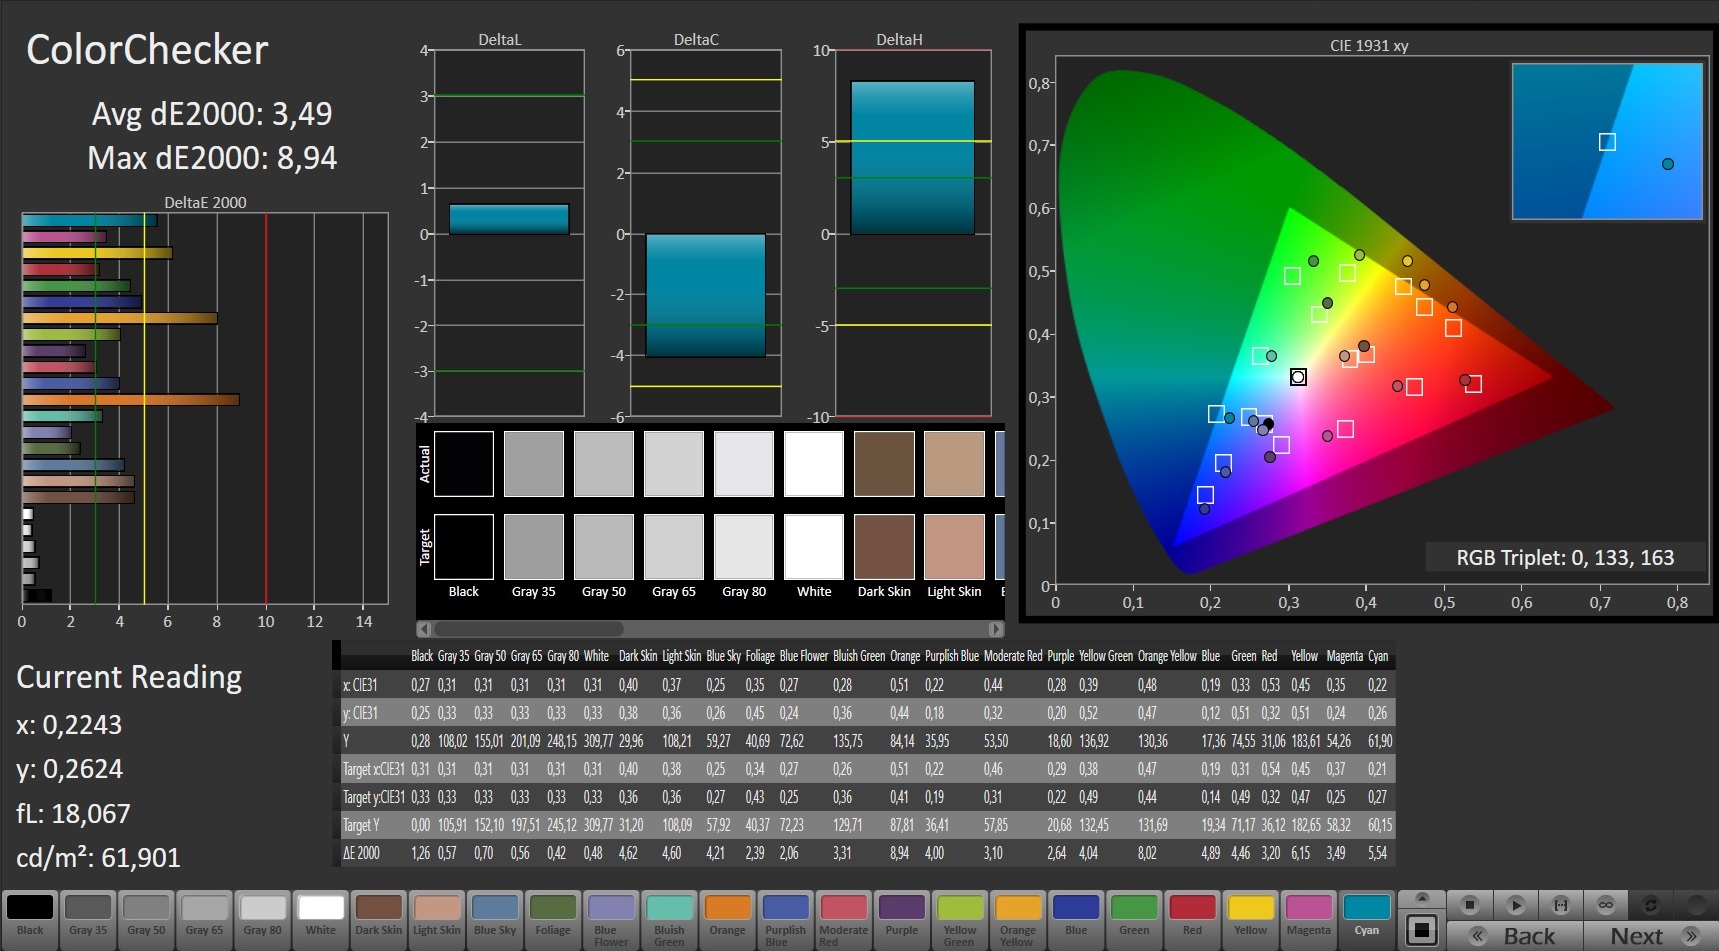
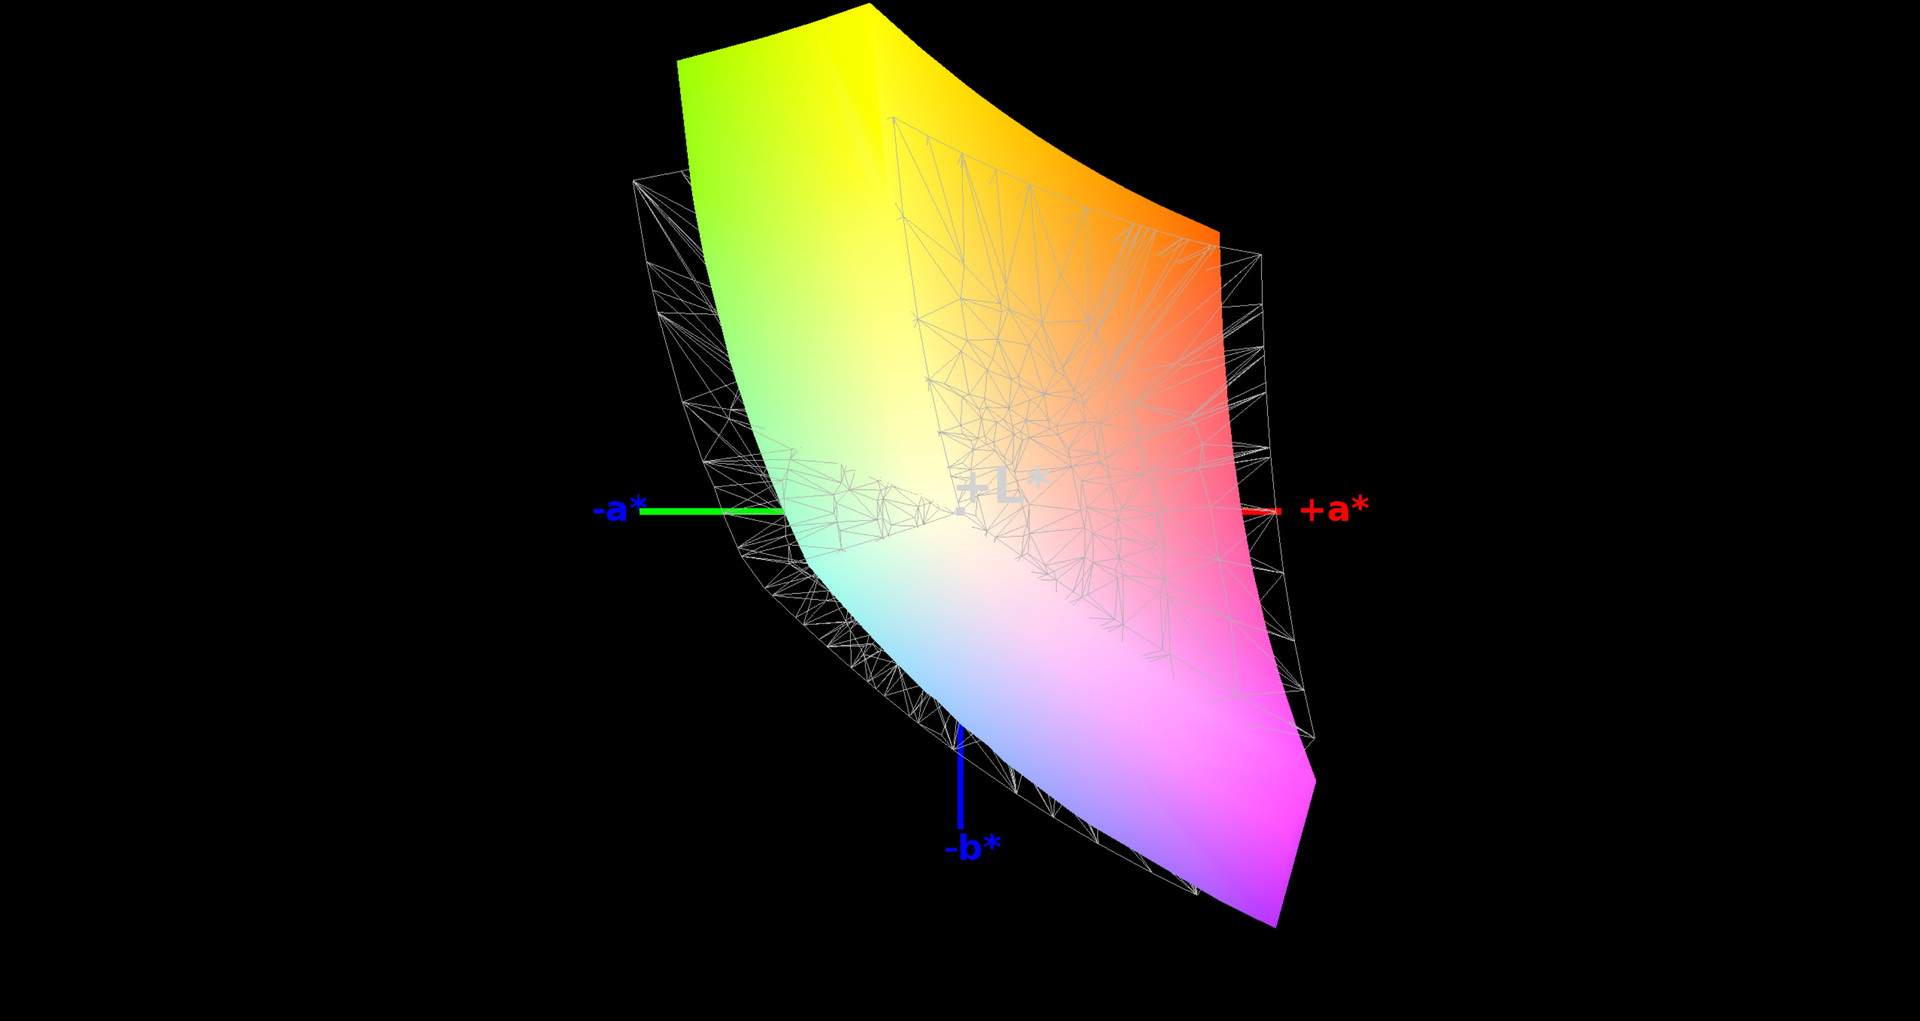
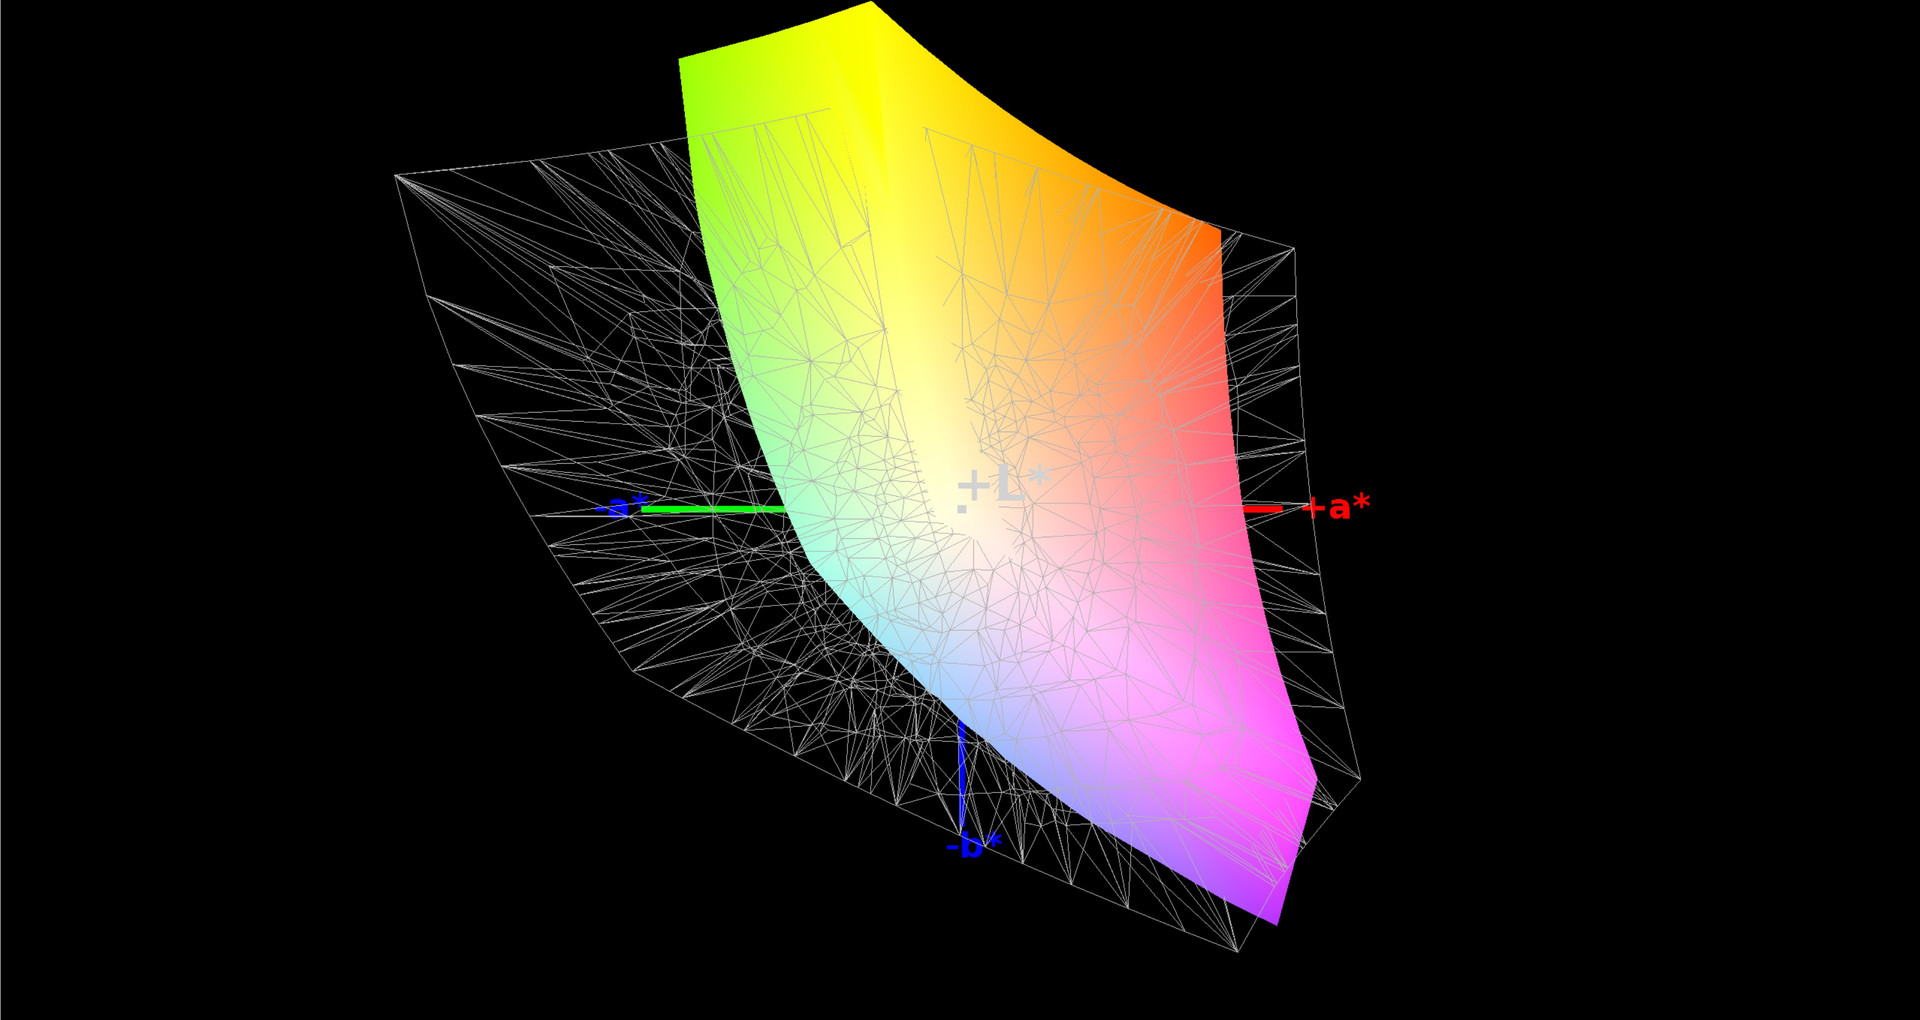
Annoying backlight bleeding was not observed in our review sample, although the illumination of 88% is not a top rate. The same is true for color accuracy: A DeltaE 2000 deviation of 3.05 (grayscale) and 4.47 (ColorChecker) is midfield. Buyers who use the XMG C506 only for gaming, Internet and videos can confidently ignore the last sentence. It looks similar for the color space: 81% sRGB and 54% AdobeRGB are definitely enough for gamers.

It is rather too bad that the LP156WF4 panel has relatively high response times when switching from gray to gray. However, subjectively, we did not observe streaking. Note: Our measurements are all based on the Smart Manager "Native Color" mode.
Display Response Times
| ↔ Response Time Black to White | ||
|---|---|---|
| 27 ms ... rise ↗ and fall ↘ combined | ↗ 7 ms rise | 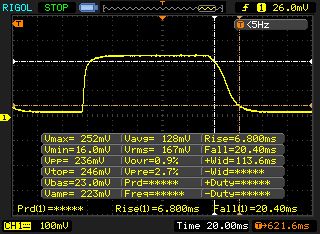 |
| ↘ 20 ms fall | ||
| The screen shows relatively slow response rates in our tests and may be too slow for gamers. In comparison, all tested devices range from 0.1 (minimum) to 240 (maximum) ms. » 68 % of all devices are better. This means that the measured response time is worse than the average of all tested devices (19.8 ms). | ||
| ↔ Response Time 50% Grey to 80% Grey | ||
| 48 ms ... rise ↗ and fall ↘ combined | ↗ 18 ms rise | 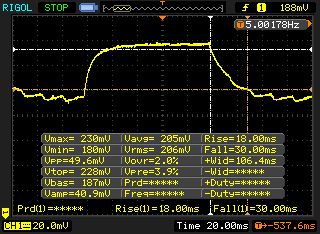 |
| ↘ 30 ms fall | ||
| The screen shows slow response rates in our tests and will be unsatisfactory for gamers. In comparison, all tested devices range from 0.165 (minimum) to 636 (maximum) ms. » 82 % of all devices are better. This means that the measured response time is worse than the average of all tested devices (30.9 ms). | ||
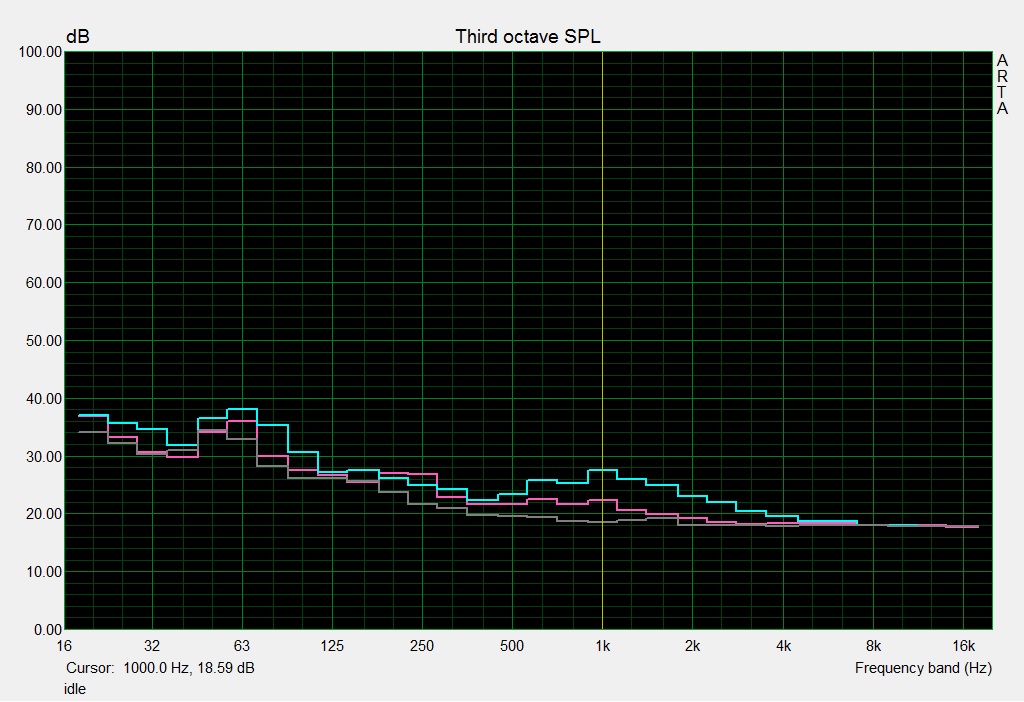
Screen Flickering / PWM (Pulse-Width Modulation)
| Screen flickering / PWM not detected | 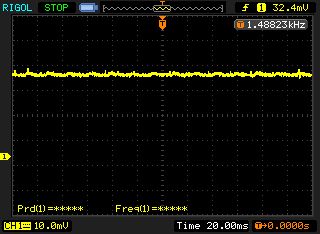 | ||
In comparison: 52 % of all tested devices do not use PWM to dim the display. If PWM was detected, an average of 7741 (minimum: 5 - maximum: 343500) Hz was measured. | |||
Performance
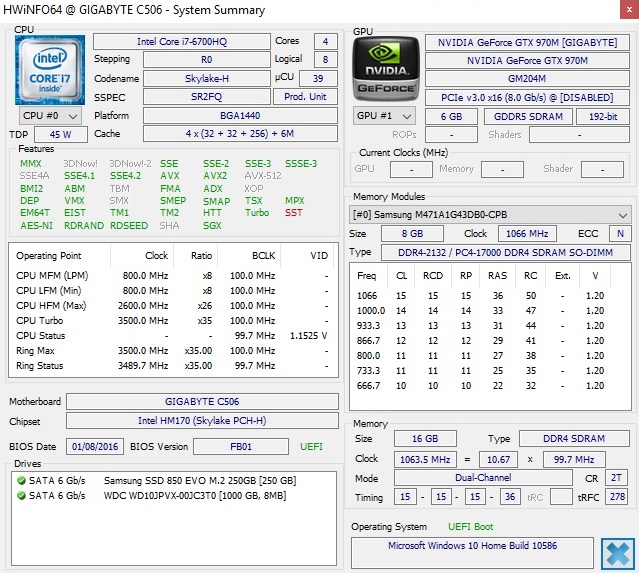
We configured the 15-inch device with 16 GB of DDR4 RAM and a combination of SSD and HDD so that the XMG C506 has a fair chance against the high-end opponents. The GTX 980M costs 236 Euros (~$267) more than the GTX 970M. Buyers will have to decide whether this upgrade is justifiable. The latter GPU calculates approximately 30% faster.
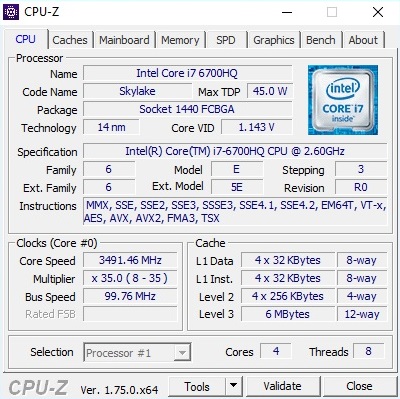
Processor
The processor is no surprise: The Core i7-6700HQ is currently the most popular quad-core model among laptop makers. Depending on the application, the Skylake chip built in the 14 nm process achieves up to 3.1 GHz (single-core load), 3.3 GHz (dual-core load) and 3.5 GHz (quad-core load).
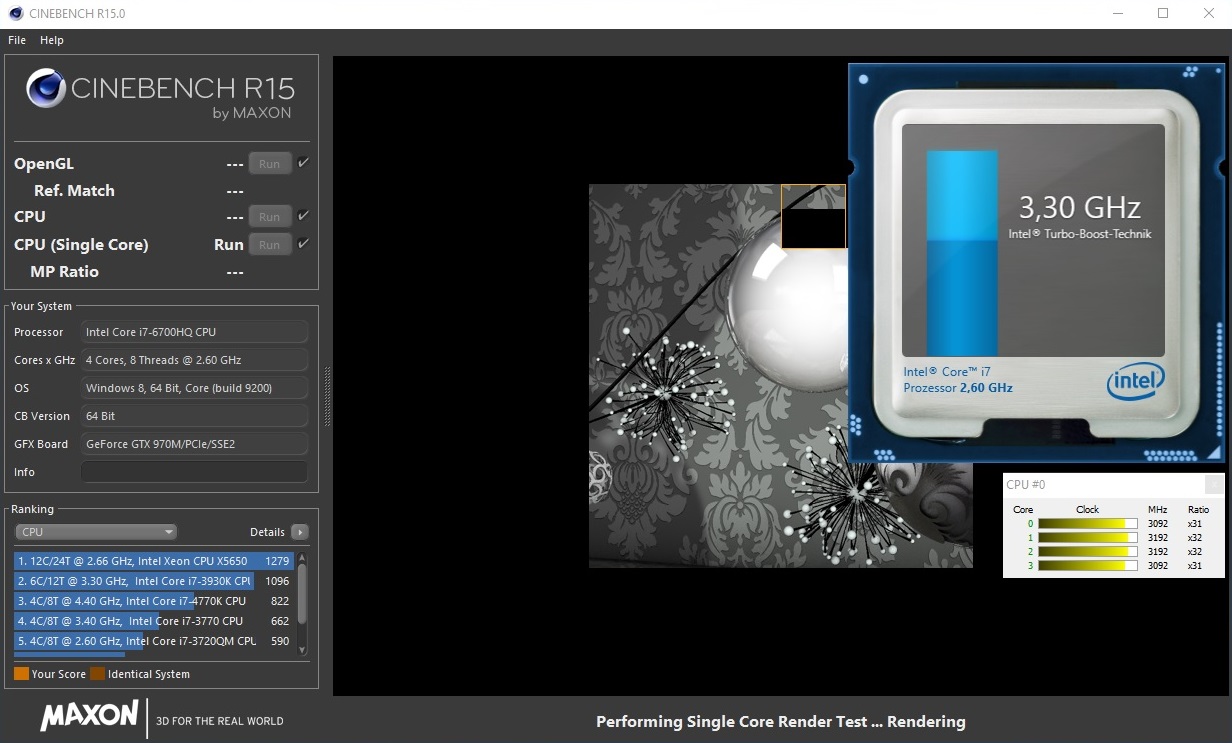
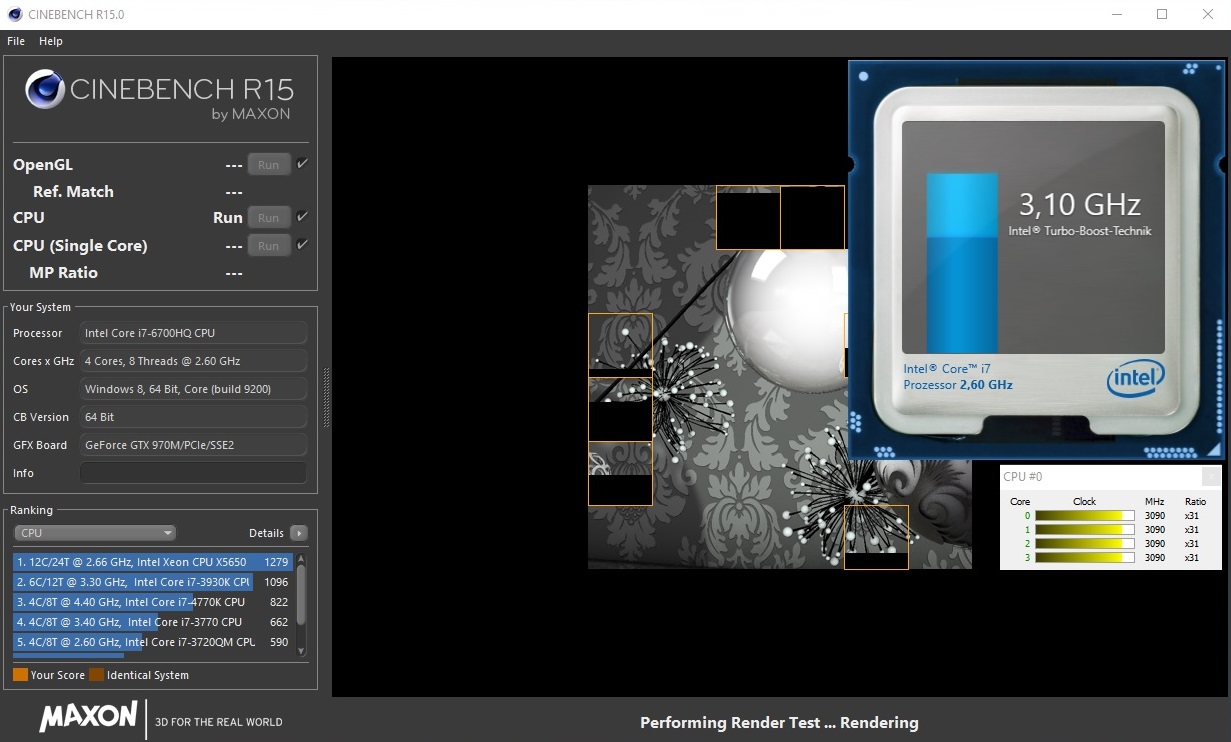
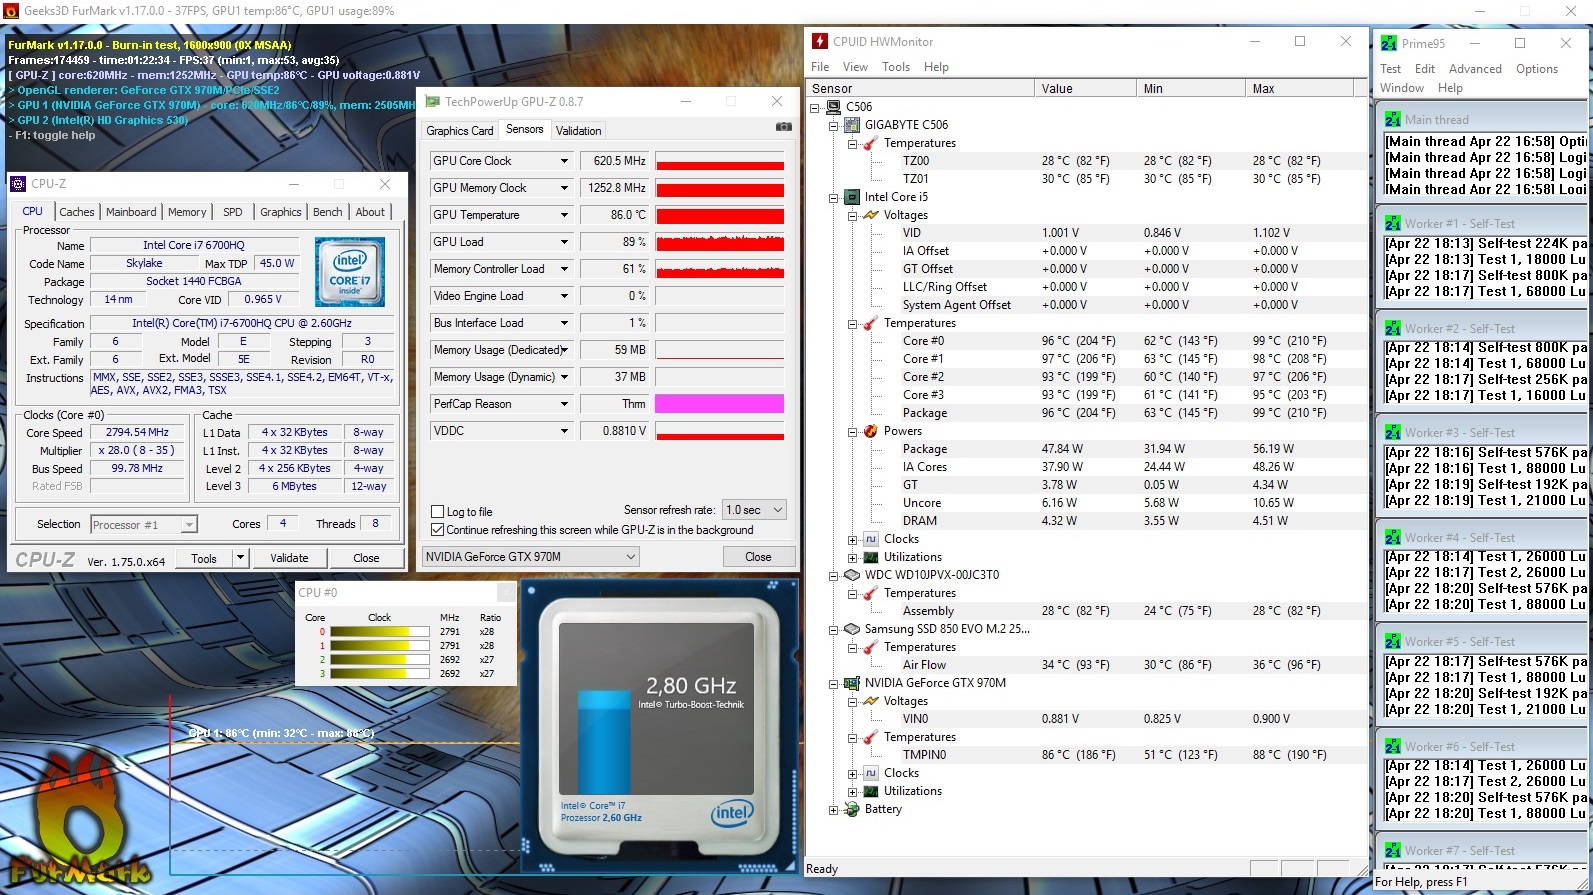
The XMG C506 maintains the Turbo as long as it is not loaded with extremely demanding tools. The clock rate decreased only marginally in our stress test made up of Prime95 and FurMark. However, 2.8 GHz are still decent. It throttled below the standard rate only for a short time.
Thanks to the high clock rates, the performance plays in the major league. The outcomes in the Cinebench test correspond to the expected high-end level achieved by other Core i7-6700HQ laptops, no matter whether Schenker's XMG A516 or Gigabyte's P55W v5. The more expensive Core i7-6820HK delivers only marginally more performance than the XMG P506 displays.
| Cinebench R15 | |
| CPU Single 64Bit | |
| Schenker XMG P506 PRO | |
| Schenker XMG C506 | |
| Schenker XMG A516 | |
| Gigabyte P35X v5 | |
| Gigabyte P55W v5 | |
| CPU Multi 64Bit | |
| Schenker XMG P506 PRO | |
| Schenker XMG C506 | |
| Schenker XMG A516 | |
| Gigabyte P35X v5 | |
| Gigabyte P55W v5 | |
| Cinebench R11.5 | |
| CPU Single 64Bit | |
| Schenker XMG P506 PRO | |
| Schenker XMG A516 | |
| Schenker XMG C506 | |
| Gigabyte P35X v5 | |
| Gigabyte P55W v5 | |
| CPU Multi 64Bit | |
| Schenker XMG P506 PRO | |
| Schenker XMG C506 | |
| Schenker XMG A516 | |
| Gigabyte P35X v5 | |
| Gigabyte P55W v5 | |
System Performance
Regardless of whether GTX 965M, GTX 970M or GTX 980M: Virtually all gaming opponents surpass 6000 points in PCMark 7. The XMG C506 is no exception here. Fast booting times and a system that generally responds lag free underlines this good outcome. Great: As expected from Schenker, no bloatware is preloaded on the storage device.
| PCMark 7 Score | 6019 points | |
Help | ||
Storage Devices
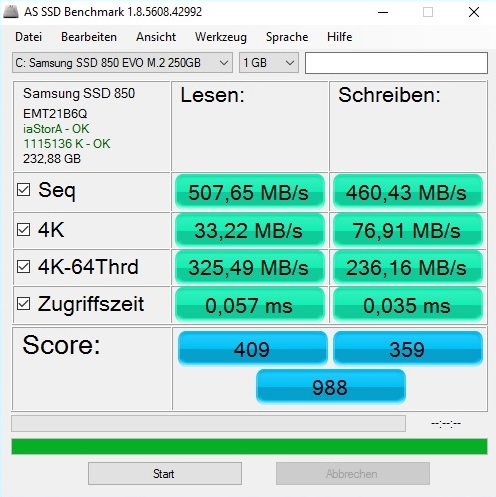
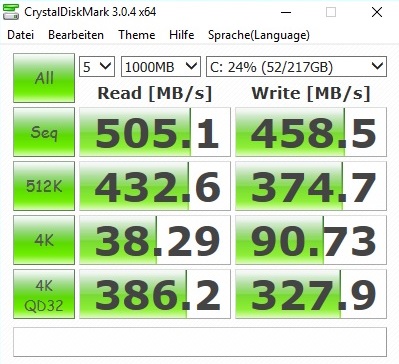
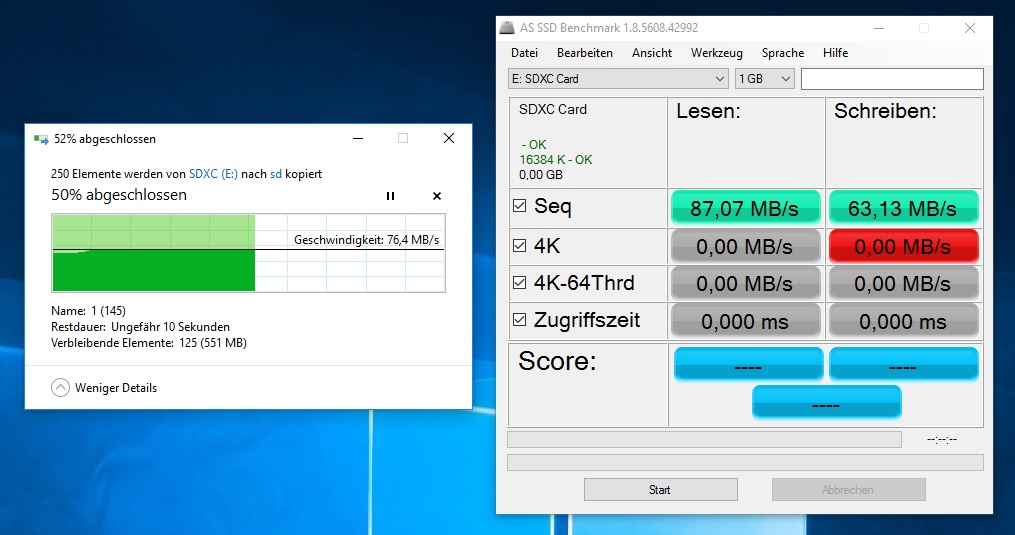
Although PCIe drives achieve impressive rates on paper, a SATA III SSD suffices the needs of most users. The 250 GB version of Samsung's 850 EVO in the review sample does a good job even without PCIe support. However, 507 MB/s in sequential read and 460 MB/s in sequential write cannot compete with Samsung's SM951 (Gigabyte P55W v5, P35X v5) or 950 Pro (Schenker XMG A516, XMG P506).
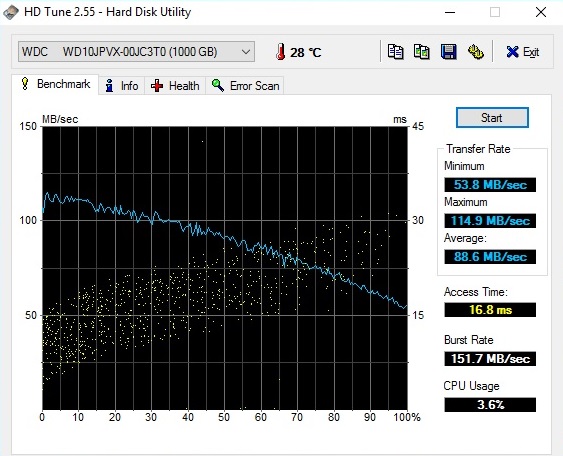
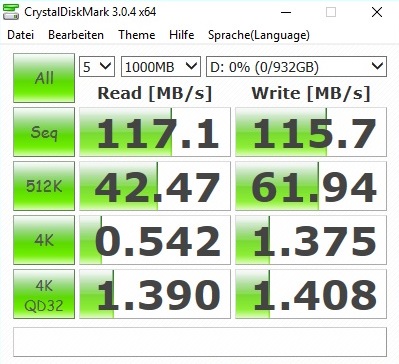
But let us be honest: Higher score are rarely a decisive advantage. The performance with small files is primarily significant in Windows routine. And the SSD type barely has an impact here. The M.2 drive is accompanied by a 2.5-inch, 1000 GB hard drive that spins at 5400 revolutions per minute. The Western Digital Blue climbs to 110 MB/s in the CrystalDiskMark test, which is pretty good for an HDD.

| Schenker XMG C506 Samsung SSD 850 EVO M.2 250 GB | Schenker XMG A516 Samsung SSD 950 Pro 256GB m.2 NVMe | Gigabyte P55W v5 Samsung SM951 MZVPV128 NVMe | Gigabyte P35X v5 Samsung SM951 MZVPV256HDGL m.2 PCI-e | Schenker XMG P506 PRO Samsung SSD 950 Pro 512GB m.2 NVMe | |
|---|---|---|---|---|---|
| AS SSD | 131% | 93% | 101% | 165% | |
| Seq Read (MB/s) | 508 | 2005 295% | 1739 242% | 1611 217% | 2104 314% |
| Seq Write (MB/s) | 460.4 | 916 99% | 536 16% | 1100 139% | 1416 208% |
| 4K Read (MB/s) | 33.22 | 48.47 46% | 45.15 36% | 22.8 -31% | 48.71 47% |
| 4K Write (MB/s) | 76.9 | 136.8 78% | 112.7 47% | 100.9 31% | 138.3 80% |
| Score Total (Points) | 988 | 2356 138% | 2201 123% | 2460 149% | 2716 175% |
Graphics Card
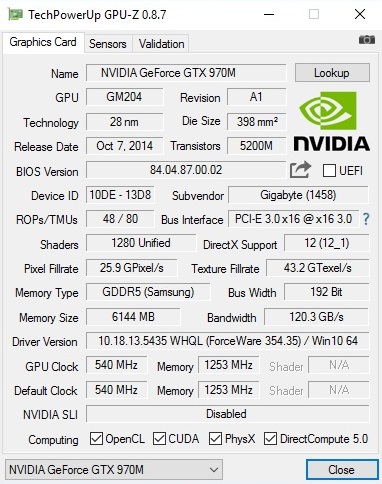
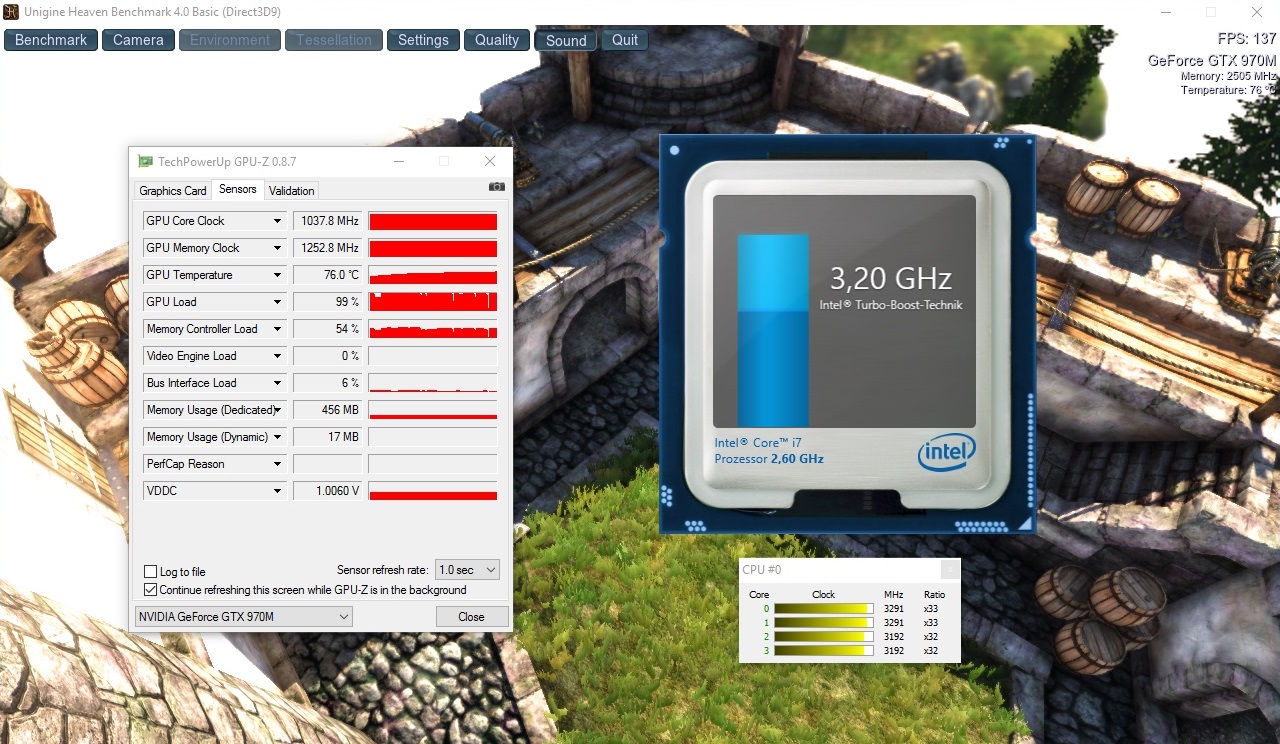
The lower-priced Maxwell chips are not ready for the junkyard, even after the launch of the GeForce GTX 980. While the GTX 980M can boast with 1536 Shaders and 4 to 8 GB of GDDR5 memory (256-bit interface), the GTX 970M has 1280 arithmetic units and 3 to 6 GB of VRAM (192 interface). Like Intel's processors, the Nvidia GPUs also feature automatic overclocking that speeds up the core by several percent during higher load. In the case of the GTX 970M, up to 1038 MHz is possible, rather than 924 MHz (1127 MHz @GTX 980M). Turbo is always active in standard 3D applications. We could only provoke throttling via the GPU-torturer FurMark.
| 3DMark 11 Performance | 9417 points | |
| 3DMark Ice Storm Standard Score | 88920 points | |
| 3DMark Cloud Gate Standard Score | 21376 points | |
| 3DMark Fire Strike Score | 6531 points | |
Help | ||
A look at the Fire Strike test of 3DMark 13 reveals that the GeForce GTX 970M is fairly centered between the GTX 980M and GTX 965M from 2016. The latter marks the entry in the Core division. The GTX 960M price-performance tip is too slow for passionate gamers.
| 3DMark | |
| 1920x1080 Fire Strike Score | |
| Schenker XMG P506 PRO | |
| Gigabyte P35X v5 | |
| Gigabyte P55W v5 | |
| Schenker XMG C506 | |
| Schenker XMG A516 | |
| 1920x1080 Fire Strike Graphics | |
| Gigabyte P35X v5 | |
| Schenker XMG P506 PRO | |
| Gigabyte P55W v5 | |
| Schenker XMG C506 | |
| Schenker XMG A516 | |
| 3DMark 11 | |
| 1280x720 Performance | |
| Gigabyte P35X v5 | |
| Schenker XMG P506 PRO | |
| Schenker XMG C506 | |
| Gigabyte P55W v5 | |
| Schenker XMG A516 | |
| 1280x720 Performance GPU | |
| Gigabyte P35X v5 | |
| Schenker XMG P506 PRO | |
| Gigabyte P55W v5 | |
| Schenker XMG C506 | |
| Schenker XMG A516 | |
Gaming Performance
Our benchmarks confirm that the GeForce GTX 970M copes decently with current games. Users who deem 30 or 40 FPS as playable and do not have problems with occasional lags can also play the 2016 edition of "Need for Speed" and "Hitman" as well as "The Division" and "Far Cry Primal" in maximum details. Otherwise, high settings would be the right choice.
We only had problems with "Assassin's Creed Syndicate" that categorically refused to launch with the preloaded driver (ForceWare 354.35). An update to the latest 364.72 version via "GeForce Experience" fixed the bug. However, maximum settings are not possible due to the extreme requirements. More information about the performance of various graphics cards can be found in our games list and in the GPU section.
| low | med. | high | ultra | |
|---|---|---|---|---|
| Assassin's Creed Syndicate (2015) | 78.8 | 73.6 | 49.2 | 20.6 |
| Far Cry Primal (2016) | 97 | 58 | 51 | 36 |
| The Division (2016) | 134.6 | 87.7 | 42.3 | 32.4 |
| Hitman 2016 (2016) | 63.9 | 63.1 | 48.3 | 47.8 |
| Need for Speed 2016 (2016) | 96.9 | 87.2 | 57.7 | 42.4 |
Emissions
System Noise
The high-end components do not seem to be too much for the cooling system. Even thicker gaming laptops achieve and sometimes surpass an average of 32 to 33 dB(A) in idle mode (maximum 35 dB(A) when booting) and 38 to 48 dB(A) during load. The fan’s behavior and characteristic, do not give much cause for complaint. The speed is mostly stable in 3D operation. Both fans slow down again relatively quickly after a prolonged stress period. Overall, the noise level is on par with the comparison field with minor advantages for the XMG C506.
Noise level
| Idle |
| 32 / 33 / 35 dB(A) |
| HDD |
| 33 dB(A) |
| Load |
| 38 / 48 dB(A) |
 | ||
30 dB silent 40 dB(A) audible 50 dB(A) loud |
||
min: | ||
| Schenker XMG C506 GeForce GTX 970M, 6700HQ | Schenker XMG A516 GeForce GTX 965M, 6700HQ | Gigabyte P55W v5 GeForce GTX 970M, 6700HQ | Gigabyte P35X v5 GeForce GTX 980M, 6700HQ | Schenker XMG P506 PRO GeForce GTX 980M, 6820HK | |
|---|---|---|---|---|---|
| Noise | -0% | -4% | -5% | -3% | |
| off / environment * (dB) | 30 | 30 -0% | |||
| Idle Minimum * (dB) | 32 | 31 3% | 33 -3% | 32.2 -1% | 32 -0% |
| Idle Average * (dB) | 33 | 32 3% | 34 -3% | 32.3 2% | 33 -0% |
| Idle Maximum * (dB) | 35 | 38 -9% | 35 -0% | 32.6 7% | 37 -6% |
| Load Average * (dB) | 38 | 40 -5% | 43 -13% | 44.4 -17% | 41 -8% |
| Load Maximum * (dB) | 48 | 45 6% | 49 -2% | 54.6 -14% | 49 -2% |
* ... smaller is better
Temperature
The satisfactory noise development is achieved partly at the expense of borderline temperatures. We could drive the Core i7-6700HQ to almost 100 °C (~212 °F) in the stress test with the tools FurMark and Prime95. A maximum of 88°C (~190 °F) on the GeForce GTX 970M is also high. However, experience shows that the components do not reach these high temperatures under normal conditions (including games) - especially the CPU.
The user is only faced with the high temperatures to some extent. Our thermometer displayed a maximum of 49 °C (~120 °F) on the casing's upper side and up to 61 °C (~142 °F) on the underside after one hour of full load. Although that is quite high, the wrist rest stays pleasantly cool with at most 29 °C (~84 °F) even in stress situations. This means that the hardware has been positioned ideally. The entire chassis feels very cool in idle mode. An average of 25 °C (~77 °F/upper side) and 24 °C (~75 °F/underside) are outstanding.
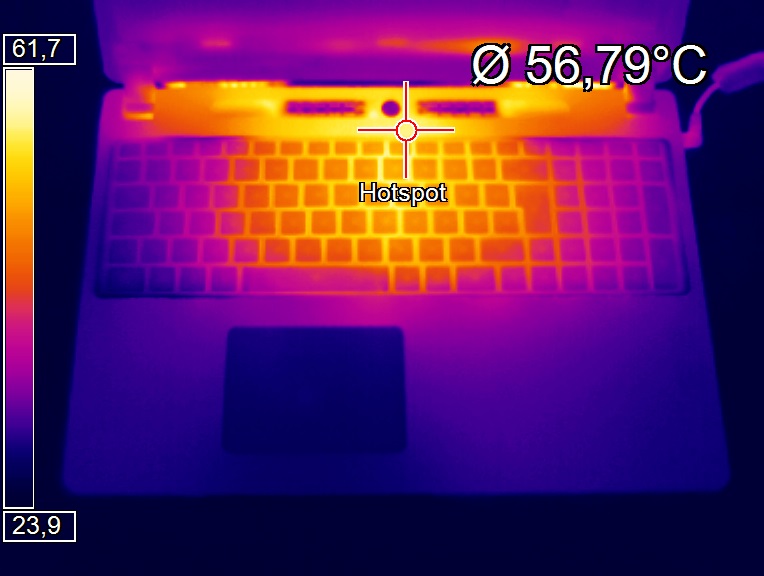
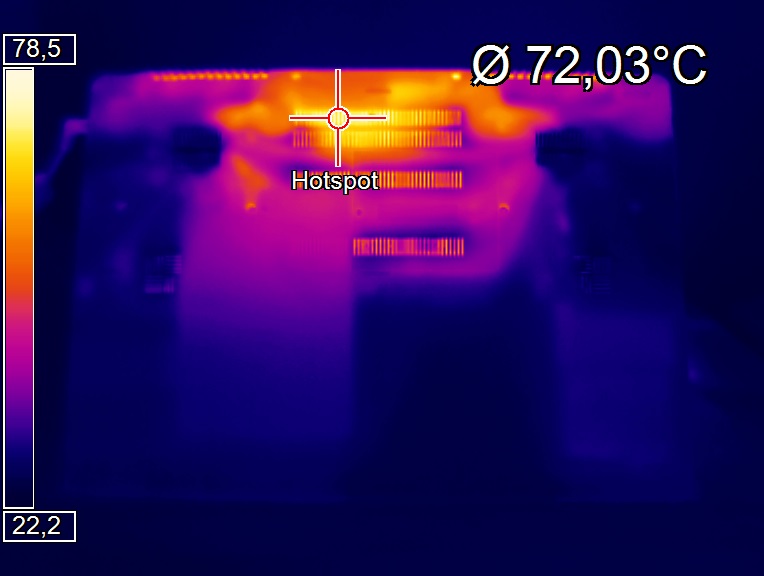
(-) The maximum temperature on the upper side is 49.4 °C / 121 F, compared to the average of 40.4 °C / 105 F, ranging from 21.2 to 68.8 °C for the class Gaming.
(-) The bottom heats up to a maximum of 60.7 °C / 141 F, compared to the average of 43.2 °C / 110 F
(+) In idle usage, the average temperature for the upper side is 24.6 °C / 76 F, compared to the device average of 33.9 °C / 93 F.
(+) The palmrests and touchpad are cooler than skin temperature with a maximum of 29 °C / 84.2 F and are therefore cool to the touch.
(±) The average temperature of the palmrest area of similar devices was 28.8 °C / 83.8 F (-0.2 °C / -0.4 F).
| Schenker XMG C506 GeForce GTX 970M, 6700HQ | Schenker XMG A516 GeForce GTX 965M, 6700HQ | Gigabyte P55W v5 GeForce GTX 970M, 6700HQ | Gigabyte P35X v5 GeForce GTX 980M, 6700HQ | Schenker XMG P506 PRO GeForce GTX 980M, 6820HK | |
|---|---|---|---|---|---|
| Heat | -22% | 2% | -1% | -13% | |
| Maximum Upper Side * (°C) | 49.4 | 52.4 -6% | 50 -1% | 52.4 -6% | 53 -7% |
| Maximum Bottom * (°C) | 60.7 | 53.1 13% | 57.7 5% | 58 4% | 58 4% |
| Idle Upper Side * (°C) | 28.1 | 39.3 -40% | 25.7 9% | 26.6 5% | 33.7 -20% |
| Idle Bottom * (°C) | 25.6 | 39.5 -54% | 27.2 -6% | 27.4 -7% | 33.2 -30% |
* ... smaller is better
Energy Management
Power Consumption
Despite the identical processor, other GTX 970M laptops consume less energy. The XMG C506 surpasses Gigabyte's P55W v5 by 19% with 14 - 22 watts in idle mode and 87 - 157 watts in 3D load. Meanwhile, laptops based on GTX 980M units need approximately 20% more power.
| Off / Standby | |
| Idle | |
| Load |
|
Key:
min: | |
| Schenker XMG C506 GeForce GTX 970M, 6700HQ | Schenker XMG A516 GeForce GTX 965M, 6700HQ | Gigabyte P55W v5 GeForce GTX 970M, 6700HQ | Gigabyte P35X v5 GeForce GTX 980M, 6700HQ | Schenker XMG P506 PRO GeForce GTX 980M, 6820HK | |
|---|---|---|---|---|---|
| Power Consumption | 10% | 19% | -18% | ||
| Idle Minimum * (Watt) | 14 | 11 21% | 9 36% | 15 -7% | |
| Idle Average * (Watt) | 18 | 15 17% | 13 28% | 20 -11% | |
| Idle Maximum * (Watt) | 22 | 22 -0% | 17 23% | 27 -23% | |
| Load Average * (Watt) | 87 | 75 14% | 81 7% | 98 -13% | |
| Load Maximum * (Watt) | 157 | 160 -2% | 152 3% | 210 -34% |
* ... smaller is better
Battery Runtime
Thanks to the strong 76 Wh battery, the runtime can compete with the opponents. The XMG C506 managed roughly five hours in our Wi-Fi marathon that we test using medium brightness and the "Balanced" energy profile - quite a decent outcome considering the hardware performance. Gigabyte's P55W v5 lasts longer thanks to it lower energy requirement - despite the weaker battery.
| Schenker XMG C506 75.81 Wh | Schenker XMG A516 62 Wh | Gigabyte P55W v5 61 Wh | Gigabyte P35X v5 76 Wh | Schenker XMG P506 PRO 60 Wh | |
|---|---|---|---|---|---|
| Battery runtime | |||||
| WiFi v1.3 (h) | 4.8 | 5.8 21% | 4.4 -8% | 4.5 -6% |
Pros
Cons
Verdict
Like Gigabyte's original, Schenker's XMG C506 also achieves a total rating of 82%. In particular, the weight of just 2.4 kg (~5.3 lb), the slim build and high-contrast Full HD panel are looked back on favorably. The speed is also first-rate when a few Euros more are invested during the configuration (solid-state drive!). Interface diversity, battery life and cooling system are also impressive - except for some minor details.
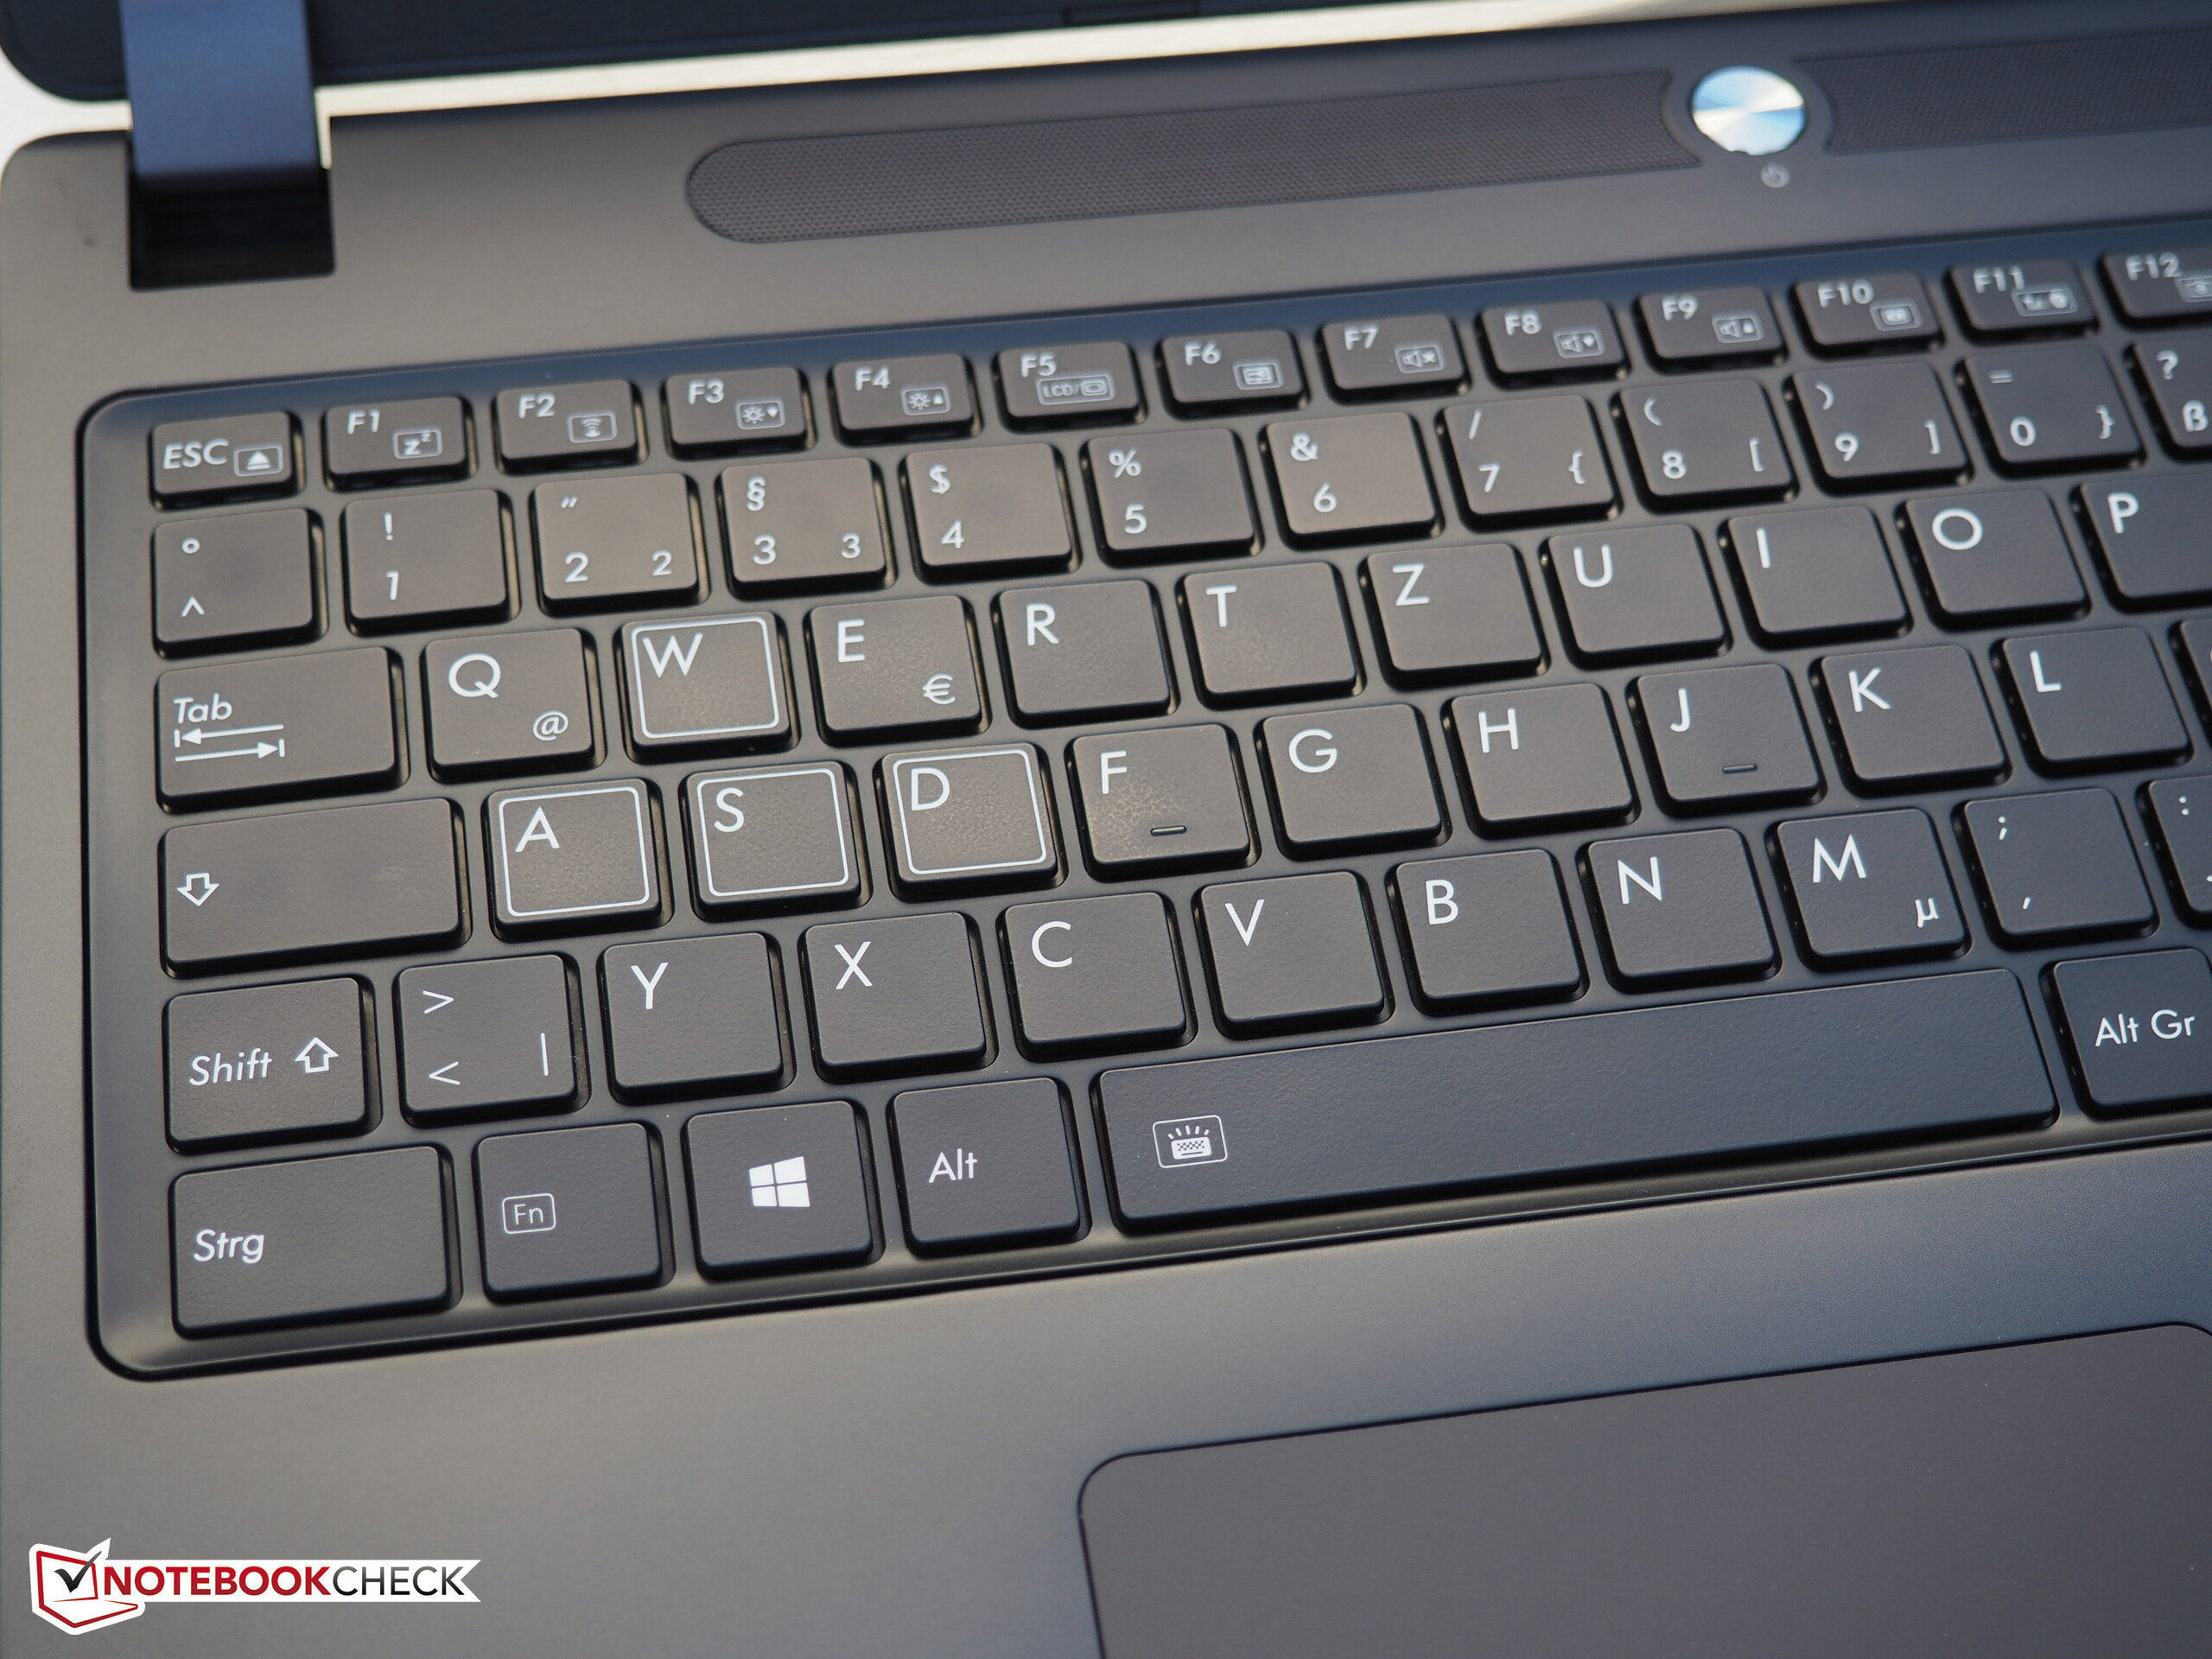
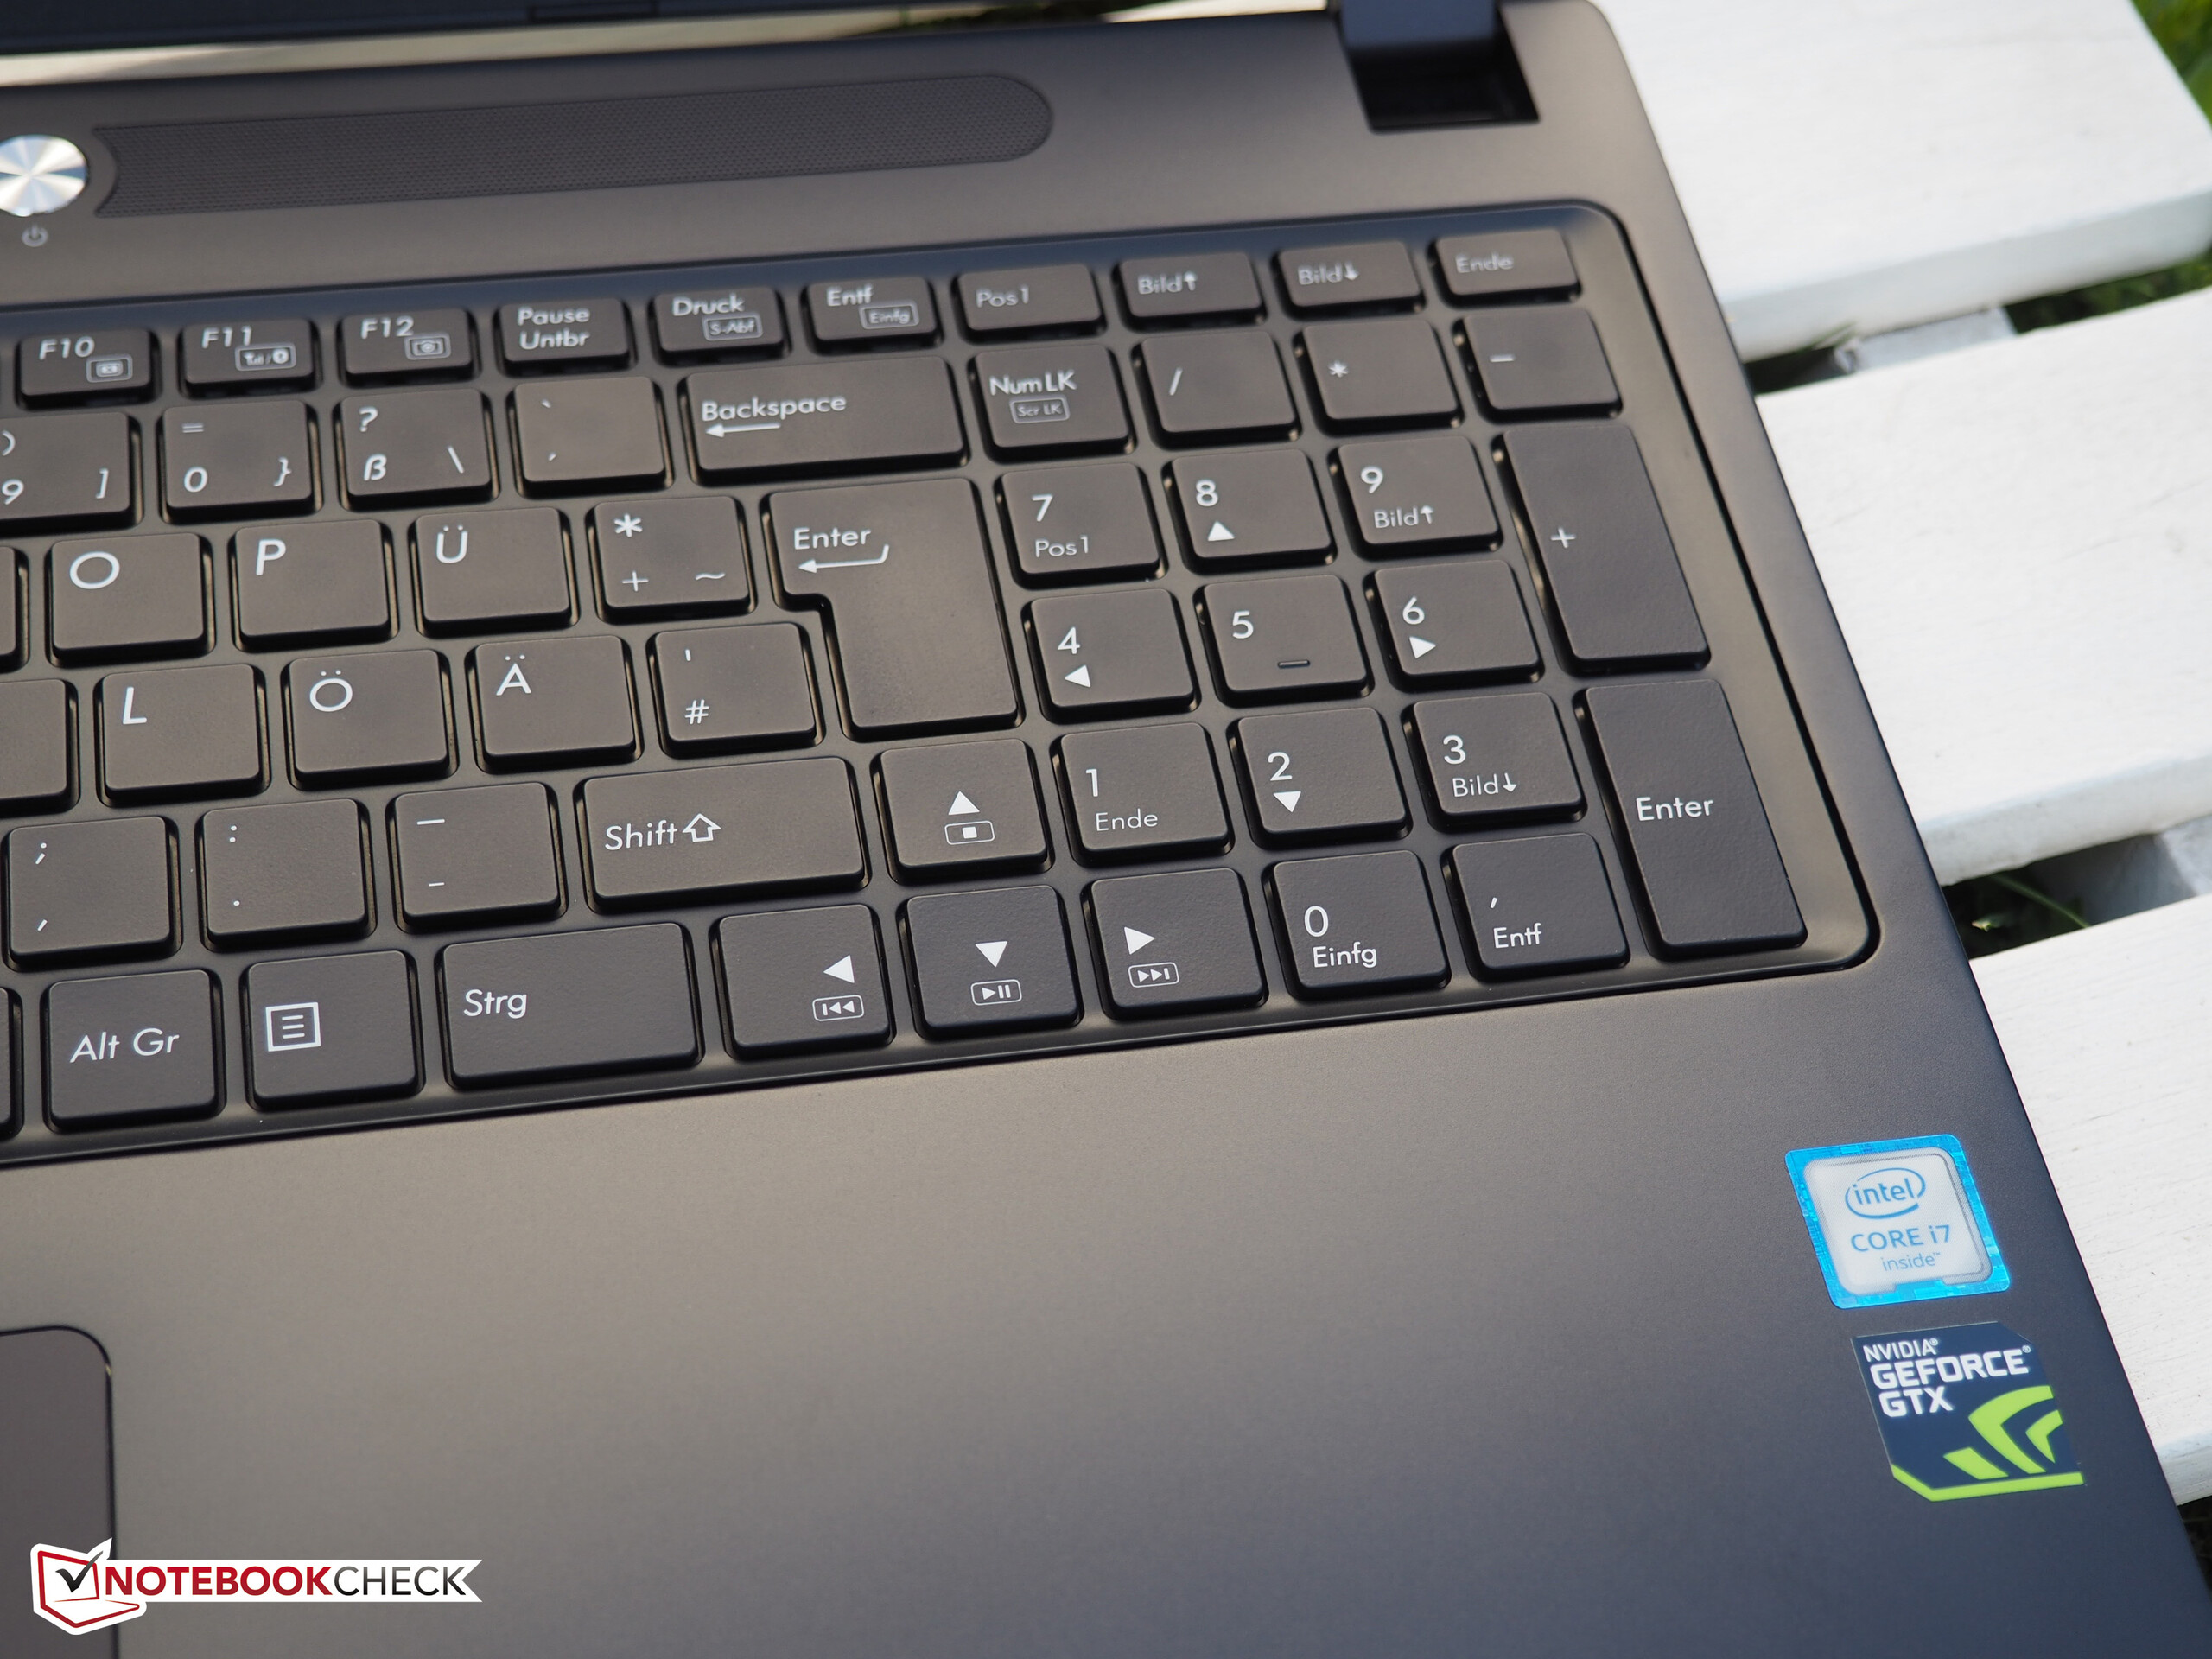
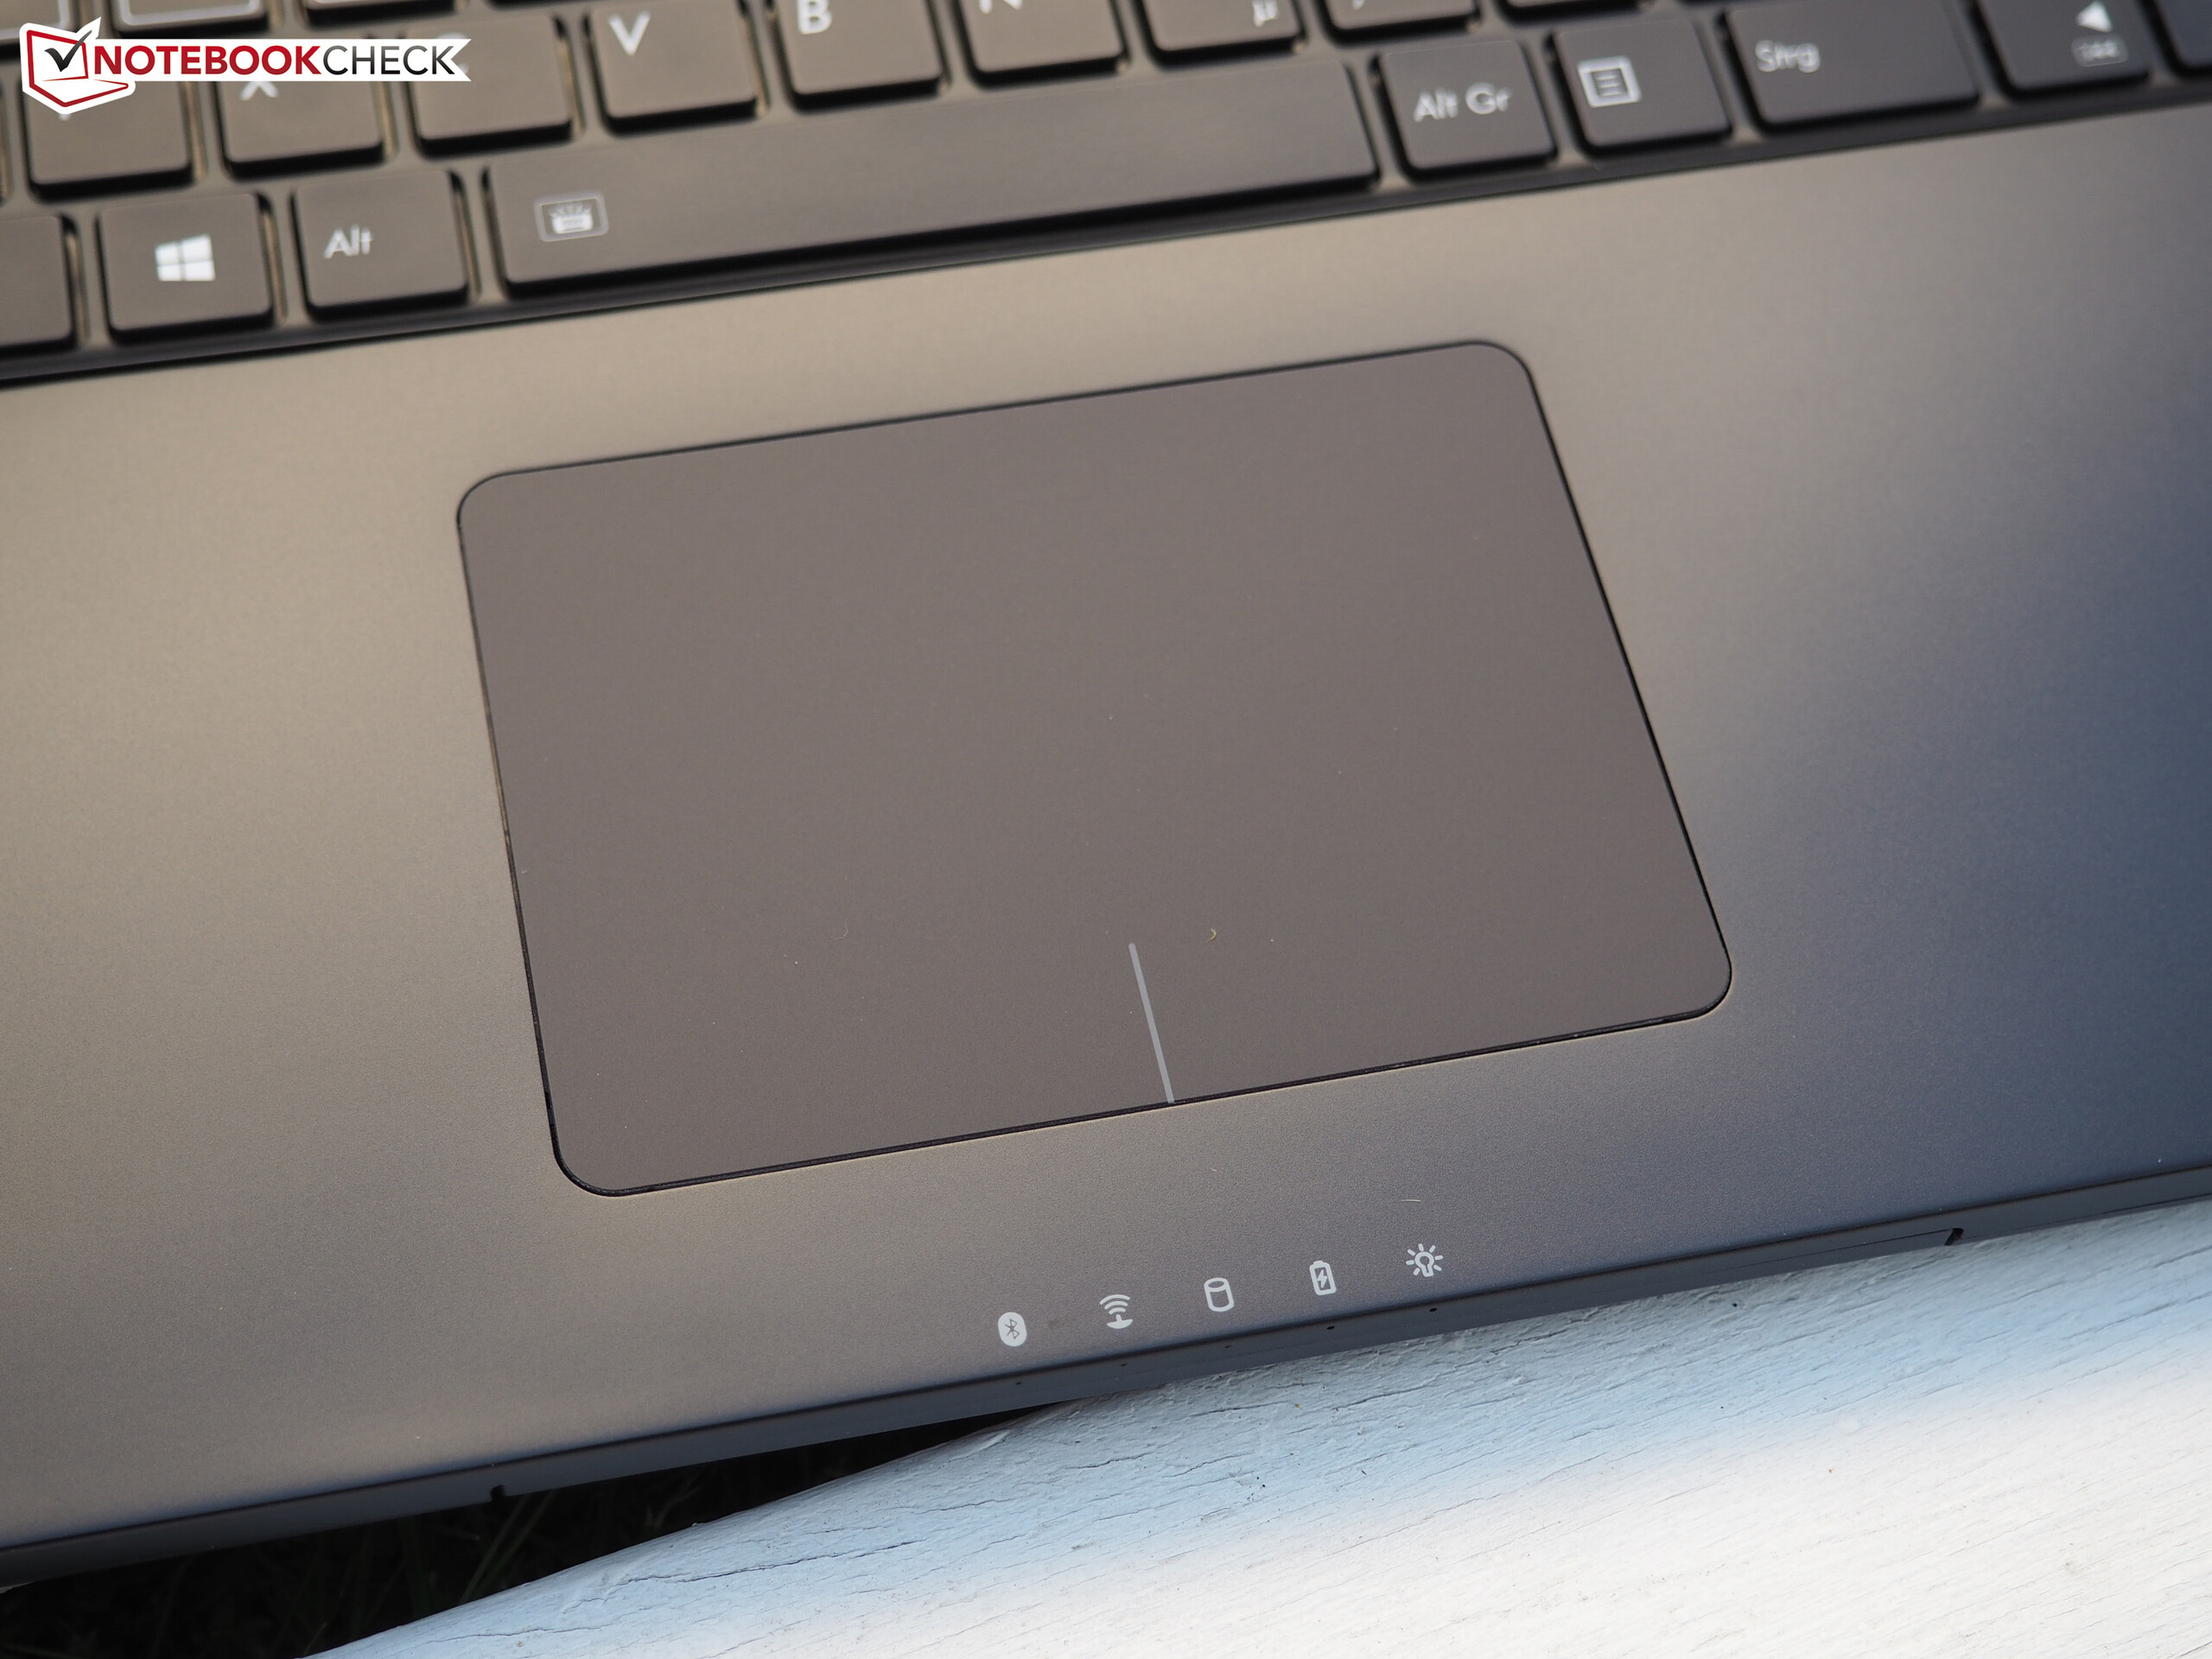
The manufacturer should improve the sound and input devices. While the keyboard has a spongy feel, the ClickPad is somewhat unreliable. Users who like to type on their laptops should prefer the XMG P506.
Fans of ultra-slim casings cannot go wrong with this model.
More slim gaming laptops can be found in our mobile Top 10.
Schenker XMG C506
- 04/24/2016 v5.1 (old)
Florian Glaser
Price comparison
