
Amazing value for money: The AMD Radeon RX 9070 XT and RX 9070 take on the overpriced GeForce RTX 5000 graphics cards
RDNA4 – The great hope reviewed!
AMD's RDNA4 is a new generation of graphics cards featuring higher efficiency, improved performance and attractive prices. AMD promises a better gaming experience in combination with FSR4 in particular. But is this enough to give Nvidia some competition? Our review will unveil whether AMD was able to fulfill our expectations.Sebastian Bade, 👁 Sebastian Bade (translated by Daisy Dickson) Published 🇩🇪 🇫🇷 ...
Verdict: Good performance at an acceptable price
After more than two years, AMD is saying goodbye to its RDNA3 graphics cards and is launching a whole new generation, namely RDNA4. Still, the Radeon RX 9070 XT doesn't have it easy compared to the previous flagship. One of the biggest changes is the switch from the MCM design back to a monolithic chip, combined with a finer manufacturing structure. Both new models are equipped with 16 GB of VRAM, which is sufficient for most games. However, there are some games that benefit from more memory, which is also reflected in the benchmark results. Even so, if you are prepared to make some slight compromises when it comes to resolution and opt for 1,440p, then you can enjoy a smooth gaming experience with high frame rates.
The AMD Radeon RX 9070 is similarly impressive, although it is overshadowed by the faster XT variant. It offers solid gaming performance and only suffers a slight loss in performance compared to the RX 9070 XT. It does particularly well in terms of efficiency and quieter operation, delivering around 10 percent less performance but around 20 percent lower energy consumption. At the same time, it has the same advantages as the XT model. AMD's FSR4 is a strong alternative to DLSS4, particularly when it comes to upscaling, which is now AI-supported. However, FSR4 is reserved exclusively for RDNA4 graphics cards, which means that an upgrade is required to benefit from the latest features.
AMD's models are particularly attractive in terms of their pricing compared to Nvidia. The official MRSP of the Radeon RX 9070 XT is around $740, while the RX 9070 has an even lower MRSP of approximately $670. It remains to be seen how good the availability of these graphics cards will be. If AMD suffers no bottlenecks, then there's a good chance that it will be able to take market share from Nvidia in the broader mid-range segment.
Pros
Cons
Price and availability
In Germany which is where we conducted our testing, the AMD Radeon RX 9070 XT costs around $740, while the AMD Radeon RX 9070 can be purchased for approximately $670.
Table of Contents
- Verdict: Good performance at an acceptable price
- The AMD Radeon RX 9070 (XT) with RDNA4 genes and FSR4
- Specifications
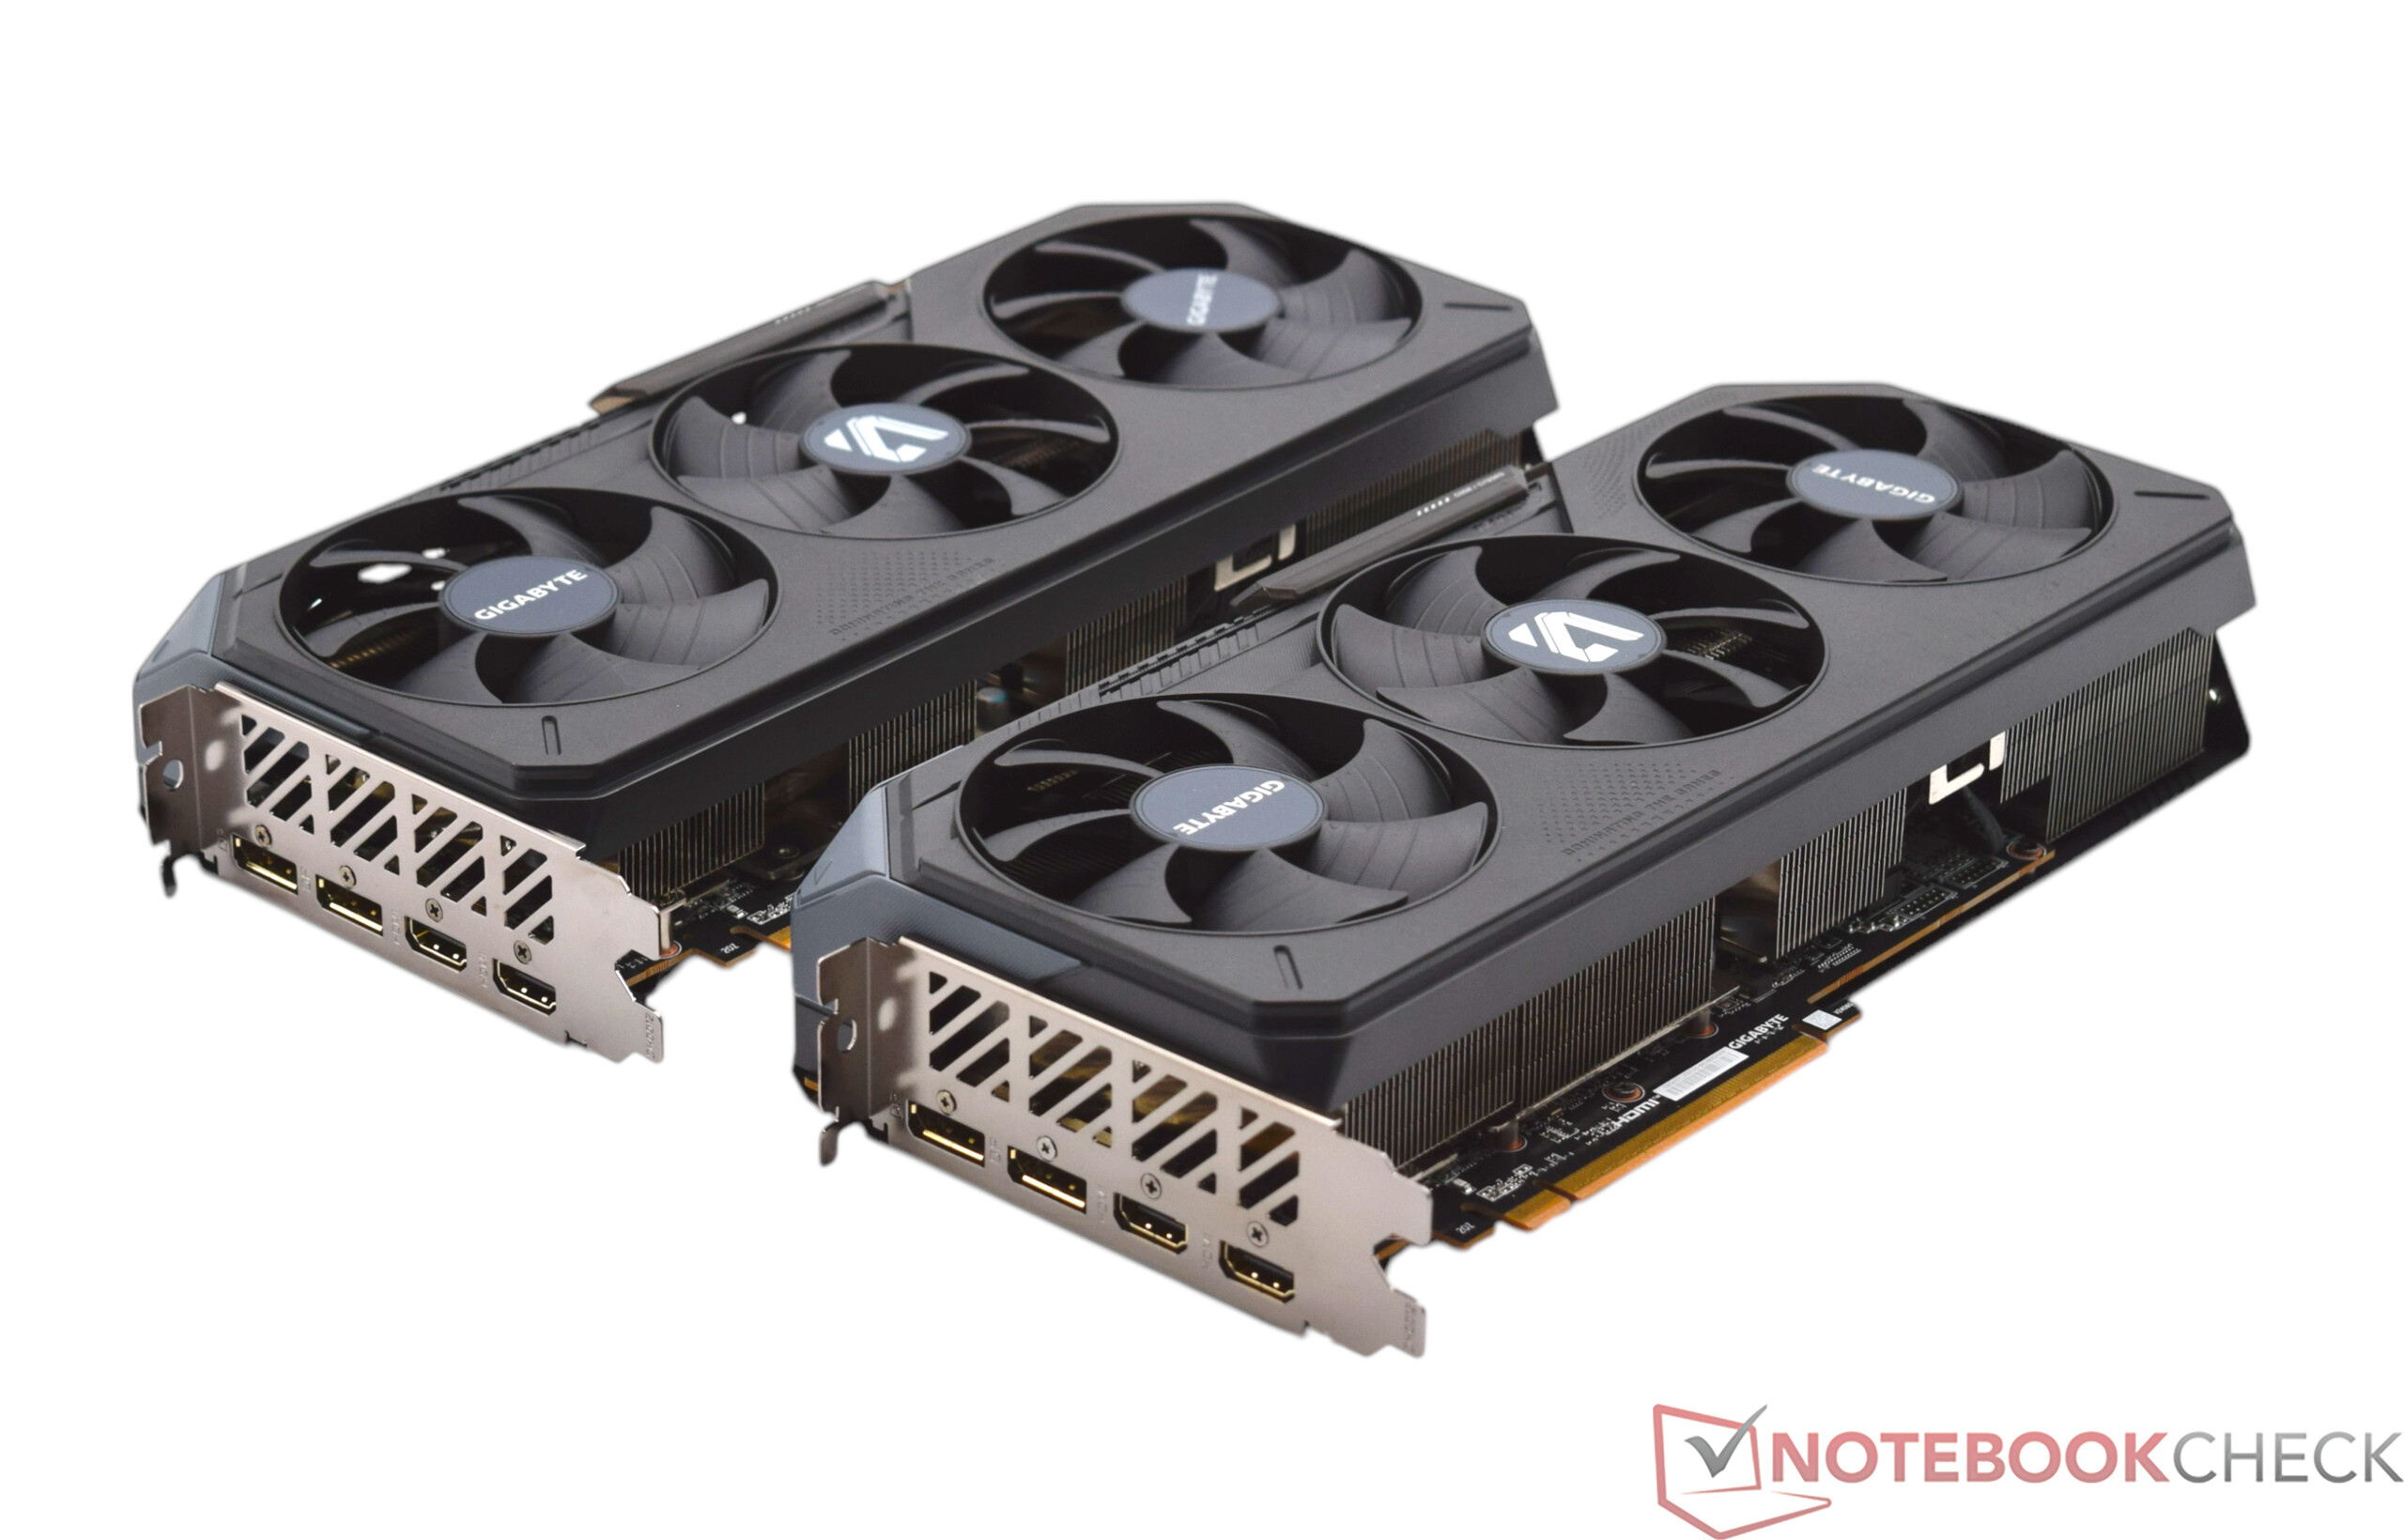
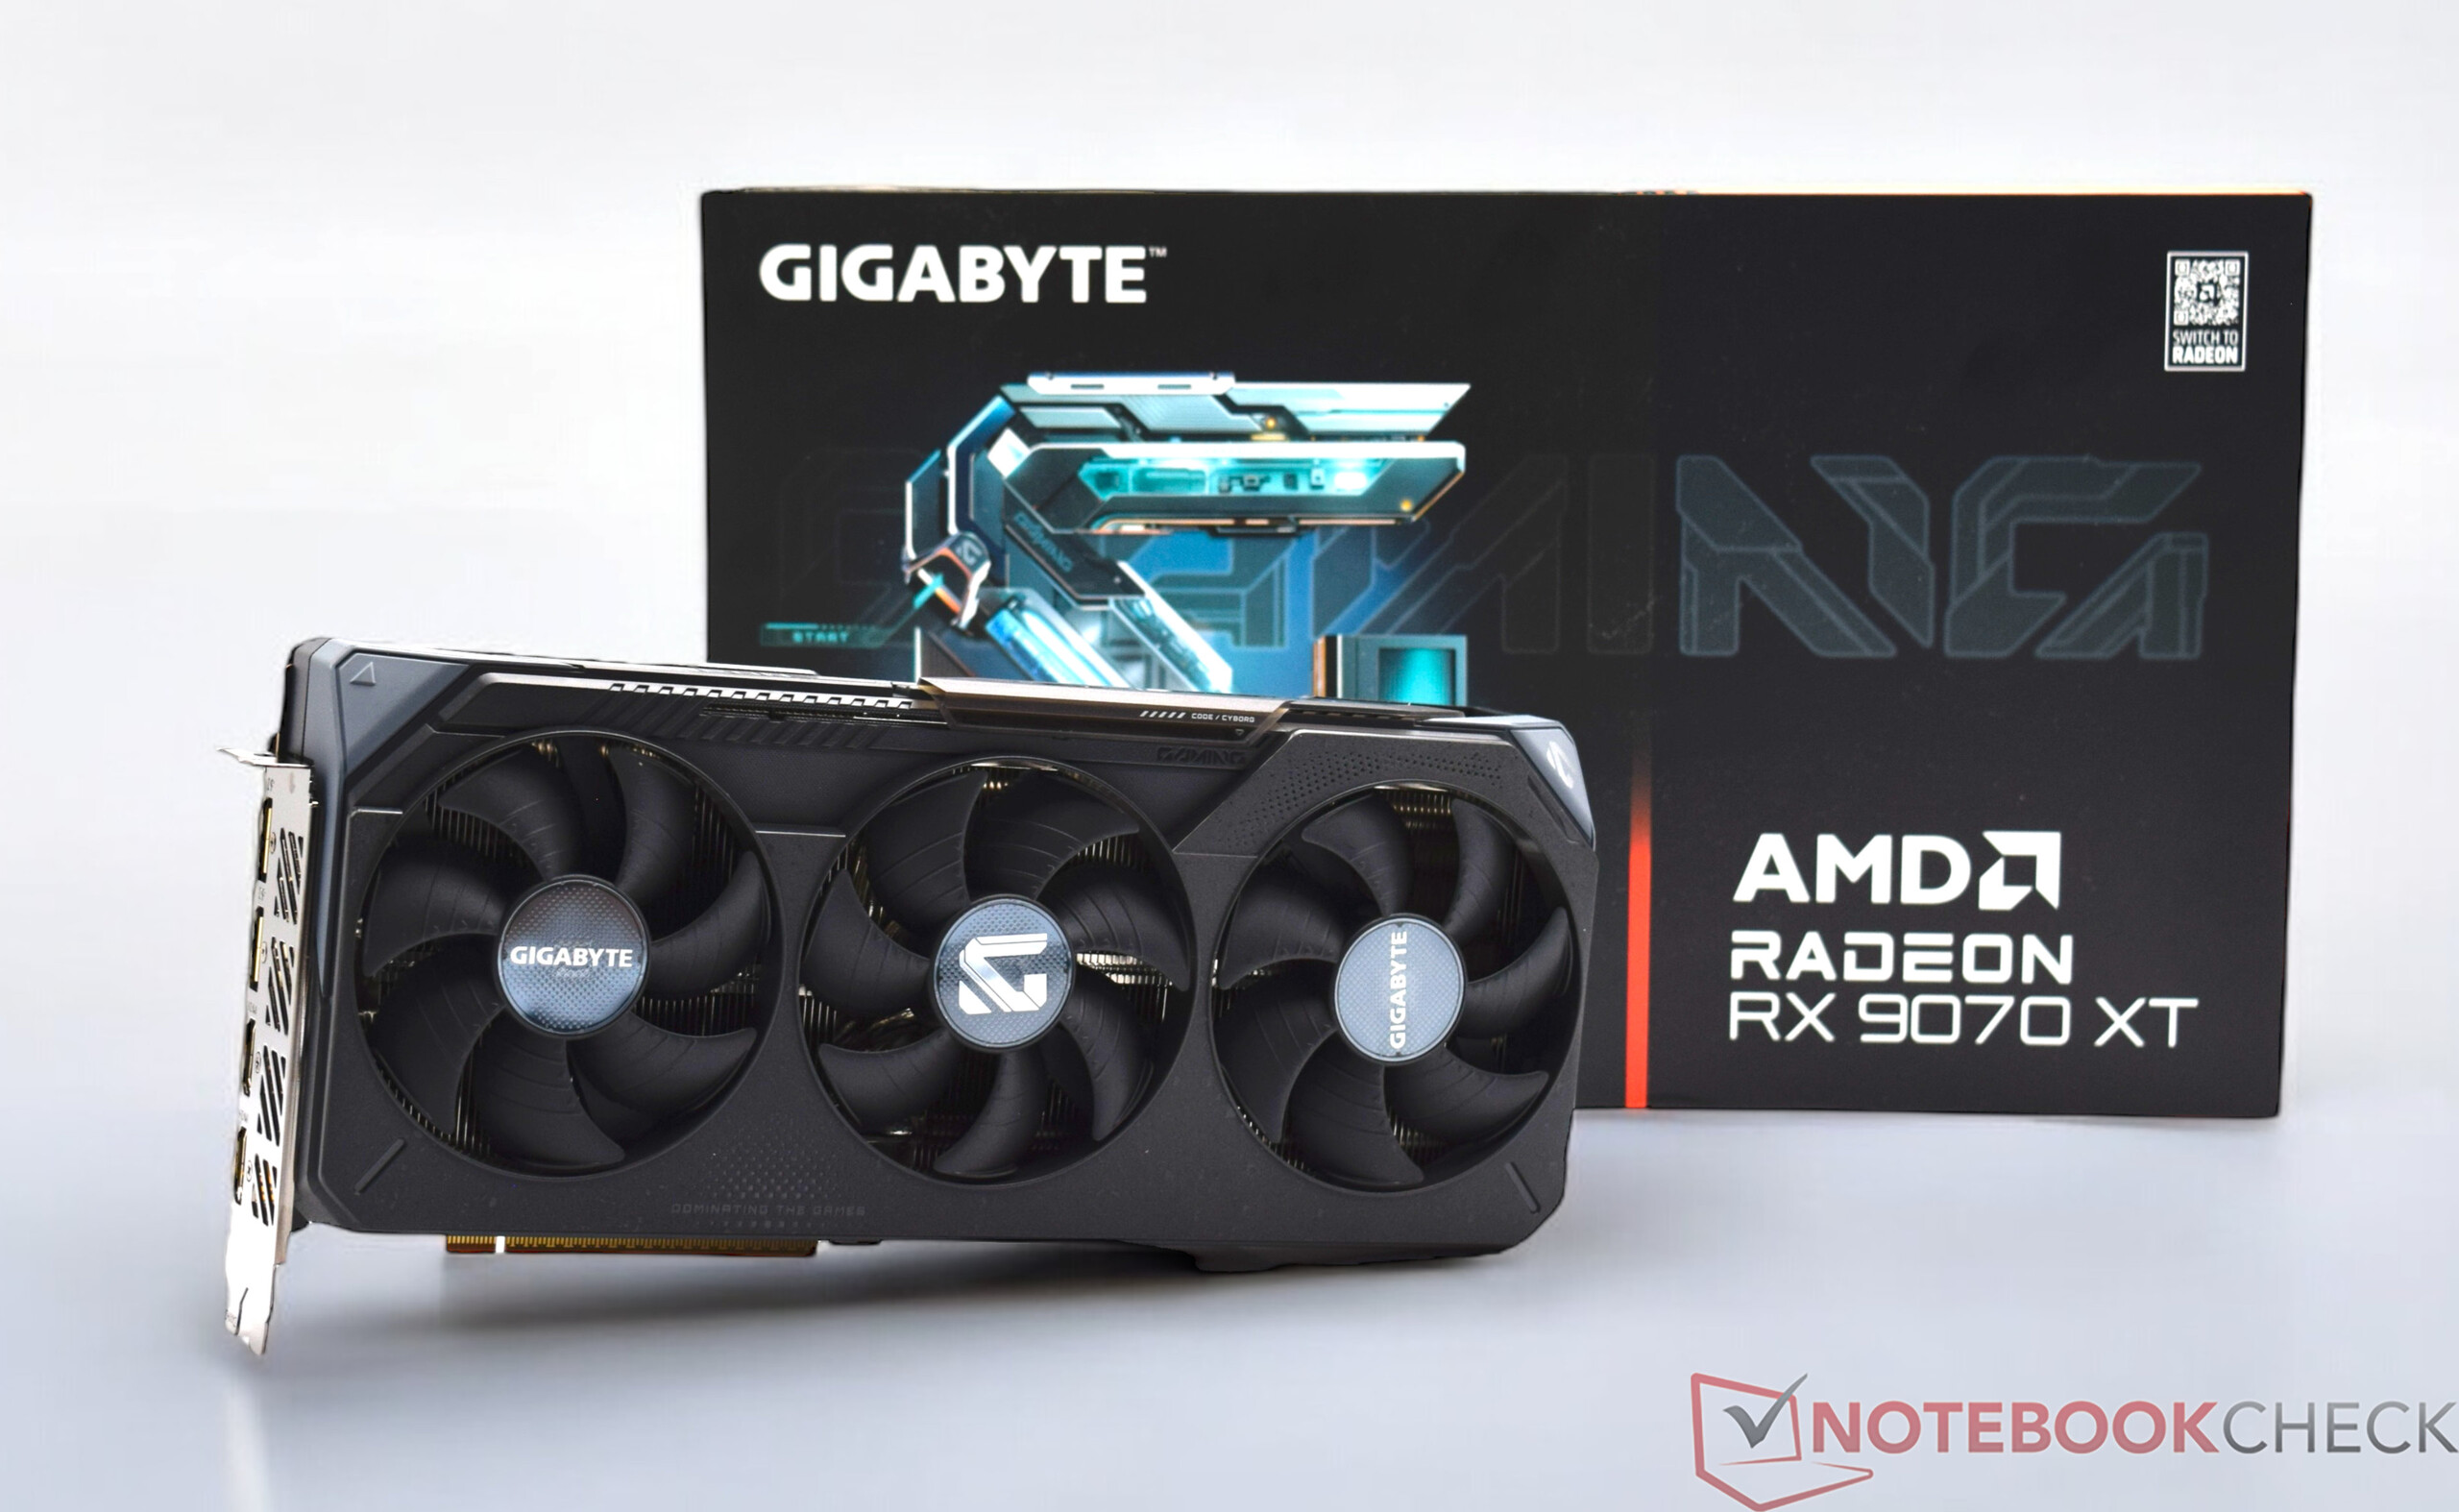
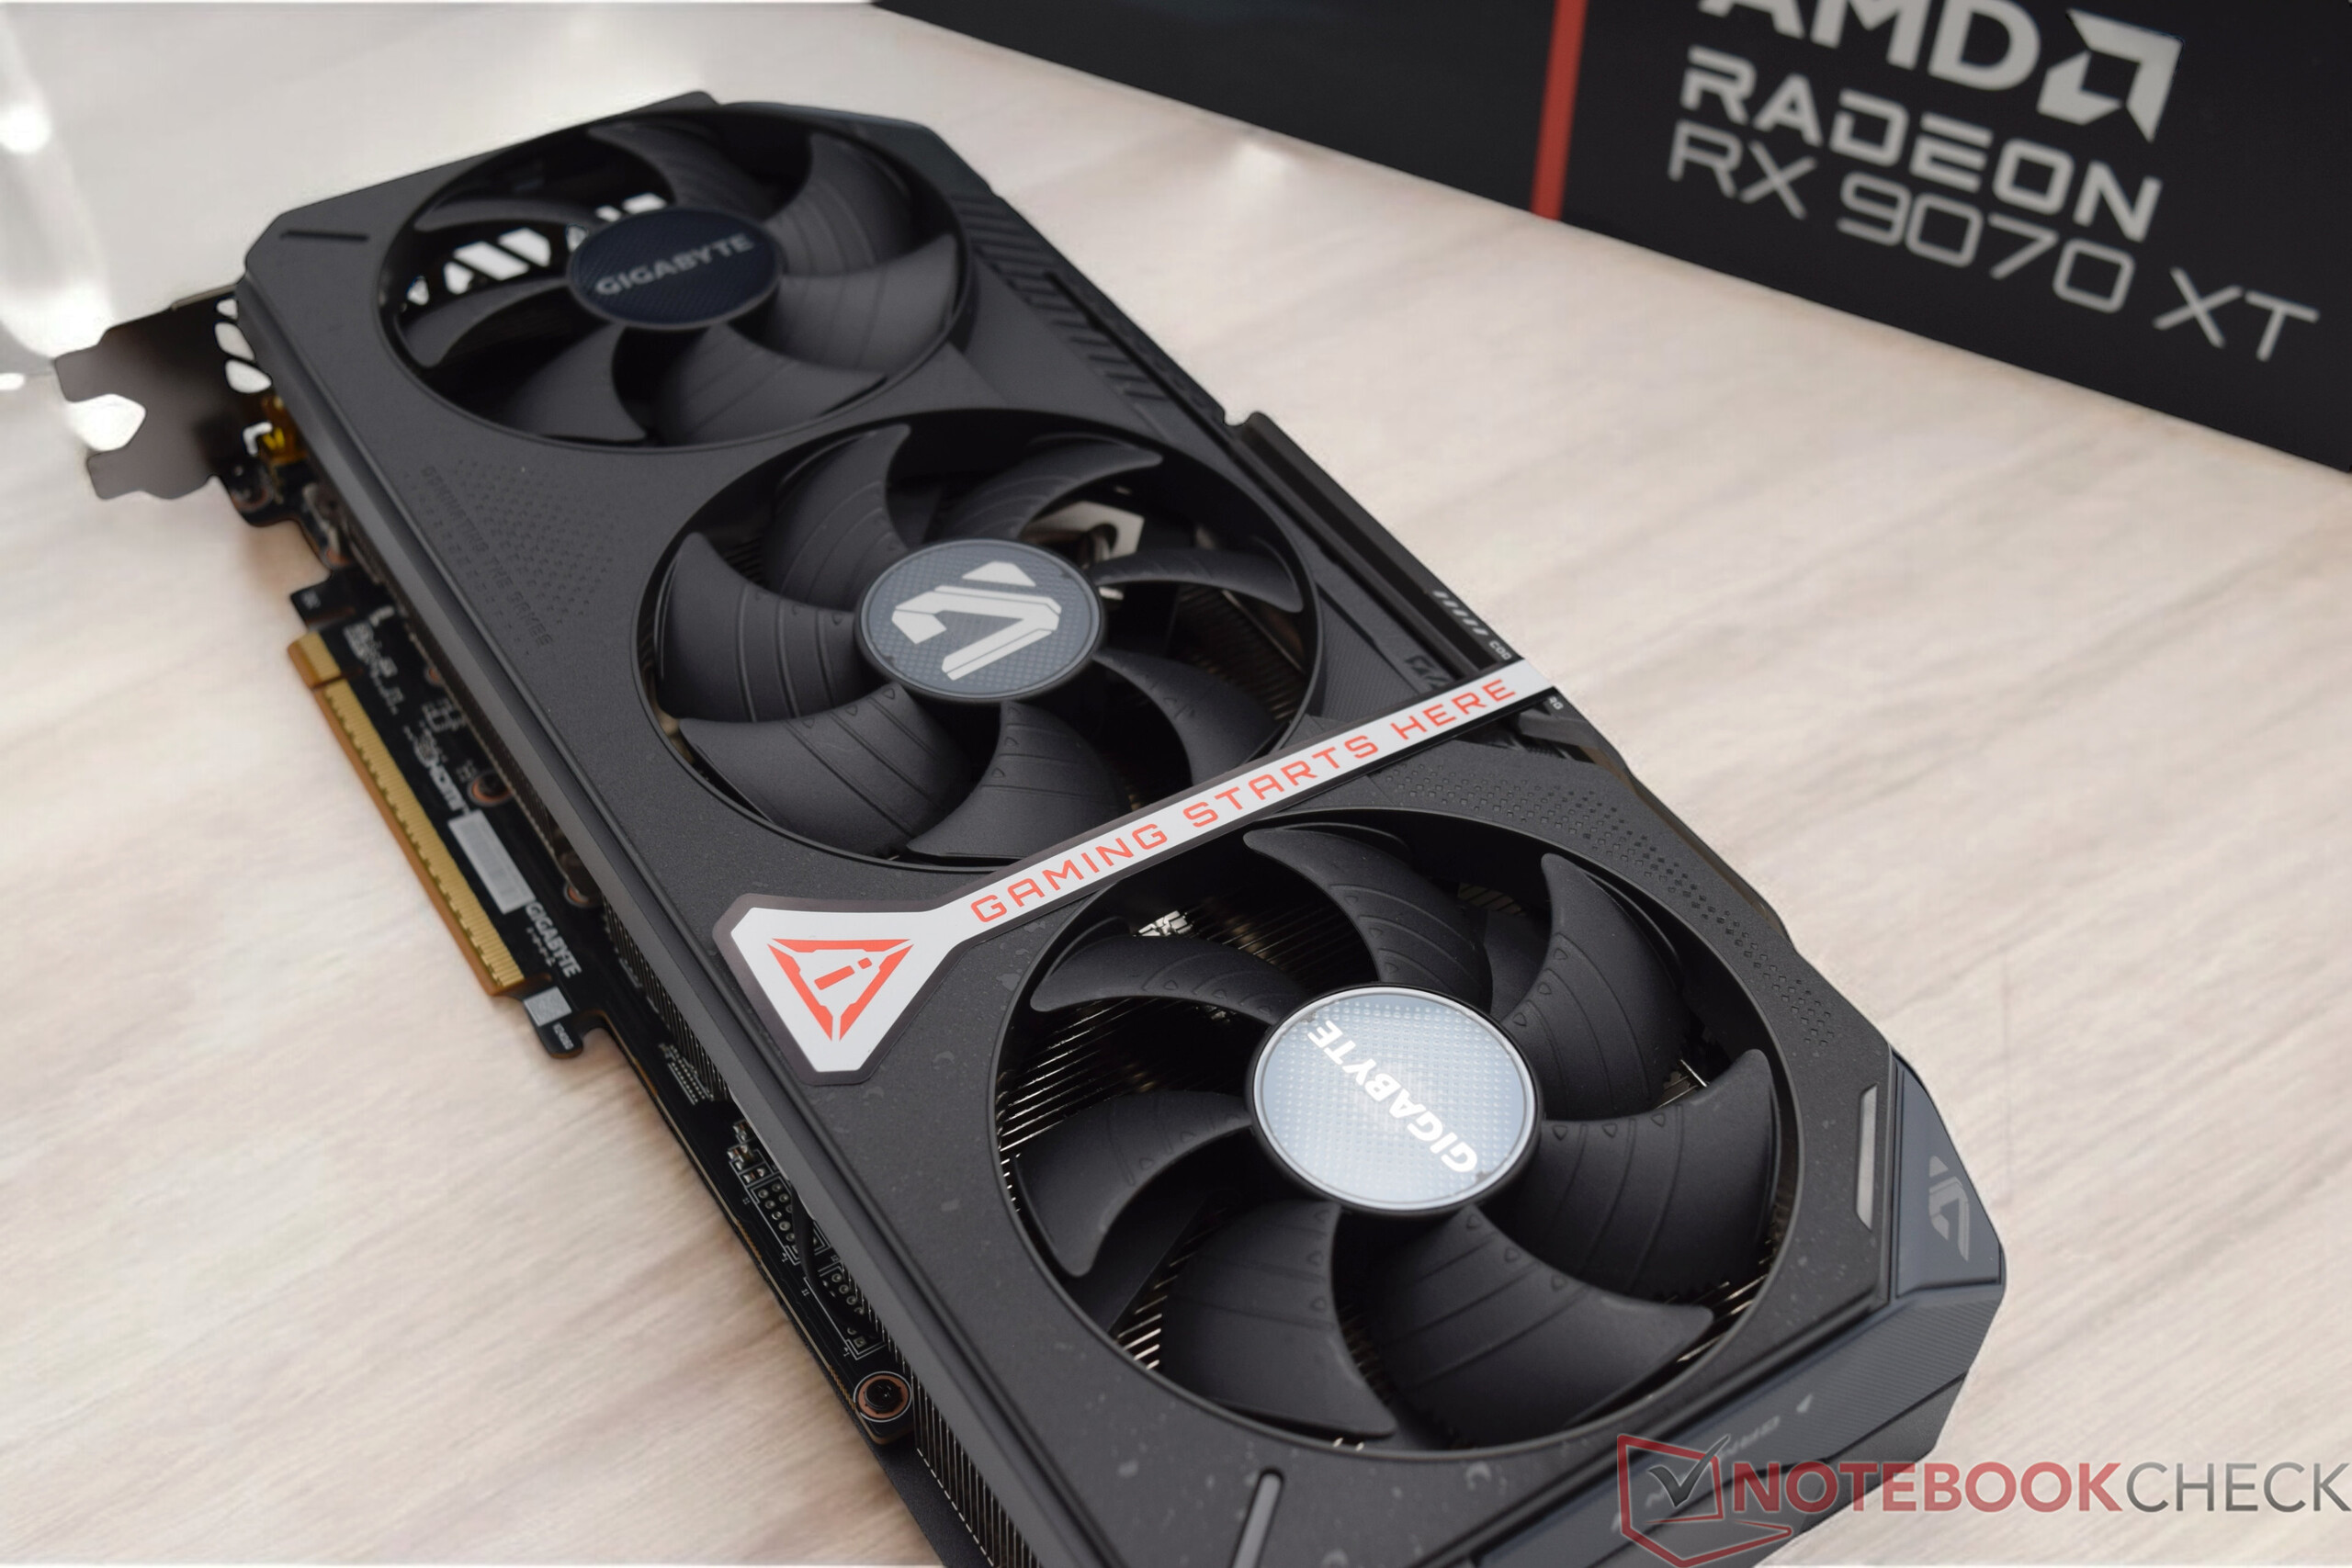
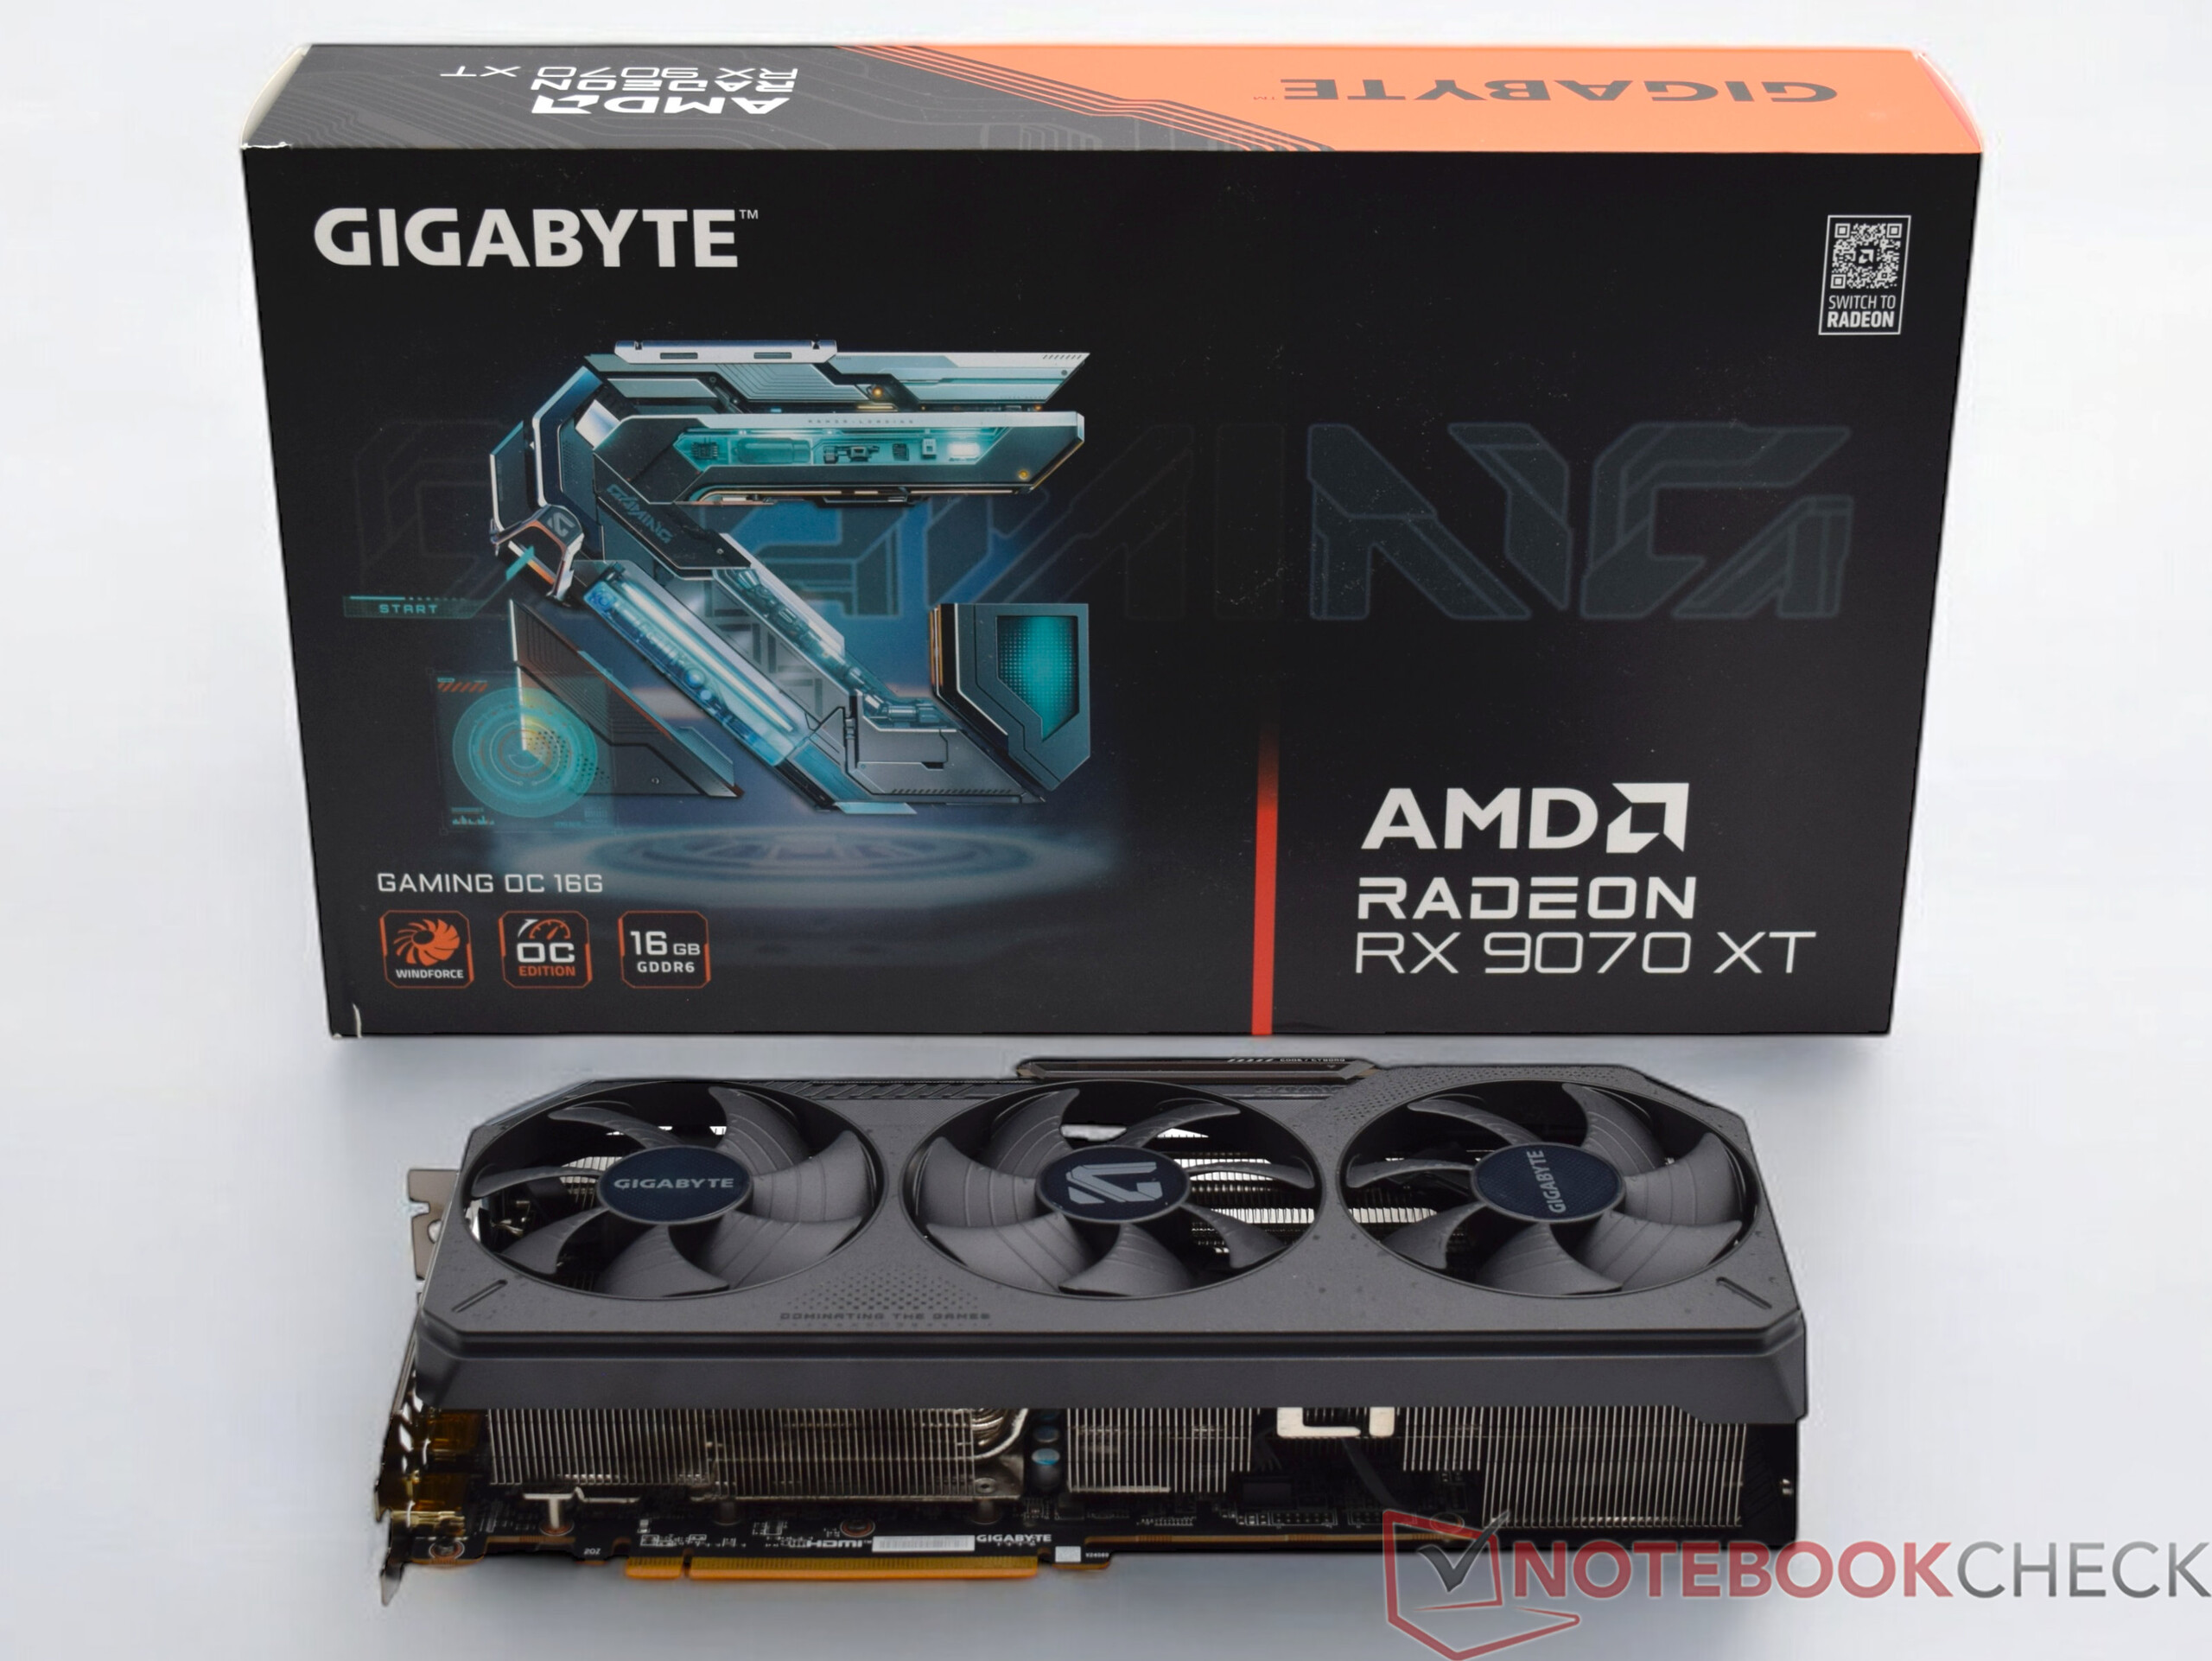
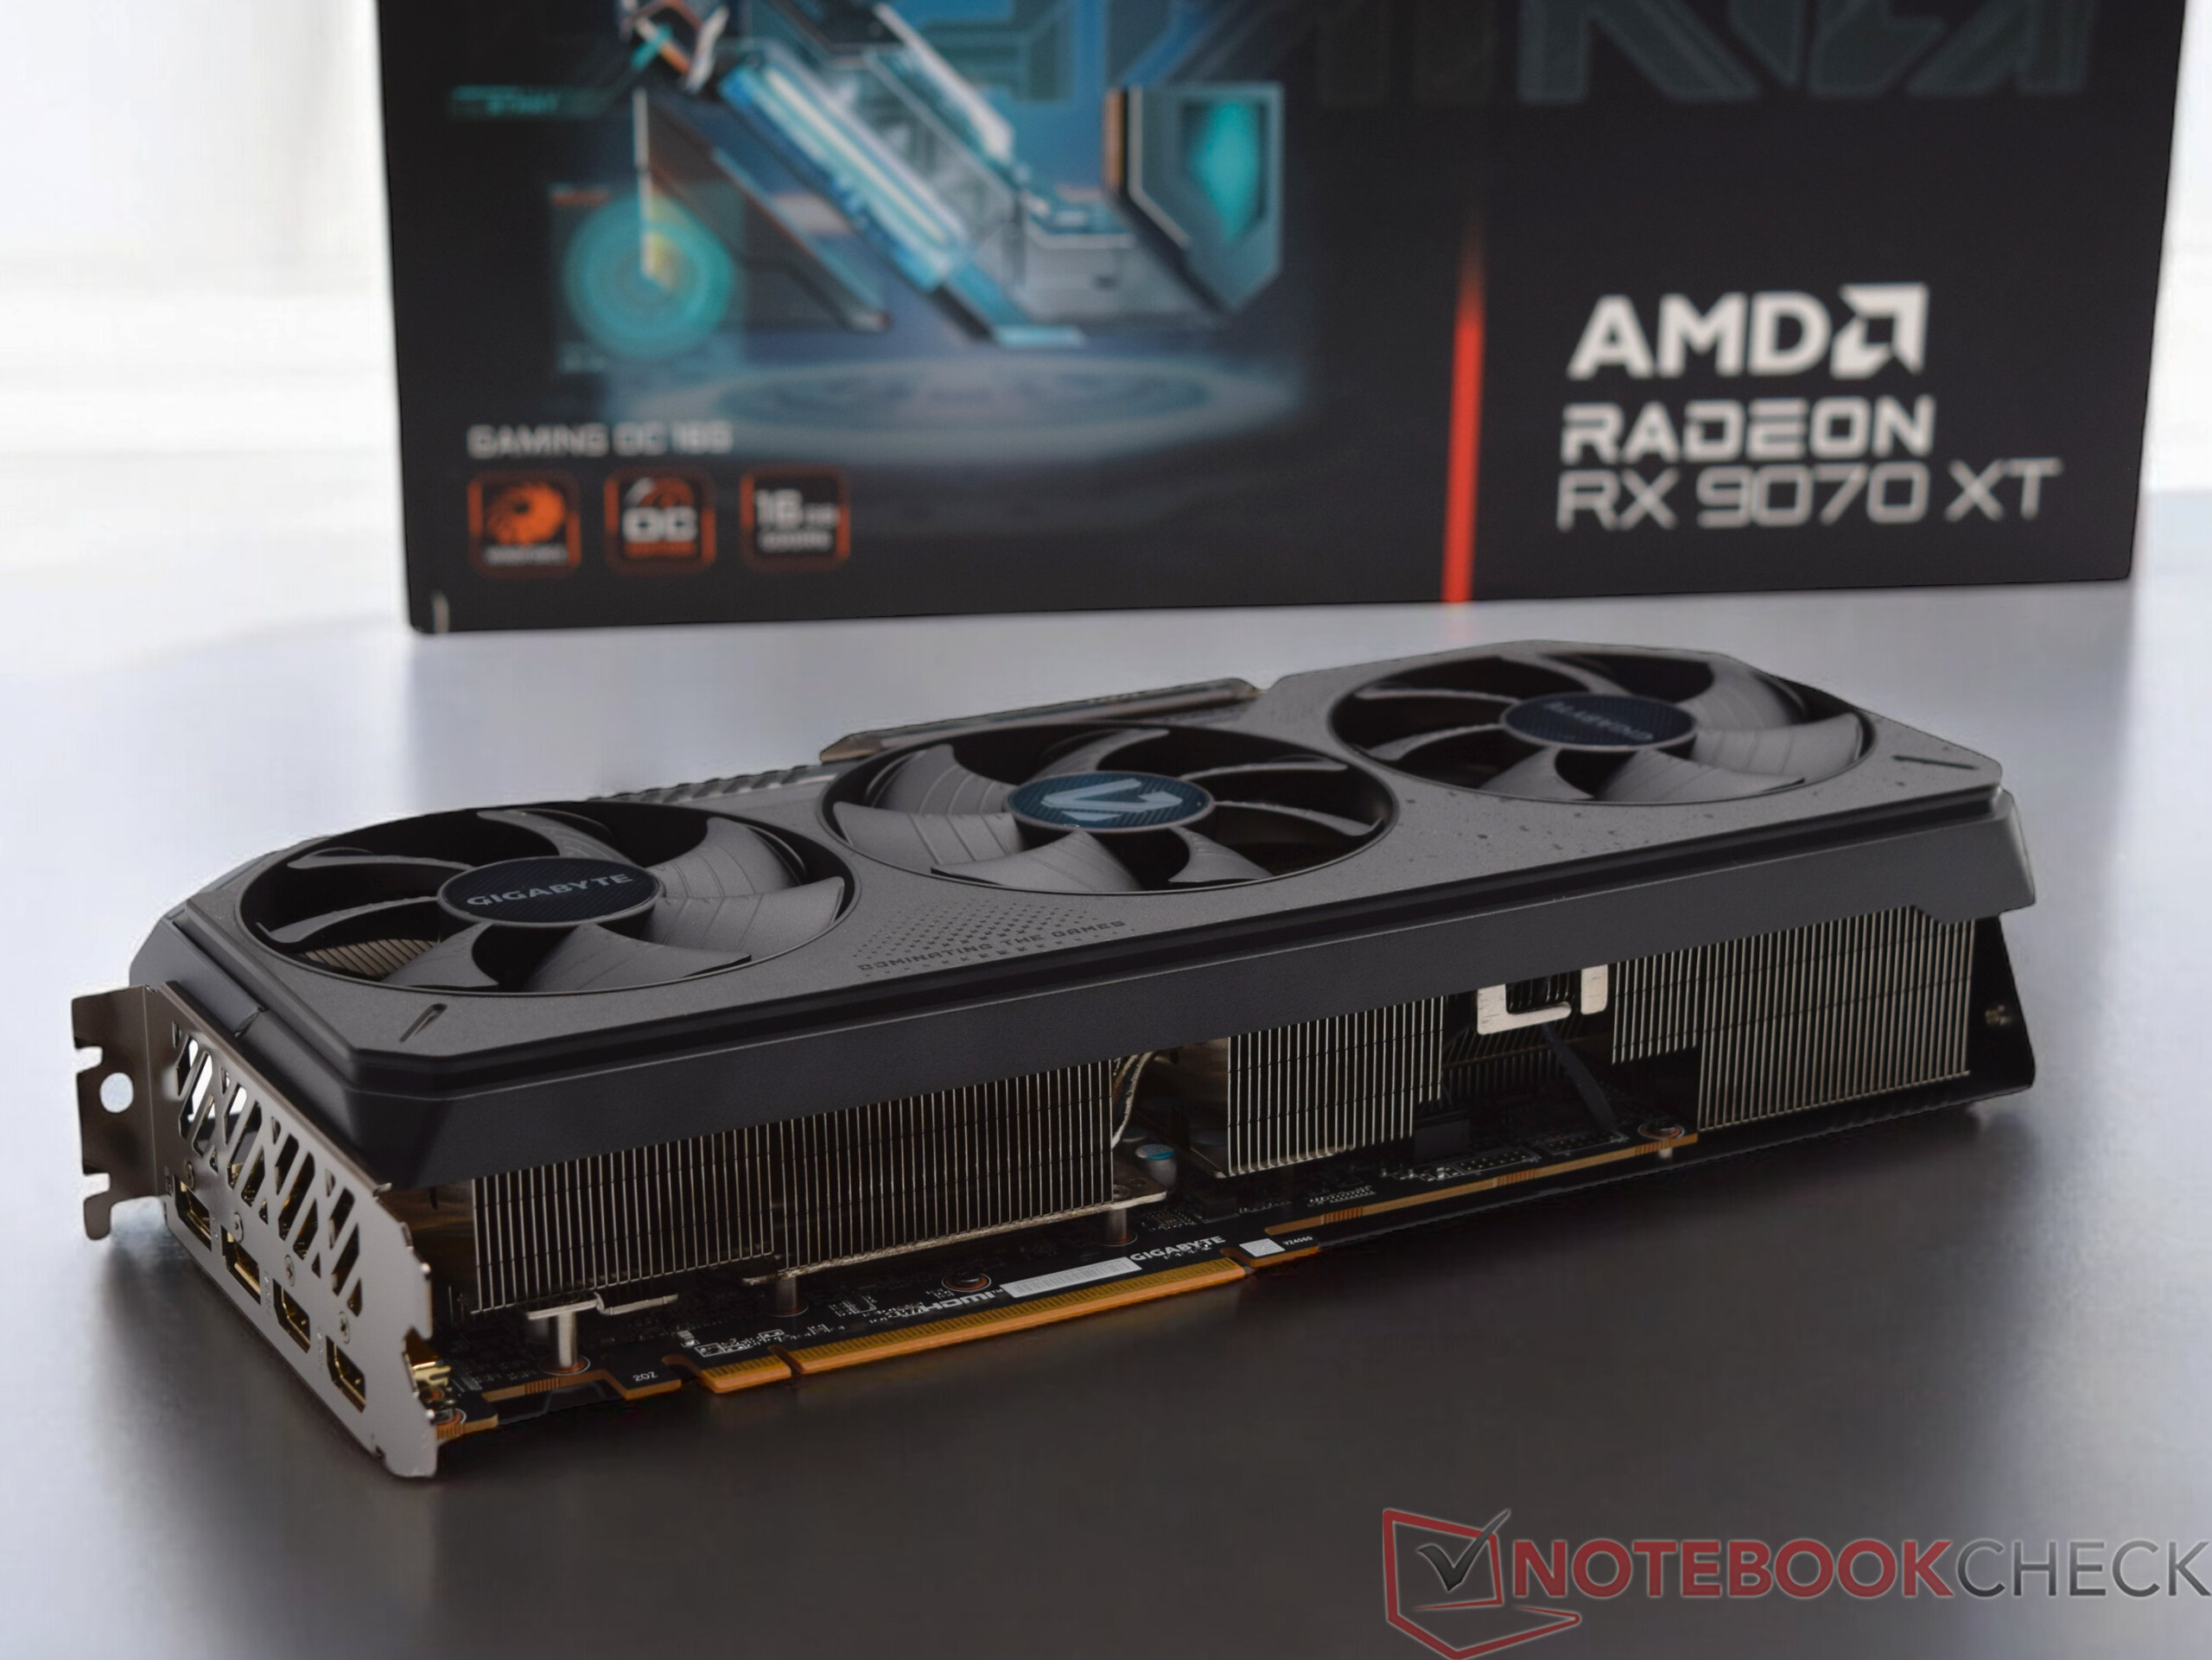
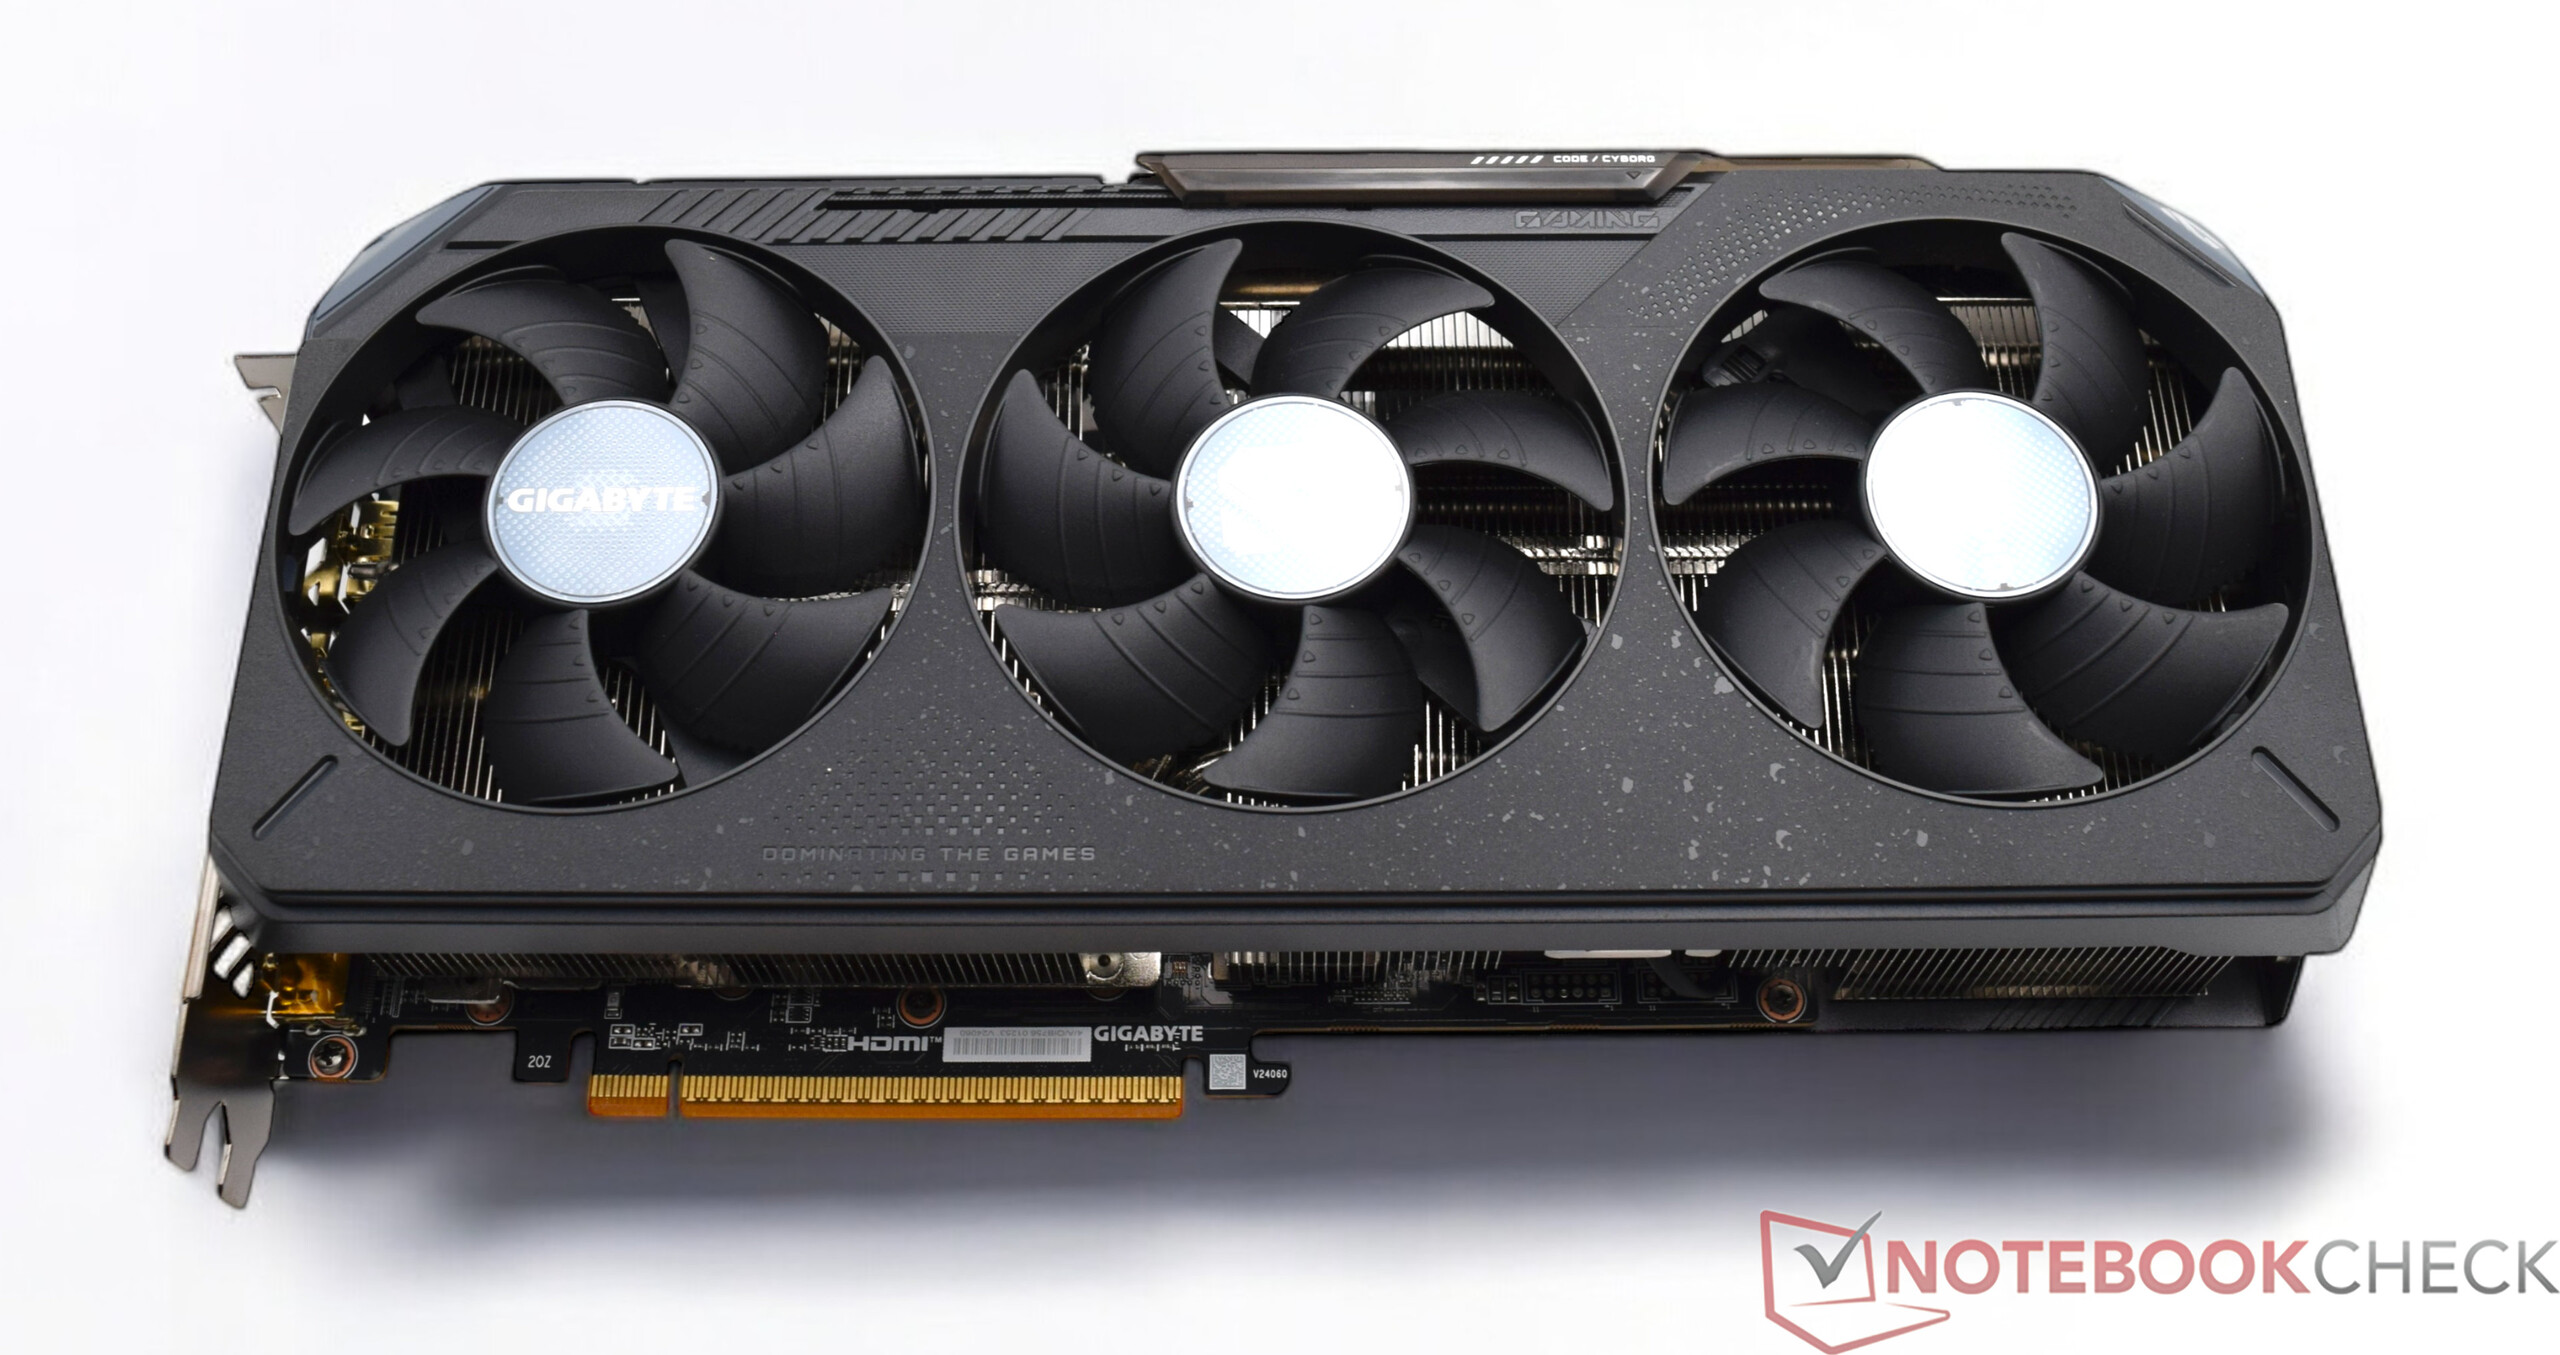
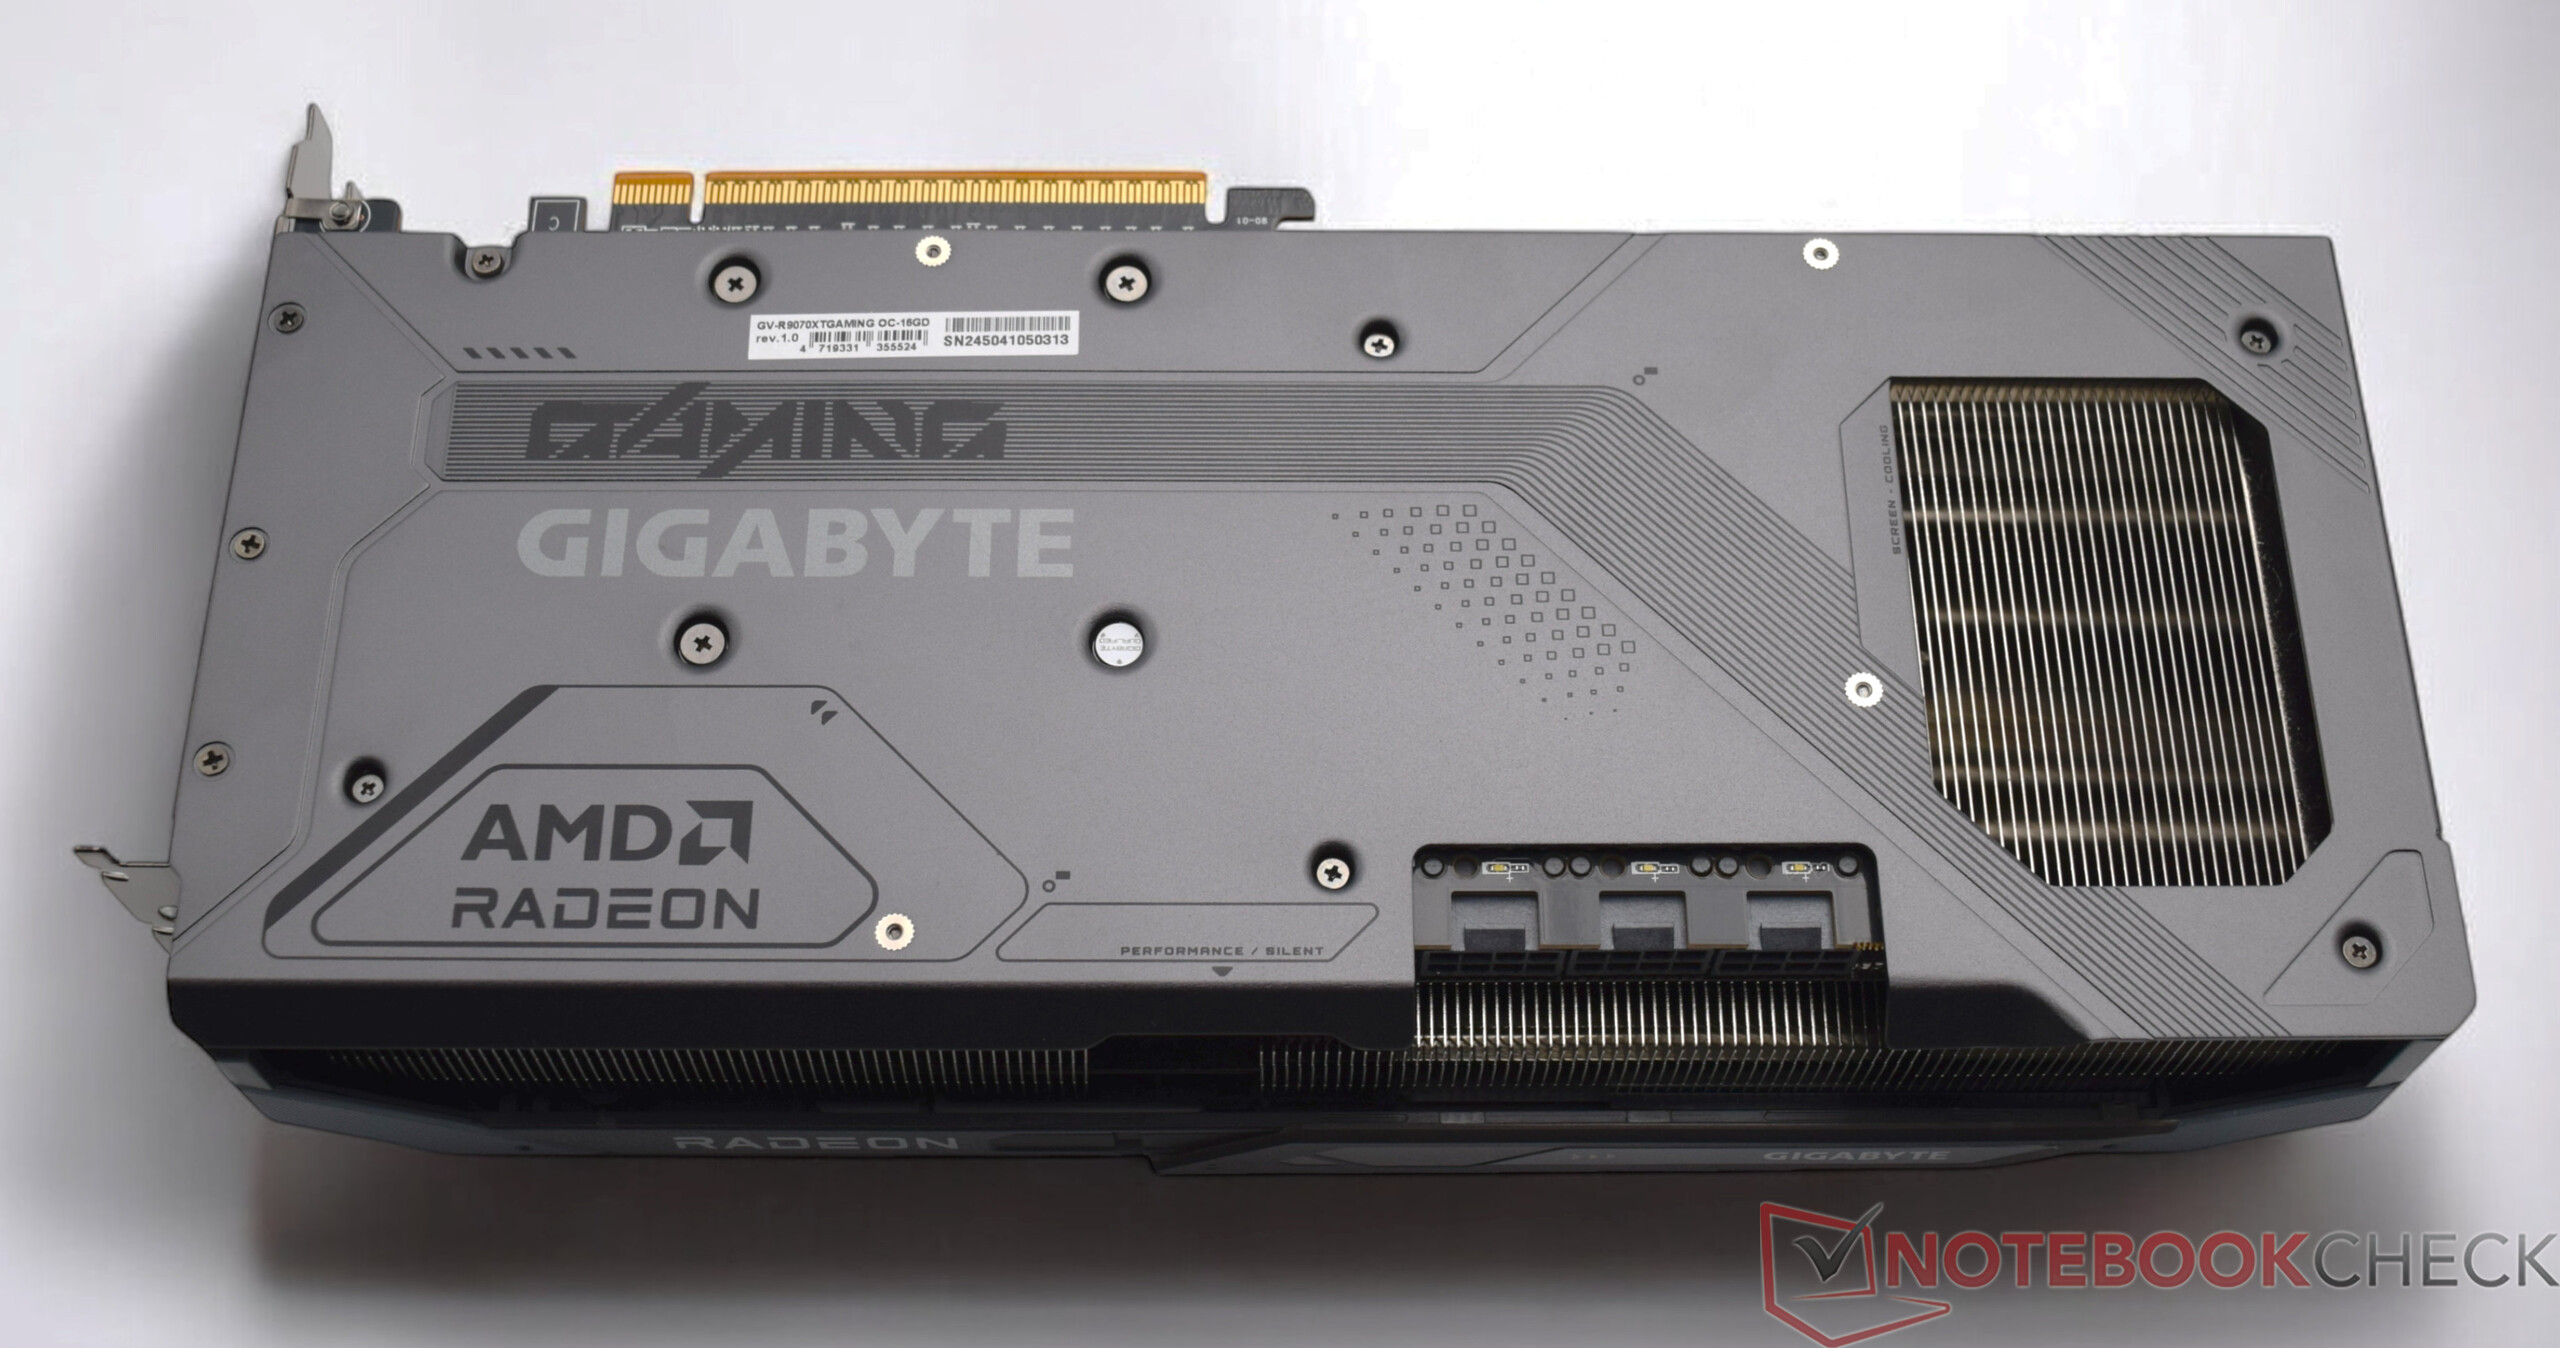
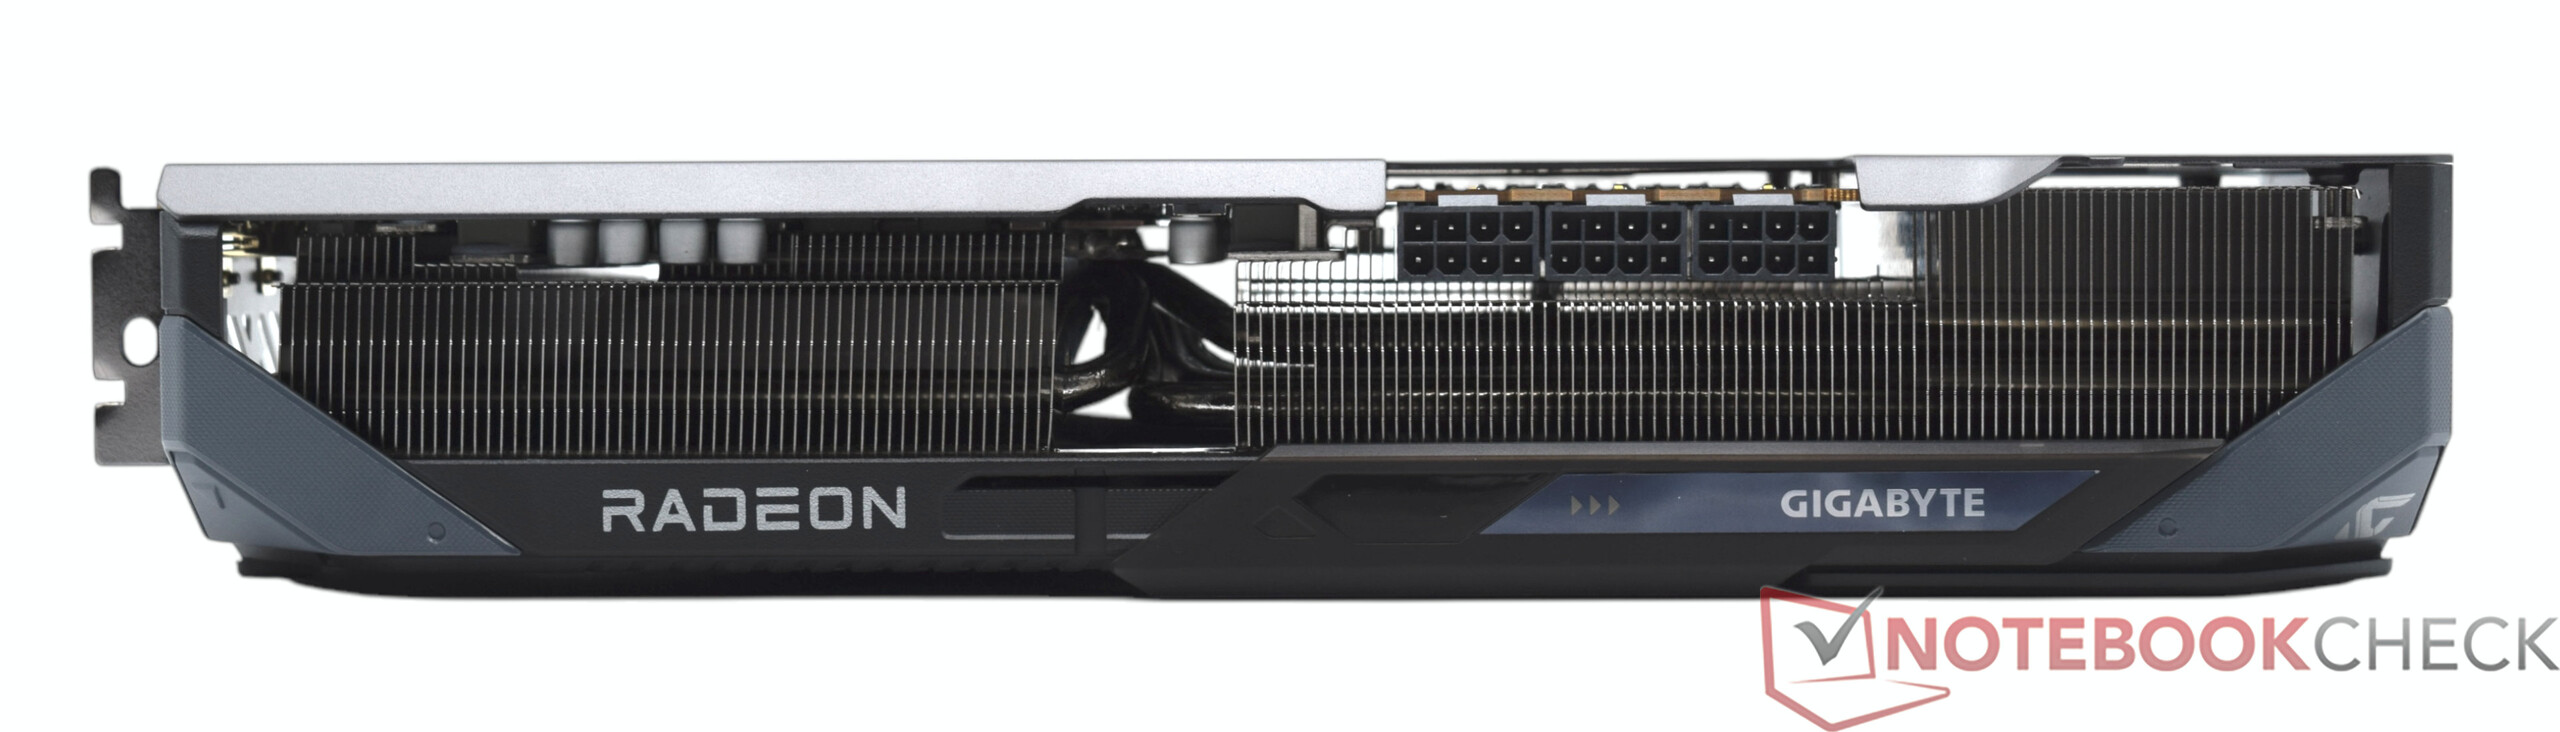
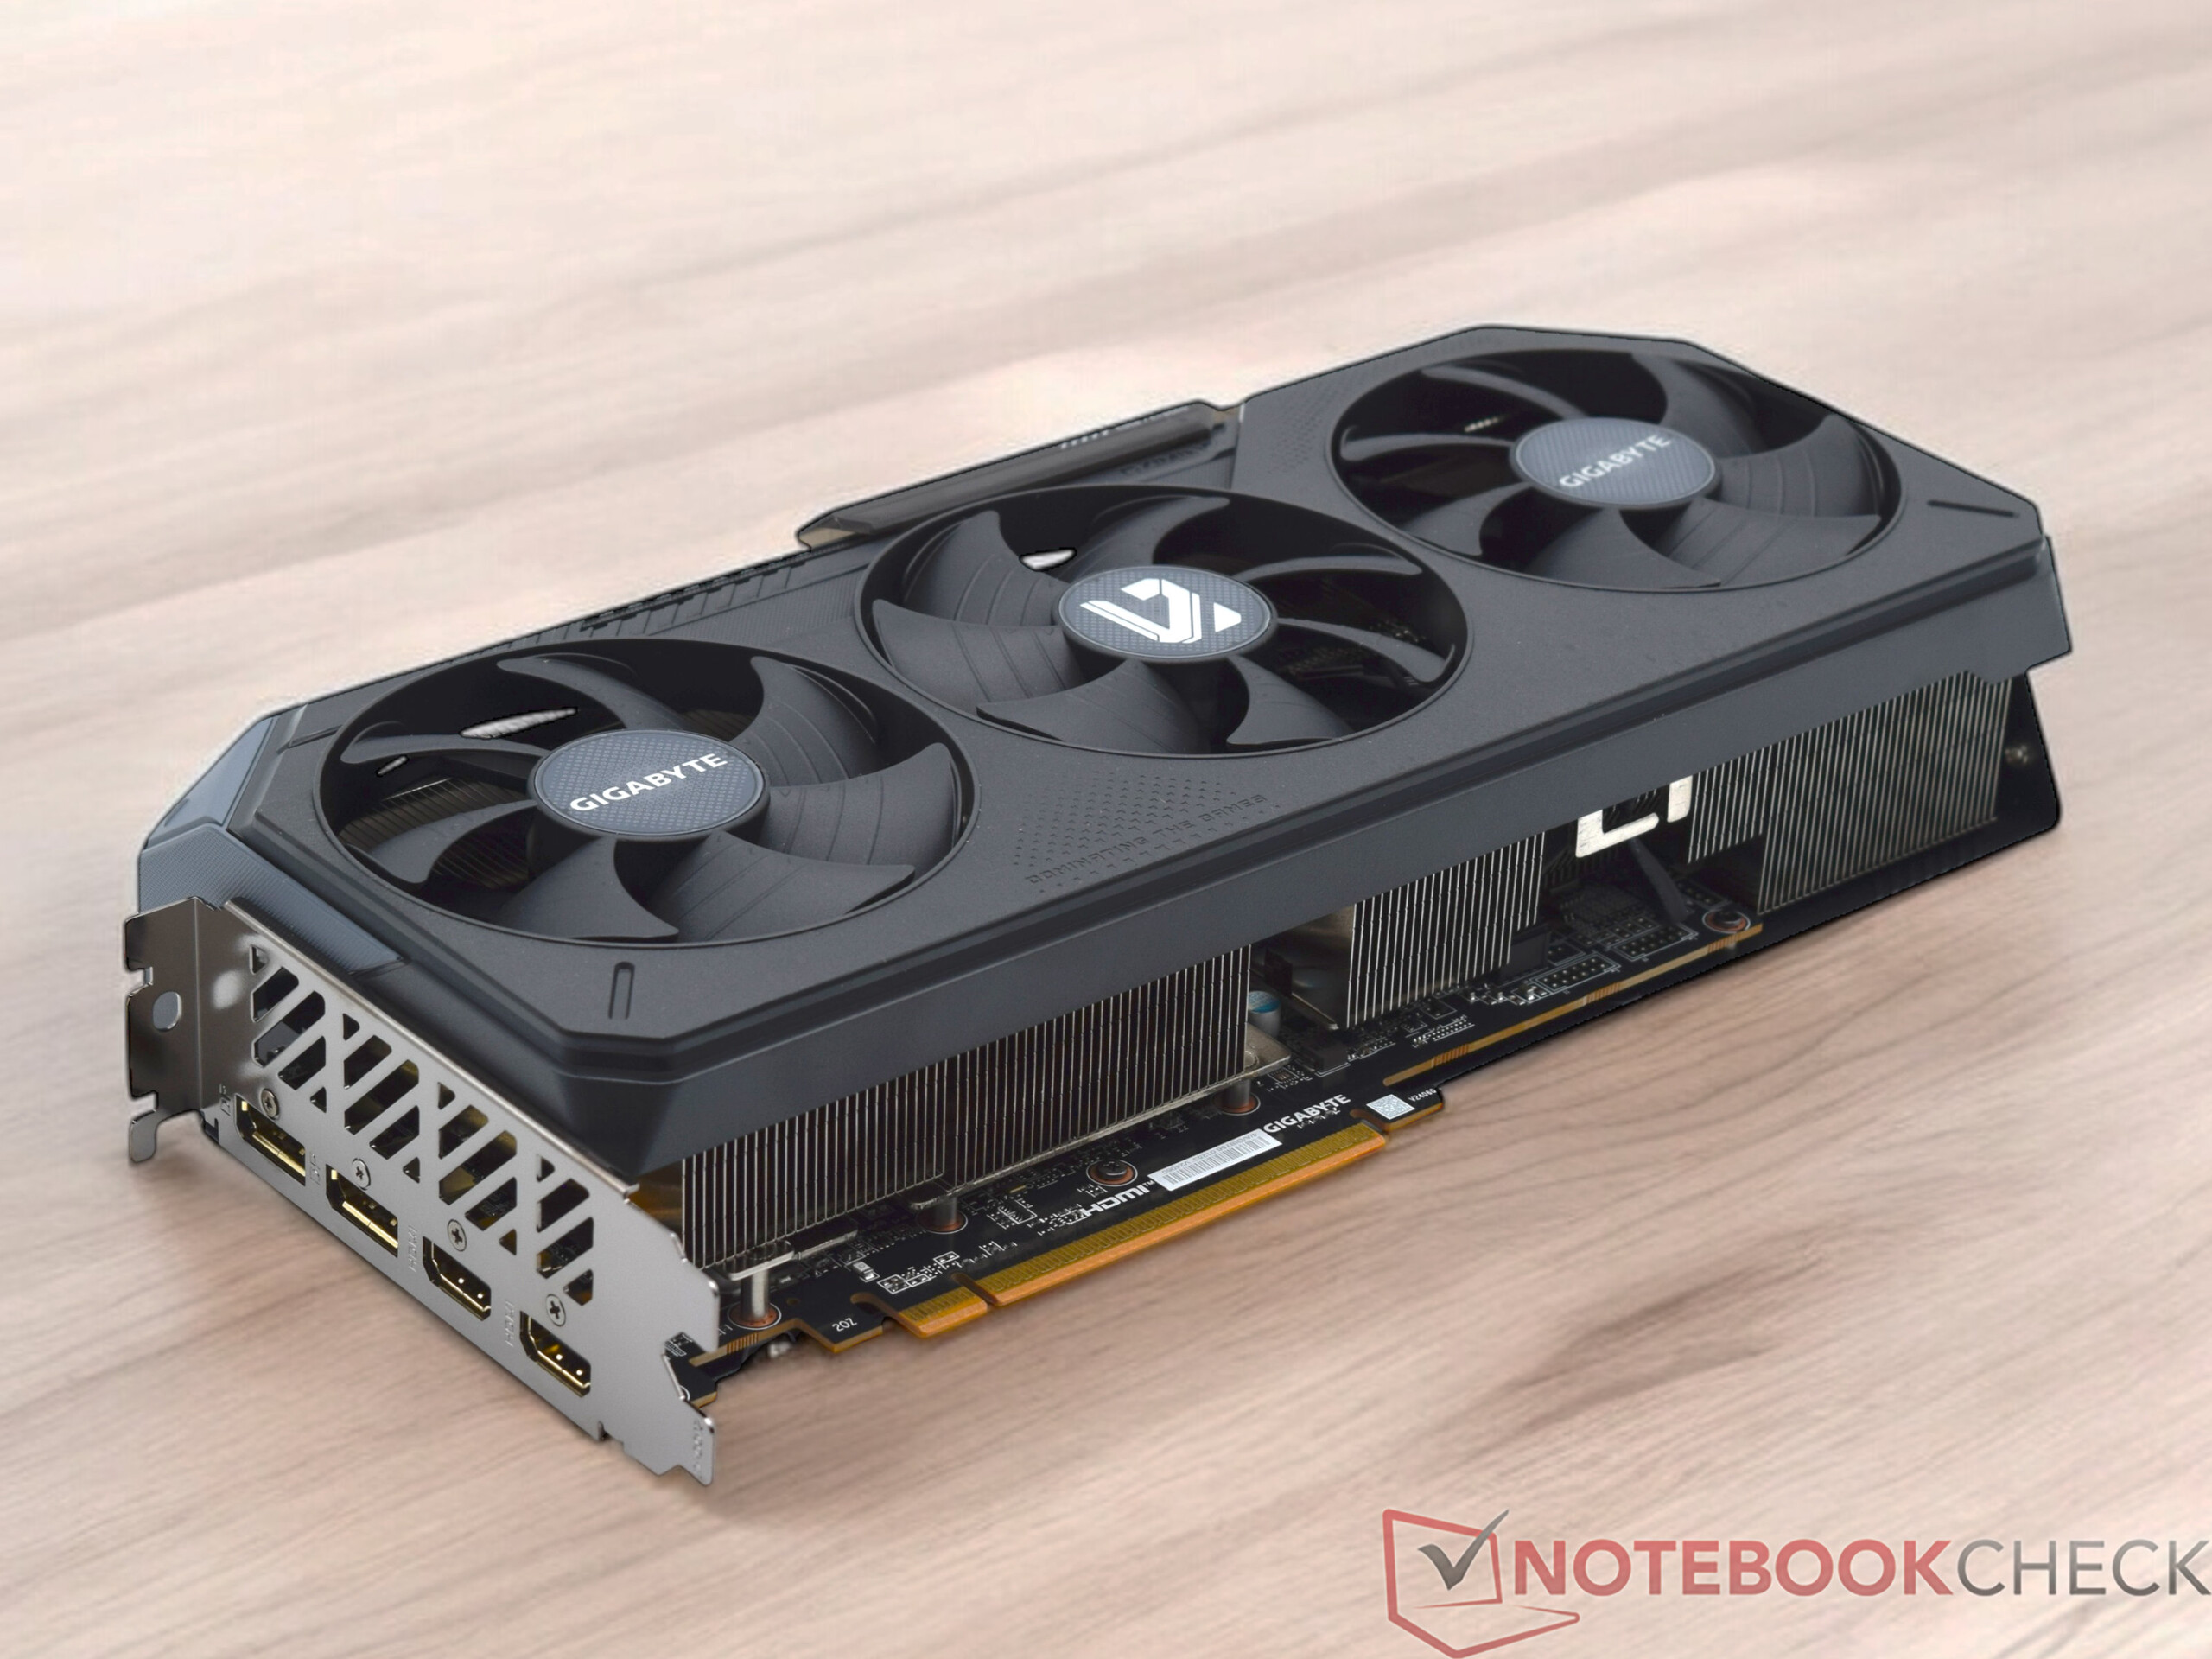
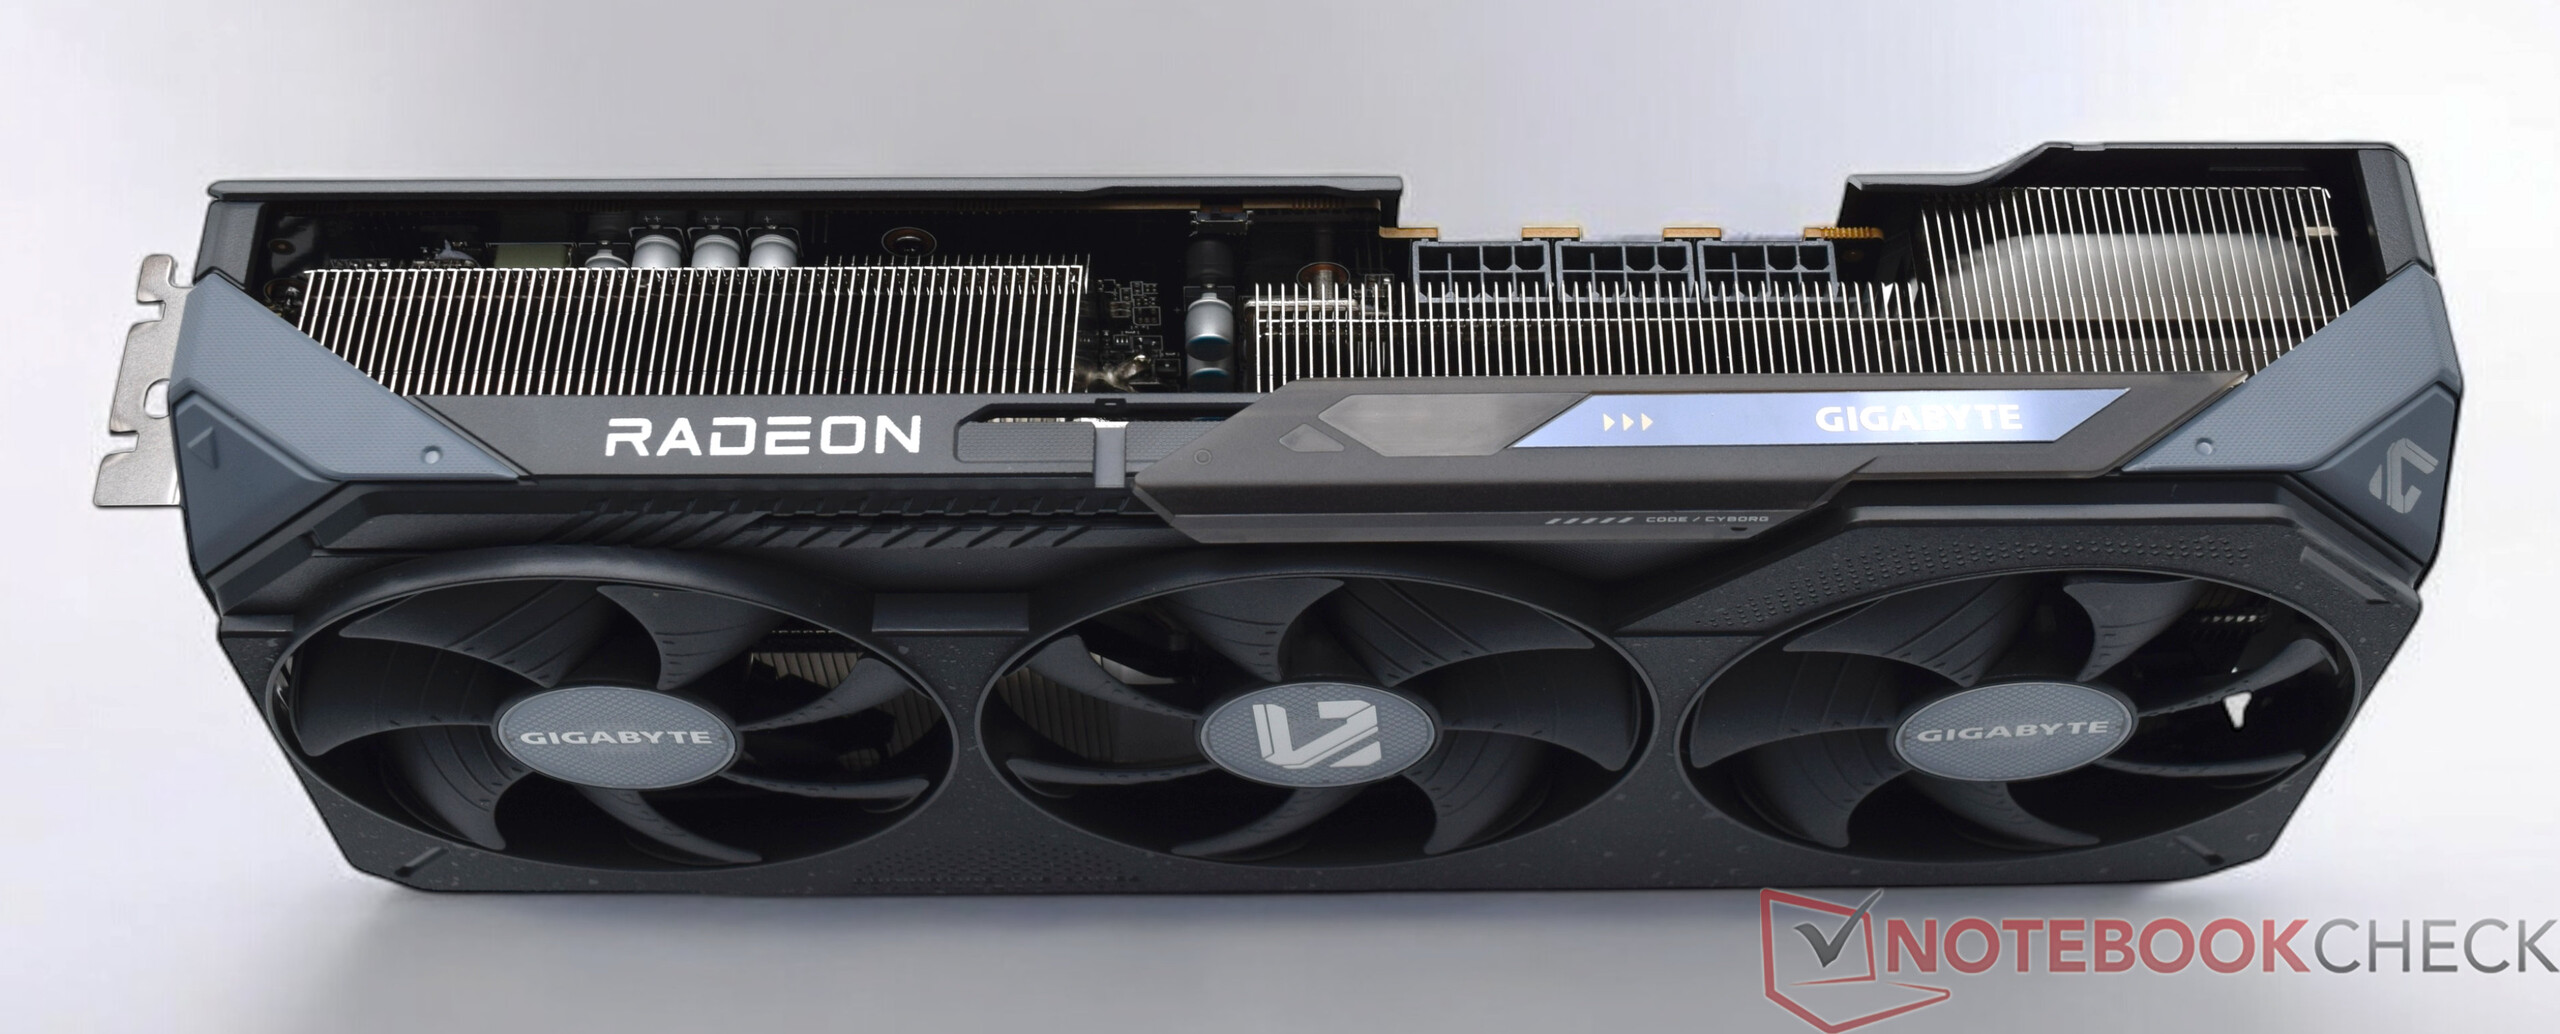
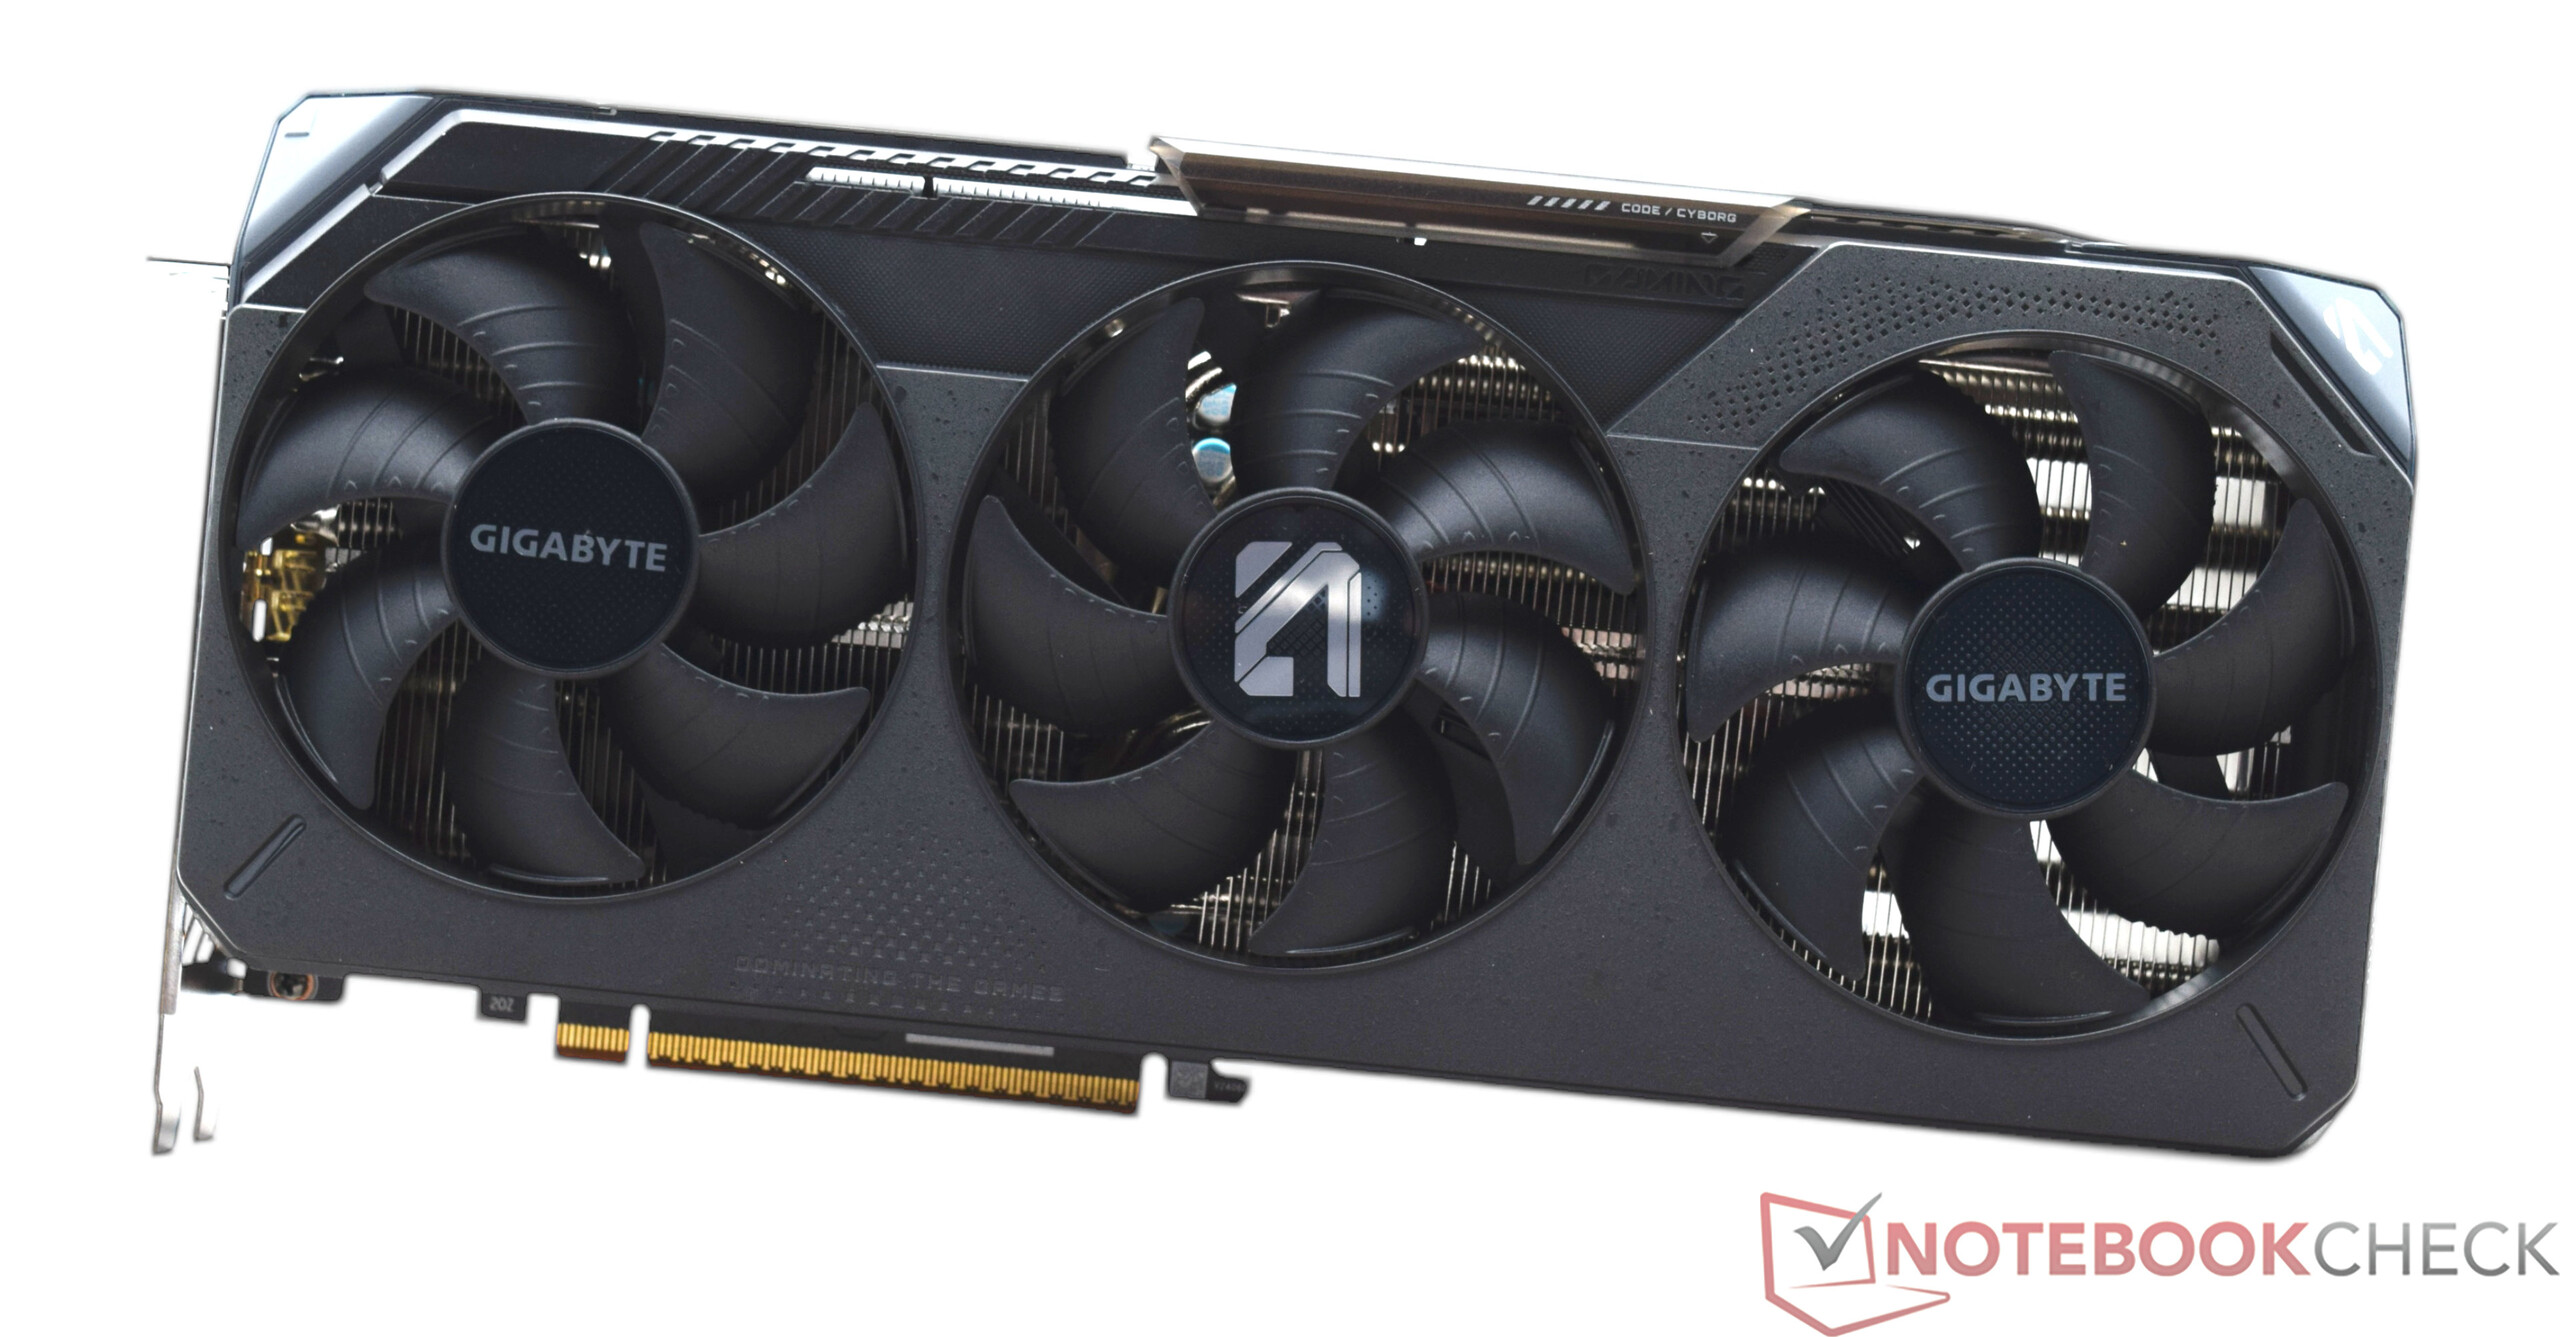
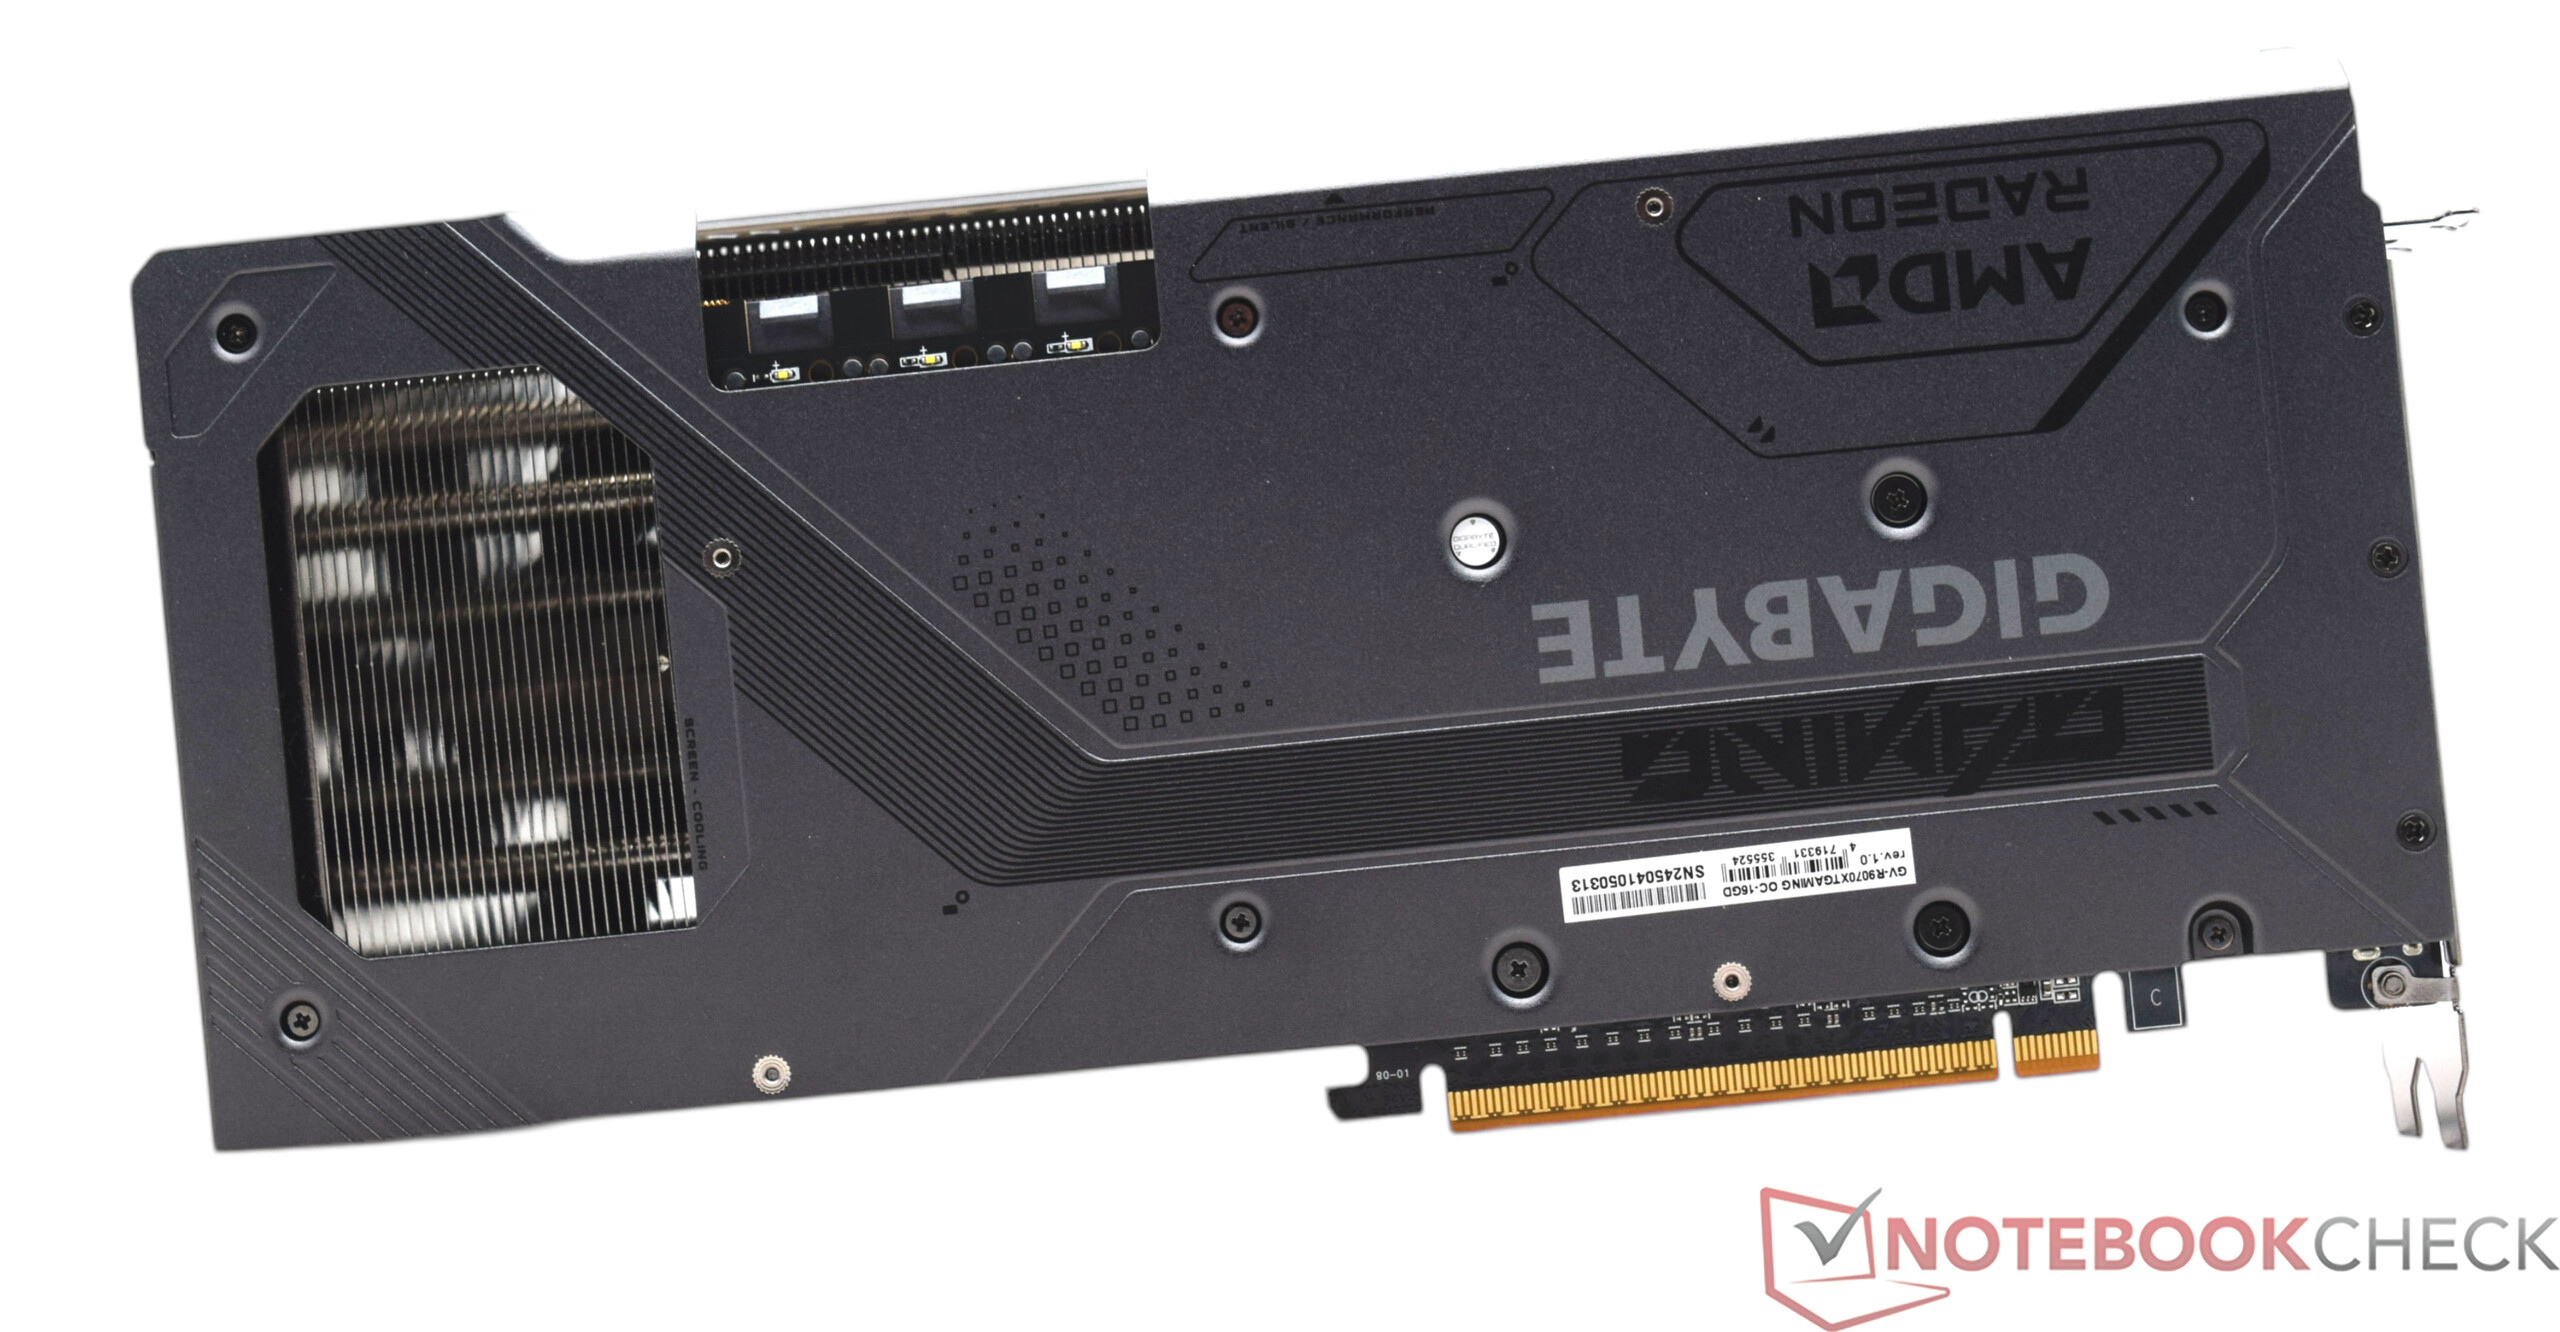
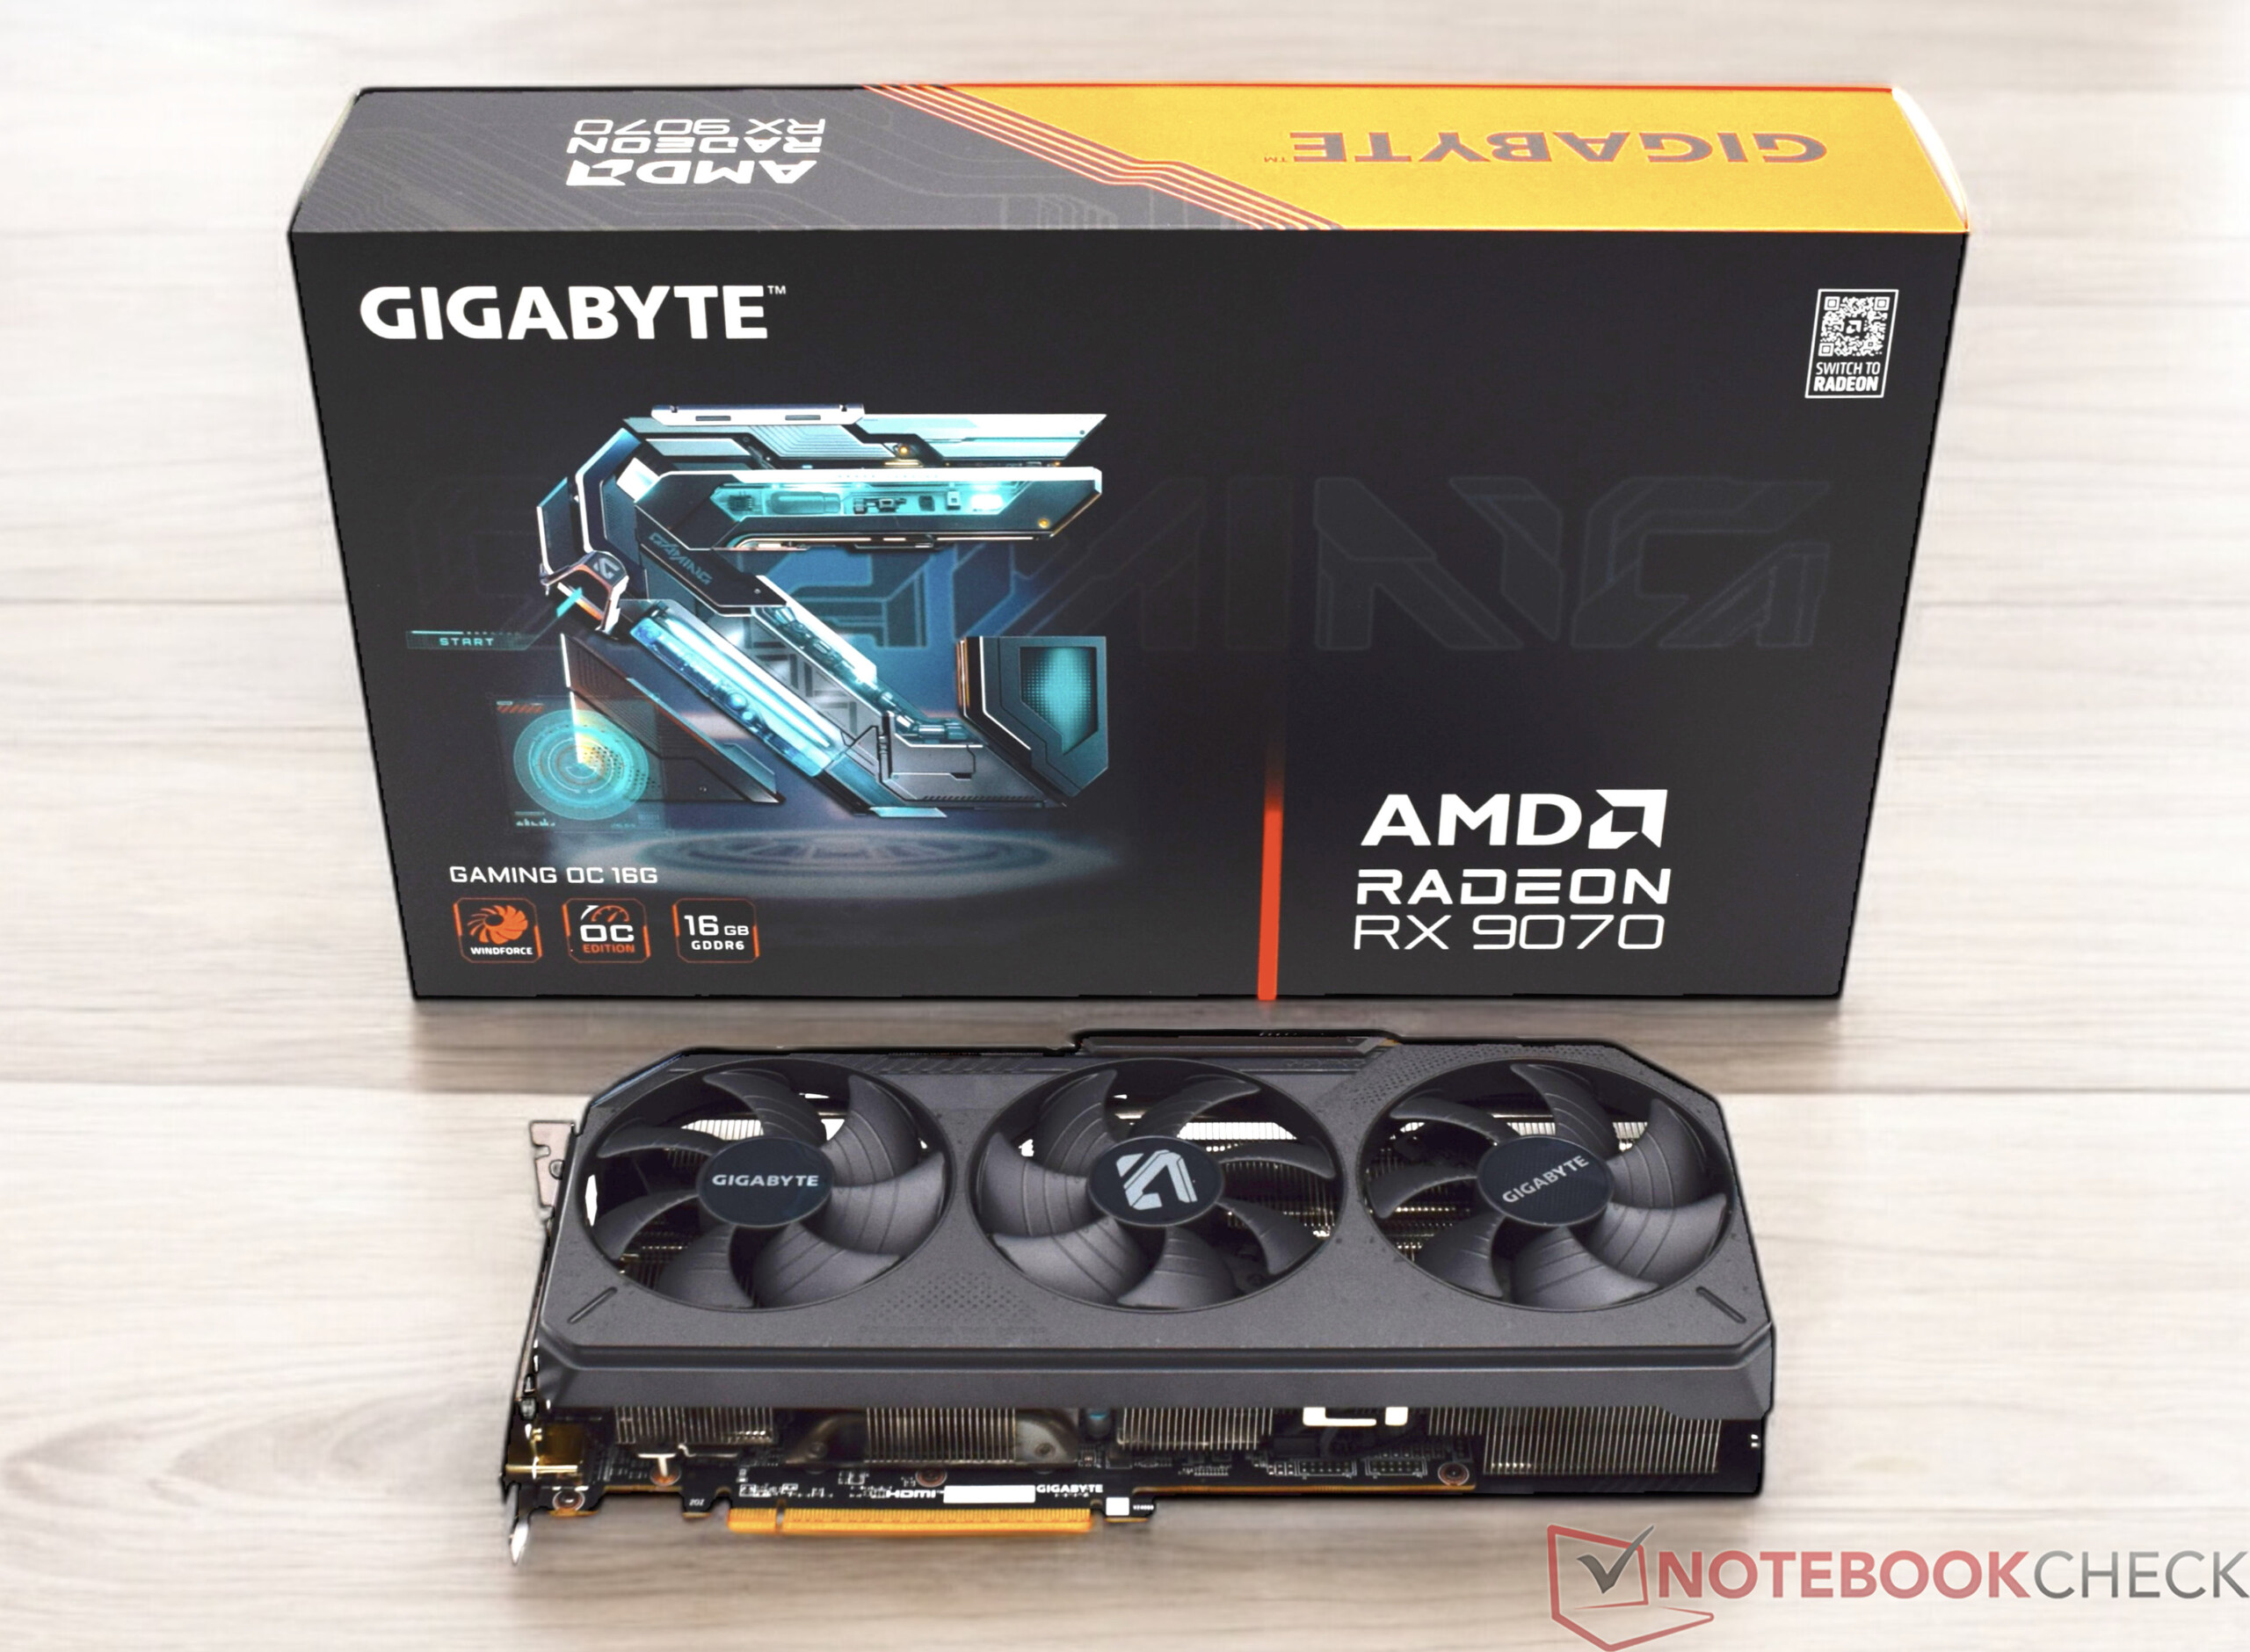
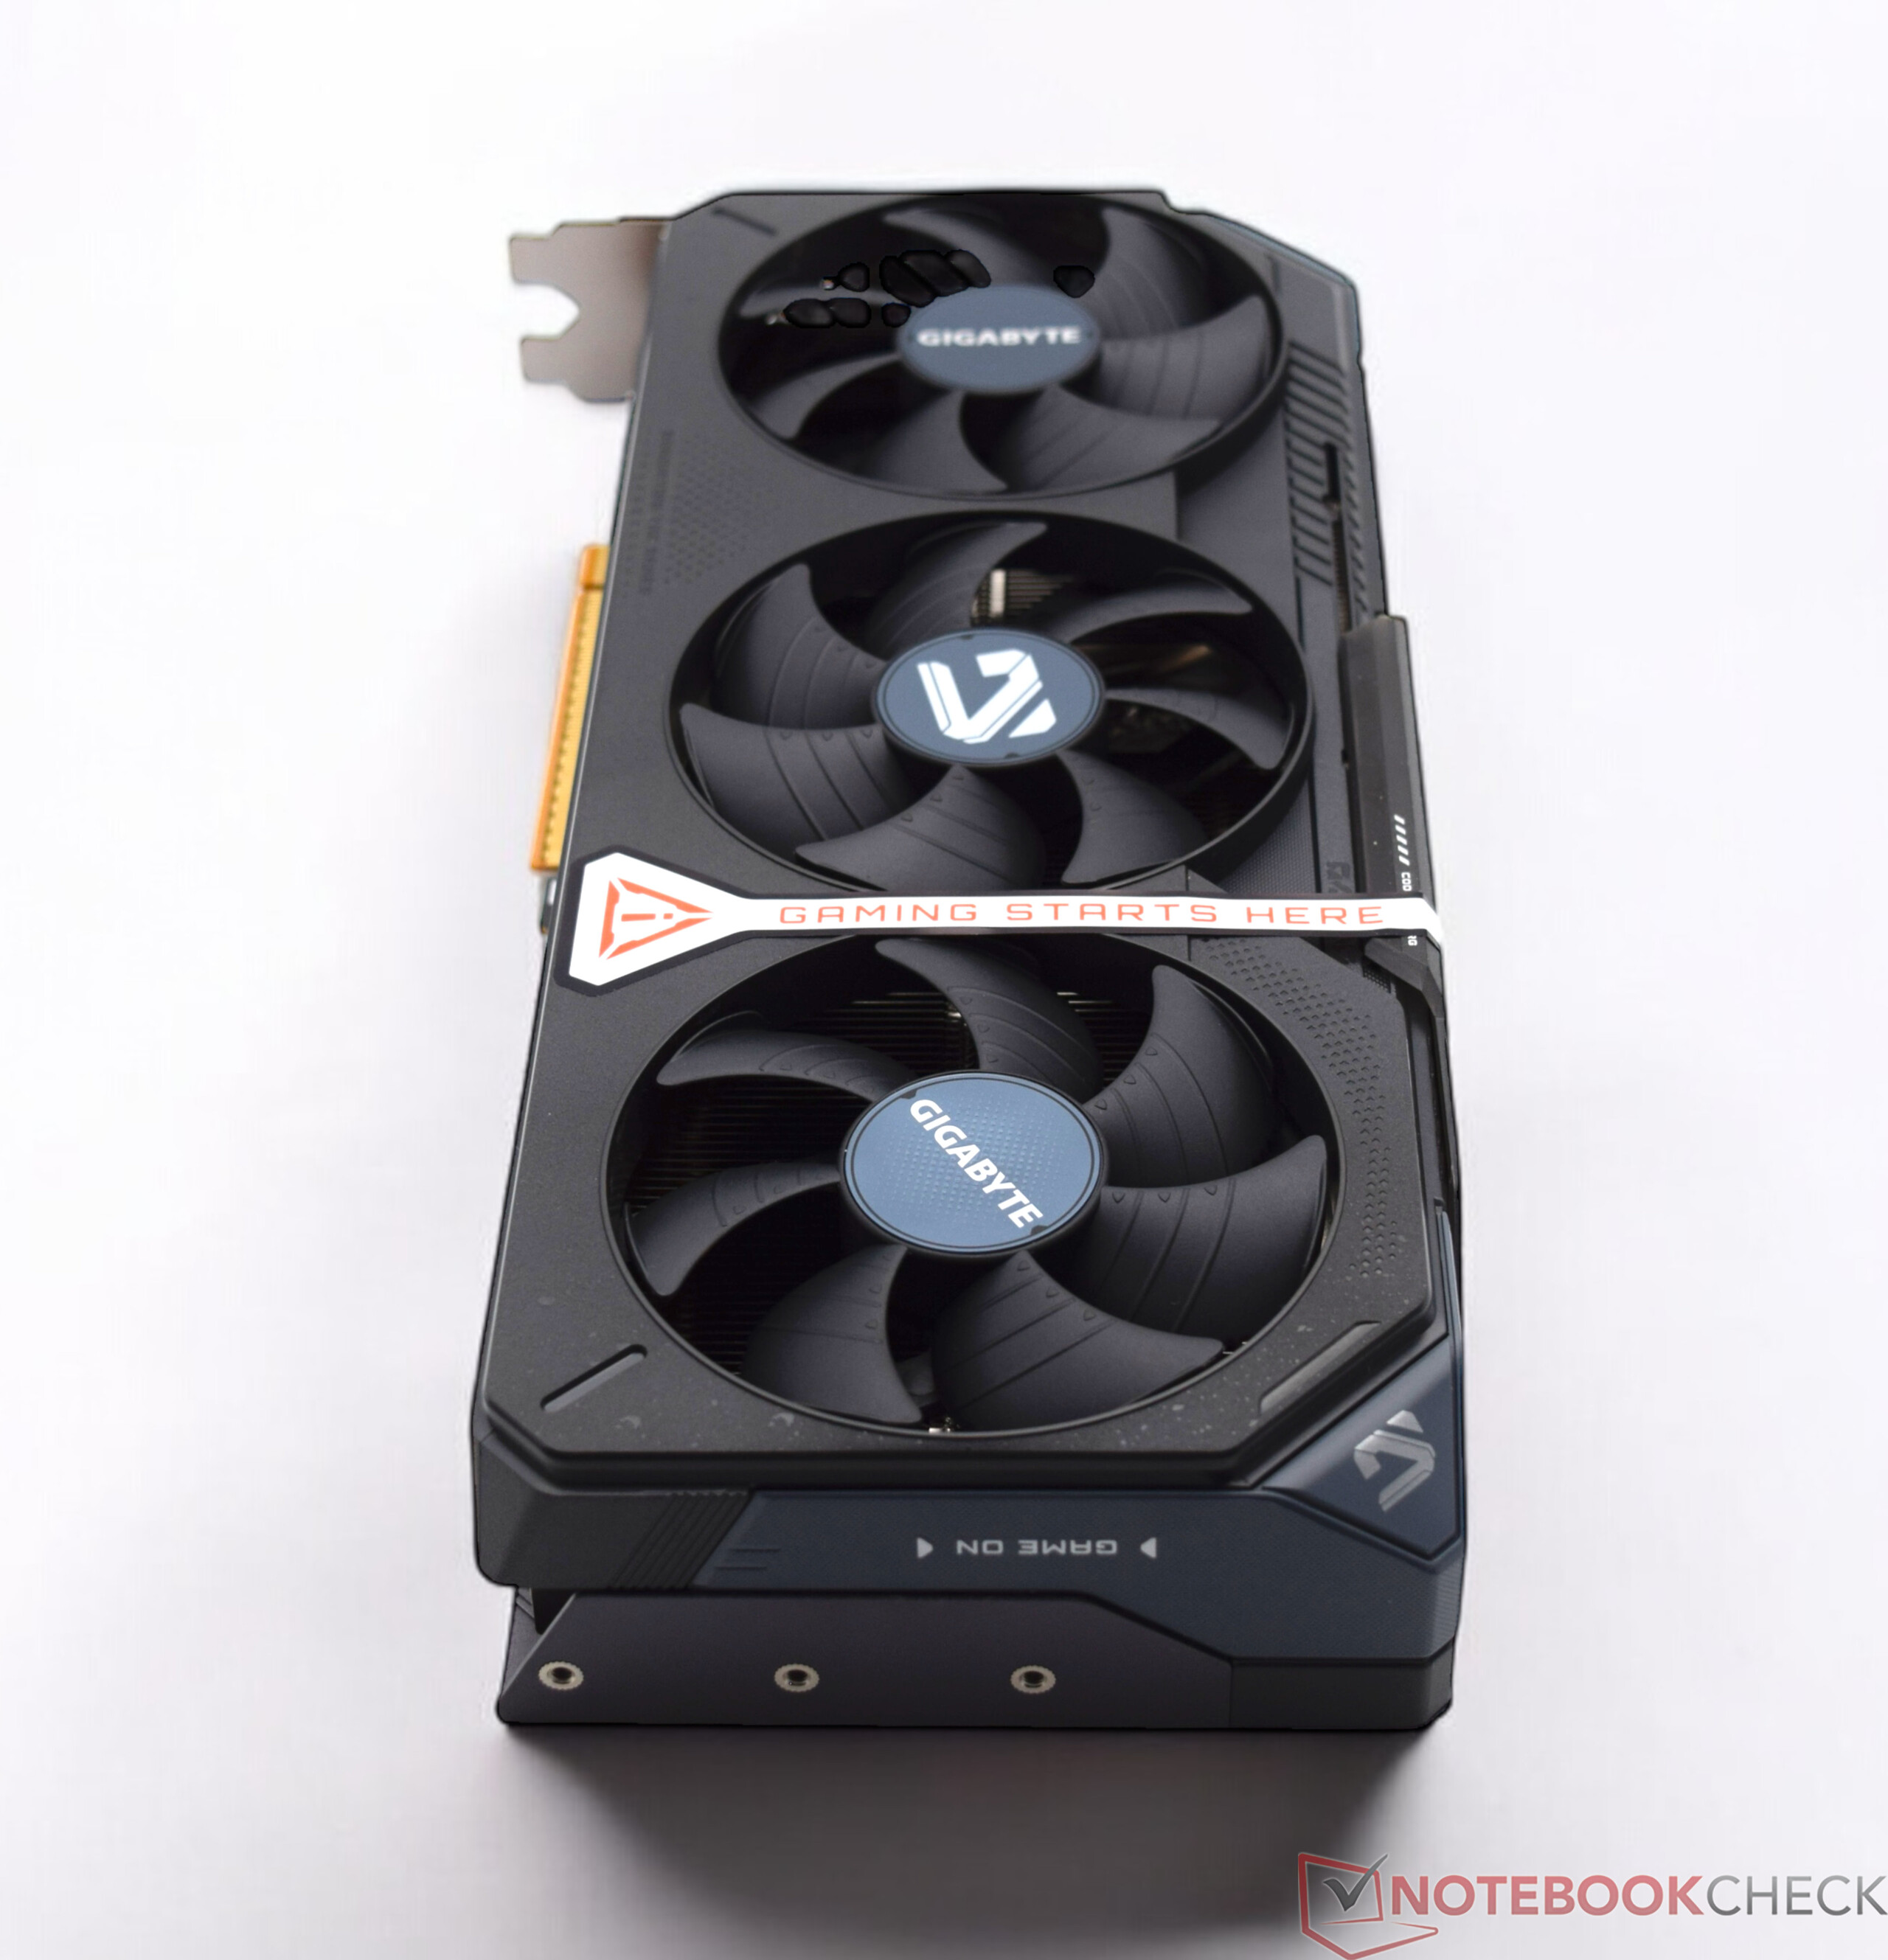
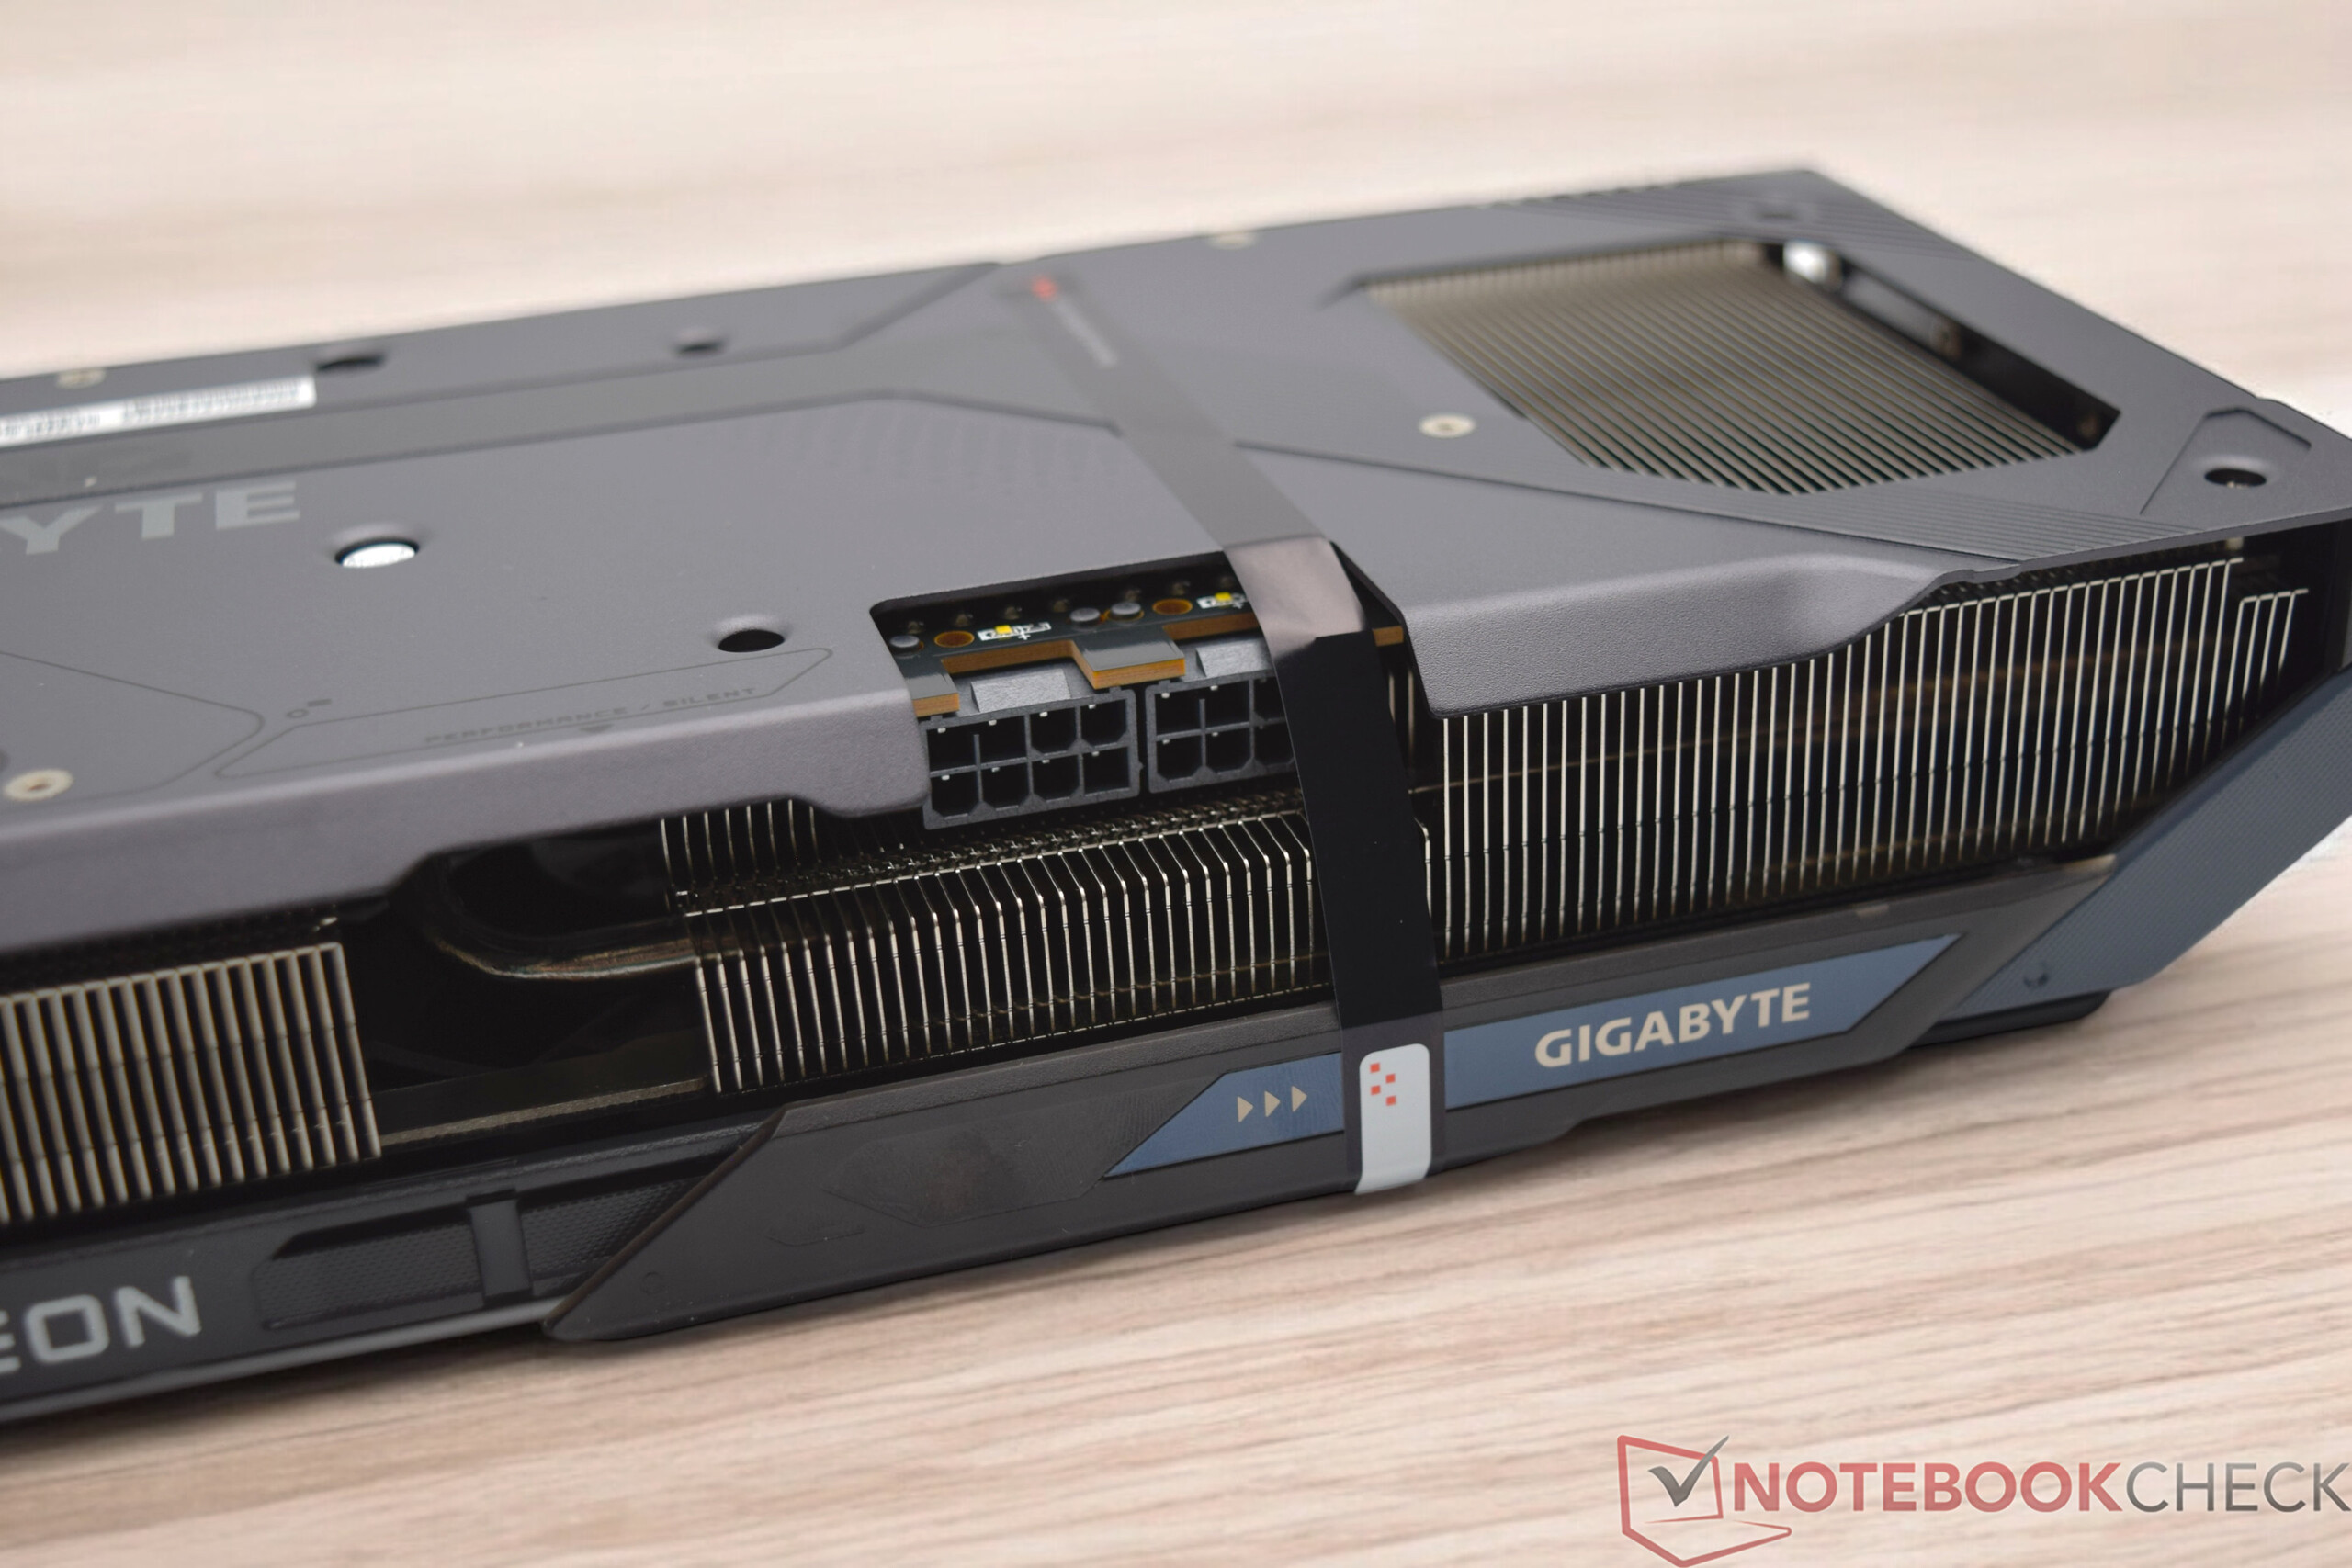
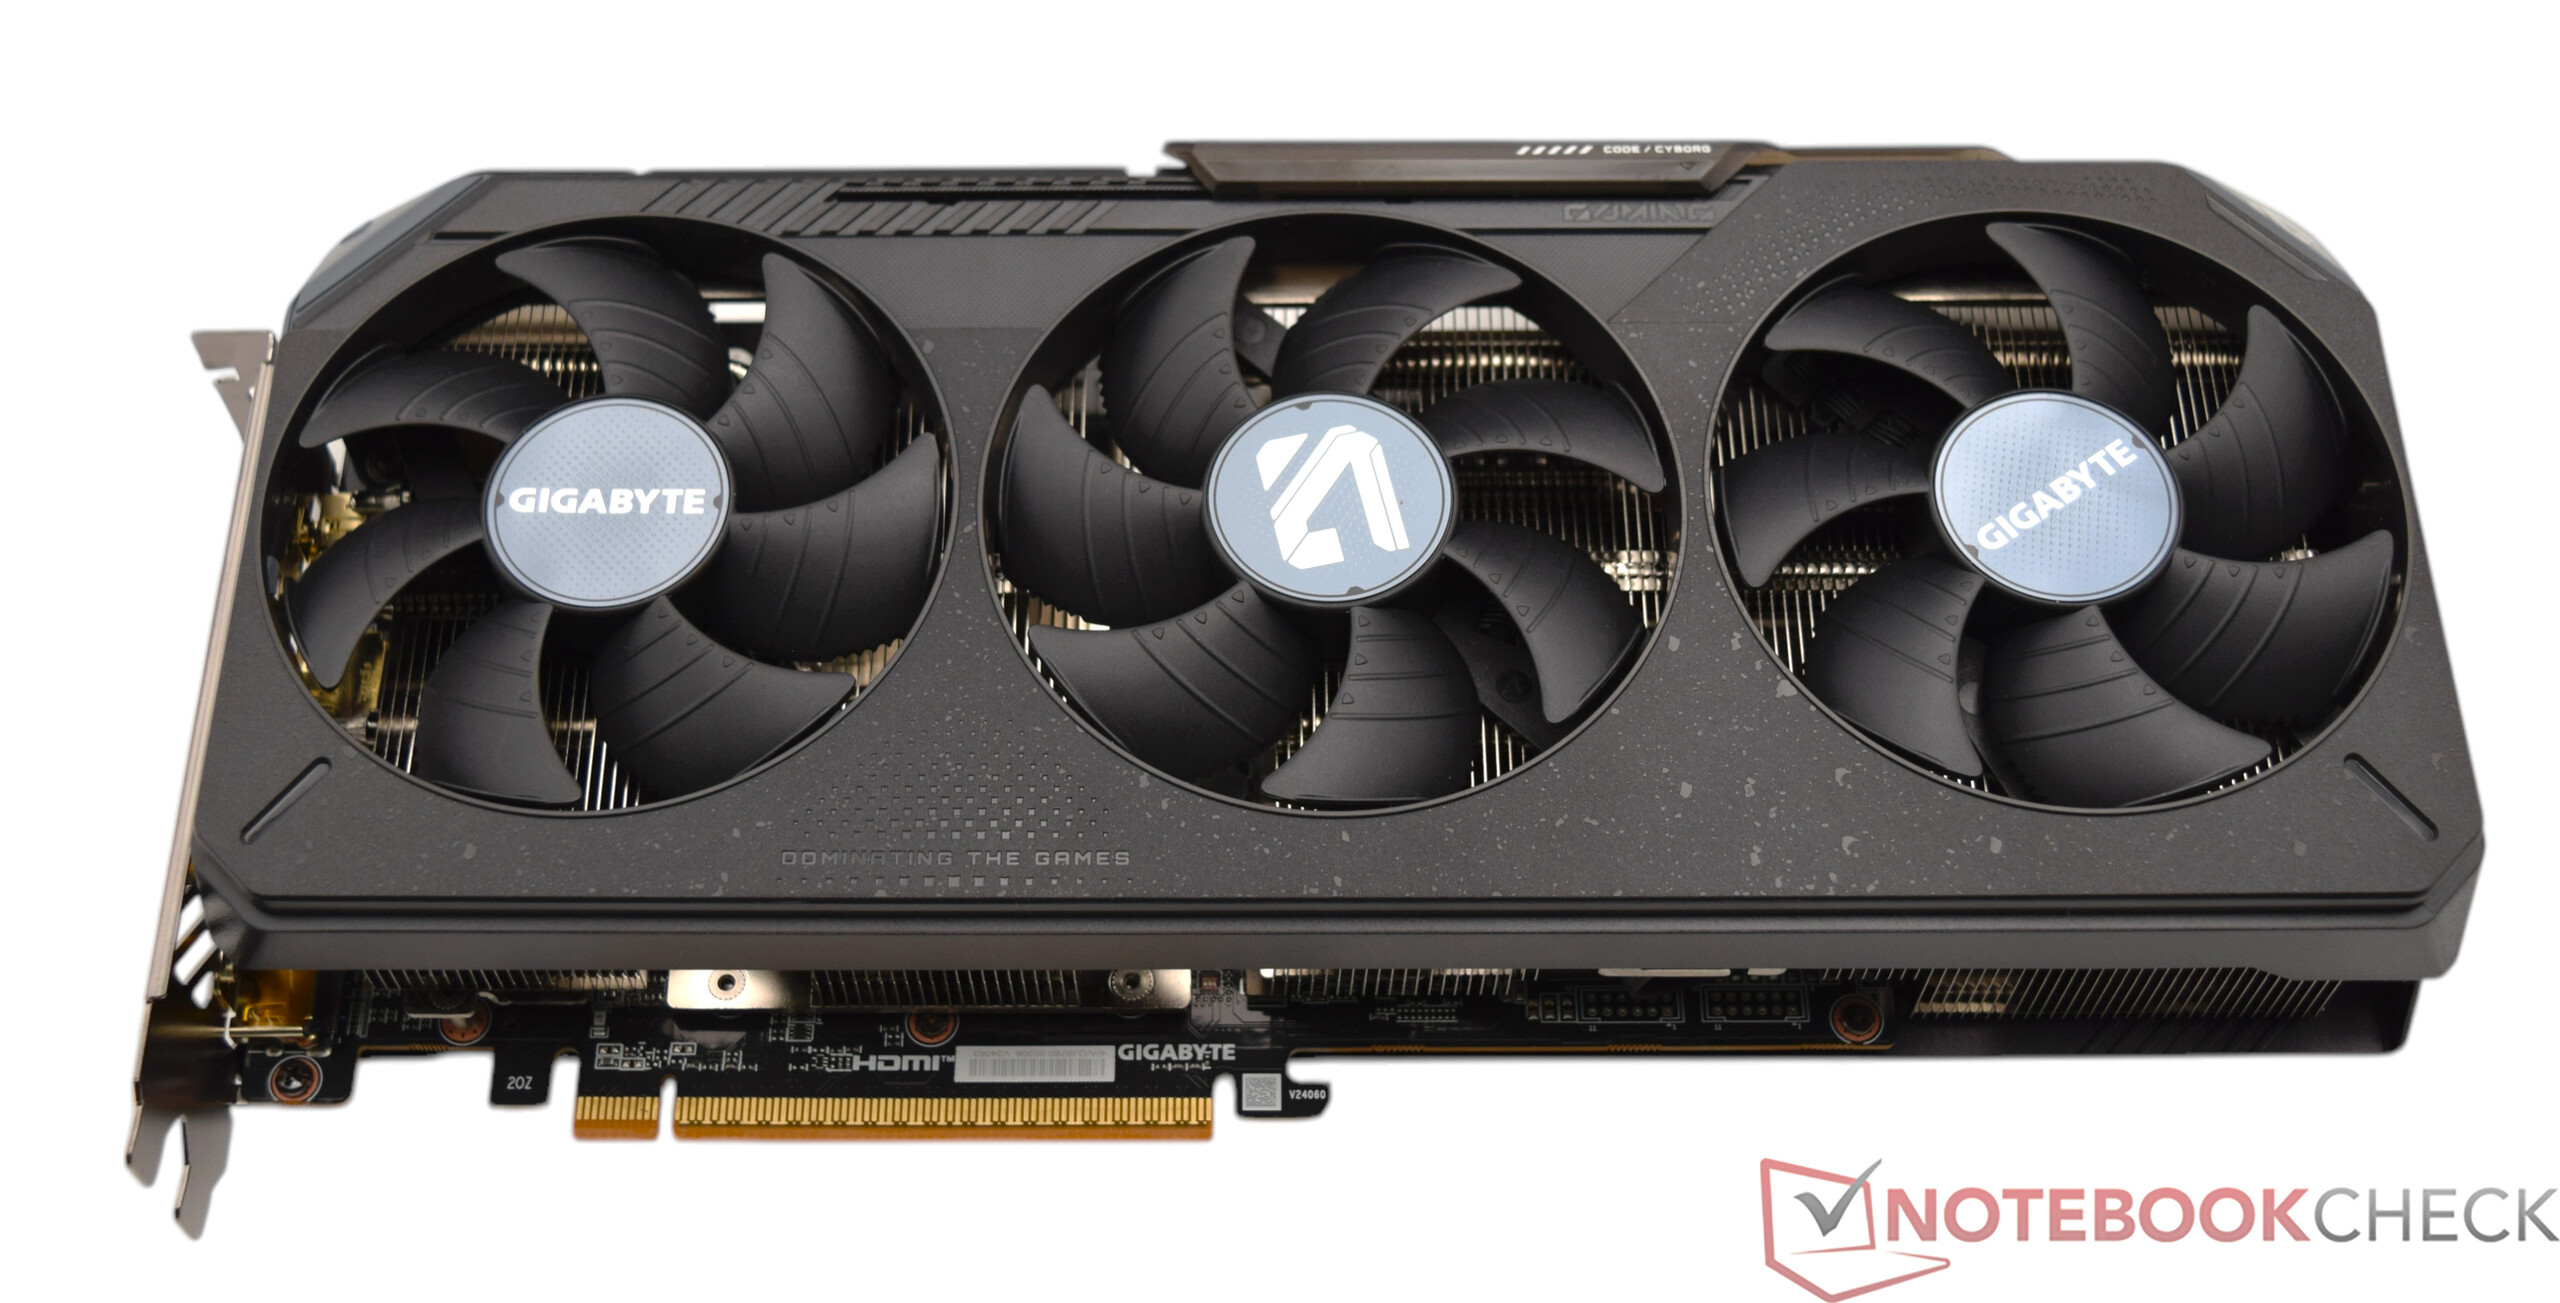
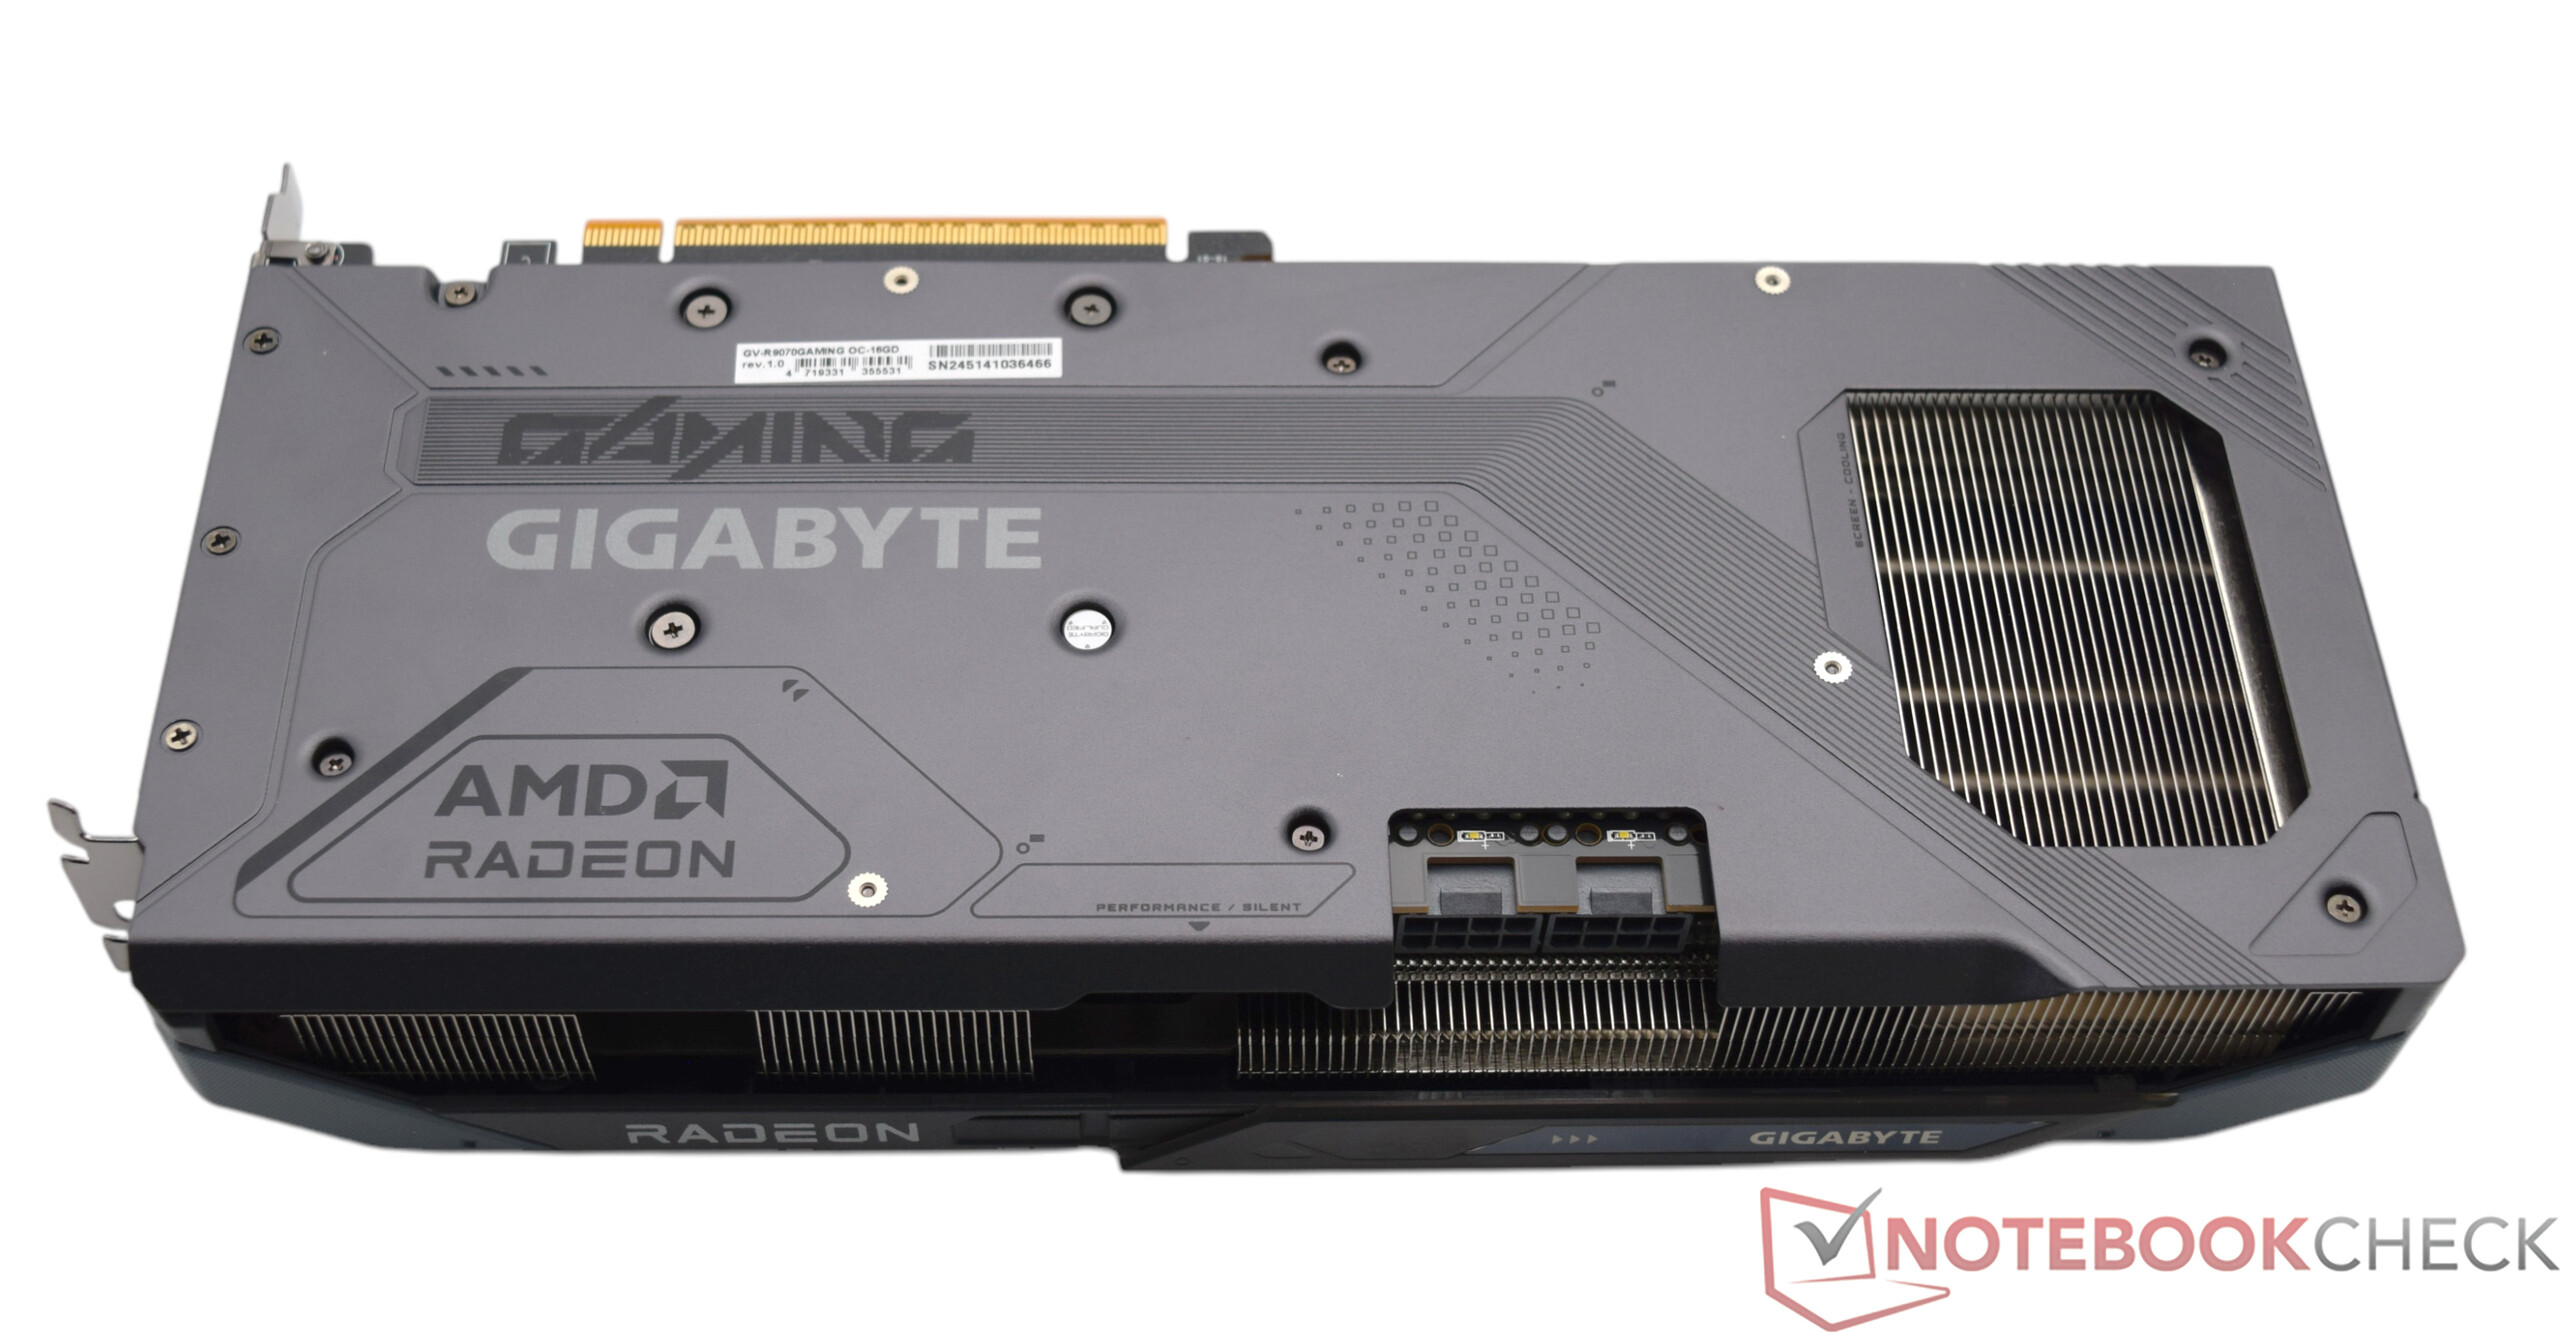
- The Gigabyte Radeon RX 9070 (XT) Gaming OC
- Synthetic benchmarks
- Gaming performance without upscaling
- Gaming performance with FSR
- Emissions - The AMD Radeon RX 9070 as a hidden gem
- Power management - The AMD Radeon RX 9070 is a lot more frugal
- Notebookcheck total rating
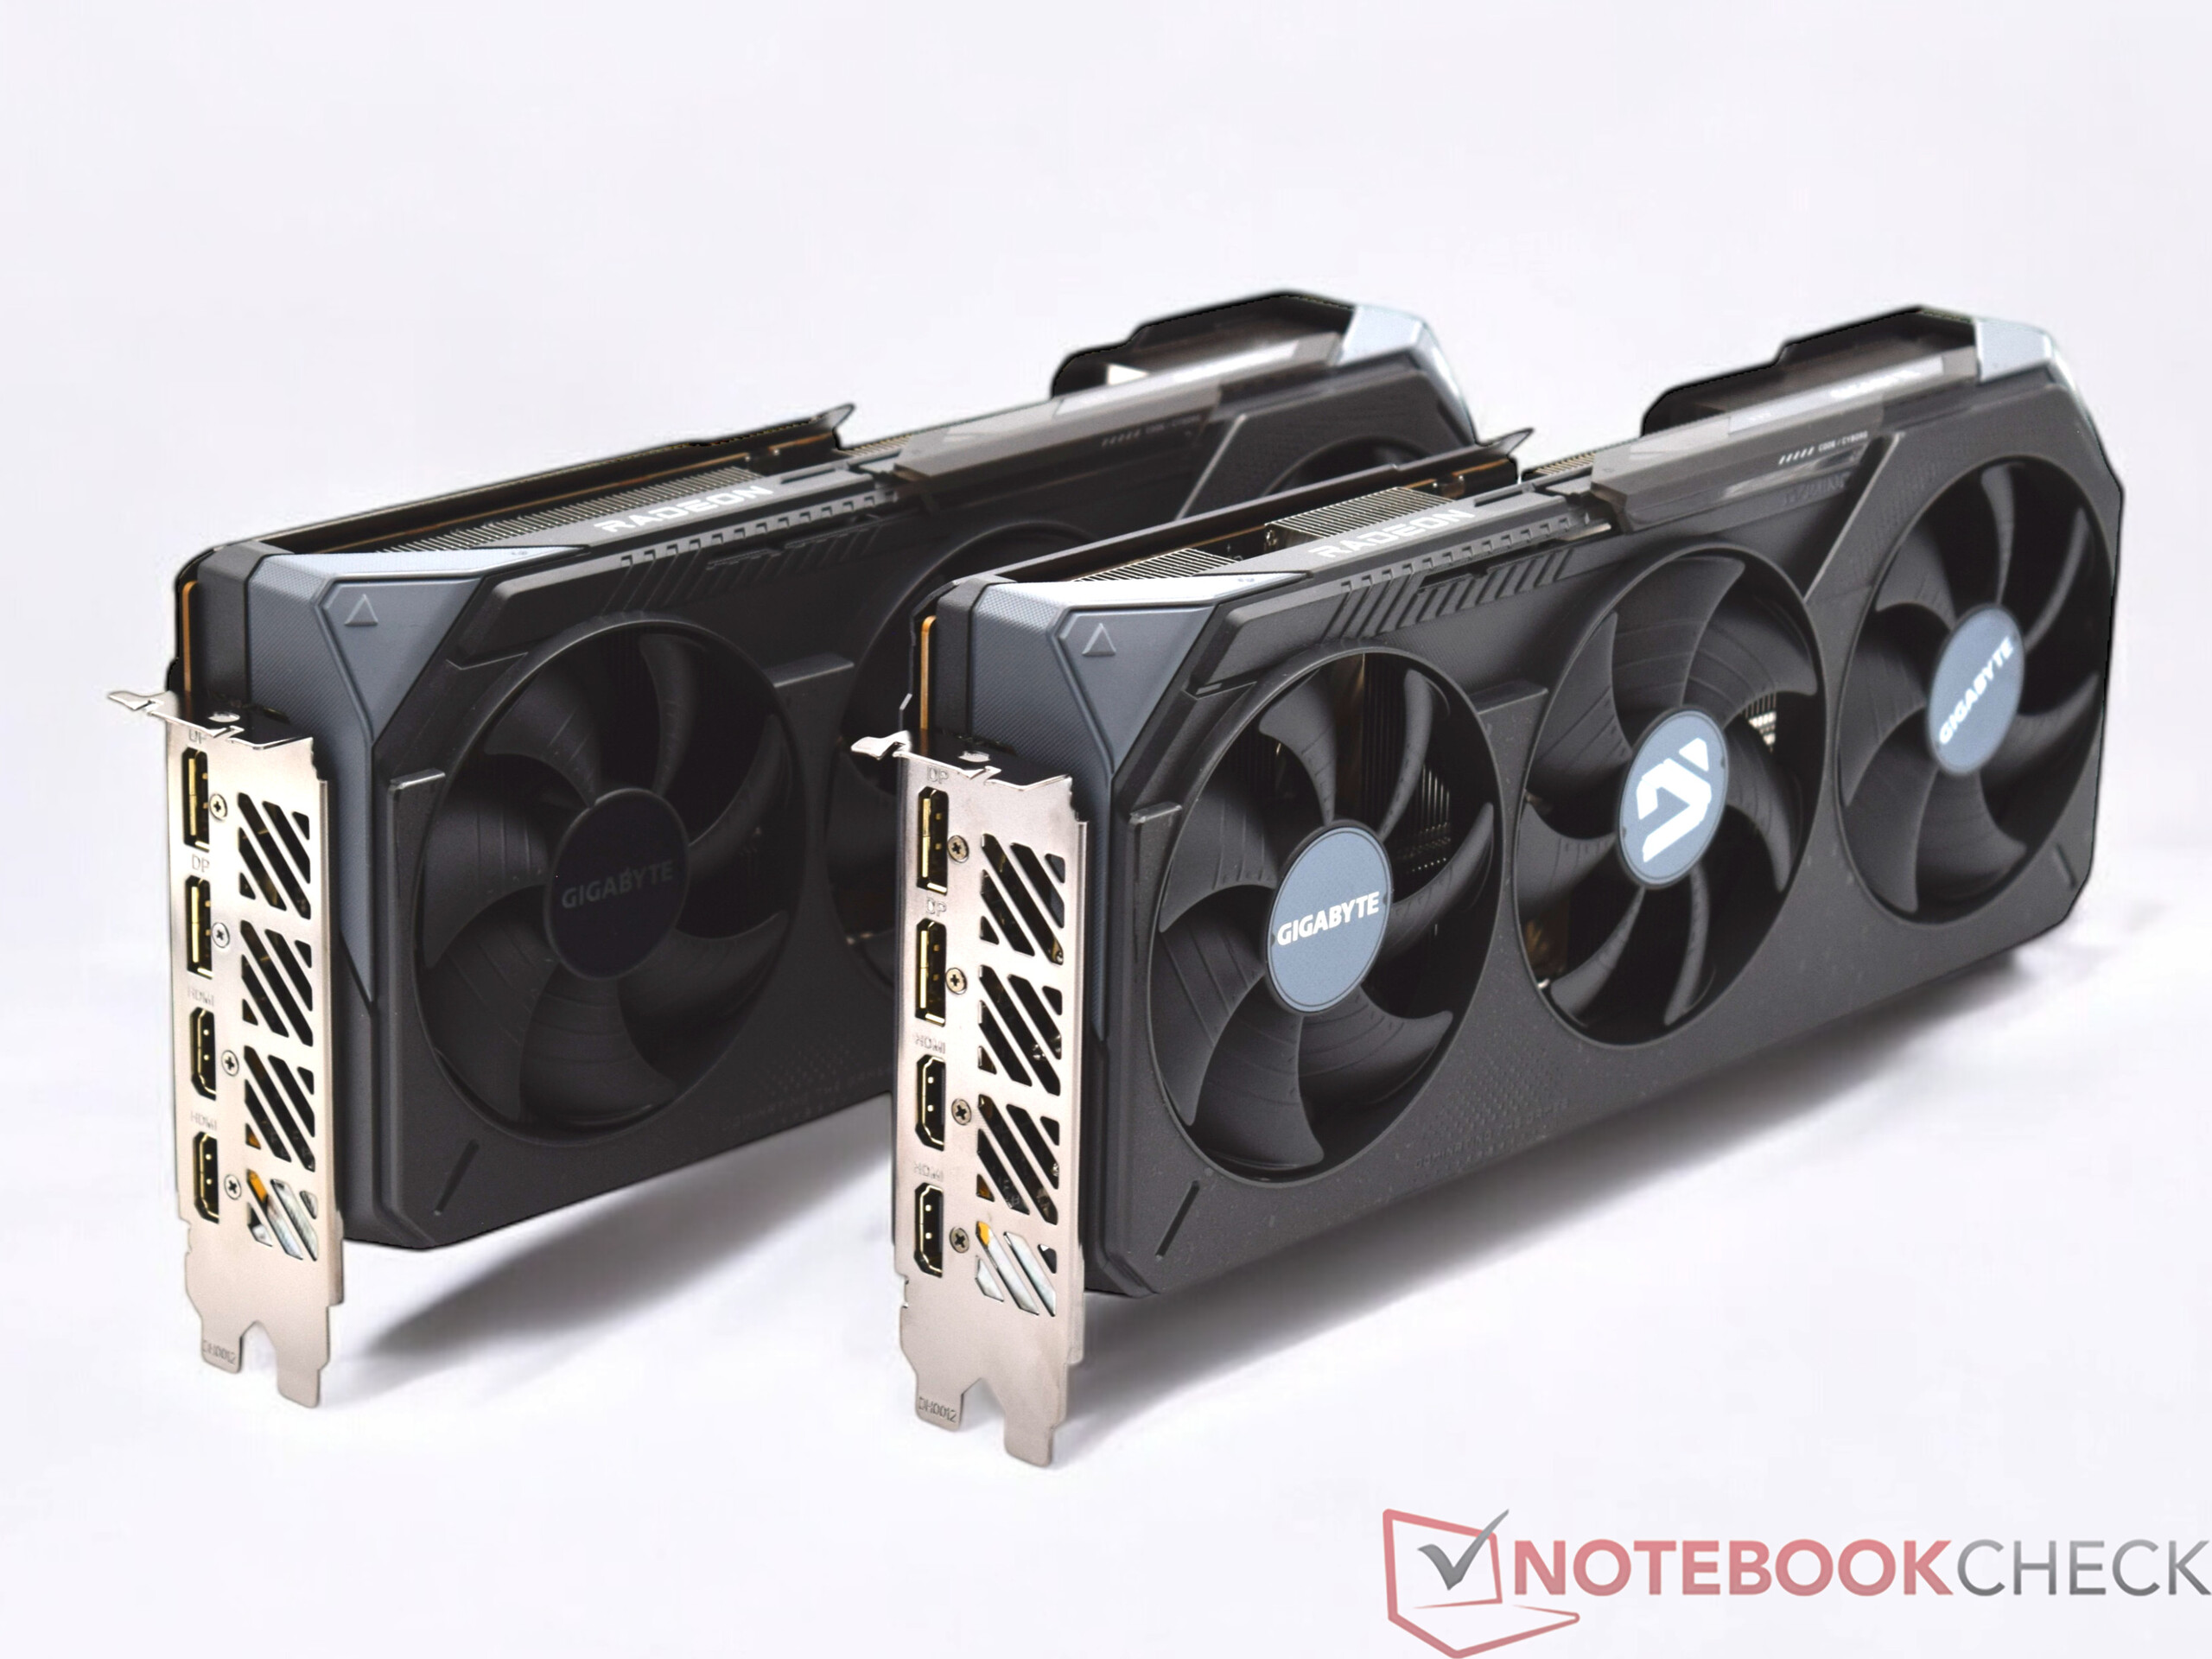
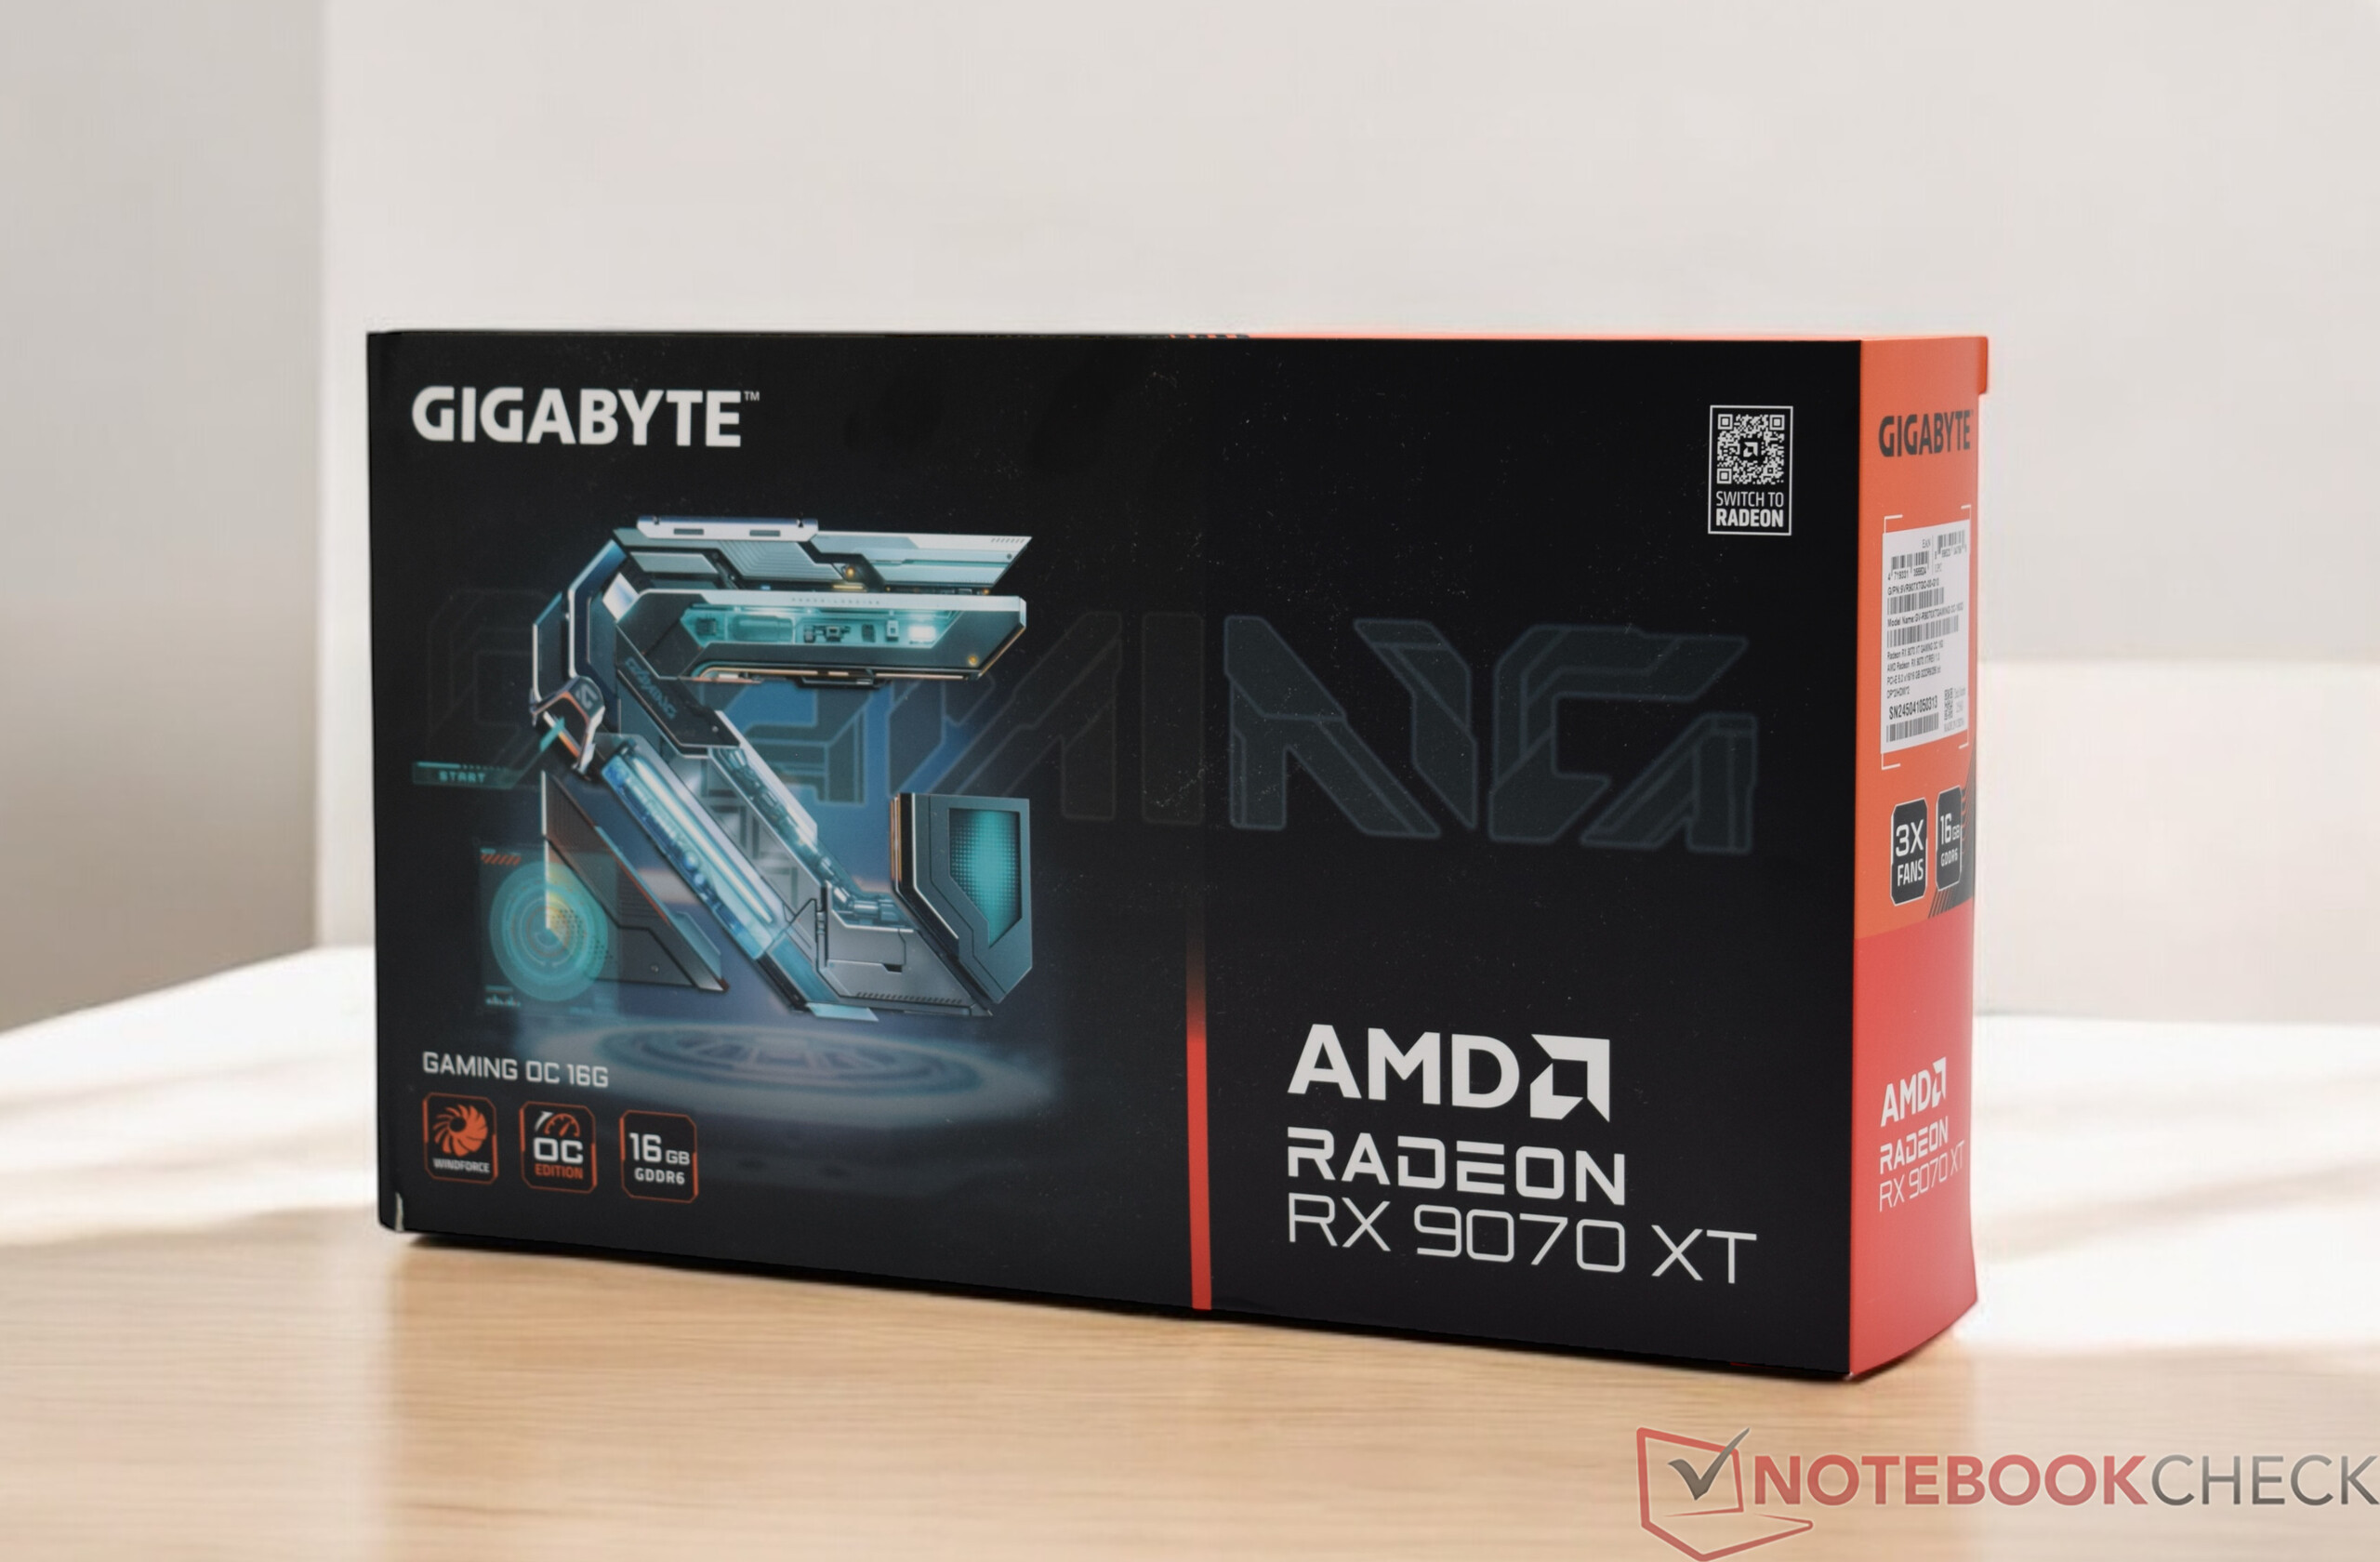
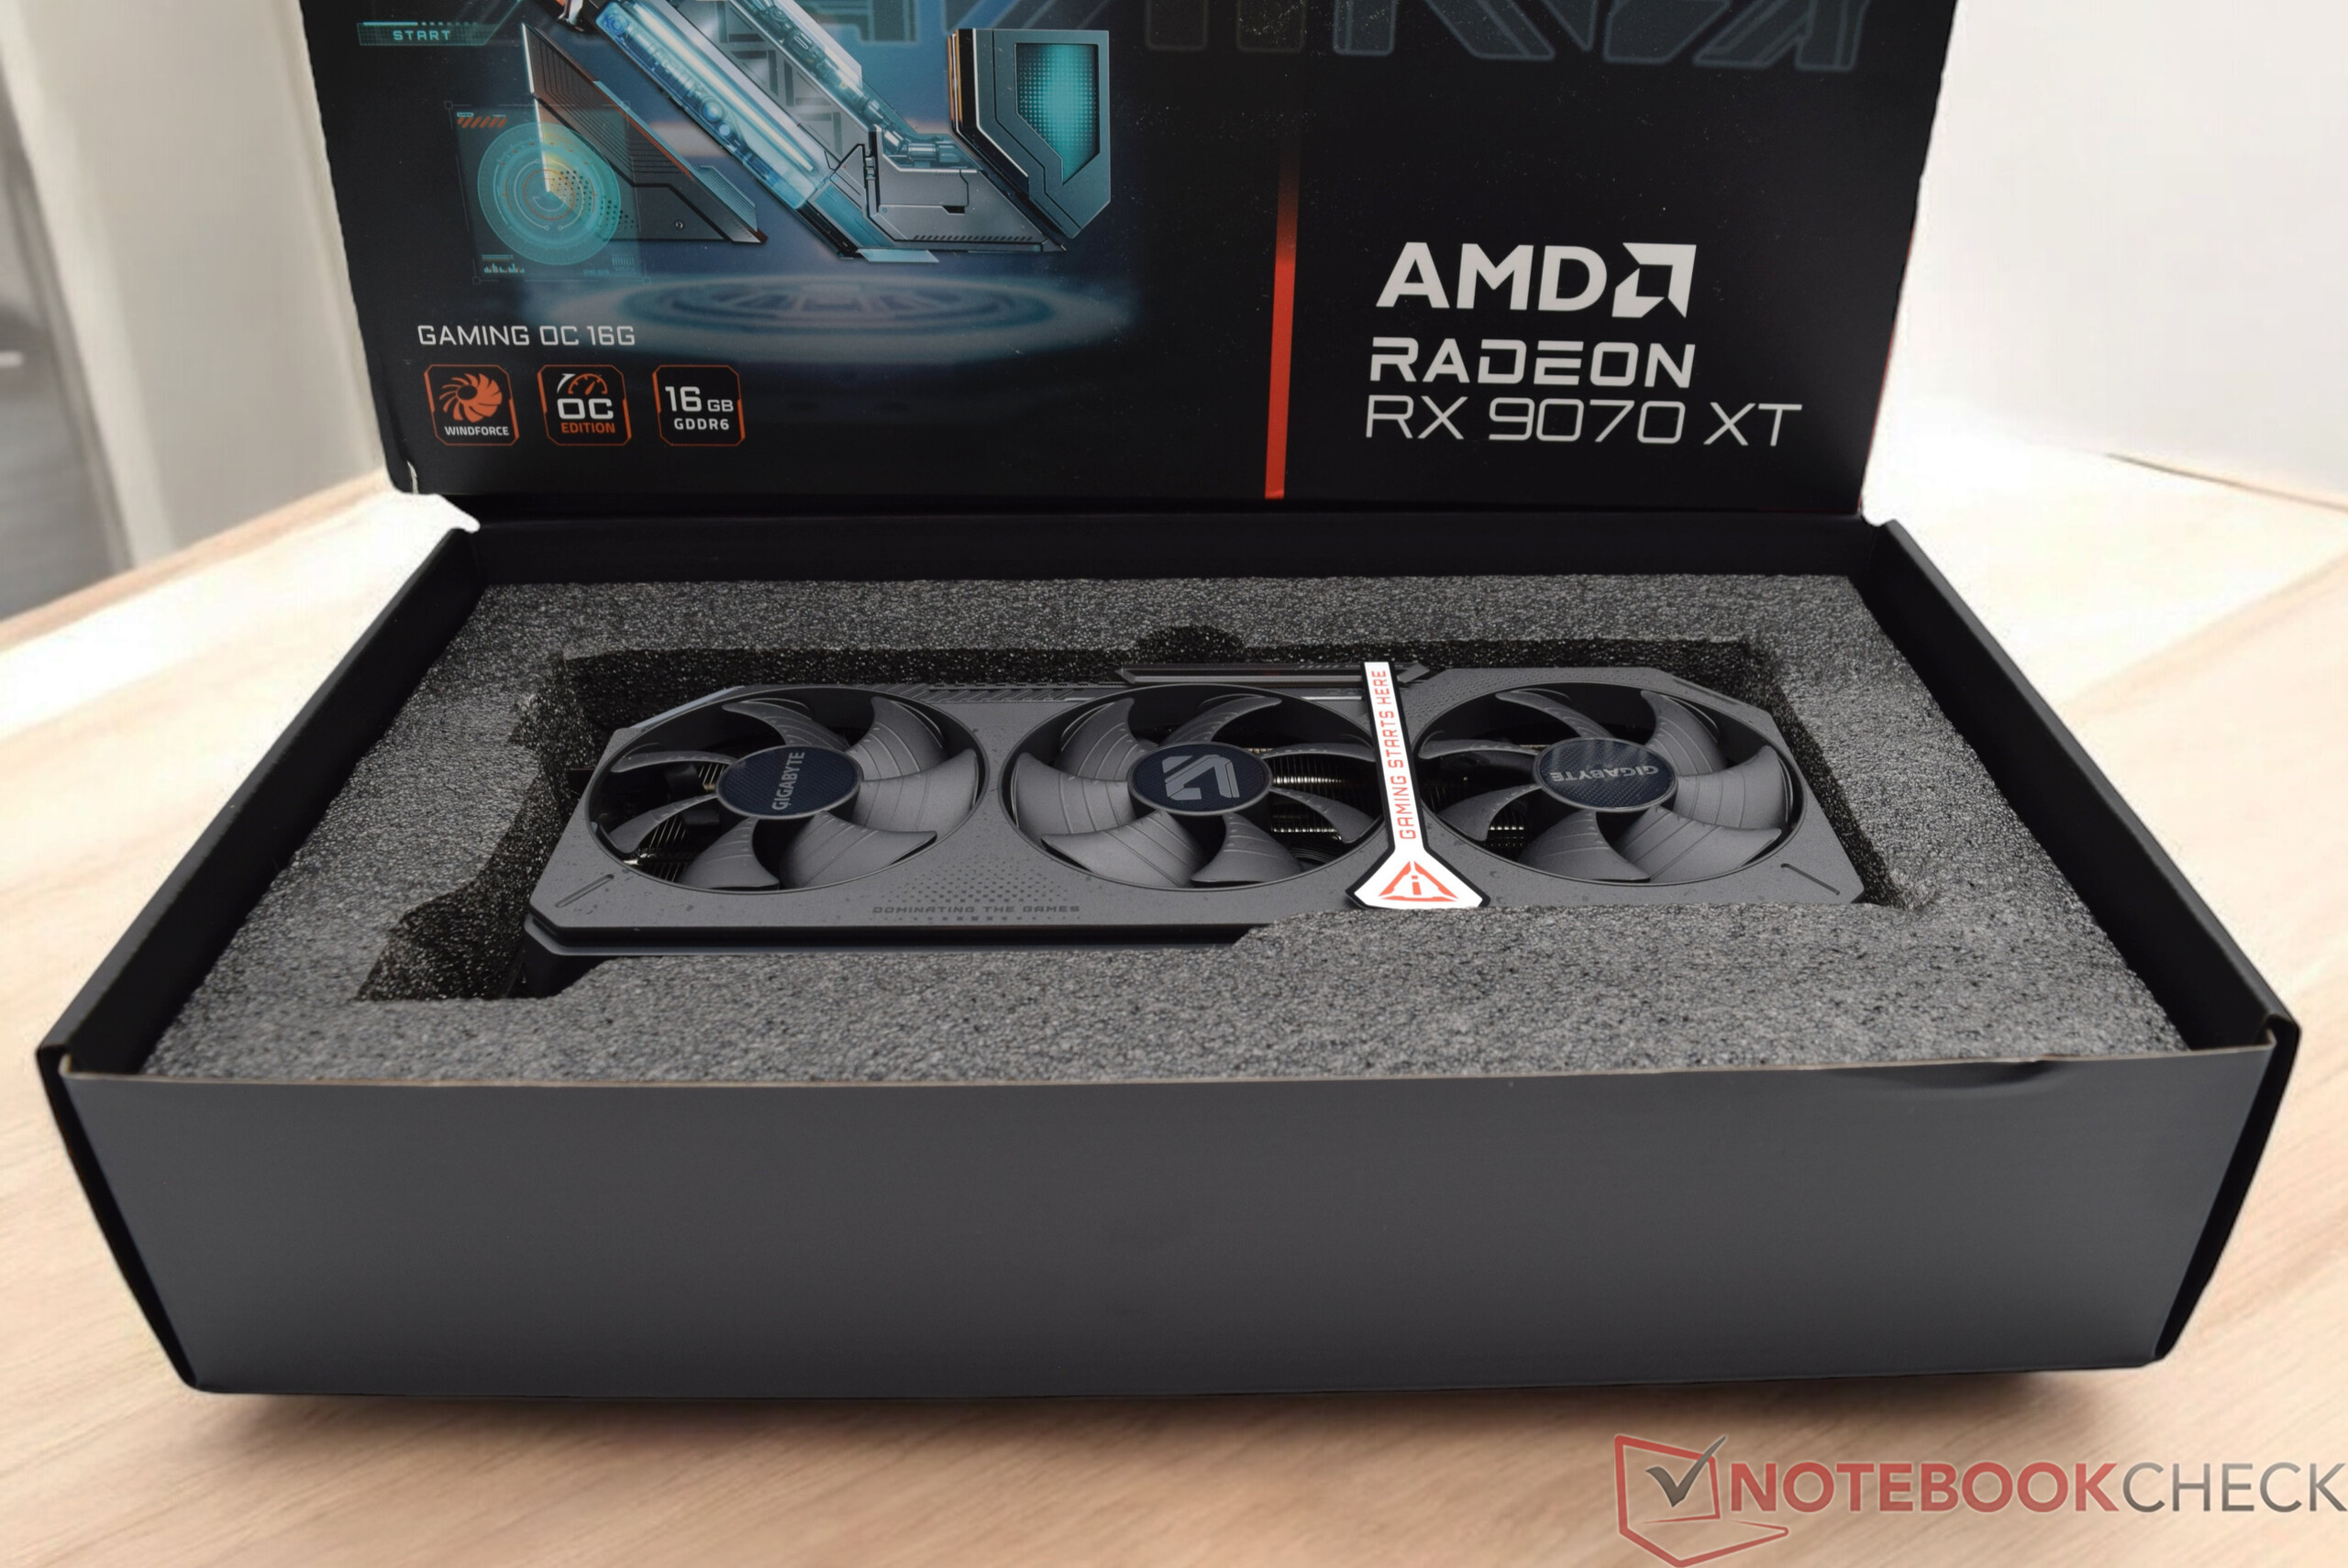
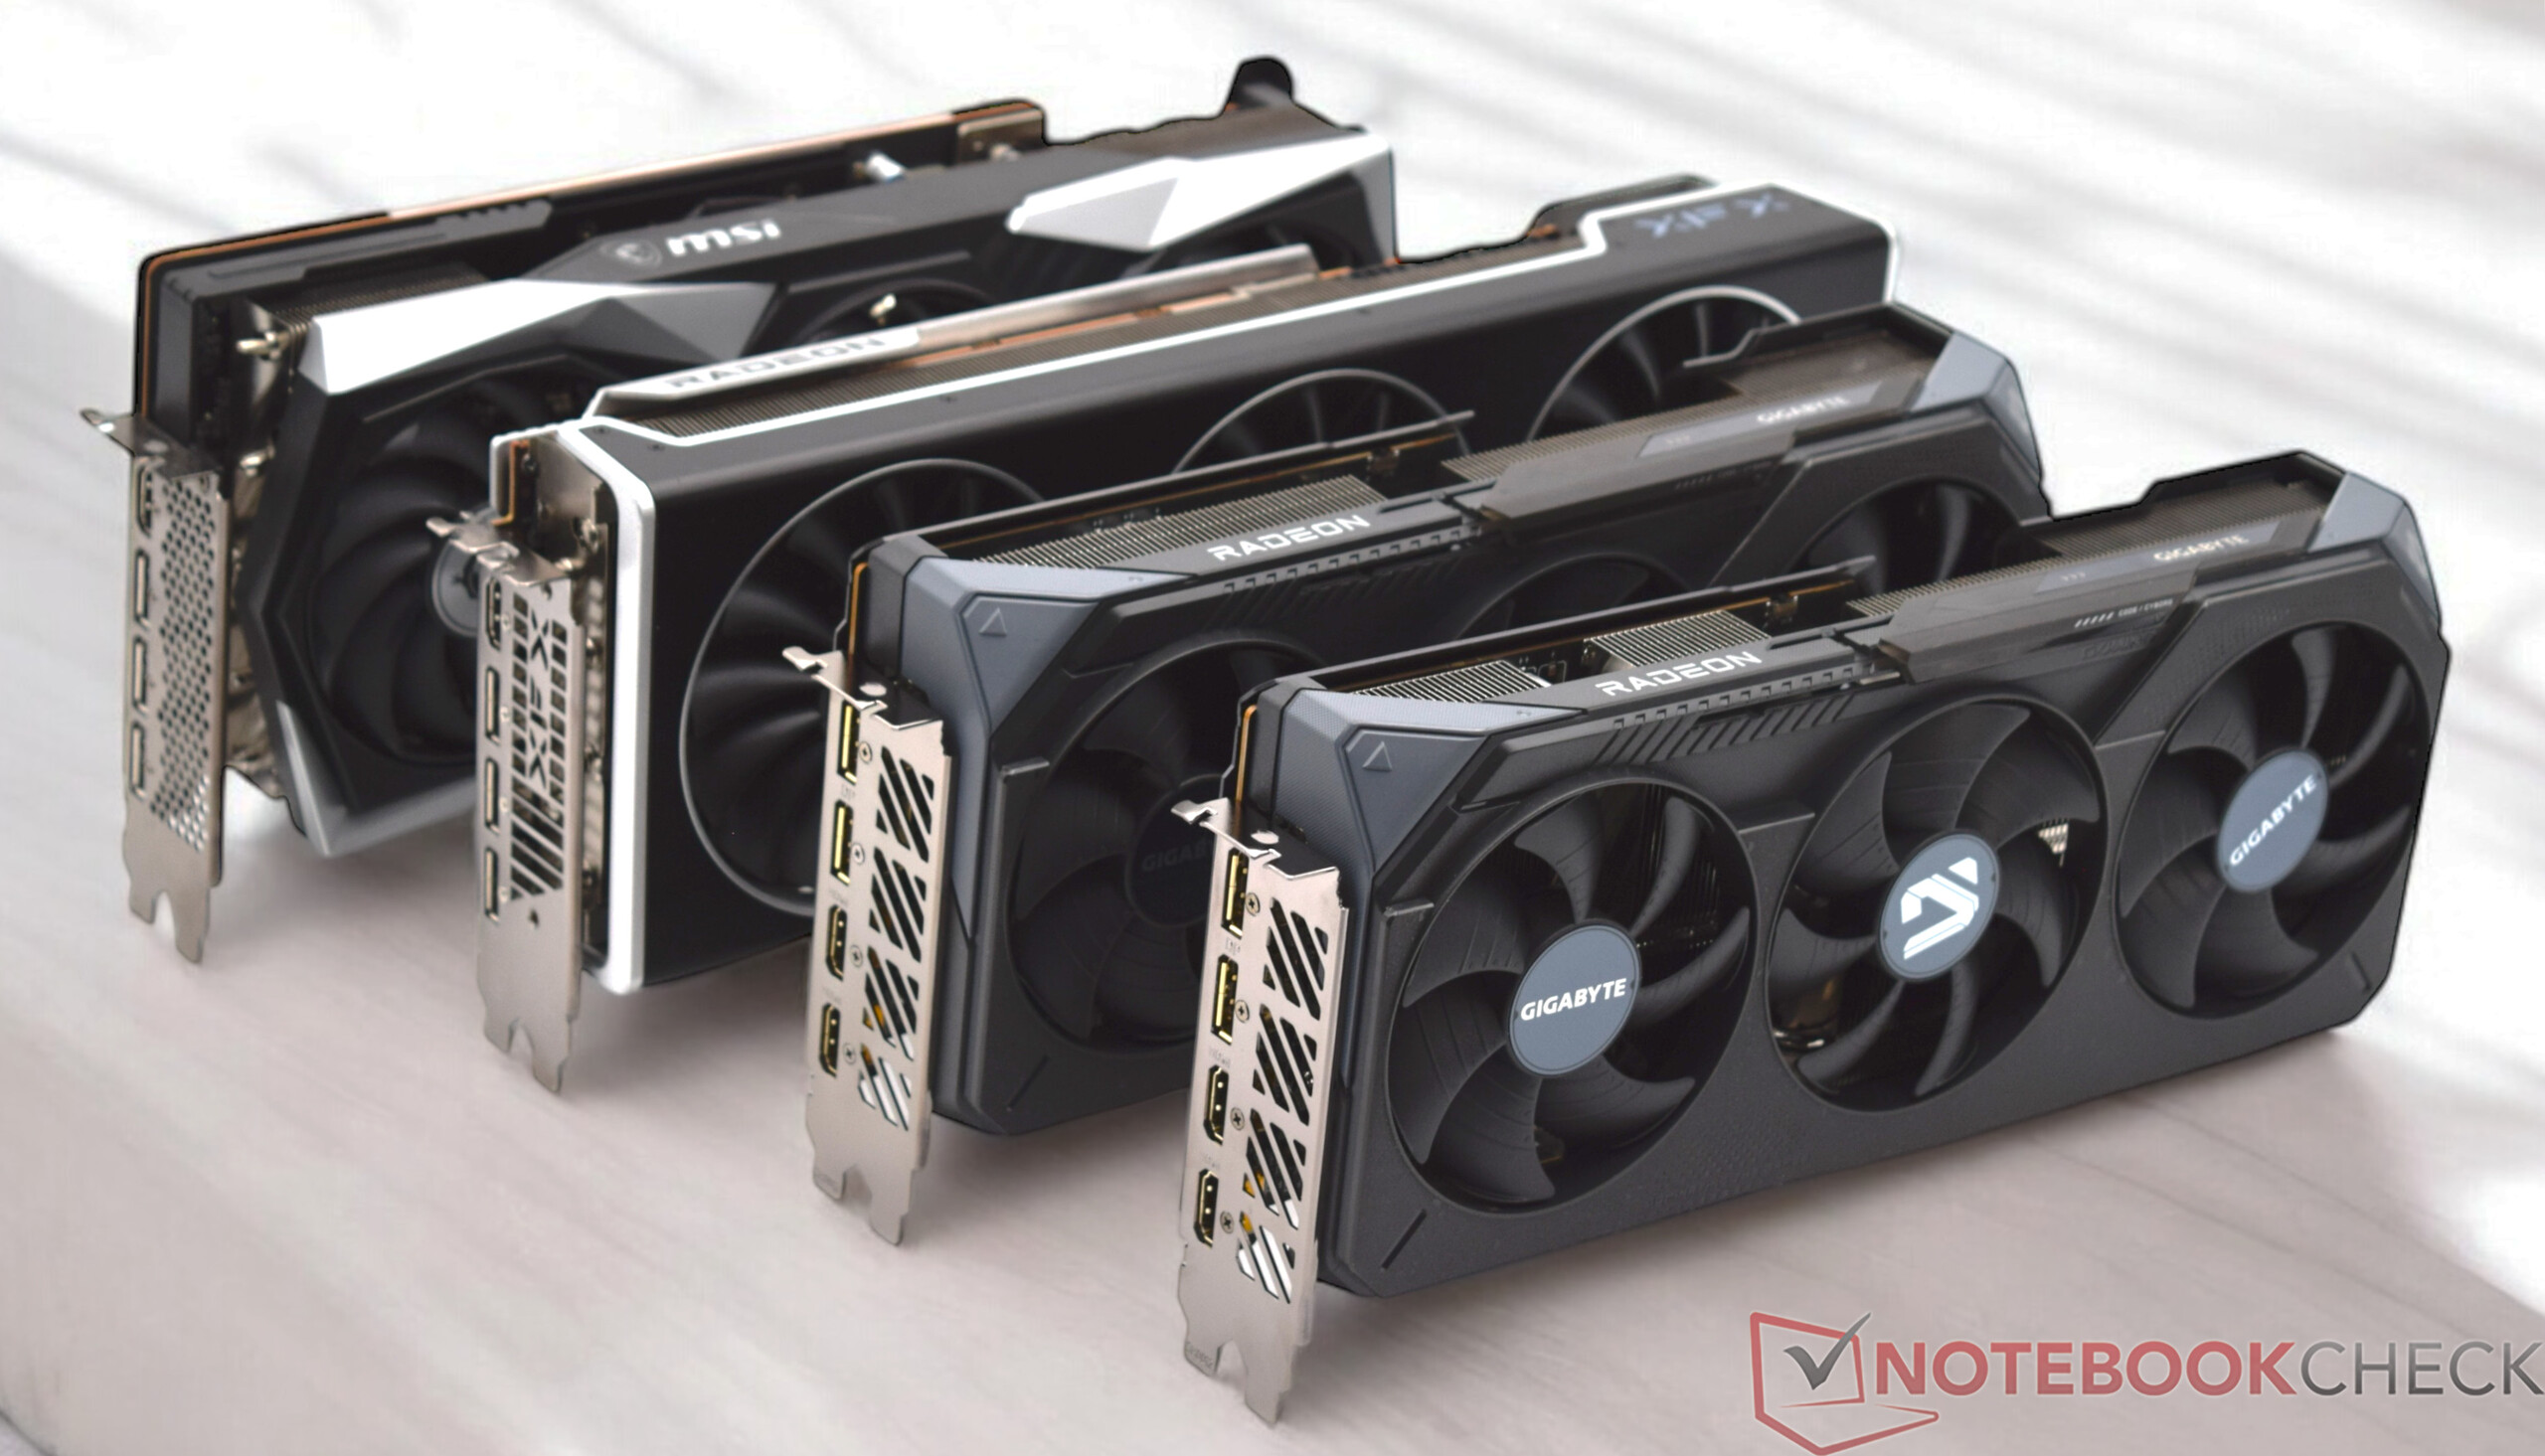
AMD's Radeon RX 9070 XT and AMD Radeon RX 9070 are two of the latest powerful GPUs based on the new RDNA4 architecture. However, they are not directly competing with the graphics cards from Nvidia (GeForce RTX 5090 and GeForce RTX 5080) which were presented at the beginning of the year. Rather, the two new AMD desktop graphics cards are aimed at the broader mid-range, which is also reflected in their price. Due to the current market situation, AMD could have an easy time selling its graphics cards. The prerequisite for this is good availability in combination with good value for money. We will gradually take a closer look at the performance that can be expected from them. Gigabyte has provided us with a Radeon RX 9070 XT and an AMD Radeon RX 9070 for this test.
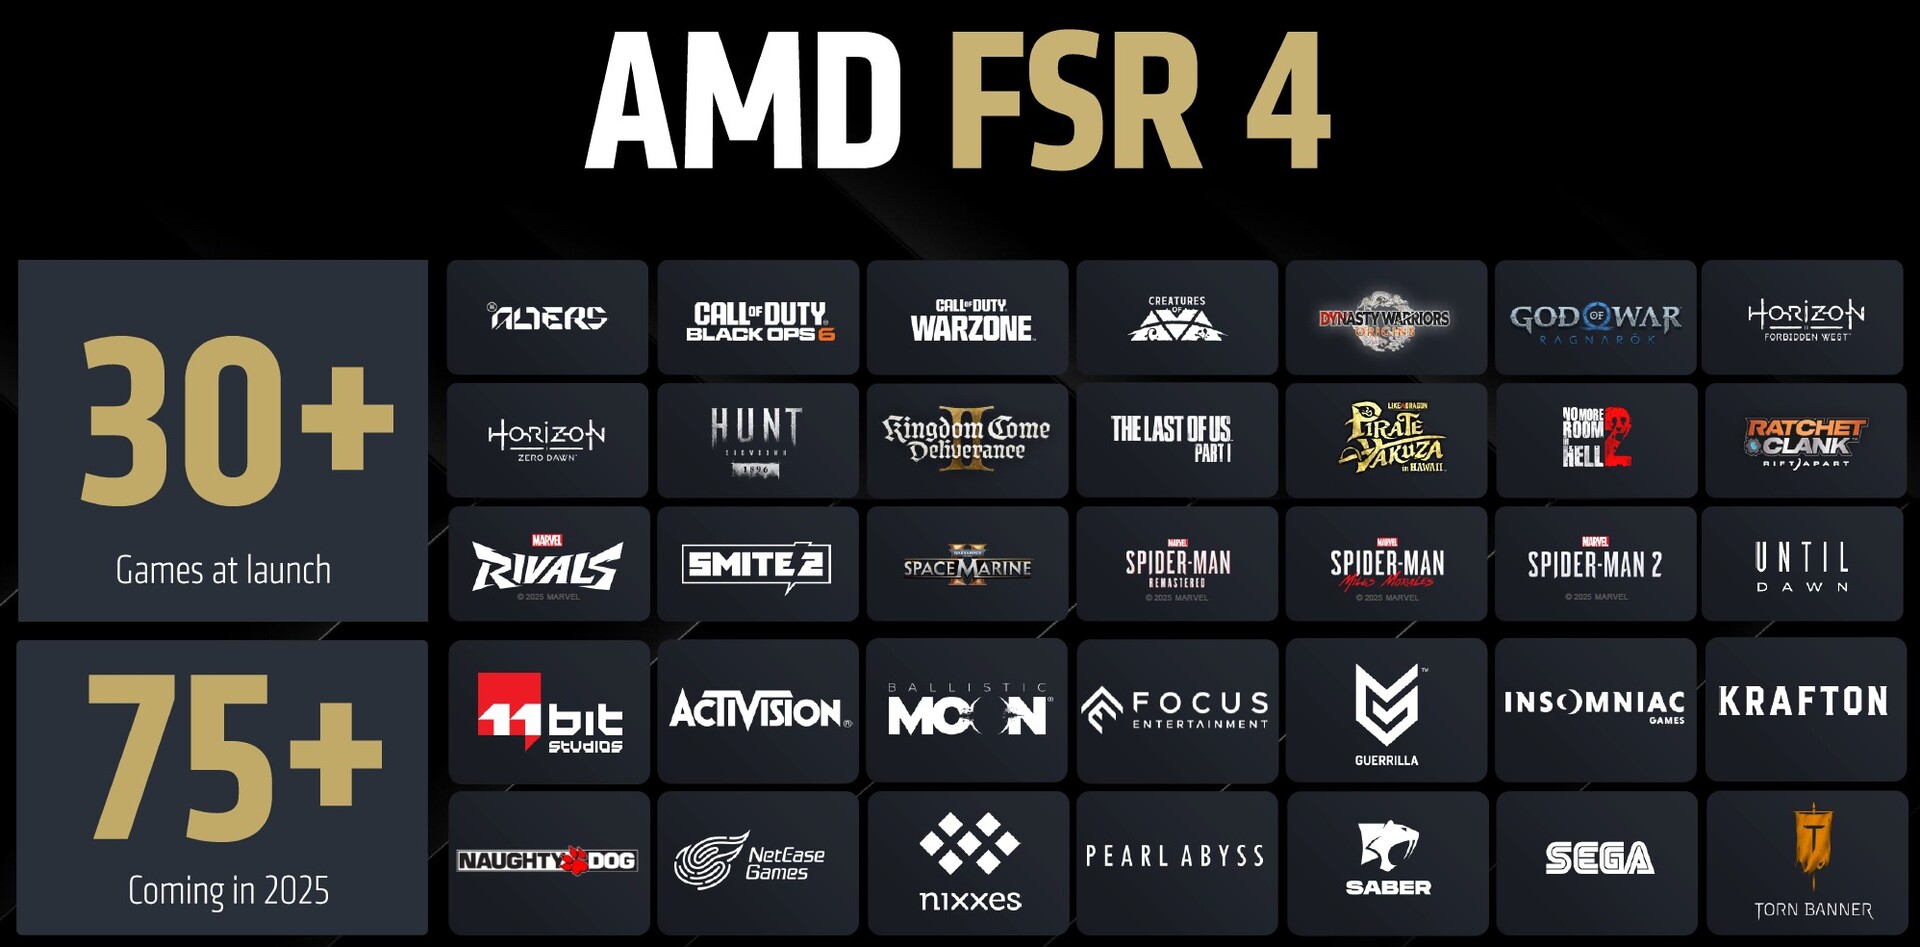
Technically, the RDNA4 architecture promises better efficiency. The integration of FSR4 (FidelityFX Super Resolution 4) ensures better image quality through advanced upscaling and Frame Generation technology. This is a clear challenge to Nvidia's DLSS 4.0, which follows a similar approach. Unlike DLSS 4, which can also be used in combination with older GeForce RTX graphics cards, FSR 4 is only available to owners of a new RX 9070 XT or RX 9070 graphics card.
AMD has invested a lot of development effort in its drivers and associated software. This enables the use of a local chat that benefits from the graphics card's AI-based computing power. Plus, there are numerous options for creating specially customized profiles for games that let you adapt it to your own needs. FSR 4 can also be activated on the driver side if the games have not already been patched with this option.
The AMD Radeon RX 9070 (XT) with RDNA4 genes and FSR4
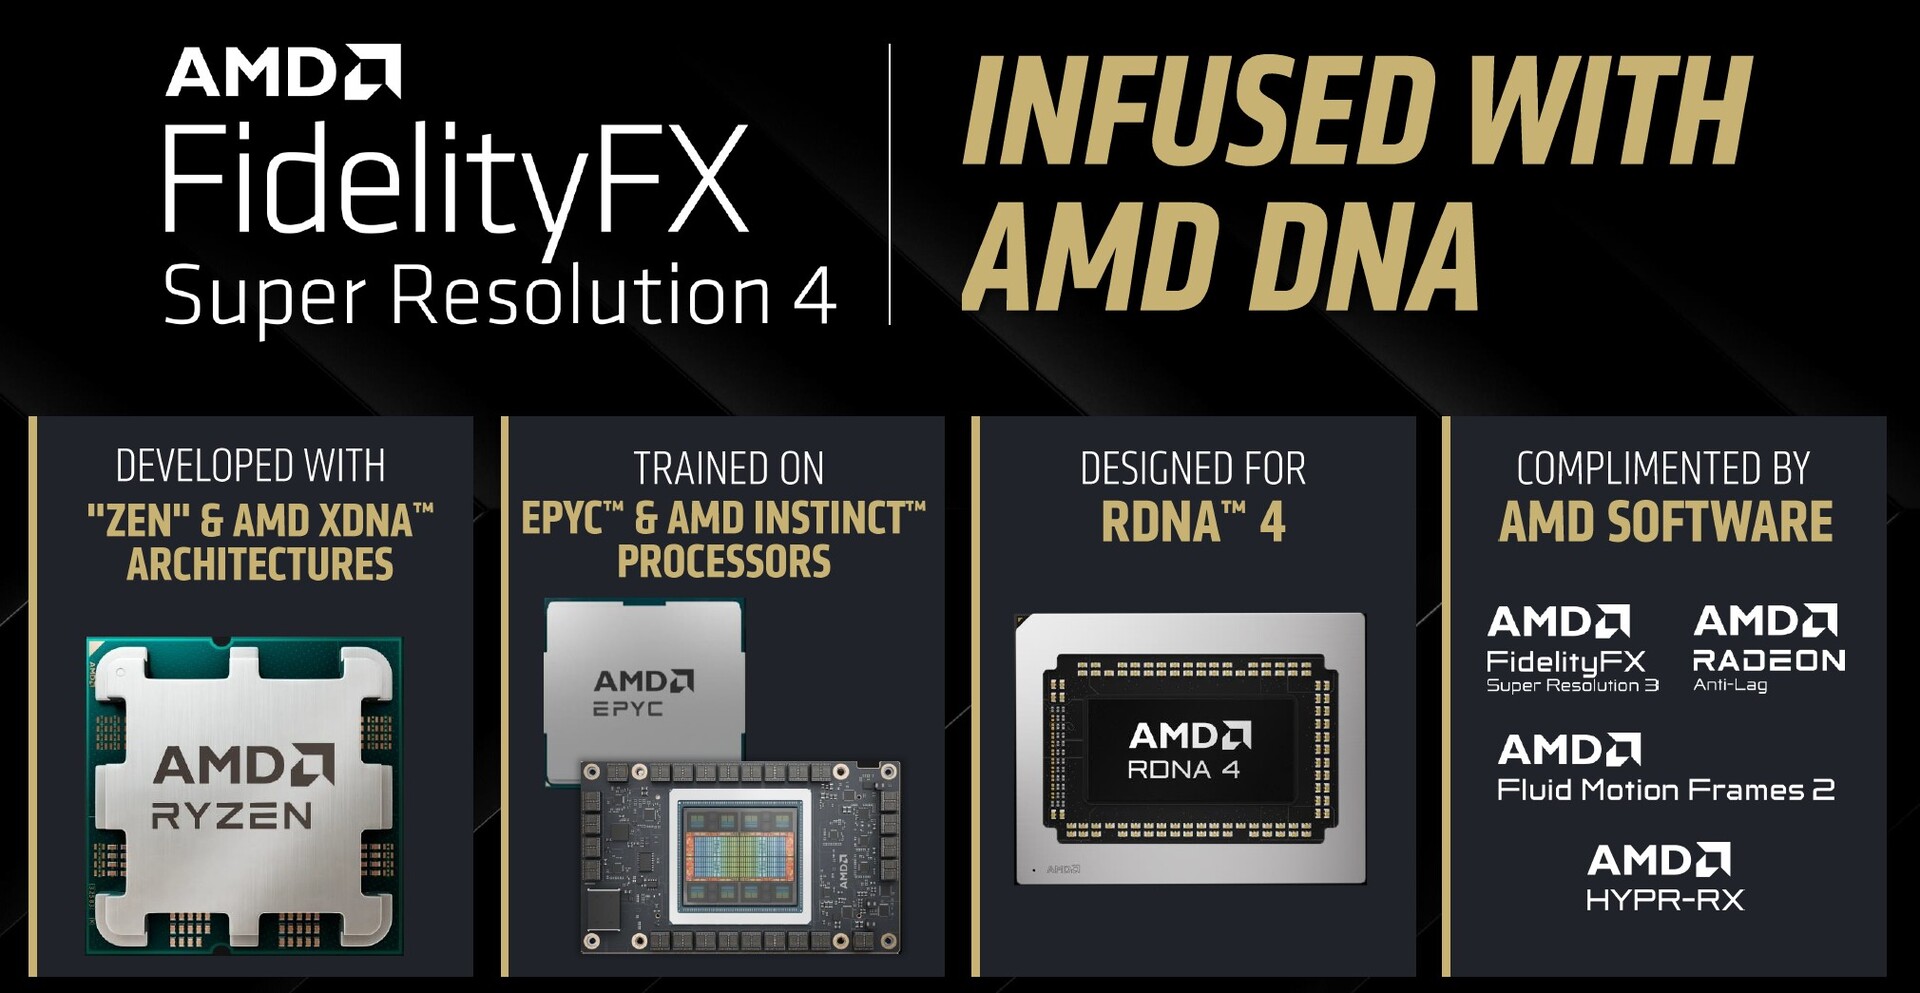
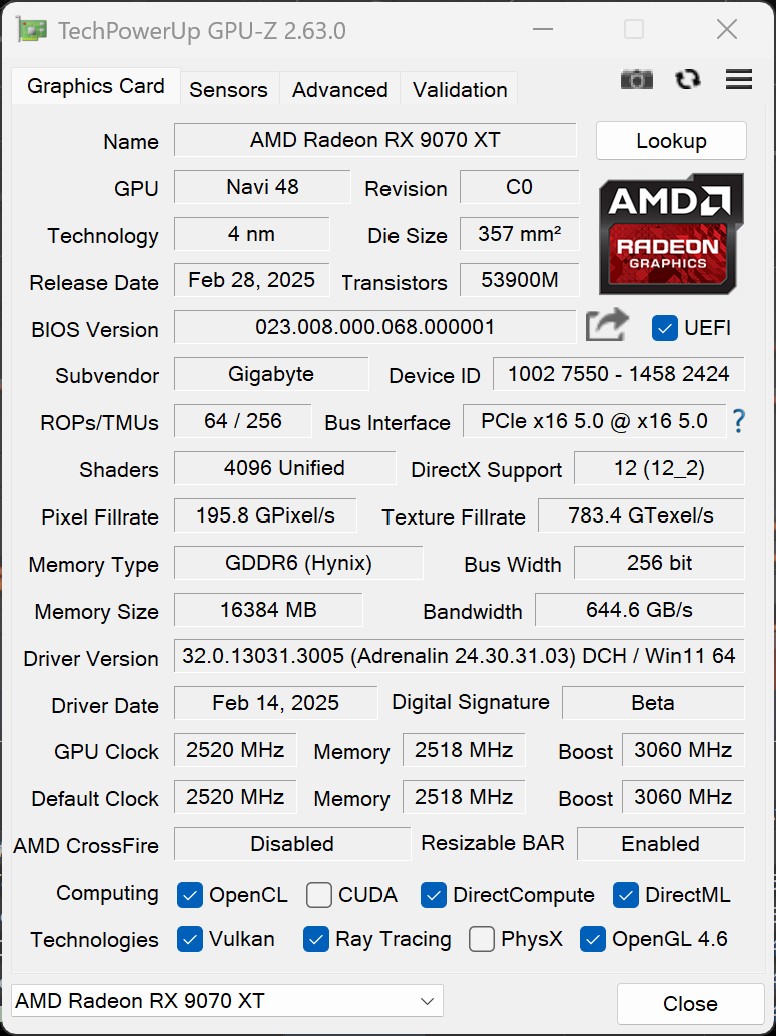
RDNA4 is AMD's latest GPU architecture that delivers higher efficiency and increased performance. Compared to RDNA3, AMD uses a monolithic chip instead of an MCM design, which reduces latency and improves energy efficiency. The architecture brings optimized compute units and improved ray tracing performance. In addition, RDNA4 exclusively supports FSR4, which is the first to use AI-supported upscaling technologies.
The development of AMD's FidelityFX Super Resolution (FSR) has undergone remarkable progress. FSR1 relied on simple spatial upscaling, which increased performance but was often accompanied by a visible loss of quality. With FSR2, AMD introduced temporal upscaling techniques, significantly improving sharpness and detail. FSR3 brought Frame Generation into play for the first time in order to generate additional images and thus further increase frame rates. Now FSR4 marks the next big leap: for the first time, AI-supported algorithms are used to raise image quality to a new level and achieve almost native sharpness. At the same time, Frame Generation also ensures an even smoother display in combination with FSR4. FSR4 shows its strengths in 4K in particular, but is reserved exclusively for RDNA4 graphics cards. So it seems that FSR is developing into a real alternative to Nvidia's DLSS and is making AMD GPUs even more powerful, especially when playing in high resolutions.


Specifications


Comparison of the Radeon RX 9070 series with other AMD GPUs
| Specifications | Gigabyte RX 9070 XT Gaming OC | Radeon RX 9070 XT | Gigabyte RX 9070 Gaming OC | Radeon RX 9070 | Radeon RX 7900 XTX | Radeon RX 7900 XT | Radeon RX 6950 XT | Radeon RX 6800 XT | Radeon RX 6800 |
| GPU | Navi 48 | Navi 48 | Navi 48 | Navi 48 | Navi 31 XTX | Navi 31 XT | Navi 21 XTX | Navi 21 XT | Navi 21 XL |
| Manufacturing Process | 4 nm | 4 nm | 4 nm | 4 nm | 5/6 nm | 5/6 nm | 7 nm | 7 nm | 7 nm |
| Compute Units | 64 | 64 | 56 | 56 | 96 | 84 | 80 | 72 | 60 |
| Shading Units | 4,096 | 4,096 | 3,584 | 3,584 | 6,144 | 5,376 | 5,120 | 4,608 | 3,840 |
| Texture Mapping Units | 256 | 256 | 224 | 224 | 384 | 336 | 320 | 288 | 240 |
| Ray Accelerators | 64 | 64 | 56 | 56 | 96 | 84 | 80 | 72 | 60 |
| AI Accelerators | 128 | 128 | 112 | 112 | 192 | 168 | - | - | - |
| Base Clock | 1,820 MHz | ? | 1,440 MHz | ? | 2,270 MHz | 2,000 MHz | 1,925 MHz | 1,825 MHz | 1,700 MHz |
| Game Clock | 2,520 MHz | 2,400 MHz | 2,210 MHz | 2,070 MHz | 2,300 MHz | 2,000 MHz | 2,116 MHz | 2,015 MHz | 1,815 MHz |
| Boost Clock | 3,060 MHz | 2,970 MHz | 2,700 MHz | 2,540 MHz | 2,500 MHz | 2,400 MHz | 2,324 MHz | 2,250 MHz | 2,105 MHz |
| Infinity Cache | 64 MB (3rd Gen) | 64 MB (3rd Gen) | 64 MB (3rd Gen) | 64 MB (3rd Gen) | 96 MB | 80 MB | 128 MB | 128 MB | 128 MB |
| Memory Bus Width | 256-bit | 256-bit | 256-bit | 256-bit | 384-bit | 320-bit | 256-bit | 256-bit | 256-bit |
| Memory Bandwidth | 644.6 GB/s | 640 GB/s | 644.6 GB/s | 640 GB/s | 960 GB/s | 800 GB/s | 576 GB/s | 512 GB/s | 512 GB/s |
| Memory Size | 16 GB GDDR6 | 16 GB GDDR6 | 16 GB GDDR6 | 16 GB GDDR6 | 24 GB GDDR6 | 20 GB GDDR6 | 16 GB GDDR6 | 16 GB GDDR6 | 16 GB GDDR6 |
| TBP | 330 W | 304 W | 240 W | 220 W | 355 W | 315 W | 335 W | 300 W | 250 W |
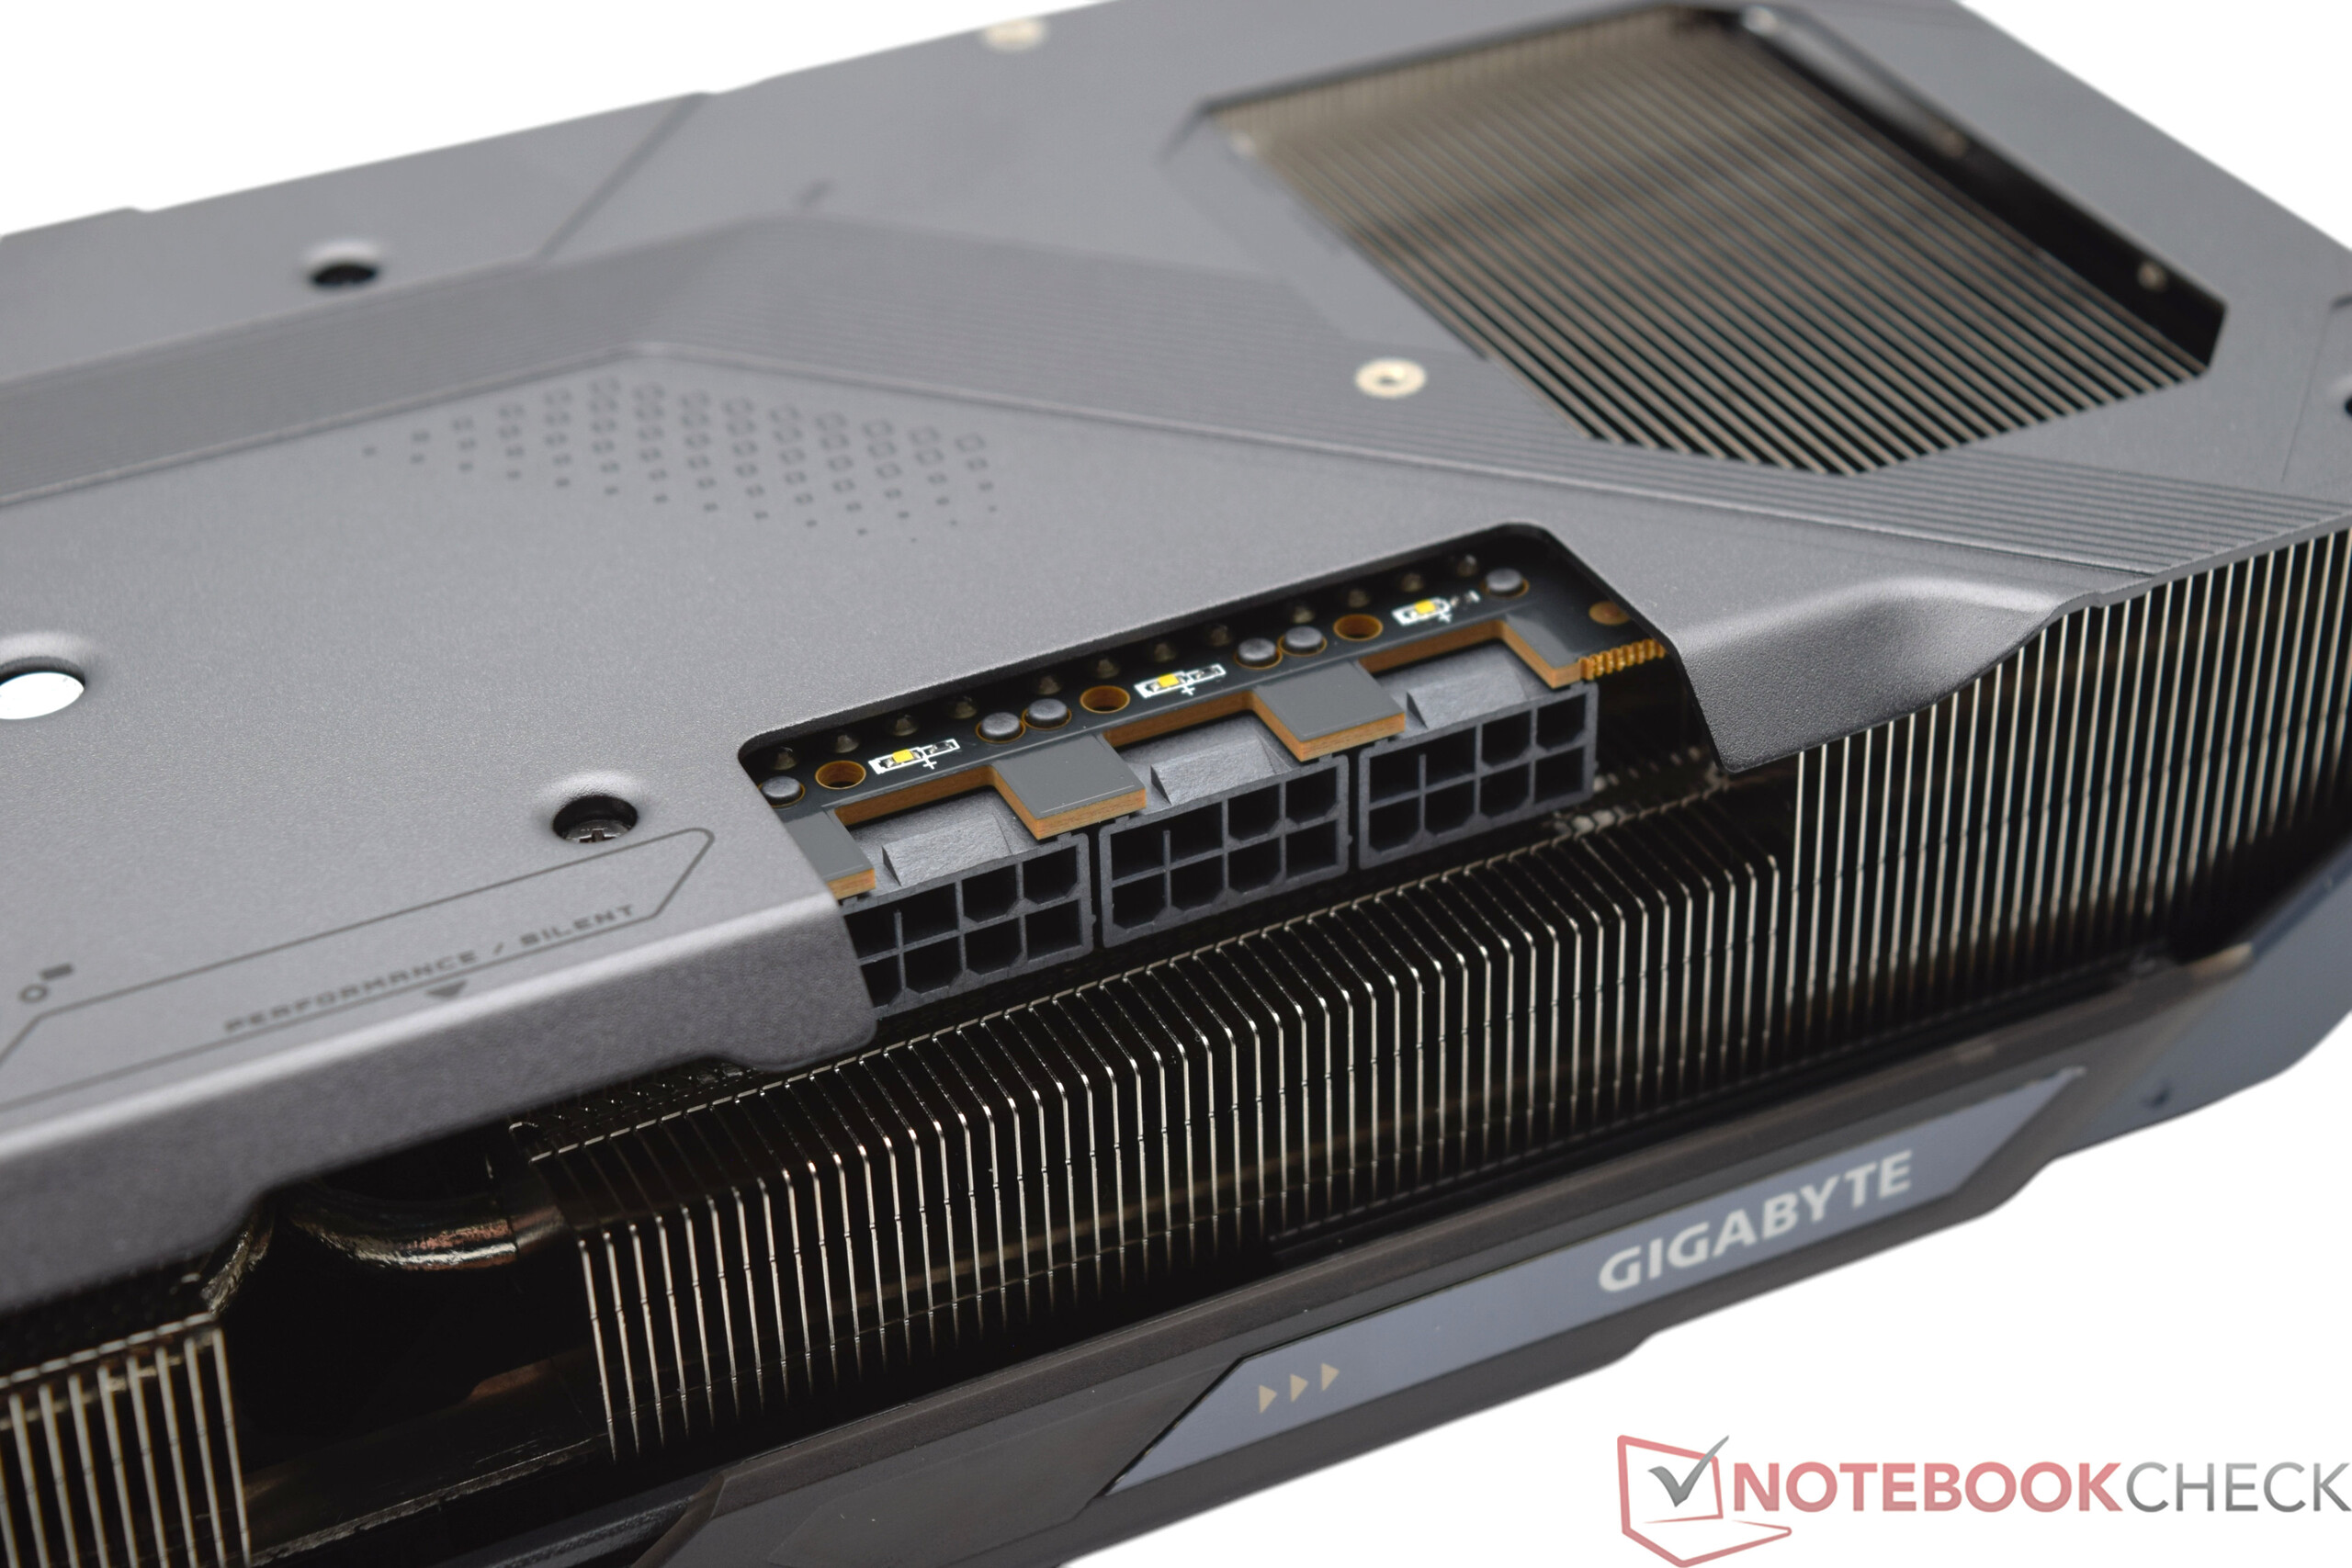
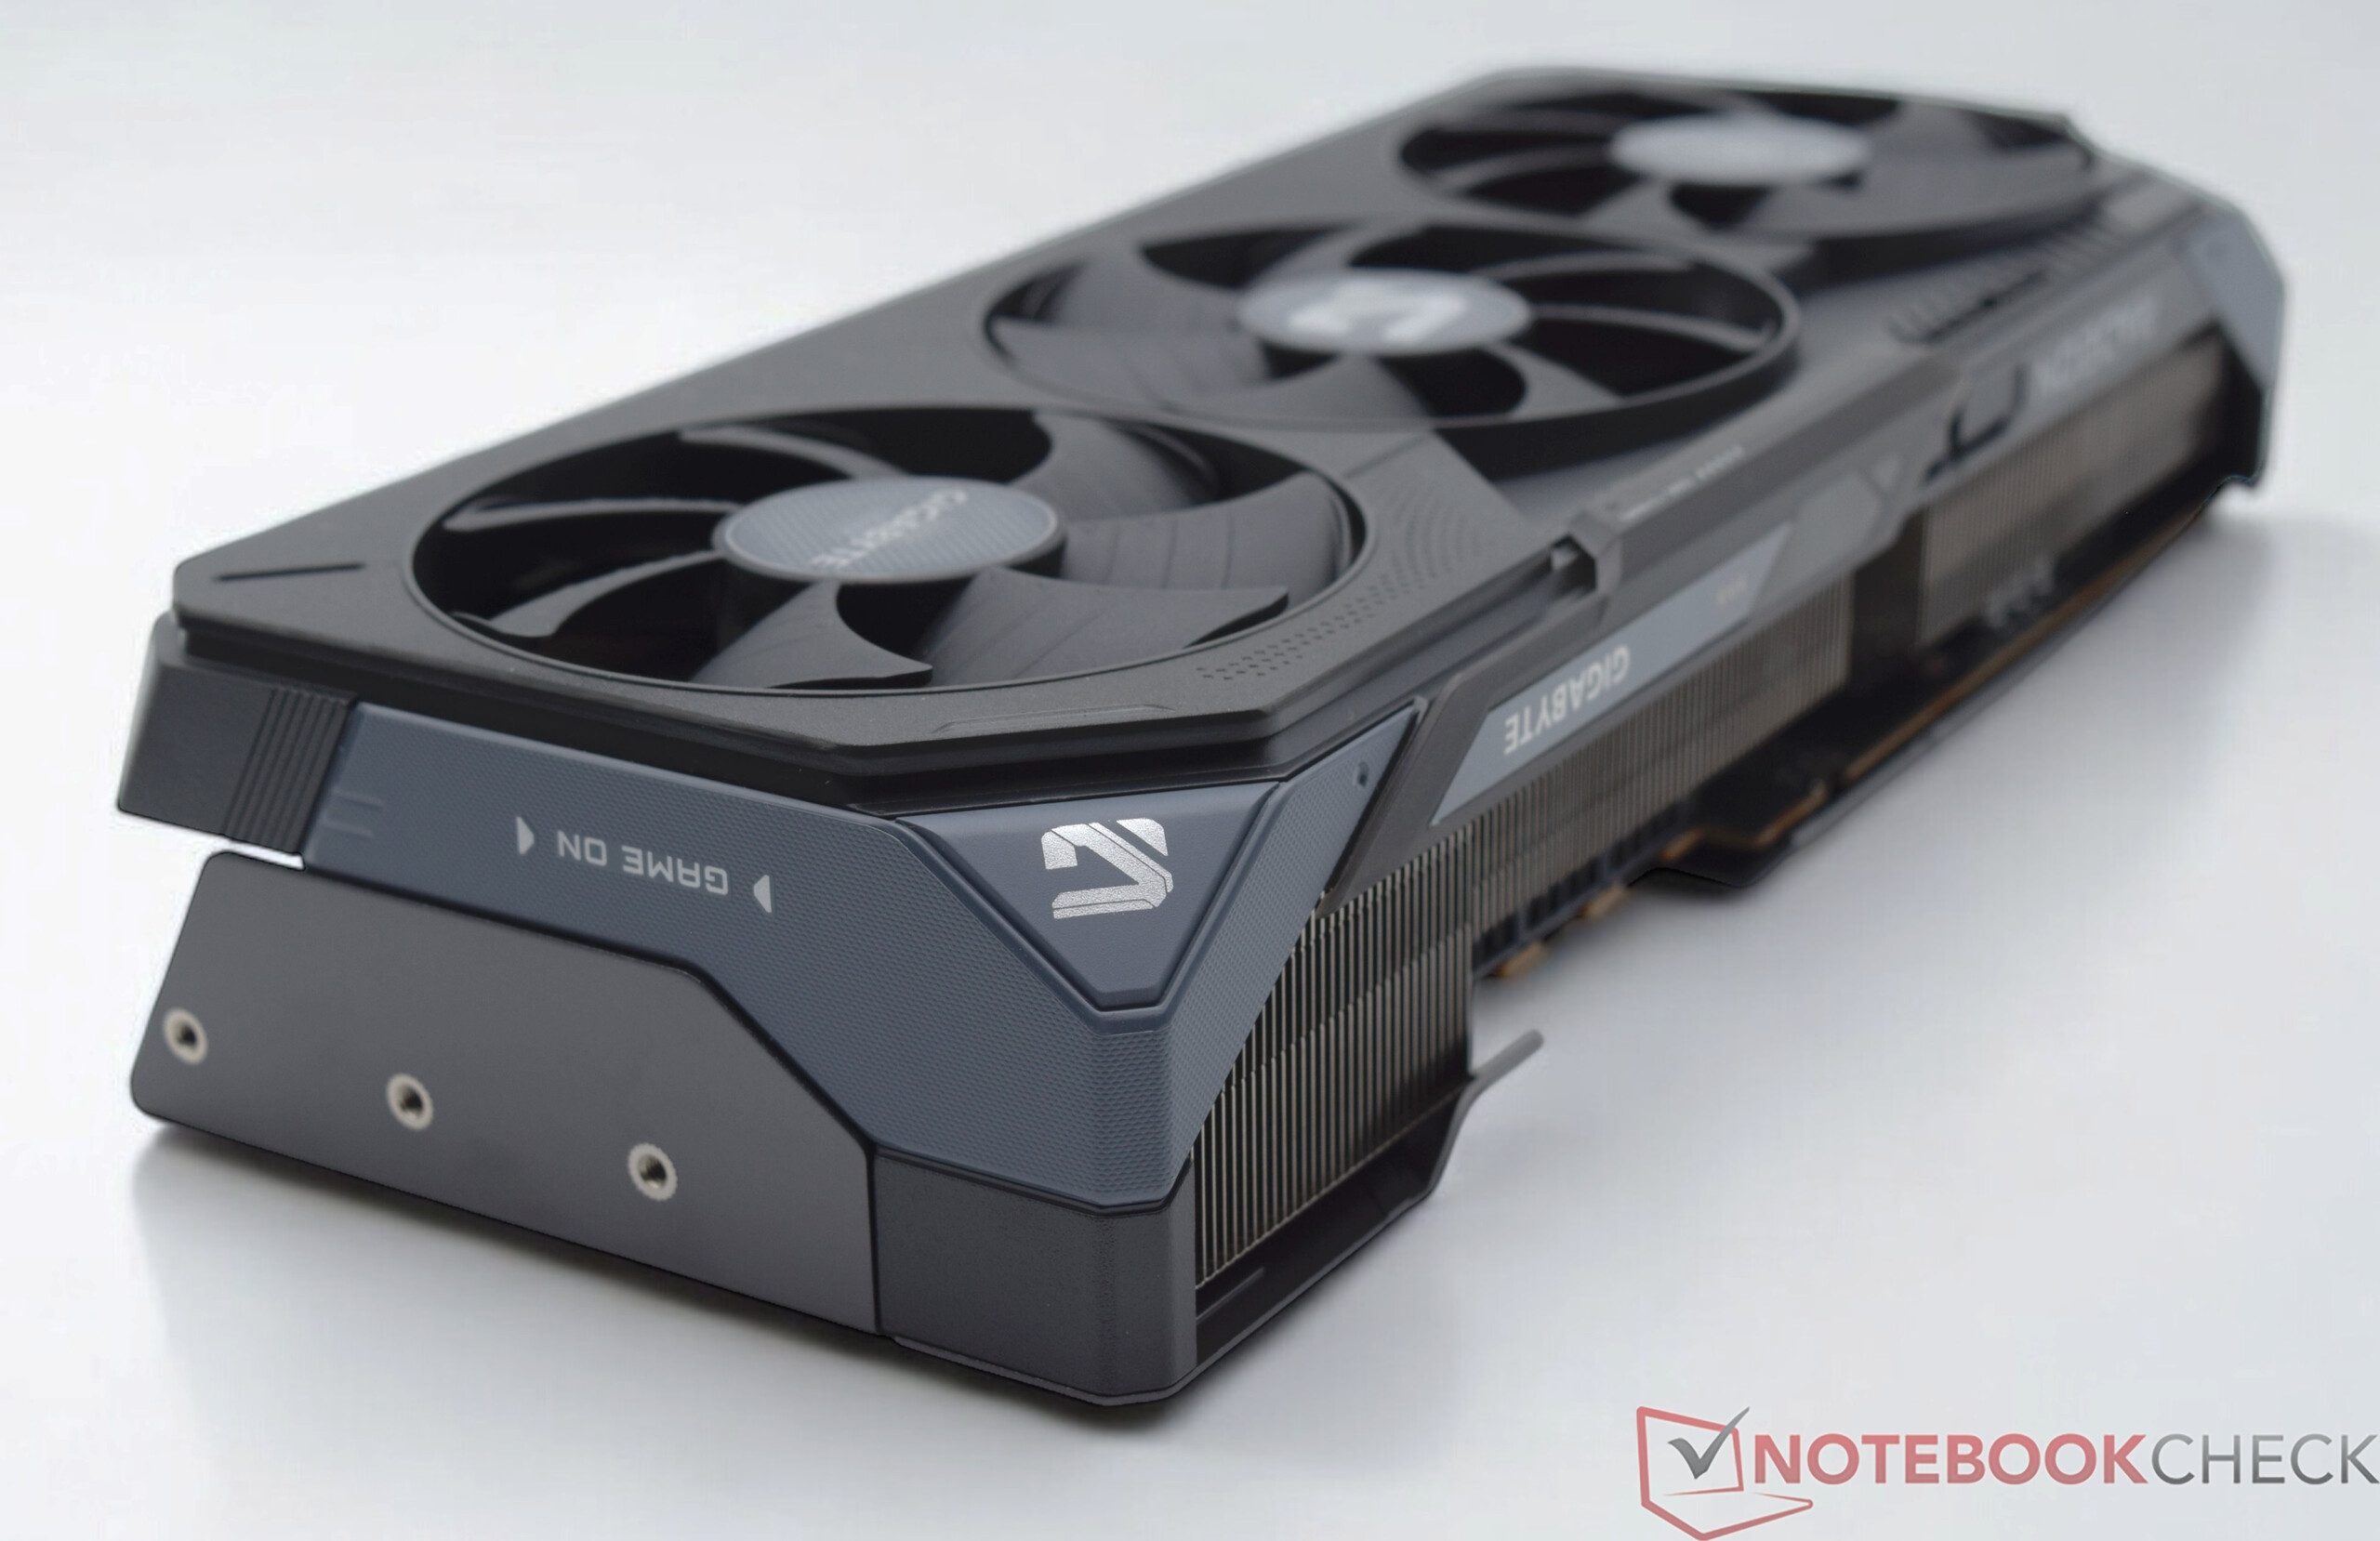
The Gigabyte Radeon RX 9070 (XT) Gaming OC
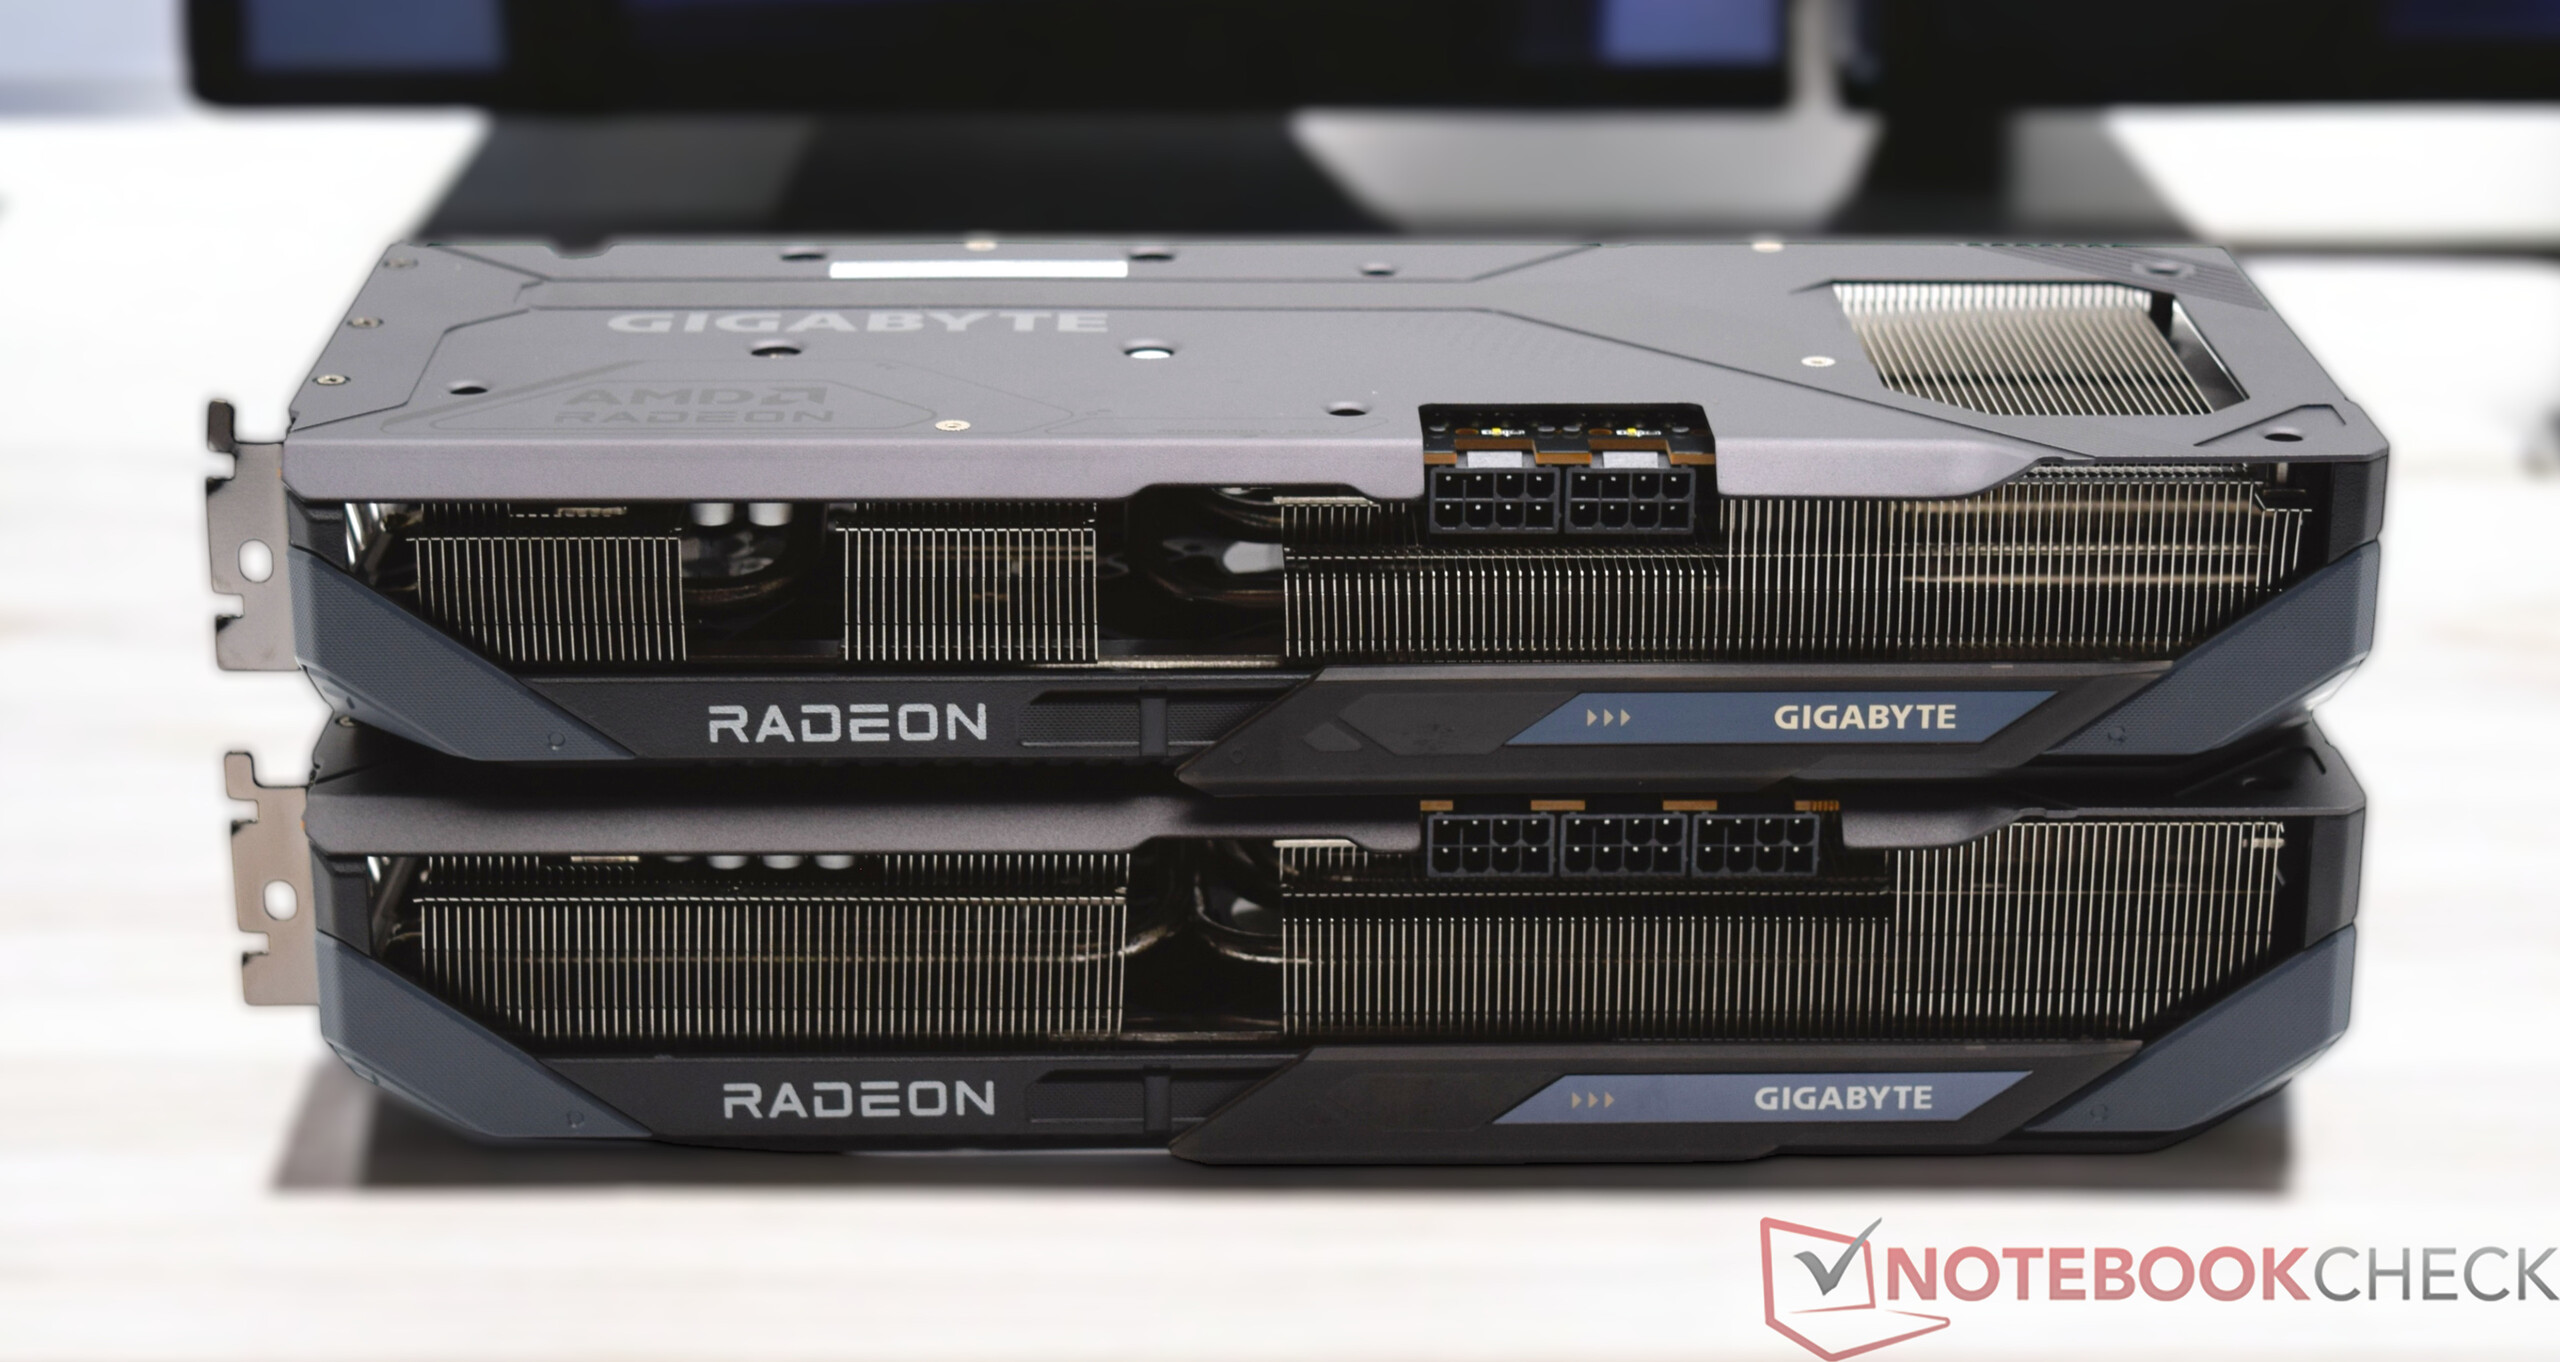
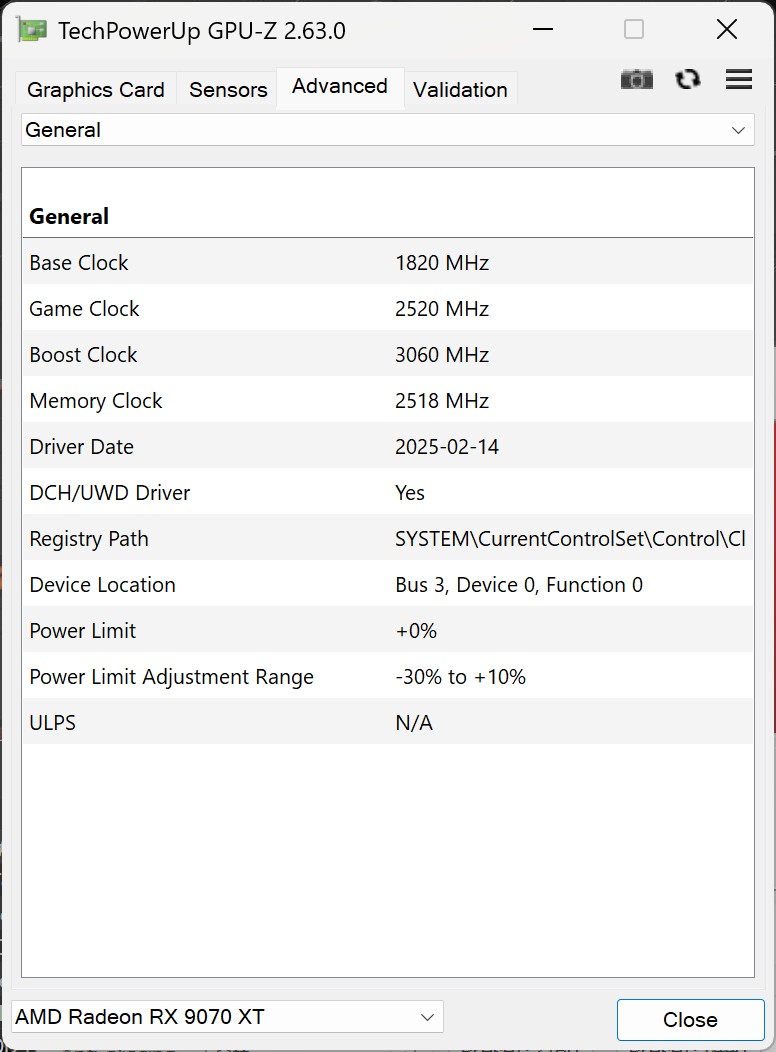
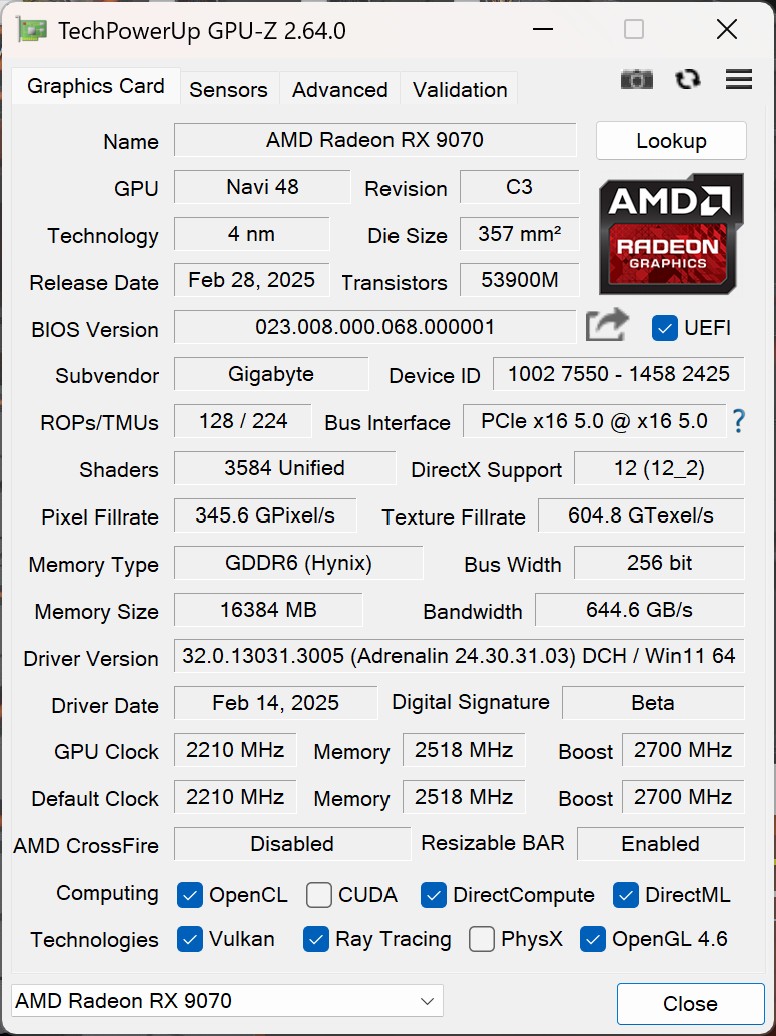
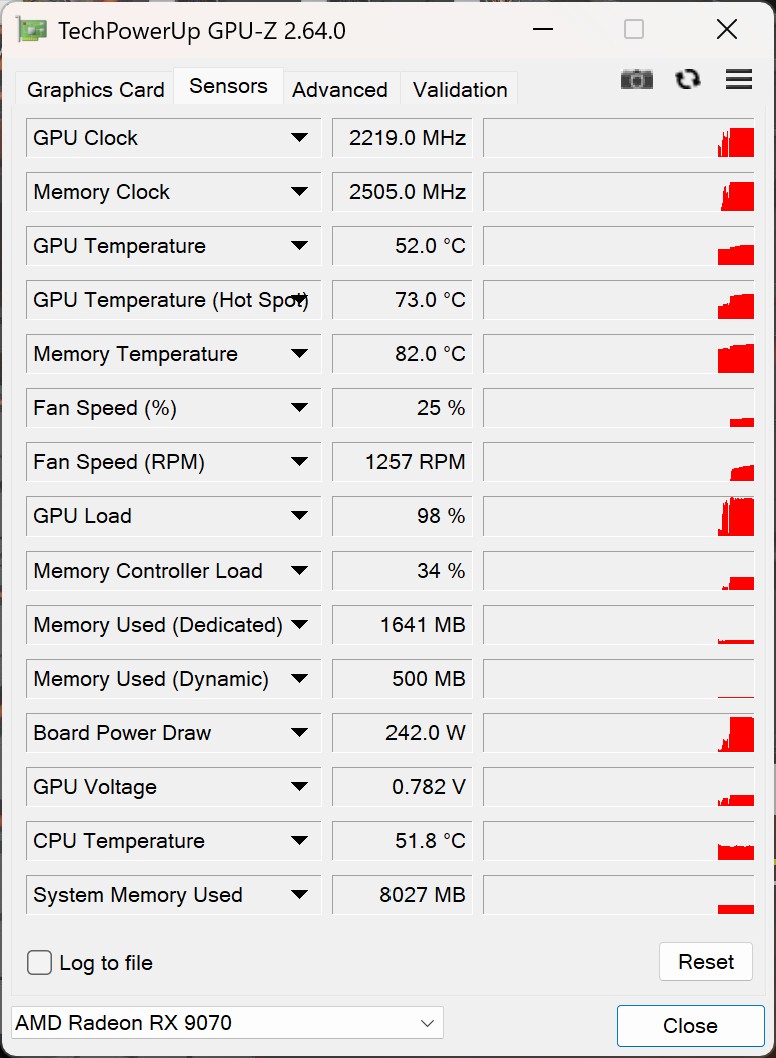
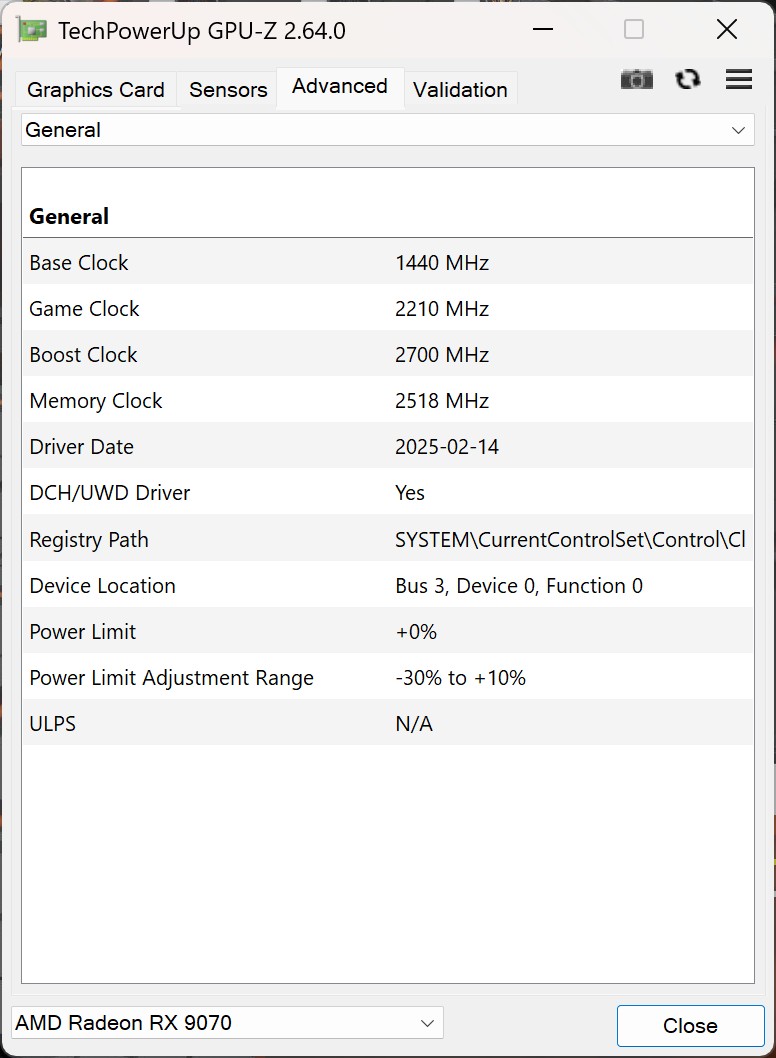
When looking at the data that we read out with GPU-Z, you can see that both graphics cards that were provided to us for our test deviate from AMD's reference values. Both Gigabyte models bear the abbreviation OC in their designation, which indicates a slight overclocking ex works. We can confirm this, because not only the GPU clock, but also the TBP (Total Board Power) are above the specifications that AMD specifies as a reference. The Gigabyte Radeon RX 9070 Gaming OC's maximum power consumption is 330 watts, while we documented 240 watts for the non-XT model. This leads to a noticeably higher efficiency. Both models have a dual BIOS, which is activated ex works in performance mode. This is precisely the configuration in which we conducted all tests on the Gigabyte Radeon RX 9070 XT Gaming OC and Gigabyte Radeon RX 9070 Gaming OC.
Synthetic benchmarks
A look at the synthetic benchmarks reveals the performance of the Gigabyte Radeon RX 9070 XT Gaming OC and the Gigabyte Radeon RX 9070 Gaming. It quickly becomes apparent that the new RDNA4 graphics cards don't quite match the top performance of the previous RDNA3 flagship. In comparison, the XFX Speedster MERC 310 Radeon RX 7900 XTX delivers around 5 percent more performance than the MBA model of the AMD Radeon RX 7900 XTX. If you look further back in GPU history, you'll see a slight advantage over the MSI Radeon RX 6950 XT Gaming X Trio and the Nvidia GeForce RTX 3090 Founders Edition.
Nevertheless, one thing remains clear: Nvidia's high-end models are out of reach—the Gigabyte RX 9070 XT cannot compete in this league.
| Performance rating - Percent | |
| Zotac Gaming GeForce RTX 5090 SOLID | |
| Palit GeForce RTX 4090 GameRock OC | |
| Asus TUF Gaming GeForce RTX 5080 OC | |
| XFX Speedster MERC 310 Radeon RX 7900 XTX | |
| AMD Radeon RX 9070 XT | |
| AMD Radeon RX 9070 | |
| MSI Radeon RX 6950 XT Gaming X Trio | |
| Nvidia GeForce RTX 3090 FE | |
| MSI GeForce RTX 3070 Ti Suprim X | |
| AMD Radeon RX 6800 | |
| AMD Radeon RX 6700 XT | |
| 3DMark | |
| 2560x1440 Time Spy Graphics | |
| Zotac Gaming GeForce RTX 5090 SOLID | |
| Palit GeForce RTX 4090 GameRock OC | |
| Asus TUF Gaming GeForce RTX 5080 OC | |
| XFX Speedster MERC 310 Radeon RX 7900 XTX | |
| AMD Radeon RX 9070 XT | |
| AMD Radeon RX 9070 | |
| MSI Radeon RX 6950 XT Gaming X Trio | |
| Nvidia GeForce RTX 3090 FE | |
| AMD Radeon RX 6800 | |
| MSI GeForce RTX 3070 Ti Suprim X | |
| AMD Radeon RX 6700 XT | |
| Fire Strike Extreme Graphics | |
| Zotac Gaming GeForce RTX 5090 SOLID | |
| Palit GeForce RTX 4090 GameRock OC | |
| Asus TUF Gaming GeForce RTX 5080 OC | |
| XFX Speedster MERC 310 Radeon RX 7900 XTX | |
| AMD Radeon RX 9070 XT | |
| AMD Radeon RX 9070 | |
| MSI Radeon RX 6950 XT Gaming X Trio | |
| Nvidia GeForce RTX 3090 FE | |
| AMD Radeon RX 6800 | |
| MSI GeForce RTX 3070 Ti Suprim X | |
| AMD Radeon RX 6700 XT | |
| Steel Nomad Score | |
| Zotac Gaming GeForce RTX 5090 SOLID (Vulkan) | |
| Zotac Gaming GeForce RTX 5090 SOLID (DX12) | |
| Palit GeForce RTX 4090 GameRock OC (Vulkan) | |
| Palit GeForce RTX 4090 GameRock OC (DX12) | |
| Asus TUF Gaming GeForce RTX 5080 OC (Vulkan) | |
| Asus TUF Gaming GeForce RTX 5080 OC (DX12) | |
| AMD Radeon RX 9070 XT (Vulkan) | |
| AMD Radeon RX 9070 XT (DX12) | |
| XFX Speedster MERC 310 Radeon RX 7900 XTX (Vulkan) | |
| XFX Speedster MERC 310 Radeon RX 7900 XTX (DX12) | |
| AMD Radeon RX 9070 (Vulkan) | |
| AMD Radeon RX 9070 (DX12) | |
| Nvidia GeForce RTX 3090 FE (Vulkan) | |
| Nvidia GeForce RTX 3090 FE (DX12) | |
| MSI Radeon RX 6950 XT Gaming X Trio (Vulkan) | |
| MSI Radeon RX 6950 XT Gaming X Trio (DX12) | |
| MSI GeForce RTX 3070 Ti Suprim X (Vulkan) | |
| MSI GeForce RTX 3070 Ti Suprim X (DX12) | |
| AMD Radeon RX 6800 (Vulkan) | |
| AMD Radeon RX 6800 (DX12) | |
| AMD Radeon RX 6700 XT (Vulkan) | |
| AMD Radeon RX 6700 XT (DX12) | |
| 2560x1440 Port Royal Graphics | |
| Zotac Gaming GeForce RTX 5090 SOLID | |
| Palit GeForce RTX 4090 GameRock OC | |
| Asus TUF Gaming GeForce RTX 5080 OC | |
| AMD Radeon RX 9070 XT | |
| XFX Speedster MERC 310 Radeon RX 7900 XTX | |
| AMD Radeon RX 9070 | |
| Nvidia GeForce RTX 3090 FE | |
| MSI Radeon RX 6950 XT Gaming X Trio | |
| MSI GeForce RTX 3070 Ti Suprim X | |
| AMD Radeon RX 6800 | |
| AMD Radeon RX 6700 XT | |
| 2560x1440 Speed Way Score | |
| Zotac Gaming GeForce RTX 5090 SOLID | |
| Palit GeForce RTX 4090 GameRock OC | |
| Asus TUF Gaming GeForce RTX 5080 OC | |
| XFX Speedster MERC 310 Radeon RX 7900 XTX | |
| AMD Radeon RX 9070 XT | |
| AMD Radeon RX 9070 | |
| Nvidia GeForce RTX 3090 FE | |
| MSI Radeon RX 6950 XT Gaming X Trio | |
| MSI GeForce RTX 3070 Ti Suprim X | |
| AMD Radeon RX 6800 | |
| AMD Radeon RX 6700 XT | |
| Unigine Superposition | |
| 7680x4320 8k Optimized | |
| Zotac Gaming GeForce RTX 5090 SOLID | |
| Palit GeForce RTX 4090 GameRock OC | |
| Asus TUF Gaming GeForce RTX 5080 OC | |
| XFX Speedster MERC 310 Radeon RX 7900 XTX | |
| AMD Radeon RX 9070 XT | |
| Nvidia GeForce RTX 3090 FE | |
| AMD Radeon RX 9070 | |
| MSI Radeon RX 6950 XT Gaming X Trio | |
| MSI GeForce RTX 3070 Ti Suprim X | |
| AMD Radeon RX 6800 | |
| AMD Radeon RX 6700 XT | |
| 3840x2160 4k Optimized | |
| MSI GeForce RTX 3070 Ti Suprim X | |
| Zotac Gaming GeForce RTX 5090 SOLID | |
| Palit GeForce RTX 4090 GameRock OC | |
| Asus TUF Gaming GeForce RTX 5080 OC | |
| XFX Speedster MERC 310 Radeon RX 7900 XTX | |
| AMD Radeon RX 9070 XT | |
| AMD Radeon RX 9070 | |
| MSI Radeon RX 6950 XT Gaming X Trio | |
| Nvidia GeForce RTX 3090 FE | |
| AMD Radeon RX 6800 | |
| AMD Radeon RX 6700 XT | |
| 1920x1080 1080p Extreme | |
| Zotac Gaming GeForce RTX 5090 SOLID | |
| Palit GeForce RTX 4090 GameRock OC | |
| Asus TUF Gaming GeForce RTX 5080 OC | |
| XFX Speedster MERC 310 Radeon RX 7900 XTX | |
| AMD Radeon RX 9070 XT | |
| AMD Radeon RX 9070 | |
| Nvidia GeForce RTX 3090 FE | |
| MSI Radeon RX 6950 XT Gaming X Trio | |
| MSI GeForce RTX 3070 Ti Suprim X | |
| AMD Radeon RX 6800 | |
| AMD Radeon RX 6700 XT | |
| Unigine Heaven 4.0 | |
| Extreme Preset DX11 | |
| Zotac Gaming GeForce RTX 5090 SOLID | |
| Palit GeForce RTX 4090 GameRock OC | |
| Asus TUF Gaming GeForce RTX 5080 OC | |
| XFX Speedster MERC 310 Radeon RX 7900 XTX | |
| MSI Radeon RX 6950 XT Gaming X Trio | |
| Nvidia GeForce RTX 3090 FE | |
| AMD Radeon RX 9070 XT | |
| AMD Radeon RX 9070 | |
| MSI GeForce RTX 3070 Ti Suprim X | |
| AMD Radeon RX 6800 | |
| AMD Radeon RX 6700 XT | |
| Extreme Preset OpenGL | |
| Zotac Gaming GeForce RTX 5090 SOLID | |
| Palit GeForce RTX 4090 GameRock OC | |
| Asus TUF Gaming GeForce RTX 5080 OC | |
| XFX Speedster MERC 310 Radeon RX 7900 XTX | |
| MSI Radeon RX 6950 XT Gaming X Trio | |
| AMD Radeon RX 9070 XT | |
| AMD Radeon RX 9070 | |
| Nvidia GeForce RTX 3090 FE | |
| AMD Radeon RX 6800 | |
| MSI GeForce RTX 3070 Ti Suprim X | |
| AMD Radeon RX 6700 XT | |
| Unigine Valley 1.0 | |
| 1920x1080 Extreme HD DirectX AA:x8 | |
| Palit GeForce RTX 4090 GameRock OC | |
| Zotac Gaming GeForce RTX 5090 SOLID | |
| Asus TUF Gaming GeForce RTX 5080 OC | |
| XFX Speedster MERC 310 Radeon RX 7900 XTX | |
| MSI Radeon RX 6950 XT Gaming X Trio | |
| Nvidia GeForce RTX 3090 FE | |
| AMD Radeon RX 9070 XT | |
| AMD Radeon RX 6800 | |
| AMD Radeon RX 9070 | |
| MSI GeForce RTX 3070 Ti Suprim X | |
| AMD Radeon RX 6700 XT | |
| 1920x1080 Extreme HD Preset OpenGL AA:x8 | |
| Palit GeForce RTX 4090 GameRock OC | |
| Zotac Gaming GeForce RTX 5090 SOLID | |
| XFX Speedster MERC 310 Radeon RX 7900 XTX | |
| Asus TUF Gaming GeForce RTX 5080 OC | |
| MSI Radeon RX 6950 XT Gaming X Trio | |
| Nvidia GeForce RTX 3090 FE | |
| AMD Radeon RX 9070 XT | |
| AMD Radeon RX 6800 | |
| AMD Radeon RX 9070 | |
| MSI GeForce RTX 3070 Ti Suprim X | |
| AMD Radeon RX 6700 XT | |
| Affinity Photo 2 - Combined (Single / Multi GPU) | |
| XFX Speedster MERC 310 Radeon RX 7900 XTX | |
| AMD Radeon RX 9070 | |
| AMD Radeon RX 9070 XT | |
| Palit GeForce RTX 4090 GameRock OC | |
| MSI Radeon RX 6950 XT Gaming X Trio | |
| Zotac Gaming GeForce RTX 5090 SOLID | |
| Asus TUF Gaming GeForce RTX 5080 OC | |
| AMD Radeon RX 6800 | |
| Nvidia GeForce RTX 3090 FE | |
| MSI GeForce RTX 3070 Ti Suprim X | |
| AMD Radeon RX 6700 XT | |
| ComputeMark v2.1 | |
| 1024x600 Normal, Score | |
| Zotac Gaming GeForce RTX 5090 SOLID | |
| Palit GeForce RTX 4090 GameRock OC | |
| Asus TUF Gaming GeForce RTX 5080 OC | |
| XFX Speedster MERC 310 Radeon RX 7900 XTX | |
| AMD Radeon RX 9070 XT | |
| Nvidia GeForce RTX 3090 FE | |
| AMD Radeon RX 9070 | |
| MSI Radeon RX 6950 XT Gaming X Trio | |
| MSI GeForce RTX 3070 Ti Suprim X | |
| AMD Radeon RX 6800 | |
| AMD Radeon RX 6700 XT | |
| 1024x600 Normal, Fluid 3DTex | |
| Zotac Gaming GeForce RTX 5090 SOLID | |
| Asus TUF Gaming GeForce RTX 5080 OC | |
| Palit GeForce RTX 4090 GameRock OC | |
| XFX Speedster MERC 310 Radeon RX 7900 XTX | |
| AMD Radeon RX 9070 XT | |
| AMD Radeon RX 9070 | |
| Nvidia GeForce RTX 3090 FE | |
| MSI Radeon RX 6950 XT Gaming X Trio | |
| AMD Radeon RX 6800 | |
| MSI GeForce RTX 3070 Ti Suprim X | |
| AMD Radeon RX 6700 XT | |
| 1024x600 Normal, Fluid 2DTexArr | |
| Zotac Gaming GeForce RTX 5090 SOLID | |
| XFX Speedster MERC 310 Radeon RX 7900 XTX | |
| Asus TUF Gaming GeForce RTX 5080 OC | |
| AMD Radeon RX 9070 XT | |
| AMD Radeon RX 9070 | |
| Palit GeForce RTX 4090 GameRock OC | |
| Nvidia GeForce RTX 3090 FE | |
| MSI Radeon RX 6950 XT Gaming X Trio | |
| MSI GeForce RTX 3070 Ti Suprim X | |
| AMD Radeon RX 6800 | |
| AMD Radeon RX 6700 XT | |
| 1024x600 Normal, Mandel Vector | |
| AMD Radeon RX 6700 XT | |
| Zotac Gaming GeForce RTX 5090 SOLID | |
| Palit GeForce RTX 4090 GameRock OC | |
| Asus TUF Gaming GeForce RTX 5080 OC | |
| XFX Speedster MERC 310 Radeon RX 7900 XTX | |
| AMD Radeon RX 9070 XT | |
| AMD Radeon RX 9070 | |
| MSI Radeon RX 6950 XT Gaming X Trio | |
| Nvidia GeForce RTX 3090 FE | |
| AMD Radeon RX 6800 | |
| MSI GeForce RTX 3070 Ti Suprim X | |
| 1024x600 Normal, Mandel Scalar | |
| Zotac Gaming GeForce RTX 5090 SOLID | |
| Palit GeForce RTX 4090 GameRock OC | |
| Asus TUF Gaming GeForce RTX 5080 OC | |
| XFX Speedster MERC 310 Radeon RX 7900 XTX | |
| AMD Radeon RX 9070 XT | |
| MSI Radeon RX 6950 XT Gaming X Trio | |
| AMD Radeon RX 9070 | |
| Nvidia GeForce RTX 3090 FE | |
| AMD Radeon RX 6800 | |
| MSI GeForce RTX 3070 Ti Suprim X | |
| AMD Radeon RX 6700 XT | |
| 1024x600 Normal, QJuliaRayTrace | |
| Zotac Gaming GeForce RTX 5090 SOLID | |
| Palit GeForce RTX 4090 GameRock OC | |
| Asus TUF Gaming GeForce RTX 5080 OC | |
| XFX Speedster MERC 310 Radeon RX 7900 XTX | |
| Nvidia GeForce RTX 3090 FE | |
| AMD Radeon RX 9070 XT | |
| AMD Radeon RX 9070 | |
| MSI Radeon RX 6950 XT Gaming X Trio | |
| MSI GeForce RTX 3070 Ti Suprim X | |
| AMD Radeon RX 6800 | |
| AMD Radeon RX 6700 XT | |
| V-Ray Benchmark Next 4.10 - GPU | |
| Zotac Gaming GeForce RTX 5090 SOLID (v4.10.07 ) | |
| Palit GeForce RTX 4090 GameRock OC (v4.10.07 ) | |
| Asus TUF Gaming GeForce RTX 5080 OC (v4.10.07 ) | |
| Nvidia GeForce RTX 3090 FE (v4.10.07 ) | |
| MSI GeForce RTX 3070 Ti Suprim X (v4.10.07 ) | |
| XFX Speedster MERC 310 Radeon RX 7900 XTX (v4.10.07 ) | |
| AMD Radeon RX 9070 (v4.10.07 ) | |
| MSI Radeon RX 6950 XT Gaming X Trio (v4.10.07 ) | |
| AMD Radeon RX 6800 (v4.10.07 ) | |
| AMD Radeon RX 6700 XT (v4.10.07 ) | |
| AMD Radeon RX 9070 XT (v4.10.07 ) | |
| Photoshop PugetBench - Overall Score 1.01 | |
| XFX Speedster MERC 310 Radeon RX 7900 XTX | |
| AMD Radeon RX 6800 | |
| MSI Radeon RX 6950 XT Gaming X Trio | |
| AMD Radeon RX 9070 | |
| AMD Radeon RX 6700 XT | |
| AMD Radeon RX 9070 XT | |
| Asus TUF Gaming GeForce RTX 5080 OC | |
| Palit GeForce RTX 4090 GameRock OC | |
| Zotac Gaming GeForce RTX 5090 SOLID | |
| Nvidia GeForce RTX 3090 FE | |
| MSI GeForce RTX 3070 Ti Suprim X | |
| Premiere Pro PugetBench - Overall Score 1.1 | |
| Palit GeForce RTX 4090 GameRock OC | |
| Zotac Gaming GeForce RTX 5090 SOLID | |
| Asus TUF Gaming GeForce RTX 5080 OC | |
| AMD Radeon RX 9070 | |
| XFX Speedster MERC 310 Radeon RX 7900 XTX | |
| AMD Radeon RX 9070 XT | |
| Nvidia GeForce RTX 3090 FE | |
| MSI GeForce RTX 3070 Ti Suprim X | |
| AMD Radeon RX 6800 | |
| MSI Radeon RX 6950 XT Gaming X Trio | |
| AMD Radeon RX 6700 XT | |
| Performance rating - Percent | |
| Zotac Gaming GeForce RTX 5090 SOLID | |
| Palit GeForce RTX 4090 GameRock OC | |
| Asus TUF Gaming GeForce RTX 5080 OC | |
| XFX Speedster MERC 310 Radeon RX 7900 XTX | |
| Nvidia GeForce RTX 3090 FE | |
| AMD Radeon RX 9070 XT | |
| AMD Radeon RX 9070 | |
| MSI Radeon RX 6950 XT Gaming X Trio | |
| MSI GeForce RTX 3070 Ti Suprim X | |
| AMD Radeon RX 6800 | |
| AMD Radeon RX 6700 XT | |
| Geekbench AI | |
| Single Precision ONNX DirectML GPU 1.2 | |
| Zotac Gaming GeForce RTX 5090 SOLID | |
| Palit GeForce RTX 4090 GameRock OC | |
| Asus TUF Gaming GeForce RTX 5080 OC | |
| XFX Speedster MERC 310 Radeon RX 7900 XTX | |
| AMD Radeon RX 9070 XT | |
| MSI Radeon RX 6950 XT Gaming X Trio | |
| AMD Radeon RX 9070 | |
| Nvidia GeForce RTX 3090 FE | |
| AMD Radeon RX 6800 | |
| AMD Radeon RX 6700 XT | |
| MSI GeForce RTX 3070 Ti Suprim X | |
| Half Precision ONNX DirectML GPU 1.2 | |
| Zotac Gaming GeForce RTX 5090 SOLID | |
| Asus TUF Gaming GeForce RTX 5080 OC | |
| Palit GeForce RTX 4090 GameRock OC | |
| AMD Radeon RX 9070 XT | |
| AMD Radeon RX 9070 | |
| XFX Speedster MERC 310 Radeon RX 7900 XTX | |
| Nvidia GeForce RTX 3090 FE | |
| MSI GeForce RTX 3070 Ti Suprim X | |
| MSI Radeon RX 6950 XT Gaming X Trio | |
| AMD Radeon RX 6800 | |
| AMD Radeon RX 6700 XT | |
| Quantized ONNX DirectML GPU 1.2 | |
| Zotac Gaming GeForce RTX 5090 SOLID | |
| AMD Radeon RX 9070 XT | |
| Palit GeForce RTX 4090 GameRock OC | |
| XFX Speedster MERC 310 Radeon RX 7900 XTX | |
| Asus TUF Gaming GeForce RTX 5080 OC | |
| AMD Radeon RX 9070 | |
| MSI Radeon RX 6950 XT Gaming X Trio | |
| AMD Radeon RX 6800 | |
| AMD Radeon RX 6700 XT | |
| Nvidia GeForce RTX 3090 FE | |
| MSI GeForce RTX 3070 Ti Suprim X | |
| MLPerf Client 0.5 - overall generation rate | |
| Zotac Gaming GeForce RTX 5090 SOLID (0.5.0.08fb2d4) | |
| AMD Radeon RX 6800 (0.5.0.08fb2d4) | |
| AMD Radeon RX 6800 (0.5.0.08fb2d4) | |
| AMD Radeon RX 6800 (0.5.0.08fb2d4) | |
| AMD Radeon RX 6800 (0.5.0.08fb2d4) | |
| AMD Radeon RX 6800 (0.5.0.08fb2d4) | |
| Palit GeForce RTX 4090 GameRock OC (0.5.0.08fb2d4) | |
| Asus TUF Gaming GeForce RTX 5080 OC (0.5.0.08fb2d4) | |
| XFX Speedster MERC 310 Radeon RX 7900 XTX (0.5.0.08fb2d4) | |
| Nvidia GeForce RTX 3090 FE (0.5.0.08fb2d4) | |
| AMD Radeon RX 9070 XT (0.5.0.08fb2d4) | |
| AMD Radeon RX 9070 (0.5.0.08fb2d4) | |
| MSI Radeon RX 6950 XT Gaming X Trio (0.5.0.08fb2d4) | |
| MSI GeForce RTX 3070 Ti Suprim X (0.5.0.08fb2d4) | |
| AMD Radeon RX 6700 XT (0.5.0.08fb2d4) | |
| UL Procyon for Windows - Overall Score Integer GPU | |
| Palit GeForce RTX 4090 GameRock OC (Nvidia TensorRT) | |
| Nvidia GeForce RTX 3090 FE (Nvidia TensorRT) | |
| MSI GeForce RTX 3070 Ti Suprim X (Nvidia TensorRT) | |
| Zotac Gaming GeForce RTX 5090 SOLID (Windows ML) | |
| Asus TUF Gaming GeForce RTX 5080 OC (Windows ML) | |
| XFX Speedster MERC 310 Radeon RX 7900 XTX (Windows ML) | |
| MSI Radeon RX 6950 XT Gaming X Trio (Windows ML) | |
| AMD Radeon RX 9070 XT (Windows ML) | |
| AMD Radeon RX 9070 (Windows ML) | |
| AMD Radeon RX 6800 (Windows ML) | |
| AMD Radeon RX 6700 XT (Windows ML) | |
| Basemark GPU 1.2 | |
| 3840x2160 DX12 High Offscreen | |
| Zotac Gaming GeForce RTX 5090 SOLID (bc7) | |
| Palit GeForce RTX 4090 GameRock OC (bc7) | |
| Asus TUF Gaming GeForce RTX 5080 OC (bc7) | |
| XFX Speedster MERC 310 Radeon RX 7900 XTX (bc7) | |
| AMD Radeon RX 9070 XT (bc7) | |
| Nvidia GeForce RTX 3090 FE (bc7) | |
| MSI Radeon RX 6950 XT Gaming X Trio (bc7) | |
| AMD Radeon RX 9070 (bc7) | |
| MSI GeForce RTX 3070 Ti Suprim X (bc7) | |
| AMD Radeon RX 6800 (bc7) | |
| AMD Radeon RX 6700 XT (bc7) | |
| 3840x2160 Vulkan High Offscreen | |
| Zotac Gaming GeForce RTX 5090 SOLID (bc7) | |
| Palit GeForce RTX 4090 GameRock OC (bc7) | |
| Asus TUF Gaming GeForce RTX 5080 OC (bc7) | |
| XFX Speedster MERC 310 Radeon RX 7900 XTX (bc7) | |
| AMD Radeon RX 9070 XT (bc7) | |
| Nvidia GeForce RTX 3090 FE (bc7) | |
| MSI Radeon RX 6950 XT Gaming X Trio (bc7) | |
| AMD Radeon RX 9070 (bc7) | |
| MSI GeForce RTX 3070 Ti Suprim X (bc7) | |
| AMD Radeon RX 6800 (bc7) | |
| AMD Radeon RX 6700 XT (bc7) | |
| Geekbench 6.7 | |
| GPU Vulkan | |
| Zotac Gaming GeForce RTX 5090 SOLID (6.4.0 Pro) | |
| Asus TUF Gaming GeForce RTX 5080 OC (6.4.0 Pro) | |
| Palit GeForce RTX 4090 GameRock OC (6.4.0 Pro) | |
| XFX Speedster MERC 310 Radeon RX 7900 XTX (6.4.0 Pro) | |
| Nvidia GeForce RTX 3090 FE (6.4.0 Pro) | |
| AMD Radeon RX 9070 (6.4.0 Pro) | |
| AMD Radeon RX 9070 XT (6.4.0 Pro) | |
| MSI GeForce RTX 3070 Ti Suprim X (6.4.0 Pro) | |
| MSI Radeon RX 6950 XT Gaming X Trio (6.4.0 Pro) | |
| AMD Radeon RX 6800 (6.4.0 Pro) | |
| AMD Radeon RX 6700 XT (6.4.0 Pro) | |
| GPU OpenCL | |
| Zotac Gaming GeForce RTX 5090 SOLID (6.4.0 Pro) | |
| Palit GeForce RTX 4090 GameRock OC (6.4.0 Pro) | |
| Asus TUF Gaming GeForce RTX 5080 OC (6.4.0 Pro) | |
| Nvidia GeForce RTX 3090 FE (6.4.0 Pro) | |
| XFX Speedster MERC 310 Radeon RX 7900 XTX (6.4.0 Pro) | |
| MSI Radeon RX 6950 XT Gaming X Trio (6.4.0 Pro) | |
| AMD Radeon RX 9070 XT (6.4.0 Pro) | |
| AMD Radeon RX 9070 (6.4.0 Pro) | |
| MSI GeForce RTX 3070 Ti Suprim X (6.4.0 Pro) | |
| AMD Radeon RX 6800 (6.4.0 Pro) | |
| AMD Radeon RX 6700 XT (6.4.0 Pro) | |
| Geekbench 6.0 | |
| GPU Vulkan 6.0 | |
| Zotac Gaming GeForce RTX 5090 SOLID | |
| Asus TUF Gaming GeForce RTX 5080 OC | |
| Palit GeForce RTX 4090 GameRock OC | |
| XFX Speedster MERC 310 Radeon RX 7900 XTX | |
| AMD Radeon RX 9070 XT | |
| AMD Radeon RX 9070 | |
| Nvidia GeForce RTX 3090 FE | |
| MSI GeForce RTX 3070 Ti Suprim X | |
| MSI Radeon RX 6950 XT Gaming X Trio | |
| AMD Radeon RX 6800 | |
| AMD Radeon RX 6700 XT | |
| GPU OpenCL 6.0 | |
| Zotac Gaming GeForce RTX 5090 SOLID | |
| Palit GeForce RTX 4090 GameRock OC | |
| Asus TUF Gaming GeForce RTX 5080 OC | |
| Nvidia GeForce RTX 3090 FE | |
| XFX Speedster MERC 310 Radeon RX 7900 XTX | |
| MSI Radeon RX 6950 XT Gaming X Trio | |
| AMD Radeon RX 9070 XT | |
| MSI GeForce RTX 3070 Ti Suprim X | |
| AMD Radeon RX 9070 | |
| AMD Radeon RX 6800 | |
| AMD Radeon RX 6700 XT | |
Professional applications
The two test models continue to offer solid performance for professional and semi-professional uses. In this area, AMD has already impressed in the past with strong computing power and efficient memory management. However, the results vary considerably depending on the application software and interface. In the SPECviewperf 2020 benchmark, which measures performance in CAD and visualization programs, the Gigabyte Radeon RX 9070 XT Gaming OC was around 20 % behind the XFX Speedster MERC 310 Radeon RX 7900 XTX. The gap was much smaller in SPECworkstation 4.0, indicating that the card performs more efficiently in certain workloads. The optimized RDNA4 architecture proved to have a particularly positive effect during HandBrake, where the GPU benefitted from the improved hardware-accelerated codecs and demonstrated high efficiency during video rendering and encoding.
| Gigabyte Radeon RX 9070 XT Gaming OC 16G R7 9800X3D | Gigabyte Radeon RX 9070 Gaming OC 16G R7 9800X3D | XFX Speedster MERC 310 Radeon RX 7900 XTX R7 9800X3D | MSI Radeon RX 6950 XT Gaming X Trio R7 9800X3D | NVIDIA Zotac GeForce RTX 5090 Solid R7 9800X3D | NVIDIA Asus TUF Gaming GeForce RTX 5080 OC R7 9800X3D | Palit GeForce RTX 4090 GameRock OC R7 9800X3D | Nvidia GeForce RTX 3090 FE R7 9800X3D | |
|---|---|---|---|---|---|---|---|---|
| SPECviewperf 2020 | -9% | 19% | -13% | 33% | -11% | -2% | -42% | |
| 3840x2160 Medical (medical-03) (fps) | 156 | 131 -16% | 107 -31% | 71.6 -54% | 50.7 -67% | 34.8 -78% | 43.4 -72% | 21.1 -86% |
| 3840x2160 Maya (maya-06) (fps) | 405 | 377 -7% | 565 40% | 467 15% | 684 69% | 565 40% | 610 51% | 363 -10% |
| 3840x2160 Energy (energy-03) (fps) | 136 | 109 -20% | 194 43% | 109 -20% | 312 129% | 115 -15% | 138 1% | 56.4 -59% |
| 3840x2160 Creo (creo-03) (fps) | 205 | 195 -5% | 223 9% | 169 -18% | 135 -34% | 130 -37% | 133 -35% | 114 -44% |
| 3840x2160 CATIA (catia-06) (fps) | 133 | 129 -3% | 149 12% | 114 -14% | 110 -17% | 82.5 -38% | 89.9 -32% | 59.3 -55% |
| 3840x2160 3ds Max (3dsmax-07) (fps) | 134 | 128 -4% | 187 40% | 155 16% | 292 118% | 217 62% | 235 75% | 139 4% |
SPECworkstation 4.0: Graphics Score | Accelerator Score | Viewport Graphics | HandBrake | ONNX Inference
| Performance rating | |
| XFX Speedster MERC 310 Radeon RX 7900 XTX | |
| Gigabyte Radeon RX 9070 XT Gaming OC 16G | |
| NVIDIA Zotac GeForce RTX 5090 Solid | |
| Gigabyte Radeon RX 9070 Gaming OC 16G | |
| Palit GeForce RTX 4090 GameRock OC | |
| NVIDIA Asus TUF Gaming GeForce RTX 5080 OC | |
| MSI Radeon RX 6950 XT Gaming X Trio | |
| Nvidia GeForce RTX 3090 FE | |
| AMD Radeon RX 6700 XT | |
| MSI GeForce RTX 3070 Ti Suprim X | |
| ASUS Dual GeForce RTX 4060 EVO OC | |
| SPECworkstation 4.0 / Graphics Score | |
| XFX Speedster MERC 310 Radeon RX 7900 XTX | |
| Gigabyte Radeon RX 9070 XT Gaming OC 16G | |
| Gigabyte Radeon RX 9070 Gaming OC 16G | |
| NVIDIA Zotac GeForce RTX 5090 Solid | |
| MSI Radeon RX 6950 XT Gaming X Trio | |
| Palit GeForce RTX 4090 GameRock OC | |
| NVIDIA Asus TUF Gaming GeForce RTX 5080 OC | |
| AMD Radeon RX 6700 XT | |
| Nvidia GeForce RTX 3090 FE | |
| MSI GeForce RTX 3070 Ti Suprim X | |
| ASUS Dual GeForce RTX 4060 EVO OC | |
| SPECworkstation 4.0 / Accelerator Score | |
| NVIDIA Zotac GeForce RTX 5090 Solid | |
| Palit GeForce RTX 4090 GameRock OC | |
| NVIDIA Asus TUF Gaming GeForce RTX 5080 OC | |
| Gigabyte Radeon RX 9070 XT Gaming OC 16G | |
| Gigabyte Radeon RX 9070 Gaming OC 16G | |
| XFX Speedster MERC 310 Radeon RX 7900 XTX | |
| Nvidia GeForce RTX 3090 FE | |
| MSI Radeon RX 6950 XT Gaming X Trio | |
| MSI GeForce RTX 3070 Ti Suprim X | |
| ASUS Dual GeForce RTX 4060 EVO OC | |
| AMD Radeon RX 6700 XT | |
| SPECworkstation 4.0 / Viewport Graphics | |
| XFX Speedster MERC 310 Radeon RX 7900 XTX | |
| Gigabyte Radeon RX 9070 XT Gaming OC 16G | |
| Gigabyte Radeon RX 9070 Gaming OC 16G | |
| NVIDIA Zotac GeForce RTX 5090 Solid | |
| MSI Radeon RX 6950 XT Gaming X Trio | |
| Palit GeForce RTX 4090 GameRock OC | |
| NVIDIA Asus TUF Gaming GeForce RTX 5080 OC | |
| AMD Radeon RX 6700 XT | |
| Nvidia GeForce RTX 3090 FE | |
| MSI GeForce RTX 3070 Ti Suprim X | |
| ASUS Dual GeForce RTX 4060 EVO OC | |
| SPECworkstation 4.0 / HandBrake | |
| Gigabyte Radeon RX 9070 XT Gaming OC 16G | |
| Gigabyte Radeon RX 9070 Gaming OC 16G | |
| XFX Speedster MERC 310 Radeon RX 7900 XTX | |
| NVIDIA Asus TUF Gaming GeForce RTX 5080 OC | |
| NVIDIA Zotac GeForce RTX 5090 Solid | |
| Palit GeForce RTX 4090 GameRock OC | |
| MSI Radeon RX 6950 XT Gaming X Trio | |
| ASUS Dual GeForce RTX 4060 EVO OC | |
| AMD Radeon RX 6700 XT | |
| Nvidia GeForce RTX 3090 FE | |
| MSI GeForce RTX 3070 Ti Suprim X | |
| SPECworkstation 4.0 / ONNX Inference | |
| NVIDIA Zotac GeForce RTX 5090 Solid | |
| Palit GeForce RTX 4090 GameRock OC | |
| XFX Speedster MERC 310 Radeon RX 7900 XTX | |
| Gigabyte Radeon RX 9070 XT Gaming OC 16G | |
| NVIDIA Asus TUF Gaming GeForce RTX 5080 OC | |
| MSI Radeon RX 6950 XT Gaming X Trio | |
| Gigabyte Radeon RX 9070 Gaming OC 16G | |
| Nvidia GeForce RTX 3090 FE | |
| AMD Radeon RX 6700 XT | |
| MSI GeForce RTX 3070 Ti Suprim X | |
| ASUS Dual GeForce RTX 4060 EVO OC | |
Gaming performance without upscaling
First, let's take a look at the pure graphics performance of the new AMD graphics cards without the use of FSR. Directly compared with the XFX Speedster MERC 310 Radeon RX 7900 XTX, it quickly becomes apparent that the Gigabyte Radeon RX 9070 XT Gaming OC falls behind. While the synthetic benchmarks suggested a clearer gap, this was noticeably smaller in our gaming test course. The Gigabyte Radeon RX 9070 Gaming OC was on average 13 percent behind the XT model, although the difference varied slightly depending on the game and resolution. Compared to Nvidia, both RX 9070 models offer higher performance on average than the GeForce RTX 3090 Founders Edition. In addition, newer games benefit more from the RDNA4 architecture than older ones. Overall, both variants are ideal for 2K gaming, while unrestricted 4K gaming is only possible with certain compromises.
| Performance rating - Percent | |
| Zotac Gaming GeForce RTX 5090 SOLID | |
| Palit GeForce RTX 4090 GameRock OC | |
| Asus TUF Gaming GeForce RTX 5080 OC | |
| XFX Speedster MERC 310 Radeon RX 7900 XTX | |
| AMD Radeon RX 9070 XT | |
| AMD Radeon RX 9070 | |
| Nvidia GeForce RTX 3090 FE | |
| The Witcher 3 | |
| 3840x2160 Ultra Graphics & Postprocessing (HBAO+) | |
| Zotac Gaming GeForce RTX 5090 SOLID | |
| Palit GeForce RTX 4090 GameRock OC | |
| Asus TUF Gaming GeForce RTX 5080 OC | |
| XFX Speedster MERC 310 Radeon RX 7900 XTX | |
| AMD Radeon RX 9070 XT | |
| AMD Radeon RX 9070 | |
| Nvidia GeForce RTX 3090 FE | |
| 2560x1440 Ultra Graphics & Postprocessing (HBAO+) | |
| Zotac Gaming GeForce RTX 5090 SOLID | |
| Palit GeForce RTX 4090 GameRock OC | |
| Asus TUF Gaming GeForce RTX 5080 OC | |
| XFX Speedster MERC 310 Radeon RX 7900 XTX | |
| AMD Radeon RX 9070 XT | |
| AMD Radeon RX 9070 | |
| Nvidia GeForce RTX 3090 FE | |
| 1920x1080 Ultra Graphics & Postprocessing (HBAO+) | |
| Zotac Gaming GeForce RTX 5090 SOLID | |
| Palit GeForce RTX 4090 GameRock OC | |
| XFX Speedster MERC 310 Radeon RX 7900 XTX | |
| Asus TUF Gaming GeForce RTX 5080 OC | |
| AMD Radeon RX 9070 XT | |
| AMD Radeon RX 9070 | |
| Nvidia GeForce RTX 3090 FE | |
| Hogwarts Legacy | |
| 3840x2160 Ultra Preset AA:High T | |
| Zotac Gaming GeForce RTX 5090 SOLID | |
| Palit GeForce RTX 4090 GameRock OC | |
| Asus TUF Gaming GeForce RTX 5080 OC | |
| AMD Radeon RX 9070 XT | |
| XFX Speedster MERC 310 Radeon RX 7900 XTX | |
| AMD Radeon RX 9070 | |
| Nvidia GeForce RTX 3090 FE | |
| 2560x1440 Ultra Preset AA:High T | |
| Zotac Gaming GeForce RTX 5090 SOLID | |
| Palit GeForce RTX 4090 GameRock OC | |
| XFX Speedster MERC 310 Radeon RX 7900 XTX | |
| Asus TUF Gaming GeForce RTX 5080 OC | |
| AMD Radeon RX 9070 XT | |
| AMD Radeon RX 9070 | |
| Nvidia GeForce RTX 3090 FE | |
| 1920x1080 Ultra Preset AA:High T | |
| Zotac Gaming GeForce RTX 5090 SOLID | |
| Asus TUF Gaming GeForce RTX 5080 OC | |
| Palit GeForce RTX 4090 GameRock OC | |
| XFX Speedster MERC 310 Radeon RX 7900 XTX | |
| AMD Radeon RX 9070 XT | |
| AMD Radeon RX 9070 | |
| Nvidia GeForce RTX 3090 FE | |
| Baldur's Gate 3 | |
| 3840x2160 Ultra Preset AA:T | |
| Zotac Gaming GeForce RTX 5090 SOLID | |
| Palit GeForce RTX 4090 GameRock OC | |
| Asus TUF Gaming GeForce RTX 5080 OC | |
| XFX Speedster MERC 310 Radeon RX 7900 XTX | |
| AMD Radeon RX 9070 XT | |
| AMD Radeon RX 9070 | |
| Nvidia GeForce RTX 3090 FE | |
| 2560x1440 Ultra Preset AA:T | |
| Zotac Gaming GeForce RTX 5090 SOLID | |
| Palit GeForce RTX 4090 GameRock OC | |
| Asus TUF Gaming GeForce RTX 5080 OC | |
| XFX Speedster MERC 310 Radeon RX 7900 XTX | |
| AMD Radeon RX 9070 XT | |
| AMD Radeon RX 9070 | |
| Nvidia GeForce RTX 3090 FE | |
| 1920x1080 Ultra Preset AA:T | |
| Zotac Gaming GeForce RTX 5090 SOLID | |
| Palit GeForce RTX 4090 GameRock OC | |
| XFX Speedster MERC 310 Radeon RX 7900 XTX | |
| Asus TUF Gaming GeForce RTX 5080 OC | |
| AMD Radeon RX 9070 XT | |
| AMD Radeon RX 9070 | |
| Nvidia GeForce RTX 3090 FE | |
| Cyberpunk 2077 | |
| 3840x2160 Ultra Preset (FSR off) | |
| Zotac Gaming GeForce RTX 5090 SOLID | |
| Palit GeForce RTX 4090 GameRock OC | |
| Asus TUF Gaming GeForce RTX 5080 OC | |
| XFX Speedster MERC 310 Radeon RX 7900 XTX | |
| AMD Radeon RX 9070 XT | |
| AMD Radeon RX 9070 | |
| Nvidia GeForce RTX 3090 FE | |
| 2560x1440 Ultra Preset (FSR off) | |
| Zotac Gaming GeForce RTX 5090 SOLID | |
| Palit GeForce RTX 4090 GameRock OC | |
| Asus TUF Gaming GeForce RTX 5080 OC | |
| XFX Speedster MERC 310 Radeon RX 7900 XTX | |
| AMD Radeon RX 9070 XT | |
| AMD Radeon RX 9070 | |
| Nvidia GeForce RTX 3090 FE | |
| 1920x1080 Ultra Preset (FSR off) | |
| Zotac Gaming GeForce RTX 5090 SOLID | |
| Palit GeForce RTX 4090 GameRock OC | |
| Asus TUF Gaming GeForce RTX 5080 OC | |
| XFX Speedster MERC 310 Radeon RX 7900 XTX | |
| AMD Radeon RX 9070 XT | |
| AMD Radeon RX 9070 | |
| Nvidia GeForce RTX 3090 FE | |
| Alan Wake 2 | |
| 3840x2160 High Preset | |
| Zotac Gaming GeForce RTX 5090 SOLID | |
| Palit GeForce RTX 4090 GameRock OC | |
| XFX Speedster MERC 310 Radeon RX 7900 XTX | |
| Asus TUF Gaming GeForce RTX 5080 OC | |
| AMD Radeon RX 9070 XT | |
| AMD Radeon RX 9070 | |
| Nvidia GeForce RTX 3090 FE | |
| 2560x1440 High Preset | |
| Zotac Gaming GeForce RTX 5090 SOLID | |
| Palit GeForce RTX 4090 GameRock OC | |
| XFX Speedster MERC 310 Radeon RX 7900 XTX | |
| AMD Radeon RX 9070 XT | |
| Asus TUF Gaming GeForce RTX 5080 OC | |
| AMD Radeon RX 9070 | |
| Nvidia GeForce RTX 3090 FE | |
| 1920x1080 High Preset | |
| Zotac Gaming GeForce RTX 5090 SOLID | |
| Palit GeForce RTX 4090 GameRock OC | |
| XFX Speedster MERC 310 Radeon RX 7900 XTX | |
| AMD Radeon RX 9070 XT | |
| Asus TUF Gaming GeForce RTX 5080 OC | |
| AMD Radeon RX 9070 | |
| Nvidia GeForce RTX 3090 FE | |
| F1 24 | |
| 3840x2160 Ultra High Preset AA:T AF:16x | |
| Zotac Gaming GeForce RTX 5090 SOLID | |
| Palit GeForce RTX 4090 GameRock OC | |
| Asus TUF Gaming GeForce RTX 5080 OC | |
| AMD Radeon RX 9070 XT | |
| XFX Speedster MERC 310 Radeon RX 7900 XTX | |
| AMD Radeon RX 9070 | |
| Nvidia GeForce RTX 3090 FE | |
| 2560x1440 Ultra High Preset AA:T AF:16x | |
| Zotac Gaming GeForce RTX 5090 SOLID | |
| Palit GeForce RTX 4090 GameRock OC | |
| Asus TUF Gaming GeForce RTX 5080 OC | |
| AMD Radeon RX 9070 XT | |
| AMD Radeon RX 9070 | |
| XFX Speedster MERC 310 Radeon RX 7900 XTX | |
| Nvidia GeForce RTX 3090 FE | |
| 1920x1080 Ultra High Preset AA:T AF:16x | |
| Zotac Gaming GeForce RTX 5090 SOLID | |
| Palit GeForce RTX 4090 GameRock OC | |
| Asus TUF Gaming GeForce RTX 5080 OC | |
| AMD Radeon RX 9070 XT | |
| AMD Radeon RX 9070 | |
| XFX Speedster MERC 310 Radeon RX 7900 XTX | |
| Nvidia GeForce RTX 3090 FE | |
| Black Myth: Wukong | |
| 3840x2160 cinematic TSR 100 | |
| Zotac Gaming GeForce RTX 5090 SOLID | |
| Palit GeForce RTX 4090 GameRock OC | |
| Asus TUF Gaming GeForce RTX 5080 OC | |
| XFX Speedster MERC 310 Radeon RX 7900 XTX | |
| AMD Radeon RX 9070 XT | |
| AMD Radeon RX 9070 | |
| Nvidia GeForce RTX 3090 FE | |
| 2560x1440 cinematic TSR 100 | |
| Zotac Gaming GeForce RTX 5090 SOLID | |
| Palit GeForce RTX 4090 GameRock OC | |
| Asus TUF Gaming GeForce RTX 5080 OC | |
| XFX Speedster MERC 310 Radeon RX 7900 XTX | |
| AMD Radeon RX 9070 XT | |
| AMD Radeon RX 9070 | |
| Nvidia GeForce RTX 3090 FE | |
| 1920x1080 cinematic TSR 100 | |
| Zotac Gaming GeForce RTX 5090 SOLID | |
| Palit GeForce RTX 4090 GameRock OC | |
| Asus TUF Gaming GeForce RTX 5080 OC | |
| XFX Speedster MERC 310 Radeon RX 7900 XTX | |
| AMD Radeon RX 9070 XT | |
| AMD Radeon RX 9070 | |
| Nvidia GeForce RTX 3090 FE | |
| Star Wars Outlaws | |
| 3840x2160 cinem. ultra | |
| Zotac Gaming GeForce RTX 5090 SOLID | |
| Palit GeForce RTX 4090 GameRock OC | |
| Asus TUF Gaming GeForce RTX 5080 OC | |
| AMD Radeon RX 9070 XT | |
| XFX Speedster MERC 310 Radeon RX 7900 XTX | |
| AMD Radeon RX 9070 | |
| Nvidia GeForce RTX 3090 FE | |
| 2560x1440 cinem. ultra | |
| Palit GeForce RTX 4090 GameRock OC | |
| Zotac Gaming GeForce RTX 5090 SOLID | |
| Asus TUF Gaming GeForce RTX 5080 OC | |
| AMD Radeon RX 9070 XT | |
| XFX Speedster MERC 310 Radeon RX 7900 XTX | |
| AMD Radeon RX 9070 | |
| Nvidia GeForce RTX 3090 FE | |
| 1920x1080 cinem. ultra | |
| Palit GeForce RTX 4090 GameRock OC | |
| Zotac Gaming GeForce RTX 5090 SOLID | |
| Asus TUF Gaming GeForce RTX 5080 OC | |
| AMD Radeon RX 9070 XT | |
| XFX Speedster MERC 310 Radeon RX 7900 XTX | |
| Nvidia GeForce RTX 3090 FE | |
| AMD Radeon RX 9070 | |
| Call of Duty Black Ops 6 | |
| 3840x2160 Extreme Preset | |
| Zotac Gaming GeForce RTX 5090 SOLID | |
| XFX Speedster MERC 310 Radeon RX 7900 XTX | |
| AMD Radeon RX 9070 XT | |
| Palit GeForce RTX 4090 GameRock OC | |
| AMD Radeon RX 9070 | |
| Asus TUF Gaming GeForce RTX 5080 OC | |
| Nvidia GeForce RTX 3090 FE | |
| 2560x1440 Extreme Preset | |
| Zotac Gaming GeForce RTX 5090 SOLID | |
| XFX Speedster MERC 310 Radeon RX 7900 XTX | |
| AMD Radeon RX 9070 XT | |
| Palit GeForce RTX 4090 GameRock OC | |
| AMD Radeon RX 9070 | |
| Asus TUF Gaming GeForce RTX 5080 OC | |
| Nvidia GeForce RTX 3090 FE | |
| 1920x1080 Extreme Preset | |
| Zotac Gaming GeForce RTX 5090 SOLID | |
| Palit GeForce RTX 4090 GameRock OC | |
| AMD Radeon RX 9070 XT | |
| XFX Speedster MERC 310 Radeon RX 7900 XTX | |
| AMD Radeon RX 9070 | |
| Asus TUF Gaming GeForce RTX 5080 OC | |
| Nvidia GeForce RTX 3090 FE | |
| Stalker 2 | |
| 3840x2160 Epic Preset | |
| Zotac Gaming GeForce RTX 5090 SOLID | |
| Palit GeForce RTX 4090 GameRock OC | |
| Asus TUF Gaming GeForce RTX 5080 OC | |
| XFX Speedster MERC 310 Radeon RX 7900 XTX | |
| AMD Radeon RX 9070 XT | |
| AMD Radeon RX 9070 | |
| Nvidia GeForce RTX 3090 FE | |
| 2560x1440 Epic Preset | |
| Zotac Gaming GeForce RTX 5090 SOLID | |
| Palit GeForce RTX 4090 GameRock OC | |
| Asus TUF Gaming GeForce RTX 5080 OC | |
| XFX Speedster MERC 310 Radeon RX 7900 XTX | |
| AMD Radeon RX 9070 XT | |
| AMD Radeon RX 9070 | |
| Nvidia GeForce RTX 3090 FE | |
| 1920x1080 Epic Preset | |
| Palit GeForce RTX 4090 GameRock OC | |
| Zotac Gaming GeForce RTX 5090 SOLID | |
| Asus TUF Gaming GeForce RTX 5080 OC | |
| XFX Speedster MERC 310 Radeon RX 7900 XTX | |
| AMD Radeon RX 9070 XT | |
| AMD Radeon RX 9070 | |
| Nvidia GeForce RTX 3090 FE | |
| Indiana Jones and the Great Circle | |
| 3840x2160 Very Ultra Preset | |
| Zotac Gaming GeForce RTX 5090 SOLID | |
| Palit GeForce RTX 4090 GameRock OC | |
| Asus TUF Gaming GeForce RTX 5080 OC | |
| XFX Speedster MERC 310 Radeon RX 7900 XTX | |
| AMD Radeon RX 9070 XT | |
| AMD Radeon RX 9070 | |
| Nvidia GeForce RTX 3090 FE | |
| 2560x1440 Very Ultra Preset | |
| Zotac Gaming GeForce RTX 5090 SOLID | |
| Palit GeForce RTX 4090 GameRock OC | |
| Asus TUF Gaming GeForce RTX 5080 OC | |
| XFX Speedster MERC 310 Radeon RX 7900 XTX | |
| AMD Radeon RX 9070 XT | |
| AMD Radeon RX 9070 | |
| Nvidia GeForce RTX 3090 FE | |
| 1920x1080 Very Ultra Preset | |
| Zotac Gaming GeForce RTX 5090 SOLID | |
| Palit GeForce RTX 4090 GameRock OC | |
| Asus TUF Gaming GeForce RTX 5080 OC | |
| XFX Speedster MERC 310 Radeon RX 7900 XTX | |
| AMD Radeon RX 9070 XT | |
| AMD Radeon RX 9070 | |
| Nvidia GeForce RTX 3090 FE | |
| Monster Hunter Wilds | |
| 3840x2160 ultra, RT: high, no upscaling | |
| Zotac Gaming GeForce RTX 5090 SOLID | |
| Palit GeForce RTX 4090 GameRock OC | |
| Asus TUF Gaming GeForce RTX 5080 OC | |
| AMD Radeon RX 9070 XT | |
| XFX Speedster MERC 310 Radeon RX 7900 XTX | |
| AMD Radeon RX 9070 | |
| Nvidia GeForce RTX 3090 FE | |
| 2560x1440 ultra, RT: high, no upscaling | |
| Zotac Gaming GeForce RTX 5090 SOLID | |
| Palit GeForce RTX 4090 GameRock OC | |
| Asus TUF Gaming GeForce RTX 5080 OC | |
| AMD Radeon RX 9070 XT | |
| XFX Speedster MERC 310 Radeon RX 7900 XTX | |
| AMD Radeon RX 9070 | |
| Nvidia GeForce RTX 3090 FE | |
| 1920x1080 ultra, RT: high, no upscaling | |
| Zotac Gaming GeForce RTX 5090 SOLID | |
| Palit GeForce RTX 4090 GameRock OC | |
| AMD Radeon RX 9070 XT | |
| Asus TUF Gaming GeForce RTX 5080 OC | |
| XFX Speedster MERC 310 Radeon RX 7900 XTX | |
| AMD Radeon RX 9070 | |
| Nvidia GeForce RTX 3090 FE | |
| Kingdom Come Deliverance 2 | |
| 3840x2160 Ultra Preset | |
| Zotac Gaming GeForce RTX 5090 SOLID | |
| Palit GeForce RTX 4090 GameRock OC | |
| Asus TUF Gaming GeForce RTX 5080 OC | |
| XFX Speedster MERC 310 Radeon RX 7900 XTX | |
| AMD Radeon RX 9070 XT | |
| AMD Radeon RX 9070 | |
| Nvidia GeForce RTX 3090 FE | |
| 2560x1440 Ultra Preset | |
| Zotac Gaming GeForce RTX 5090 SOLID | |
| Palit GeForce RTX 4090 GameRock OC | |
| Asus TUF Gaming GeForce RTX 5080 OC | |
| XFX Speedster MERC 310 Radeon RX 7900 XTX | |
| AMD Radeon RX 9070 XT | |
| AMD Radeon RX 9070 | |
| Nvidia GeForce RTX 3090 FE | |
| 1920x1080 Ultra Preset | |
| Zotac Gaming GeForce RTX 5090 SOLID | |
| Palit GeForce RTX 4090 GameRock OC | |
| Asus TUF Gaming GeForce RTX 5080 OC | |
| XFX Speedster MERC 310 Radeon RX 7900 XTX | |
| AMD Radeon RX 9070 XT | |
| AMD Radeon RX 9070 | |
| Nvidia GeForce RTX 3090 FE | |
Gaming performance with FSR
FSR (FidelityFX Super Resolution) is an upscaling technology developed by AMD that increases gaming performance by calculating games with a lower internal resolution and then upscaling them. This enables higher frame rates without significantly compromising visual quality. With the introduction of FSR4, AMD is additionally focusing on AI support, which should bring the image quality close to the native resolution. In conjunction with FSR, which we prefer to use in quality mode, the frame rates could be noticeably improved during our test, so we could even run demanding games smoothly in 4K. Numerous games already support FSR4 or will soon receive it via an update. Alternatively, the technology can be activated directly via the driver.
| Performance rating - Percent | |
| XFX Speedster MERC 310 Radeon RX 7900 XTX | |
| AMD Radeon RX 9070 XT | |
| AMD Radeon RX 9070 | |
| The First Descendant - 3840x2160 Ultra Preset + Ultra Ray Tracing + FSR Quality | |
| AMD Radeon RX 9070 XT | |
| AMD Radeon RX 9070 | |
| XFX Speedster MERC 310 Radeon RX 7900 XTX | |
| Call of Duty Black Ops 6 - 3840x2160 Extreme Preset + FSR Quality | |
| XFX Speedster MERC 310 Radeon RX 7900 XTX | |
| AMD Radeon RX 9070 XT | |
| AMD Radeon RX 9070 | |
| Kingdom Come Deliverance 2 - 3840x2160 Ultra Preset + Quality FSR | |
| XFX Speedster MERC 310 Radeon RX 7900 XTX | |
| AMD Radeon RX 9070 XT | |
| AMD Radeon RX 9070 | |
| Monster Hunter Wilds - 3840x2160 ultra, RT: high, FSR quality | |
| AMD Radeon RX 9070 XT | |
| XFX Speedster MERC 310 Radeon RX 7900 XTX | |
| AMD Radeon RX 9070 | |
| Star Wars Outlaws | |
| 3840x2160 cinem. ultra FSR | |
| AMD Radeon RX 9070 XT | |
| XFX Speedster MERC 310 Radeon RX 7900 XTX | |
| AMD Radeon RX 9070 | |
| 2560x1440 cinem. ultra FSR | |
| AMD Radeon RX 9070 XT | |
| XFX Speedster MERC 310 Radeon RX 7900 XTX | |
| AMD Radeon RX 9070 | |
| Civilization 7 | |
| 3840x2160 High Preset + FSR Quality | |
| XFX Speedster MERC 310 Radeon RX 7900 XTX | |
| AMD Radeon RX 9070 XT | |
| AMD Radeon RX 9070 | |
| 2560x1440 High Preset + FSR Quality | |
| XFX Speedster MERC 310 Radeon RX 7900 XTX | |
| AMD Radeon RX 9070 XT | |
| AMD Radeon RX 9070 | |
| F1 24 | |
| 3840x2160 Ultra High Preset + Quality FSR AF:16x | |
| AMD Radeon RX 9070 XT | |
| XFX Speedster MERC 310 Radeon RX 7900 XTX | |
| AMD Radeon RX 9070 | |
| 2560x1440 Ultra High Preset + Quality FSR AF:16x | |
| AMD Radeon RX 9070 XT | |
| AMD Radeon RX 9070 | |
| XFX Speedster MERC 310 Radeon RX 7900 XTX | |
| Cyberpunk 2077 - 3840x2160 Ray Tracing Ultra Preset (FSR2 on) | |
| AMD Radeon RX 9070 XT | |
| XFX Speedster MERC 310 Radeon RX 7900 XTX | |
| AMD Radeon RX 9070 | |
| Indiana Jones and the Great Circle - 2560x1440 Very Ultra + FSR Quality | |
| AMD Radeon RX 9070 XT | |
| XFX Speedster MERC 310 Radeon RX 7900 XTX | |
| AMD Radeon RX 9070 | |
| Stalker 2 | |
| 3840x2160 Epic Preset + Quality FSR | |
| XFX Speedster MERC 310 Radeon RX 7900 XTX | |
| AMD Radeon RX 9070 XT | |
| AMD Radeon RX 9070 | |
| 3840x2160 Epic Preset + Quality FSR + FG | |
| XFX Speedster MERC 310 Radeon RX 7900 XTX | |
| AMD Radeon RX 9070 XT | |
| AMD Radeon RX 9070 | |
| 2560x1440 Epic Preset + Quality FSR + FG | |
| XFX Speedster MERC 310 Radeon RX 7900 XTX | |
| AMD Radeon RX 9070 XT | |
| AMD Radeon RX 9070 | |
| Black Myth: Wukong - 2560x1440 cinematic FSR 68 | |
| XFX Speedster MERC 310 Radeon RX 7900 XTX | |
| AMD Radeon RX 9070 XT | |
| AMD Radeon RX 9070 | |
| God of War Ragnarök | |
| 3840x2160 Ultra Preset + Quality FSR | |
| XFX Speedster MERC 310 Radeon RX 7900 XTX | |
| AMD Radeon RX 9070 XT | |
| AMD Radeon RX 9070 | |
| 2560x1440 Ultra Preset + Quality FSR | |
| XFX Speedster MERC 310 Radeon RX 7900 XTX | |
| AMD Radeon RX 9070 | |
| AMD Radeon RX 9070 XT | |
| Until Dawn | |
| 3840x2160 Ultra Preset + Quality FSR + Ray Tracing | |
| XFX Speedster MERC 310 Radeon RX 7900 XTX | |
| AMD Radeon RX 9070 XT | |
| AMD Radeon RX 9070 | |
| 2560x1440 Ultra Preset + Quality FSR + Ray Tracing | |
| XFX Speedster MERC 310 Radeon RX 7900 XTX | |
| AMD Radeon RX 9070 XT | |
| AMD Radeon RX 9070 | |
| Alan Wake 2 - 3840x2160 High Preset + High Ray Tracing + Quality FSR | |
| AMD Radeon RX 9070 XT | |
| AMD Radeon RX 9070 | |
| XFX Speedster MERC 310 Radeon RX 7900 XTX | |
| Once Human | |
| 3840x2160 Very High Preset + Quality FSR | |
| XFX Speedster MERC 310 Radeon RX 7900 XTX | |
| AMD Radeon RX 9070 XT | |
| AMD Radeon RX 9070 | |
| 2560x1440 Very High Preset + Quality FSR | |
| XFX Speedster MERC 310 Radeon RX 7900 XTX | |
| AMD Radeon RX 9070 XT | |
| AMD Radeon RX 9070 | |
Overview of all tested games with the Gigabyte Radeon RX 9070 XT Gaming OC
| low | med. | high | ultra | QHD FSR | QHD | 4K FSR | 4K | |
|---|---|---|---|---|---|---|---|---|
| Resident Evil Requiem (2026) | 277 | 205 | 192.3 | 101.9 | 70.5 | 37 | ||
| Death Stranding 2 (2026) | 182.4 | 157.3 | 145.5 | 113.2 | 118.3 | 92.6 | 86 | 60.7 |
| Crimson Desert (2026) | 206 | 136.4 | 129.9 | 114 | 113.7 | 87.6 | 80 | 54.5 |
| Pragmata (2026) | 287 | 224 | 176.1 | 170 | 136.2 | 111.8 | 79.9 | |
| Forza Horizon 6 (2026) | 371 | 210 | 142 | 86 | 64 | 38 | ||
| 007 First Light (2026) | 168.4 | 159.5 | 147 | 139 | 158.3 | 101.5 | 109.8 | 55.9 |
Overview of all tested games with the Gigabyte Radeon RX 9070 Gaming OC
| low | med. | high | ultra | QHD FSR | QHD | 4K FSR | 4K | |
|---|---|---|---|---|---|---|---|---|
| Resident Evil Requiem (2026) | 257 | 189.6 | 177.2 | 91.3 | 61.7 | 32 | ||
| Death Stranding 2 (2026) | 170 | 147.4 | 129.1 | 99.7 | 106 | 80.5 | 76.4 | 52.2 |
| Crimson Desert (2026) | 190.3 | 121.2 | 117 | 103.3 | 104.3 | 77.9 | 71 | 46.6 |
| Pragmata (2026) | 264 | 205 | 162.6 | 156.4 | 123.1 | 101.5 | 69.7 | |
| Forza Horizon 6 (2026) | 354 | 202 | 135 | 79 | 56 | 33 | ||
| 007 First Light (2026) | 150.9 | 141.8 | 130.9 | 123.7 | 143.9 | 89.2 | 97.2 | 48.7 |
Emissions - The AMD Radeon RX 9070 as a hidden gem
Noise emissions
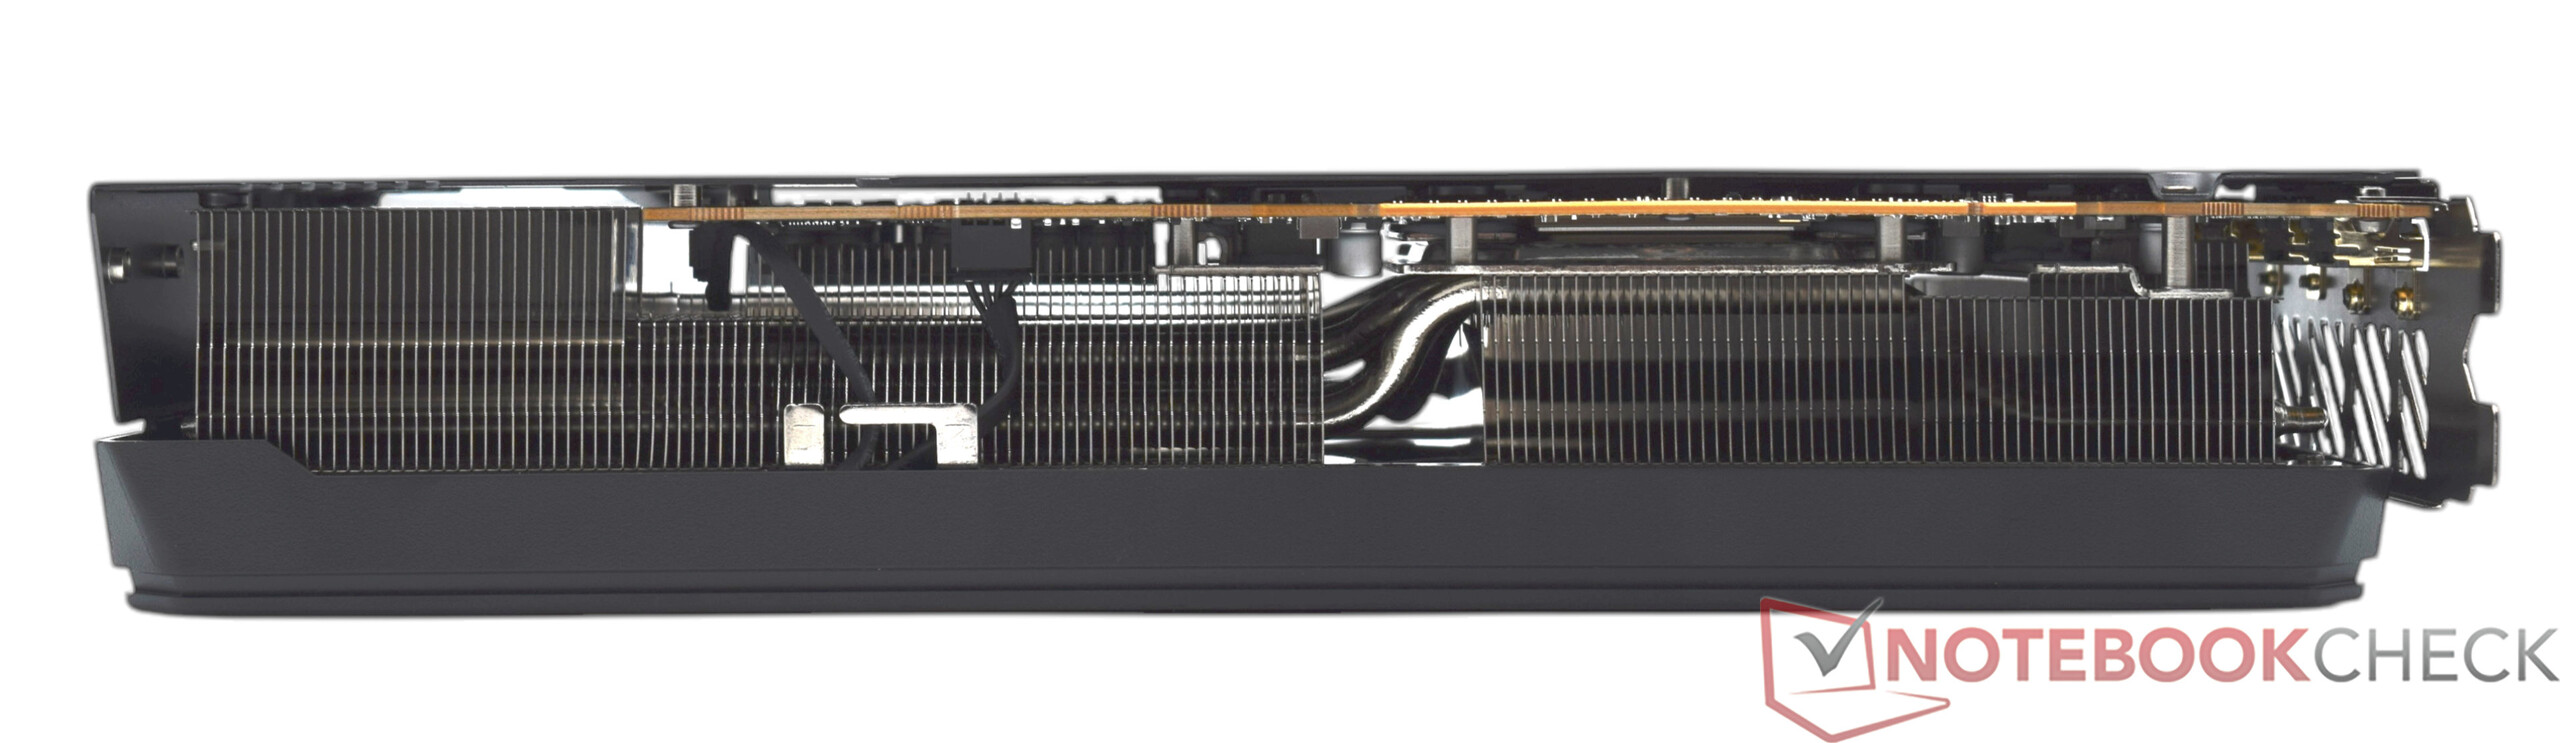
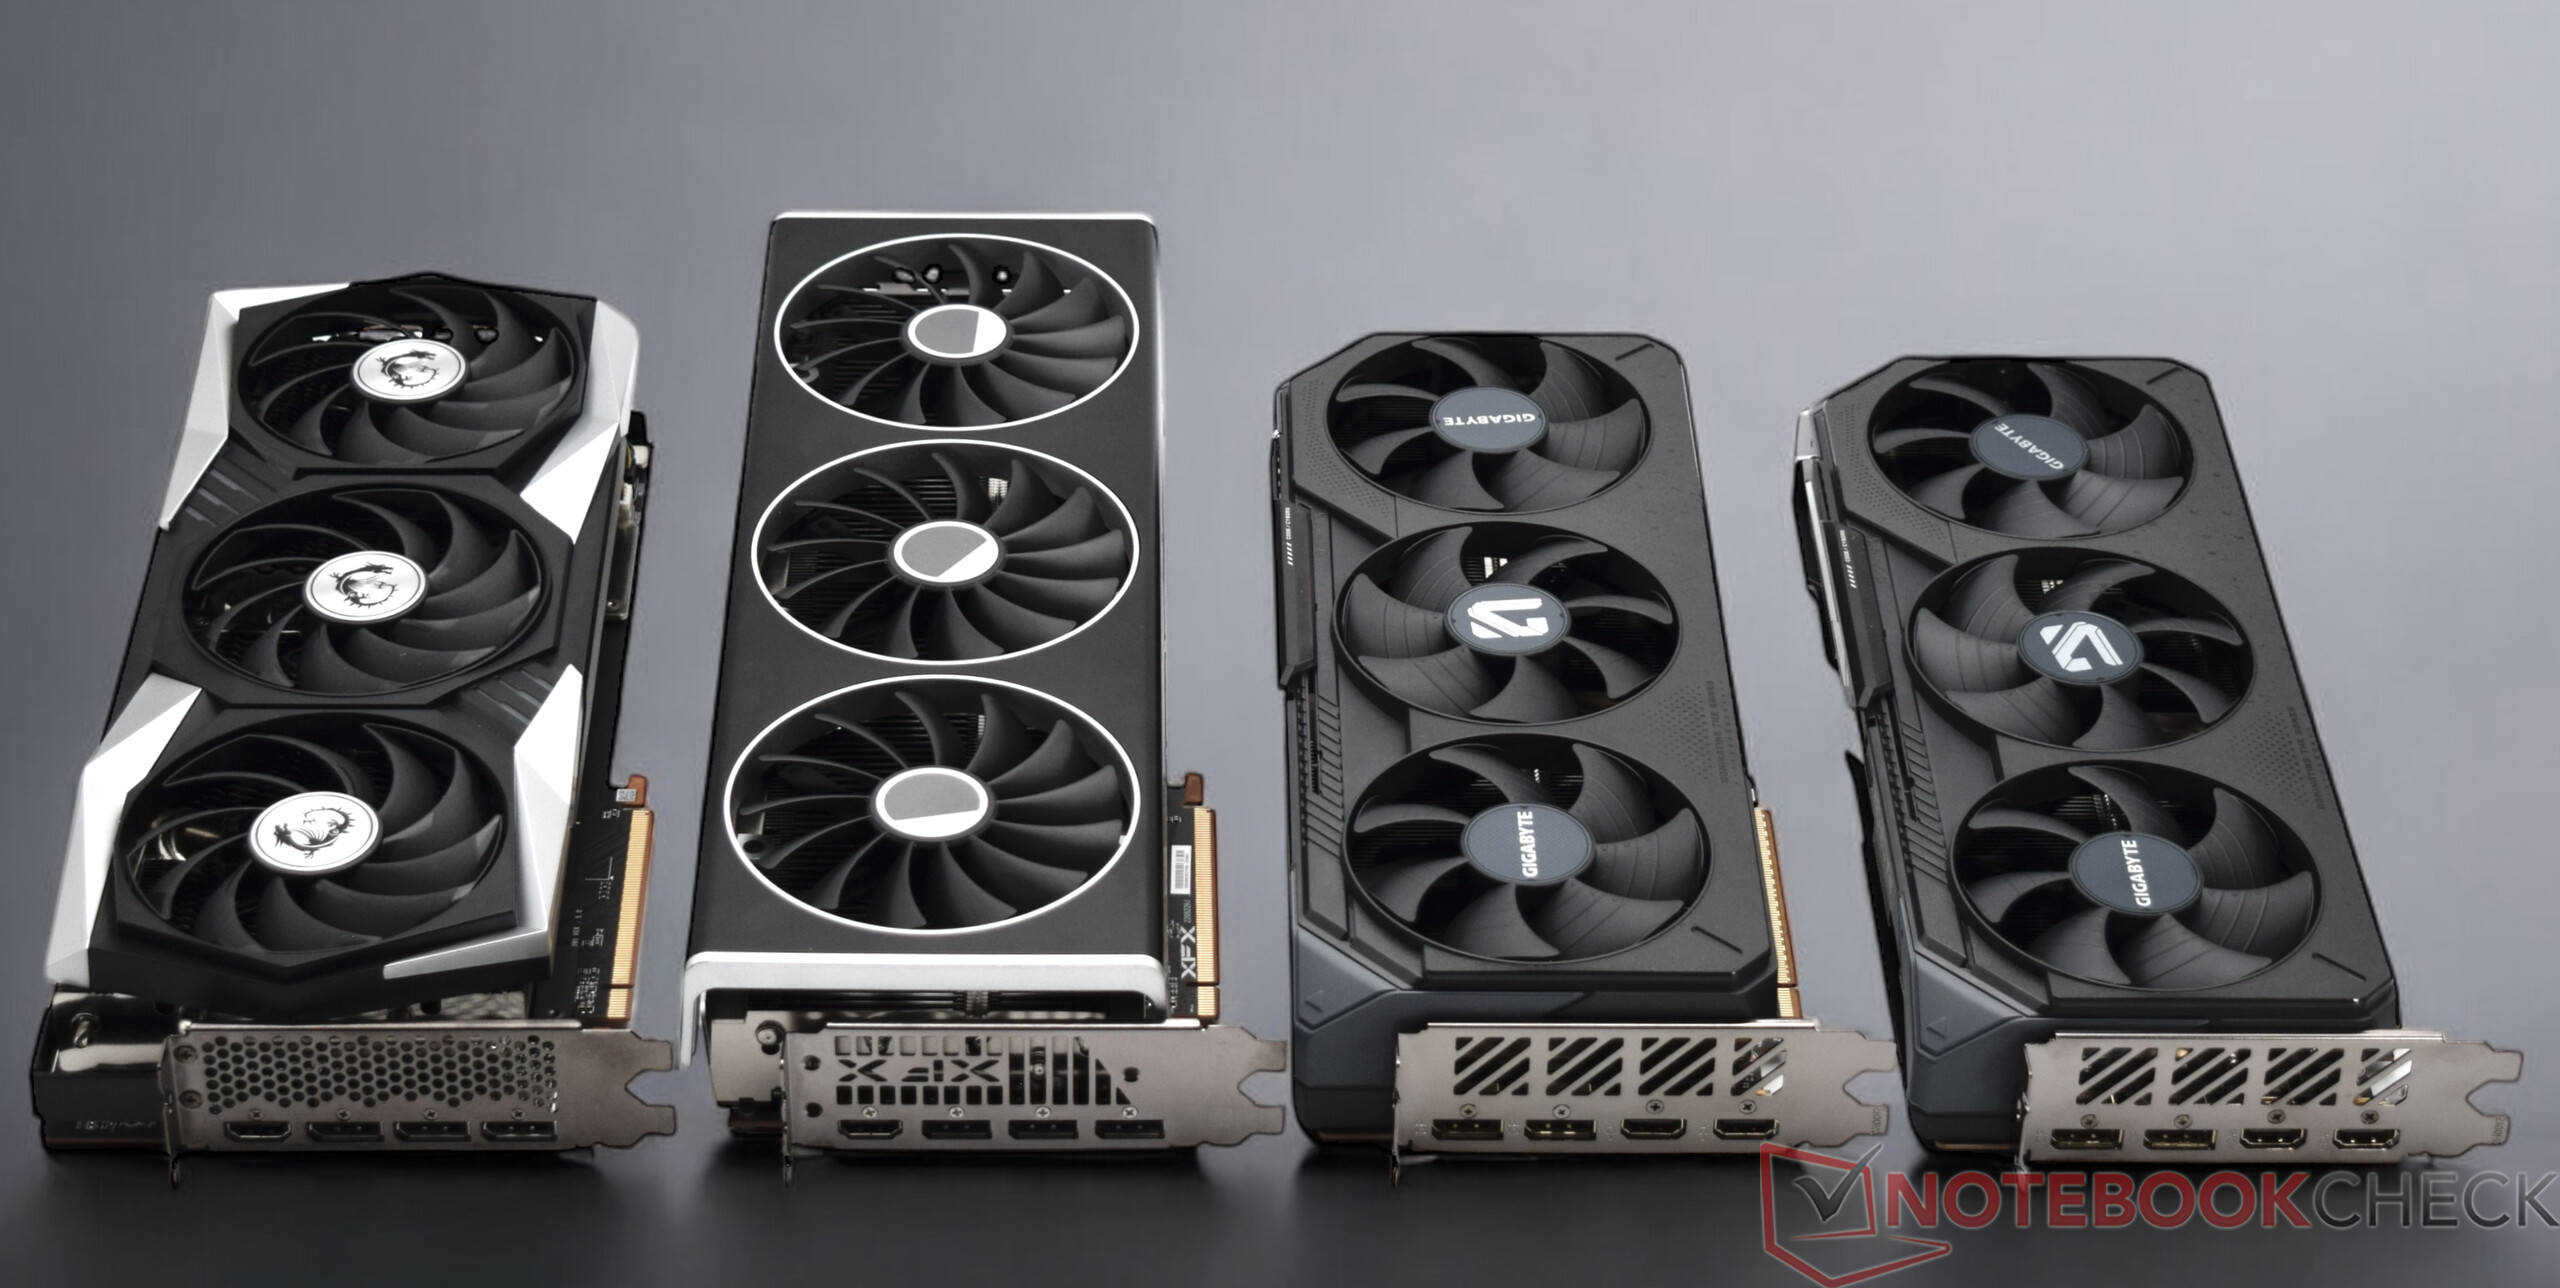
Both Gigabyte test models feature a similar cooling design, which differs in some details on closer inspection. The Gigabyte Radeon RX 9070 XT Gaming OC is equipped with a more powerful cooling system due to its higher power consumption, which didn't show any negative conspicuous features during our tests. Even so, the card wasn't completely silent and we measured a sound pressure level of 41.8 dB(A). Although the three fans generate an acceptable noise level, they are still slightly audible inside a closed case.
The Gigabyte Radeon RX 9070 Gaming OC also relies on a triple-fan design, although its heat sink and fin structure are more compact than on the XT model—a sensible adjustment in view of its lower power consumption. This also made itself noticeable during the noise level measurements: Under load, its noise development remained noticeably lower. In an open setup, we measured a sound pressure level of just 34.5 dB(A)—an excellent result for a powerful graphics card.
Gigabyte Radeon RX 9070 XT Gaming OC
Noise level
| Idle |
| 26.7 / 26.8 / 26.9 dB(A) |
| Load |
| 27.2 / 41.8 dB(A) |
 | ||
30 dB silent 40 dB(A) audible 50 dB(A) loud |
||
min: | ||
Gigabyte Radeon RX 9070 Gaming OC
Noise level
| Idle |
| 26.6 / 26.6 / 26.6 dB(A) |
| Load |
| 27.2 / 34.5 dB(A) |
|
| ||
30 dB silent 40 dB(A) audible 50 dB(A) loud |
||
min: | ||
Temperature
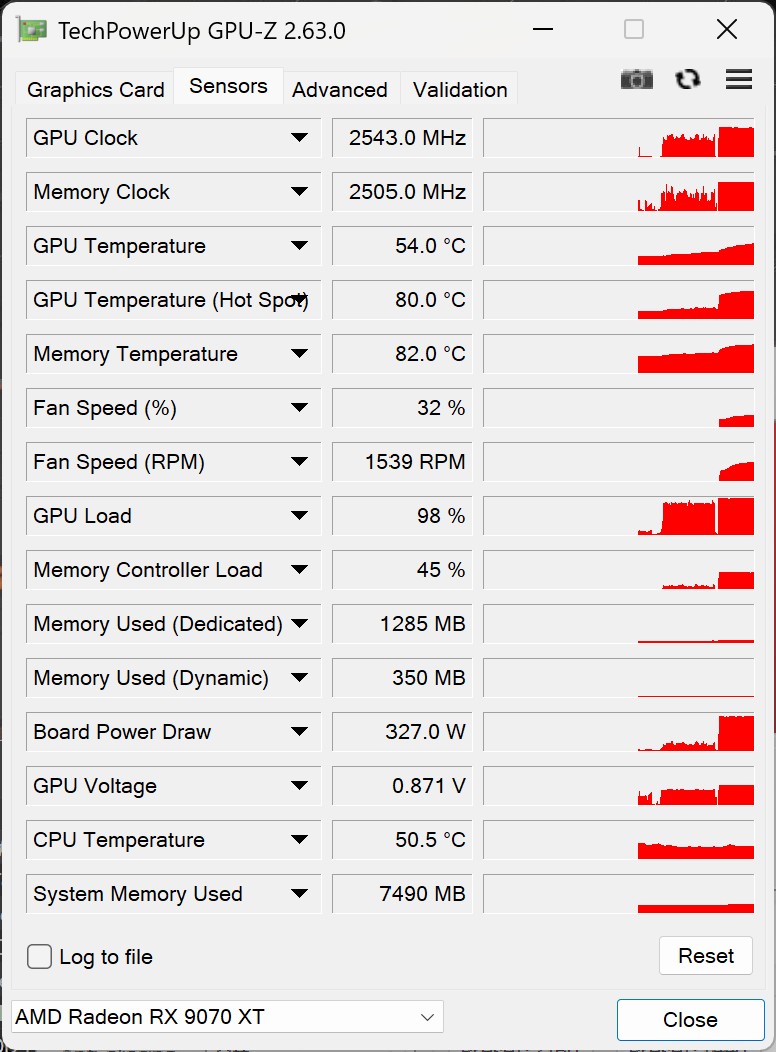
In view of the fact that the Gigabyte Radeon RX 9070 XT Gaming OC consumes significantly more than 300 watts under load, its built-in cooling initially seems quite compact. However, the stress test revealed that Gigabyte has heat management well under control: Both the GPU and the VRAM stayed within a controlled temperature range. Its maximum power consumption was kept stable over longer periods of time. The GPU hot spot reached 85 °C, while the VRAM only got slightly warmer at 88 °C. The VRAM's temperatures were similar in the non-XT model, but the GPU hot spot remained significantly cooler at a maximum of 76 °C.
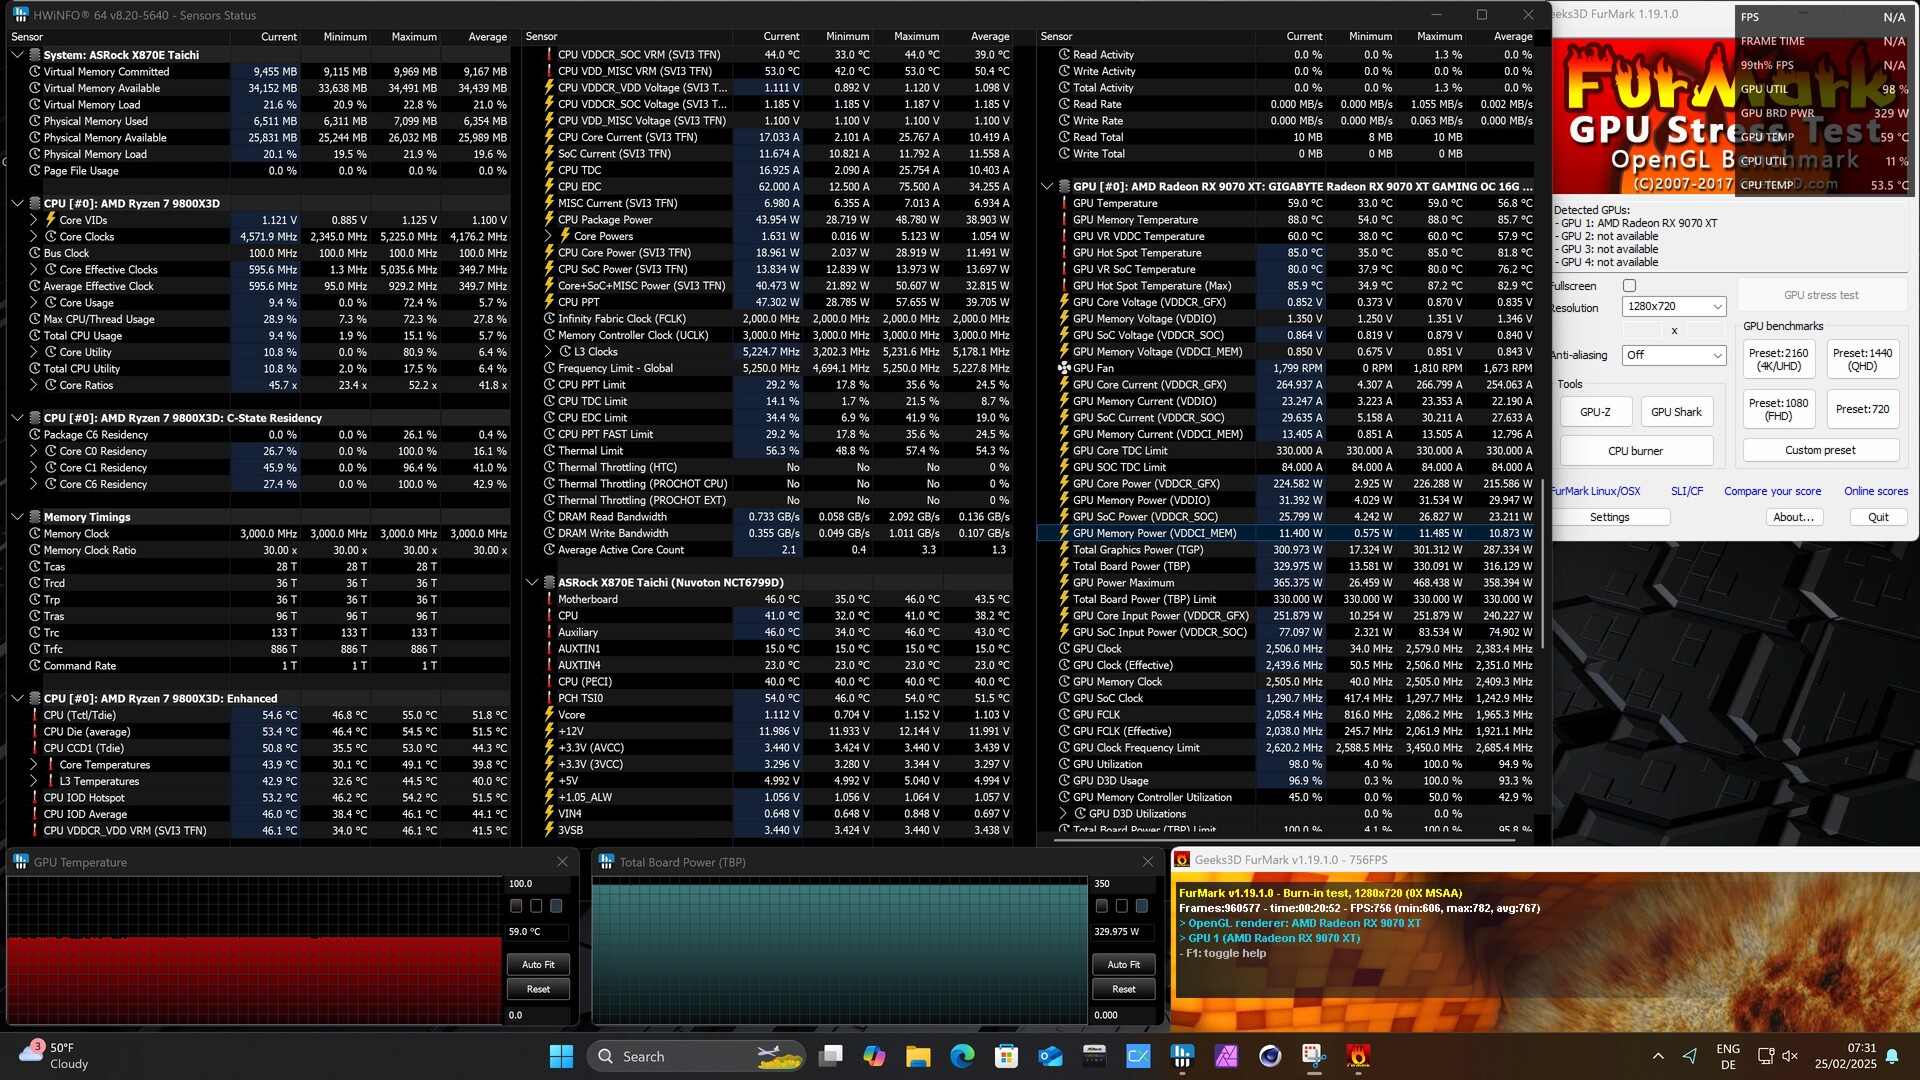
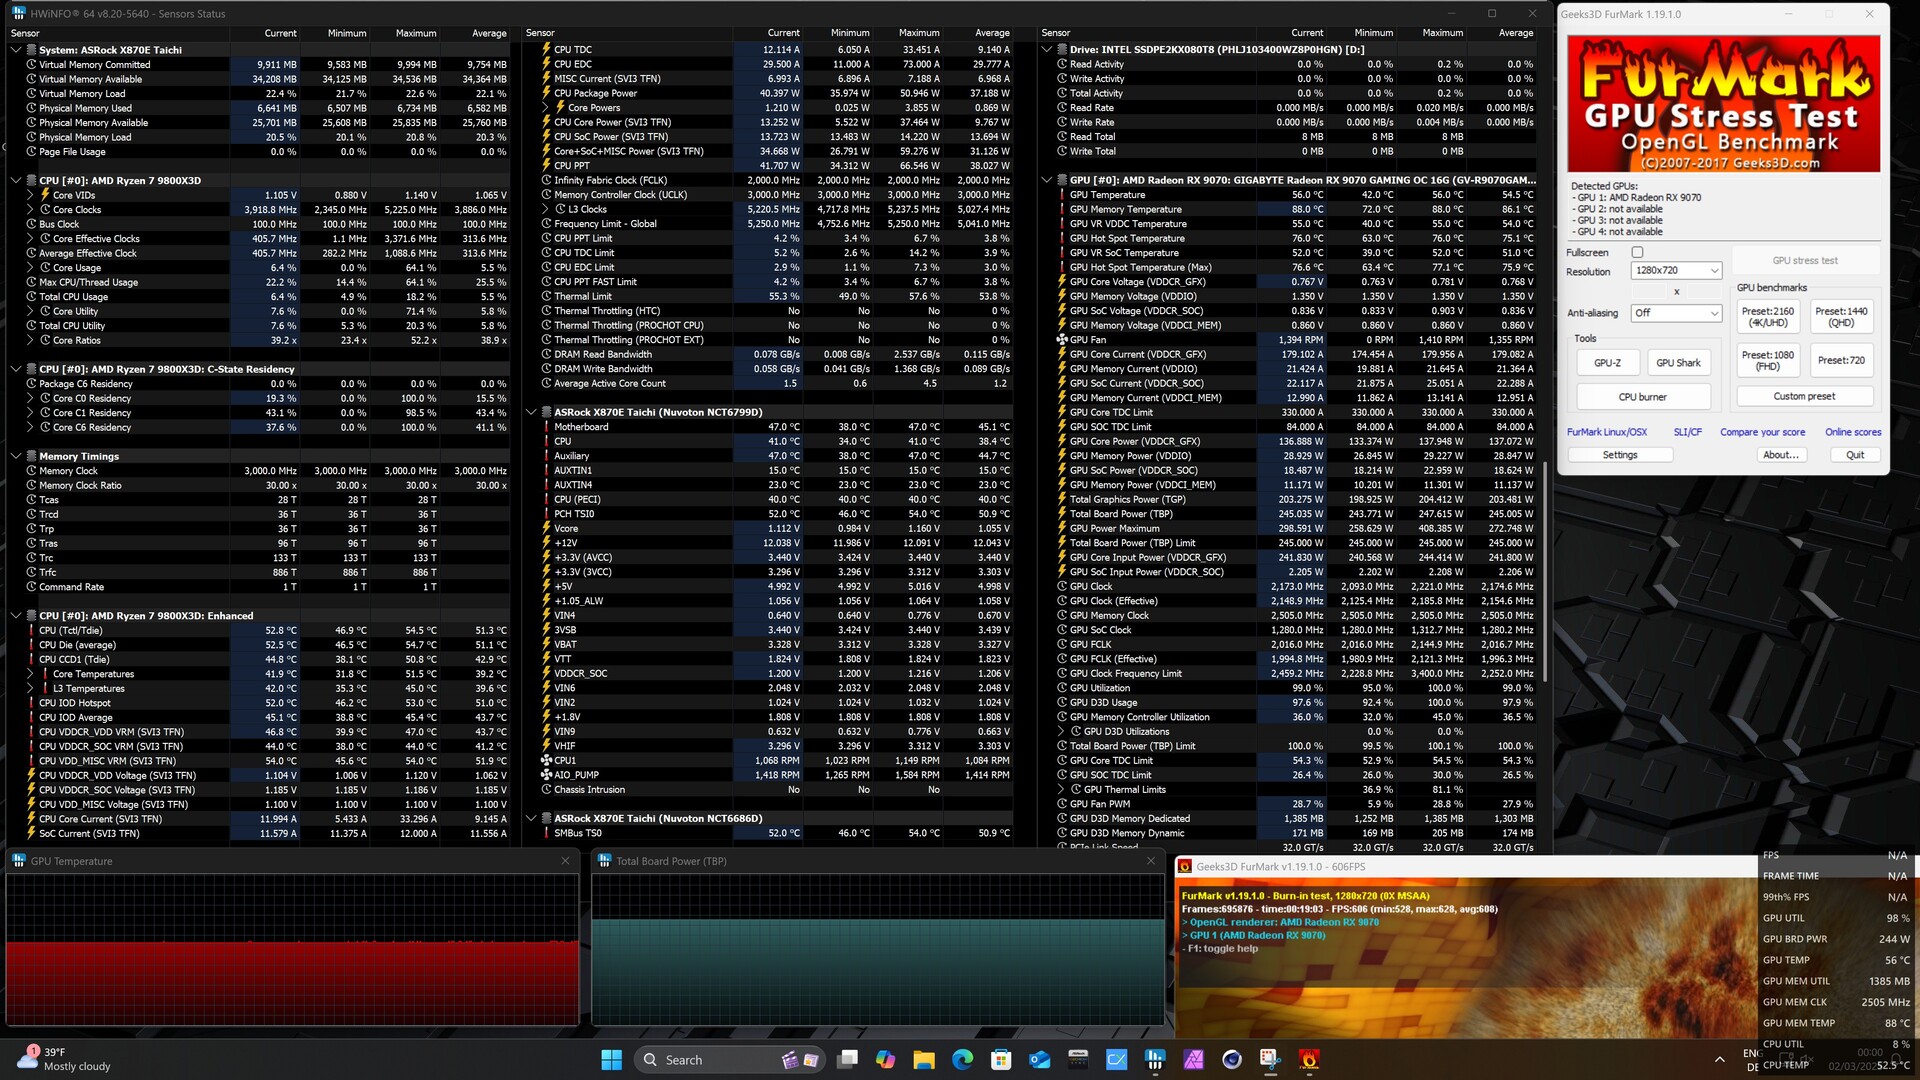
Power management - The AMD Radeon RX 9070 is a lot more frugal
| Power Consumption / FurMark 1.19 GPU Stress Test (external Monitor) | |
| Zotac Gaming GeForce RTX 5090 SOLID, AMD Ryzen 7 9800X3D | |
| Palit GeForce RTX 4090 GameRock OC, AMD Ryzen 7 9800X3D | |
| XFX Speedster MERC 310 Radeon RX 7900 XTX, AMD Ryzen 7 9800X3D | |
| Asus TUF Gaming GeForce RTX 5080 OC, AMD Ryzen 7 9800X3D | |
| AMD Radeon RX 9070 XT, AMD Ryzen 7 9800X3D | |
| Nvidia GeForce RTX 3090 FE, AMD Ryzen 7 9800X3D | |
| AMD Radeon RX 9070, AMD Ryzen 7 9800X3D | |
| Power Consumption / The Witcher 3 ultra (external Monitor) | |
| Zotac Gaming GeForce RTX 5090 SOLID, AMD Ryzen 7 9800X3D | |
| XFX Speedster MERC 310 Radeon RX 7900 XTX, AMD Ryzen 7 9800X3D | |
| Palit GeForce RTX 4090 GameRock OC, AMD Ryzen 7 9800X3D | |
| AMD Radeon RX 9070 XT, AMD Ryzen 7 9800X3D | |
| Nvidia GeForce RTX 3090 FE, AMD Ryzen 7 9800X3D | |
| Asus TUF Gaming GeForce RTX 5080 OC, AMD Ryzen 7 9800X3D | |
| AMD Radeon RX 9070, AMD Ryzen 7 9800X3D | |
| Power Consumption / Cyberpunk 2077 FHD ultra no FSR (external Monitor) | |
| Zotac Gaming GeForce RTX 5090 SOLID, AMD Ryzen 7 9800X3D | |
| Palit GeForce RTX 4090 GameRock OC, AMD Ryzen 7 9800X3D | |
| XFX Speedster MERC 310 Radeon RX 7900 XTX, AMD Ryzen 7 9800X3D | |
| AMD Radeon RX 9070 XT, AMD Ryzen 7 9800X3D | |
| Nvidia GeForce RTX 3090 FE, AMD Ryzen 7 9800X3D | |
| Asus TUF Gaming GeForce RTX 5080 OC, AMD Ryzen 7 9800X3D | |
| AMD Radeon RX 9070, AMD Ryzen 7 9800X3D | |
| Power Consumption / Witcher 3 ultra Efficiency (external Monitor) | |
| AMD Radeon RX 9070, AMD Ryzen 7 9800X3D | |
| Asus TUF Gaming GeForce RTX 5080 OC, AMD Ryzen 7 9800X3D | |
| Zotac Gaming GeForce RTX 5090 SOLID, AMD Ryzen 7 9800X3D | |
| Palit GeForce RTX 4090 GameRock OC, AMD Ryzen 7 9800X3D | |
| XFX Speedster MERC 310 Radeon RX 7900 XTX, AMD Ryzen 7 9800X3D | |
| AMD Radeon RX 9070 XT, AMD Ryzen 7 9800X3D | |
| Nvidia GeForce RTX 3090 FE, AMD Ryzen 7 9800X3D | |
| Power Consumption / Idle 1min (external Monitor) | |
| Zotac Gaming GeForce RTX 5090 SOLID, AMD Ryzen 7 9800X3D | |
| Palit GeForce RTX 4090 GameRock OC, AMD Ryzen 7 9800X3D | |
| XFX Speedster MERC 310 Radeon RX 7900 XTX, AMD Ryzen 7 9800X3D | |
| Nvidia GeForce RTX 3090 FE, AMD Ryzen 7 9800X3D | |
| Asus TUF Gaming GeForce RTX 5080 OC, AMD Ryzen 7 9800X3D | |
| AMD Radeon RX 9070, AMD Ryzen 7 9800X3D | |
| AMD Radeon RX 9070 XT, AMD Ryzen 7 9800X3D | |
* ... smaller is better
Power consumption with external monitor
Notebookcheck total rating
The Gigabyte Radeon RX 9070 XT Gaming OC and RX 9070 Gaming OC deliver strong gaming performance without compromising on quality settings. Although they don't quite reach the performance level of the AMD Radeon RX 7900 XTX, their attractive price-to-performance ratio makes them a serious alternative. This could become a challenge for Nvidia in particular, as the new models are putting the mid-range competition under noticeable pressure.
Transparency
The selection of devices to be reviewed is made by our editorial team. The test sample was provided to the author as a loan by the manufacturer or retailer for the purpose of this review. The lender had no influence on this review, nor did the manufacturer receive a copy of this review before publication. There was no obligation to publish this review. As an independent media company, Notebookcheck is not subjected to the authority of manufacturers, retailers or publishers.
This is how Notebookcheck is testing
Every year, Notebookcheck independently reviews hundreds of laptops and smartphones using standardized procedures to ensure that all results are comparable. We have continuously developed our test methods for around 20 years and set industry standards in the process. In our test labs, high-quality measuring equipment is utilized by experienced technicians and editors. These tests involve a multi-stage validation process. Our complex rating system is based on hundreds of well-founded measurements and benchmarks, which maintains objectivity. Further information on our test methods can be found here.

