The XPS 13 9370 has some of the slowest display response times for an Ultrabook
As manufacturers have told us time and time again, narrow display bezels require the use of special panels. The bezels of the XPS 13 9370 in particular are as narrow as they are partly because Dell was able to source compatible panels from Sharp for both its FHD and 4K UHD SKUs. Unfortunately for said panels, they suffer from an often overlooked characteristic when it comes to the Ultrabook form factor.
As our measurements and table below show, both the XPS 13 9370 FHD and 4K UHD displays have very slow response times for significantly more noticeable ghosting than your average notebook or desktop monitor. The black-to-white response time, for example, is about 23 ms on the new XPS 13 compared to 8 ms or faster on modern desktop monitors. Even competing Ultrabooks like the Asus Zenbook 13, Huawei Matebook X, Apple MacBook Pro 13, and older XPS 13 9360 have much faster black-to-white response times as low as 12 ms. Similarly, gray-to-gray response times are equally as slow on the new XPS 13 relative to other Ultrabooks in its size class.
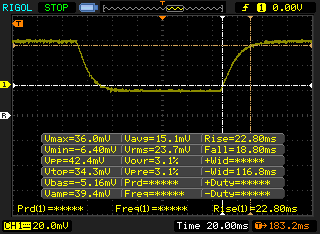
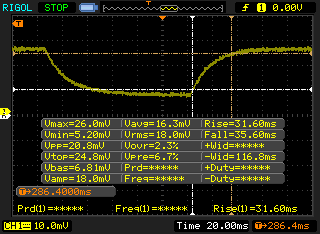
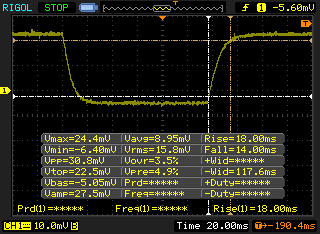
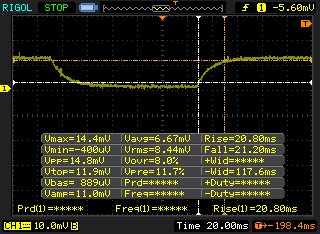
The result is a display that looks gorgeous in still shots because of its ultra-narrow bezels, deep contrast, wide color gamut, and bright backlight. Once in motion, however, the ghosting trails of the mouse cursor and blurrier movements become very apparent. It's certainly no consequence that Dell is explicitly advertising its new XPS 13 9370 with nearly full sRGB coverage, higher resolution options, a brighter 500-nit backlight, and a 23 percent narrower bezel than the XPS 13 9360 without a single word about the plodding black-to-white and gray-to-gray response times.
Do the disappointing response times alone preclude the XPS 13 9370 from being a solid purchase? Certainly not since the notebook is targeted more towards word processing, browsing, and video streaming where ghosting is less likely to distract from the experience. Nonetheless, it's an important aspect of the display that is frequently ignored and it just so happens to be worse on this latest XPS iteration compared to the older XPS 13 9360.
| Dell XPS 13 9370 i5 UHD ID: Sharp SHP148B, Name: LQ133D1, Dell P/N: 8XDHY, IPS, 13.3", 3840x2160 | Dell XPS 13 9370 FHD i5 SHP1484, IPS, 13.3", 1920x1080 | Dell XPS 13 9360 QHD+ i7 Sharp SHP144A, IPS, 13.3", 3200x1800 | Asus ZenBook 13 UX331UN B133HAN04.9, IPS LED, 13.3", 1920x1080 | Apple MacBook Pro 13 2017 APPA033, IPS, 13.3", 2560x1600 | Huawei MateBook X Chi Mei CMN8201 / P130ZDZ-EF1, , 13.3", 2160x1440 | |
|---|---|---|---|---|---|---|
| Display | -1% | -8% | -5% | 24% | -3% | |
| Display P3 Coverage (%) | 68.9 | 68.9 0% | 62.8 -9% | 65.4 -5% | 99.2 44% | 65.8 -4% |
| sRGB Coverage (%) | 98.4 | 96.6 -2% | 89.4 -9% | 93.1 -5% | 99.9 2% | 96.2 -2% |
| AdobeRGB 1998 Coverage (%) | 69.5 | 69.6 0% | 64.6 -7% | 66.4 -4% | 87.1 25% | 66.8 -4% |
| Response Times | -2% | 33% | 46% | 34% | 47% | |
| Response Time Grey 50% / Grey 80% * (ms) | 67.2 ? | 62.4 ? 7% | 43.6 ? 35% | 22.4 ? 67% | 42.8 ? 36% | 33 ? 51% |
| Response Time Black / White * (ms) | 41.6 ? | 45.6 ? -10% | 29.2 ? 30% | 31.2 ? 25% | 28.8 ? 31% | 24 ? 42% |
| PWM Frequency (Hz) | 2500 ? | 1008 ? | ||||
| Screen | 1% | -5% | -11% | 24% | 12% | |
| Brightness middle (cd/m²) | 496.4 | 428 -14% | 396.2 -20% | 338 -32% | 588 18% | 408 -18% |
| Brightness (cd/m²) | 469 | 405 -14% | 357 -24% | 321 -32% | 561 20% | 395 -16% |
| Brightness Distribution (%) | 84 | 87 4% | 84 0% | 90 7% | 92 10% | 88 5% |
| Black Level * (cd/m²) | 0.5 | 0.26 48% | 0.266 47% | 0.35 30% | 0.45 10% | 0.45 10% |
| Contrast (:1) | 993 | 1646 66% | 1489 50% | 966 -3% | 1307 32% | 907 -9% |
| Colorchecker dE 2000 * | 2.9 | 3.8 -31% | 3.9 -34% | 4.2 -45% | 1.7 41% | 1.55 47% |
| Colorchecker dE 2000 max. * | 5.26 | 7.2 -37% | 7.58 -44% | 6.5 -24% | 3.5 33% | 2.19 58% |
| Greyscale dE 2000 * | 3.9 | 4.4 -13% | 4.16 -7% | 3.9 -0% | 1.9 51% | 1.91 51% |
| Gamma | 2.066 106% | 2.21 100% | 2.31 95% | 2.43 91% | 2.33 94% | 2.34 94% |
| CCT | 7169 91% | 7067 92% | 6514 100% | 7144 91% | 6738 96% | 6491 100% |
| Color Space (Percent of AdobeRGB 1998) (%) | 63.9 | 62.8 -2% | 57.5 -10% | 60.4 -5% | 77.92 22% | 61 -5% |
| Color Space (Percent of sRGB) (%) | 98.2 | 96.4 -2% | 88.7 -10% | 93.1 -5% | 99.94 2% | 96 -2% |
| Total Average (Program / Settings) | -1% /
0% | 7% /
-1% | 10% /
-2% | 27% /
25% | 19% /
14% |
* ... smaller is better
Source(s)
Own
