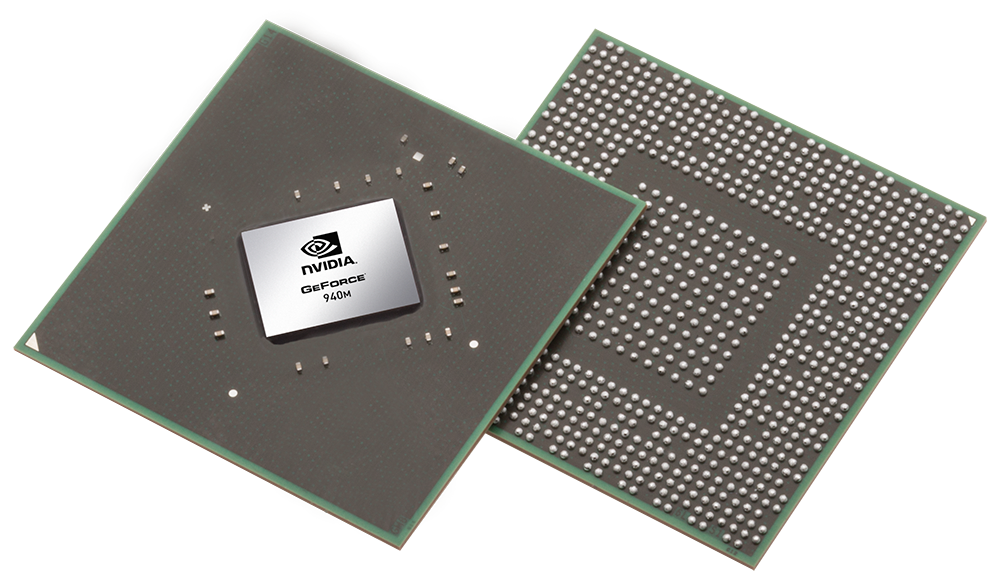
Notebook reviews with NVIDIA GeForce 940MX graphics card
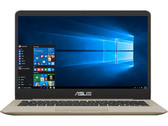
Asus VivoBook S14 S410UQ (i7-8550U, 940MX, Full HD) Laptop Review
The sum of its parts. Asus' good-looking VivoBook S14 comes with ample processing power thanks to the 8th-generation CPU and a dedicated - albeit low-end - grap...
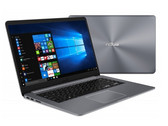
Intel Core i7-8550U | NVIDIA GeForce 940MX | 14.00" | 1.3 kgAsus VivoBook 15 Laptop (i5-8250U, GeForce 940MX, FHD) Review
Not quite grown up yet. The new VivoBook from Asus sounds promising: A new quad-core processor and a dedicated graphics unit are wrapped in a premium-looking ca...
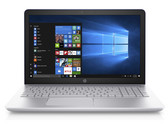
Intel Core i5-8250U | NVIDIA GeForce 940MX | 15.60" | 1.6 kgHP Pavilion 15t (i5-8250U, 940MX, FHD) Laptop Review
Disappointing display. The Pavilion 15 offers a ULV quad-core processor, a dedicated GeForce graphics core, and a solid-state disk. The greatest weakness of thi...
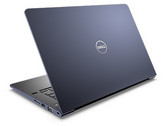
Intel Core i5-8250U | NVIDIA GeForce 940MX | 15.60" | 1.8 kgDell Vostro 15 5568 (i7-7500U, 940MX) Laptop Review
New assets, old shortcomings. We already announced in January that Dell was planning to offer the Vostro 15 5568 with other processors and a dedicated graphics ...
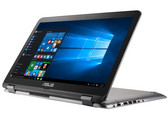
Intel Core i7-7500U | NVIDIA GeForce 940MX | 15.60" | 1.9 kgAsus VivoBook Flip 15 TP501UQ (i5-7200U, 940MX, FHD) Convertible Review
Multi-functional. The VivoBook Flip 15 comes with a variety of features, but it also comes with some small flaws. The screen with a 360-degree hinge offers seve...
Intel Core i5-7200U | NVIDIA GeForce 940MX | 15.60" | 2.2 kgDell Inspiron 15 7570: Intel Core i7-8550U, 15.60", 2 kg
Review » Dell Inspiron 15 7570 (i7-8550U, 940MX) Laptop Review
Lenovo IdeaPad 320-15IKB 80XL01NEGE: Intel Core i5-7200U, 15.60", 2.2 kg
Review » Lenovo IdeaPad 320-15IKB (7200U, 940MX, FHD) Laptop Review
Asus Vivobook S15 S510UQ-BQ189T: Intel Core i5-7200U, 15.60", 1.7 kg
Review » Asus VivoBook S15 S510UQ (i5-7200U, 940MX) Laptop Review
Lenovo ThinkPad 25: Intel Core i7-7500U, 14.00", 1.7 kg
Review » Lenovo ThinkPad 25 Anniversary Edition Laptop Review
Huawei MateBook D 15, i7-7500U 940MX: Intel Core i7-7500U, 15.60", 1.8 kg
Review » Huawei MateBook D (i7-7500U, GeForce 940MX) Laptop Review
Lenovo IdeaPad 520s-14IKB 80X200C1GE: Intel Core i5-7200U, 14.00", 1.6 kg
Review » Lenovo IdeaPad 520s-14IKB (Core i5-7200U, 940MX) Laptop Review
HP Pavilion x360 14-ba011ng: Intel Core i5-7200U, 14.00", 1.7 kg
Review » HP Pavilion x360 14t (7200U, 940MX, FHD) Convertible Review
Asus Zenbook UX3430UQ-GV012T: Intel Core i7-7500U, 14.00", 1.3 kg
Review » Asus Zenbook UX3430UQ (7500U, 940MX, 512 GB) Laptop Review
Samsung Notebook 9 NP900X5N-X01US: Intel Core i7-7500U, 15.00", 1.2 kg
Review » Samsung Notebook 9 NP900X5N (7500U, FHD, GeForce 940MX) Laptop Review
Lenovo ThinkPad T470p-20J7S00000 : Intel Core i7-7700HQ, 14.00", 1.9 kg
Review » Lenovo ThinkPad T470p (Core i7, GeForce 940MX) Laptop Review
Asus Zenbook UX3410UQ-GV077T: Intel Core i7-7500U, 14.00", 1.4 kg
Review » Asus ZenBook UX3410UQ (7500U, 940MX, Full HD) Laptop Review
Acer TravelMate P658-G2-MG-7327: Intel Core i7-7500U, 15.60", 2.1 kg
Review » Acer TravelMate P658-G2 (7500U, 940MX, FHD) Laptop Review
Lenovo ThinkPad T570-20HAS01E00: Intel Core i7-7500U, 15.60", 2 kg
Review » Lenovo ThinkPad T570 (Core i7, 4K, 940MX) Laptop Review
Asus AsusPro P4540UQ-FY0056R: Intel Core i5-7200U, 15.60", 2.4 kg
Review » Asus ASUSPRO P4540UQ (7200U, 940MX, Full-HD) Laptop Review
Asus UX310UQ-FC396T: Intel Core i7-7500U, 13.30", 1.5 kg
Review » Asus ZenBook UX310UQ (7500U, 940MX, Full HD) Notebook Review
Asus Vivobook F556UQ-XO626D: Intel Core i5-6198DU, 15.60", 2.3 kg
Review » Asus Vivobook F556UQ-XO626D Notebook Review
HP Spectre x360 15-bl002xx: Intel Core i7-7500U, 15.60", 2 kg
Review » HP Spectre x360 15-bl002xx Convertible Review
Lenovo IdeaPad 710S Plus-13IKB: Intel Core i7-7500U, 13.30", 1.1 kg
Review » Lenovo IdeaPad 710S Plus (Core i7) Subnotebook Review
MSI CX62 7QL: Intel Core i5-7200U, 15.60", 2.2 kg
Review » MSI CX62 7QL Notebook Review
Lenovo ThinkPad E470-20H2S00400: Intel Core i5-7200U, 14.00", 1.9 kg
Review » Lenovo ThinkPad E470 (Core i5, GeForce 940MX) Notebook Review
Acer TravelMate P259-MG-71UU: Intel Core i7-6500U, 15.60", 2.3 kg
Review » Acer TravelMate P259-MG-71UU Notebook Review
HP Pavilion 15t-au100 CTO (W0P31AV): Intel Core i7-7500U, 15.60", 2.1 kg
Review » HP Pavilion 15t-au100 (W0P31AV) Notebook Review
Asus Zenbook UX310UQ-GL011T: Intel Core i7-6500U, 13.30", 1.5 kg
Review » Asus ZenBook UX310UQ-GL011T Notebook Review
MSI CX72-7QLi581: Intel Core i5-7200U, 17.30", 2.8 kg
Review » MSI CX72-7QLi581 Notebook Review
Lenovo IdeaPad 510-15IKB 80SV0087GE: Intel Core i7-7500U, 15.60", 2.2 kg
Review » Lenovo IdeaPad 510-15IKB Notebook Review
Xiaomi Mi Notebook Air 13.3 2016: Intel Core i5-6200U, 13.30", 1.3 kg
Review » Xiaomi Mi Air (13.3-inch) Notebook Review
Lenovo Ideapad 510-15ISK: Intel Core i5-6200U, 15.60", 2.2 kg
Review » Lenovo IdeaPad 510-15ISK Notebook Review
Acer Aspire E5-774G-78NA: Intel Core i7-6500U, 17.30", 3 kg
Review » Acer Aspire E5-774G-78NA (GeForce 940MX GDDR5) Notebook Review
Dell Inspiron 17 7778: Intel Core i7-6500U, 17.30", 2.8 kg
Review » Dell Inspiron 17 7778 Convertible Review
HP Pavilion 14-al003ng: Intel Core i5-6200U, 14.00", 1.5 kg
Review » HP Pavilion 14-al003ng Notebook Review
Lenovo Yoga 710-14ISK: Intel Core i5-6200U, 14.00", 1.6 kg
Review » Lenovo Yoga 710-14ISK Convertible Review
Asus VivoBook X556UQ-XO076T: Intel Core i5-6200U, 15.60", 2.3 kg
Review » Asus VivoBook X556UQ-XO076T Notebook Review
Lenovo ThinkPad T560-20FH002RGE: Intel Core i7-6600U, 15.60", 2.3 kg
Review » Lenovo ThinkPad T560 (Core i7, 940MX, 3K) Notebook Review
Lenovo ThinkPad T460p-20FXS05500: Intel Core i7-6700HQ, 14.00", 1.9 kg
Review » Lenovo ThinkPad T460p (Core i7, GeForce 940MX) Notebook Review
MSI CX72 6QD: Intel Core i7-6700HQ, 17.30"
Review » Nvidia GeForce 940MX DDR3 Review - inside the MSI CX72
HP Pavilion 14-bf013ns: Intel Core i7-7500U, 14.00", 1.5 kg
External Review » HP Pavilion 14-bf013ns
Dell Inspiron 15 7570-0CH38: Intel Core i5-8250U, 15.60", 2 kg
External Review » Dell Inspiron 15 7570-0CH38
HP Pavilion 14-bf105ns: Intel Core i5-8250U, 14.00", 1.6 kg
External Review » HP Pavilion 14-bf105ns
HP Pavilion 15-ck007ns: Intel Core i7-8550U, 15.60", 1.9 kg
External Review » HP Pavilion 15-ck007ns
Asus Vivobook 17 A705UQ-BX109T: Intel Core i5-8250U, 17.30", 2.1 kg
External Review » Asus Vivobook 17 A705UQ-BX109T
Lenovo Ideapad 320-15IKB-80XL03L4SP: Intel Core i3-7130U, 15.60", 2.2 kg
External Review » Lenovo Ideapad 320-15IKB-80XL03L4SP
Asus VivoBook S15 S510UQ-BQ702T: Intel Core i7-8550U, 15.60", 1.7 kg
External Review » Asus VivoBook S15 S510UQ-BQ702T
HP Pavilion 14-bf108ns: Intel Core i7-8550U, 14.00", 1.5 kg
External Review » HP Pavilion 14-bf108ns
Lenovo Yoga 520-14IKB-80X8006KSP: Intel Core i5-7200U, 14.00", 1.8 kg
External Review » Lenovo Yoga 520-14IKB-80X8006KSP
HP Pavilion 14-bf014ns: Intel Core i7-7500U, 14.00", 1.5 kg
External Review » HP Pavilion 14-bf014ns
Lenovo Yoga 520-14IKB-80X8006LSP: Intel Core i3-7100U, 14.00", 1.8 kg
External Review » Lenovo Yoga 520-14IKB-80X8006LSP
HP Pavilion 15-cc504ur: Intel Core i5-7200U, 15.60", 1.9 kg
External Review » HP Pavilion 15-cc504ur
HP Pavilion 15-ck015ns: Intel Core i5-8250U, 15.60", 1.8 kg
External Review » HP Pavilion 15-ck015ns
Lenovo Ideapad 520-15IKB-80YL00MNSP: Intel Core i7-7500U, 15.60", 2.2 kg
External Review » Lenovo Ideapad 520-15IKB-80YL00MNSP
Asus X756UQ-TY355T: Intel Core i5-7200U, 17.30", 2.7 kg
External Review » Asus X756UQ-TY355T
Asus VivoBook S15 S510UQ-BQ178T: Intel Core i5-7200U, 15.60", 1.7 kg
External Review » Asus VivoBook S15 S510UQ-BQ178T
Lenovo IdeaPad 320-15IKB 80XL01NEGE: Intel Core i5-7200U, 15.60", 2.2 kg
External Review » Lenovo IdeaPad 320-15IKB 80XL01NEGE
Lenovo Ideapad 520-15IKB-80YL00MMSP: Intel Core i5-7200U, 15.60", 2.2 kg
External Review » Lenovo Ideapad 520-15IKB-80YL00MMSP
Lenovo Ideapad 320-15IKBN-80XL02U2SP: Intel Core i7-7500U, 15.60", 2.2 kg
External Review » Lenovo Ideapad 320-15IKBN-80XL02U2SP
Asus A442UQ-FA020T : Intel Core i7-7500U, 14.00", 1.8 kg
External Review » Asus A442UQ-FA020T
Acer Aspire E5-576G-36WC: Intel Core i3-7130U, 15.60", 2.1 kg
External Review » Acer Aspire E5-576G-36WC
HP Pavilion 14-ba140ns x360: Intel Core i7-8550U, 14.00", 1.6 kg
External Review » HP Pavilion 14-ba140ns x360
Lenovo Yoga 3-14-80JH00QYSP: Intel Core i3-5005U, 14.00", 1.6 kg
External Review » Lenovo Yoga 3-14-80JH00QYSP
Acer Aspire 5 A515-51G-51LK: Intel Core i5-7200U, 15.60", 2.2 kg
External Review » Acer Aspire 5 A515-51G-51LK
Medion Akoya P7645-30022215: Intel Core i5-7200U, 17.30", 2.7 kg
External Review » Medion Akoya P7645-30022215
Lenovo ThinkPad T560-20FH002RGE: Intel Core i7-6600U, 15.60", 2.3 kg
External Review » Lenovo ThinkPad T560-20FH002RGE
HP Pavilion 14-bf106ns: Intel Core i5-8250U, 14.00", 1.6 kg
External Review » HP Pavilion 14-bf106ns
Dell Vostro 15 5568-V4F8F: Intel Core i7-7500U, 15.60", 2 kg
External Review » Dell Vostro 15 5568-V4F8F
Asus UX410UQ-GV045R: Intel Core i7-7500U, 14.00", 1.4 kg
External Review » Asus UX410UQ-GV045R
Acer Aspire 5 A515-51G-35NN: Intel Core i3-6006U, 15.60", 2.2 kg
External Review » Acer Aspire 5 A515-51G-35NN
HP Pavilion 14-ba139ns x360: Intel Core i5-8250U, 14.00", 1.6 kg
External Review » HP Pavilion 14-ba139ns x360
Asus VivoBook Flip 15 TP510UQ-E8033T: Intel Core i5-8250U, 15.60", 1.9 kg
External Review » Asus VivoBook Flip 15 TP510UQ-E8033T
HP Pavilion 15-cc108ng: Intel Core i7-8550U, 15.60", 1.8 kg
External Review » HP Pavilion 15-cc108ng
Asus X542UQ-DM284: Intel Core i5-7200U, 15.60", 2.2 kg
External Review » Asus X542UQ-DM284
Lenovo IdeaPad 520s-14IKB 80X200C1GE: Intel Core i5-7200U, 14.00", 1.6 kg
External Review » Lenovo IdeaPad 520s-14IKB 80X200C1GE
Asus VivoBook X510UQ-BR594T: Intel Core i5-8250U, 15.60", 1.7 kg
External Review » Asus VivoBook X510UQ-BR594T
HP Pavilion 15-au120tx: Intel Core i5-7200U, 15.60", 2 kg
External Review » HP Pavilion 15-au120tx
Asus X542UQ: Intel Core i3-7100U, 15.60", 2.2 kg
External Review » Asus X542UQ
Lenovo IdeaPad 520s-14IKB-80X2002VCK: Intel Core i7-7500U, 14.00", 1.7 kg
External Review » Lenovo IdeaPad 520s-14IKB-80X2002VCK
HP Pavilion 15-cc509nh: Intel Core i5-7200U, 15.60", 1.9 kg
External Review » HP Pavilion 15-cc509nh
HP Pavilion 14-ba009ne x360: Intel Core i5-7200U, 14.00", 1.7 kg
External Review » HP Pavilion 14-ba009ne x360
Lenovo IdeaPad Flex 5 1570-80XB0000US: Intel Core i7-7500U, 15.60", 2 kg
External Review » Lenovo Flex 5 1570-80XB0000US
Lenovo IdeaPad 320-15IKB-80XL03AUIN: Intel Core i5-7200U, 15.60", 2.2 kg
External Review » Lenovo IdeaPad 320-15IKB-80XL03AUIN
Dell Latitude 5580-X1W6W: Intel Core i7-7820HQ, 15.60", 2.2 kg
External Review » Dell Latitude 5580-X1W6W
HP Pavilion 14-bf104ns: Intel Core i5-8250U, 14.00", 1.5 kg
External Review » HP Pavilion 14-bf104ns
Asus VivoBook S510UQ-BQ323T: Intel Core i5-7200U, 15.60", 1.7 kg
External Review » Asus VivoBook S510UQ-BQ323T
HP Envy x360 15-bp008ng: Intel Core i7-7500U, 15.60", 2.2 kg
External Review » HP Envy x360 15-bp008ng
HP Pavilion 15-cc508ns: Intel Core i5-7200U, 15.60", 1.9 kg
External Review » HP Pavilion 15-cc508ns
Acer Aspire E5-575G-56X9: Intel Core i5-7200U, 15.60", 2.2 kg
External Review » Acer Aspire E5-575G-56X9
HP Pavilion 15-ck001ns: Intel Core i5-8250U, 15.60", 1.8 kg
External Review » HP Pavilion 15-ck001ns
Acer Aspire F5 573G-71S6: Intel Core i7-7500U, 15.60", 2.3 kg
External Review » Acer Aspire F5 573G-71S6
Asus VivoBook S510UQ-BQ322T: Intel Core i5-7200U, 15.60", 1.6 kg
External Review » Asus VivoBook S510UQ-BQ322T
HP Pavilion 14-bf009ns: Intel Core i5-7200U, 14.00", 1.5 kg
External Review » HP Pavilion 14-bf009ns
HP Pavilion 14-Bf009Ur: Intel Core i7-7500U, 14.00", 1.6 kg
External Review » HP Pavilion 14-Bf009Ur
Asus K556UQ-XO431T: Intel Core i5-6200U, 15.60", 2.4 kg
External Review » Asus K556UQ-XO431T
Acer Aspire E5-575G-55XS: Intel Core i5-7200U, 15.60", 2.2 kg
External Review » Acer Aspire E5-575G-55XS
Dell Inspiron 15 7570: Intel Core i7-8550U, 15.60", 2 kg
External Review » Dell Inspiron 15-7570
Acer Aspire 5 A515-51G-54T5: Intel Core i5-7200U, 15.60", 2.2 kg
External Review » Acer Aspire 5 A515-51G-54T5
Lenovo Ideapad 320-15IKBN-80XL02U4SP: Intel Core i5-7200U, 15.60", 2.2 kg
External Review » Lenovo Ideapad 320-15IKBN-80XL02U4SP
Asus Vivobook S15 S510UQ-BQ189T: Intel Core i5-7200U, 15.60", 1.7 kg
External Review » Asus Vivobook S15 S510UQ-BQ189T
Lenovo ThinkPad 25: Intel Core i7-7500U, 14.00", 1.7 kg
External Review » Lenovo ThinkPad 25
HP Pavilion 14-BF007NS: Intel Core i7-7500U, 14.00", 1.6 kg
External Review » HP Pavilion 14-BF007NS
HP Pavilion 15-cc509ns: Intel Core i5-7200U, 15.60", 1.8 kg
External Review » HP Pavilion 15-cc509ns
Lenovo IdeaPad 320-15IKB-80XL0053RK: Intel Core i5-7200U, 15.60", 2 kg
External Review » Lenovo IdeaPad 320-15IKB-80XL0053RK
Lenovo Yoga 520-14-80X8001URK: Intel Core i3-7100U, 14.00", 1.7 kg
External Review » Lenovo Yoga 520-14-80X8001URK
Lenovo IdeaPad Flex 5 14-80XA0009US: Intel Core i7-7500U, 14.00", 1.7 kg
External Review » Lenovo Flex 5 14-80XA0009US
HP Pavilion x360 14-ba073TX: Intel Core i5-7200U, 14.00", 1.6 kg
External Review » HP Pavilion x360 14-ba073TX
Acer Aspire E5-575G-36VF: Intel Core i3-6006U, 15.60", 2.4 kg
External Review » Acer Aspire E5-575G-36VF
Samsung Notebook 7 Spin NP740U5L-Y03US: Intel Core i7-6500U, 15.60", 1.8 kg
External Review » Samsung Notebook 7 Spin NP740U5L-Y03US
Lenovo IdeaPad 720S-80XC004NGE: Intel Core i7-7500U, 14.00", 1.6 kg
External Review » Lenovo IdeaPad 720S-80XC004NGE
Lenovo IdeaPad 720S-80XC003RGE: Intel Core i5-7200U, 14.00", 1.6 kg
External Review » Lenovo IdeaPad 720S-80XC003RGE
Acer Aspire 5 A515-51G-52R1: Intel Core i5-7200U, 15.60", 2.1 kg
External Review » Acer Aspire 5 A515-51G-52R1
Asus UX310UQ-FC396T: Intel Core i7-7500U, 13.30", 1.5 kg
External Review » Asus UX310UQ-FC396T
Lenovo IdeaPad Flex 5 15-80XB0014US: Intel Core i7-7500U, 15.60", 2 kg
External Review » Lenovo Flex 5 15-80XB0014US
Acer Aspire 5 A515-51G-58AM: Intel Core i5-7200U, 15.60", 2.1 kg
External Review » Acer Aspire 5 A515-51G-58AM
HP Envy 15-bp030nd x360: Intel Core i7-7500U, 15.60", 2.2 kg
External Review » HP Envy 15-bp030nd x360
HP Pavilion 15-cc593nd: Intel Core i5-7200U, 15.60", 1.9 kg
External Review » HP Pavilion 15-cc593nd
HP Pavilion x360 14-ba043nd: Intel Core i7-7500U, 14.00", 1.6 kg
External Review » HP Pavilion x360 14-ba043nd
Asus UX410UQ-GV109T: Intel Core i7-7500U, 14.00", 1.5 kg
External Review » Asus UX410UQ-GV109T
Asus VivoBook S15 S510UQ-BQ165T: Intel Core i7-7500U, 15.60", 2 kg
External Review » Asus VivoBook S15 S510UQ-BQ165T
HP Pavilion x360 14-ba028ns: Intel Core i5-7200U, 14.00", 1.6 kg
External Review » HP Pavilion x360 14-ba028ns
HP Pavilion 15-au111nt: Intel Core i5-7200U, 15.60", 2 kg
External Review » HP Pavilion 15-au111nt
Acer Aspire E5-575G-73CN: Intel Core i7-7500U, 15.60", 2.2 kg
External Review » Acer Aspire E5-575G-73CN
Asus Vivobook S15 S510UQ-BR180T: Intel Core i7-7500U, 15.60", 1.7 kg
External Review » Asus Vivobook S15 S510UQ-BR180T
Asus Vivobook S15 S510UQ-BQ182T: Intel Core i7-7500U, 15.60", 1.7 kg
External Review » Asus Vivobook S15 S510UQ-BQ182T
HP Pavilion 14-bf015ns: Intel Core i7-7500U, 14.00", 1.5 kg
External Review » HP Pavilion 14-bf015ns
Lenovo ThinkPad T470p-20J60018MH: Intel Core i7-7700HQ, 14.00", 2 kg
External Review » Lenovo ThinkPad T470p-20J60018MH
Acer Aspire E5-575G-57D4: Intel Core i5-7200U, 15.60", 2.4 kg
External Review » Acer Aspire E5-575G-57D4
MSI CX72 6QD-080XES: Intel Core i7-6700HQ, 17.30", 2.8 kg
External Review » MSI CX72 6QD-080XES
HP Pavilion 14-ba028n x360: Intel Core i5-7200U, 14.00", 1.6 kg
External Review » HP Pavilion 14-ba028n x360
Acer Aspire E5-575G-50AL: Intel Core i5-7200U, 15.60", 2.4 kg
External Review » Acer Aspire E5-575G-50AL
Lenovo Ideapad 510-15IKB-80SV00QVGE: Intel Core i7-7500U, 15.60", 2.2 kg
External Review » Lenovo Ideapad 510-15IKB-80SV00QVGE
Asus Zenbook U5100UQ: Intel Core i7-7500U, 15.60", 1.6 kg
External Review » Asus Zenbook U5100UQ
Asus Zenbook U4100UQ: Intel Core i7-7500U, 14.00", 1.3 kg
External Review » Asus Zenbook U4100UQ
Medion Akoya P6677-MD60283: Intel Core i7-7500U, 15.60", 2.3 kg
External Review » Medion Akoya P6677-MD60283
HP Spectre x360 15-bl001ng: Intel Core i7-7500U, 15.60", 2 kg
External Review » HP Spectre x360 15-bl001ng
Acer Aspire F15 F5-573G-7420: Intel Core i7-7500U, 15.60", 2.3 kg
External Review » Acer Aspire F15 F5-573G-7420
Asus ZenBook UX430UQ-PURE4: Intel Core i7-7500U, 14.00", 1.3 kg
External Review » Asus ZenBook UX430UQ-PURE4
Asus ZenBook Flip UX560UQ 2017: Intel Core i7-7500U, 15.60", 2.3 kg
External Review » Asus ZenBook Flip UX560UQ 2017
Huawei MateBook D 15, i7-7500U 940MX: Intel Core i7-7500U, 15.60", 1.8 kg
External Review » Huawei MateBook D
Acer Aspire E5-575G-598W: Intel Core i5-7200U, 15.60", 2.4 kg
External Review » Acer Aspire E5-575G-598W
Lenovo ThinkPad E470-20H2S00400: Intel Core i5-7200U, 14.00", 1.9 kg
External Review » Lenovo ThinkPad E470-20H2S00400
Lenovo Ideapad 510-15ISK: Intel Core i5-6200U, 15.60", 2.2 kg
External Review » Lenovo Ideapad 510-15ISK
Acer Aspire E5-575G-51WV: Intel Core i5-7200U, 15.60", 2.4 kg
External Review » Acer Aspire E5-575G-51WV
Samsung Notebook 9 NP900X5N-X01US: Intel Core i7-7500U, 15.00", 1.2 kg
External Review » Samsung Notebook 9 NP900X5N-X01US
Asus X550VQ-0021B: Intel Core i5-6300HQ, 15.60", 2.5 kg
External Review » Asus X550VQ-0021B
Lenovo IdeaPad 710S Plus-13IKB: Intel Core i7-7500U, 13.30", 1.1 kg
External Review » Lenovo IdeaPad 710S Plus-13IKB
Dell Inspiron 17-7779: Intel Core i7-7500U, 17.30", 2.8 kg
External Review » Dell Inspiron 17-7779
Asus Zenbook UX310UQ-FC275T: Intel Core i5-7200U, 13.30", 1.5 kg
External Review » Asus Zenbook UX310UQ-FC275T
Lenovo Yoga 710-14 80TY002QTX: Intel Core i7-6500U, 14.00", 1.6 kg
External Review » Lenovo Yoga 710-14 80TY002QTX
Lenovo Ideapad 510-15ISK 80SR00AVSP: Intel Core i5-6200U, 15.60", 2.1 kg
External Review » Lenovo Ideapad 510-15ISK 80SR00AVSP
HP Pavilion 15-au100ns: Intel Core i5-7200U, 15.60", 2 kg
External Review » HP Pavilion 15-au100ns
Acer Aspire F5-771G-31JJ: Intel Core i3-7100U, 17.30", 2.9 kg
External Review » Acer Aspire F5-771G-31JJ
Asus UX410UQ-GV034T: Intel Core i7-7500U, 14.00", 1.2 kg
External Review » Asus UX410UQ-GV034T
MSI CX62 7QL-047XES: Intel Core i7-7500U, 15.60", 2.3 kg
External Review » MSI CX62 7QL-047XES
Acer Aspire E5-575G-56X: Intel Core i5-7200U, 15.60", 2.4 kg
External Review » Acer Aspire E5-575G-56X
Acer Aspire F15 F5-573G-77L0: Intel Core i7-6500U, 15.60", 2.3 kg
External Review » Acer Aspire F15 F5-573G-77L0
HP Envy 17-W0Q29AV: Intel Core i7-7500U, 17.30", 3 kg
External Review » HP Envy 17-W0Q29AV
Lenovo Yoga 710-15-80V50000US: Intel Core i5-7200U, 15.60", 1.9 kg
External Review » Lenovo Yoga 710-15-80V50000US
Dell Vostro 14 5468-P75G001: Intel Core i5-7200U, 14.00", 1.6 kg
External Review » Dell Vostro 5468-P75G001
Asus R558UQ-DM539D: Intel Core i5-7200U, 15.60", 2.1 kg
External Review » Asus R558UQ-DM539D
Lenovo Yoga 520-14IKB 80X80097GE: Intel Core i5-7200U, 14.10", 1.8 kg
External Review » Lenovo Yoga 520-14IKB
HP Spectre x360 15-bl002xx: Intel Core i7-7500U, 15.60", 2 kg
External Review » HP Spectre x360 15-bl002xx
HP Spectre x360 15-bl020nd: Intel Core i7-7500U, 15.60", 2 kg
External Review » HP Spectre x360 15-bl020nd
Dell Inspiron 14 7460: Intel Core i5-7200U, 14.00", 1.7 kg
External Review » Dell Inspiron 14 7460
Acer Aspire E5-575G-51PV: Intel Core i5-7200U, 15.60", 2.4 kg
External Review » Acer Aspire E5-575G-51PV
Asus ZenBook UX3410UQ-GV077T: Intel Core i7-7500U, 14.00", 1.4 kg
External Review » Asus ZenBook UX3410UQ-GV077T
Lenovo Ideapad 510-15IKB-80SV00G3GE: Intel Core i5-7200U, 15.60", 2.2 kg
External Review » Lenovo Ideapad 510-15IKB-80SV00G3GE
Acer TravelMate P259-MG-549Q: Intel Core i5-6200U, 15.60", 2.4 kg
External Review » Acer TravelMate P259-MG-549Q
Asus VivoBook Flip TP501UQ-CJ012T: Intel Core i5-6200U, 15.60", 2.2 kg
External Review » Asus VivoBook Flip TP501UQ-CJ012T
Lenovo Yoga 710-14IKB-80V4002VGE: Intel Core i7-7500U, 14.00", 1.6 kg
External Review » Lenovo Yoga 710-14IKB-80V4002VGE
Asus Zenbook UX310UQ-GL011T: Intel Core i7-6500U, 13.30", 1.5 kg
External Review » Asus Zenbook UX310UQ-GL011T
Asus A456UQ-FA073D: Intel Core i7-7500U, 14.00", 2.3 kg
External Review » Asus A456UQ-FA073D
Lenovo Yoga 710-14IKB-80V40031SP: Intel Core i7-7500U, 14.00", 1.6 kg
External Review » Lenovo Yoga 710-14IKB-80V40031SP
Acer Aspire E5-575G-71UK: Intel Core i7-6500U, 15.60", 2.2 kg
External Review » Acer Aspire E5-575G-71UK
Asus Zenbook Flip UX560UQ-FZ018R: Intel Core i5-6200U, 15.60", 2.3 kg
External Review » Asus Zenbook Flip UX560UQ-FZ018R
Acer Aspire F15 F5-573G-52PJ: Intel Core i5-7200U, 15.60", 2.3 kg
External Review » Acer Aspire F15 F5-573G-52PJ
Acer Aspire F5-573G-52PJ: Intel Core i5-7200U, 15.60", 2.3 kg
External Review » Acer Aspire F5-573G-52PJ
Acer Aspire E5-774G-59PC: Intel Core i5-6200U, 17.30", 3.3 kg
External Review » Acer Aspire E5-774G-59PC
Dell Inspiron 15 7560, Core i7: Intel Core i7-7500U, 15.60", 2 kg
External Review » Dell Inspiron 15-7560, Core i7
Asus K501UQ-DM032T: Intel Core i7-6500U, 15.60", 2 kg
External Review » Asus K501UQ-DM032T
HP Pavilion 14-AL107NT: Intel Core i5-7200U, 14.00", 1.5 kg
External Review » HP Pavilion 14-AL107NT
HP Pavilion 15-X9Z69EA: Intel Core i5-6200U, 15.60", 2.4 kg
External Review » HP Pavilion 15-X9Z69EA
Dell Vostro 5468-N010VN5468EMEA01: Intel Core i7-7500U, 14.00", 1.6 kg
External Review » Dell Vostro 5468-N010VN5468EMEA01
Asus K501UQ: Intel Core i5-6200U, 15.60", 2 kg
External Review » Asus K501UQ
HP Pavilion 14-al104ng: Intel Core i5-7200U, 14.10", 1.5 kg
External Review » HP Pavilion 14-al104ng
Acer Aspire F15 F5-573G-748R: Intel Core i7-6500U, 15.60", 2.3 kg
External Review » Acer Aspire F15 F5-573G-748R
Acer Aspire F15 F5-573G-75UZ: Intel Core i7-6500U, 15.60", 2.3 kg
External Review » Acer Aspire F15 F5-573G-75UZ
Lenovo Ideapad 510-15ISK-80SR003JGE: Intel Core i7-6500U, 15.60", 2.1 kg
External Review » Lenovo Ideapad 510-15ISK-80SR003JGE
Medion Akoya P6670: Intel Core i5-6200U, 15.60", 2.3 kg
External Review » Medion Akoya P6670
Acer Aspire E5-774G-553R: Intel Core i5-7200U, 17.30", 3 kg
External Review » Acer Aspire E5-774G-553R
Asus Zenbook UX310UQ-GL011T: Intel Core i7-6500U, 13.30", 1.5 kg
External Review » Asus Zenbook UX310UQ-GL011T
Acer Aspire R15 R5-571TG-50RF: Intel Core i5-6200U, 15.60", 2.2 kg
External Review » Acer Aspire R15 R5-571TG-50RF
Xiaomi Mi Notebook Air 13.3 2016: Intel Core i5-6200U, 13.30", 1.3 kg
External Review » Xiaomi Mi Air 13 inch 2016 i5 940MX
Asus VivoBook R558UQ-DM326T: Intel Core i5-6200U, 15.60", 2.3 kg
External Review » Asus VivoBook R558UQ-DM326T
Acer Aspire R15 R5-571TG-765T: Intel Core i7-6500U, 15.60", 2.2 kg
External Review » Acer Aspire R15 R5-571TG-765T
Acer Aspire E5-575G-54TU: Intel Core i5-6200U, 15.60", 2.4 kg
External Review » Acer Aspire E5-575G-54TU
Lenovo Yoga 700-14ISK-80TY000QGE: Intel Core i7-6500U, 14.00", 1.5 kg
External Review » Lenovo Yoga 700-14ISK-80TY000QGE
Dell Inspiron 17-7778-1142: Intel Core i7-6500U, 17.30", 2.8 kg
External Review » Dell Inspiron 17-7778-1142
Lenovo Yoga 710-15ISK-80U00005US: Intel Core i7-6500U, 15.60", 1.9 kg
External Review » Lenovo Yoga 710-15ISK-80U00005US
Asus Q524UQ: Intel Core i7-6500U, 15.60", 2.3 kg
External Review » Asus Q524UQ
Dell Inspiron 17 7778: Intel Core i7-6500U, 17.30", 2.8 kg
External Review » Dell Inspiron 17 7778
Lenovo Yoga 710-14ISK: Intel Core i5-6200U, 14.00", 1.6 kg
External Review » Lenovo Yoga 710-14ISK
Acer Aspire E5-575G-53VG: Intel Core i5-6200U, 15.60", 2.4 kg
External Review » Acer Aspire E5-575G-53VG
Acer Aspire F15 F5-573G-50BM: Intel Core i5-6200U, 15.60", 2.4 kg
External Review » Acer Aspire F15 F5-573G-50BM
MSI GL62-6QC-065UK: Intel Core i5-6300HQ, 15.60", 2.3 kg
External Review » MSI GL62-6QC-065UK
Lenovo ThinkPad T460p-20FXS05500: Intel Core i7-6700HQ, 14.00", 1.9 kg
External Review » Lenovo ThinkPad T460p-20FXS05500
Lenovo ThinkPad T470p-20J7S00000 : Intel Core i7-7700HQ, 14.00", 1.9 kg
Article » Comparison: NVIDIA GeForce MX150 vs NVIDIA GeForce 940MX
Dell Vostro 5468: Intel Core i5-7200U, 14.00", 1.6 kg
» Asus refreshes the UX310 ultrabook with Kaby Lake
Lenovo ThinkPad E470-20H2S00400: Intel Core i5-7200U, 14.00", 1.9 kg
» Asus refreshes the UX310 ultrabook with Kaby Lake
 Deutsch
 English
 Español
 Français
 Italiano
 Nederlands
 Polski
 Português
 Русский
 Türkçe
 Svenska
 Chinese
 Magyar