Notebookcheck Logo

NVIDIA GeForce RTX 4070 Laptop GPU

NVIDIA NVIDIA GeForce RTX 4070 Laptop GPU

The NVIDIA GeForce RTX 4070 Laptop GPU (Codename GN21-X6) is a high-end laptop GPU. It is based on the AD106 chip and use the Ada Lovelace architecture. The RTX 4070 offers 4,608 cores (of the 7,680 in the AD106) and a 128 Bit memory bus. The RTX 4070 mobile uses 8 GB GDDR6 dedicated graphics memory with a clock speed of 16 Gbps (effective). The TGP (Total Graphics Power) can be configured between 35 and 115 Watt (+ 15-25 Watt Dynamic Boost from the CPU) leading to different performance levels (the desktop RTX 4070 Ti uses 285 Watt for comparisons). The boost clock speed ranges from 1230 MHz (at 35 Watt TGP) up to 2175 MHz (115W). Therefore, the performance is also depending a lot on the power setting used for the RTX 4080 mobile in the laptop.

The performance should be below the desktop RTX 4070 Ti and therefore best suited for 2k and maximum details for demanding games of 2022.

Our synthetic benchmarks of an average RTX 4070 mobile show a performance slightly below a mobile RTX 3080 Ti. However, with reduced power limits, the performance is clearly suffering, e.g. only 70% in Time Spy for a version with 60W TDP. In games, a fast RTX 4070 is best suited for QHD gaming, where some very demanding games wont reach the 60 fps limit (and may have to run at 1080p, reduced settings or using DLSS). See below for detailed gaming benchmarks of various cards.

The RTX 4070 offers 144 tensor cores (4th gen) that enable DLSS 3 including frame generation for supported games. Furthermore, 36 raytracing cores (4rd gen) can be used for raytracing effects in supported games.

The AD106 chip is manufactured in 5nm at TSMC (4N process).

GeForce RTX 4000 Laptop GPU Series

NVIDIA GeForce RTX 4090 Laptop GPU compare 9728 @ 1.34 - 2.04 GHz256 Bit @ 20000 MHz
NVIDIA GeForce RTX 4080 Laptop GPU compare 7424 @ 1.86 - 2.28 GHz192 Bit @ 20000 MHz
NVIDIA GeForce RTX 4070 Laptop GPU 4608 @ 1.61 - 2.18 GHz128 Bit @ 16000 MHz
NVIDIA GeForce RTX 4060 Laptop GPU compare 3072 @ 1.55 - 2.37 GHz128 Bit @ 16000 MHz
NVIDIA GeForce RTX 4050 Laptop GPU compare 2560 @ 2.37 GHz96 Bit @ 16000 MHz
CodenameGN21-X6
ArchitectureAda Lovelace
Pipelines4608 - unified
TMUs144
ROPs48
Raytracing Cores36
Tensor / AI Cores144
Core Speed1605 - 2175 (Boost) MHz
Theoretical Performance15.6 TFLOPS FP16, 15.6 TFLOPS FP32
CacheL2: 32 MB
Memory Speed16000 effective = 2000 MHz
Memory Bus Width128 Bit
Memory TypeGDDR6
Max. Amount of Memory8 GB
Shared Memoryno
Memory Bandwidth256 GB/s
APIDirectX 12 Ultimate, Shader 6.7, OpenGL 4.6, OpenCL 3.0, Vulkan 1.3
Power Consumption115 Watt (35 - 115 Watt TGP)
technology5 nm
PCIe4.0 x16
Displays4 Displays (max.), HDMI 2.1, DisplayPort 1.4a
Notebook Sizelarge
Date of Announcement03.01.2023
Link to Manufacturer Pagewww.nvidia.com
PredecessorGeForce RTX 3070 Laptop GPU

Benchmarks

Performance Rating - 3DMark 11 + Fire Strike + Time Spy
11.2 pt (34%)
Restrict / Search: Model: Max. age: years
3DMark - 3DMark Time Spy Score
min: 5339     avg: 11732     median: 12024.5 (32%)     max: 13871 Points
3DMark - 3DMark Time Spy Graphics
min: 5012     avg: 11609     median: 11959.5 (24%)     max: 13391 Points
Restrict / Search: Model: Max. age: years
3DMark - 3DMark Ice Storm Unlimited Graphics
min: 534989     avg: 618710     median: 622222 (63%)     max: 718215 Points
3DMark - 3DMark Ice Storm Extreme Graphics
min: 105935     avg: 350834     median: 369414 (43%)     max: 481630 Points
3DMark - 3DMark Cloud Gate Score
min: 34191     avg: 60327     median: 61871.5 (58%)     max: 70329 Points
3DMark - 3DMark Cloud Gate Graphics
min: 54238     avg: 146466     median: 157542 (39%)     max: 193851 Points
3DMark - 3DMark Fire Strike Standard Score
min: 11910     avg: 25386     median: 26013 (39%)     max: 29580 Points
3DMark - 3DMark Fire Strike Standard Graphics
min: 12242     avg: 29140     median: 30051 (28%)     max: 33451 Points
3DMark - 3DMark Ice Storm Graphics
min: 93493     avg: 292013     median: 306567 (34%)     max: 456086 Points
3DMark - 3DMark Wild Life Extreme Unlimited
min: 17684     avg: 21363     median: 22084 (26%)     max: 24275 Points
3DMark - 3DMark Night Raid
min: 48102     avg: 57171     median: 56246 (53%)     max: 69098 Points
3DMark - 3DMark Night Raid Graphics Score
min: 84468     avg: 120710     median: 128429 (49%)     max: 148174 Points
3DMark 11 - 3DM11 Performance Score
min: 22258     avg: 33407     median: 34145.5 (41%)     max: 37906 Points
3DMark 11 - 3DM11 Performance GPU
min: 24229     avg: 40462     median: 41302 (32%)     max: 46434 Points
Restrict / Search: Model: Max. age: years
3DMark Vantage
3DM Vant. Perf. total +
3DMark Vantage - 3DM Vant. Perf. total
min: 84316     avg: 93992     median: 94245 (27%)     max: 100062 Points
3DM Vant. Perf. GPU no PhysX +
3DMark Vantage - 3DM Vant. Perf. GPU no PhysX
min: 96177     avg: 102619     median: 100299 (55%)     max: 112764 Points
Restrict / Search: Model: Max. age: years
3DMark 05 - 3DMark 05 - Standard
min: 53254     avg: 62666     median: 63338.5 (69%)     max: 70732 Points
Restrict / Search: Model: Max. age: years
3DMark 06 3DMark 06 - Standard 1280x1024 +
3DMark 06
min: 47449     avg: 57940     median: 57499 (75%)     max: 65535 Points
Unigine Valley 1.0 - Unigine Valley 1.0 DX
min: 108.4     avg: 117.7     median: 119.2 (36%)     max: 122.8 fps
Blender - Blender 3.3 Classroom CUDA *
min: 32     avg: 34.9     median: 34 (5%)     max: 50 Seconds
Blender - Blender 3.3 Classroom OPTIX *
min: 18     avg: 21.4     median: 21 (8%)     max: 30 Seconds
Blender - Blender 3.3 Classroom HIP *
330 Seconds (27%)
SPECviewperf 12
specvp12 sw-03 +
SPECviewperf 12 - specvp12 sw-03
79.8 fps (20%)
specvp12 snx-02 +
SPECviewperf 12 - specvp12 snx-02
11.4 fps (2%)
specvp12 showcase-01 +
SPECviewperf 12 - specvp12 showcase-01
117 fps (20%)
specvp12 mediacal-01 +
SPECviewperf 12 - specvp12 mediacal-01
89.3 fps (23%)
specvp12 maya-04 +
SPECviewperf 12 - specvp12 maya-04
204 fps (56%)
specvp12 energy-01 +
SPECviewperf 12 - specvp12 energy-01
20.8 fps (19%)
specvp12 creo-01 +
SPECviewperf 12 - specvp12 creo-01
66.2 fps (26%)
specvp12 catia-04 +
SPECviewperf 12 - specvp12 catia-04
109 fps (18%)
specvp12 3dsmax-05 +
SPECviewperf 12 - specvp12 3dsmax-05
234 fps (35%)
SPECviewperf 13 specvp13 sw-04 +
SPECviewperf 13 - specvp13 sw-04
min: 109.63     avg: 113.9     median: 114.7 (31%)     max: 116.36 fps
specvp13 snx-03 +
SPECviewperf 13 - specvp13 snx-03
min: 20.7     avg: 22.5     median: 22.9 (3%)     max: 23.62 fps
specvp13 showcase-02 +
SPECviewperf 13 - specvp13 showcase-02
min: 111.17     avg: 116.1     median: 115.5 (20%)     max: 122.16 fps
specvp13 medical-02 +
SPECviewperf 13 - specvp13 medical-02
min: 74.35     avg: 78     median: 78.8 (13%)     max: 80.13 fps
specvp13 maya-05 +
SPECviewperf 13 - specvp13 maya-05
min: 319.16     avg: 339.4     median: 341 (39%)     max: 356.37 fps
specvp13 energy-02 +
SPECviewperf 13 - specvp13 energy-02
min: 41     avg: 42.6     median: 42 (14%)     max: 45.45 fps
specvp13 creo-02 +
SPECviewperf 13 - specvp13 creo-02
min: 241.03     avg: 254.5     median: 256.2 (37%)     max: 264.39 fps
specvp13 catia-05 +
SPECviewperf 13 - specvp13 catia-05
min: 150.22     avg: 158.7     median: 156.4 (17%)     max: 171.81 fps
specvp13 3dsmax-06 +
SPECviewperf 13 - specvp13 3dsmax-06
min: 215.97     avg: 239.8     median: 238.7 (37%)     max: 265.83 fps
SPECviewperf 2020 specvp2020 solidworks-07 1080p +
SPECviewperf 2020 - specvp2020 solidworks-07 1080p
271.1 fps (57%)
specvp2020 solidworks-05 1080p +
SPECviewperf 2020 - specvp2020 solidworks-05 1080p
min: 249.69     avg: 260.2     median: 258.6 (48%)     max: 271.1 fps
specvp2020 snx-04 1080p +
SPECviewperf 2020 - specvp2020 snx-04 1080p
min: 21.4     avg: 23.3     median: 23.1 (3%)     max: 25.5 fps
specvp2020 medical-03 1080p +
SPECviewperf 2020 - specvp2020 medical-03 1080p
min: 32.2     avg: 36     median: 35.7 (10%)     max: 39 fps
specvp2020 maya-06 1080p +
SPECviewperf 2020 - specvp2020 maya-06 1080p
min: 355.1     avg: 409.7     median: 407.8 (44%)     max: 472 fps
specvp2020 energy-03 1080p +
SPECviewperf 2020 - specvp2020 energy-03 1080p
min: 41.3     avg: 42.5     median: 41.9 (7%)     max: 45.69 fps
specvp2020 creo-03 1080p +
SPECviewperf 2020 - specvp2020 creo-03 1080p
min: 95.9     avg: 111.4     median: 111.8 (38%)     max: 122 fps
specvp2020 catia-06 1080p +
SPECviewperf 2020 - specvp2020 catia-06 1080p
min: 61.4     avg: 65.9     median: 65.7 (32%)     max: 70.2 fps
specvp2020 3dsmax-07 1080p +
SPECviewperf 2020 - specvp2020 3dsmax-07 1080p
min: 91.5     avg: 98     median: 98.5 (26%)     max: 102 fps
specvp2020 solidworks-05 4k +
SPECviewperf 2020 - specvp2020 solidworks-05 4k
min: 115.11     avg: 183.1     median: 183.1 (44%)     max: 251 fps
specvp2020 snx-04 4k +
SPECviewperf 2020 - specvp2020 snx-04 4k
min: 16.9     avg: 18.7     median: 18.6 (2%)     max: 20.6 fps
specvp2020 medical-03 4k +
SPECviewperf 2020 - specvp2020 medical-03 4k
min: 13.87     avg: 18.2     median: 15 (10%)     max: 35.9 fps
specvp2020 maya-06 4k +
SPECviewperf 2020 - specvp2020 maya-06 4k
min: 206     avg: 240.8     median: 211.4 (30%)     max: 386 fps
specvp2020 energy-03 4k +
SPECviewperf 2020 - specvp2020 energy-03 4k
min: 27.6     avg: 35     median: 34.6 (5%)     max: 44 fps
specvp2020 creo-03 4k +
SPECviewperf 2020 - specvp2020 creo-03 4k
min: 78     avg: 90.6     median: 89.8 (40%)     max: 108 fps
specvp2020 catia-06 4k +
SPECviewperf 2020 - specvp2020 catia-06 4k
min: 32.9     avg: 41     median: 37.1 (24%)     max: 66.1 fps
specvp2020 3dsmax-07 4k +
SPECviewperf 2020 - specvp2020 3dsmax-07 4k
min: 61.5     avg: 71.4     median: 68.1 (23%)     max: 94.3 fps
Cinebench R10 Cinebench R10 Shading (32bit) +
Cinebench R10 - Cinebench R10 Shading (32bit)
min: 6717     avg: 12568     median: 6813 (5%)     max: 24016 points
Cinebench R11.5 Cinebench R11.5 OpenGL 64 Bit +
Cinebench R11.5 - Cinebench R11.5 OpenGL 64 Bit
min: 127.97     avg: 179.6     median: 181.3 (60%)     max: 211.73 fps
Cinebench R15
Cinebench R15 OpenGL 64 Bit +
Cinebench R15 - Cinebench R15 OpenGL 64 Bit
min: 83.5     avg: 222.8     median: 222 (13%)     max: 338.06 fps
Cinebench R15 OpenGL Ref. Match 64 Bit +
Cinebench R15 - Cinebench R15 OpenGL Ref. Match 64 Bit
99.6 % (100%)
GFXBench - GFXBench 5.0 4K Aztec Ruins High Tier Offscreen
min: 123.9     avg: 125.8     median: 125.8 (47%)     max: 127.6 fps
GFXBench - GFXBench 5.0 Aztec Ruins High Tier Offscreen
min: 282.3     avg: 285.4     median: 285.4 (51%)     max: 288.5 fps
Restrict / Search: Model: Max. age: years
GFXBench - GFXBench 5.0 Aztec Ruins Normal Tier Offscreen
min: 696     avg: 716     median: 716.1 (53%)     max: 736.2 fps
GFXBench - GFXBench Car Chase Offscreen
min: 518.35     avg: 568     median: 567.5 (54%)     max: 616.7 fps
GFXBench 3.1 - GFXBench Manhattan ES 3.1 Offscreen
743 fps (16%)
GFXBench 3.0 - GFXBench 3.0 Manhattan Offscreen
990 fps (41%)
GFXBench (DX / GLBenchmark) 2.7
GFXBench T-Rex HD Offscreen C24Z16 +
GFXBench (DX / GLBenchmark) 2.7 - GFXBench T-Rex HD Offscreen C24Z16
2674 fps (21%)
Basemark GPU 1.2 - Basemark GPU 1.2 Vulkan Official Medium Offscreen 1080
min: 68.3     avg: 507     median: 270.5 (7%)     max: 1992 fps
Basemark GPU 1.2 - Basemark GPU 1.2 Vulkan Official High Offscreen 2160
min: 3.64     avg: 20.9     median: 3.6 (1%)     max: 176.8 fps
Geekbench 6.4 - Geekbench 6.4 GPU OpenCL
min: 85488     avg: 113681     median: 114699 (30%)     max: 129836 points
Geekbench 6.4 - Geekbench 6.4 GPU Vulkan
min: 7760     avg: 72963     median: 93639 (23%)     max: 120033 points
LuxMark v2.0 64Bit - LuxMark v2.0 Room GPU
min: 4194     avg: 4479     median: 4615 (17%)     max: 4727 Samples/s
LuxMark v2.0 64Bit - LuxMark v2.0 Sala GPU
min: 10502     avg: 10790     median: 10800 (19%)     max: 11026 Samples/s
ComputeMark v2.1 - ComputeMark v2.1 Result
min: 24129     avg: 27673     median: 28040.5 (23%)     max: 29432 points
Power Consumption - Furmark Stress Test Power Consumption - external Monitor *
min: 76.1     avg: 155     median: 158.7 (21%)     max: 276 Watt
0153045607590105120135150165180195210225Tooltip
Power Consumption - The Witcher 3 Power Consumption - external Monitor *
min: 81.2     avg: 156.2     median: 163.1 (23%)     max: 229 Watt
0153045607590105120135150165180195210225240255Tooltip
Power Consumption - Witcher 3 Power Consumption *
min: 95.4     avg: 164.1     median: 172.2 (38%)     max: 265 Watt
0153045607590105120135150165180195210225Tooltip
Power Consumption - Power Efficiency - Witcher 3 ultra
min: 0.4151     avg: 0.7     median: 0.7 (61%)     max: 0.885 fps per Watt
Power Consumption - Power Efficiency - Witcher 3 ultra external Monitor
min: 0.553     avg: 0.7     median: 0.7 (60%)     max: 0.912 fps per Watt
Power Consumption - Cyberpunk 2077 Power Consumption 150cd *
min: 121.6     avg: 168.4     median: 157.7 (44%)     max: 219 Watt
0153045607590105120135150165180195210225Tooltip
Power Consumption - Cyberpunk 2077 Power Consumption - external Monitor *
min: 118.7     avg: 172.6     median: 171.4 (22%)     max: 221 Watt
0153045607590105120135150165180195210225Tooltip
Power Consumption - Power Efficiency - Cyberpunk 2077 ultra
min: 0.3629     avg: 0.4     median: 0.4 (1%)     max: 0.552 fps per Watt
Emissions Witcher 3 Fan Noise +
Emissions - Witcher 3 Fan Noise
min: 40.1     avg: 49.5     median: 49.2 (70%)     max: 57.94 dB(A)
Clock Speed - GPU Clock Witcher 3 ultra
min: 1860     avg: 2217     median: 2295 (90%)     max: 2460 MHz
- Range of benchmark values
red legend - Average benchmark values
* Smaller numbers mean a higher performance

Game Benchmarks

The following benchmarks stem from our benchmarks of review laptops. The performance depends on the used graphics memory, clock rate, processor, system settings, drivers, and operating systems. So the results don't have to be representative for all laptops with this GPU. For detailed information on the benchmark results, click on the fps number.

F1 25

F1 25

2025
low 1920x1080
171.3 239 ~ 205 fps    + Compare
med. 1920x1080
162.6 236 ~ 199 fps    + Compare
high 1920x1080
156.2 191.3 ~ 174 fps    + Compare
ultra 1920x1080
25.3 28 ~ 27 fps    + Compare
QHD 2560x1440
11.9 14.3 ~ 13 fps    + Compare
4K 3840x2160
3.3 5.3 ~ 4 fps    + Compare
4K DLSS 3840x2160
6.6 14.1 ~ 10 fps    + Compare
QHD DLSS 2560x1440
26.2 31.3 ~ 29 fps    + Compare
» With all tested laptops playable in detail settings high.
Additional Benchmarks
Ultra High Preset 16xAF TAA 1920x1080
61.9
50.3
low 1920x1080
84.5 86.9 ~ 86 fps    + Compare + 📈 Graph
med. 1920x1080
76 77 ~ 77 fps    + Compare + 📈 Graph
high 1920x1080
68.4 68.8 ~ 69 fps    + Compare + 📈 Graph
ultra 1920x1080
66.8 66.9 ~ 67 fps    + Compare + 📈 Graph
QHD 2560x1440
41 43.7 ~ 42 fps    + Compare + 📈 Graph
4K 3840x2160
15.4  fps    + Compare + 📈 Graph
4K DLSS 3840x2160
18.3  fps    + Compare + 📈 Graph
QHD DLSS 2560x1440
59.7  fps    + Compare + 📈 Graph
» With all tested laptops playable in detail settings ultra.
low 1920x1080
96.7  fps    + Compare + 📈 Graph
med. 1920x1080
96.5  fps    + Compare + 📈 Graph
high 1920x1080
66.5  fps    + Compare + 📈 Graph
ultra 1920x1080
30.5  fps    + Compare + 📈 Graph
QHD 2560x1440
21.8  fps    + Compare + 📈 Graph
QHD DLSS 2560x1440
33.4  fps    + Compare + 📈 Graph
» With all tested laptops playable in detail settings high.
low 1920x1080
63 66 77 ~ 69 fps    + Compare
med. 1920x1080
55 57 65 ~ 59 fps    + Compare
high 1920x1080
46 48 55 ~ 50 fps    + Compare
ultra 1920x1080
31 33 42 ~ 35 fps    + Compare
QHD 2560x1440
26 26 (!) 33 ~ 28 fps    + Compare
4K 3840x2160
14 16 (!) ~ 15 fps    + Compare
4K DLSS 3840x2160
22 24 ~ 23 fps    + Compare
4K FSR 3840x2160
22 (!)  fps    + Compare
QHD DLSS 2560x1440
35 36 37 ~ 36 fps    + Compare
QHD FSR 2560x1440
35  fps    + Compare
» With all tested laptops playable in detail settings high.
Additional Benchmarks
Ultra High + GI + DLSS Quality + FG 2560x1440
35
44
39
Ultra High + GI + DLSS Quality + FG 3840x2160
26
30
low 1920x1080
186.5 198.9 297 ~ 227 fps    + Compare + 📈 Graph
med. 1920x1080
149.9 152.9 203 ~ 169 fps    + Compare + 📈 Graph
high 1920x1080
118.2 121.2 126 131.2 ~ 124 fps    + Compare + 📈 Graph
QHD 2560x1440
57.2 72.8 74.1 77 ~ 70 fps    + Compare + 📈 Graph
4K 3840x2160
30.3 33.7 33.7 34.4 ~ 33 fps    + Compare + 📈 Graph
4K FSR 3840x2160
56.4  fps    + Compare + 📈 Graph
QHD FSR 2560x1440
131.8  fps    + Compare + 📈 Graph
» With all tested laptops playable in detail settings high.
low 1920x1080
67.7 81.8 82.4 ~ 77 fps    + Compare
med. 1920x1080
62.7 63.1 69.3 ~ 65 fps    + Compare
ultra 1920x1080
34.2 35.6 39.7 44.8 ~ 39 fps    + Compare
QHD 2560x1440
22.9 25.4 29 36 ~ 28 fps    + Compare
4K 3840x2160
12.5 20.4 ~ 16 fps    + Compare
4K DLSS 3840x2160
16.4 33.4 ~ 25 fps    + Compare
QHD DLSS 2560x1440
30.3 35.3 35.7 46.5 ~ 37 fps    + Compare
» With most tested laptops playable in detail settings ultra.
low 1920x1080
147.6  fps    + Compare + 📈 Graph
med. 1920x1080
106.4 111.5 ~ 109 fps    + Compare + 📈 Graph
high 1920x1080
89 95.8 ~ 92 fps    + Compare + 📈 Graph
ultra 1920x1080
63.9 67.6 ~ 66 fps    + Compare + 📈 Graph
QHD 2560x1440
44.6 44.9 48 ~ 46 fps    + Compare + 📈 Graph
4K 3840x2160
23.4 24.6 26.2 ~ 25 fps    + Compare + 📈 Graph
4K DLSS 3840x2160
32.5 36.1 ~ 34 fps    + Compare + 📈 Graph
4K FSR 3840x2160
35.5  fps    + Compare + 📈 Graph
QHD DLSS 2560x1440
60.3 61 ~ 61 fps    + Compare + 📈 Graph
QHD FSR 2560x1440
58.9  fps    + Compare + 📈 Graph
» With all tested laptops playable in detail settings ultra.
low 1920x1080
97.5 111.2 129 ~ 113 fps    + Compare + 📈 Graph
high 1920x1080
55 71.5 77.4 84.8 ~ 72 fps    + Compare + 📈 Graph
ultra 1920x1080
28.9 39.4 52.4 58 ~ 45 fps    + Compare + 📈 Graph
QHD 2560x1440
24.7  fps    + Compare + 📈 Graph
4K 3840x2160
15.6  fps    + Compare + 📈 Graph
» With most tested laptops playable in detail settings ultra.
Additional Benchmarks
Very Ultra Preset + Full Path Tracing + Quality DLSS + Frame Generation 3840x2160
0 (!)
Stalker 2

Stalker 2

2024
low 1920x1080
79.4  fps    + Compare + 📈 Graph
med. 1920x1080
54.5 57.1 62.6 69.5 ~ 61 fps    + Compare + 📈 Graph
high 1920x1080
49.7 49.9 54 61.2 ~ 54 fps    + Compare + 📈 Graph
ultra 1920x1080
42.3 43.5 48.3 49.4 49.8 ~ 47 fps    + Compare + 📈 Graph
QHD 2560x1440
31.7 35.4 35.5 36.5 ~ 35 fps    + Compare + 📈 Graph
4K 3840x2160
1.8 8.8 8.8 ~ 6 fps    + Compare + 📈 Graph
4K DLSS 3840x2160
6.3 12.8 ~ 10 fps    + Compare + 📈 Graph
4K FSR 3840x2160
1.4  fps    + Compare + 📈 Graph
QHD DLSS 2560x1440
58.3 73.3 ~ 66 fps    + Compare + 📈 Graph
QHD FSR 2560x1440
47.2  fps    + Compare + 📈 Graph
» With all tested laptops playable in detail settings ultra.
Additional Benchmarks
Low Preset 1280x720
106.1
low 1920x1080
140 141 ~ 141 fps    + Compare
med. 1920x1080
105 121 130 135 ~ 123 fps    + Compare
high 1920x1080
81 87 96 103 ~ 92 fps    + Compare
ultra 1920x1080
71 76 81 89 91 97 ~ 84 fps    + Compare
QHD 2560x1440
52 60 65 67 72 ~ 63 fps    + Compare
4K 3840x2160
38 39 44 ~ 40 fps    + Compare
4K DLSS 3840x2160
41 43 47 ~ 44 fps    + Compare
4K FSR 3840x2160
38  fps    + Compare
QHD DLSS 2560x1440
60 65 73 76 80 ~ 71 fps    + Compare
QHD FSR 2560x1440
96  fps    + Compare
» With all tested laptops playable in detail settings ultra.
Additional Benchmarks
Minimum Preset 1280x720
184
Extreme Preset + FSR3 Quality 2560x1440
70
low 1920x1080
79.7 97.8 135.1 ~ 104 fps    + Compare + 📈 Graph
med. 1920x1080
78.7 83.7 88.2 91.4 110.5 ~ 91 fps    + Compare + 📈 Graph
high 1920x1080
58.9 62.7 71 74.8 82.3 ~ 70 fps    + Compare + 📈 Graph
ultra 1920x1080
44.9 46.9 52.9 61.3 62.6 ~ 54 fps    + Compare + 📈 Graph
QHD 2560x1440
32.9 37.5 43 46.1 ~ 40 fps    + Compare + 📈 Graph
4K 3840x2160
20.3 22.3 25.6 ~ 23 fps    + Compare + 📈 Graph
4K DLSS 3840x2160
30.7 30.9 34.2 ~ 32 fps    + Compare + 📈 Graph
QHD DLSS 2560x1440
41.5 50.5 51.2 ~ 48 fps    + Compare + 📈 Graph
» With all tested laptops playable in detail settings ultra.
Additional Benchmarks
Low Preset 1280x720
132.6
82.4
med. 1920x1080
193.6  fps    + Compare + 📈 Graph
high 1920x1080
123.1  fps    + Compare + 📈 Graph
ultra 1920x1080
121.8  fps    + Compare + 📈 Graph
QHD 2560x1440
108.4  fps    + Compare + 📈 Graph
4K 3840x2160
71.6  fps    + Compare + 📈 Graph
» With all tested laptops playable in detail settings ultra.
low 1920x1080
147.7 162.6 ~ 155 fps    + Compare + 📈 Graph
med. 1920x1080
111.7 123 134.2 ~ 123 fps    + Compare + 📈 Graph
high 1920x1080
97.9 110.9 120.1 ~ 110 fps    + Compare + 📈 Graph
ultra 1920x1080
76.2 90.5 101.1 108 ~ 94 fps    + Compare + 📈 Graph
QHD 2560x1440
60.5 73.2 74 ~ 69 fps    + Compare + 📈 Graph
4K 3840x2160
19.6 43 ~ 31 fps    + Compare + 📈 Graph
4K DLSS 3840x2160
43.4 63.3 ~ 53 fps    + Compare + 📈 Graph
QHD DLSS 2560x1440
78 102.5 ~ 90 fps    + Compare + 📈 Graph
» With all tested laptops playable in detail settings ultra.
Additional Benchmarks
Low Preset TAA 1280x720
207
low 1920x1080
73.8 76.4 ~ 75 fps    + Compare + 📈 Graph
med. 1920x1080
68.1 68.2 70.8 74.8 ~ 70 fps    + Compare + 📈 Graph
high 1920x1080
59 59 61.8 65 ~ 61 fps    + Compare + 📈 Graph
ultra 1920x1080
50.6 54.3 55.4 59.4 ~ 55 fps    + Compare + 📈 Graph
QHD 2560x1440
37.6 39.8 40 40.1 ~ 39 fps    + Compare + 📈 Graph
4K 3840x2160
19.9 21.1 ~ 21 fps    + Compare + 📈 Graph
4K DLSS 3840x2160
21.8 29.8 ~ 26 fps    + Compare + 📈 Graph
QHD DLSS 2560x1440
53.9 55.6 58.3 ~ 56 fps    + Compare + 📈 Graph
» With all tested laptops playable in detail settings ultra.
Additional Benchmarks
Low Preset (Super Resolution off) 1280x720
113.2
Ultra Preset + Quality DLSS FG 2560x1440
90.3
low 1920x1080
64.5 90.2 ~ 77 fps    + Compare + 📈 Graph
med. 1920x1080
58.5 74.4 75.2 83.6 ~ 73 fps    + Compare + 📈 Graph
high 1920x1080
57.6 72.8 74.2 79 ~ 71 fps    + Compare + 📈 Graph
ultra 1920x1080
52.2 67.9 73.1 78.3 84 ~ 71 fps    + Compare + 📈 Graph
QHD 2560x1440
48.2 49.1 60.7 61.5 ~ 55 fps    + Compare + 📈 Graph
4K 3840x2160
28.9 29.7 31.4 ~ 30 fps    + Compare + 📈 Graph
4K DLSS 3840x2160
45.5 46.5 48.6 ~ 47 fps    + Compare + 📈 Graph
QHD DLSS 2560x1440
53.2 65.1 79.9 ~ 66 fps    + Compare + 📈 Graph
» With all tested laptops playable in detail settings ultra.
Additional Benchmarks
Low Preset TAA 1280x720
102
low 1920x1080 cinem.
67.1 73.7 ~ 70 fps    + Compare + 📈 Graph
med. 1920x1080 cinem.
44.9 45.9 61 69.9 ~ 55 fps    + Compare + 📈 Graph
high 1920x1080 cinem.
39.6 40.8 52.5 60 ~ 48 fps    + Compare + 📈 Graph
ultra 1920x1080 cinem.
31.9 34.4 35.4 40.5 42.5 52.8 ~ 40 fps    + Compare + 📈 Graph
QHD 2560x1440 cinem.
23.3 25.9 29 29.4 37.1 ~ 29 fps    + Compare + 📈 Graph
4K 3840x2160 cinem.
12.3 15.6 18.1 ~ 15 fps    + Compare + 📈 Graph
4K DLSS 3840x2160 cinem.
25.5 32.6 ~ 29 fps    + Compare + 📈 Graph
QHD DLSS 2560x1440 cinem.
34.1 35.3 40.2 ~ 37 fps    + Compare + 📈 Graph
» With most tested laptops playable in detail settings ultra.
Additional Benchmarks
ultra, RT ultra, DLSS, FG RR 2560x1440 cinem.
29.5
low 1280x720 cinem.
82.7
ultra DLSS 1920x1080 cinem.
38.2
low 1920x1080
88 89.8 96 ~ 91 fps    + Compare + 📈 Graph
med. 1920x1080
68 68.5 72 ~ 70 fps    + Compare + 📈 Graph
high 1920x1080
54 54.1 55 ~ 54 fps    + Compare + 📈 Graph
ultra 1920x1080
25 31 31 34.7 ~ 30 fps    + Compare + 📈 Graph
QHD 2560x1440
18 22 23 25.7 ~ 22 fps    + Compare + 📈 Graph
4K 3840x2160
7 9 12.6 12.6 ~ 10 fps    + Compare + 📈 Graph
4K DLSS 3840x2160
23 23 26.2 ~ 24 fps    + Compare + 📈 Graph
QHD DLSS 2560x1440
28 34 39.2 ~ 34 fps    + Compare + 📈 Graph
» With all tested laptops playable in detail settings high.
Additional Benchmarks
low TSR 100 1280x720
128.9
128
146
cinematic RT: Very High DLSS 68 FG 3840x2160
25.1
cinematic RT: Very High DLSS 68 FG 2560x1440
38.4
low FSR 68 1280x720
154.8
low XeSS 68 1280x720
149.7
low 1920x1080
168.9 205 ~ 187 fps    + Compare + 📈 Graph
med. 1920x1080
121.6 147 151.6 ~ 140 fps    + Compare + 📈 Graph
high 1920x1080
104.9 119.7 121.2 ~ 115 fps    + Compare + 📈 Graph
ultra 1920x1080
101.1 107.4 111.9 ~ 107 fps    + Compare + 📈 Graph
QHD 2560x1440
61.1 71.8 75.8 ~ 70 fps    + Compare + 📈 Graph
4K 3840x2160
30.3 35.7 36.9 ~ 34 fps    + Compare + 📈 Graph
» With all tested laptops playable in detail settings ultra.
Additional Benchmarks
Very Low Preset 1280x720
212
255
low 1920x1080
162.7 165.3 166.9 171 ~ 166 fps    + Compare + 📈 Graph
med. 1920x1080
106.2 106.5 108.5 110.9 115.7 ~ 110 fps    + Compare + 📈 Graph
high 1920x1080
87 87.2 91.3 93.3 94.1 ~ 91 fps    + Compare + 📈 Graph
ultra 1920x1080
73.7 78.6 79.6 80 83.6 ~ 79 fps    + Compare + 📈 Graph
QHD 2560x1440
48.2 50.1 50.6 51.2 52.5 ~ 51 fps    + Compare + 📈 Graph
4K 3840x2160
26 26.4 27.9 ~ 27 fps    + Compare + 📈 Graph
4K DLSS 3840x2160
28.2 29.3 30.1 ~ 29 fps    + Compare + 📈 Graph
» With all tested laptops playable in detail settings ultra.
Additional Benchmarks
Low Preset 1280x720
197.7
205
Ultra Preset + Ultra Ray Tracing + DLSS Quality 2560x1440
51.8
48.6
F1 24

F1 24

2024
low 1920x1080
200 205 218 219 239 249 251 269 284 ~ 237 fps    + Compare
med. 1920x1080
210 211 212 212 217 233 238 245 255 269 ~ 230 fps    + Compare
high 1920x1080
179.4 186.4 187.4 192.6 193.9 194.9 194.9 196.6 203 208 220 222 ~ 198 fps    + Compare
ultra 1920x1080
58.4 64.7 68.9 69.5 70.4 71.8 72 74.1 77.4 78.1 81.2 ~ 72 fps    + Compare
QHD 2560x1440
36.8 41.1 44.8 45.1 45.6 46 47.3 47.7 48.4 50.9 51.3 ~ 46 fps    + Compare
4K 3840x2160
20.5 21.3 21.8 22 22 22.3 24.9 ~ 22 fps    + Compare
4K DLSS 3840x2160
23 27.3 30.8 35.4 36.3 40 ~ 32 fps    + Compare
4K FSR 3840x2160
36.3  fps    + Compare
QHD DLSS 2560x1440
57 65.2 68.9 70.4 71.8 73.9 76.1 78.7 86.3 ~ 72 fps    + Compare
QHD FSR 2560x1440
77.3 77.7 ~ 78 fps    + Compare
» With all tested laptops playable in detail settings ultra.
low 1920x1080
69.6 75.3 78.3 97.1 ~ 80 fps    + Compare + 📈 Graph
med. 1920x1080
53.2 60.6 61.6 64.9 ~ 60 fps    + Compare + 📈 Graph
high 1920x1080
34.3 39.3 46.2 51.2 ~ 43 fps    + Compare + 📈 Graph
QHD 2560x1440
23.7 27.1 32 33.3 ~ 29 fps    + Compare + 📈 Graph
4K 3840x2160
11.5 12.8 ~ 12 fps    + Compare + 📈 Graph
4K DLSS 3840x2160
19.2 29.4 ~ 24 fps    + Compare + 📈 Graph
QHD DLSS 2560x1440
42.2 47.8 ~ 45 fps    + Compare + 📈 Graph
» With most tested laptops playable in detail settings high.
low 1920x1080
92.7 113.1 114.9 ~ 107 fps    + Compare + 📈 Graph
med. 1920x1080
89.7 90.5 96.3 102.8 ~ 95 fps    + Compare + 📈 Graph
high 1920x1080
82.1 83.2 88.5 93 ~ 87 fps    + Compare + 📈 Graph
ultra 1920x1080
55.3 68.1 68.9 71.6 73.7 ~ 68 fps    + Compare + 📈 Graph
QHD 2560x1440
43.6 50.5 52.8 53.8 56.1 ~ 51 fps    + Compare + 📈 Graph
4K 3840x2160
27.9 28.1 ~ 28 fps    + Compare + 📈 Graph
4K DLSS 3840x2160
42.9 45.4 ~ 44 fps    + Compare + 📈 Graph
QHD DLSS 2560x1440
57 69.6 74.2 ~ 67 fps    + Compare + 📈 Graph
» With all tested laptops playable in detail settings ultra.
Additional Benchmarks
Low Preset 1280x720
136.4
low 1920x1080
80.5 92.3 96.6 100.2 106.4 107.1 110.5 114.6 ~ 101 fps    + Compare + 📈 Graph
med. 1920x1080
77.3 79.8 83.7 91.5 94.3 99.4 101.4 103.4 104.2 ~ 93 fps    + Compare + 📈 Graph
high 1920x1080
58.5 62.4 71.7 71.8 73.2 73.4 75.4 76 79.8 ~ 71 fps    + Compare + 📈 Graph
ultra 1920x1080
53.2 54.6 56.1 64.4 64.4 65.4 67.6 70.3 71.1 76.7 ~ 64 fps    + Compare + 📈 Graph
QHD 2560x1440
40.3 45.5 49.9 49.9 52.2 54 54.5 56.1 59.1 ~ 51 fps    + Compare + 📈 Graph
4K 3840x2160
30.4 31.4 32.3 ~ 31 fps    + Compare + 📈 Graph
4K DLSS 3840x2160
45.5 47.2 ~ 46 fps    + Compare + 📈 Graph
QHD DLSS 2560x1440
54.6  fps    + Compare
» With all tested laptops playable in detail settings ultra.
Additional Benchmarks
Very Low Preset 1280x720
132.1
low 1920x1080
137.2 185.9 212 215 222 ~ 194 fps    + Compare + 📈 Graph
med. 1920x1080
133.1 157.3 191 193.6 209 ~ 177 fps    + Compare + 📈 Graph
high 1920x1080
125.8 151.1 178 185.7 196.5 ~ 167 fps    + Compare + 📈 Graph
ultra 1920x1080
105.5 114 124.7 125.8 126 ~ 119 fps    + Compare + 📈 Graph
QHD 2560x1440
37.4 64.7 72 75.3 76.6 ~ 65 fps    + Compare + 📈 Graph
4K 3840x2160
10.3 17 21.2 ~ 16 fps    + Compare + 📈 Graph
4K DLSS 3840x2160
33.1 54 63.4 ~ 50 fps    + Compare + 📈 Graph
» With all tested laptops playable in detail settings ultra.
Additional Benchmarks
Low Preset 1280x720
144.8
225
low 1920x1080
64.5 68.8 70.1 81 83.9 ~ 74 fps    + Compare + 📈 Graph
high 1920x1080
61.3 61.5 65.7 70.4 80 ~ 68 fps    + Compare + 📈 Graph
QHD 2560x1440
47.7 51.6 57.4 58.5 61.3 ~ 55 fps    + Compare + 📈 Graph
4K 3840x2160
28.8 32.9 ~ 31 fps    + Compare + 📈 Graph
4K DLSS 3840x2160
35.3 39.8 ~ 38 fps    + Compare + 📈 Graph
» With all tested laptops playable in detail settings high.
Additional Benchmarks
Low Preset 1280x720
87.4
69.1
low 1920x1080
169.7  fps    + Compare + 📈 Graph
med. 1920x1080
156 196.6 ~ 176 fps    + Compare + 📈 Graph
high 1920x1080
155.9 177.5 ~ 167 fps    + Compare + 📈 Graph
ultra 1920x1080
133.8 140 ~ 137 fps    + Compare + 📈 Graph
QHD 2560x1440
80.4 81.1 ~ 81 fps    + Compare + 📈 Graph
4K 3840x2160
37.4  fps    + Compare + 📈 Graph
» With all tested laptops playable in detail settings ultra.
low 1920x1080
107 126 ~ 117 fps    + Compare
med. 1920x1080
101 116 122 ~ 113 fps    + Compare
high 1920x1080
94 96 97 ~ 96 fps    + Compare
ultra 1920x1080
75 77 81 ~ 78 fps    + Compare
QHD 2560x1440
56 59 63 ~ 59 fps    + Compare
4K 3840x2160
36 36 ~ 36 fps    + Compare
4K DLSS 3840x2160
53 54 ~ 54 fps    + Compare
» With all tested laptops playable in detail settings ultra.
Additional Benchmarks
Low Preset TAA 1280x720
129
low 1920x1080
126.8 129.5 ~ 128 fps    + Compare + 📈 Graph
med. 1920x1080
114 117.3 ~ 116 fps    + Compare + 📈 Graph
high 1920x1080
91.5 105.9 107.5 ~ 102 fps    + Compare + 📈 Graph
ultra 1920x1080
91.1 103.5 105.3 ~ 100 fps    + Compare + 📈 Graph
QHD 2560x1440
69.2 75.2 75.3 ~ 73 fps    + Compare + 📈 Graph
4K 3840x2160
37.4 40 ~ 39 fps    + Compare + 📈 Graph
» With all tested laptops playable in detail settings ultra.
Additional Benchmarks
Low Preset 1280x720
127.6
med. 1920x1080
75.2  fps    + Compare + 📈 Graph
high 1920x1080
62.7 66.6 ~ 65 fps    + Compare + 📈 Graph
ultra 1920x1080
51.3 56.5 ~ 54 fps    + Compare + 📈 Graph
QHD 2560x1440
38.9 42.3 ~ 41 fps    + Compare + 📈 Graph
4K 3840x2160
23.5  fps    + Compare + 📈 Graph
4K DLSS 3840x2160
36.3  fps    + Compare + 📈 Graph
» With all tested laptops playable in detail settings ultra.
Palworld

Palworld

2024
med. 1920x1080
118.4  fps    + Compare + 📈 Graph
high 1920x1080
102.2 111 ~ 107 fps    + Compare + 📈 Graph
ultra 1920x1080
96.6 108.5 ~ 103 fps    + Compare + 📈 Graph
QHD 2560x1440
69.1 81.3 ~ 75 fps    + Compare + 📈 Graph
4K 3840x2160
42.7  fps    + Compare + 📈 Graph
4K DLSS 3840x2160
58.1  fps    + Compare + 📈 Graph
» With all tested laptops playable in detail settings ultra.
med. 1920x1080
323 358 ~ 341 fps    + Compare + 📈 Graph
high 1920x1080
322 358 358 ~ 346 fps    + Compare + 📈 Graph
ultra 1920x1080
321 357 358 ~ 345 fps    + Compare + 📈 Graph
QHD 2560x1440
325 354 ~ 340 fps    + Compare + 📈 Graph
4K 3840x2160
186.7  fps    + Compare + 📈 Graph
» With all tested laptops playable in detail settings ultra.
med. 1920x1080
220  fps    + Compare + 📈 Graph
high 1920x1080
194.2 208 ~ 201 fps    + Compare + 📈 Graph
ultra 1920x1080
134 161.5 ~ 148 fps    + Compare + 📈 Graph
QHD 2560x1440
84.8 95.6 ~ 90 fps    + Compare + 📈 Graph
4K 3840x2160
40.6  fps    + Compare + 📈 Graph
4K DLSS 3840x2160
87.6  fps    + Compare + 📈 Graph
» With all tested laptops playable in detail settings ultra.
low 1920x1080
208  fps    + Compare + 📈 Graph
med. 1920x1080
186.6 190.1 ~ 188 fps    + Compare + 📈 Graph
high 1920x1080
168 180.6 184.4 ~ 178 fps    + Compare + 📈 Graph
ultra 1920x1080
130.2 149.6 156.7 ~ 146 fps    + Compare + 📈 Graph
QHD 2560x1440
82.8 93.3 94.6 ~ 90 fps    + Compare + 📈 Graph
4K 3840x2160
42.7 42.9 ~ 43 fps    + Compare + 📈 Graph
4K DLSS 3840x2160
68.9 70.5 ~ 70 fps    + Compare + 📈 Graph
» With all tested laptops playable in detail settings ultra.
Additional Benchmarks
Low Preset 1280x720
198.9
Epic Preset + Epic RTX Global Illumination 1920x1080
142.2
137.2
low 1920x1080
81 81 88 94 94 97 101 ~ 91 fps    + Compare
med. 1920x1080
74 75 82 87 87 90 91 94 ~ 85 fps    + Compare
high 1920x1080
65 66 72 76 76 78 80 82 ~ 74 fps    + Compare
ultra 1920x1080
49 49 54 55 58 58 58 61 62 ~ 56 fps    + Compare
QHD 2560x1440
32 33 37 38 38 39 41 41 42 ~ 38 fps    + Compare
4K 3840x2160
19 19 19 19 19 20 ~ 19 fps    + Compare
4K DLSS 3840x2160
33 34 34 35 ~ 34 fps    + Compare
» With all tested laptops playable in detail settings ultra.
Additional Benchmarks
Low Preset TAA 1280x720
137
141
130
134
low 1920x1080
143 145 146 167 180 182 ~ 161 fps    + Compare
med. 1920x1080
130 130 132 150 156 158 164 ~ 146 fps    + Compare
high 1920x1080
99 101 103 113 119 124 127 ~ 112 fps    + Compare
ultra 1920x1080
92 94 95 104 108 114 120 ~ 104 fps    + Compare
QHD 2560x1440
64 66 72 78 82 83 ~ 74 fps    + Compare
4K 3840x2160
48 49 50 ~ 49 fps    + Compare
4K DLSS 3840x2160
55  fps    + Compare
» With all tested laptops playable in detail settings ultra.
low 1920x1080
147.4  fps    + Compare + 📈 Graph
med. 1920x1080
90.6 94.9 107 ~ 98 fps    + Compare + 📈 Graph
high 1920x1080
85 89.6 99.2 ~ 91 fps    + Compare + 📈 Graph
ultra 1920x1080
77.1 81.2 92.8 ~ 84 fps    + Compare + 📈 Graph
QHD 2560x1440
59.6 67 68.8 ~ 65 fps    + Compare + 📈 Graph
4K 3840x2160
36.7 37.7 ~ 37 fps    + Compare + 📈 Graph
4K DLSS 3840x2160
54.5 56.2 ~ 55 fps    + Compare + 📈 Graph
» With all tested laptops playable in detail settings ultra.
Additional Benchmarks
Ultra Low Preset LowAA 1280x720
208
low 1920x1080
74.3 77 77.5 79.6 82.8 83 ~ 79 fps    + Compare + 📈 Graph
med. 1920x1080
66.9 70.2 71.4 72.4 75.7 75.9 76.3 ~ 73 fps    + Compare + 📈 Graph
high 1920x1080
65.1 66.8 68.5 68.9 70 70.1 71 ~ 69 fps    + Compare + 📈 Graph
QHD 2560x1440
40.2 41.5 42.3 42.8 43.3 43.8 44.5 ~ 43 fps    + Compare + 📈 Graph
4K 3840x2160
15.3 19.8 20.4 24.8 ~ 20 fps    + Compare + 📈 Graph
4K DLSS 3840x2160
16.8 25.7 ~ 21 fps    + Compare + 📈 Graph
» With all tested laptops playable in detail settings high.
Additional Benchmarks
Low Preset 1280x720
104.7
119.5
82.5
High Preset + High Ray Tracing 1920x1080
31.7
34.5
29.2
low 1920x1080
96.9 104.2 105 ~ 102 fps    + Compare + 📈 Graph
med. 1920x1080
84.1 85.1 96.5 98.1 ~ 91 fps    + Compare + 📈 Graph
high 1920x1080
62.6 63.4 81.5 83.6 ~ 73 fps    + Compare + 📈 Graph
ultra 1920x1080
44.3 45.9 66.1 67.7 ~ 56 fps    + Compare + 📈 Graph
QHD 2560x1440
29.1 29.8 45.6 47.1 ~ 38 fps    + Compare + 📈 Graph
4K 3840x2160
14.6 24.1 25.1 ~ 21 fps    + Compare + 📈 Graph
4K DLSS 3840x2160
29.1 43.7 44.5 ~ 39 fps    + Compare + 📈 Graph
» With all tested laptops playable in detail settings ultra.
Additional Benchmarks
Low Preset 1280x720
141.4
119.8
142.8
low 1920x1080
286 327 383.5 385.9 ~ 346 fps    + Compare
med. 1920x1080
206 215 239.5 256.4 263 ~ 236 fps    + Compare
high 1920x1080
137 143 146.2 166 170.2 ~ 152 fps    + Compare
ultra 1920x1080
110 112 113.3 129 136.2 ~ 120 fps    + Compare
QHD 2560x1440
87.2 91 95.4 96 96.6 ~ 93 fps    + Compare
4K 3840x2160
46 46.9 47 47.1 ~ 47 fps    + Compare
» With all tested laptops playable in detail settings ultra.
Additional Benchmarks
Low Preset 1280x720
446.1
313
490.5
355
low 1920x1080
131 143 150 152 ~ 144 fps    + Compare
med. 1920x1080
124 132 137 140 141 ~ 135 fps    + Compare
high 1920x1080
116 125 129 130 133 ~ 127 fps    + Compare
ultra 1920x1080
91 97 97 98 99 99 ~ 97 fps    + Compare
QHD 2560x1440
73 74 75 77 78 80 ~ 76 fps    + Compare
4K 3840x2160
41 41 41 ~ 41 fps    + Compare
4K DLSS 3840x2160
52 54 59 ~ 55 fps    + Compare
» With all tested laptops playable in detail settings ultra.
Additional Benchmarks
Low Preset (Adaptive Quality Off) 1280x720
180
171
med. 1920x1080
192.7  fps    + Compare + 📈 Graph
high 1920x1080
162.3  fps    + Compare + 📈 Graph
ultra 1920x1080
150.1  fps    + Compare + 📈 Graph
QHD 2560x1440
138.4  fps    + Compare + 📈 Graph
4K 3840x2160
82.4  fps    + Compare + 📈 Graph
» With all tested laptops playable in detail settings ultra.
med. 1920x1080
160.2 182.9 ~ 172 fps    + Compare + 📈 Graph
high 1920x1080
151.5 170.7 ~ 161 fps    + Compare + 📈 Graph
ultra 1920x1080
121.5 141 ~ 131 fps    + Compare + 📈 Graph
QHD 2560x1440
87.9 100.6 ~ 94 fps    + Compare + 📈 Graph
4K 3840x2160
55.4  fps    + Compare + 📈 Graph
» With all tested laptops playable in detail settings ultra.
low 1920x1080
43.1 90.2 96.4 104.7 110.2 112 115.2 116.3 116.8 118.6 119.4 119.4 125.3 125.7 126.3 129.6 129.7 130 131.7 132.4 135.1 135.3 135.8 142.5 143.4 144.7 146.2 154.7 156.6 ~ 124 fps    + Compare
med. 1920x1080
81.6 87.6 89.9 90 93.9 99.4 99.7 101.9 106.1 106.3 106.8 108.4 110 110.2 112.1 113.2 113.7 113.8 114.1 115.2 115.6 117.1 118.1 118.9 119.1 120 120.9 122 123.7 124 124.5 ~ 110 fps    + Compare
high 1920x1080
74.7 75.7 76.9 77 80.1 83.7 84.4 86.1 88.1 90.5 90.8 91.5 94.1 94.1 94.3 95.5 95.6 96.2 96.4 96.7 98.3 99.4 99.6 100.2 100.4 100.5 101 101 102 102.2 102.6 103.6 ~ 93 fps    + Compare
ultra 1920x1080
30.7 61 64.3 66.8 68.3 69 69.1 72.4 73.9 74.1 75.8 76.4 76.9 77.9 78.7 80.7 81.2 82.5 82.5 83.1 83.3 83.5 83.6 83.6 84 84 85.2 85.5 86 86.3 87 87.1 87.5 87.9 88.2 88.6 88.9 89.5 90.5 90.7 ~ 79 fps    + Compare
QHD 2560x1440
24.8 39.6 40.1 42 42.3 43.6 43.6 43.7 44.3 47.8 47.8 48.6 48.8 49.1 49.1 49.4 49.4 49.8 50.5 50.7 51.1 51.4 51.7 51.8 51.8 51.9 52.1 52.6 52.7 52.8 53 53.5 54.5 54.9 55.4 55.6 57.1 ~ 49 fps    + Compare
4K 3840x2160
20.2 20.2 20.3 21 21.4 21.4 21.7 21.9 22 22.3 22.5 23.5 24 ~ 22 fps    + Compare
4K DLSS 3840x2160
15.7 16.5 19.6 29.6 ~ 20 fps    + Compare
4K FSR 3840x2160
21.2  fps    + Compare
QHD DLSS 2560x1440
49.7 58.6 66.3 ~ 58 fps    + Compare
» With most tested laptops playable in detail settings ultra.
Additional Benchmarks
Low Preset (FSR off) 1280x720
134.2
138.9
149.4
126.2
147.1
149.9
120.6
175.5
132.7
132.2
127.5
119.8
124.4
132.4
169.6
140
137.8
110.2
Ray Tracing Ultra Preset (DLSS off) 1920x1080
30.4
41.2
43.6
43.8
42.4
44.8
43.4
40.9
43.4
43.8
46.8
45.2
41
40.6
35
41.1
41.6
34.8
19.1
36
43.7
42.2
42.5
Steam Deck 1280x800
126.2
142.3
146.8
124.8
174.9
118.6
Ultra Preset (FSR2 on) 1920x1080
78.3
99.7
101.7
96.5
104
81.6
100.9
Ray Tracing Ultra Preset (DLSS off, no Path Tracing) 3840x2160
9.9
9.9
7
8.8
4.4
8.6
30min Start Ultra Preset (FSR off) 1920x1080
77.5
79.7
77.5
61
79.1
72.3
69.7
60.6
68.5
73.5
74.8
63.8
30.6
69.5
78.1
73.9
82.1
65.8
81.4
80.2
Ray Tracing Overdrive Preset (no DLSS, no FG) 3840x2160
1.5
Ray Tracing Overdrive Preset + DLSS 4 Transformer Quality (no FG) 3840x2160
12.4
13.8
11
Ray Tracing Overdrive Preset + DLSS 4 Transformer Quality + Frame Generation (M)FG 2x 3840x2160
11.8
5.7
low 1920x1080
127.4 135.7 137.1 141.7 141.9 148.8 150 151 151.5 152 155.4 155.6 156.6 157.2 162.1 162.6 163 164.2 165.1 166.3 168.7 171.8 176 ~ 155 fps    + Compare + 📈 Graph
med. 1920x1080
107.1 108.4 109.7 110.6 113.9 114.2 115.2 116.3 119 121.2 123.3 124.1 125.3 125.4 125.6 125.9 127.9 129.3 130.5 131.1 132 132.5 135.5 136.5 136.6 139.3 148.9 150.8 ~ 126 fps    + Compare + 📈 Graph
high 1920x1080
72.7 82.8 89.2 90.9 91.4 93.5 94.8 95.3 99.1 99.3 100.5 105.2 105.6 106.1 107.8 108.2 108.2 109.1 109.3 113.8 114.4 115.3 115.7 119.1 119.9 122.4 128.5 129.3 ~ 105 fps    + Compare + 📈 Graph
ultra 1920x1080
66.7 71.3 77.4 82.5 86.1 88.5 88.6 91.1 91.8 94.4 95.4 100.2 100.2 103.1 104.9 105 105 106.8 107.4 107.9 109.4 111.8 113.6 114.7 115 117 117.7 121.4 125.6 128.5 ~ 102 fps    + Compare + 📈 Graph
QHD 2560x1440
54.4 59.9 60 60.2 62.3 62.5 63.8 65 66 70.6 70.9 71.5 71.9 73.6 73.7 75.5 75.9 77.2 79.8 81.1 82.1 82.8 85.7 88.3 89.6 ~ 72 fps    + Compare + 📈 Graph
4K 3840x2160
33.4 34.2 34.5 37.2 38.1 38.7 39.2 40.2 41.1 43.5 44.3 45.2 ~ 39 fps    + Compare + 📈 Graph
4K DLSS 3840x2160
58 63.3 64.4 65.1 66.4 104.7 ~ 70 fps    + Compare + 📈 Graph
4K FSR 3840x2160
71.5  fps    + Compare + 📈 Graph
QHD DLSS 2560x1440
110.5  fps    + Compare + 📈 Graph
» With all tested laptops playable in detail settings ultra.
Additional Benchmarks
Low Preset SMAA 1280x720
162.7
218
173.5
196.8
184.8
203.8
167.8
Low Preset FSR 2.2 Balanced 1920x1080
206
Ultra Preset + Quality FSR 2.2 2560x1440
104.9
Lies of P

Lies of P

2023
low 1920x1080
195.8 199.7 206 ~ 201 fps    + Compare + 📈 Graph
med. 1920x1080
171.6 182 184.4 188.5 ~ 182 fps    + Compare + 📈 Graph
high 1920x1080
150.2 159.8 160 165.4 ~ 159 fps    + Compare + 📈 Graph
ultra 1920x1080
137.4 140.1 144.1 148.1 ~ 142 fps    + Compare + 📈 Graph
QHD 2560x1440
97.2 97.3 97.5 98.8 ~ 98 fps    + Compare + 📈 Graph
4K 3840x2160
47.8 48.3 49 ~ 48 fps    + Compare + 📈 Graph
4K DLSS 3840x2160
73.9 75.5 76.7 ~ 75 fps    + Compare + 📈 Graph
» With all tested laptops playable in detail settings ultra.
Additional Benchmarks
Low Preset 1280x720
255
202
257
med. 1920x1080
60 60 ~ 60 fps    + Compare
high 1920x1080
60 60 ~ 60 fps    + Compare
ultra 1920x1080
60 60 ~ 60 fps    + Compare
QHD 2560x1440
59  fps    + Compare
4K 3840x2160
39  fps    + Compare
» With all tested laptops playable in detail settings ultra.
Starfield

Starfield

2023
med. 1920x1080
62.3 66.7 ~ 65 fps    + Compare + 📈 Graph
high 1920x1080
51.2 52.3 ~ 52 fps    + Compare + 📈 Graph
ultra 1920x1080
46.6 46.6 ~ 47 fps    + Compare + 📈 Graph
QHD 2560x1440
37.2  fps    + Compare + 📈 Graph
4K 3840x2160
24  fps    + Compare + 📈 Graph
» With all tested laptops playable in detail settings ultra.
med. 1920x1080
92.1 102.5 109.7 110.1 ~ 104 fps    + Compare + 📈 Graph
high 1920x1080
91.1 101.9 109.2 109.4 ~ 103 fps    + Compare + 📈 Graph
ultra 1920x1080
87.2 97 106.4 107 ~ 99 fps    + Compare + 📈 Graph
QHD 2560x1440
76.2 85 ~ 81 fps    + Compare + 📈 Graph
4K 3840x2160
45.2  fps    + Compare + 📈 Graph
» With all tested laptops playable in detail settings ultra.
high 1920x1080
56 57.1 57.3 61.6 ~ 58 fps    + Compare + 📈 Graph
ultra 1920x1080
46.1 46.9 46.9 49.9 ~ 47 fps    + Compare + 📈 Graph
QHD 2560x1440
32 35 ~ 34 fps    + Compare + 📈 Graph
4K 3840x2160
19.7  fps    + Compare + 📈 Graph
4K DLSS 3840x2160
39.5  fps    + Compare + 📈 Graph
» With all tested laptops playable in detail settings ultra.
med. 1920x1080
113.2 124.7 133.8 143.1 ~ 129 fps    + Compare + 📈 Graph
high 1920x1080
106.5 119.9 126.7 132.4 ~ 121 fps    + Compare + 📈 Graph
ultra 1920x1080
105.3 106.1 106.6 111.1 ~ 107 fps    + Compare + 📈 Graph
QHD 2560x1440
80.6 89.5 ~ 85 fps    + Compare + 📈 Graph
4K 3840x2160
51  fps    + Compare + 📈 Graph
» With all tested laptops playable in detail settings ultra.
low 1920x1080
90.4  fps    + Compare + 📈 Graph
med. 1920x1080
72.3 72.5 78.8 79.5 ~ 76 fps    + Compare + 📈 Graph
high 1920x1080
58 60.2 62.3 64.7 ~ 61 fps    + Compare + 📈 Graph
ultra 1920x1080
52.3 56.3 57.1 58.1 ~ 56 fps    + Compare + 📈 Graph
QHD 2560x1440
48.7 48.8 49.1 ~ 49 fps    + Compare + 📈 Graph
4K 3840x2160
33.2  fps    + Compare + 📈 Graph
» With all tested laptops playable in detail settings ultra.
Additional Benchmarks
Very Low Preset 1280x720
109.7
Very High Preset + Very High Raytracing TAA 1920x1080
44.8
43.4
Very High Preset + Very High Raytracing + DLSS Quality + FG 3840x2160
13.3
F1 23

F1 23

2023
low 1920x1080
178.9 192.9 194.5 195.2 214 229 230 235 248 248 279 287 ~ 228 fps    + Compare
med. 1920x1080
169.2 189.7 193.8 197.3 205 232 239 240 251 251 255 261 284 ~ 228 fps    + Compare
high 1920x1080
153.4 165.4 175.1 176.3 188.8 189 198 198.2 199.2 206 209 209 222 ~ 191 fps    + Compare
ultra 1920x1080
49.5 55.5 55.8 62.5 67.6 68 68.9 70.1 70.3 71 71 71.7 77 100 ~ 68 fps    + Compare
QHD 2560x1440
35.2 36 36 39.4 41 43.9 44 45 45.5 45.6 46 46.3 49 ~ 43 fps    + Compare
4K 3840x2160
19.6 20.1 22 23 ~ 21 fps    + Compare
4K DLSS 3840x2160
32.7 38 ~ 35 fps    + Compare
» With all tested laptops playable in detail settings ultra.
Additional Benchmarks
Ultra Low Preset TAA 1280x720
232
221
237
281
176.4
Diablo 4

Diablo 4

2023
low 1920x1080
242 255 ~ 249 fps    + Compare + 📈 Graph
med. 1920x1080
227 233 ~ 230 fps    + Compare + 📈 Graph
high 1920x1080
207 208 ~ 208 fps    + Compare + 📈 Graph
ultra 1920x1080
177.8 182.9 ~ 180 fps    + Compare + 📈 Graph
QHD 2560x1440
105.4 120.7 ~ 113 fps    + Compare + 📈 Graph
4K 3840x2160
60.9  fps    + Compare + 📈 Graph
4K DLSS 3840x2160
82.6  fps    + Compare + 📈 Graph
» With all tested laptops playable in detail settings ultra.
Additional Benchmarks
Low Preset 1280x720
282
low 1920x1080
78.7 80.1 84 92.1 99.8 ~ 87 fps    + Compare + 📈 Graph
med. 1920x1080
69.9 70.5 76 80.6 91.7 94.9 ~ 81 fps    + Compare + 📈 Graph
high 1920x1080
65.1 67 72 75.6 79 79.1 86.5 ~ 75 fps    + Compare + 📈 Graph
ultra 1920x1080
61.5 63.5 67 71.1 73 75 77.9 80.1 ~ 71 fps    + Compare + 📈 Graph
QHD 2560x1440
39.5 39.8 44 45 46.7 47 50.4 51.1 ~ 45 fps    + Compare + 📈 Graph
4K 3840x2160
22.7 24.2 24.2 ~ 24 fps    + Compare + 📈 Graph
» With all tested laptops playable in detail settings ultra.
Additional Benchmarks
Low Preset 1280x720
117.4
Epic Preset + Ray Tracing 1920x1080
57
56.7
low 1920x1080
167.9 192.7 ~ 180 fps    + Compare + 📈 Graph
med. 1920x1080
161.7 186.5 224 ~ 191 fps    + Compare + 📈 Graph
high 1920x1080
151.9 163 190.7 ~ 169 fps    + Compare + 📈 Graph
ultra 1920x1080
130.2 143.4 178.5 ~ 151 fps    + Compare + 📈 Graph
QHD 2560x1440
95.6 106.6 116.7 ~ 106 fps    + Compare + 📈 Graph
4K 3840x2160
47.5 52.5 ~ 50 fps    + Compare + 📈 Graph
» With all tested laptops playable in detail settings ultra.
Additional Benchmarks
Low Preset Low TAA 1280x720
171
180.4
low 1920x1080
73.1 98.6 114.4 ~ 95 fps    + Compare + 📈 Graph
med. 1920x1080
60.9 85.9 96.5 ~ 81 fps    + Compare + 📈 Graph
high 1920x1080
56.9 77.7 85.5 ~ 73 fps    + Compare + 📈 Graph
ultra 1920x1080
56 69.5 69.9 75 ~ 68 fps    + Compare + 📈 Graph
QHD 2560x1440
41.7 41.7 43.9 53.3 ~ 45 fps    + Compare + 📈 Graph
4K 3840x2160
30.6  fps    + Compare
» With all tested laptops playable in detail settings ultra.
Additional Benchmarks
Low Preset 1280x720
92.9
137.3
109.4
low 1920x1080
119.3 160.1 185.9 ~ 155 fps    + Compare + 📈 Graph
med. 1920x1080
108.3 117.6 123.4 133.5 ~ 121 fps    + Compare + 📈 Graph
high 1920x1080
105.5 111.5 113.1 120.8 ~ 113 fps    + Compare + 📈 Graph
ultra 1920x1080
74.8 80.5 82.4 86.7 ~ 81 fps    + Compare + 📈 Graph
QHD 2560x1440
58.5 61.3 61.5 ~ 60 fps    + Compare + 📈 Graph
» With all tested laptops playable in detail settings ultra.
Additional Benchmarks
Prioritize Performance Preset 1280x720
231
189.7
120.6
low 1920x1080
190 211.8 228.9 ~ 210 fps    + Compare
med. 1920x1080
171 174 186 191.4 205.1 ~ 186 fps    + Compare
high 1920x1080
135 145 155 156.5 159.7 ~ 150 fps    + Compare
ultra 1920x1080
134 140 150 153.9 157.5 ~ 147 fps    + Compare
QHD 2560x1440
106 107 114.8 115.1 ~ 111 fps    + Compare
4K 3840x2160
61 63 ~ 62 fps    + Compare
» With all tested laptops playable in detail settings ultra.
Additional Benchmarks
Minimum Settings 1280x720
307.4
237.2
217
low 1920x1080
98.3  fps    + Compare + 📈 Graph
med. 1920x1080
73.3 86.8 88.1 92.1 ~ 85 fps    + Compare + 📈 Graph
high 1920x1080
71.9 83.3 85.8 88.5 ~ 82 fps    + Compare + 📈 Graph
ultra 1920x1080
71.1 82.3 85.4 87.5 ~ 82 fps    + Compare + 📈 Graph
QHD 2560x1440
61 69.5 ~ 65 fps    + Compare + 📈 Graph
» With all tested laptops playable in detail settings ultra.
Additional Benchmarks
Ultra Low Preset 1280x720
101.8
low 1920x1080
176.6 199.8 ~ 188 fps    + Compare + 📈 Graph
med. 1920x1080
131.7 132.5 147.4 158.3 ~ 142 fps    + Compare + 📈 Graph
high 1920x1080
86.2 95 95.1 96.4 ~ 93 fps    + Compare + 📈 Graph
ultra 1920x1080
70.4 74.2 78 79 ~ 75 fps    + Compare + 📈 Graph
QHD 2560x1440
51.6 58.6 58.9 ~ 56 fps    + Compare + 📈 Graph
» With all tested laptops playable in detail settings ultra.
Additional Benchmarks
Low Preset 1280x720
208
181.7
Returnal

Returnal

2023
low 1920x1080
65 72 83 87 93 109 115 115 116 117 119 ~ 99 fps    + Compare
med. 1920x1080
69 71 81 85 90 111 112 113 114 115 115 117 ~ 99 fps    + Compare
high 1920x1080
64 67 76 81 85 101 101 102 104 104 105 106 ~ 91 fps    + Compare
ultra 1920x1080
54 59 61 73 77 79 85 87 88 88 88 90 ~ 77 fps    + Compare
QHD 2560x1440
39 41 52 52 55 63 63 64 64 66 66 66 ~ 58 fps    + Compare
4K 3840x2160
21 21 27 28 29 37 37 39 ~ 30 fps    + Compare
» With all tested laptops playable in detail settings ultra.
Additional Benchmarks
Low Preset 1280x720
150
126
144
139
132
Epic Preset + Epic Ray-Tracing 1920x1080
75
73
74
71
74
Epic Preset + Epic Ray-Tracing 3840x2160
18
low 1920x1080
103 112.6 ~ 108 fps    + Compare + 📈 Graph
med. 1920x1080
92 98.8 142.7 ~ 111 fps    + Compare + 📈 Graph
high 1920x1080
57 85.5 86 87 121.2 123 ~ 93 fps    + Compare + 📈 Graph
ultra 1920x1080
41 68.8 71 76 77.2 101.2 107 ~ 77 fps    + Compare + 📈 Graph
QHD 2560x1440
35 48.6 50 50 52 55.3 71 ~ 52 fps    + Compare + 📈 Graph
4K 3840x2160
24.8 27.7 ~ 26 fps    + Compare + 📈 Graph
» With all tested laptops playable in detail settings ultra.
Additional Benchmarks
Low Preset Low TAA 1280x720
190
109.9
Ultra Preset + Full Ray Tracing High TAA 1920x1080
43.9
34.2
Ultra Preset + Full Ray Tracing High TAA 3840x2160
5
low 1920x1080
97 100.9 102.8 104.6 ~ 101 fps    + Compare + 📈 Graph
med. 1920x1080
94 95.7 96.9 98.2 ~ 96 fps    + Compare + 📈 Graph
high 1920x1080
81 85.2 85.3 86.7 ~ 85 fps    + Compare + 📈 Graph
ultra 1920x1080
80 82.4 84.8 86.5 ~ 83 fps    + Compare + 📈 Graph
QHD 2560x1440
51 53.1 54 56.5 ~ 54 fps    + Compare + 📈 Graph
4K 3840x2160
26 26.5 ~ 26 fps    + Compare + 📈 Graph
» With all tested laptops playable in detail settings ultra.
Additional Benchmarks
Low Preset TAA 1280x720
135.5
133.4
131.9
low 1920x1080
271  fps    + Compare + 📈 Graph
med. 1920x1080
215  fps    + Compare + 📈 Graph
high 1920x1080
101 176.2 ~ 139 fps    + Compare + 📈 Graph
ultra 1920x1080
85 86.5 ~ 86 fps    + Compare + 📈 Graph
QHD 2560x1440
54  fps    + Compare
4K 3840x2160
28  fps    + Compare
» With all tested laptops playable in detail settings ultra.
Additional Benchmarks
RT Ultra Preset / On FXAA 1920x1080
36
40.4
low 1920x1080
220 236 ~ 228 fps    + Compare + 📈 Graph
med. 1920x1080
166.2 178 178.7 185.9 ~ 177 fps    + Compare + 📈 Graph
high 1920x1080
126.7 131.6 134.1 141.6 ~ 134 fps    + Compare + 📈 Graph
ultra 1920x1080
101.9 108.5 110.6 114 ~ 109 fps    + Compare + 📈 Graph
QHD 2560x1440
64.5 66.9 68.5 ~ 67 fps    + Compare + 📈 Graph
4K 3840x2160
25.7  fps    + Compare + 📈 Graph
» With all tested laptops playable in detail settings ultra.
Additional Benchmarks
Low Preset 1280x720
269
234
low 1920x1080
122.8 155.6 162.8 ~ 147 fps    + Compare
med. 1920x1080
113.8 127.5 142.2 ~ 128 fps    + Compare
high 1920x1080
111.8 121.8 136 ~ 123 fps    + Compare
ultra 1920x1080
78.9 79.7 83.5 88 ~ 83 fps    + Compare
QHD 2560x1440
58.4 59.1 66.7 68.3 ~ 63 fps    + Compare
4K 3840x2160
33  fps    + Compare
» With all tested laptops playable in detail settings ultra.
Additional Benchmarks
Low Preset (without FSR Upscaling) 1280x720
168.4
128.5
170.9
Ultra Preset (without FSR Upscaling) + Full Ray-Tracing 1920x1080
50.8
58.1
56.8
70
low 1920x1080
115.2 118.1 ~ 117 fps    + Compare + 📈 Graph
med. 1920x1080
107.7 112.1 131.1 ~ 117 fps    + Compare + 📈 Graph
high 1920x1080
99.1 101 110.1 ~ 103 fps    + Compare + 📈 Graph
ultra 1920x1080
89.1 94.2 97.2 ~ 94 fps    + Compare + 📈 Graph
QHD 2560x1440
67.7 77.7 82.6 ~ 76 fps    + Compare + 📈 Graph
4K 3840x2160
36.2 40 ~ 38 fps    + Compare + 📈 Graph
» With all tested laptops playable in detail settings ultra.
Additional Benchmarks
Low Preset 1280x720
119.6
115.3
high 1920x1080
115  fps    + Compare
ultra 1920x1080
82.3 90.5 110 ~ 94 fps    + Compare
QHD 2560x1440
53.1 68.9 86 ~ 69 fps    + Compare
4K 3840x2160
40.5 44 ~ 42 fps    + Compare
» With all tested laptops playable in detail settings ultra.
Additional Benchmarks
Very High Preset + Ray-Tracing TAA 1920x0180
71.4
high 1920x1080
111  fps    + Compare
ultra 1920x1080
80 100 100 101 102 105 105 106 108 ~ 101 fps    + Compare
QHD 2560x1440
59 71 72 72 72 74 76 76 77 ~ 72 fps    + Compare
4K 3840x2160
39 41 44 47 ~ 43 fps    + Compare
4K DLSS 3840x2160
71  fps    + Compare
» With all tested laptops playable in detail settings ultra.
low 1920x1080
92.7 94 ~ 93 fps    + Compare + 📈 Graph
med. 1920x1080
89.4 92.4 ~ 91 fps    + Compare + 📈 Graph
high 1920x1080
84.4 86.2 ~ 85 fps    + Compare + 📈 Graph
ultra 1920x1080
82.1 82.7 ~ 82 fps    + Compare + 📈 Graph
QHD 2560x1440
61 61.2 ~ 61 fps    + Compare + 📈 Graph
» With all tested laptops playable in detail settings ultra.
Additional Benchmarks
Low Preset 1280x720
102.9
med. 1920x1080
67.2 74.6 ~ 71 fps    + Compare + 📈 Graph
high 1920x1080
58.9 65.6 ~ 62 fps    + Compare + 📈 Graph
ultra 1920x1080
54.9 57.5 ~ 56 fps    + Compare + 📈 Graph
QHD 2560x1440
40.9  fps    + Compare + 📈 Graph
4K 3840x2160
23  fps    + Compare + 📈 Graph
» With all tested laptops playable in detail settings ultra.
FIFA 23

FIFA 23

2022
QHD 2560x1440
166.2  fps    + Compare + 📈 Graph
med. 1920x1080
146  fps    + Compare + 📈 Graph
high 1920x1080
122.1  fps    + Compare + 📈 Graph
ultra 1920x1080
98  fps    + Compare + 📈 Graph
QHD 2560x1440
68.2  fps    + Compare + 📈 Graph
4K 3840x2160
28.7  fps    + Compare + 📈 Graph
» With all tested laptops playable in detail settings ultra.
F1 22

F1 22

2022
low 1920x1080
138.5 151 155.1 192.3 192.9 194.5 206 216 220 225 232 235 239 247 252 256 256 256 258 262 275 279 301 310 311 320 ~ 238 fps    + Compare
med. 1920x1080
133.8 145.8 148.5 190 196.4 199.7 200 204 214 220 221 222 225 228 240 242 246 250 251 252 261 264 273 275 289 300 306 312 ~ 232 fps    + Compare
high 1920x1080
109 111.2 123.5 140.1 158.2 163 166.3 168.1 173.8 182 183 183.4 186.7 189.4 193.7 195.2 196.3 205 206 206 210 211 216 217 217 219 221 222 225 231 235 245 ~ 191 fps    + Compare
ultra 1920x1080
39.2 54 59.4 60.7 61.8 65.6 66.6 67 69.2 71 71.4 71.8 72.6 76.6 76.7 77.6 77.8 78.2 78.7 79.3 79.3 79.3 81.5 81.7 81.9 83.1 83.6 83.8 83.9 84.1 84.2 88.7 ~ 74 fps    + Compare
QHD 2560x1440
10.6 36 39.4 40.9 42.4 42.9 44.3 44.3 44.3 46.2 47 47.1 47.8 48.4 49 49.7 50.3 50.4 50.4 50.8 51.1 51.9 52.2 52.9 53.3 53.8 54.7 54.8 55.1 58.8 ~ 47 fps    + Compare
4K 3840x2160
4.7 18.8 21.5 24.5 24.7 25 25.4 25.9 25.9 26.3 26.4 26.5 26.5 26.6 27.6 ~ 24 fps    + Compare
» With all tested laptops playable in detail settings ultra.
Additional Benchmarks
Ultra Low Preset 16xAF TAA 1280x720
296
256
368
333
63.1
365
199.1
308
312
398
254
277
276
321
196.4
366
335
287
282
394
249
293
309
med. 1920x1080
212  fps    + Compare + 📈 Graph
high 1920x1080
199.9  fps    + Compare + 📈 Graph
ultra 1920x1080
195.7  fps    + Compare + 📈 Graph
QHD 2560x1440
148.6  fps    + Compare + 📈 Graph
4K 3840x2160
78.5  fps    + Compare + 📈 Graph
» With all tested laptops playable in detail settings ultra.
med. 1920x1080
172.7  fps    + Compare + 📈 Graph
high 1920x1080
171.7  fps    + Compare + 📈 Graph
ultra 1920x1080
165.9  fps    + Compare + 📈 Graph
QHD 2560x1440
108.7  fps    + Compare + 📈 Graph
4K 3840x2160
52.3  fps    + Compare + 📈 Graph
» With all tested laptops playable in detail settings ultra.
Additional Benchmarks
Highest Settings + Maximum Ray Tracing 1920x1080
73
69.6
low 1920x1080
98.1 183.5 218.7 219 227.5 230 237 239.8 241.7 244 244.3 245.9 250 263.6 283.4 ~ 228 fps    + Compare
med. 1920x1080
92.5 153.3 180.9 190.1 193.2 193.9 194.7 195.6 199.6 201.5 202 202.8 204.8 217.3 230.6 ~ 190 fps    + Compare
high 1920x1080
74.3 104.9 119.4 130.3 132.5 132.5 132.6 134.1 137.8 138.3 138.7 142 143.7 144.5 151.4 ~ 130 fps    + Compare
ultra 1920x1080
58.6 79.7 82.4 92.9 98 101.7 102 102.7 103.2 104.7 107.6 107.7 107.7 109.4 111.3 112.1 113.9 115.9 ~ 101 fps    + Compare
QHD 2560x1440
49.8 55.7 57.6 62.7 69.1 70.4 70.5 71.2 71.3 71.4 73.7 74.6 75.6 76.6 76.9 78.1 79.5 ~ 70 fps    + Compare
4K 3840x2160
28.3 31.1 33.6 33.8 34.8 35.2 35.5 36.9 37 37.3 37.4 39.2 39.7 ~ 35 fps    + Compare
» With all tested laptops playable in detail settings ultra.
Additional Benchmarks
Lowest Preset (DX12) 1280x720
319
277
345
286.3
231
low 1920x1080
55.3 102.1 106 128.5 129 130 135.4 138.3 147 147.8 155.9 182.8 185.8 ~ 134 fps    + Compare
med. 1920x1080
70 99.4 102 104 113 113.8 115 118.1 125.7 141.3 141.9 152.9 157.6 ~ 120 fps    + Compare
high 1920x1080
57.5 71 85.6 86 89 95 95.3 96 96.7 98 100.7 101 103 106.1 111.5 112 115.1 121.3 ~ 97 fps    + Compare
ultra 1920x1080
48 65 71 71.6 81.7 82 82 83.3 83.6 84.8 86 86.7 87 87.5 88.8 90 90.7 91 91 92.1 93.6 98.9 102.3 110 ~ 85 fps    + Compare
QHD 2560x1440
30 42 43 51.6 52 53.1 53.3 53.4 53.5 53.9 54 54 54.4 54.5 54.5 54.5 55.4 55.6 57 57.5 58.1 61 61 63.9 ~ 53 fps    + Compare
4K 3840x2160
12.8 18.7 19.6 23.1 23.3 23.5 23.9 24 24.4 24.7 26 ~ 22 fps    + Compare
» With all tested laptops playable in detail settings ultra.
Additional Benchmarks
Low Preset 1280x720
148.4
129
161.3
Ray Tracing Ultra Preset (DLSS off) 1920x1080
65
42
36.2
57.1
41
Ray Tracing Ultra Preset (DLSS off) 3840x2160
7.8
Elex 2

Elex 2

2022
med. 1920x1080
118.7  fps    + Compare + 📈 Graph
high 1920x1080
118.2  fps    + Compare + 📈 Graph
ultra 1920x1080
112.9  fps    + Compare + 📈 Graph
QHD 2560x1440
78.9  fps    + Compare + 📈 Graph
4K 3840x2160
40  fps    + Compare + 📈 Graph
» With all tested laptops playable in detail settings ultra.
low 1920x1080
147.7 182.9 ~ 165 fps    + Compare
med. 1920x1080
132.7 164.1 ~ 148 fps    + Compare
high 1920x1080
125.6 150.1 ~ 138 fps    + Compare
ultra 1920x1080
115.9 131.7 ~ 124 fps    + Compare
QHD 2560x1440
101.4 112.1 ~ 107 fps    + Compare
4K 3840x2160
69.6  fps    + Compare
» With all tested laptops playable in detail settings ultra.
Additional Benchmarks
Low Preset 1280x720
186.1
148.1
med. 1920x1080
59.6  fps    + Compare + 📈 Graph
high 1920x1080
59.5  fps    + Compare + 📈 Graph
ultra 1920x1080
59.5  fps    + Compare + 📈 Graph
QHD 2560x1440
59.5  fps    + Compare + 📈 Graph
4K 3840x2160
45  fps    + Compare + 📈 Graph
» With all tested laptops playable in detail settings ultra.
high 1920x1080
95  fps    + Compare
QHD 2560x1440
64  fps    + Compare
4K 3840x2160
32  fps    + Compare
» With all tested laptops playable in detail settings high.
Additional Benchmarks
High Quality Raytracing 1920x1080
42
med. 1920x1080
253  fps    + Compare
high 1920x1080
240  fps    + Compare
ultra 1920x1080
188  fps    + Compare
QHD 2560x1440
125  fps    + Compare
4K 3840x2160
64  fps    + Compare
» With all tested laptops playable in detail settings ultra.
low 1920x1080
139.8 143.1 146.5 149 ~ 145 fps    + Compare + 📈 Graph
med. 1920x1080
119.5 123.2 124.5 129 ~ 124 fps    + Compare + 📈 Graph
high 1920x1080
95.6 98.6 101.1 105 109 ~ 102 fps    + Compare + 📈 Graph
ultra 1920x1080
68.8 68.9 69.4 74 80 ~ 72 fps    + Compare + 📈 Graph
QHD 2560x1440
58.5 59 59.2 60 65 ~ 60 fps    + Compare + 📈 Graph
4K 3840x2160
40.3 41.1 43 ~ 41 fps    + Compare + 📈 Graph
» With all tested laptops playable in detail settings ultra.
Additional Benchmarks
Low Preset 1280x720
182.7
155
159.2
139
med. 1920x1080
172.7  fps    + Compare + 📈 Graph
high 1920x1080
149.1  fps    + Compare + 📈 Graph
ultra 1920x1080
140.6  fps    + Compare + 📈 Graph
QHD 2560x1440
102.5  fps    + Compare + 📈 Graph
4K 3840x2160
57.5  fps    + Compare + 📈 Graph
» With all tested laptops playable in detail settings ultra.
med. 1920x1080
203  fps    + Compare + 📈 Graph
high 1920x1080
148.2  fps    + Compare + 📈 Graph
ultra 1920x1080
138.9  fps    + Compare + 📈 Graph
QHD 2560x1440
137  fps    + Compare + 📈 Graph
4K 3840x2160
94.1  fps    + Compare + 📈 Graph
» With all tested laptops playable in detail settings ultra.
low 1280x720
301  fps    + Compare
med. 1920x1080
216  fps    + Compare
high 1920x1080
195  fps    + Compare
ultra 1920x1080
118  fps    + Compare
QHD 2560x1440
97  fps    + Compare
4K 3840x2160
64  fps    + Compare
» With all tested laptops playable in detail settings ultra.
Additional Benchmarks
Low Preset 1920x1080
237
med. 1920x1080
160  fps    + Compare
high 1920x1080
135  fps    + Compare
ultra 1920x1080
121  fps    + Compare
QHD 2560x1440
87  fps    + Compare
4K 3840x2160
49  fps    + Compare
» With all tested laptops playable in detail settings ultra.
med. 1920x1080
148  fps    + Compare
high 1920x1080
147  fps    + Compare
ultra 1920x1080
144  fps    + Compare
QHD 2560x1440
108  fps    + Compare
4K 3840x2160
60  fps    + Compare
» With all tested laptops playable in detail settings ultra.
Additional Benchmarks
Ultra Preset + Ultra Ray-Tracing 1920x1080
85
med. 1920x1080
252  fps    + Compare + 📈 Graph
high 1920x1080
221  fps    + Compare + 📈 Graph
ultra 1920x1080
209  fps    + Compare + 📈 Graph
QHD 2560x1440
129.4  fps    + Compare + 📈 Graph
4K 3840x2160
73.7  fps    + Compare + 📈 Graph
» With all tested laptops playable in detail settings ultra.
Far Cry 6

Far Cry 6

2021
low 1280x720
133.1 136.7 150.2 168.8 201 ~ 158 fps    + Compare + 📈 Graph
med. 1920x1080
117.1 121.1 132.1 143 160 ~ 135 fps    + Compare + 📈 Graph
high 1920x1080
105.1 109.6 120.8 126.5 139.1 144 ~ 124 fps    + Compare + 📈 Graph
ultra 1920x1080
89 92 96.3 102.4 103 105 107.3 110 114.5 116.2 123.1 126 ~ 107 fps    + Compare + 📈 Graph
QHD 2560x1440
70 74.5 77 82 86.2 86.7 87 88 88.3 91 91 ~ 84 fps    + Compare + 📈 Graph
4K 3840x2160
10.1 12.8 43 48 ~ 28 fps    + Compare + 📈 Graph
» With all tested laptops playable in detail settings ultra.
Additional Benchmarks
Low Graphics Quality 1920x1080
158.5
143.7
143.7
130.1
178.9
126.2
Ultra Graphics Quality + HD Textures + DXR TAA 1920x1080
78
85.2
86.9
Deathloop

Deathloop

2021
med. 1920x1080
139.9  fps    + Compare + 📈 Graph
high 1920x1080
129.8  fps    + Compare + 📈 Graph
ultra 1920x1080
106.3  fps    + Compare + 📈 Graph
QHD 2560x1440
65.4  fps    + Compare + 📈 Graph
4K 3840x2160
37.4  fps    + Compare + 📈 Graph
» With all tested laptops playable in detail settings ultra.
F1 2021

F1 2021

2021
low 1280x720
294 299 310 339 378 441 520 ~ 369 fps    + Compare
med. 1920x1080
182.6 262 270 276 295 300 336 407 ~ 291 fps    + Compare
high 1920x1080
162.5 220 220 234 238 258 264 306 ~ 238 fps    + Compare
ultra 1920x1080
118.4 123.1 129 133.1 139.5 143.6 149.8 157.5 ~ 137 fps    + Compare
QHD 2560x1440
88.6 95.2 96.6 104.3 108.5 110.9 113 114.7 ~ 104 fps    + Compare
4K 3840x2160
59.7 63.4 ~ 62 fps    + Compare
» With all tested laptops playable in detail settings ultra.
Days Gone

Days Gone

2021
med. 1920x1080
173.2  fps    + Compare + 📈 Graph
high 1920x1080
154.7  fps    + Compare + 📈 Graph
ultra 1920x1080
119.2  fps    + Compare + 📈 Graph
QHD 2560x1440
83.8  fps    + Compare + 📈 Graph
4K 3840x2160
45  fps    + Compare + 📈 Graph
» With all tested laptops playable in detail settings ultra.
med. 1920x1080
220  fps    + Compare + 📈 Graph
high 1920x1080
212  fps    + Compare + 📈 Graph
ultra 1920x1080
189.7  fps    + Compare + 📈 Graph
QHD 2560x1440
128.6  fps    + Compare + 📈 Graph
4K 3840x2160
62.7  fps    + Compare + 📈 Graph
» With all tested laptops playable in detail settings ultra.
Additional Benchmarks
Ray Tracing Preset 1920x1080
115.6
Outriders

Outriders

2021
med. 1920x1080
165.3  fps    + Compare + 📈 Graph
high 1920x1080
145.2  fps    + Compare + 📈 Graph
ultra 1920x1080
129.4  fps    + Compare + 📈 Graph
QHD 2560x1440
90  fps    + Compare + 📈 Graph
4K 3840x2160
46.3  fps    + Compare + 📈 Graph
» With all tested laptops playable in detail settings ultra.
Hitman 3

Hitman 3

2021
low 1280x720
294.3  fps    + Compare
med. 1920x1080
234  fps    + Compare
high 1920x1080
208.4  fps    + Compare
ultra 1920x1080
197.4  fps    + Compare
QHD 2560x1440
129.9  fps    + Compare
4K 3840x2160
68.5  fps    + Compare
» With all tested laptops playable in detail settings ultra.
Additional Benchmarks
Minimum Settings 1920x1080
284.1
ultra 1920x1080
86 101 106 ~ 98 fps    + Compare
QHD 2560x1440
65 75 78 ~ 73 fps    + Compare
4K 3840x2160
41 43 ~ 42 fps    + Compare
» With all tested laptops playable in detail settings ultra.
high 1920x1080
130  fps    + Compare
ultra 1920x1080
89  fps    + Compare
QHD 2560x1440
64  fps    + Compare
4K 3840x2160
33  fps    + Compare
» With all tested laptops playable in detail settings ultra.
Additional Benchmarks
Ultra Preset + Ultra Ray Tracing (DX12) 1920x1080
45
low 1280x720
158.8  fps    + Compare + 📈 Graph
med. 1920x1080
117.2  fps    + Compare + 📈 Graph
high 1920x1080
82.5  fps    + Compare + 📈 Graph
ultra 1920x1080
64.8  fps    + Compare + 📈 Graph
QHD 2560x1440
50.1  fps    + Compare + 📈 Graph
» With all tested laptops playable in detail settings ultra.
Additional Benchmarks
Low-End TAAAA 1920x1080
151.8
high 1920x1080
143  fps    + Compare
ultra 1920x1080
126  fps    + Compare
QHD 2560x1440
98  fps    + Compare
4K 3840x2160
52  fps    + Compare
» With all tested laptops playable in detail settings ultra.
F1 2020

F1 2020

2020
low 1280x720
267 331 ~ 299 fps    + Compare
med. 1920x1080
230 276 ~ 253 fps    + Compare
high 1920x1080
228 235 ~ 232 fps    + Compare
ultra 1920x1080
183 186.9 ~ 185 fps    + Compare
QHD 2560x1440
142.6 143.8 ~ 143 fps    + Compare
4K 3840x2160
83.5  fps    + Compare
» With all tested laptops playable in detail settings ultra.
low 1280x720
135.3 141.3 175.9 258.5 ~ 178 fps    + Compare
med. 1920x1080
117.6 124.1 145.9 200.1 ~ 147 fps    + Compare
high 1920x1080
106.6 110.1 119.7 131.8 139 ~ 121 fps    + Compare
ultra 1920x1080
93.7 94.7 98.6 100.3 109 ~ 99 fps    + Compare
QHD 2560x1440
68.7 71.5 72.3 72.5 75 ~ 72 fps    + Compare
4K 3840x2160
33.8 35.7 38.5 40 ~ 37 fps    + Compare
» With all tested laptops playable in detail settings ultra.
Additional Benchmarks
Very Low Overall Quality (DX11) 1920x1080
252.8
166.7
134.9
138.8
low 1280x720
326  fps    + Compare
med. 1920x1080
293  fps    + Compare
high 1920x1080
133  fps    + Compare
ultra 1920x1080
96  fps    + Compare
QHD 2560x1440
59  fps    + Compare
4K 3840x2160
29  fps    + Compare
» With all tested laptops playable in detail settings ultra.
Anno 1800

Anno 1800

2019
low 1280x720
117.6 164.5 ~ 141 fps    + Compare + 📈 Graph
med. 1920x1080
107.3 144.2 ~ 126 fps    + Compare + 📈 Graph
high 1920x1080
91.5 125.9 ~ 109 fps    + Compare + 📈 Graph
ultra 1920x1080
60.4 69.9 ~ 65 fps    + Compare + 📈 Graph
QHD 2560x1440
53.4 65.4 ~ 59 fps    + Compare + 📈 Graph
4K 3840x2160
52.8 54.3 ~ 54 fps    + Compare + 📈 Graph
» With all tested laptops playable in detail settings ultra.
low 1280x720
124 165 172 ~ 154 fps    + Compare + 📈 Graph
med. 1920x1080
107 140 144 ~ 130 fps    + Compare + 📈 Graph
high 1920x1080
102 135 137 ~ 125 fps    + Compare + 📈 Graph
ultra 1920x1080
92 120 124 ~ 112 fps    + Compare + 📈 Graph
QHD 2560x1440
88 105 109 ~ 101 fps    + Compare + 📈 Graph
4K 3840x2160
56 61 ~ 59 fps    + Compare + 📈 Graph
» With all tested laptops playable in detail settings ultra.
low 1280x720
193.5 196 208.9 221 ~ 205 fps    + Compare
med. 1920x1080
128.5 133 139.8 141.3 ~ 136 fps    + Compare
high 1920x1080
105 109.7 109.8 110.3 117 ~ 110 fps    + Compare
ultra 1920x1080
83.2 83.5 86.8 87.2 91 ~ 86 fps    + Compare
QHD 2560x1440
68 69 69.1 71.2 72 ~ 70 fps    + Compare
4K 3840x2160
43.5 44 44.5 46 ~ 45 fps    + Compare
» With all tested laptops playable in detail settings ultra.
Additional Benchmarks
Ultra Quality DXR 16xAF 1920x1080
78
74.4
74.3
72.2
72.5
low 1280x720
160.3 165.3 206 245 ~ 194 fps    + Compare
med. 1920x1080
153 158 159.9 163.4 ~ 159 fps    + Compare
high 1920x1080
148.7 152.4 158.1 171.3 172 ~ 161 fps    + Compare
ultra 1920x1080
117 131 137 141.9 143.9 145.9 153 155.9 158 158 158 168 ~ 147 fps    + Compare
QHD 2560x1440
86 99 102 103 103.2 104 106.2 107 107.1 110 119 129 ~ 106 fps    + Compare
4K 3840x2160
46.5 50 51.9 53 53 53.2 70 ~ 54 fps    + Compare
» With all tested laptops playable in detail settings ultra.
Additional Benchmarks
Lowest Preset 1920x1080
183.7
173.1
216
160.5
Strange Brigade

Strange Brigade

2018
low 1280x720
315 318 333 334 340 347 357 362 367 368 370 375 390 393 408 414 418 420 423 427 431 436 439 455 457 464 468 470 476 477 481 483 485 490 490 496 501 514 537 544 558 567 636 ~ 438 fps    + Compare
med. 1920x1080
162.1 172.1 224 238 242 249 249 258 261 265 266 268 270 270 272 273 276 276 277 277 278 280 282 284 286 295 295 295 297 300 300 300 300 302 302 305 305 306 308 309 310 310 311 313 315 316 326 332 334 340 ~ 284 fps    + Compare
high 1920x1080
136.6 150.6 164.5 173.9 192 192.4 202 202 211 211 213 215 215 217 220 220 221 221 223 224 225 227 227 230 231 232 233 233 233 235 235 236 236 237 240 241 243 244 244 244 244 245 245 245 247 249 249 250 250 252 255 255 259 260 268 ~ 227 fps    + Compare
ultra 1920x1080
76.3 117.7 129.3 142.7 148.7 165.4 174.7 174.8 175 180.5 180.9 183 187.1 190.3 190.6 191.7 192 192.6 192.8 194 194.2 195 195.7 196.7 196.9 200 201 202 202 202 203 204 204 205 205 206 206 207 208 208 208 209 209 209 210 210 211 213 213 213 213 214 214 214 217 218 219 219 220 222 223 228 234 ~ 197 fps    + Compare
QHD 2560x1440
52.8 79.9 95.3 106.2 113.6 116 121.2 121.8 122.8 123 123.4 125.3 126.3 126.7 127.9 129 130 131.4 131.6 132 132 132.8 133.1 133.2 133.3 133.5 133.6 133.9 134 134.3 134.4 135.2 135.9 136.2 136.6 136.7 136.7 137.7 138.1 138.3 138.7 138.8 139 139.2 139.3 139.3 139.8 141.7 142.3 143 143.3 145.6 146.4 149.2 150.9 ~ 130 fps    + Compare
4K 3840x2160
42.7 61.7 66.7 67.6 68.4 69.1 70.4 71.4 71.6 71.9 72.6 73.2 73.8 74.7 75.3 75.7 76.8 77.9 ~ 70 fps    + Compare
» With all tested laptops playable in detail settings ultra.
low 1280x720
217  fps    + Compare + 📈 Graph
med. 1920x1080
177.4  fps    + Compare + 📈 Graph
high 1920x1080
169  fps    + Compare + 📈 Graph
ultra 1920x1080
135.8  fps    + Compare + 📈 Graph
QHD 2560x1440
83.4  fps    + Compare + 📈 Graph
4K 3840x2160
39.9  fps    + Compare + 📈 Graph
» With all tested laptops playable in detail settings ultra.
Far Cry 5

Far Cry 5

2018
low 1280x720
132 137 139 140 141 147 147 150 151 156 158 168 173 178 183 184 187 187 188 190 191 193 197 202 204 ~ 169 fps    + Compare + 📈 Graph
med. 1920x1080
115 119 120 123 123 124 125 126 126 127 130 133 134 134 134 138 139 146 153 156 157 157 161 162 163 163 163 166 168 176 179 183 ~ 144 fps    + Compare + 📈 Graph
high 1920x1080
98 110 114 115 116 117 118 118 119 121 122 122 124 124 125 127 130 133 133 134 141 145 145 149 150 151 151 153 154 154 154 157 159 166 169 170 ~ 136 fps    + Compare + 📈 Graph
ultra 1920x1080
92 103 103 109 109 110 110 111 112 114 114 115 115 116 116 120 121 123 123 123 124 132 136 138 140 141 143 144 144 145 145 146 147 149 157 158 158 ~ 127 fps    + Compare + 📈 Graph
QHD 2560x1440
79 94 94 95 95 98 101 102 102 102 103 108 108 109 111 111 112 113 113 113 114 114 114 115 115 115 117 117 118 119 122 124 128 ~ 109 fps    + Compare + 📈 Graph
4K 3840x2160
54 55 59 59 60 61 61 61 62 65 ~ 60 fps    + Compare + 📈 Graph
» With all tested laptops playable in detail settings ultra.
Additional Benchmarks
Low Preset TAA 1920x1080
185
175
178
182
176
129
170
150
136
196
167
143
178
low 1280x720
80.6 88.9 95.2 95.4 96.5 100.5 103.6 106.3 107 109.9 114.7 117.1 119.3 119.9 121 121.6 121.8 123.6 123.7 125.1 128.8 130 130.5 130.6 130.8 132.3 133.9 134.2 136 139.9 142.5 143.4 144.7 146 147.6 154.6 154.8 158.5 159.9 160 162.3 164.9 165.7 166.6 166.7 169.3 172.4 178 181.6 182.3 182.9 186.3 186.7 187.5 188.3 188.7 189.4 191.5 192.8 194.4 198 203 205 207 212 218 ~ 150 fps    + Compare
med. 1920x1080
74.7 80.4 82 88.7 90.7 91.6 94.2 98 99.5 101.6 101.7 101.9 103.8 103.8 106.3 106.6 107.3 108.3 108.5 108.8 111.9 112.6 114.8 115.7 116 116.5 116.6 118.1 118.3 118.7 122.2 122.6 124.4 130.6 130.8 133.1 133.8 138.4 141.7 141.8 142.1 142.4 143.3 145.5 145.8 146.4 147.3 148 151.8 155.2 155.9 156 158.7 161.7 163 164.3 164.7 165.6 168.1 169.8 173.3 173.3 178.9 179.8 180.6 187.1 191.1 ~ 131 fps    + Compare
high 1920x1080
52.1 58.9 66.2 72.2 72.3 74.1 76.3 76.8 78 78.4 80.7 81.2 82 83.5 84.1 84.4 84.7 84.8 84.8 85.5 86.2 87.8 87.8 89.2 89.5 89.7 89.8 90.5 90.6 90.8 95.4 98 100.6 101.4 102 103 106.4 109.7 110.2 110.3 112.6 113.4 113.4 114.9 115.3 117.1 117.8 119.5 119.5 120.8 121.2 122.4 123 123.6 126.3 126.4 128.4 128.5 129.2 131.1 132.9 133 136.9 137.6 137.9 138.2 138.4 144.4 147.9 ~ 104 fps    + Compare
4K 3840x2160
63.4 65.2 67.3 68.6 68.9 73 73.4 74 76.6 78.2 85.7 89.7 90 98.5 99.5 102.2 103.4 105.7 109.2 112.8 113.5 114 117.7 120.3 122.7 125.8 ~ 93 fps    + Compare
» With all tested laptops playable in detail settings high.
low 1280x720
108.6 150.2 161.8 171.8 173.8 174.8 175.3 176.6 184.6 185.2 186.2 187.6 189.3 189.6 191.3 198.5 201 202 205 205 208 212 213 213 214 214 215 215 215 216 218 219 220 220 221 223 226 227 227 227 229 231 ~ 201 fps    + Compare
med. 1920x1080
84 121.8 123.2 128.2 128.3 131.8 132.3 132.3 132.4 135.2 135.6 138 139.1 140.5 140.8 141.1 143.2 144.4 145 146.3 147.5 147.7 150.5 151.7 151.9 151.9 152.9 153.1 154.2 154.9 155.7 156.2 159.1 159.8 162.2 162.3 162.4 162.8 163.6 163.9 164.8 165.1 166.2 166.3 166.8 166.9 167.2 168.8 169.2 170.8 171.4 172.5 173.7 175.2 175.5 177.3 185.9 ~ 152 fps    + Compare
high 1920x1080
41 66 82 93.1 93.3 94.7 99.7 100.8 101.1 101.4 101.7 103.1 103.3 104 104.6 106.3 107.1 108.3 108.3 108.7 109 109.1 109.3 110.6 110.6 111.5 111.9 112.7 113.9 114.3 114.3 114.3 114.7 114.8 115 115.2 115.3 115.4 115.5 115.5 115.7 116.1 116.2 117.2 117.3 117.5 119.3 119.4 119.7 119.8 119.9 120 120.1 120.5 121.2 121.2 121.5 121.9 122.1 122.7 124.6 124.8 128.1 131 131.9 ~ 111 fps    + Compare
QHD 2560x1440
32.5 48.8 60.2 69.9 70 71.6 73.7 74.1 75.3 75.5 76.1 76.3 77.9 79.5 80 80.9 81.2 81.3 81.6 82 82.6 82.6 83 83.3 83.7 83.8 84.1 84.1 84.1 84.4 84.7 84.7 85.2 85.2 85.3 85.6 85.8 86.1 86.2 86.8 86.9 87.5 88.2 88.4 88.6 88.7 88.9 89 89.1 89.5 90.5 91 91.4 91.9 94.5 95.1 119.9 ~ 82 fps    + Compare
4K 3840x2160
26.6 38.2 40.3 44.9 45 45.4 46.1 46.1 46.6 46.7 46.9 46.9 47.1 47.2 47.5 47.5 48.5 48.5 48.8 49.2 49.4 51.5 52.8 ~ 46 fps    + Compare
» With all tested laptops playable in detail settings high.
low 1280x720
89.8 102.1 135.8 137.7 149.5 149.6 152.5 157.1 158.8 161.2 161.6 161.7 161.7 162.3 164.1 164.6 164.7 165.3 165.7 166.4 166.8 166.9 168.4 169.3 169.6 171 171.7 173.3 173.4 173.9 174 178.3 178.4 186.9 189.5 189.6 191.9 192.8 193.5 194.7 199.2 202 203 203 205 210 212 213 215 219 222 224.3 225 230 231 231 232 233 233 234 238 247 252.7 ~ 186 fps    + Compare
med. 1366x768
89.6 98.2 122.8 130.5 131.9 136.1 138.8 140.6 144 144.5 144.5 146.4 146.7 146.8 147.9 148.2 149 149.2 149.8 150 150.3 150.5 151.4 152 152.5 152.8 153 153.5 154 155.7 157 158 161.3 163.1 167.6 169 173.2 174.3 174.5 174.6 178.9 181.1 182.3 183.2 183.3 185.1 186.9 187.5 187.9 187.9 192 192.8 196.2 198.8 200 203 205 205 206 207 208 208 216 217.3 ~ 166 fps    + Compare
high 1920x1080
88.2 89.5 99.7 114.5 118.9 126.3 127.7 131.9 135.9 137.3 138.1 138.6 139.3 139.9 140.7 141 141.6 142 142.2 142.8 143 143.4 143.6 144.1 144.3 145.3 145.3 146.3 147.6 148.1 148.1 149.1 149.5 150.9 152.4 160.5 161.1 162.4 164.4 165.9 167 168.7 169.8 169.9 170.6 171.5 171.6 172.5 175.8 176.5 177.3 179.6 181.6 184.4 187.2 188.1 188.4 191 191.8 193.4 194.9 195.4 196.5 196.7 199.1 203 209.9 ~ 158 fps    + Compare
ultra 1920x1080
89.7 89.8 97.4 108.3 114.8 119.5 120.7 121.9 122.8 126.3 126.9 127.4 129.9 130 130.8 131.6 131.6 132.6 133.9 134.8 135 135.2 135.9 136.1 136.1 137 137.8 138.5 139 139.2 139.7 141.6 143.1 143.8 144.5 149.4 149.9 154.1 154.7 154.7 156.9 158.3 158.6 158.8 160.2 160.8 162.2 162.8 163.4 164.5 165 165.3 166.3 168.4 170.2 171.6 175.4 178.6 179.5 180.6 180.9 181.7 182 182.1 185.3 187.5 191.2 ~ 148 fps    + Compare
4K 3840x2160
88.4 107 108 112.2 115.7 117.3 118.6 119.6 123.6 124.3 128.3 129.9 130.6 132.4 133.5 134.6 135.2 136.9 137.1 141.3 142.5 145.5 146.6 150.7 151.5 153.3 ~ 129 fps    + Compare
» With all tested laptops playable in detail settings ultra.
low 1024x768
313.8 322.5 335.2 354.2 364.2 380 399 399.6 415.2 426 428 432.4 435 452.3 459.3 474.9 484.7 489 500.9 545 556.7 597 603.3 606.3 607.3 617 ~ 461 fps    + Compare + 📈 Graph
med. 1366x768
123.3 233.3 277.3 291.5 295.9 297.6 317 327 328 338 344.6 356.8 365.4 366 366.3 371 371.8 375.9 379 390.1 390.5 391.4 405.9 415.1 418.4 430.3 448.7 ~ 349 fps    + Compare + 📈 Graph
high 1920x1080
123.9 161 181.4 195 201 203 205 213.3 216 218.5 221 222.7 223 223 224 225.9 226 226 226.7 228.3 228.7 230.9 231.4 234.9 236 237 239 240.5 240.9 242 242.3 245.2 246 246.2 247 249 252 257.3 258 260.5 268.3 ~ 227 fps    + Compare + 📈 Graph
ultra 1920x1080
69.8 71 75 83.2 87.8 94 96.2 97.1 98.6 103 105.3 105.4 106.9 107.1 107.8 109.5 110 110 110 111.8 112 113.1 113.2 113.9 114 114 115 116 116 116.8 117 117 117.9 118.4 119 119 119.8 120 120.4 120.7 121 121 121.1 121.3 122 123.2 123.3 124 125.4 125.4 126.2 127 127.2 128 129 133 133.7 ~ 113 fps    + Compare + 📈 Graph
QHD 2560x1440
47 73 77.7 81.6 82.4 86.9 88 88.5 89 91.1 92 92 92.2 92.2 92.7 93.1 ~ 85 fps    + Compare + 📈 Graph
4K 3840x2160
26.5 59 60 65.7 68.5 69.4 70 71 71.7 72 72.4 72.5 75.2 76.2 78.8 83.5 ~ 68 fps    + Compare + 📈 Graph
» With all tested laptops playable in detail settings ultra.
Additional Benchmarks
Ultra Graphics & Postprocessing (HBAO+) 3840x2160
46
50.6
48.4
49.6
49.9
Medium Graphics & Postprocessing 1920x1080
263
260.1
277.8
284
290
GTA V

GTA V

2015
low 1024x768
162.7 170.6 174.4 174.9 178.9 179.7 180 180.6 182.2 182.4 182.8 183.1 183.3 184 184 184.8 185.1 185.3 185.4 185.8 186.1 186.1 186.6 186.7 186.7 186.8 187 187 187 187.1 187.3 187.3 187.5 187.8 ~ 183 fps    + Compare
med. 1366x768
158.6 165.6 168.1 168.5 169.7 170 171.6 173.4 174.2 174.9 175.1 175.4 175.5 175.8 176 176.8 177 177.7 179 179.8 180.3 180.4 180.9 181 181.2 182.2 182.5 182.5 183.4 184.1 184.5 184.7 184.7 184.9 184.9 185.1 185.9 185.9 185.9 186.4 186.5 186.9 187 187 187.2 ~ 179 fps    + Compare
high 1920x1080
134.3 142.4 150.1 152.8 155.8 156.9 158.3 158.9 160 163.1 164.5 164.8 164.9 165.8 166.4 166.5 166.8 167 167.1 167.9 167.9 168 169 169.8 170.7 171.1 171.4 172.7 174.1 175 175 175.3 175.7 176 176.5 176.9 178.1 178.3 178.6 179 179.4 179.7 180.2 180.3 180.8 180.9 180.9 181.1 181.3 181.6 181.7 182.4 182.9 183.1 183.1 183.8 186.4 ~ 171 fps    + Compare
ultra 1920x1080
48.3 63.5 74.7 89.5 90.4 94.4 94.8 95.7 96.5 97.4 98.8 100.3 102.7 103.6 103.9 104.3 104.5 104.6 104.8 105.3 105.6 105.9 105.9 107.2 108.7 108.9 109.9 110.5 110.9 111.2 112.8 114 114.2 114.3 115.1 115.2 115.8 116.1 116.4 116.6 117.2 117.4 117.7 117.8 119.7 119.9 120 121.4 123 123.2 124.1 124.7 124.8 125.4 126 127.2 127.8 128 130.5 132.2 137.6 140.5 141.6 ~ 111 fps    + Compare
QHD 2560x1440
36.9 52.9 64.5 72.6 75.5 75.9 79.6 80.2 80.6 81.3 81.6 82.2 82.3 82.6 86.1 86.6 86.8 87.1 87.6 87.6 87.6 88.3 88.5 88.8 89.7 90 90.2 90.4 90.5 90.6 90.6 90.6 91.6 92.2 92.3 92.8 93.1 93.2 93.2 93.4 93.6 94.2 94.3 94.5 95.2 95.9 98.1 98.2 99.5 100.1 102.2 ~ 87 fps    + Compare
4K 3840x2160
53 75 76.9 83.7 87.7 88.5 88.8 89.8 90 90.1 90.4 90.9 92.5 93.6 93.7 98.7 99.8 ~ 87 fps    + Compare
» With all tested laptops playable in detail settings ultra.
Additional Benchmarks
Highest Settings possible 16xAF 4xMSAA + FXAA 3840x2160
40.5
38.2
40.7
25.9
40.9
36.4
41.5
43.9
42.7
44.1
40.5
40.6
41.3
41.4
41
Normal/Off 4xAF 1920x1080
186.4
185.5
182.7
185.7
172.1
186.2
182.7
68.2
186.3
159.9
185.6
182.1
183.5
184.4
180
173.7
175.8
179.5
169
167
175.7
179.2
179.4
186
170.6
175.4
181.2
186
186.3
186.8
187.5
174.4
171.2
176.4
177
181.3
186.5
183.7
179.4
168.2
Lowest Settings possible 1920x1080
186.6
187
187.1
181.7
187.4
187.2
73.7
187.3
157.5
187
185.9
185.7
186.6
183
179.2
182.4
184.9
173
132.1
186.8
183.4
186.8
187
187.5
187.9
186.5
179.4
175.6
180.8
183.7
187.5
187
183.6
174.3
lowmed.highultraQHD4K
F1 2520519917427134
Doom: The Dark Ages867769674215.4
The Elder Scrolls IV Oblivion Remastered96.796.566.530.521.8
Assassin's Creed Shadows695950352815
Civilization 72271691247033
Monster Hunter Wilds7765392816
Kingdom Come Deliverance 2147.610992664625
Indiana Jones and the Great Circle113724524.715.6
Stalker 279.4615447356
Call of Duty Black Ops 614112392846340
Until Dawn1049170544023
EA Sports FC 25193.6123.1121.8108.471.6
God of War Ragnarök155123110946931
Final Fantasy XVI757061553921
Space Marine 2777371715530
Star Wars Outlaws705548402915
Black Myth: Wukong917054302210
Once Human1871401151077034
The First Descendant16611091795127
F1 24237230198724622
Senua's Saga Hellblade 28060432912
Ghost of Tsushima1079587685128
Horizon Forbidden West1019371645131
Alone in the Dark1941771671196516
Dragon's Dogma 274685531
Last Epoch169.71761671378137.4
Skull & Bones11711396785936
Helldivers 21281161021007339
Enshrouded75.265544123.5
Palworld118.41071037542.7
Prince of Persia The Lost Crown341346345340186.7
Ready or Not2202011489040.6
The Finals2081881781469043
Avatar Frontiers of Pandora918574563819
Call of Duty Modern Warfare 3 20231611461121047449
EA Sports WRC147.49891846537
Alan Wake 27973694320
Lords of the Fallen1029173563821
Total War Pharaoh3462361521209347
Assassin's Creed Mirage144135127977641
EA Sports FC 24192.7162.3150.1138.482.4
Counter-Strike 21721611319455.4
Cyberpunk 2077 2.2 Phantom Liberty12411093794922
Baldur's Gate 31551261051027239
Lies of P2011821591429848
The Crew Motorfest6060605939
Starfield65524737.224
Armored Core 6104103998145.2
Immortals of Aveum58473419.7
Atlas Fallen1291211078551
Ratchet & Clank Rift Apart90.47661564933.2
F1 23228228191684321
Diablo 424923020818011360.9
Star Wars Jedi Survivor878175714524
Dead Island 218019116915110650
The Last of Us958173684530.6
Resident Evil 4 Remake1551211138160
Company of Heroes 321018615014711162
Sons of the Forest98.385828265
Atomic Heart188142937556
Returnal999991775830
Hogwarts Legacy10811193775226
Dead Space Remake1019685835426
The Witcher 3 v4271215139865428
High On Life2281771341096725.7
The Callisto Protocol147128123836332.96
Need for Speed Unbound117117103947638
Spider-Man Miles Morales115946942
Call of Duty Modern Warfare 2 20221111017243
Uncharted Legacy of Thieves Collection9391858261
A Plague Tale Requiem71625640.923
FIFA 23166.2
The Quarry146122.19868.228.7
F1 22238232191744724
Vampire Bloodhunt212199.9195.7148.678.5
Ghostwire Tokyo172.7171.7165.9108.752.3
Tiny Tina's Wonderlands2281901301017035
Cyberpunk 2077 1.613412097855322
Elex 2118.7118.2112.978.940
GRID Legends16514813812410769.6
Elden Ring59.659.559.559.545
Dying Light 2956432
Rainbow Six Extraction25324018812564
God of War145124102726041
Halo Infinite172.7149.1140.6102.557.5
Farming Simulator 22203148.2138.913794.1
Forza Horizon 53012161951189764
Riders Republic1601351218749
Guardians of the Galaxy14814714410860
Back 4 Blood252221209129.473.7
Far Cry 61581351241078428
Deathloop139.9129.8106.365.437.4
F1 202136929123813710462
Days Gone173.2154.7119.283.845
Resident Evil Village220212189.7128.662.7
Outriders165.3145.2129.49046.3
Hitman 3294.3234208.4197.4129.968.5
Assassin´s Creed Valhalla987342
Watch Dogs Legion130896433
Flight Simulator 2020158.8117.282.564.850.1
Horizon Zero Dawn1431269852
F1 202029925323218514383.5
Borderlands 3178147121997237
Total War: Three Kingdoms326293133965929
Anno 1800141126109655954
Far Cry New Dawn15413012511210159
Metro Exodus205136110867045
Shadow of the Tomb Raider19415916114710654
Strange Brigade43828422719713070
Monster Hunter World217177.4169135.883.439.9
Far Cry 516914413612710960
X-Plane 11.1115013110493
Final Fantasy XV Benchmark2011521118246
Dota 2 Reborn186166158148129
The Witcher 34613492271138568
GTA V1831791711118787
lowmed.highultraQHD4K
< 30 fps
< 60 fps
< 120 fps
≥ 120 fps


28
53

3
37
66

8
50
55
1
17
58
32
8
36
59
11
35
52
20
2

For more games that might be playable and a list of all games and graphics cards visit our Gaming List

Add one or more devices and compare

In the following list you can select (and also search for) devices that should be added to the comparison. You can select more than one device.

search for model:
v1.33
log 20. 15:34:05

#0 ran 0s before starting gpusingle class +0s ... 0s

#1 no ids found in url (should be separated by "_") +0s ... 0s

#2 not redirecting to Ajax server +0s ... 0s

#3 did not recreate cache, as it is less than 5 days old! Created at Fri, 19 Sep 2025 05:36:23 +0200 +0.001s ... 0.001s

#4 composed specs +0.032s ... 0.033s

#5 did output specs +0s ... 0.033s

#6 start showIntegratedCPUs +0s ... 0.033s

#7 getting avg benchmarks for device 11453 +0.029s ... 0.061s

#8 got single benchmarks 11453 +0.278s ... 0.34s

#9 got avg benchmarks for devices +0s ... 0.34s

#10 min, max, avg, median took s +1.609s ... 1.949s

#11 before gaming benchmark output +0.001s ... 1.95s

#12 Got 4425 rows for game benchmarks. +1.324s ... 3.274s

#13 composed SQL query for gamebenchmarks +0s ... 3.274s

#14 got data and put it in $dataArray +0.091s ... 3.365s

#15 benchmarks composed for output. +1.869s ... 5.234s

#16 return log +0.011s ... 5.246s

Notebook reviews with NVIDIA GeForce RTX 4070 Laptop GPU graphics card

Zotac Zbox Magnus EN374070

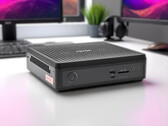
Zotac Zbox Magnus EN374070 review – A mini gaming PC inside a 2.65-liter case with the Nvidia GeForce RTX 4070

The Zotac Zbox Magnus EN374070 combines powerful hardware with a compact footprint: The Intel Core i7-13700HX and Nvidia GeForce RTX 4070 Laptop GPU promise pow...
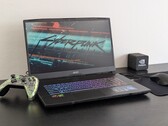
Intel Core i7-13700HX | NVIDIA GeForce RTX 4070 Laptop GPU | 1.6 kg
MSI Katana A17 AI laptop review: Strong graphics let down by a weak display

MSI Katana A17 AI laptop review: Strong graphics let down by a weak display

The Katana A17 is a cheaper alternative to the GE, GS, or GT series while still offering excellent graphics performance with its 105 W GeForce RTX 4070 GPU. Unf...
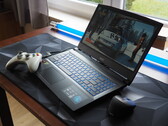
AMD Ryzen 7 8845HS | NVIDIA GeForce RTX 4070 Laptop GPU | 17.30" | 2.7 kg
MSI Katana A15 AI laptop review: RTX 4070 gamer hurt by cost-saving measures

MSI Katana A15 AI laptop review: RTX 4070 gamer hurt by cost-saving measures

MSI ventures into the competitive mid-range gaming laptop sector with the Katana A15 AI. This 15-inch laptop features a powerful Ryzen processor along with a Ge...
AMD Ryzen 9 8945HS | NVIDIA GeForce RTX 4070 Laptop GPU | 15.60" | 2.3 kg
Acer Predator Triton Neo 16 review: A premium laptop with an RTX 4070 for gamers and creators

Acer Predator Triton Neo 16 review: A premium laptop with an RTX 4070 for gamers and creators

While the Nitro V 16 that we tested recently only impressed us a limited amount due to its poor display, the Predator Triton Neo 16 cut a much better figure. We...
Intel Core Ultra 9 185H | NVIDIA GeForce RTX 4070 Laptop GPU | 16.00" | 2 kg
Minisforum AtomMan G7 Ti

Minisforum AtomMan G7 Ti review: Gaming laptop without a screen as a space-saving alternative to the desktop PC

The Minisforum AtomMan G7 Ti promises desktop performance in a compact format. Equipped with the powerful Intel Core i9-14900HX and the Nvidia GeForce RTX 4070 ...
Intel Core i9-14900HX | NVIDIA GeForce RTX 4070 Laptop GPU | 2.6 kg

MSI Sword 16 HX B14VGKG: Intel Core i7-14700HX, 16.00", 2.3 kg
  Review » MSI Sword 16 HX Laptop Review: Gaming powerhouse stifled by an unimpressive screen

Maingear ML-16 MK2: Intel Core Ultra 7 155H, 16.00", 2.1 kg
  Review » Maingear ML-16 MK2 laptop review: GeForce RTX 4070 performance for a decent price

Acer Predator Helios Neo 14 (2024): Intel Core Ultra 9 185H, 14.50", 1.9 kg
  Review » Acer Predator Helios Neo 14 (2024) review: The portable RTX 4070 laptop with long runtimes

Asus ROG NUC 14-90AS0051: Intel Core Ultra 9 185H, 2.6 kg
  Review » Asus ROG NUC gaming mini PC review: Intel Core Ultra 9 185H and Nvidia GeForce RTX 4070 laptop in a 2.5-liter case

Asus ProArt P16 H7606WI: AMD Ryzen AI 9 HX 370, 16.00", 1.8 kg
  Review » Asus ProArt P16 laptop review - AMD Zen 5 meets RTX 4070 laptop and 4K OLED

Asus ProArt PX13 HN7306: AMD Ryzen AI 9 HX 370, 13.30", 1.4 kg
  Review » AMD Zen 5 Strix Point CPU analysis - Ryzen AI 9 HX 370 versus Intel Core Ultra, Apple M3 and Qualcomm Snapdragon X Elite

  Review » Asus ProArt PX13 review - The world's fastest 13.3-inch 2-in-1 thanks to AMD Zen 5 and RTX 4070 laptop

HP Omen 17-db0079ng: AMD Ryzen 7 8845HS, 17.30", 2.8 kg
  Review » HP Omen 17 (2024) review: RTX 4070 and Ryzen 7 show their size in the gaming laptop

SCHENKER XMG Pro 16 Studio (Mid 24): Intel Core i9-14900HX, 16.00", 2.3 kg
  Review » XMG Pro 16 Studio (Mid 24) review: Core i9 and RTX 4070 for gamers and creators

Acer Predator Helios Neo 16 (2024): Intel Core i7-14700HX, 16.00", 2.6 kg
  Review » Acer Predator Helios Neo 16 (2024) review: Gaming laptop with RTX 4070 and DCI-P3 panel

SCHENKER XMG Fusion 15 (Early 24): Intel Core i9-14900HX, 15.30", 2.1 kg
  Review » XMG Fusion 15 (Early 24) review: A compact RTX 4070 laptop for gamers and creators

Lenovo Yoga Pro 9 16IMH9: Intel Core Ultra 9 185H, 16.00", 2.1 kg
  Review » Lenovo Yoga Pro 9i 16 G9 laptop review: MiniLED with 1200 nits and Core Ultra 9

Lenovo Legion 7 16 IRX G9: Intel Core i9-14900HX, 16.00", 2.3 kg
  Review » Lenovo Legion 7 16 G9 laptop review - A gaming machine with a 3.2K display, HX CPU and an overclocked RTX 4070 laptop

Aorus 16X 2024: Intel Core i9-14900HX, 16.00", 2.3 kg
  Review » Aorus 16X (2024) review: Core i9 and RTX 4070 for US$2,000

Dell XPS 16 9640: Intel Core Ultra 7 155H, 16.30", 2.3 kg
  Review » Dell XPS 16 9640 review - The multimedia laptop with 4K OLED and an annoying touch bar

Lenovo Legion Pro 5 16IRX9: Intel Core i9-14900HX, 16.00", 2.5 kg
  Review » Lenovo Legion Pro 5 16IRX9 laptop review: Great performance, but a little heavy

Alienware m16 R2: Intel Core Ultra 7 155H, 16.00", 2.5 kg
  Review » Alienware m16 R2 laptop review: Big and risky changes

Razer Blade 14 RZ09-0508: AMD Ryzen 9 8945HS, 14.00", 1.9 kg
  Review » Razer Blade 14 2024 laptop review: Futureproofing with Ryzen AI

HP Omen Transcend 16-u1095ng: Intel Core i9-14900HX, 16.00", 2.3 kg
  Review » HP Omen Transcend 16 (2024) laptop review: An RTX 4070 gaming machine with an OLED display

Asus ROG Zephyrus G14 2024 GA403U: AMD Ryzen 9 8945HS, 14.00", 1.5 kg
  Review » Asus ROG Zephyrus G14 2024 review - The gaming/multimedia laptop with Ryzen 8000 and G-Sync OLED

Asus ROG Zephyrus G16 2024 GU605M: Intel Core Ultra 7 155H, 16.00", 1.8 kg
  Review » Asus ROG Zephyrus G16 2024 review - The gaming laptop now with G-Sync OLED and Intel Meteor Lake

Asus TUF Gaming A17 FA707XI-NS94: AMD Ryzen 9 7940HS, 17.30", 2.5 kg
  Review » Asus TUF Gaming A17 FA707XI laptop review: 140 W GeForce RTX 4070 for $1400

MSI Stealth 16 Mercedes-AMG Motorsport A13VG: Intel Core i9-13900H, 16.00", 1.9 kg
  Review » MSI Stealth 16 Mercedes-AMG Motorsport laptop in review: Mobile racing car with OLED display

SCHENKER XMG Pro 16 Studio (Mid 23): Intel Core i9-13900H, 16.00", 2.6 kg
  Review » XMG Pro 16 Studio (Mid 23) review: The RTX 4070 laptop for gamers and creators

SCHENKER XMG CORE 16 (L23): AMD Ryzen 7 7840HS, 16.00", 2.4 kg
  Review » SCHENKER XMG Core 16 gaming laptop review - A real competitor to the Lenovo Legion Pro 5 16

HP Victus 16-r0077ng: Intel Core i7-13700H, 16.10", 2.4 kg
  Review » HP Victus 16 laptop review: Full HD gamer with RTX 4070

HP Omen 16-xf0376ng: AMD Ryzen 7 7840HS, 16.10", 2.4 kg
  Review » HP Omen 16 laptop review: A good choice for gamers even with Zen 4

Acer Nitro 17 AN17-41-R9LN: AMD Ryzen 7 7735HS, 17.30", 3 kg
  Review » Acer Nitro 17 Ryzen edition review: The QHD gaming laptop with an RTX 4070

Aorus 15 BSF: Intel Core i7-13700H, 15.60", 2.4 kg
  Review » Aorus 15 BSF review: The QHD gaming laptop with an RTX 4070 and great runtimes

HP Omen Transcend 16: Intel Core i9-13900HX, 16.00", 2.3 kg
  Review » HP Omen Transcend 16 laptop review: More than just a small name difference

SCHENKER VISION 16 Pro (M23): Intel Core i7-13700H, 16.00", 1.6 kg
  Review » Schenker Vision 16 Pro 2023 review: 1.6 kg light and powerful package with RTX 4070 Laptop

MSI Pulse 17 B13VGK: Intel Core i7-13700H, 17.30", 2.7 kg
  Review » MSI Pulse 17 B13V gaming laptop review: With quiet wings

MSI Stealth 16 Studio A13VG: Intel Core i7-13700H, 16.00", 2 kg
  Review » MSI Stealth 16 Studio laptop review: An extremely light, 16-inch, Core i7, RTX 4070 device for gamers and creators

Lenovo Legion Slim 7i 16 Gen 8: Intel Core i9-13900H, 16.00", 2.1 kg
  Review » Lenovo Legion Slim 7i 16 Gen 8 laptop review: Slimmer than the Razer Blade 16

Asus ProArt Studiobook 16 OLED H7604: Intel Core i9-13980HX, 16.00", 2.4 kg
  Review » Asus ProArt Studiobook 16 OLED review: Multimedia laptop with extreme CPU performance

Razer Blade 14 RTX 4070: AMD Ryzen 9 7940HS, 14.00", 1.8 kg
  Review » Razer Blade 14 Zen 4 laptop review: Lots of changes that matter

Acer Nitro 16 AN16-41: AMD Ryzen 7 7735HS, 16.00", 2.7 kg
  Review » Acer Nitro 16 AN16-41 review: An RTX 4070 gaming laptop with good battery life

SCHENKER XMG Focus 17 (E23): Intel Core i9-13900HX, 17.30", 2.9 kg
  Review » Schenker XMG Focus 17 (E23) in review: Gaming laptop with RTX 4070 doesn't skimp on performance

Asus Zenbook Pro 14 OLED UX6404VI: Intel Core i9-13900H, 14.50", 1.7 kg
  Review » Asus Zenbook Pro 14 OLED laptop review: MacBook Pro rival with 120 Hz OLED display

Dell XPS 17 9730 RTX 4070: Intel Core i7-13700H, 17.00", 2.5 kg
  Review » Dell XPS 17 9730 laptop review: GeForce RTX 4070 multimedia monster

Lenovo Legion Pro 5 16ARX8: AMD Ryzen 7 7745HX, 16.00", 2.5 kg
  Review » Ryzen 7 7745HX performance debut: Lenovo Legion Pro 5 16 Gen 8 laptop review

Samsung Galaxy Book3 Ultra 16, i9-13900H RTX 4070: Intel Core i9-13900H, 16.00", 1.8 kg
  Review » Samsung Galaxy Book3 Ultra 16 with RTX 4070 in review: High graphics performance in a business-like notebook

Medion Erazer Major X20: Intel Core i9-13900HX, 16.00", 2.4 kg
  Review » Medion Erazer Major X20 review: Gaming notebook with RTX 4070 and solid hardware

Dell XPS 15 9530 RTX 4070: Intel Core i7-13700H, 15.60", 1.9 kg
  Review » Dell XPS 15 9530 RTX 4070 laptop review: Both impressive and underwhelming

Asus ROG Flow Z13 ACRNM: Intel Core i9-13900H, 13.40", 1.7 kg
  Review » Asus ROG Flow Z13 ACRNM Review - Gaming Convertible with RTX 4070 Laptop

Aorus 15X ASF: Intel Core i7-13700HX, 15.60", 2.3 kg
  Review » Aorus 15X ASF review: Gaming laptop with RTX 4070 power and stamina

Asus ROG Strix G17 G713PI: AMD Ryzen 9 7945HX, 17.30", 2.8 kg
  Review » AMD Ryzen 9 7945HX Analysis - Zen4 Dragon Range is faster and more efficient than Intel Raptor Lake-HX

Uniwill GM6PX7X RTX 4070: Intel Core i7-13700HX, 16.00", 2.2 kg
  Review » Core i7-13700HX performance debut: Uniwill GM6PX7X IDX laptop review

Asus ROG Strix G17 G713PI: AMD Ryzen 9 7945HX, 17.30", 2.8 kg
  Review » Asus ROG Strix G17 G713PI: Gaming laptop impresses in the test with the new Ryzen 9

Gigabyte AERO 16 OLED BSF: Intel Core i9-13900H, 16.00", 2.1 kg
  Review » Slim Gigabyte AERO 16 OLED laptop review: Efficient RTX 4070 for gamers and creatives

Asus ROG Strix G18 G814JI: Intel Core i7-13650HX, 18.00", 3 kg
  Review » Asus ROG Strix G18 G814JI laptop review: Light and shade with the 18-inch gaming machine

SCHENKER XMG Neo 17 2023 Engineering Sample: Intel Core i9-13900HX
  Review » GeForce RTX 4070, 4060, 4050 Laptop Analysis - Nvidia's new Mainstream Laptop GPUs in Review

Razer Blade 18 RTX 4070: Intel Core i9-13950HX, 18.00", 3 kg
  Review » Razer Blade 18 laptop review: Smaller than many 17-inch gaming laptops

MSI Creator A16 AI+ A3XVFG: AMD Ryzen AI 9 365, 16.00", 2.1 kg
  External Review » MSI Creator A16 AI+ A3XVFG

MSI Katana 15 B13VGK, i7-13700H: Intel Core i7-13700H, 15.60", 2.3 kg
  External Review » MSI Katana 15 B13VGK, i7-13700H

HP Victus 16-s1000: AMD Ryzen 7 8845HS, 16.10", 2.3 kg
  External Review » HP Victus 16-s1000

Tulpar 6 V3.2.2: Intel Core i7-13700HX, 16.00", 2.3 kg
  External Review » Tulpar 6 V3.2.2

MSI Creator A16 AI+ A3HVGG: AMD Ryzen AI 9 365, 16.00", 2.1 kg
  External Review » MSI Creator A16 AI+ A3HVGG

Lenovo Legion 5 16IRX9, i7-14700HX: Intel Core i7-14700HX, 6.00", 2.5 kg
  External Review » Lenovo Legion 5 16IRX9, i7-14700HX

MSI Prestige 16 AI Studio B1VGG: Intel Core Ultra 9 185H, 16.00", 1.6 kg
  External Review » MSI Prestige 16 AI Studio B1VGG

MSI Sword 16 HX B14VGKG, i7-14650HX: Intel Core i7-14650HX, 16.00", 2.3 kg
  External Review » MSI Sword 16 HX B14VGKG, i7-14650HX

MSI Pulse 17 AI C1VGKG: Intel Core Ultra 7 155H, 17.00", 2.8 kg
  External Review » MSI Pulse 17 AI C1VGKG

MSI Stealth A16 AI+ A3XVGG: AMD Ryzen AI 9 365, 16.00", 2.1 kg
  External Review » MSI Stealth A16 AI+ A3XVGG

MSI Stealth 16 AI Studio A1VGG, Ultra 7 155H: Intel Core Ultra 7 155H, 16.00", 2 kg
  External Review » MSI Stealth 16 AI Studio A1VGG, Ultra 7 155H

Asus ROG Zephyrus G16 GA605WI: AMD Ryzen AI 9 HX 370, 16.00", 1.9 kg
  External Review » Asus ROG Zephyrus G16 GA605WI

Acer Predator Helios Neo 14 (2024): Intel Core Ultra 9 185H, 14.50", 1.9 kg
  External Review » Acer Predator Helios Neo 14 (2024)

Asus TUF Gaming F15 FX507VI: Intel Core i7-13620H, 15.60", 2.2 kg
  External Review » Asus TUF Gaming F15 FX507VI

HP Omen Transcend 14-fb: Intel Core Ultra 7 155H, 14.00", 1.6 kg
  External Review » HP Omen Transcend 14-fb

MSI Stealth 16 AI Studio A1VGG: Intel Core Ultra 9 185H, 16.00", 2 kg
  External Review » MSI Stealth 16 AI Studio A1VGG

Asus ProArt P16 H7606WI: AMD Ryzen AI 9 HX 370, 16.00", 1.8 kg
  External Review » Asus ProArt P16 H7606WI

MSI Creator M16 HX C14VGG: Intel Core i9-14900HX, 16.00", 2.4 kg
  External Review » MSI Creator M16 HX C14VGG

Aorus 16X 9SG: Intel Core i7-13650HX, 16.00", 2.3 kg
  External Review » Aorus 16X 9SG

HP Omen 17-db0079ng: AMD Ryzen 7 8845HS, 17.30", 2.8 kg
  External Review » HP Omen 17-db0079ng

Lenovo Legion 7 16IRX9, i7-14700HX: Intel Core i7-14700HX, 16.00", 2.2 kg
  External Review » Lenovo Legion 7 16IRX9, i7-14700HX

Asus ProArt PX13 HN7306: AMD Ryzen AI 9 HX 370, 13.30", 1.4 kg
  External Review » Asus ProArt PX13 HN7306

Maingear ML-16 MK2: Intel Core Ultra 7 155H, 16.00", 2.1 kg
  External Review » Maingear ML-16 MK2

SCHENKER XMG Fusion 15 (Early 24): Intel Core i9-14900HX, 15.30", 2.1 kg
  External Review » SCHENKER XMG Fusion 15 (Early 24)

Acer Nitro 16 AN16-42: AMD Ryzen 7 8845HS, 16.00", 2.7 kg
  External Review » Acer Nitro 16 AN16-42

HP Omen 16-wf0000: Intel Core i7-13650HX, 16.10", 2.4 kg
  External Review » HP Omen 16-wf0000

Acer Predator Triton Neo 16 PTN16-51, RTX 4070: Intel Core Ultra 9 185H, 16.00", 2.1 kg
  External Review » Acer Predator Triton Neo 16 PTN16-51, RTX 4070

Medion Erazer Beast X40 2024, RTX 4070: Intel Core i9-14900HX, 17.00", 2.9 kg
  External Review » Medion Erazer Beast X40 2024, RTX 4070

Acer Swift X OLED SFX14-72G, RTX 4070: Intel Core Ultra 7 155H, 14.50", 1.6 kg
  External Review » Acer Swift X OLED SFX14-72G, RTX 4070

MSI Katana A17 AI B8VG: AMD Ryzen 9 8945HS, 17.30", 2.7 kg
  External Review » MSI Katana A17 AI B8VG

Medion Erazer Deputy P60: Intel Core i7-12650H, 15.60", 2.1 kg
  External Review » Medion Erazer Deputy P60

Acer Nitro 17 AN17-41-R3S4: AMD Ryzen 9 7940HS, 17.30", 3.1 kg
  External Review » Acer Nitro 17 AN17-41-R3S4

Asus ROG Strix G16 G614JZR: Intel Core i9-14900HX, 16.00", 2.8 kg
  External Review » Asus ROG Strix G16 G614JZR

HP Victus 16-r1000: Intel Core i7-14700HX, 16.10", 2.3 kg
  External Review » HP Victus 16-r1000

MSI Katana A15 AI B8VG: AMD Ryzen 9 8945HS, 15.60", 2.3 kg
  External Review » MSI Katana A15 AI B8VG

Asus ROG Strix G18 G814JIR: Intel Core i9-14900HX, 18.00", 3 kg
  External Review » Asus ROG Strix G18 G814JIR

Asus TUF Gaming A16 FA608: AMD Ryzen AI 9 HX 370, 16.00", 2.2 kg
  External Review » Asus TUF Gaming A16 FA608

Asus ROG Strix G16 G614JIR: Intel Core i9-14900HX, 16.00", 2.8 kg
  External Review » Asus ROG Strix G16 G614JIR

MSI Pulse 16 AI C1VGKG: Intel Core Ultra 9 185H, 16.00", 2.5 kg
  External Review » MSI Pulse 16 AI C1VGKG

Acer Predator Helios Neo 14 PHN14-51: Intel Core Ultra 7 155H, 14.50", 1.9 kg
  External Review » Acer Predator Helios Neo 14 PHN14-51

MSI Stealth 14 AI Studio A1VGG: Intel Core Ultra 9 185H, 14.00", 1.7 kg
  External Review » MSI Stealth 14 AI Studio A1VGG

MSI Sword 16 HX B14VGKG: Intel Core i7-14700HX, 16.00", 2.3 kg
  External Review » MSI Sword 16 HX B14VGKG

MSI Sword 17 HX B14VGKG: Intel Core i7-14700HX, 17.00", 2.6 kg
  External Review » MSI Sword 17 HX B14VGKG

Lenovo Legion 7 16IRX9, i9-14900HX: Intel Core i9-14900HX, 16.00", 2.2 kg
  External Review » Lenovo Legion 7 16IRX9, i9-14900HX

Acer Nitro 16 AN16-41-R6KQ: AMD Ryzen 7 7840HS, 16.00", 2.7 kg
  External Review » Acer Nitro 16 AN16-41-R6KQ

Samsung Galaxy Book4 Ultra, RTX 4070: Intel Core Ultra 9 185H, 16.00", 1.9 kg
  External Review » Samsung Galaxy Book4 Ultra, RTX 4070

Lenovo Legion Slim 5 16AHP9: AMD Ryzen 7 8845HS, 16.00", 2.3 kg
  External Review » Lenovo Legion Slim 5 16AHP9

Lenovo Legion 5 16IRX9, i7-14650HX: Intel Core i7-14650HX, 16.00", 2.3 kg
  External Review » Lenovo Legion 5 16IRX9, i7-14650HX

Asus ROG Zephyrus G16 GU605MI, Ultra 9 185H: Intel Core Ultra 9 185H, 16.00", 1.8 kg
  External Review » Asus ROG Zephyrus G16 GU605MI, Ultra 9 185H

Asus TUF Gaming A16 FA607PI: AMD Ryzen 9 7845HX, 16.00", 2.3 kg
  External Review » Asus TUF Gaming A16 FA607PI

Dell XPS 16 9640, Ultra 7 165H RTX 4070: Intel Core Ultra 7 165H, 16.30", 2.1 kg
  External Review » Dell XPS 16 9640, Ultra 7 165H RTX 4070

HP Omen 16-xf0079ng: AMD Ryzen 7 7840HS, 16.10", 2.4 kg
  External Review » HP Omen 16-xf0079ng

HP Omen Transcend 16-u1095ng: Intel Core i9-14900HX, 16.00", 2.3 kg
  External Review » HP Omen Transcend 16-u1095ng

MSI Vector 17 HX A14VGG: Intel Core i9-14900HX, 17.30", 3 kg
  External Review » MSI Vector 17 HX A14VGG

Lenovo Legion Pro 5 16IRX9, i7-14700HX: Intel Core i7-14700HX, 16.00", 2.5 kg
  External Review » Lenovo Legion Pro 5 16IRX9, i7-14700HX

Lenovo Legion Slim 7 16IRH8, i9-13900H RTX 4070: Intel Core i9-13900H, 16.00", 2 kg
  External Review » Lenovo Legion Slim 7 16IRH8, i9-13900H RTX 4070

Lenovo Yoga Pro 9 16IMH9: Intel Core Ultra 9 185H, 16.00", 2.1 kg
  External Review » Lenovo Yoga Pro 9 16IMH9

Lenovo Legion 7 16IRX9: Intel Core i7-14650HX, 16.00", 2.3 kg
  External Review » Lenovo Legion 7 16IRX9

Lenovo ThinkPad P1 G6, i7-13800H RTX 4070: Intel Core i7-13800H, 16.00", 1.8 kg
  External Review » Lenovo ThinkPad P1 G6, i7-13800H RTX 4070

Acer Nitro 16 AN16-41, R9 7940HS: AMD Ryzen 9 7940HS, 16.00", 2.7 kg
  External Review » Acer Nitro 16 AN16-41, R9 7940HS

HP Omen Transcend 14-fb0000ng: Intel Core Ultra 9 185H, 14.00", 1.6 kg
  External Review » HP Omen Transcend 14-fb0000ng

Aorus 16X 2024: Intel Core i9-14900HX, 16.00", 2.3 kg
  External Review » Aorus 16X 2024

Lenovo Legion Pro 5 16IRX9: Intel Core i9-14900HX, 16.00", 2.5 kg
  External Review » Lenovo Legion Pro 5 16IRX9

Razer Blade 14 RZ09-0508: AMD Ryzen 9 8945HS, 14.00", 1.9 kg
  External Review » Razer Blade 14 RZ09-0508

Acer Predator Helios Neo 18 PHN18-71: Intel Core i9-14900HX, 18.00", 3.4 kg
  External Review » Acer Predator Helios Neo 18 PHN18-71

Acer Predator Helios Neo 16 (2024): Intel Core i7-14700HX, 16.00", 2.6 kg
  External Review » Acer Predator Helios Neo 16 PHN16-72

Alienware m16 R2: Intel Core Ultra 7 155H, 16.00", 2.5 kg
  External Review » Alienware m16 R2

Asus ROG Zephyrus G16 2024 GU605M: Intel Core Ultra 7 155H, 16.00", 1.8 kg
  External Review » Asus ROG Zephyrus G16 2024 GU605M

Asus ROG Zephyrus G14 2024 GA403U: AMD Ryzen 9 8945HS, 14.00", 1.5 kg
  External Review » Asus ROG Zephyrus G14 2024 GA403U

Acer Predator Helios Neo 16 PHN16-71, i5-13700HX RTX 4070: Intel Core i7-13700HX, 16.00", 2.6 kg
  External Review » Acer Predator Helios Neo 16 PHN16-71, i5-13700HX RTX 4070

Dell XPS 16 9640: Intel Core Ultra 7 155H, 16.30", 2.3 kg
  External Review » Dell XPS 16 9640

Aorus 16X ASG: Intel Core i7-14650HX, 16.00", 2.3 kg
  External Review » Aorus 16X ASG

MSI Alpha 17 C7VG: AMD Ryzen 9 7945HX, 17.30", 2.8 kg
  External Review » MSI Alpha 17 C7VG

Dell XPS 17 9730, i9-13900H: Intel Core i9-13900H, 17.00", 2.4 kg
  External Review » Dell XPS 17 9730, i9-13900H

Dell G16 7630, i9-13900HX RTX 4070: Intel Core i9-13900HX, 16.00", 2.9 kg
  External Review » Dell G16 7630, i9-13900HX RTX 4070

Acer Nitro 17 AN17-41: AMD Ryzen 7 7840HS, 17.30", 3 kg
  External Review » Acer Nitro 17 AN17-41

HP Omen 16-xf0000ng: AMD Ryzen 9 7940HS, 16.10", 2.4 kg
  External Review » HP Omen 16-xf0000ng

SCHENKER XMG CORE 16 (L23): AMD Ryzen 7 7840HS, 16.00", 2.4 kg
  External Review » SCHENKER XMG CORE 16 (L23)

Asus ROG Zephyrus G14 GA402XI: AMD Ryzen 9 7940HS, 14.00", 1.7 kg
  External Review » Asus ROG Zephyrus G14 GA402XI

MSI Creator Z17 HX Studio A13VGT, i7-13700HX: Intel Core i7-13700HX, 17.00", 2.5 kg
  External Review » MSI Creator Z17 HX Studio A13VGT, i7-13700HX

Acer Predator Helios 16 PH16-71-97H2: Intel Core i9-13900HX, 16.00", 2.7 kg
  External Review » Acer Predator Helios 16 PH16-71-97H2

HP Victus 16-s0000: AMD Ryzen 7 7840HS, 16.10", 2.3 kg
  External Review » HP Victus 16-s0000

SCHENKER VISION 16 Pro (M23): Intel Core i7-13700H, 16.00", 1.6 kg
  External Review » SCHENKER VISION 16 Pro (M23)

Lenovo Yoga Pro 9i RTX4070: Intel Core i9-13905H, 16.00"
  External Review » Lenovo Yoga Pro 9i RTX4070

HP Victus 16-r0077ng: Intel Core i7-13700H, 16.10", 2.4 kg
  External Review » HP Victus 16-r0077ng

Asus TUF Gaming A15 FA507XI: AMD Ryzen 9 7940HS, 15.60", 2.2 kg
  External Review » Asus TUF Gaming A15 FA507XI

Lenovo Legion Pro 5 16IRX8, i7-13700HX RTX 4070: Intel Core i7-13700HX, 16.00", 2.6 kg
  External Review » Lenovo Legion Pro 5 16IRX8, i7-13700HX RTX 4070

Acer Predator Helios 16 PH16-71-76FS: Intel Core i7-13700HX, 16.00", 2.7 kg
  External Review » Acer Predator Helios 16 PH16-71-76FS

Lenovo Yoga Pro 9 16IRP8, RTX 4070: Intel Core i9-13905H, 16.00", 2.2 kg
  External Review » Lenovo Yoga Pro 9 16IRP8, RTX 4070

MSI Katana 17 B13VGK: Intel Core i7-13620H, 17.30", 2.6 kg
  External Review » MSI Katana 17 B13VGK

Acer Predator Helios 16 PH16-71-74AS: Intel Core i7-13700HX, 16.00", 2.6 kg
  External Review » Acer Predator Helios 16 PH16-71-74AS

Lenovo Legion 5 Pro 16ARX8: AMD Ryzen 7 7745HX, 16.00", 2.5 kg
  External Review » Lenovo Legion 5 Pro 16ARX8

HP Omen Transcend 16-u0027TX: Intel Core i7-13700HX, 16.00", 2.2 kg
  External Review » HP Omen Transcend 16-u0027TX

Acer Predator Triton 14 PT14-51, i7-13700H RTX 4070: Intel Core i7-13700H, 14.00", 1.7 kg
  External Review » Acer Predator Triton 14 PT14-51, i7-13700H RTX 4070

HP Omen Transcend 16-u0000: Intel Core i9-13900HX, 16.00", 2.2 kg
  External Review » HP Omen Transcend 16-u0000

Lenovo Legion Pro 7 16IRX8, i7-13700HX RTX 4070: Intel Core i7-13700HX, 16.00", 2.8 kg
  External Review » Lenovo Legion Pro 7 16IRX8, i7-13700HX RTX 4070

Acer Nitro 16 AN16-41: AMD Ryzen 7 7735HS, 16.00", 2.7 kg
  External Review » Acer Nitro 16 AN16-41

Asus TUF Gaming A17 FA707XI: AMD Ryzen 9 7940HS, 17.30", 2.6 kg
  External Review » Asus TUF Gaming A17 FA707XI

Alienware m16 R1 AMD, RTX 4070: AMD Ryzen 9 7845HX, 16.00", 3.1 kg
  External Review » Alienware m16 R1 AMD, RTX 4070

Acer Nitro 16 AN16-41-R8UR: AMD Ryzen 7 7735HS, 16.00", 2.7 kg
  External Review » Acer Nitro 16 AN16-41-R8UR

HP Victus 16-r0000ns: Intel Core i7-13700H, 16.10", 2.3 kg
  External Review » HP Victus 16-r0000ns

Asus ROG Flow X13 GV302XI: AMD Ryzen 9 7940HS, 13.40", 1.3 kg
  External Review » Asus ROG Flow X13 GV302XI

Asus ProArt StudioBook 16 OLED H7604JI: Intel Core i9-13980HX, 16.00", 2.4 kg
  External Review » Asus ProArt StudioBook 16 OLED H7604JI

Asus VivoBook Pro 16 OLED K6604JI: Intel Core i9-13980HX, 16.00", 2 kg
  External Review » Asus VivoBook Pro 16 OLED K6604JI

Origin PC EON14-S 2023: Intel Core i9-13900H, 14.00", 1.8 kg
  External Review » Origin PC EON14-S 2023

MSI Katana 15 B12VGK: Intel Core i7-12650H, 15.60", 2.3 kg
  External Review » MSI Katana 15 B12VGK

HP Omen Transcend 16: Intel Core i9-13900HX, 16.00", 2.3 kg
  External Review » HP Omen Transcend 16

Lenovo Legion Slim 7i 16 Gen 8: Intel Core i9-13900H, 16.00", 2.1 kg
  External Review » Lenovo Legion Slim 7i 16 Gen 8

HP Omen Transcend 16-u0095ng: Intel Core i9-13900HX, 16.00", 2.2 kg
  External Review » HP Omen Transcend 16-u0095ng

MSI Crosshair 15 C12VG: Intel Core i7-12650H, 15.60", 2.3 kg
  External Review » MSI Crosshair 15 C12VG

Hyperbook SL606, i9-13900H RTX 4070: Intel Core i9-13900H, 16.00", 2.7 kg
  External Review » Hyperbook SL606, i9-13900H RTX 4070

MSI Alpha 17 C7VF: AMD Ryzen 9 7945HX, 17.30", 2.8 kg
  External Review » MSI Alpha 17 C7VF

Lenovo Legion Pro 5 16ARX8: AMD Ryzen 7 7745HX, 16.00", 2.5 kg
  External Review » Lenovo Legion Pro 5 16ARX8

MSI Creator Z17 HX Studio A13VGT: Intel Core i9-13950HX, 17.00", 2.5 kg
  External Review » MSI Creator Z17 HX Studio A13VGT

Origin PC EVO16-S 2023: Intel Core i9-13900H, 16.10", 2.5 kg
  External Review » Origin PC EVO16-S 2023

Acer Nitro 17 AN17-41-R9LN: AMD Ryzen 7 7735HS, 17.30", 3 kg
  External Review » Acer Nitro 17 AN17-41-R9LN

Razer Blade 14 RTX 4070: AMD Ryzen 9 7940HS, 14.00", 1.8 kg
  External Review » Razer Blade 14 RTX 4070

MSI Stealth 14 Studio A13VG, i7-13620H: Intel Core i7-13620H, 14.00", 1.7 kg
  External Review » MSI Stealth 14 Studio A13VG, i7-13620H

Dell XPS 17 9730 RTX 4070: Intel Core i7-13700H, 17.00", 2.5 kg
  External Review » Dell XPS 17 9730 RTX 4070

Asus ProArt Studiobook 16 OLED H7604: Intel Core i9-13980HX, 16.00", 2.4 kg
  External Review » Asus ProArt Studiobook 16 OLED H7604

Lenovo Legion Pro 5 16IRX8, i9-13900HX RTX 4070: Intel Core i9-13900HX, 16.00", 2.6 kg
  External Review » Lenovo Legion Pro 5 16IRX8, i9-13900HX RTX 4070

Asus ROG Zephyrus M16 GU604VI: Intel Core i9-13900H, 16.00", 2.3 kg
  External Review » Asus ROG Zephyrus M16 GU604VI

Lenovo Legion Pro 7 16IRX8H, i9-13900HX RTX 4070: Intel Core i9-13900HX, 16.00", 2.5 kg
  External Review » Lenovo Legion Pro 7 16IRX8H, i9-13900HX RTX 4070

Asus Zenbook Pro 14 OLED UX6404VI: Intel Core i9-13900H, 14.50", 1.7 kg
  External Review » Asus Zenbook Pro 14 OLED UX6404VI

Lenovo Yoga Pro 9i 14 2023: Intel Core i9-13905H, 14.50", 1.7 kg
  External Review » Lenovo Yoga Pro 9i 14 2023

Razer Blade 16 Early 2023 RTX 4070: Intel Core i9-13950HX, 16.00", 2.5 kg
  External Review » Razer Blade 16 Early 2023 RTX 4070

MSI Stealth 14 Studio A13VG: Intel Core i7-13700H, 14.00", 1.7 kg
  External Review » MSI Stealth 14 Studio A13VG

Acer Predator Helios 16 PH16-71: Intel Core i9-13900HX, 16.00", 2.7 kg
  External Review » Acer Predator Helios 16 PH16-71

Acer Predator Helios 16 PH16-71-96HK: Intel Core i9-13900HK, 16.00", 2.7 kg
  External Review » Acer Predator Helios 16 PH16-71-96HK

Dell XPS 15 9530 RTX 4070: Intel Core i7-13700H, 15.60", 1.9 kg
  External Review » Dell XPS 15 9530 RTX 4070

Asus ROG Strix G17 G713PI: AMD Ryzen 9 7945HX, 17.30", 2.8 kg
  External Review » Asus ROG Strix G17 G713PI

Asus ROG Strix G18 G814JI, i9-13980HX: Intel Core i9-13980HX, 18.00", 3 kg
  External Review » Asus ROG Strix G18 G814JI, i9-13980HX

Gigabyte Aorus 15 BSF: Intel Core i7-13700H, 15.60", 2.3 kg
  External Review » Gigabyte Aorus 15 BSF

MSI Raider GE68 HX 13VG: Intel Core i9-13950HX, 15.60", 2.7 kg
  External Review » MSI Raider GE68 HX 13VG

MSI Raider GE68 HX 13VG, i7-13700HX: Intel Core i7-13700HX, 16.00", 2.7 kg
  External Review » MSI Raider GE68 HX 13VG, i7-13700HX

Medion Erazer Major X20: Intel Core i9-13900HX, 16.00", 2.4 kg
  External Review » Medion Erazer Major X20

MSI Stealth 16 Studio A13VG: Intel Core i7-13700H, 16.00", 2 kg
  External Review » MSI Stealth 16 Studio A13VG

Asus ROG Strix G16 G614JI: Intel Core i9-13980HX, 16.00", 2.5 kg
  External Review » Asus ROG Strix G16 G614JI

Asus ROG Flow X16 GV601VI: Intel Core i9-13900H, 16.00", 2.2 kg
  External Review » Asus ROG Flow X16 GV601VI

MSI Pulse 15 B13VGK: Intel Core i7-13700H, 17.30", 2.7 kg
  External Review » MSI Pulse 15 B13VGK

Gigabyte AERO 16 OLED BSF: Intel Core i9-13900H, 16.00", 2.1 kg
  External Review » Gigabyte AERO 16 OLED BSF

Asus ROG Flow Z13 ACRNM: Intel Core i9-13900H, 13.40", 1.7 kg
  External Review » Asus ROG Flow Z13 ACRNM

MSI Katana 15 B13VGK: Intel Core i7-13620H, 15.60", 2.3 kg
  External Review » MSI Katana 15 2023 B13VGK

MSI Vector GP77 13VG: Intel Core i7-13700H, 17.30", 2.8 kg
  External Review » MSI Vector GP77 13VG

MSI Pulse 17 B13VGK: Intel Core i7-13700H, 17.30", 2.7 kg
  External Review » MSI Pulse 17 B13VGK

Asus ROG Strix G18 G814JI: Intel Core i7-13650HX, 18.00", 3 kg
  External Review » Asus ROG Strix G18 G814JI

Aorus 15X ASF: Intel Core i7-13700HX, 15.60", 2.3 kg
  External Review » Aorus 15X ASF

Razer Blade 18 RTX 4070: Intel Core i9-13950HX, 18.00", 3 kg
  External Review » Razer Blade 18 RTX 4070

Samsung Galaxy Book3 Ultra 16, i9-13900H RTX 4070: Intel Core i9-13900H, 16.00", 1.8 kg
  External Review » Samsung Galaxy Book3 Ultra 16, i9-13900H RTX 4070

Lenovo Yoga Pro 9 16IMH9: Intel Core Ultra 9 185H, 16.00", 2.1 kg
   » Lenovo Yoga Pro 9 leaks with Nvidia RTX 5060 and sharp, 120 Hz OLED display

Asus ROG Zephyrus G16 2024 GU605M: Intel Core Ultra 7 155H, 16.00", 1.8 kg
   » Highly-rated Asus ROG Zephyrus G16 with 240 Hz OLED panel and RTX 4070 is 30% cheaper vs list price

Dell G16 7630, i9-13900HX RTX 4070: Intel Core i9-13900HX, 16.00", 2.9 kg
   » RTX 4070-powered Dell G16 with Core i9 and 240Hz QHD display is 39% off again

Asus ProArt P16 H7606WI: AMD Ryzen AI 9 HX 370, 16.00", 1.8 kg
   » Highly rated Asus ProArt P16 OLED laptop in "Open-Box Excellent" condition scores big $520 discount

Lenovo Legion Slim 5 16AHP9: AMD Ryzen 7 8845HS, 16.00", 2.3 kg
   » RTX 4070-powered Lenovo Legion Slim 5 G9 is 34% off right now

Lenovo Yoga Pro 9 16IMH9: Intel Core Ultra 9 185H, 16.00", 2.1 kg
   » Lenovo Yoga Pro 9i Gen 9 with Mini LED display, Core Ultra 9 185H, and RTX 4060 records double-digit price drop

Asus ROG Strix G17 G713PI: AMD Ryzen 9 7945HX, 17.30", 2.8 kg
   » RTX 4070-powered Asus ROG Strix G17 drops to another record-low price

Asus ROG Zephyrus G14 2024 GA403U: AMD Ryzen 9 8945HS, 14.00", 1.5 kg
   » 2025 Asus ROG Zephyrus G14 announced with up to RTX 5080 laptop GPU, ROG Nebula OLED display and thinner build

Alienware m16 R2: Intel Core Ultra 7 155H, 16.00", 2.5 kg
   » Open-box Alienware m16 R2 (2024) RTX 4070 gaming laptop in pristine condition is now on sale at enticing price

Asus ROG Zephyrus G16 2024 GU605M: Intel Core Ultra 7 155H, 16.00", 1.8 kg
   » Asus Rog Zephyrus G16 RTX 4070 gaming laptop price reaches new record-low after 28% discount on list MSRP

Asus ProArt P16 H7606WI: AMD Ryzen AI 9 HX 370, 16.00", 1.8 kg
   » Asus ProArt P16 4K OLED laptop with Ryzen AI 9 HX 370 and RTX 4060 now on sale at lowest ever price

Asus ProArt PX13 HN7306: AMD Ryzen AI 9 HX 370, 13.30", 1.4 kg
   » Asus ProArt P16 4K OLED laptop with Ryzen AI 9 HX 370 and RTX 4060 now on sale at lowest ever price

Acer Predator Helios Neo 14 (2024): Intel Core Ultra 9 185H, 14.50", 1.9 kg
   » RTX 4070-powered Acer Predator Helios Neo 14-inch gaming laptop drops to lowest price yet

Lenovo Legion 7 16 IRX G9: Intel Core i9-14900HX, 16.00", 2.3 kg
   » Highly rated Lenovo Legion 7i Gen 9 (2024) with RTX 4070 is now on sale at $500 discount

   » Lenovo Legion 5i Gen 9 (2024) price for RTX 4060 and Core i7-13650HX SKU slashed by massive 32%

Alienware m16 R2: Intel Core Ultra 7 155H, 16.00", 2.5 kg
   » Outstanding Alienware m16 R2 RTX 4070 gaming laptop is now up to 32% cheaper than list price

Acer Nitro 17 AN17-41-R9LN: AMD Ryzen 7 7735HS, 17.30", 3 kg
   » RTX 4060-equipped Acer Nitro 17 gaming laptop in "certified-refurbished" condition is on sale for less than $750

Lenovo Legion Pro 5 16IRX9: Intel Core i9-14900HX, 16.00", 2.5 kg
   » Lenovo Legion Pro 5i Gen 9 gaming laptop with RTX 4070 receives steep 34% price cut

Lenovo Legion Slim 5 16AHP9: AMD Ryzen 7 8845HS, 16.00", 2.3 kg
   » RTX 4070-powered Lenovo Legion Slim 5 Gen 9 gaming laptop now discounted by 35%

Acer Predator Helios Neo 14 (2024): Intel Core Ultra 9 185H, 14.50", 1.9 kg
   » Acer Predator Helios Neo 14 with RTX 4070, Core Ultra 9 and QHD display drops back to all-time low

Lenovo Yoga Pro 9 16IMH9: Intel Core Ultra 9 185H, 16.00", 2.1 kg
   » Lenovo Yoga Pro 9i Gen 9 price drops by $300 for RTX 4060 SKU with 16-inch Mini-LED display

Asus ROG Zephyrus G14 2024 GA403U: AMD Ryzen 9 8945HS, 14.00", 1.5 kg
   » Asus ROG Zephyrus G14 with RTX 4070, 120Hz OLED and AMD Ryzen 9 gets big discount

Acer Predator Helios Neo 14 (2024): Intel Core Ultra 9 185H, 14.50", 1.9 kg
   » Acer Predator Helios Neo 16 (2024) gaming laptop with full-power RTX 4060 drops to lowest price ever

Acer Predator Helios Neo 16 (2024): Intel Core i7-14700HX, 16.00", 2.6 kg
   » Acer Predator Helios Neo 16 (2024) gaming laptop with full-power RTX 4060 drops to lowest price ever

Asus ProArt P16 H7606WI: AMD Ryzen AI 9 HX 370, 16.00", 1.8 kg
   » Latest Asus ProArt PX13 OLED creator laptop with Ryzen AI 9 HX 370 drops to lowest price ever

Asus ProArt PX13 HN7306: AMD Ryzen AI 9 HX 370, 13.30", 1.4 kg
   » Latest Asus ProArt PX13 OLED creator laptop with Ryzen AI 9 HX 370 drops to lowest price ever

Dell G16 7630, i9-13900HX RTX 4070: Intel Core i9-13900HX, 16.00", 2.9 kg
   » Dell G16 7630 with RTX 4070 gets huge 38% discount as Core i9 laptop drops to incredibly enticing price

Acer Predator Helios Neo 14 (2024): Intel Core Ultra 9 185H, 14.50", 1.9 kg
   » RTX 4070-powered Acer Predator Helios Neo 14 with Core Ultra 9 and 32GB RAM gets biggest discount yet

   » Speedy Acer Predator Helios 18 gaming laptop with RTX 4090 and 250 Hz mini-LED display drops back to record-low price

Acer Predator Helios Neo 16 (2024): Intel Core i7-14700HX, 16.00", 2.6 kg
   » Speedy Acer Predator Helios 18 gaming laptop with RTX 4090 and 250 Hz mini-LED display drops back to record-low price

Lenovo Yoga Pro 9 16IMH9: Intel Core Ultra 9 185H, 16.00", 2.1 kg
   » Latest Lenovo Yoga Pro 9i Gen 9 with 1200-nit mini LED display and RTX 4060 is on sale at noticeable discount

Dell G16 7630, i9-13900HX RTX 4070: Intel Core i9-13900HX, 16.00", 2.9 kg
   » Dell G16 7630 with Core i9-13900HX and RTX 4070 returns to lowest price yet

Lenovo Legion Pro 5 16IRX9, i7-14700HX: Intel Core i7-14700HX, 16.00", 2.5 kg
   » Lenovo Legion Pro 5i Gen 9 with RTX 4070 hits record low thanks to huge 41% Labor Day discount

Asus ROG Strix G17 G713PI: AMD Ryzen 9 7945HX, 17.30", 2.8 kg
   » Ryzen 9-powered Asus ROG Strix G17 gaming laptop with RTX 4070 hits lowest price ever

Dell G16 7630, i9-13900HX RTX 4070: Intel Core i9-13900HX, 16.00", 2.9 kg
   » Core i9-powered Dell G16 7630 gaming laptop with RTX 4070 is back on sale for 33% off

Asus ProArt PX13 HN7306: AMD Ryzen AI 9 HX 370, 13.30", 1.4 kg
   » Strix Point APU handheld performance simulation: Ryzen AI 9 HX 370 shines in gaming even when tested at just 17 W

HP Omen 17-db0079ng: AMD Ryzen 7 8845HS, 17.30", 2.8 kg
   » Power efficiency improvements, performance uplift, and hardly any noise: HP Omen 17 (2024) evaluated

Lenovo Legion Slim 5 16AHP9: AMD Ryzen 7 8845HS, 16.00", 2.3 kg
   » Ryzen 7-equipped Lenovo Legion Slim 5 Gen 9 gaming laptop with RTX 4070 gets steep 30% price cut

Dell G16 7630, i9-13900HX RTX 4070: Intel Core i9-13900HX, 16.00", 2.9 kg
   » RTX 4070-equipped Dell G16 7630 gaming laptop with Core i9 and 32GB RAM is 35% off right now

Asus ROG Zephyrus G16 GU605MI, Ultra 9 185H: Intel Core Ultra 9 185H, 16.00", 1.8 kg
   » Asus ROG Zephyrus G16 with 240Hz OLED, Core Ultra 9 and RTX 4070 drops to lowest price yet

Lenovo Legion Pro 5 16ARX8: AMD Ryzen 7 7745HX, 16.00", 2.5 kg
   » RTX 4070-powered Lenovo Legion Pro 5 gaming laptop with AMD Ryzen 9 and 32GB RAM gets 31% price cut

Lenovo Legion Pro 5 16IRX8, i9-13900HX RTX 4070: Intel Core i9-13900HX, 16.00", 2.6 kg
   » Lenovo Legion Pro 5i with RTX 4070 marked down by 30%

Asus ROG Zephyrus G16 2024 GU605M: Intel Core Ultra 7 155H, 16.00", 1.8 kg
   » 2024 Asus ROG Zephyrus G16 with RTX 4070 and gorgeous 240Hz OLED gets largest price cut yet

Acer Predator Helios Neo 16 (2024): Intel Core i7-14700HX, 16.00", 2.6 kg
   » Acer Predator Helios Neo 16 (2024) with a bright display, RTX 4070, and Thunderbolt 4

Lenovo Legion Pro 5 16ARX8: AMD Ryzen 7 7745HX, 16.00", 2.5 kg
   » Lenovo Legion Pro 5i Gen 9 with Core i9-14900HX and RTX 4070 can now be yours at a whopping 34% discount

Lenovo Legion Pro 5 16IRX9: Intel Core i9-14900HX, 16.00", 2.5 kg
   » Lenovo Legion Pro 5i Gen 9 with Core i9-14900HX and RTX 4070 can now be yours at a whopping 34% discount

SCHENKER XMG Fusion 15 (Early 24): Intel Core i9-14900HX, 15.30", 2.1 kg
   » XMG Fusion 15 (Early 24) with top ranking among the RTX 4070 laptops

Dell G16 7630, i9-13900HX RTX 4070: Intel Core i9-13900HX, 16.00", 2.9 kg
   » RTX 4070-powered Dell G16 gaming laptop with Core i9 and 32GB RAM is $600 off today

Lenovo Legion Pro 5 16IRX8, i9-13900HX RTX 4070: Intel Core i9-13900HX, 16.00", 2.6 kg
   » Core i9-powered Lenovo Legion Pro 5i gaming laptop with RTX 4070 returns to record-low price

Lenovo Yoga Pro 9 16IMH9: Intel Core Ultra 9 185H, 16.00", 2.1 kg
   » Lenovo Yoga Pro 9i 16 G9 still comes with a great mini LED panel at 1200 nits, but also new problems

Lenovo Legion Pro 5 16ARX8: AMD Ryzen 7 7745HX, 16.00", 2.5 kg
   » Lenovo Legion Pro 5 with RTX 4070 and 32 GB RAM receives sizeable $641 discount

Asus ROG Zephyrus G16 2024 GU605M: Intel Core Ultra 7 155H, 16.00", 1.8 kg
   » Asus ROG Zephyrus G16 OLED gaming laptop with RTX 4070 and Core Ultra 9 gets first discount

Aorus 16X 2024: Intel Core i9-14900HX, 16.00", 2.3 kg
   » Aorus 16X (2024): Bright display, long runtimes, RTX 4070

Asus ROG Zephyrus G14 GA402XI: AMD Ryzen 9 7940HS, 14.00", 1.7 kg
   » Asus ROG Zephyrus G14 gaming laptop with RTX 4070 back on sale for record-low price

Dell XPS 17 9730 RTX 4070: Intel Core i7-13700H, 17.00", 2.5 kg
   » Monstrous Dell XPS 17 laptop with RTX 4080, 4K display, 32GB RAM and Core i9 gets largest discount ever

Dell XPS 15 9530 RTX 4070: Intel Core i7-13700H, 15.60", 1.9 kg
   » Dell XPS 15 laptop with Core i7 and Intel ARC A370M dGPU gets sweet $510 discount

Lenovo Legion Pro 5 16ARX8: AMD Ryzen 7 7745HX, 16.00", 2.5 kg
   » RTX 4070-powered Legion Pro 5 Gen 8 gets big 32% price cut in Lenovo's new gaming laptop sale

Dell G16 7630, i9-13900HX RTX 4070: Intel Core i9-13900HX, 16.00", 2.9 kg
   » Dell G16 with RTX 4070 and Core i9 drops by $400 in Amazon's limited-time gaming laptop sale

Asus ROG Zephyrus G14 2024 GA403U: AMD Ryzen 9 8945HS, 14.00", 1.5 kg
   » Asus ROG Zephyrus G14 and G16 go on sale with OLED displays starting at €1,899

Asus ROG Zephyrus G16 2024 GU605M: Intel Core Ultra 7 155H, 16.00", 1.8 kg
   » Asus ROG Zephyrus G14 and G16 go on sale with OLED displays starting at €1,899

HP Omen 16-xf0000ng: AMD Ryzen 9 7940HS, 16.10", 2.4 kg
   » HP Omen 16 gaming laptop with RTX 4070 and Ryzen 9 now discounted by $750

HP Omen 16-xf0376ng: AMD Ryzen 7 7840HS, 16.10", 2.4 kg
   » HP OMEN 16 2023 price drops again to 120-day low at Best Buy for Ryzen 9 7940HS and RTX 4070 SKU

HP Omen Transcend 16: Intel Core i9-13900HX, 16.00", 2.3 kg
   » HP OMEN 16 2023 price drops again to 120-day low at Best Buy for Ryzen 9 7940HS and RTX 4070 SKU

MSI Vector GP77 13VG: Intel Core i7-13700H, 17.30", 2.8 kg
   » MSI Vector GP77 gaming laptop with Core i9, RTX 4070 and 64GB RAM gets massive $650 discount

Asus ROG Zephyrus M16 GU604VI: Intel Core i9-13900H, 16.00", 2.3 kg
   » Stealthy Asus ROG Zephyrus M16 gaming laptop with RTX 4070 and Core i9 drops back to record-low price

Asus ROG Strix G17 G713PI: AMD Ryzen 9 7945HX, 17.30", 2.8 kg
   » Asus ROG Strix G17 gaming laptop with RTX 4070, AMD Ryzen 9 7945HX and 240Hz QHD display discounted by 27% in Amazon's Black Friday sale

SCHENKER XMG Pro 16 Studio (Mid 23): Intel Core i9-13900H, 16.00", 2.6 kg
   » XMG Pro 16 Studio: Lots of power for gamers and creators

HP Victus 16-r0077ng: Intel Core i7-13700H, 16.10", 2.4 kg
   » Affordable HP Victus 15 gaming laptop records massive 33% discount at Best Buy

Aorus 15 BSF: Intel Core i7-13700H, 15.60", 2.4 kg
   » Aorus 15 BSF: The RTX 4070 laptop with 10-hour runtimes

Asus ROG Strix G17 G713PI: AMD Ryzen 9 7945HX, 17.30", 2.8 kg
   » Asus ROG Strix G17 with RTX 4060, AMD Ryzen 9 7845HX and 240Hz QHD display gets US$300 discount in new gaming laptop sale

HP Omen Transcend 16: Intel Core i9-13900HX, 16.00", 2.3 kg
   » HP Omen Transcend 16 is three steps forward and one step back for the series

Asus ROG Zephyrus M16 GU604VI: Intel Core i9-13900H, 16.00", 2.3 kg
   » Powerful Asus ROG Zephyrus M16 QHD gaming laptop with RTX 4070 and Core i9 on sale with its largest discount yet

MSI Pulse 17 B13VGK: Intel Core i7-13700H, 17.30", 2.7 kg
   » MSI Pulse 17 reviewed: Gaming laptop with a questionable price-performance ratio

SCHENKER VISION 16 Pro (M23): Intel Core i7-13700H, 16.00", 1.6 kg
   » Highest performance per kg: Schenker Vision 16 Pro impresses with RTX 4070 Laptop and magnesium case

Lenovo Legion Slim 7i 16 Gen 8: Intel Core i9-13900H, 16.00", 2.1 kg
   » Small attention to detail on the Lenovo Legion Slim Gen 8 solves an annoying issue on the Alienware x16 r1

Asus ProArt Studiobook 16 OLED H7604: Intel Core i9-13980HX, 16.00", 2.4 kg
   » The ProArt Studiobook 16 OLED is fast, but too loud

Asus Zenbook Pro 14 OLED UX6404VI: Intel Core i9-13900H, 14.50", 1.7 kg
   » The Asus Zenbook Pro 14 impresses with a lot of performance and the world's first 120 Hz OLED display

Samsung Galaxy Book3 Ultra 16, i9-13900H RTX 4070: Intel Core i9-13900H, 16.00", 1.8 kg
   » A quiet and hot creator laptop: Samsung Galaxy Book3 Ultra 16 reviewed

Dell XPS 15 9530 RTX 4070: Intel Core i7-13700H, 15.60", 1.9 kg
   » Dell XPS 15 9530 comes with 40 W to 50 W TGP GeForce RTX 4070 graphics

Medion Erazer Major X20: Intel Core i9-13900HX, 16.00", 2.4 kg
   » Medion Erazer Major X20: RTX 4070 notebook with mechanical keyboard

Uniwill GM6PX7X RTX 4070: Intel Core i7-13700HX, 16.00", 2.2 kg
   » First in-house Core i7-13700HX benchmarks show a 25 percent performance boost over the popular Core i7-12700H

Asus ROG Strix G17 G713PI: AMD Ryzen 9 7945HX, 17.30", 2.8 kg
   » Focus on gaming performance: Asus ROG Strix G17 with remarkable single purpose

Gigabyte AERO 16 OLED BSF: Intel Core i9-13900H, 16.00", 2.1 kg
   » New Aero 16 OLED reviewed: OLED and new Intel/Nvidia generations on the rise

Razer Blade 18 RTX 4070: Intel Core i9-13950HX, 18.00", 3 kg
   » Nvidia driver 528.49 is borked on the Blade 18 RTX 4070, Razer says a fix should be coming soon

Please share our article, every link counts!
Mail Logo

» Comparison of GPUs
Detailed list of all laptop GPUs sorted by class and performance.

» Benchmark List
Sort and restrict laptop GPUs based on performance in synthetic benchmarks.

» Notebook Gaming List
Playable games for each graphics card and their average FPS results.

Class 1

Class 2

Radeon PRO W6600M *

Class 3

Arc Graphics 3-core (Arrow Lake) *
Arc Graphics 2-core (Arrow Lake) *
UHD Graphics 32EUs
UHD Graphics 750

Class 4

* Approximate position of the graphics adapter

Klaus Hinum (Update: 2022-12-19)