Notebook reviews with AMD Radeon RX Vega 8 (Ryzen 2000/3000) graphics card
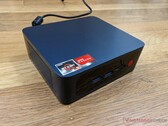
Trigkey S3 mini PC review: Core i3-like performance for the price of a Celeron or Atom
The Trigkey is inexpensive at just under US$300, but it thankfully sidesteps the terribly slow Celeron or Atom solutions for an older but faster AMD Zen+ processor instead. Even light HTPC multi-tasking can benefit from the aging AMD processor.
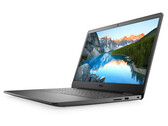
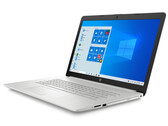
AMD Ryzen 5 3550H, Vega 8, 419 gDell Inspiron 15 3505 in review: Quiet, affordable office laptop
The Inspiron 15 3505 shines with low noise levels, two drive slots, and a moderate price. The installed Ryzen 5 APU does not reach its full performance potential. The battery life is poor.
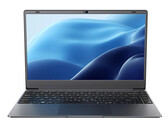
AMD Ryzen 5 3450U, Vega 8, 15.6", 2 kgBMAX X14 Pro laptop review: Attractive with AMD Ryzen 5 for under $500 USD
$500 USD isn't a lot for a laptop these days unless if you're willing to settle for cheap designs and slower Celeron-level performance. The BMax X14 Pro bucks the trend with its sleek profile and reasonably fast AMD Ryzen 5 CPU, but it's not without its own unique drawbacks as well.
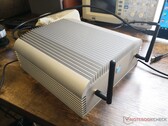
AMD Ryzen 5 3450U, Vega 8, 14", 1.4 kgImpact Display Solutions IMP-3713-V2-16-500 Fanless PC Review
Why use a small heat sink when the entire chassis itself can be one instead? This bulky industrial PC may be fanless, but it sacrifices performance in the process.
AMD Ryzen Embedded V1605B, Vega 8, 3.7 kgHP 17 in Review: Ryzen notebook for the home desk
HP's 17.3-inch model is a simple office notebook with a Ryzen 5-3500U APU, 16GB memory (dual-channel mode), NVMe SSD and a matte IPS screen. In addition, an optical drive is on board. With a price of just under 800 Euros (~$934), the computer is not a bargain.
AMD Ryzen 5 3500U, Vega 8, 17.3", 2.5 kgBeelink GTR35 II-G-16512D00W64PRO-1T: AMD Ryzen 5 3550H, 0.8 kg
Review » Beelink GT-R Mini Desktop Review
Honor MagicBook 15: AMD Ryzen 5 3500U, 15.60", 1.5 kg
Review » Honor MagicBook 15 in review: Ryzen 5 in a stylish suit
Huawei MateBook 13 2020 AMD: AMD Ryzen 5 3500U, 13.00", 1.3 kg
Review » Huawei MateBook 13 (2020) review - A Ryzen laptop isn't always the better choice
HP EliteBook 735 G6 7KN29EA: AMD Ryzen 5 PRO 3500U, 13.30", 1.5 kg
Review » HP EliteBook 735 G6 laptop review: Despite AMD Picasso, not necessarily a bad choice
Honor Magicbook 14: AMD Ryzen 5 3500U, 14.00", 1.4 kg
Review » Honor Magicbook 14 Laptop Review: A better version of the MateBook D 14?
Schenker VIA 15: AMD Ryzen 5 3500U, 15.60", 1.4 kg
Review » Schenker VIA 15 Laptop Review: a lightweight AMD notebook
Huawei MateBook D 14-53010TVS: AMD Ryzen 5 3500U, 14.00", 1.4 kg
Review » Huawei MateBook D 14 in Review: AMD Ryzen 5 3500U Unleashed
Huawei MateBook D 15-53010TUY: AMD Ryzen 5 3500U, 15.60", 1.5 kg
Review » Huawei MateBook D 15 Laptop Review: Still a good notebook with AMD
Asus VivoBook 17 M712DA-AU017T: AMD Ryzen 5 3500U, 17.30", 2.3 kg
Review » Asus VivoBook 17 M712DA Laptop Review: Cheap 17-incher
Lenovo IdeaPad S540-13API: AMD Ryzen 5 3550H, 13.30", 1.3 kg
Review » Lenovo IdeaPad S540-13API Laptop in Review: Slim Ryzen Companion with Long Battery Life
Walmart Motile M142: AMD Ryzen 5 3500U, 14.00", 1.1 kg
Review » Walmart Motile M142 Laptop Review: Pretty Good for $500
Acer Aspire 5 A515-43-R6WW: AMD Ryzen 5 3500U, 15.60", 1.8 kg
Review » Acer Aspire 5 A515-43-R057 Laptop Review: A super price for an AMD laptop, but with a hefty shortcoming
Acer Swift 3 SF314-41-R8HZ: AMD Ryzen 5 3500U, 14.00", 1.5 kg
Review » Acer Swift 3 SF314-41 Laptop Review: A stylish and slim Ryzen subnotebook with plenty of power and battery life in the tank
Lenovo Ideapad C340-14API 81N6004UGE: AMD Ryzen 5 3500U, 14.00", 1.7 kg
Review » Lenovo IdeaPad Flex 14API Review: Ryzen 5 raises the bar
HP ProBook 455R G6: AMD Ryzen 5 3500U, 15.60", 2 kg
Review » HP ProBook 455R G6 Laptop Review: Better battery life thanks to Zen+
Lenovo V155-15API: AMD Ryzen 5 3500U, 15.60", 2.2 kg
Review » Lenovo V155 Review: Budget laptop turns out as a storage giant
Lenovo ThinkPad E495-20NE000JGE: AMD Ryzen 5 3500U, 14.00", 1.8 kg
Review » Lenovo ThinkPad E495 Laptop Review: Inexpensive office device with a lot of power, but without keyboard illumination
Lenovo ThinkPad T495-20NKS01Y00: AMD Ryzen 5 PRO 3500U, 14.00", 1.5 kg
Review » Lenovo ThinkPad T495 Review: business laptop with AMD processor, long battery life, and good display
Lenovo Ideapad L340-17API-81LY0004GE: AMD Ryzen 5 3500U, 17.30", 2.8 kg
Review » Lenovo Ideapad L340-17API laptop review: 17.3-incher pleases with good battery life
Lenovo Ideapad 330S-15ARR-81FB00C7GE: AMD Ryzen 5 2500U, 15.60", 1.9 kg
Review » Lenovo IdeaPad 330s-15ARR Laptop Review: A powerful Ryzen 5 2500U laptop paired with disappointing battery life
Huawei MateBook D 14 W00D-53010GXL: AMD Ryzen 5 2500U, 14.00", 1.5 kg
Review » Huawei MateBook D 14 W00D (Ryzen 5, RX Vega 8) Laptop Review
HP ProBook 445 G6: AMD Ryzen 5 2500U, 14.00", 1.6 kg
Review » HP ProBook 445 G6 (Ryzen 5 2500U, RX Vega 8, SSD, FHD) Laptop Review
Lenovo ThinkPad E485-20KU000NGE: AMD Ryzen 5 2500U, 14.00", 1.8 kg
Review » Lenovo ThinkPad E485 (Ryzen 5, Vega 8) Laptop Review
Lenovo ThinkPad A285-20MX0002GE: AMD Ryzen 5 PRO 2500U, 12.50", 1.1 kg
Review » Lenovo ThinkPad A285 (Ryzen 5 Pro, Vega 8, FHD) Laptop Review
HP 17-ca0013ng: AMD Ryzen 5 2500U, 17.30", 2.5 kg
Review » HP 17 (Ryzen 5 2500U, FHD, IPS, Vega 8) Review
HP Pavilion 15-cw0003ng: AMD Ryzen 5 2500U, 15.60", 1.9 kg
Review » HP Pavilion 15 (AMD Ryzen 5 2500U, Vega 8) Laptop Review
Lenovo ThinkPad A485-20MU000CGE: AMD Ryzen 5 PRO 2500U, 14.00", 1.6 kg
Review » Lenovo ThinkPad A485 (Ryzen 5 Pro) Laptop Review
Lenovo IdeaPad 330-15ARR 81D2005CUS: AMD Ryzen 5 2500U, 15.60", 2.2 kg
Review » Lenovo IdeaPad 330 15 (Ryzen 5 2500U) Laptop Review
HP ProBook 645 G4 3UP62EA: AMD Ryzen 5 PRO 2500U, 14.00", 1.7 kg
Review » HP ProBook 645 G4 (Ryzen 5 Pro 2500U, SSD, FHD) Laptop Review
HP Envy x360 15-bq102ng: AMD Ryzen 5 2500U, 15.60", 2.1 kg
Review » HP Envy x360 15z (Ryzen 5 2500U, Vega 8, SSD, FHD) Convertible Review
Lenovo Ideapad 720S-13ARR: AMD Ryzen 5 2500U, 13.30", 1.1 kg
Review » Lenovo Ideapad 720S (Ryzen 2500U, Vega 8) Laptop Review
MSI B350I Pro AC - DDR4-2933: AMD Ryzen 3 2200G, 0.00"
Review » Ryzen 5 2400G and Ryzen 3 2200G in Review
Acer Swift 3 SF315-41-R4W1: AMD Ryzen 5 2500U, 15.60", 2 kg
Review » Acer Swift 3 SF315 (Ryzen 5 2500U, Vega 8, 256 GB, FHD) Laptop Review
HP Envy x360 15m-bq121dx: AMD Ryzen 5 2500U, 15.60", 2.2 kg
Review » HP Envy x360 15 (Ryzen 5 2500U, Radeon Vega 8) Laptop Review
HP Pavilion 15-cw0003ng: AMD Ryzen 5 2500U, 15.60", 1.9 kg
External Review » HP Pavilion 15-cw0003ng
Medion Akoya E14301: AMD Ryzen 5 3500U, 14.00", 1.5 kg
External Review » Medion Akoya E14301
HP Pavilion 15-cw1501nd: AMD Ryzen 5 3500U, 15.60", 1.9 kg
External Review » HP Pavilion 15-cw1501nd
Dell Vostro 14 3405, R5 3500U: AMD Ryzen 5 3500U, 14.00", 1.7 kg
External Review » Dell Vostro 14 3405, R5 3500U
BMAX X14 Pro: AMD Ryzen 5 3450U, 14.00", 1.4 kg
External Review » BMAX X14 Pro
HP Pavilion 15-cw1947nd: AMD Ryzen 5 3500U, 15.60", 1.9 kg
External Review » HP Pavilion 15-cw1947nd
Acer Spin 3 SP314-21-R572: AMD Ryzen 5 3500U, 14.00", 1.5 kg
External Review » Acer Spin 3 SP314-21-R572
Asus VivoBook 14 D415DA-EB238: AMD Ryzen 5 3500U, 14.00", 1.6 kg
External Review » Asus VivoBook 14 D415DA-EB238
Asus VivoBook 14 M415DA-EK274: AMD Ryzen 5 3500U, 14.00", 1.6 kg
External Review » Asus VivoBook 14 M415DA-EK274
Medion Akoya E15301: AMD Ryzen 5 3500U, 15.60", 1.9 kg
External Review » Medion Akoya E15301
Lenovo ThinkPad E585-20KV0008MH: AMD Ryzen 5 2500U, 15.60", 2.1 kg
External Review » Lenovo ThinkPad E585-20KV0008MH
HP 15s-eq0022ns: AMD Ryzen 5 3500U, 15.60", 1.8 kg
External Review » HP 15s-eq0022ns
Asus VivoBook 14 M409DA-BV646: AMD Ryzen 5 3500U, 14.00", 1.5 kg
External Review » Asus VivoBook 14 M409DA-BV646
Asus VivoBook D509DA-EJ028T: AMD Ryzen 5 3500U, 15.60", 1.8 kg
External Review » Asus VivoBook D509DA-EJ028T
Asus VivoBook 14 M409DA-EK146T: AMD Ryzen 5 3500U, 14.00", 1.6 kg
External Review » Asus VivoBook 14 M409DA-EK146T
HP Pavilion 15-cw1948nd: AMD Ryzen 5 3500U, 15.60", 1.9 kg
External Review » HP Pavilion 15-cw1948nd
HP 14-dk0033ns: AMD Ryzen 5 3500U, 14.00", 1.5 kg
External Review » HP 14-dk0033ns
Acer Aspire 3 A315-23-R6U9: AMD Ryzen 5 3500U, 15.60", 1.9 kg
External Review » Acer Aspire 3 A315-23-R6U9
Acer Aspire 3 A315-23-R875: AMD Ryzen 5 3500U, 15.60", 1.9 kg
External Review » Acer Aspire 3 A315-23-R875
Lenovo ThinkPad E495-20NE000JGE: AMD Ryzen 5 3500U, 14.00", 1.8 kg
External Review » Lenovo ThinkPad E495-20NE000JGE
Lenovo IdeaPad S145-81V70008BR: AMD Ryzen 5 3500U, 15.60", 2.5 kg
External Review » Lenovo IdeaPad S145-81V70008BR
Acer Aspire 3 A315-23-R33X: AMD Ryzen 5 3500U, 15.60", 1.9 kg
External Review » Acer Aspire 3 A315-23-R33X
HP 14-dk0030ns: AMD Ryzen 5 3500U, 14.00", 1.5 kg
External Review » HP 14-dk0030ns
Acer Aspire 3 A315-23-R8W6: AMD Ryzen 5 3500U, 15.60", 1.9 kg
External Review » Acer Aspire 3 A315-23-R8W6
HP 17-ca1008ng: AMD Ryzen 5 3500U, 17.30", 2.5 kg
External Review » HP 17-ca1008ng
Lenovo IdeaPad 3 15ADA05: AMD Ryzen 5 3500U, 15.60", 1.9 kg
External Review » Lenovo IdeaPad 3 15ADA05
Asus VivoBook 17 D712DA-AU021T: AMD Ryzen 5 3500U, 17.30", 2.3 kg
External Review » Asus VivoBook 17 D712DA-AU021T
Asus ZenBook 14 UM431DA-AM011T: AMD Ryzen 5 3500U, 14.00", 1.4 kg
External Review » Asus ZenBook 14 UM431DA-AM011T
Asus D509DA-BR294: AMD Ryzen 5 3500U, 15.60", 1.8 kg
External Review » Asus D509DA-BR294
Acer Swift 3 SF314-41-R69Y: AMD Ryzen 5 3500U, 14.00", 1.5 kg
External Review » Acer Swift 3 SF314-41-R69Y
Asus M509DA-EJ068T: AMD Ryzen 5 3500U, 15.60", 1.8 kg
External Review » Asus M509DA-EJ068T
Asus ZenBook Flip 14 UM462DA-AI038: AMD Ryzen 5 3500U, 14.00", 1.6 kg
External Review » Asus ZenBook Flip 14 UM462DA-AI038
Lenovo ThinkPad T495-20NKS01Y00: AMD Ryzen 5 PRO 3500U, 14.00", 1.5 kg
External Review » Lenovo ThinkPad T495-20NKS01Y00
Honor MagicBook 15: AMD Ryzen 5 3500U, 15.60", 1.5 kg
External Review » Honor MagicBook 15
Asus VivoBook 14 D409DA-EK366: AMD Ryzen 5 3500U, 14.00", 1.6 kg
External Review » Asus VivoBook 14 D409DA-EK366
Lenovo Ideapad S340-14API-81NB006AGE: AMD Ryzen 5 3500U, 14.00", 1.7 kg
External Review » Lenovo Ideapad S340-14API-81NB006AGE
Huawei MateBook 13 2020 AMD: AMD Ryzen 5 3500U, 13.00", 1.3 kg
External Review » Huawei MateBook 13 2020 AMD
Lenovo IdeaPad S540-13API: AMD Ryzen 5 3550H, 13.30", 1.3 kg
External Review » Lenovo IdeaPad S540-13API
HP 15s-eq0025ns: AMD Ryzen 5 3500U, 15.60", 1.7 kg
External Review » HP 15s-eq0025ns
Honor MagicBook Pro HLY-19R: AMD Ryzen 5 3550H, 16.10", 1.7 kg
External Review » Honor MagicBook Pro HLY-19R
Lenovo Ideapad S145-15API-81UT00DBGE: AMD Ryzen 5 3500U, 15.60", 1.9 kg
External Review » Lenovo Ideapad S145-15API-81UT00DBGE
Asus VivoBook 17 M712DA-AU017T: AMD Ryzen 5 3500U, 17.30", 2.3 kg
External Review » Asus VivoBook 17 M712DA-AU017T
Acer Aspire 5 A515-43-R4HV: AMD Ryzen 5 3500U, 15.60", 1.9 kg
External Review » Acer Aspire 5 A515-43-R4HV
HP 14-dk0009ns: AMD Ryzen 5 3500U, 14.00", 1.5 kg
External Review » HP 14-dk0009ns
HP 15s-eq0017ns: AMD Ryzen 5 3500U, 15.60", 1.8 kg
External Review » HP 15s-eq0017ns
Asus M509DA-EJ025T: AMD Ryzen 5 3500U, 15.60", 1.9 kg
External Review » Asus M509DA-EJ025T
HP Envy x360 13-ar0002ur: AMD Ryzen 5 3500U, 13.30", 1.3 kg
External Review » HP Envy x360 13-ar0002ur
Lenovo ThinkPad A285-20MW000JMH: AMD Ryzen 5 2500U, 12.50", 1.2 kg
External Review » Lenovo ThinkPad A285-20MW000JMH
Lenovo ThinkPad E595-20NF001HMH: AMD Ryzen 5 3500U, 15.60", 2.1 kg
External Review » Lenovo ThinkPad E595-20NF001HMH
Acer Swift 3 SF314-41-R9JT: AMD Ryzen 5 3500U, 14.00", 1.5 kg
External Review » Acer Swift 3 SF314-41-R9JT
Honor Magicbook 14: AMD Ryzen 5 3500U, 14.00", 1.4 kg
External Review » Honor Magicbook 14
Huawei MateBook D 15-53010TUY: AMD Ryzen 5 3500U, 15.60", 1.5 kg
External Review » Huawei MateBook D 15-53010TUY
HP 14-dk0933nd: AMD Ryzen 5 3500U, 14.00", 1.5 kg
External Review » HP 14-dk0933nd
Huawei Matebook D 15 Space Grey (2020): AMD Ryzen 5 3500U, 15.60", 1.5 kg
External Review » Huawei Matebook D 15 Space Grey (2020)
Huawei MateBook D 14-53010TVS: AMD Ryzen 5 3500U, 14.00", 1.4 kg
External Review » Huawei MateBook D 14-53010TVS
HP Envy x360 13-ar0006nw: AMD Ryzen 5 3500U, 13.30", 1.3 kg
External Review » HP Envy x360 13-ar0006nw
HP Envy x360 13-ar0150nd: AMD Ryzen 5 3500U, 13.30", 1.3 kg
External Review » HP Envy x360 13-ar0150nd
HP Envy x360 13-ar0800no: AMD Ryzen 5 3500U, 13.30", 1.3 kg
External Review » HP Envy x360 13-ar0800no
Acer Swift 3 SF314-41-R8HZ: AMD Ryzen 5 3500U, 14.00", 1.5 kg
External Review » Acer Swift 3 SF314-41-R8HZ
Asus ZenBook Flip 14 UM462DA-AI012T: AMD Ryzen 5 3500U, 14.00", 1.6 kg
External Review » Asus ZenBook Flip 14 UM462DA-AI012T
Acer Swift 3 SF314-41-R1X6: AMD Ryzen 5 3500U, 14.00", 1.5 kg
External Review » Acer Swift 3 SF314-41-R1X6
Asus ZenBook 14 UM431DA-AM003: AMD Ryzen 5 3500U, 14.00", 1.4 kg
External Review » Asus ZenBook 14 UM431DA-AM003
HP 255 G7 6UM18EA: AMD Ryzen 5 2500U, 15.60", 1.8 kg
External Review » HP 255 G7 6UM18EA
HP 17-ca1105ng: AMD Ryzen 5 3500U, 17.30", 2.5 kg
External Review » HP 17-ca1105ng
Lenovo V155-15API-81V50008SP: AMD Ryzen 5 3500U, 15.60", 2.2 kg
External Review » Lenovo V155-15API-81V50008SP
Acer Aspire 3 A315-42-R5P7: AMD Ryzen 5 3500U, 15.60", 1.9 kg
External Review » Acer Aspire 3 A315-42-R5P7
Asus ZenBook 14 UM431DA-AM053: AMD Ryzen 5 3500U, 14.00", 1.4 kg
External Review » Asus ZenBook 14 UM431DA-AM053
Acer Aspire 5 A515-43-R7MS: AMD Ryzen 5 3500U, 15.60", 1.8 kg
External Review » Acer Aspire 5 A515-43-R7MS
Lenovo Ideapad C340-14API 81N6004UGE: AMD Ryzen 5 3500U, 14.00", 1.7 kg
External Review » Lenovo Ideapad C340-14API 81N6004UGE
Asus VivoBook 15 S512DA-BR097: AMD Ryzen 5 3500U, 15.60", 1.6 kg
External Review » Asus VivoBook 15 S512DA-BR097
Acer Swift 3 SF314-41-R8VS: AMD Ryzen 5 3500U, 14.00", 1.5 kg
External Review » Acer Swift 3 SF314-41-R8VS
Asus ZenBook 14 UM433DA-AM062T: AMD Ryzen 5 3500U, 14.00", 1.4 kg
External Review » Asus ZenBook 14 UM433DA-AM062T
Lenovo Ideapad C340-14API-81N6005LSP: AMD Ryzen 5 3500U, 14.00", 1.7 kg
External Review » Lenovo Ideapad C340-14API-81N6005LSP
HP 14-dk0002ns: AMD Ryzen 5 3500U, 14.00", 1.5 kg
External Review » HP 14-dk0002ns
HP Envy x360 13-ar0004ng: AMD Ryzen 5 3500U, 13.30", 1.3 kg
External Review » HP Envy x360 13-ar0004ng
Lenovo Ideapad S540-14API-81NH002YGE: AMD Ryzen 5 3500U, 14.00", 1.5 kg
External Review » Lenovo Ideapad S540-14API-81NH002YGE
Lenovo V330-14ARR-81B1001EUK: AMD Ryzen 5 2500U, 14.00", 1.6 kg
External Review » Lenovo V330-14ARR-81B1001EUK
HP 15-db1011ns: AMD Ryzen 5 3500U, 15.60", 1.8 kg
External Review » HP 15-db1011ns
Lenovo Ideapad S145-15API-81UT001: AMD Ryzen 5 PRO 3500U, 15.60", 1.9 kg
External Review » Lenovo Ideapad S145-15API-81UT001
HP 15-db0069wm: AMD Ryzen 5 2500U, 15.60", 1.8 kg
External Review » HP 15-db0069wm
HP Envy x360 13-ar0000ns: AMD Ryzen 5 3500U, 13.30", 1.3 kg
External Review » HP Envy x360 13-ar0000ns
HP 15-db1014ns: AMD Ryzen 5 3500U, 15.60", 1.8 kg
External Review » HP 15-db1014ns
Lenovo IdeaPad 330-15ARR-81D2007KSP: AMD Ryzen 5 2500U, 15.60", 2.2 kg
External Review » Lenovo IdeaPad 330-15ARR-81D2007KSP
Huawei MateBook D 14-53010GXL: AMD Ryzen 5 2500U, 14.00", 1.5 kg
External Review » Huawei MateBook D 14-53010GXL
Asus VivoBook 15 R505ZA-BR675: AMD Ryzen 5 2500U, 15.60", 1.6 kg
External Review » Asus VivoBook 15 R505ZA-BR675
Acer Aspire 3 A315-41-R98U: AMD Ryzen 5 2500U, 15.60", 2.4 kg
External Review » Acer Aspire 3 A315-41-R98U
Lenovo Yoga 530-14ARR-81H9001PMH: AMD Ryzen 5 2500U, 14.00", 1.7 kg
External Review » Lenovo Yoga 530-14ARR-81H9001PMH
Lenovo IdeaPad 330-15ARR 81D2005CUS: AMD Ryzen 5 2500U, 15.60", 2.2 kg
External Review » Lenovo IdeaPad 330-15ARR 81D2005CUS
Huawei MateBook D 14 W00D-53010GXL: AMD Ryzen 5 2500U, 14.00", 1.5 kg
External Review » Huawei MateBook D 14 W00D-53010GXL
Lenovo Ideapad 330-15ARR-81D2007LSP: AMD Ryzen 5 2500U, 15.60", 2.2 kg
External Review » Lenovo Ideapad 330-15ARR-81D2007LSP
Acer Swift 3 SF315-41-R96P: AMD Ryzen 5 2500U, 15.60", 2.2 kg
External Review » Acer Swift 3 SF315-41-R96P
Lenovo ThinkPad A285-20MX0002GE: AMD Ryzen 5 PRO 2500U, 12.50", 1.1 kg
External Review » Lenovo ThinkPad A285-20MX0002GE
Honor MagicBook KPL-WOOB: AMD Ryzen 5 2500U, 14.00", 1.5 kg
External Review » Honor MagicBook KPL-WOOB
Asus VivoBook 15 X505ZA-BQ012T: AMD Ryzen 5 2500U, 15.60", 1.6 kg
External Review » Asus VivoBook 15 X505ZA-BQ012T
HP 15-db0045ns: AMD Ryzen 5 2500U, 15.60", 1.8 kg
External Review » HP 15-db0045ns
HP 14-cm0970nd: AMD Ryzen 5 2500U, 14.00", 1.5 kg
External Review » HP 14-cm0970nd
HP 17-ca0980nd: AMD Ryzen 5 2500U, 17.30", 2.5 kg
External Review » HP 17-ca0980nd
Dell Inspiron 13 7375 2-in-1: AMD Ryzen 5 2500U, 13.30", 1.8 kg
External Review » Dell Inspiron 13 7375 2-in-1
Lenovo Yoga 530-14ARR-81H9001ASP: AMD Ryzen 5 2500U, 14.00", 1.6 kg
External Review » Lenovo Yoga 530-14ARR-81H9001ASP
Lenovo Yoga 530-14ARR-81H9003DGE: AMD Ryzen 5 2500U, 14.00", 1.6 kg
External Review » Lenovo Yoga 530-14ARR-81H9003DGE
HP Envy x360 13-ag0005ng: AMD Ryzen 5 2500U, 13.30", 1.3 kg
External Review » HP Envy x360 13-ag0005ng
HP 15-db0029ns: AMD Ryzen 5 2500U, 15.60", 1.8 kg
External Review » HP 15-db0029ns
HP 15-db0011ns: AMD Ryzen 5 2500U, 15.60", 2 kg
External Review » HP 15-db0011ns
HP 17-ca0992nd: AMD Ryzen 5 2500U, 17.30", 2.5 kg
External Review » HP 17-ca0992nd
HP Envy x360 13-ag0140nd: AMD Ryzen 5 2500U, 13.30", 1.3 kg
External Review » HP Envy x360 13-ag0140nd
Huawei MateBook D 14, AMD Edition: AMD Ryzen 5 2500U, 14.00", 1.6 kg
External Review » Huawei MateBook D, AMD Edition
HP Pavilion 15-cw0001ns: AMD Ryzen 5 2500U, 15.60", 1.8 kg
External Review » HP Pavilion 15-cw0001ns
HP Envy x360 13-AG0002NS: AMD Ryzen 5 2500U, 13.30", 1.3 kg
External Review » HP Envy x360 13-AG0002NS
Acer Aspire 3-A315-41S: AMD Ryzen 5 2500U, 15.60", 2.3 kg
External Review » Acer Aspire 3-A315-41S
HP Envy x360 15-bq181no: AMD Ryzen 5 2500U, 15.60", 2 kg
External Review » HP Envy x360 15-bq181no
Acer Aspire 3 A315-41-R8ZC: AMD Ryzen 5 2500U, 15.60", 2.1 kg
External Review » Acer Aspire 3 A315-41-R8ZC
Acer Swift 3 SF315-41-R8PP: AMD Ryzen 5 2500U, 15.60", 2 kg
External Review » Acer Swift 3 SF315-41-R8PP
Lenovo Ideapad 720S-13ARR: AMD Ryzen 5 2500U, 13.30", 1.1 kg
External Review » Lenovo Ideapad 720S-13ARR
Acer Swift 3 SF315-41-R7EQ: AMD Ryzen 5 2500U, 15.60", 2 kg
External Review » Acer Swift 3 SF315-41-R7EQ
HP Envy x360 15-bq100au: AMD Ryzen 5 2500U, 15.60", 2.2 kg
External Review » HP Envy x360 15-bq100au
Acer Swift 3 SF315-41-R69U: AMD Ryzen 5 2500U, 15.60", 2.2 kg
External Review » Acer Swift 3 SF315-41-R69U
HP Envy x360 15z-1ZA07AV: AMD Ryzen 5 2500U, 15.60", 2.2 kg
External Review » HP Envy x360 15z-1ZA07AV
HP Envy x360 15-bq102ng: AMD Ryzen 5 2500U, 15.60", 2.1 kg
External Review » HP Envy x360 15-bq102ng
HP Envy x360 15-bq100nl: AMD Ryzen 5 2500U, 15.60", 2.1 kg
External Review » HP Envy x360 15-bq100nl
Acer Swift 3 SF315-41-R1H4: AMD Ryzen 5 2500U, 15.60", 2.1 kg
External Review » Acer Swift 3 SF315-41-R1H4
HP Envy x360 15m-bq121dx: AMD Ryzen 5 2500U, 15.60", 2.2 kg
External Review » HP Envy x360 15m-bq121dx
Acer Swift 3 SF315-41-R4W1: AMD Ryzen 5 2500U, 15.60", 2 kg
External Review » Acer Swift 3 SF315-41-R4W1
HP Envy 15-bq100nd x360: AMD Ryzen 5 2500U, 15.60", 2.2 kg
External Review » HP Envy 15-bq100nd x360
Dell Inspiron 15 3505-PXHPW: AMD Ryzen 5 3450U, 15.60", 2 kg
» Dell Inspiron 15 3505: Ryzen office laptop with low stamina
Honor MagicBook 15: AMD Ryzen 5 3500U, 15.60", 1.5 kg
» The Honor MagicBook 15 has turned out pretty, but offers only mediocre endurance values
Huawei MateBook 13 2020 AMD: AMD Ryzen 5 3500U, 13.00", 1.3 kg
» MateBook 13: This is the best chipset for the Huawei laptop
Honor Magicbook 14: AMD Ryzen 5 3500U, 14.00", 1.4 kg
» Apple MacBook Air vs. Honor MagicBook 14: Twice the price, half of the performance?
» The Honor MagicBook 14 is the price-performance champion
» Honor MagicBook 14 Hands-On: A solid and stylish budget laptop
Huawei MateBook D 14-53010TVS: AMD Ryzen 5 3500U, 14.00", 1.4 kg
» Huawei MateBook D 14: Just as good as the D 15
Huawei MateBook D 15-53010TUY: AMD Ryzen 5 3500U, 15.60", 1.5 kg
» Huawei MateBook D 15: Other manufacturers have something to learn from Huawei
Lenovo ThinkPad T495-20NKS01Y00: AMD Ryzen 5 PRO 3500U, 14.00", 1.5 kg
» Lenovo ThinkPad T495 with Ryzen 5 Pro is slower than Core i5 ThinkPad T490 in initial benchmarks