Notebook reviews with NVIDIA GeForce RTX 3080 Laptop GPU graphics card
Acemagic M2A Starship review: Gaming PC with futuristic spaceship look relies on Intel Core i9-12900H and Nvidia GeForce RTX 3080 laptop GPU
With the M2A Starship, Acemagic has a very eye-catching gaming PC in its portfolio. The unusual spaceship-like design of the mini-PC attracts attention, however, there is familiar hardware already used in the Acemagic Tank03. In this review, we analyzed the practical performance of the Intel Core i9-12900H and the NvidiaGeForce-RTX-3080 laptop GPU in the unique housing.
Intel Core i9-12900H, NVIDIA GeForce RTX 3080 Laptop GPU, 2.1 kgAcemagic Tank 03 gaming PC review: Small mini PC with Intel Core i9-12900H and Nvidia GeForce RTX 3080 GPU also masters current games
With the Tank 03, Acemagic offers a very special mini PC in its portfolio that stands out with a huge performance packed into the smallest amount of space. At least, this is what is promised by the technical specifications. Find out in this review, what the Intel Core i9-12900H in combination with the Nvidia GeForce RTX-3080 Laptop GPU can do in practice. As a special feature, the mini PC also offers three different performance profiles that we also examine in detail.
Intel Core i9-12900H, NVIDIA GeForce RTX 3080 Laptop GPU, 2.2 kgAcemagic Tank 03 gaming PC review: Small mini PC with Intel Core i9-12900H and Nvidia GeForce RTX 3080 GPU also masters current games
With the Tank 03, Acemagic offers a very special mini PC in its portfolio that stands out with a huge performance packed into the smallest amount of space. At least, this is what is promised by the technical specifications. Find out in this review, what the Intel Core i9-12900H in combination with the Nvidia GeForce RTX-3080 Laptop GPU can do in practice. As a special feature, the mini PC also offers three different performance profiles that we also examine in detail.
Intel Core i9-12900H, NVIDIA GeForce RTX 3080 Laptop GPUAcemagic Tank 03 gaming PC review: Small mini PC with Intel Core i9-12900H and Nvidia GeForce RTX 3080 GPU also masters current games
With the Tank 03, Acemagic offers a very special mini PC in its portfolio that stands out with a huge performance packed into the smallest amount of space. At least, this is what is promised by the technical specifications. Find out in this review, what the Intel Core i9-12900H in combination with the Nvidia GeForce RTX-3080 Laptop GPU can do in practice. As a special feature, the mini PC also offers three different performance profiles that we also examine in detail.
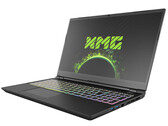
Intel Core i9-12900H, NVIDIA GeForce RTX 3080 Laptop GPUSchenker XMG Pro 15 (Clevo PC50HS-D) review: Thin and light 4K gaming laptop
The Core i7-11800H CPU and GeForce RTX 3080 mobile GPU complement the bright, high-contrast 4K OLED screen well and are able to run all current titles smoothly. The GPU comes with 16 GB of video memory. Another plus: The laptop integrates a Thunderbolt 4 port.
Intel Core i7-11800H, NVIDIA GeForce RTX 3080 Laptop GPU, 15.6", 2 kgSchenker XMG Pro 17 (Late 2021, RTX 3080): Intel Core i7-11800H, 17.30", 2.4 kg
Review » Schenker XMG Pro 17 with RTX 3080 (Clevo PC70HS) review: A throttled ultra-slim gaming laptop and workstation in one
Lenovo ThinkPad X1 Extreme G4-20Y50040GE: Intel Core i9-11950H, 16.00", 1.9 kg
Review » Lenovo ThinkPad X1 Extreme G4 Review: The best Multimedia Laptop thanks to Core i9 and RTX 3080?
MSI GP66 Leopard 11UH-028: Intel Core i7-11800H, 15.60", 2.3 kg
Review » Inexpensive MSI GP66 Leopard 11UH in review: Gamer with RTX 3080 for under €2,000
Alienware m15 R6, i7-11800H RTX 3080: Intel Core i7-11800H, 15.60", 2.5 kg
Review » Alienware m15 R6 laptop review: More efficient, but the RTX 3080 is slower than in the predecessor
Schenker XMG NEO 17 GM7TG8S: Intel Core i7-11800H, 17.30", 2.6 kg
Review » Schenker XMG NEO 17 with RTX 3080 in laptop review: Users can unleash the RTX 3080 themselves
Alienware x17 RTX 3080 P48E: Intel Core i7-11800H, 17.30", 3.2 kg
Review » Alienware x17 R1 RTX 3080 laptop review: A new beginning
MSI GS76 Stealth 11UH: Intel Core i9-11900H, 17.30", 2.4 kg
Review » MSI GS76 Stealth 11UH gaming laptop review: Slim build sacrifices GPU performance
Maingear Vector Pro MG-VCP17: Intel Core i7-11800H, 17.30", 2.3 kg
Review » Maingear Vector Pro MG-VCP17 laptop review: 165 W GeForce RTX 3080 for ultrathin size
MSI GE76 Raider 11UH-472US: Intel Core i9-11980HK, 17.30", 3 kg
Review » MSI GE76 Raider 11UH in review: High-end gaming laptop offers fast 360 Hz display
Acer Nitro 5 AN517-41-R9S5: AMD Ryzen 7 5800H, 17.30", 2.7 kg
Review » Acer Nitro 5 AN517-41 in review: RTX 3080 can only develop to a limited extent
Medion Erazer Beast X25: AMD Ryzen 9 5900HX, 17.30", 2.3 kg
Review » Medion Erazer Beast X25 (Tongfang GM7ZG8P) gaming laptop review: Light and yet powerful
Asus ROG Strix Scar 15 G533QS: AMD Ryzen 9 5900HX, 15.60", 2.3 kg
Review » Asus ROG Strix Scar 15 G533QS Laptop Review: AMD Zen 3 and 165 Hz 1440p Sweet Spot
Asus ROG Zephyrus S17 GX703HSD: Intel Core i9-11900H, 17.30", 2.8 kg
Review » Asus ROG Zephyrus S17 laptop review: Gaming device case opens up to provide more fresh air. Cool - but is it safe?
Razer Blade 15 Advanced (Mid 2021): Intel Core i7-11800H, 15.60", 2 kg
Review » Razer Blade 15 Advanced Model 11th Gen Intel (2021) Review: Small Changes, Big CPU Gains
Aorus 17G YD: Intel Core i7-11800H, 17.30", 2.8 kg
Review » Aorus 17G YD in review: Loud gaming laptop with a good mechanical keyboard
Schenker XMG Neo 15 Tiger Lake: Intel Core i7-11800H, 15.60", 2.2 kg
Review » Schenker XMG Neo 15 gaming laptop in review - RTX 3080 with 165W TGP ensures high scores
Aorus 15P YD: Intel Core i7-11800H, 15.60", 2.2 kg
Review » Aorus 15P YD in review: High-end gaming laptop with fast 360 Hz display
Lenovo Legion 7 16ACHg6: AMD Ryzen 9 5900HX, 16.00", 2.5 kg
Review » Lenovo Legion 7 16ACH in review: Gaming powerhouse with good 16:10 display
Alienware m15 R4 RTX 3080: Intel Core i9-10980HK, 15.60", 2.4 kg
Review » Alienware m15 R4 laptop in review: Now also with a mechanical keyboard
Gigabyte Aero 17 HDR YD: Intel Core i9-11980HK, 17.30", 2.8 kg
Review » Gigabyte Aero 17 HDR YD laptop review: 4K HDR meets RTX 3080
Asus Strix Scar 17 G733QSA-XS99: AMD Ryzen 9 5900HX, 17.30", 2.8 kg
Review » Asus Strix Scar 17 G733QS Laptop Review: Liquid Metal 7 nm AMD Zen 3 Is Stunning
Razer Blade 15 Advanced Model Early 2021: Intel Core i7-10875H, 15.60", 2 kg
Review » Razer Blade 15 Advanced (Early 2021) Review: Now with a 360-Hz screen
Schenker XMG Ultra 17 Rocket Lake: Intel Core i9-11900K, 17.30", 4.7 kg
Review » Schenker XMG Ultra 17 (Clevo X170KM-G) in review: Massive powerhouse with lush equipment
Alienware m17 R4: Intel Core i9-10980HK, 17.30", 3 kg
Review » Alienware m17 R4 laptop review: Burning up into the atmosphere
MSI GE76 Raider 10UH: Intel Core i7-10870H, 17.30", 3 kg
Review » MSI GE76 Raider 10UH Laptop Review: A GeForce RTX 3080 PC You Can Actually Buy
Schenker XMG Pro 15 (Early 2021, RTX 3080): Intel Core i7-10870H, 15.60", 2 kg
Review » Schenker XMG Pro 15 (Clevo PC50DS) with RTX 3080 in Review: Ultra-Thin and Lightweight High-End All-Rounder
Asus ROG Flow X13 with XG Mobile (internal Display): AMD Ryzen 9 5980HS, 13.40"
Review » Asus ROG XG Mobile in review - Gaming convertible with AMD Ryzen 5980HS and GeForce RTX 3080
Review » Asus ROG XG Mobile in review - Gaming convertible with AMD Ryzen 5980HS and GeForce RTX 3080
Razer Blade Pro 17 2021 (QHD Touch): Intel Core i7-10875H, 17.30", 3 kg
Review » Razer Blade Pro 17 Early 2021 Laptop Review: The GeForce RTX 30 Difference
Asus ROG Zephyrus Duo 15 SE GX551QS: AMD Ryzen 9 5900HX, 15.60", 2.5 kg
Review » AMD Ryzen 9 5900HX is a Mobile Beast: Asus ROG Zephyrus Duo 15 SE GX551QS Laptop Review
Asus ROG Zephyrus G15 GA503Q: AMD Ryzen 9 5900HS, 15.60", 2 kg
Review » Asus ROG Zephyrus G15 laptop review: Eye-catcher
Gigabyte Aero 17 HDR YC: Intel Core i9-10980HK, 17.30", 2.8 kg
Review » Gigabyte Aero 17 HDR YC Laptop in review: Debut for Nvidia Ampere
Alienware m15 R6, i7-11800H RTX 3080: Intel Core i7-11800H, 15.60", 2.5 kg
External Review » Alienware m15 R6, i7-11800H RTX 3080
Acer Predator Helios 300 PH315-55s-98TX: Intel Core i9-12900H, 15.60", 2.6 kg
External Review » Acer Predator Helios 300 PH315-55s-98TX
Acer Predator Helios 300 PH317-56-94RD: Intel Core i9-12900H, 17.30", 3 kg
External Review » Acer Predator Helios 300 PH317-56-94RD
Acer ConceptD 7 Ezel Pro CC715-72G-71H9: Intel Core i7-11800H, 16.00", 2.5 kg
External Review » Acer ConceptD 7 Ezel Pro CC715-72G-71H9
HP Omen 17-ck0196ng: Intel Core i9-11900H, 17.30", 2.8 kg
External Review » HP Omen 17-ck0196ng
Gigabyte Aero 15 OLED YD, i7-11800H: Intel Core i7-11800H, 15.60", 2 kg
External Review » Gigabyte Aero 15 OLED YD, i7-11800H
Acer Predator Triton 300 PT315-53-76B9: Intel Core i7-11800H, 15.60", 2.1 kg
External Review » Acer Predator Triton 300 PT315-53-76B9
Lenovo ThinkPad T15g G2-20YS002CUS: Intel Core i7-11850H, 15.60", 2.9 kg
External Review » Lenovo ThinkPad T15g G2-20YS002CUS
MSI Vector GP66 12UH-242: Intel Core i7-12700H, 15.60", 2.4 kg
External Review » MSI Vector GP66 12UH-242
Acer Predator Helios 500 PH517-52-78TY: Intel Core i7-11800H, 17.30", 4 kg
External Review » Acer Predator Helios 500 PH517-52-78TY
Schenker XMG Neo 15-E21dbb: AMD Ryzen 9 5900HX, 15.60", 2.1 kg
External Review » Schenker XMG Neo 15-E21dbb
Asus ROG Zephyrus S17 GX703HS-KF004R: Intel Core i9-11900H, 17.30", 2.6 kg
External Review » Asus ROG Zephyrus S17 GX703HS-KF004R
Razer Blade 17 RZ09-0406CG63-R3G1: Intel Core i9-11900H, 17.30", 2.8 kg
External Review » Razer Blade 17 RZ09-0406CG63-R3G1
Lenovo Legion 7 16ACHg6-82N600EKGE: AMD Ryzen 7 5800H, 16.00", 2.5 kg
External Review » Lenovo Legion 7 16ACHg6-82N600EKGE
Dream Machines 17 RX3080-17UA38: Intel Core i9-11900K, 17.30", 4.5 kg
External Review » Dream Machines 17 RX3080-17UA38
Acer Predator Triton 500 PT516-51s-72LN: Intel Core i7-11800H, 16.10", 2.5 kg
External Review » Acer Predator Triton 500 PT516-51s-72LN
Razer Blade 15 Advanced RZ09-0409CGC3-R3G1: Intel Core i7-11800H, 15.60", 2 kg
External Review » Razer Blade 15 Advanced RZ09-0409CGC3-R3G1
Acer Nitro 5 AN517-41-R3NX: AMD Ryzen 7 5800H, 15.60", 2.7 kg
External Review » Acer Nitro 5 AN517-41-R3NX
Alienware x15 R1-JYMD9: Intel Core i7-11800H, 15.60", 2.4 kg
External Review » Alienware x15 R1-JYMD9
MSI GS66 Stealth 11UH-045: Intel Core i9-11900H, 15.60", 2.1 kg
External Review » MSI GS66 Stealth 11UH-045
Alienware m15 R6-C0DK5: Intel Core i7-11800H, 15.60", 2.7 kg
External Review » Alienware m15 R6-C0DK5
Acer Nitro 5 AN515-45-R588: AMD Ryzen 7 5800H, 15.60", 2.3 kg
External Review » Acer Nitro 5 AN515-45-R588
Asus ROG Zephyrus Duo 15 SE GX551QS-HB202R: AMD Ryzen 9 5980HX, 15.60", 2.5 kg
External Review » Asus ROG Zephyrus Duo 15 SE GX551QS-HB202R
MSI Creator 17 B11UH-241: Intel Core i7-11800H, 17.30", 2.5 kg
External Review » MSI Creator 17 B11UH-241
Razer Blade 15 Advanced RZ09-0409CG53-R3G1: Intel Core i9-11900H, 15.60", 2 kg
External Review » Razer Blade 15 Advanced RZ09-0409CG53-R3G1
Razer Blade 17, i7-11800H RTX 3080: Intel Core i7-11800H, 17.30", 2.8 kg
External Review » Razer Blade 17, i7-11800H RTX 3080
Acer Predator Helios 500 PH517-52-NH.QCNEX.003: Intel Core i9-11980HK, 17.30", 3.9 kg
External Review » Acer Predator Helios 500 PH517-52-NH.QCNEX.003
Acer Predator Triton 500 PT516-51s-72JQ: Intel Core i7-11800H, 16.10", 2.5 kg
External Review » Acer Predator Triton 500 PT516-51s-72JQ
Aorus 17X YD: Intel Core i9-11980HK, 17.30", 3.8 kg
External Review » Aorus 17X YD
Razer Blade 15 Advanced (Mid 2021): Intel Core i7-11800H, 15.60", 2 kg
External Review » Razer Blade 15 Advanced Model Core i7-11800H
Acer Nitro 5 AN515-45-R9QH: AMD Ryzen 9 5900HX, 15.60", 2.3 kg
External Review » Acer Nitro 5 AN515-45-R9QH
Lenovo Legion 7 16ACHg6-82N6008FGE: AMD Ryzen 7 5800H, 16.00", 2.5 kg
External Review » Lenovo Legion 7 16ACHg6-82N6008FGE
MSI GS66 Stealth 11UH-471: Intel Core i7-11800H, 15.60", 2.1 kg
External Review » MSI GS66 Stealth 11UH-471
MSI GE76 Raider 11UH 4K i9 3080: Intel Core i9-11980HK, 17.30", 2.9 kg
External Review » MSI GE76 Raider 11UH 4K i9 3080
Lenovo Legion 7 16ITH6, 11980HK 3080: Intel Core i9-11980HK, 16.00", 2.5 kg
External Review » Lenovo Legion 7 16ITH6, 11980HK 3080
MSI GS76 Stealth 11UH: Intel Core i9-11900H, 17.30", 2.4 kg
External Review » MSI GS76 Stealth 11UH
MSI GE76 Raider 11UH-083: Intel Core i7-11800H, 17.30", 2.9 kg
External Review » MSI GE76 Raider 11UH-083
MSI GP66 Leopard 11UH-229RU: Intel Core i7-11800H, 15.60", 2.4 kg
External Review » MSI GP66 Leopard 11UH-229RU
Aorus 15G YC: Intel Core i7-10870H, 15.60", 2 kg
External Review » Aorus 15G YC
Alienware x17 RTX 3080 P48E: Intel Core i7-11800H, 17.30", 3.2 kg
External Review » Alienware x17 RTX 3080 P48E
Razer Blade 15 Advanced Model RZ09-0409CGC3-R3G1: Intel Core i7-11800H, 15.60", 2 kg
External Review » Razer Blade 15 Advanced Model RZ09-0409CGC3-R3G1
Acer Nitro 5 AN517-41-R7L9: AMD Ryzen 9 5900HX, 17.30", 2.7 kg
External Review » Acer Nitro 5 AN517-41-R7L9
MSI GE76 Raider 11UH-472US: Intel Core i9-11980HK, 17.30", 3 kg
External Review » MSI GE76 Raider 11UH
Acer Nitro 5 AN515-45-R2X0: AMD Ryzen 7 5800H, 15.60", 2.3 kg
External Review » Acer Nitro 5 AN515-45-R2X0
Acer Predator Triton 500 PT516-51s-9914: Intel Core i9-11900H, 16.10", 2.5 kg
External Review » Acer Predator Triton 500 PT516-51s-9914
Lenovo ThinkPad X1 Extreme G4-20Y50040GE: Intel Core i9-11950H, 16.00", 1.9 kg
External Review » Lenovo ThinkPad X1 Extreme G4-20Y50040GE
Acer Nitro 5 AN515-45-R715 : AMD Ryzen 9 5900HX, 15.60", 2.3 kg
External Review » Acer Nitro 5 AN515-45-R715
Gigabyte Aero 17 HDR YD: Intel Core i9-11980HK, 17.30", 2.8 kg
External Review » Gigabyte Aero 17 HDR YD
Asus ROG Strix Scar 17 G733QSA-KH222R: AMD Ryzen 9 5900HX, 17.30", 2.7 kg
External Review » Asus ROG Strix Scar 17 G733QSA-KH222R
Hyperbook GTR, i9-11900K RTX 3080: Intel Core i9-11900K, 17.30", 4.5 kg
External Review » Hyperbook GTR, i9-11900K RTX 3080
Razer Blade Pro 17 2021 (QHD Touch): Intel Core i7-10875H, 17.30", 3 kg
External Review » Razer Blade Pro 17 2021 Touch 4K, i7-10875H RTX 3080
Alienware m15 R4 RTX 3080: Intel Core i9-10980HK, 15.60", 2.4 kg
External Review » Alienware m15 R4 RTX 3080
Asus ROG Strix Scar 15 G533QS: AMD Ryzen 9 5900HX, 15.60", 2.3 kg
External Review » Asus ROG Strix Scar 15 G533QS
MSI GE76 Raider 11UH-082: Intel Core i9-11980HK, 17.30", 2.9 kg
External Review » MSI GE76 Raider 11UH-082
Asus Strix Scar 17 G733QSA-XS99: AMD Ryzen 9 5900HX, 17.30", 2.8 kg
External Review » Asus Strix Scar 17 G733QSA-XS99
Alienware x17 R1, i9-11900HK RTX 3080 FHD: Intel Core i9-11900K, 17.30", 3 kg
External Review » Alienware x17 R1, i9-11900HK RTX 3080 FHD
Aorus 15P YD: Intel Core i7-11800H, 15.60", 2.2 kg
External Review » Aorus 15P YD
Acer Predator Helios 500, i9-11980HK RTX 3080: Intel Core i9-11980HK, 17.30", 3.9 kg
External Review » Acer Predator Helios 500, i9-11980HK RTX 3080
Asus ROG Zephyrus S17 GX703HSD: Intel Core i9-11900H, 17.30", 2.8 kg
External Review » Asus ROG Zephyrus S17 GX703HSD
Razer Blade 14 Ryzen 9 RTX 3080: AMD Ryzen 9 5900HX, 14.00", 1.8 kg
External Review » Razer Blade 14 Ryzen 9 RTX 3080
Lenovo Legion 7 16ACHg6: AMD Ryzen 9 5900HX, 16.00", 2.5 kg
External Review » Lenovo Legion 7 16ACHg6
Razer Blade 15 Advanced Edition 2021 QHD, i7-10875H RTX 3080: Intel Core i7-10875H, 15.60", 2.2 kg
External Review » Razer Blade 15 Advanced Edition 2021 QHD, i7-10875H RTX 3080
Origin PC EON17-X 2021: Intel Core i9-11900K, 17.30", 3.8 kg
External Review » Origin PC EON17-X 2021
Aorus 17G YD: Intel Core i7-11800H, 17.30", 2.8 kg
External Review » Aorus 17G YD
Asus ROG Strix Scar 17 G733QS-K4016T: AMD Ryzen 9 5900HX, 17.30", 2.7 kg
External Review » Asus ROG Strix Scar 17 G733QS-K4016T
Asus ROG Strix Scar 17 G733QS-HG015T: AMD Ryzen 9 5900HX, 17.30", 2.7 kg
External Review » Asus ROG Strix Scar 17 G733QS-HG015T
Razer Blade 15 Advanced Edition 2021 FHD, i7-10875H RTX 3080: Intel Core i7-10875H, 15.60", 2.2 kg
External Review » Razer Blade 15 Advanced Edition 2021 FHD, i7-10875H RTX 3080
Asus Strix Scar 15 G533QS-DS76: AMD Ryzen 7 5800H, 15.60", 2.3 kg
External Review » Asus Strix Scar 15 G533QS-DS76
Asus Strix Scar 17 G733QS-HG026T: AMD Ryzen 9 5900HX, 17.30", 3 kg
External Review » Asus Strix Scar 17 G733QS-HG026T
MSI Creator 15 A10UH-427RU: Intel Core i7-10870H, 15.60", 2.1 kg
External Review » MSI Creator 15 A10UH-427RU
MSI GE76 Raider 10UH-061ES: Intel Core i7-10870H, 17.30", 2.9 kg
External Review » MSI GE76 Raider 10UH-061ES
Asus Strix Scar 17 G733QS-HG168T: AMD Ryzen 9 5900HX, 17.30", 2.7 kg
External Review » Asus Strix Scar 17 G733QS-HG168T
MSI GE76 Raider 10UH-200NL: Intel Core i9-10980HK, 17.30", 2.9 kg
External Review » MSI GE76 Raider 10UH-200NL
Alienware m17 R4: Intel Core i9-10980HK, 17.30", 3 kg
External Review » Alienware m17 R4
MSI GE66 Raider 10UH-062: Intel Core i7-10870H, 15.60", 2.4 kg
External Review » MSI GE66 Raider 10UH-062
MSI GE66 Raider 10UH: Intel Core i9-10980HK, 15.60", 2.4 kg
External Review » MSI GE66 Raider 10UH
Acer Nitro 5 AN515-45-R36S: AMD Ryzen 7 5800H, 15.60", 2.3 kg
External Review » Acer Nitro 5 AN515-45-R36S
MSI GS66 Stealth 10UH-010UK: Intel Core i7-10870H, 15.60", 2.1 kg
External Review » MSI GS66 Stealth 10UH-010UK
MSI GE76 Dragon Tiamat 10UH: Intel Core i9-10980HK, 17.30", 2.9 kg
External Review » MSI GE76 Dragon Tiamat 10UH
Lenovo Legion Slim 7 16ACHg6, 5900HX RTX 3080: AMD Ryzen 9 5900HX, 16.00", 2.5 kg
External Review » Lenovo Legion Slim 7 16ACHg6, 5900HX RTX 3080
MSI GE76 Raider 10UH-240IT: Intel Core i7-10870H, 17.30", 2.9 kg
External Review » MSI GE76 Raider 10UH-240IT
Gigabyte Aero 15 OLED YC: Intel Core i9-10980HK, 15.60", 2 kg
External Review » Gigabyte Aero 15 OLED YC
Aorus 17G YC: Intel Core i7-10870H, 17.30", 2.7 kg
External Review » Aorus 17G YC
Asus ROG Strix Scar 15 G533QS-HF192T: AMD Ryzen 9 5900HX, 15.60", 2.3 kg
External Review » Asus Strix Scar 15 G533QS
Asus Strix Scar 17 G733QS: AMD Ryzen 9 5900HX, 17.30", 2.7 kg
External Review » Asus Strix Scar 17 G733QS
Gigabyte Aero 17 HDR YC: Intel Core i9-10980HK, 17.30", 2.8 kg
External Review » Gigabyte Aero 17 HDR YC
Asus ROG Zephyrus Duo 15 SE GX551QS: AMD Ryzen 9 5900HX, 15.60", 2.5 kg
External Review » Asus ROG Zephyrus Duo 15 SE GX551QS
Asus ROG Zephyrus G15 GA503Q: AMD Ryzen 9 5900HS, 15.60", 2 kg
External Review » Asus ROG Zephyrus G15 GA503Q
MSI GE76 Raider 10UH: Intel Core i7-10870H, 17.30", 3 kg
External Review » MSI GE76 Raider 10UH
MSI GS66 Stealth 10UH: Intel Core i9-10980HK, 15.60", 2.1 kg
External Review » MSI GS66 Stealth 10UH
Asus ROG Zephyrus G15 GA503QS: AMD Ryzen 9 5900HS, 15.60", 1.9 kg
External Review » Asus Zephyrus G15 GA503QS
Lenovo ThinkPad T15g G2-20YS002CUS: Intel Core i7-11850H, 15.60", 2.9 kg
» Lenovo ThinkPad T15g laptop with RTX 3080, 4K display and 32GB RAM is 60% off today
Asus ROG Strix Scar 15 G533QS: AMD Ryzen 9 5900HX, 15.60", 2.3 kg
» Asus ROG Strix Scar 15 with Ryzen 9 5900HX and GeForce RTX 3080 hits lowest price in 30 days on Amazon thanks to a 25% discount
» Asus ROG Strix Scar 15 gaming laptop with RTX 3080 gets hefty 34% discount
Razer Blade 14 Ryzen 9 RTX 3080: AMD Ryzen 9 5900HX, 14.00", 1.8 kg
» Razer Blade 14 gaming laptop with RTX 3080 gets 35% price cut
Schenker XMG Pro 15 (Late 2021): Intel Core i7-11800H, 15.60", 2 kg
» Schenker XMG Pro 15: 2-kg gaming laptop with 4K OLED screen and Thunderbolt 4
Schenker XMG Pro 17 (Late 2021, RTX 3080): Intel Core i7-11800H, 17.30", 2.4 kg
» Manufacturers increasingly try to attract gamers and professionals at the same time - Schenker XMG Pro 17 (Clevo PC70HS) review
Alienware m15 R6, i7-11800H RTX 3080: Intel Core i7-11800H, 15.60", 2.5 kg
» Alienware m15 R6 test - Slower 3D performance than the predecessor?
Alienware x17 RTX 3080 P48E: Intel Core i7-11800H, 17.30", 3.2 kg
» Essential BIOS 1.3.0 update for Alienware x15 and x17 owners now available to boost performance and enable hybrid graphics switching
Maingear Vector Pro MG-VCP17: Intel Core i7-11800H, 17.30", 2.3 kg
» Maingear Vector Pro is a full 1.5 pounds lighter than the Razer Blade Pro and with nearly identical performance
MSI GE76 Raider 11UH-472US: Intel Core i9-11980HK, 17.30", 3 kg
» MSI GE76 Raider 11UH: Gaming laptop receives subtle improvements
Gigabyte Aero 17 HDR YD: Intel Core i9-11980HK, 17.30", 2.8 kg
» Gigabyte Aero 15 OLED XD: Flagship for creators and gamers
Medion Erazer Beast X25: AMD Ryzen 9 5900HX, 17.30", 2.3 kg
» Medion Erazer Beast X25: Priced quite attractively for an RTX 3080 laptop
Asus ROG Strix Scar 15 G533QS: AMD Ryzen 9 5900HX, 15.60", 2.3 kg
» Asus ROG Strix Scar 15 G533 ships with a smaller 240 W AC adapter compared to the 280 W adapter for the G532 series
Asus ROG Zephyrus S17 GX703HSD: Intel Core i9-11900H, 17.30", 2.8 kg
» RTX 3080 Asus ROG Zephyrus S17 gaming laptop reviewed: The case opens a gap for more fresh air
Aorus 17G YD: Intel Core i7-11800H, 17.30", 2.8 kg
» Aorus 17G YD: Gigabyte only provides the GeForce RTX 3080 GPU with a 105-watt TGP
Aorus 15P YD: Intel Core i7-11800H, 15.60", 2.2 kg
» Gigabyte Aorus 15P YD: 130-watt RTX 3080 meets octa-core Tiger Lake CPU
Lenovo Legion 7 16ACHg6: AMD Ryzen 9 5900HX, 16.00", 2.5 kg
» The Lenovo Legion 7 16ACH offers automatic CPU and GPU overclocking
Gigabyte Aero 17 HDR YD: Intel Core i9-11980HK, 17.30", 2.8 kg
» Gigabyte Aero 17 HDR YD: Even more performance with Tiger Lake
Razer Blade 15 Advanced Model Early 2021: Intel Core i7-10875H, 15.60", 2 kg
» Blade 15 Advanced: RTX 3080 (TGP: 95 W) beats RTX 2080 Super Max-Q (TGP: 95 W)
Alienware m17 R4: Intel Core i9-10980HK, 17.30", 3 kg
» The new Alienware m17 R4 suffers under its fast hardware
MSI GE76 Raider 10UH: Intel Core i7-10870H, 17.30", 3 kg
» We absolutely love this small detail about the MSI GE76 that was quietly improved over the GE75
» Here are all the slowest and fastest GeForce RTX 3080 laptops you can buy right now
Schenker XMG Pro 15 (Early 2021, RTX 3080): Intel Core i7-10870H, 15.60", 2 kg
» Sensible or not? Ultra-thin Case with RTX 3080 like in the Schenker XMG Pro 15 (Clevo PC50DS)
Razer Blade Pro 17 2021 (QHD Touch): Intel Core i7-10875H, 17.30", 3 kg
» This is why Nvidia TGP is important: Some GeForce RTX 3070 laptops are already outperforming the RTX 3080
Asus ROG Zephyrus Duo 15 SE GX551QS: AMD Ryzen 9 5900HX, 15.60", 2.5 kg
» Asus clarifies that confusing warning label on the Zephyrus Duo 15 about battery charging
Asus ROG Zephyrus G15 GA503Q: AMD Ryzen 9 5900HS, 15.60", 2 kg
» Sexy Beast: Asus ROG Zephyrus G15
Gigabyte Aero 17 HDR YC: Intel Core i9-10980HK, 17.30", 2.8 kg
» Gigabyte Aero 17 HDR YC: Great display for creative minds
Alienware m15 R4 RTX 3080: Intel Core i9-10980HK, 15.60", 2.4 kg
» Does a gaming laptop need good battery life? Dell doesn't think so, judging by the Alienware m15 R4
Asus Strix Scar 17 G733QSA-XS99: AMD Ryzen 9 5900HX, 17.30", 2.8 kg
» No other manufacturer is embracing mobile AMD Ryzen as fast or as hard as Asus