Nvidia Titan X Pascal Review - The Fastest Consumer GPU Available Fast, faster, fastest. Two months after the launch of the Nvidia GeForce GTX 1080 Founder's Edition, the Nvidia Titan X was introduced to the public on 8th of August 2016. The new Titan X is based on the Pascal architecture, which has significantly improved the performance of the smaller variants. 1024 shader units more than the GeForce GTX 1080, 12 GB GDDR5X VRAM, and a wider memory interface raise hope for outstanding performance. In our review, you will find out how well the higher performance potential can be used and whether there are also points of criticism.
Sebastian Bade
, ✓ Stefanie Voigt ,
Published 10/07/2016 🇩🇪 🇨🇳 ...
🇳🇱 🇪🇸 🇮🇹
For the original German review, see here .
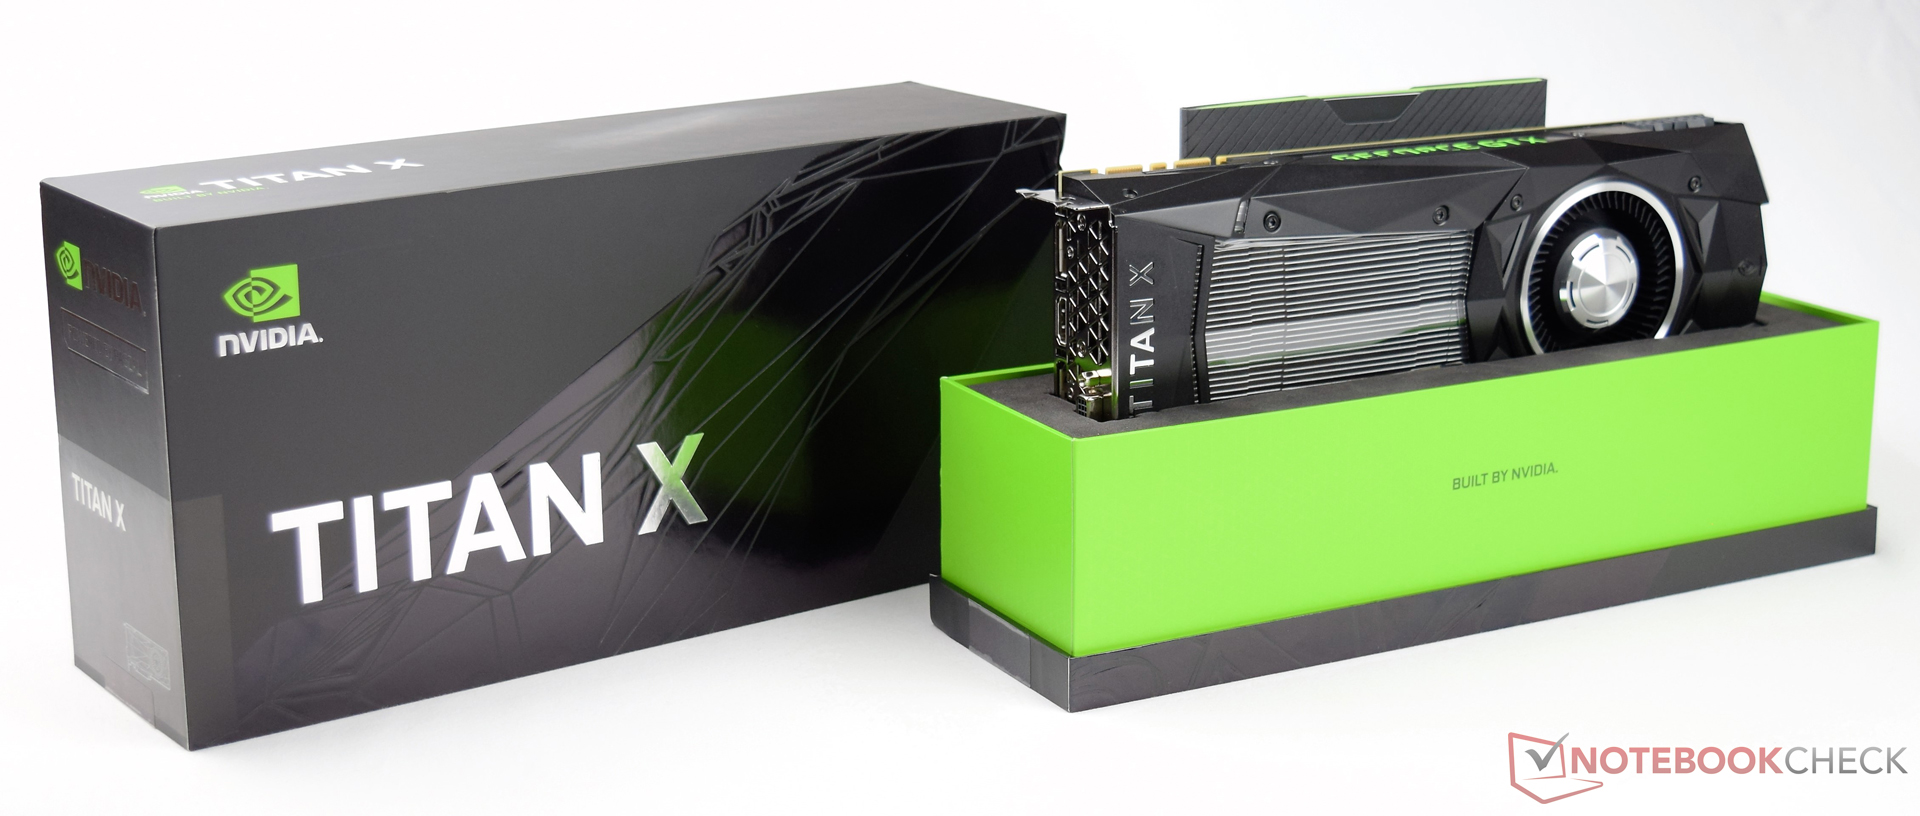
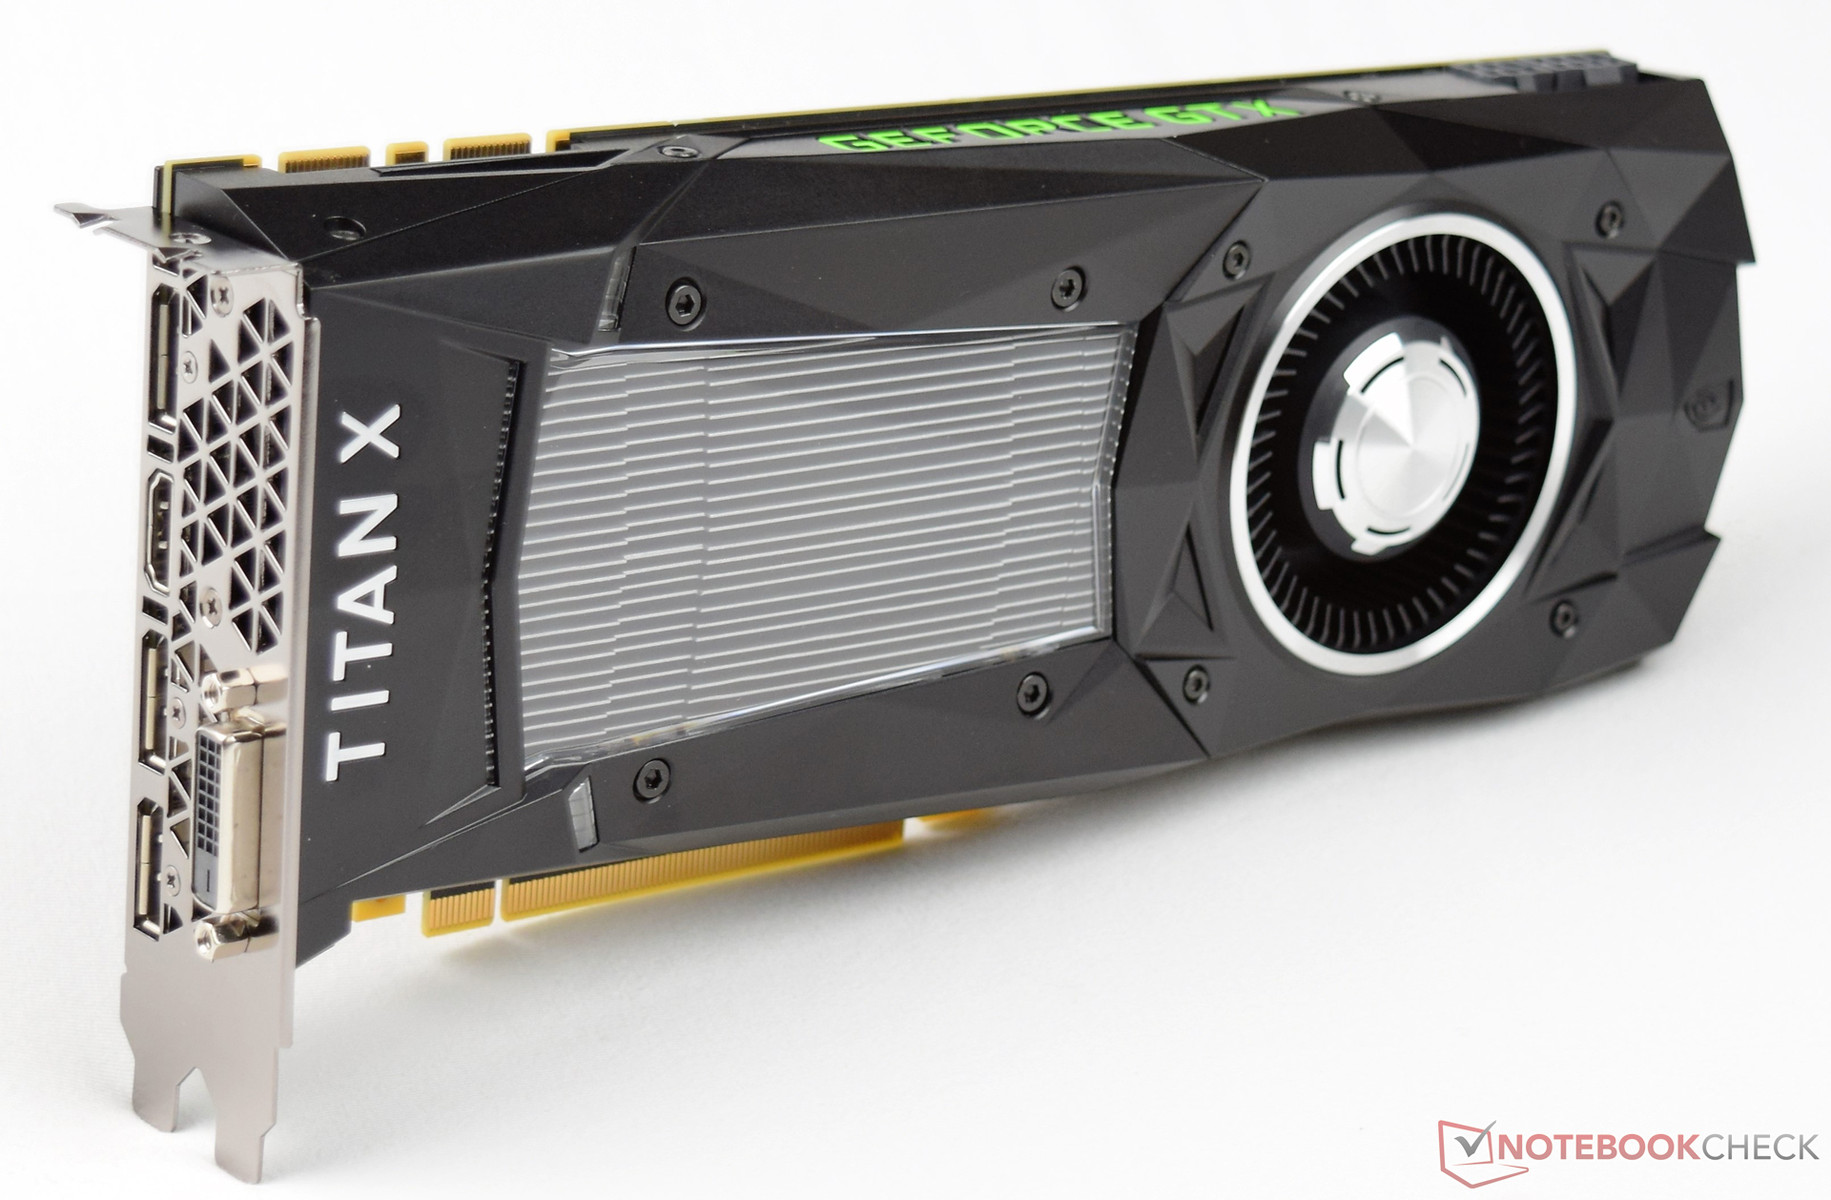
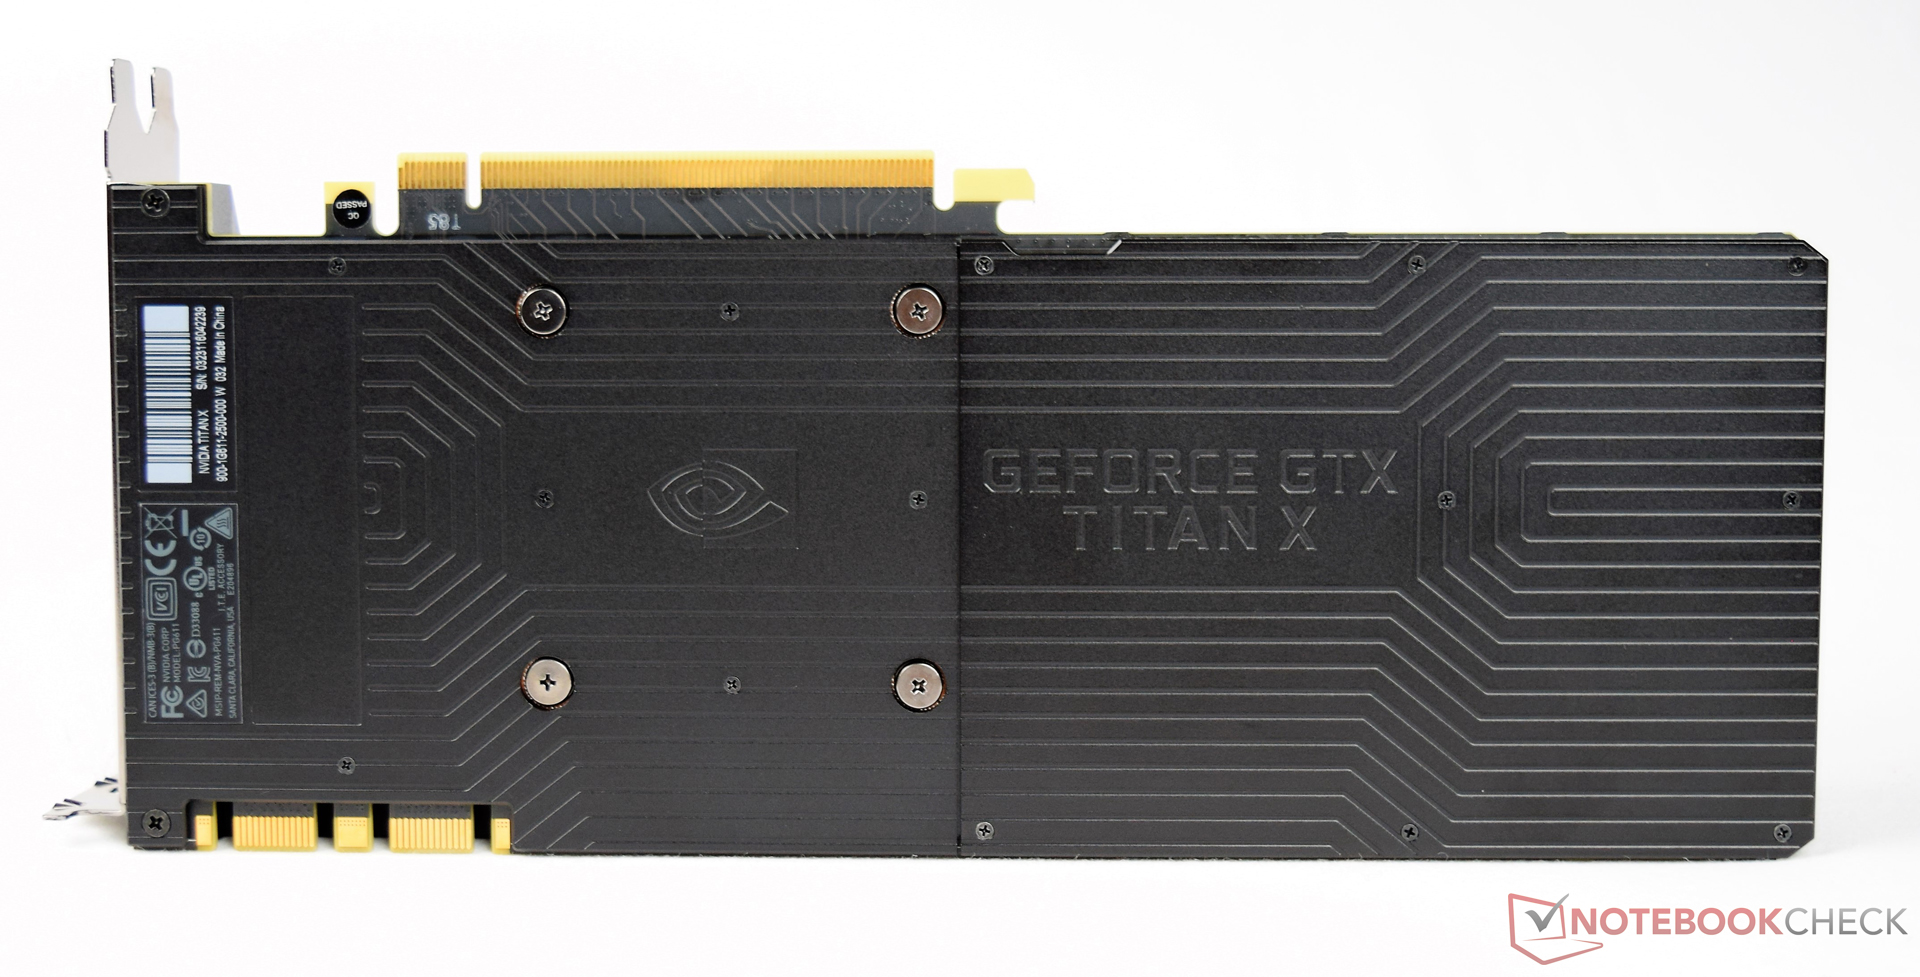
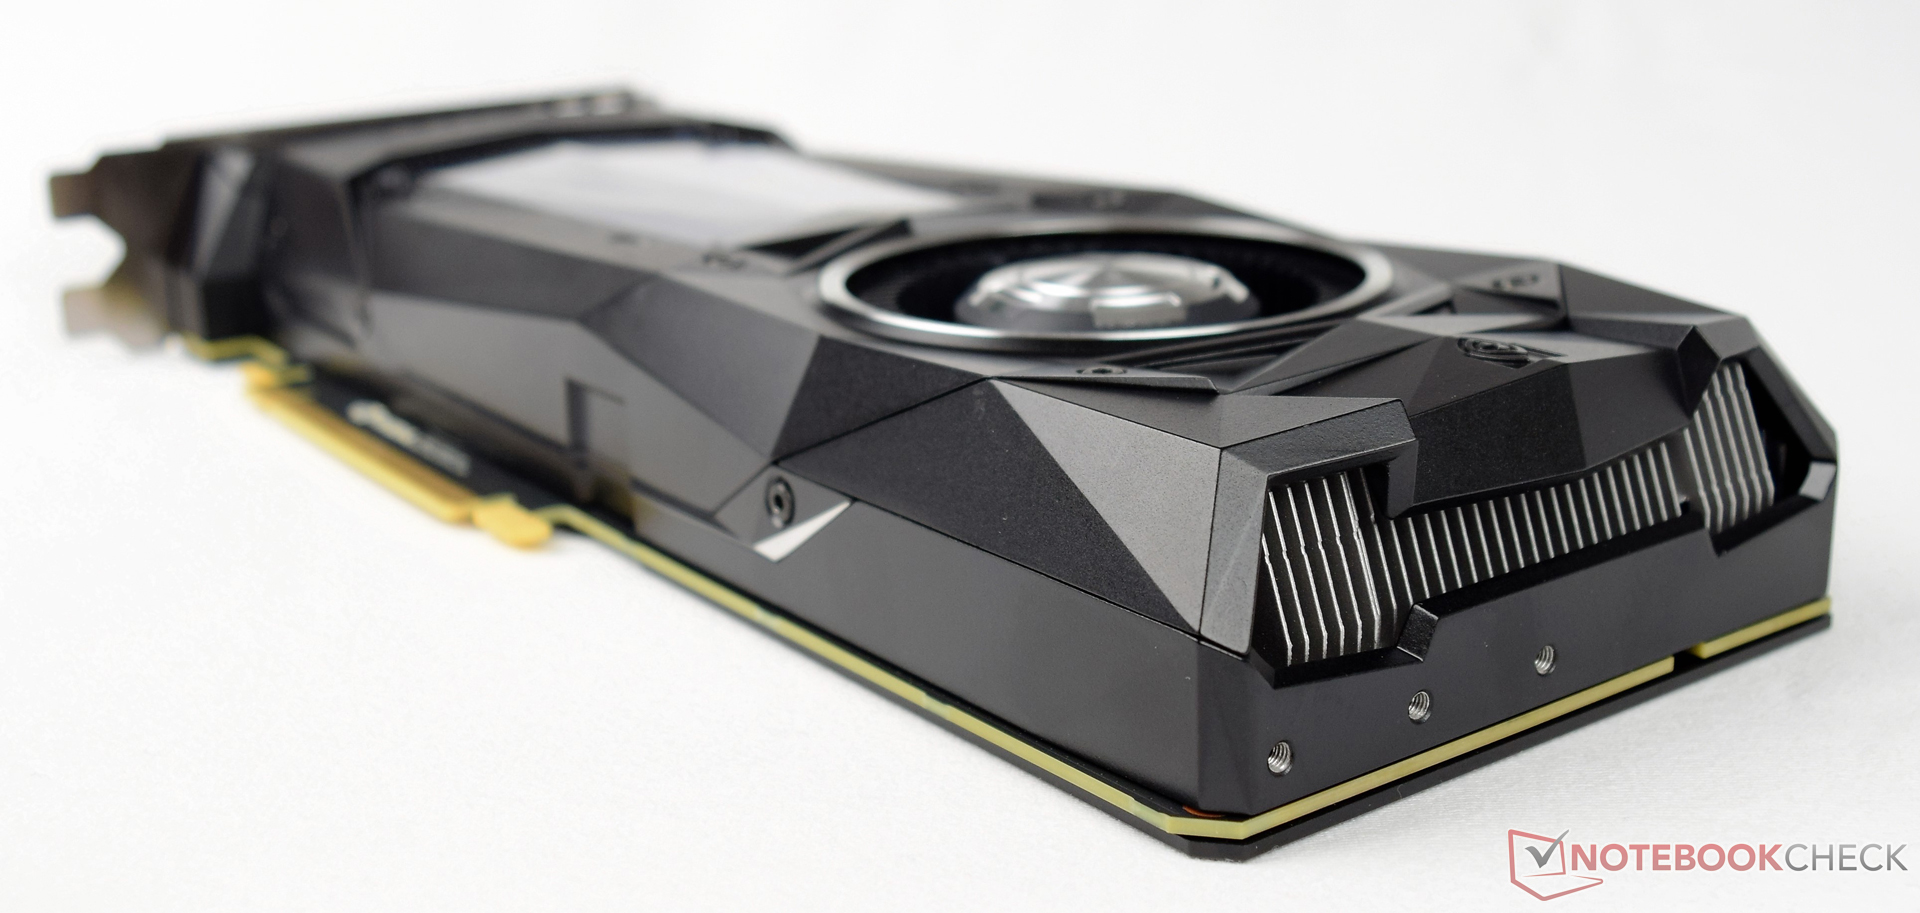
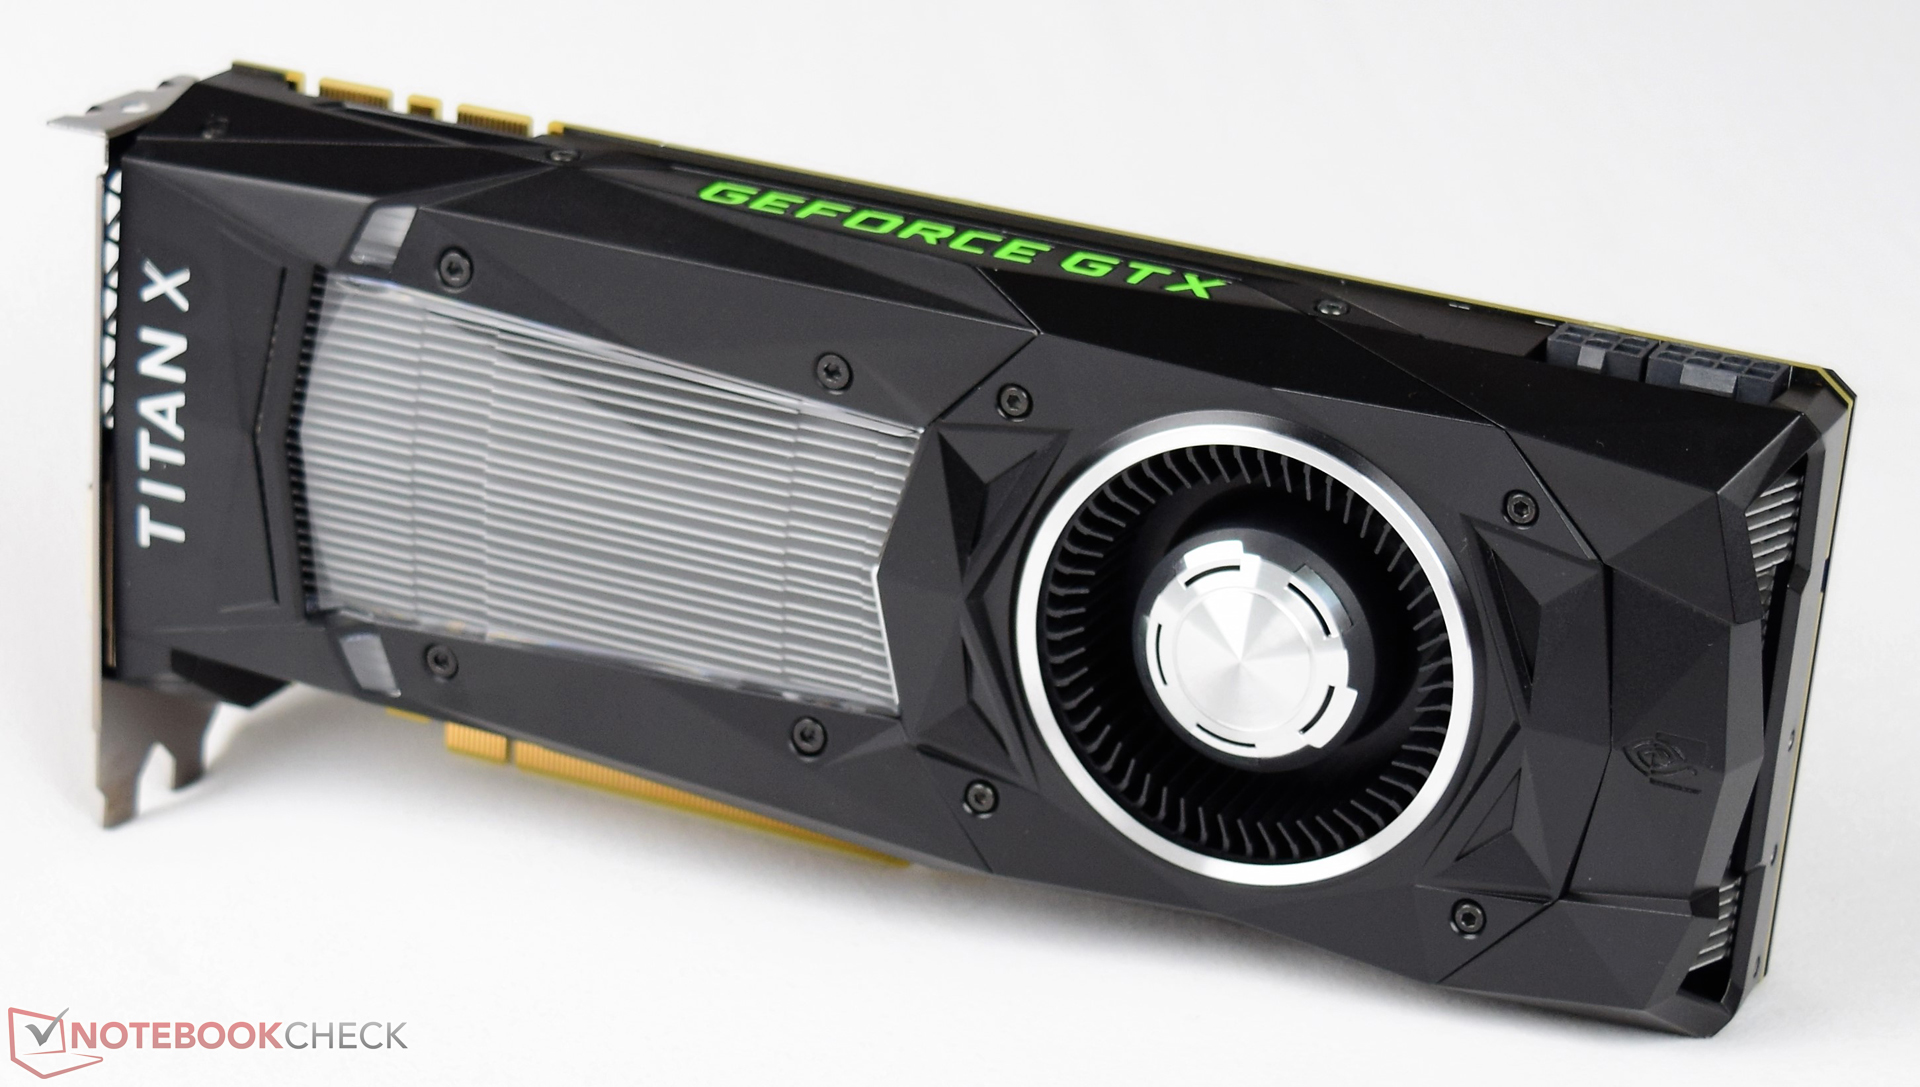
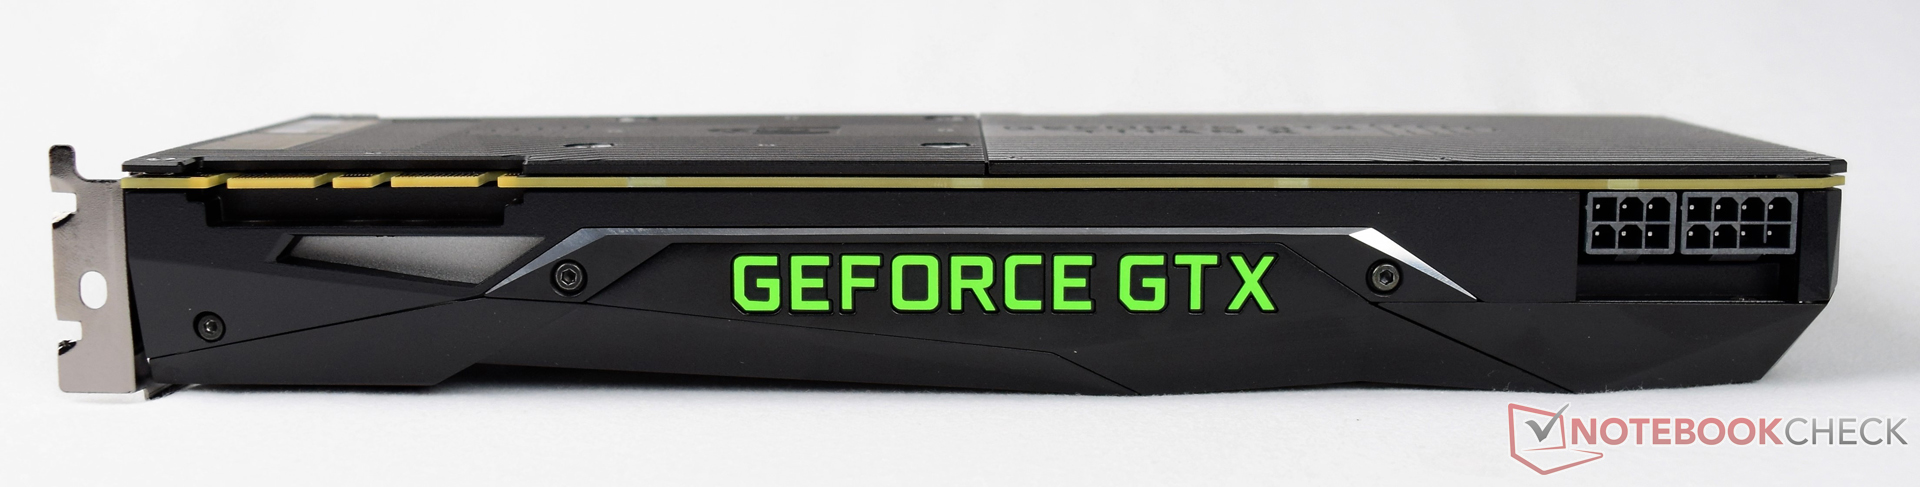
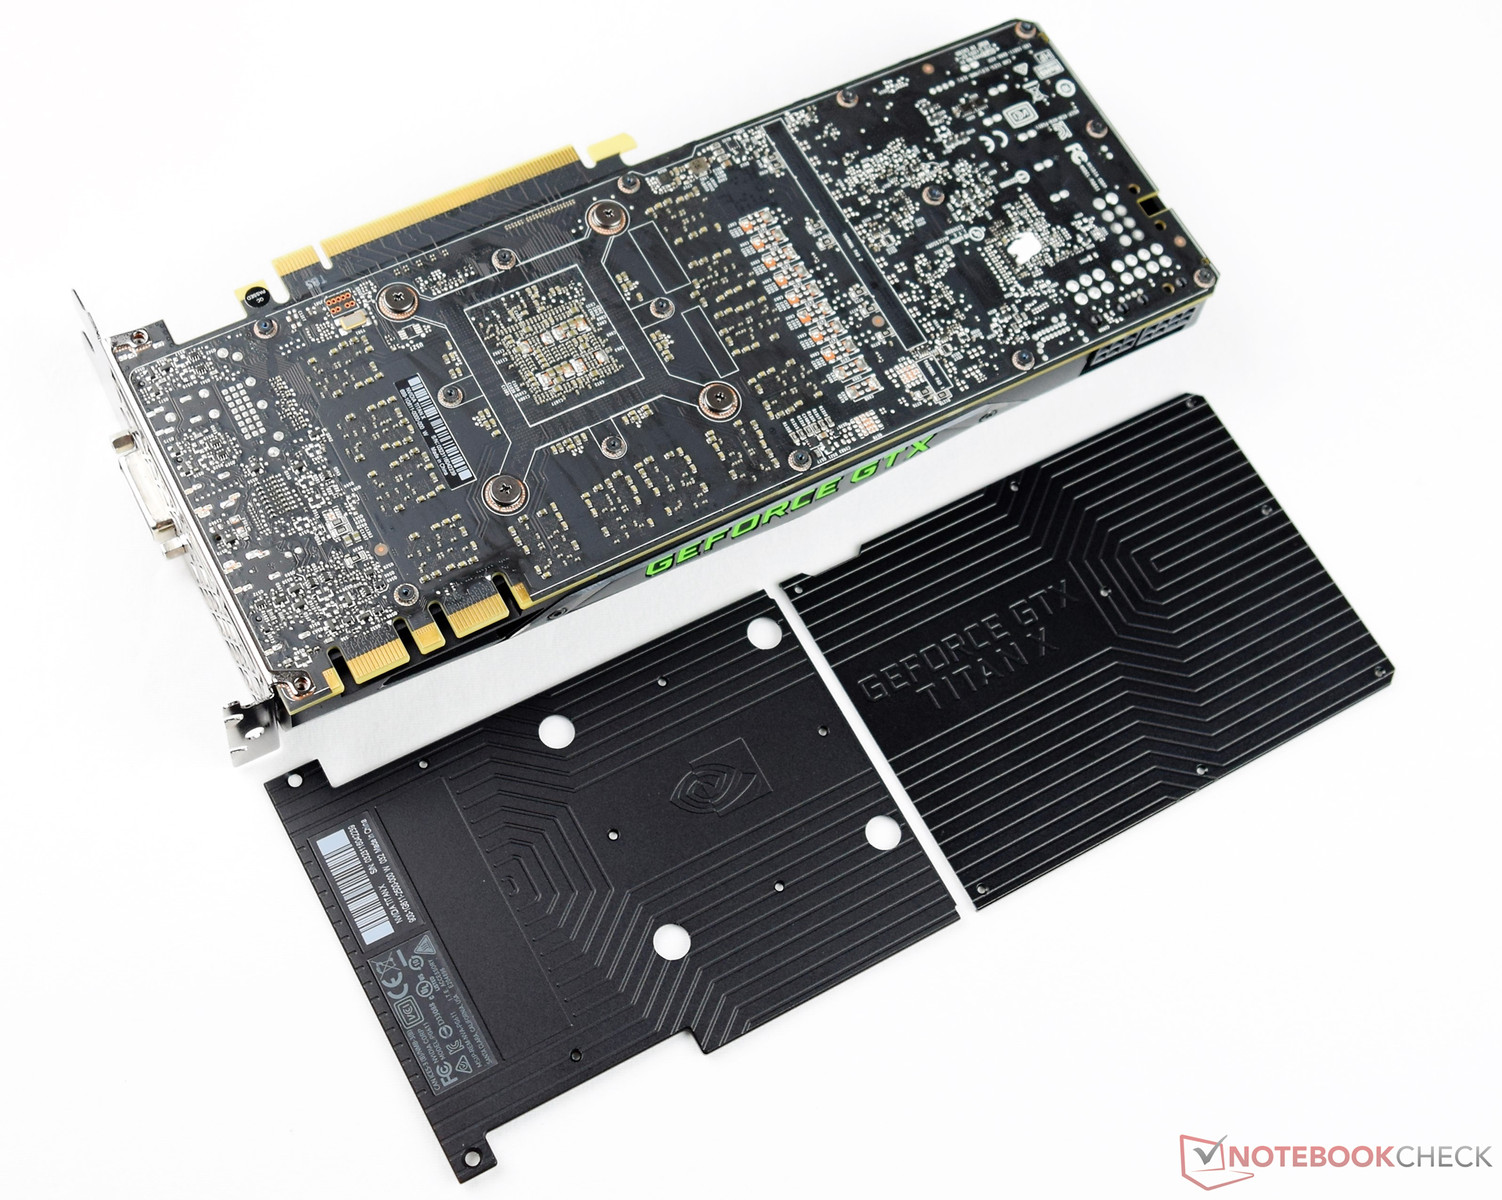
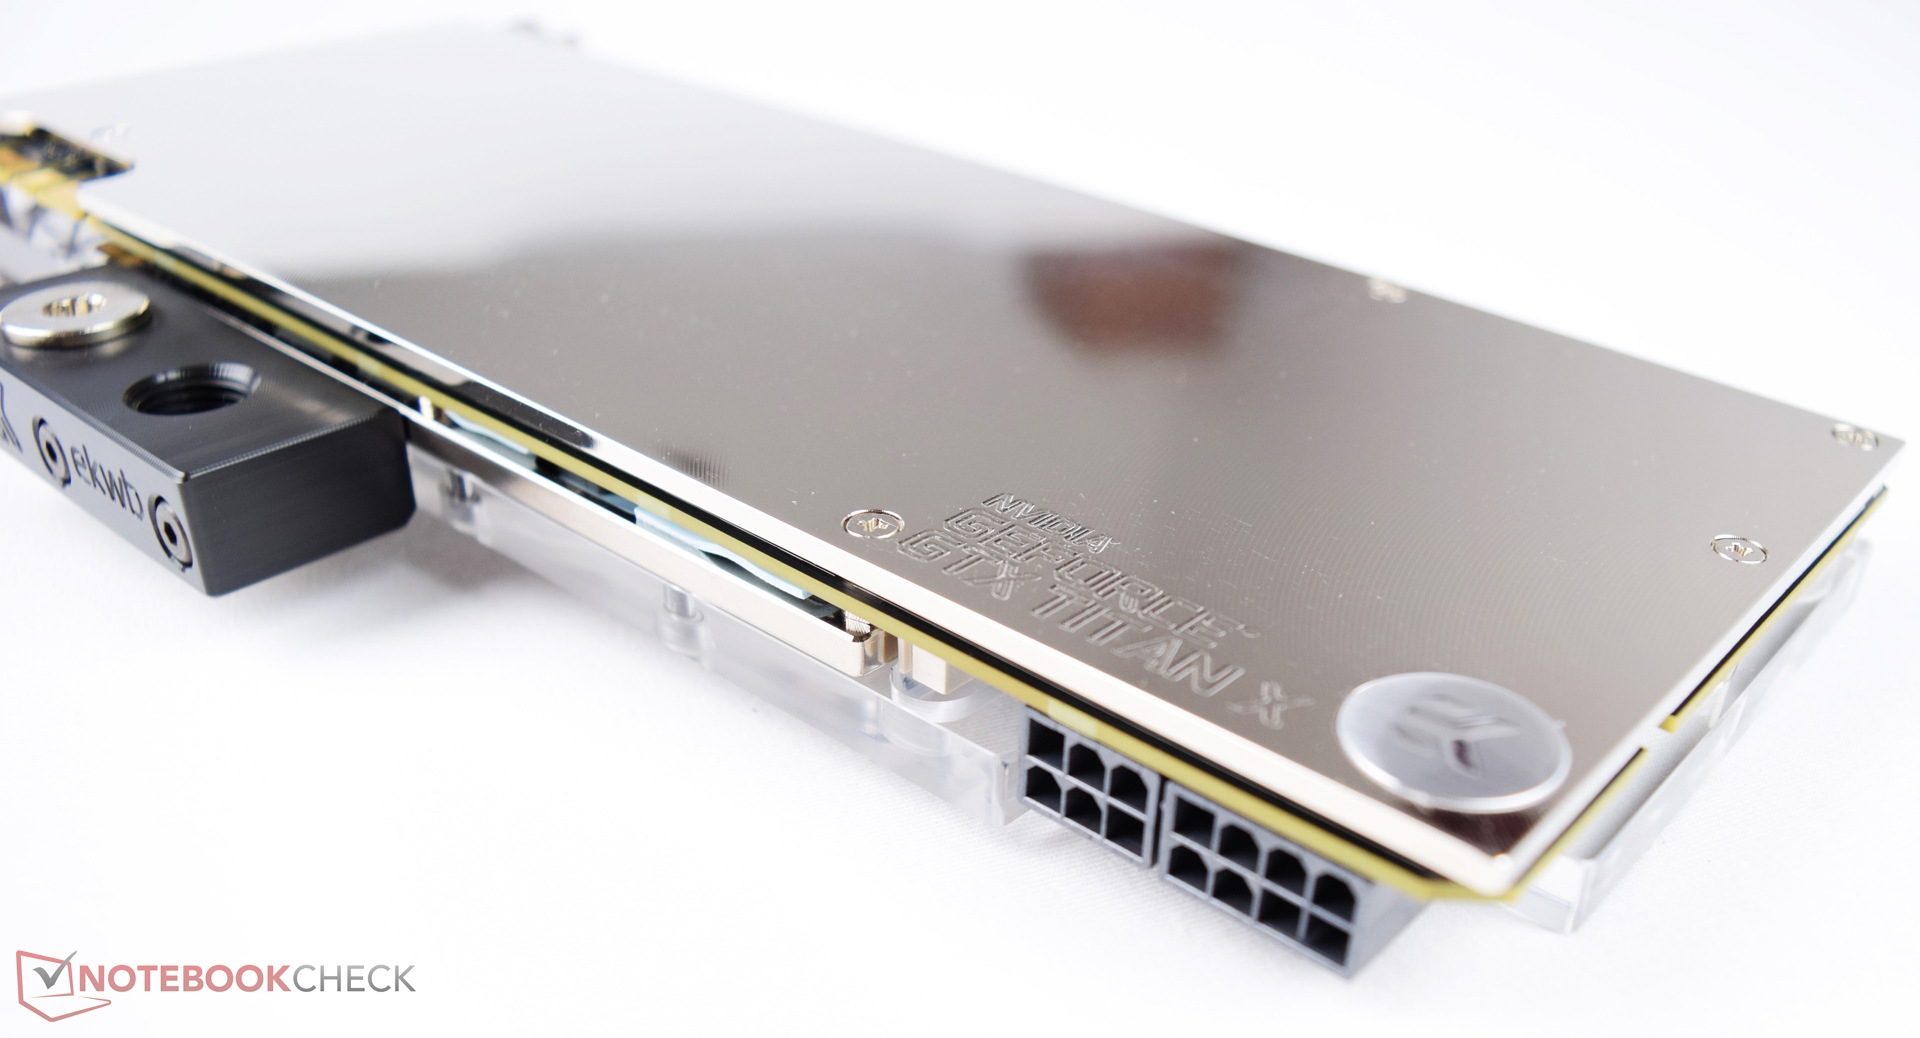
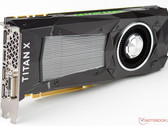
The Nvidia Titan X can be bought only via the Nvidia web store. Thus, there will not be any custom designs or cards from other manufacturers. It looks significantly different compared to Nvidia GeForce GTX 1080 Founder's Edition . The cooler, which appears to be top-quality, is entirely black. In addition to a 6-pin power-in, it features an 8-pin one in order to supply the graphics card with sufficient energy. The label of the cooler (TITAN X) hints at the top model again. On the side, there is a striking "GEFORCE GTX" logo, which glows green when it is on. We do not fully understand why Nvidia uses this logo in the Titan X, since the Titan X is not officially listed as GeForce GTX graphics card in the portfolio.
This feature is indeed an eye catcher and a gimmick. However, those who buy a graphics card of this price category might want you to see even from a distance that it is not just a conventional "GeForce GTX" graphics card.
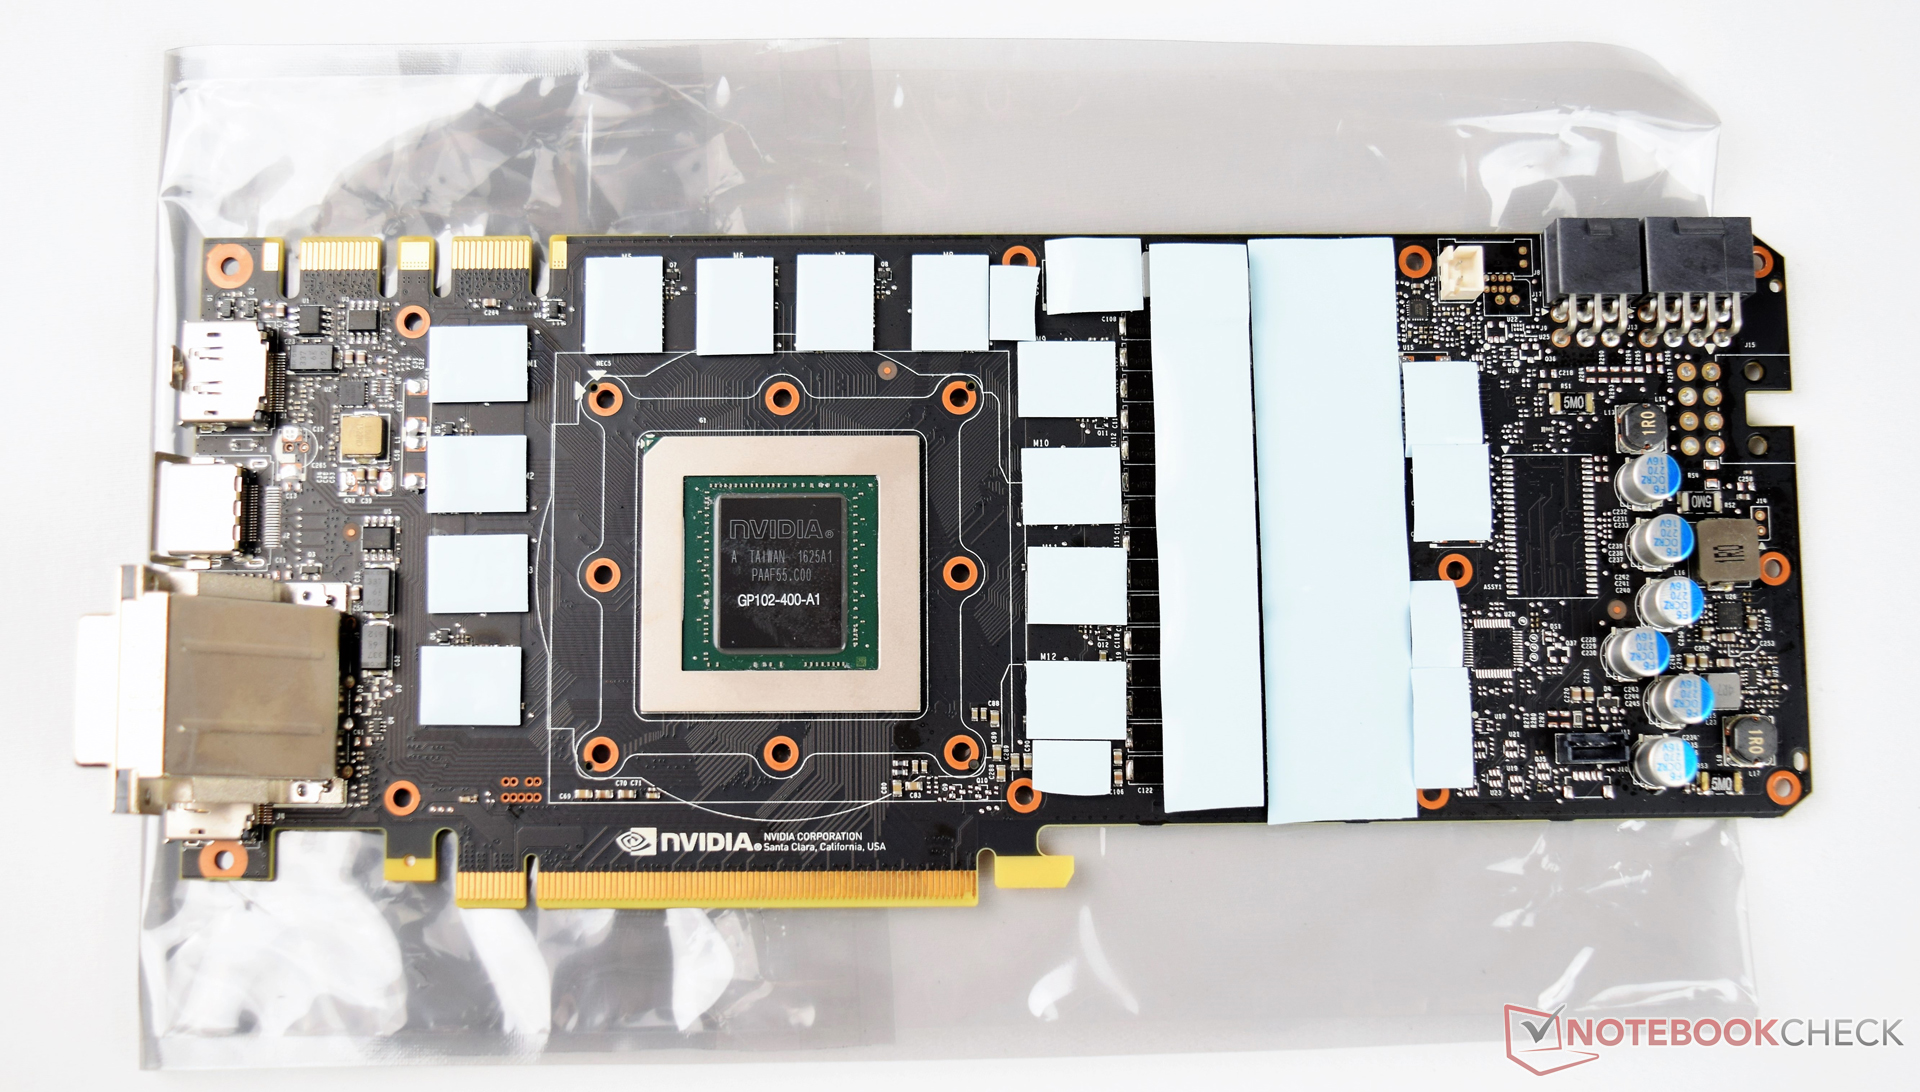
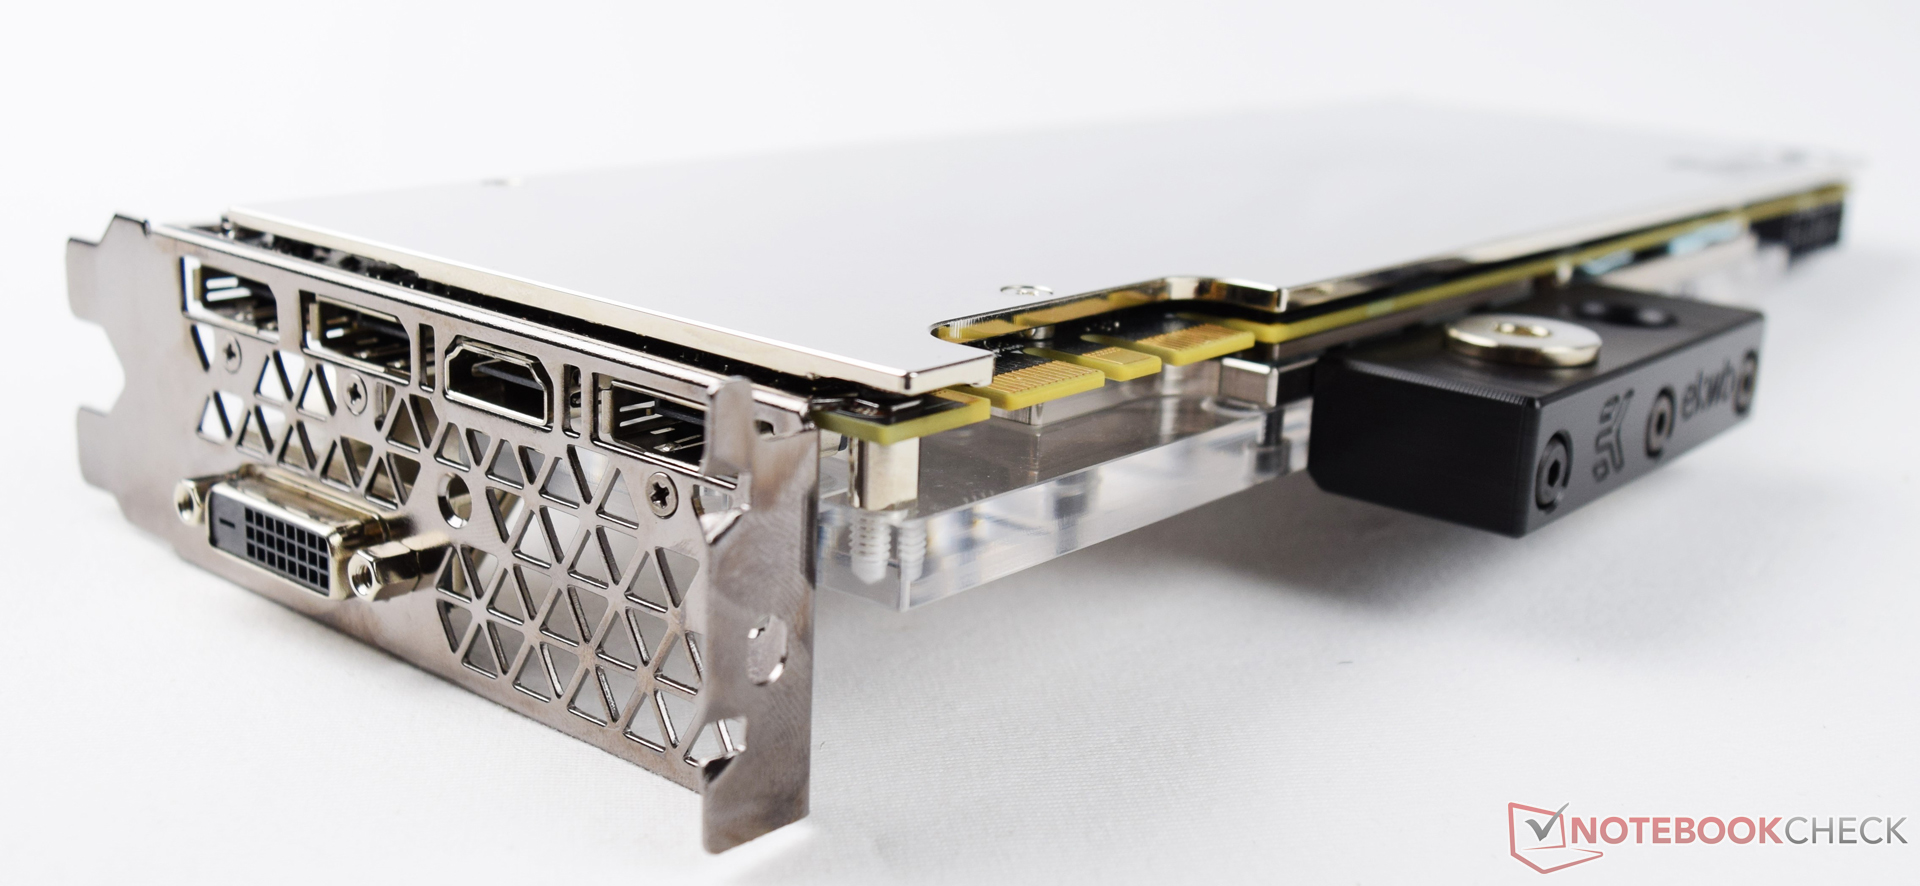
The available interfaces are identical to the Nvidia GeForce GTX 1080 Founder's Edition 's. Hence, the Nvidia Titan X also features Dual-Link-DVI, an HDMI 2.0 port as well as three Display-Port-1.4 ports. An SLI interface allows combining two of the graphic cards for further increasing the performance.
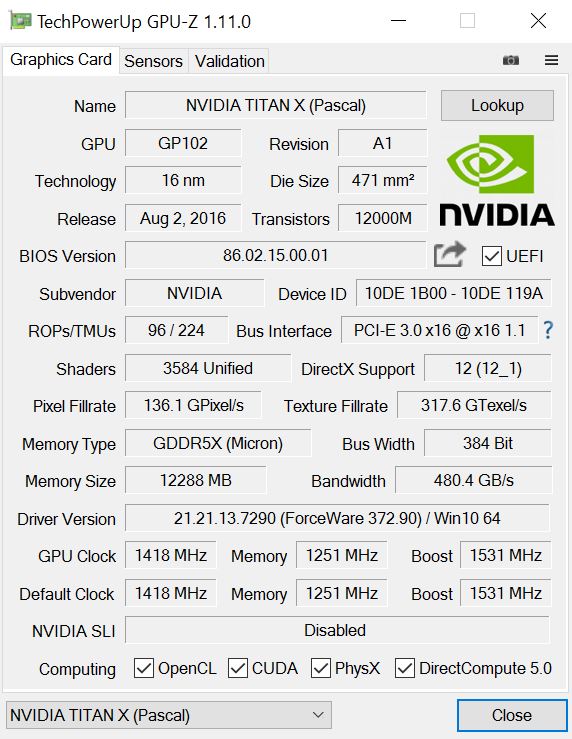
Codename GP102 Architecture Pascal Pipelines 3584 - unified Core Speed 1418 - 1531 (Boost) MHz Memory Speed 10000 MHz Memory Bus Width 384 Bit Memory Type GDDR5X Max. Amount of Memory 12 GB Shared Memory no API DirectX 12_1, OpenGL 4.5 / Vulkan Power Consumption 250 Watt Transistor Count 12 Billion technology 16 nm Features DP 1.4, HDMI 2.0b, HDCP 2.2, CUDA, PCIe 3.0, GPU Boost 3.0, G-SYNC Date of Announcement 25.07.2016
v1.26
log 27. 18:45:10
#0 no ids found in url (should be separated by "_") +0s ... 0s
#1 not redirecting to Ajax server +0s ... 0s
#2 did not recreate cache, as it is less than 5 days old! Created at Thu, 25 Apr 2024 05:40:10 +0200 +0.001s ... 0.001s
#3 start showIntegratedCPUs +0.033s ... 0.034s
#4 return log +0.012s ... 0.046s
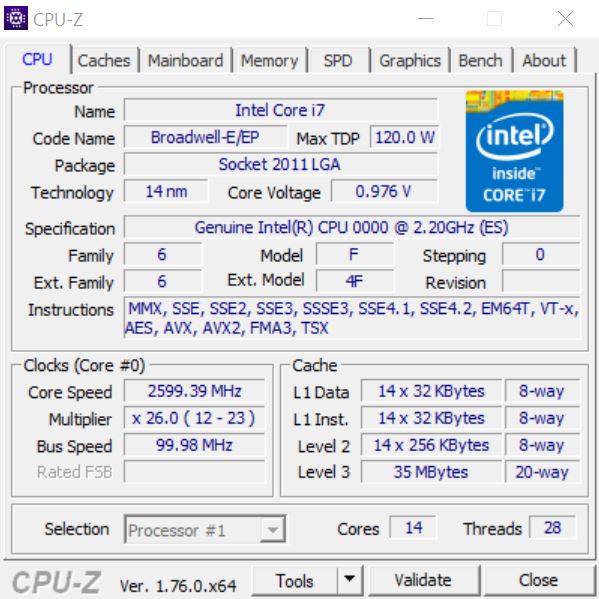
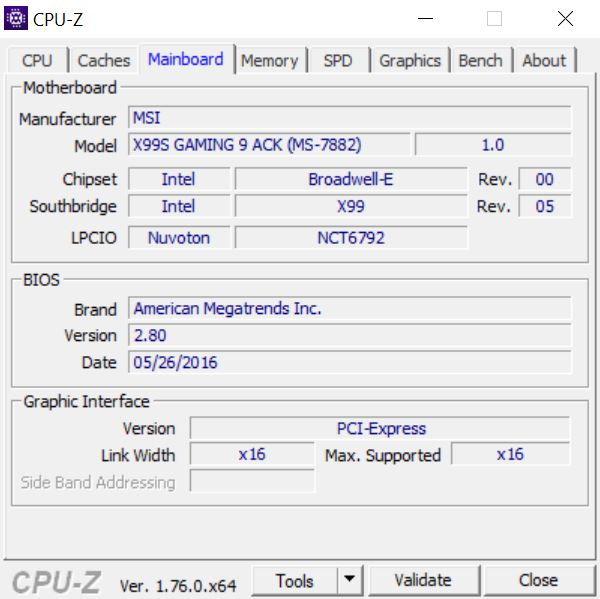
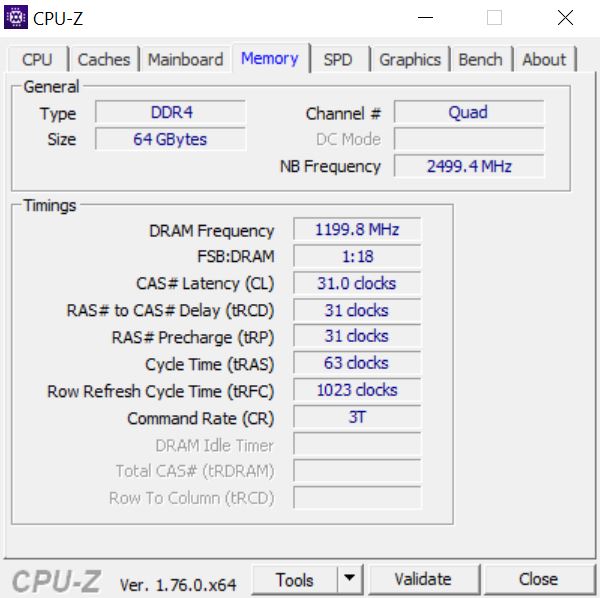
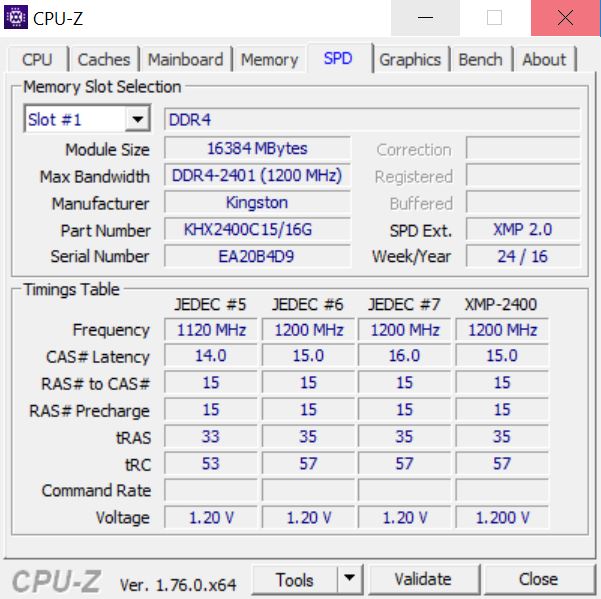
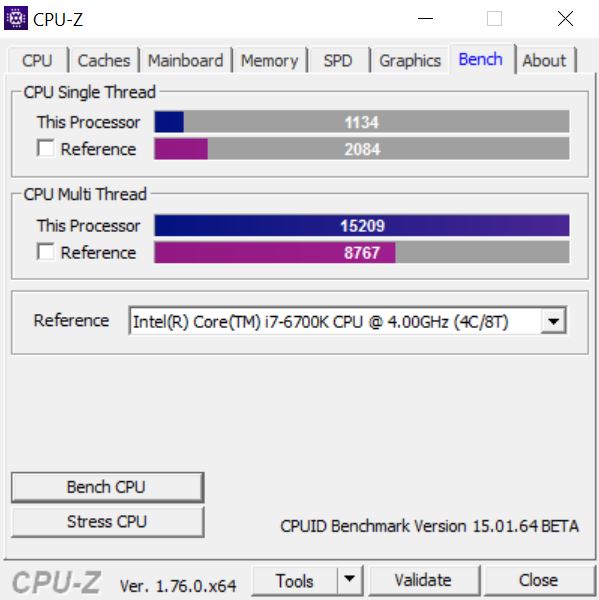
Intel Xeon E5 2680v4 (not overclocked), 64 GB DDR4 2400 MHz, MSI Gaming 9 ACK (MS-7882), Acer Predator XB321HK 4K display, Samsung SM951 M.2 SSD (512 GB, system + benchmarks), Microsoft Windows 10 64-Bit
Admittedly, the used system is rather special. The performance of the processor is on par with the Intel Core i7-6950X in applications with multi-core support. However, the Intel Xeon E5 2680v4 gives in to the higher clocked Intel Core i7-6950X and other higher-clocked, modern processors in single thread performance.
During further testing, the Nvidia Titan X was embedded in an existing liquid cooling circuit. An Aquastream XT Ultra was used as a pump and heat is dissipated through a 480mm radiator from Phobya (Phobya G-Changer 480 V.2 - Full Copper).
Legend
Core i7-3960x, Radeon HD 6450 Intel Core i7-3960X, AMD Radeon HD 6450 GDDR5,
Eurocom Panther 5D Intel Xeon E5-2697 v2, NVIDIA Quadro K5100M, Crucial M500 120 GB CT120M500SSD3
Asus G752VS-XB78K Intel Core i7-6820HK, NVIDIA GeForce GTX 1070 Mobile, Toshiba NVMe THNSN5512GPU7
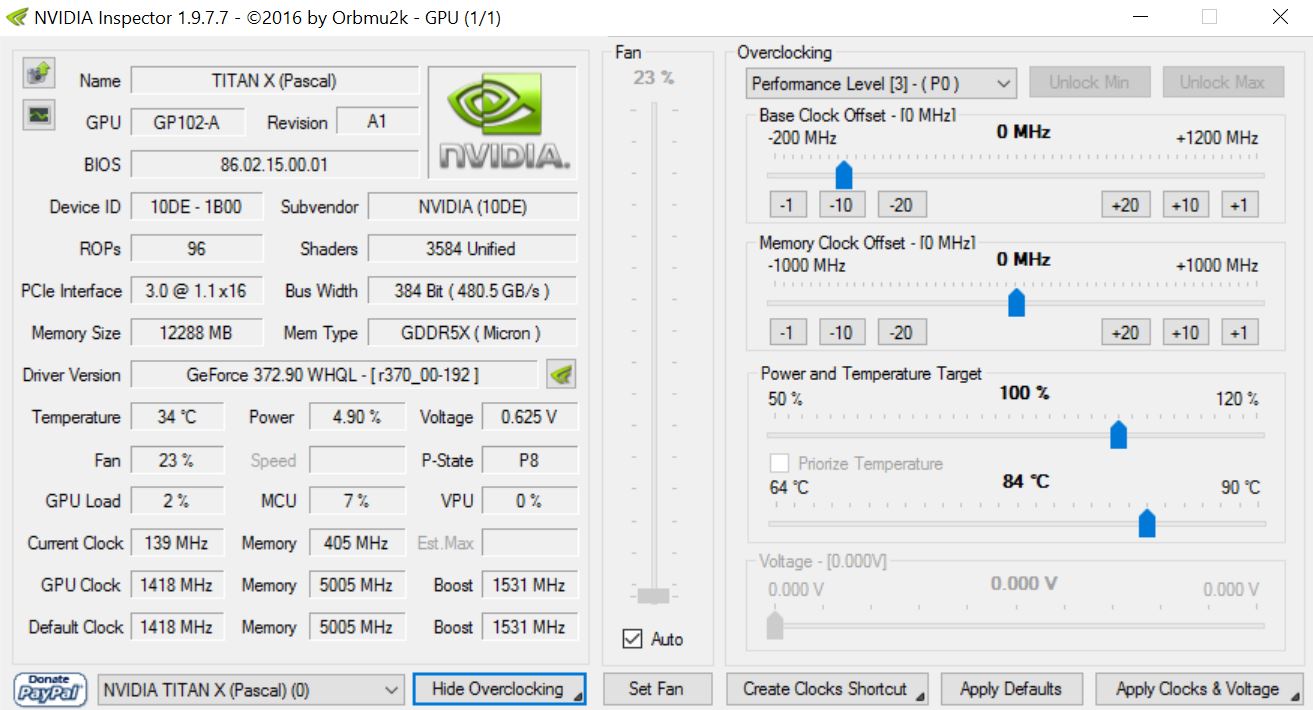
By default, the Nvidia Titan X clocks at 1418 MHz and guarantees a Turbo clock of 1531 MHz. We have recorded a maximum GPU clock rate of 1835 MHz in the GPU-Z render test. The system could keep this frequency throughout the test without any drops. In gaming, the Nvidia Titan X frequently clocked at significantly above 1600 MHz (1600 MHz to 1800 MHz). The "Temperature Target" of the Nvidia Titan X is 84 °C (~183 °F) out-of-the-box. If this is exceeded, the GPU begins to throttle the performance. We will explain this in detail in the stress test section.
MSI Afterburner NVIDIA Inspector
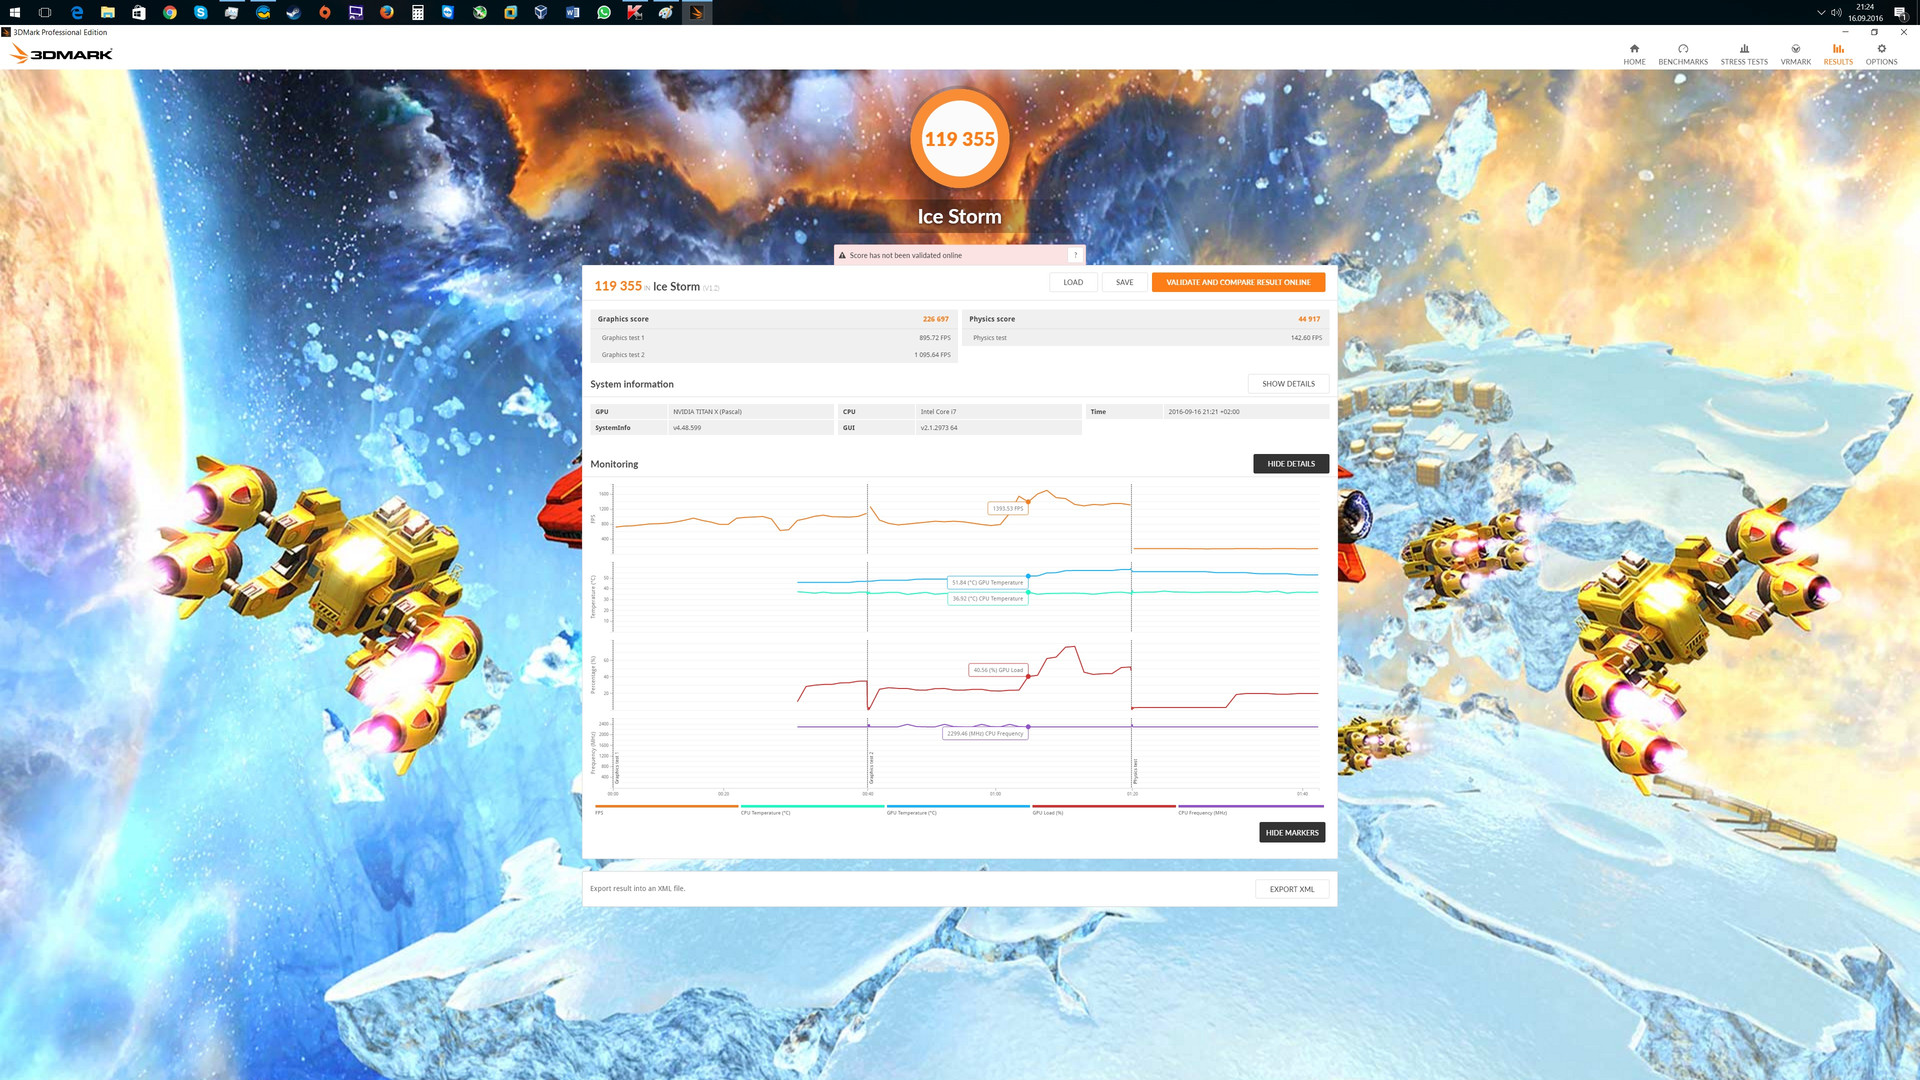
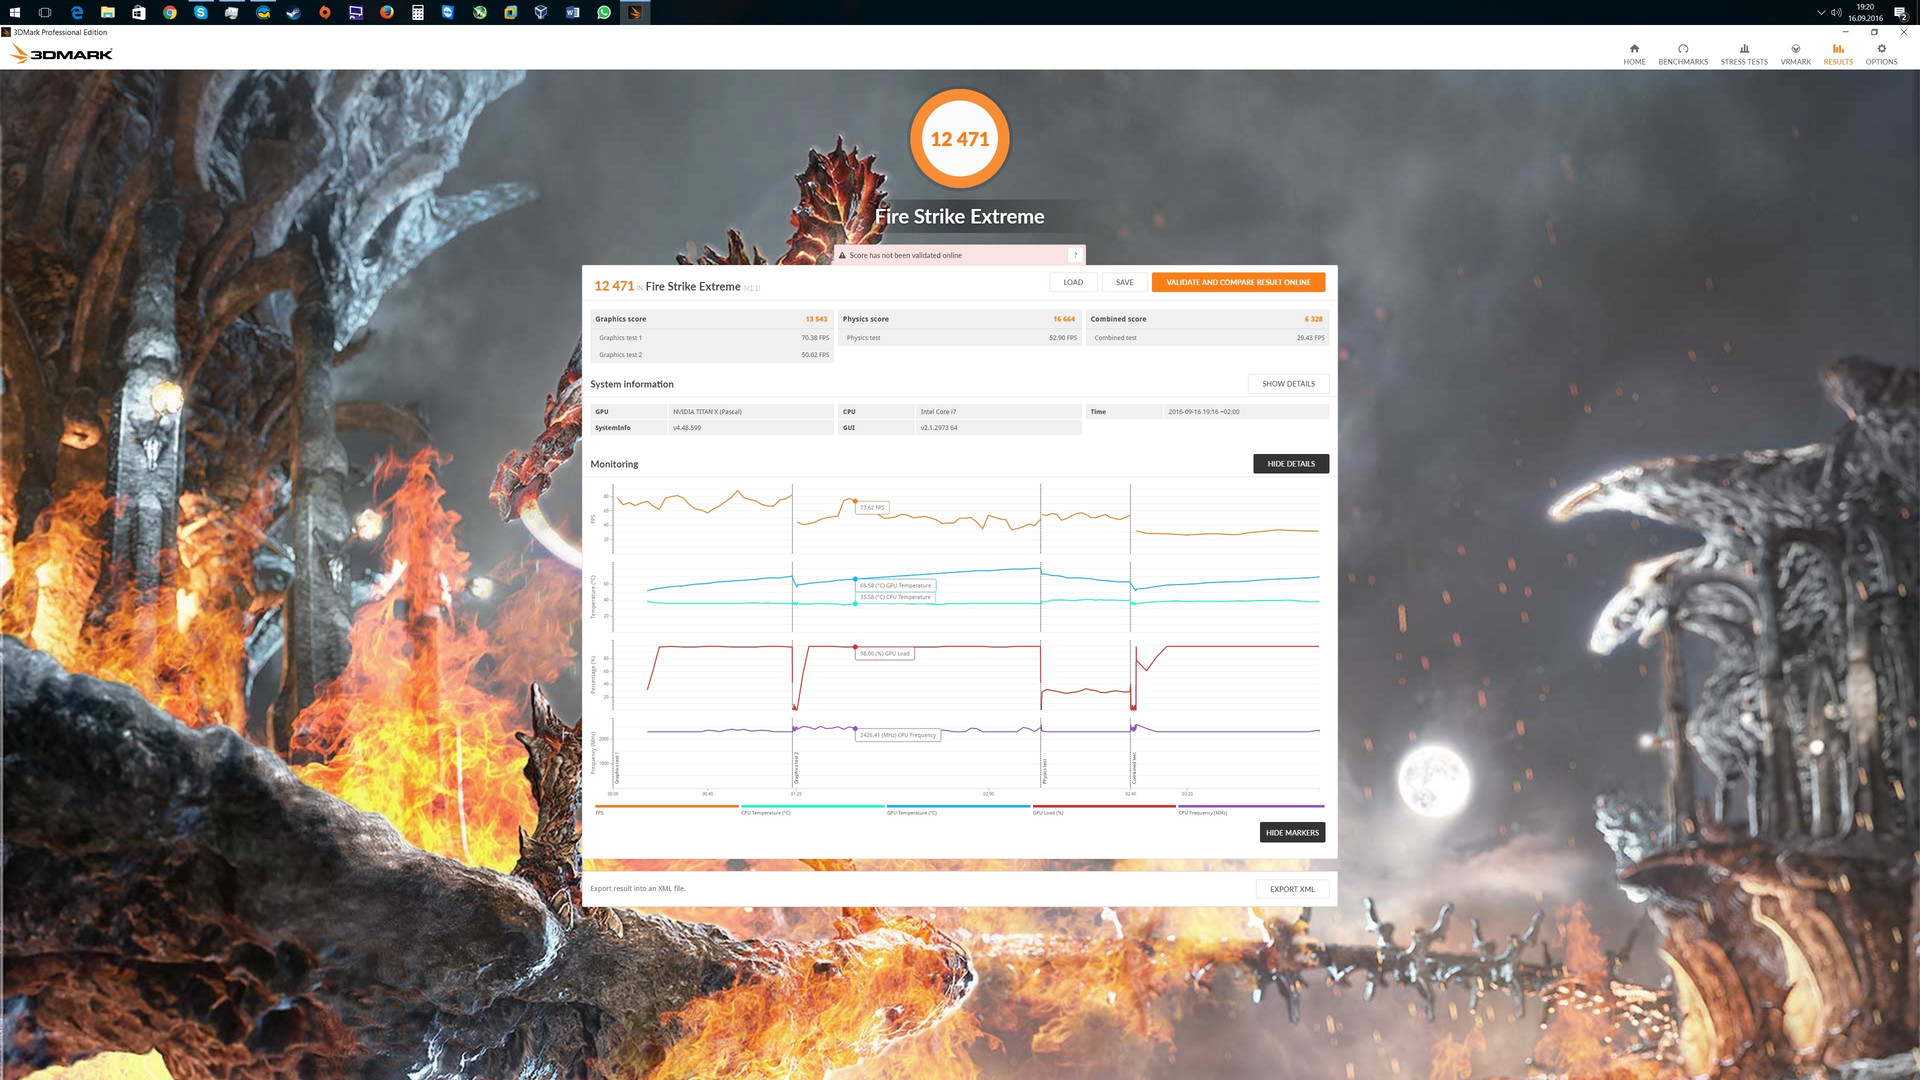
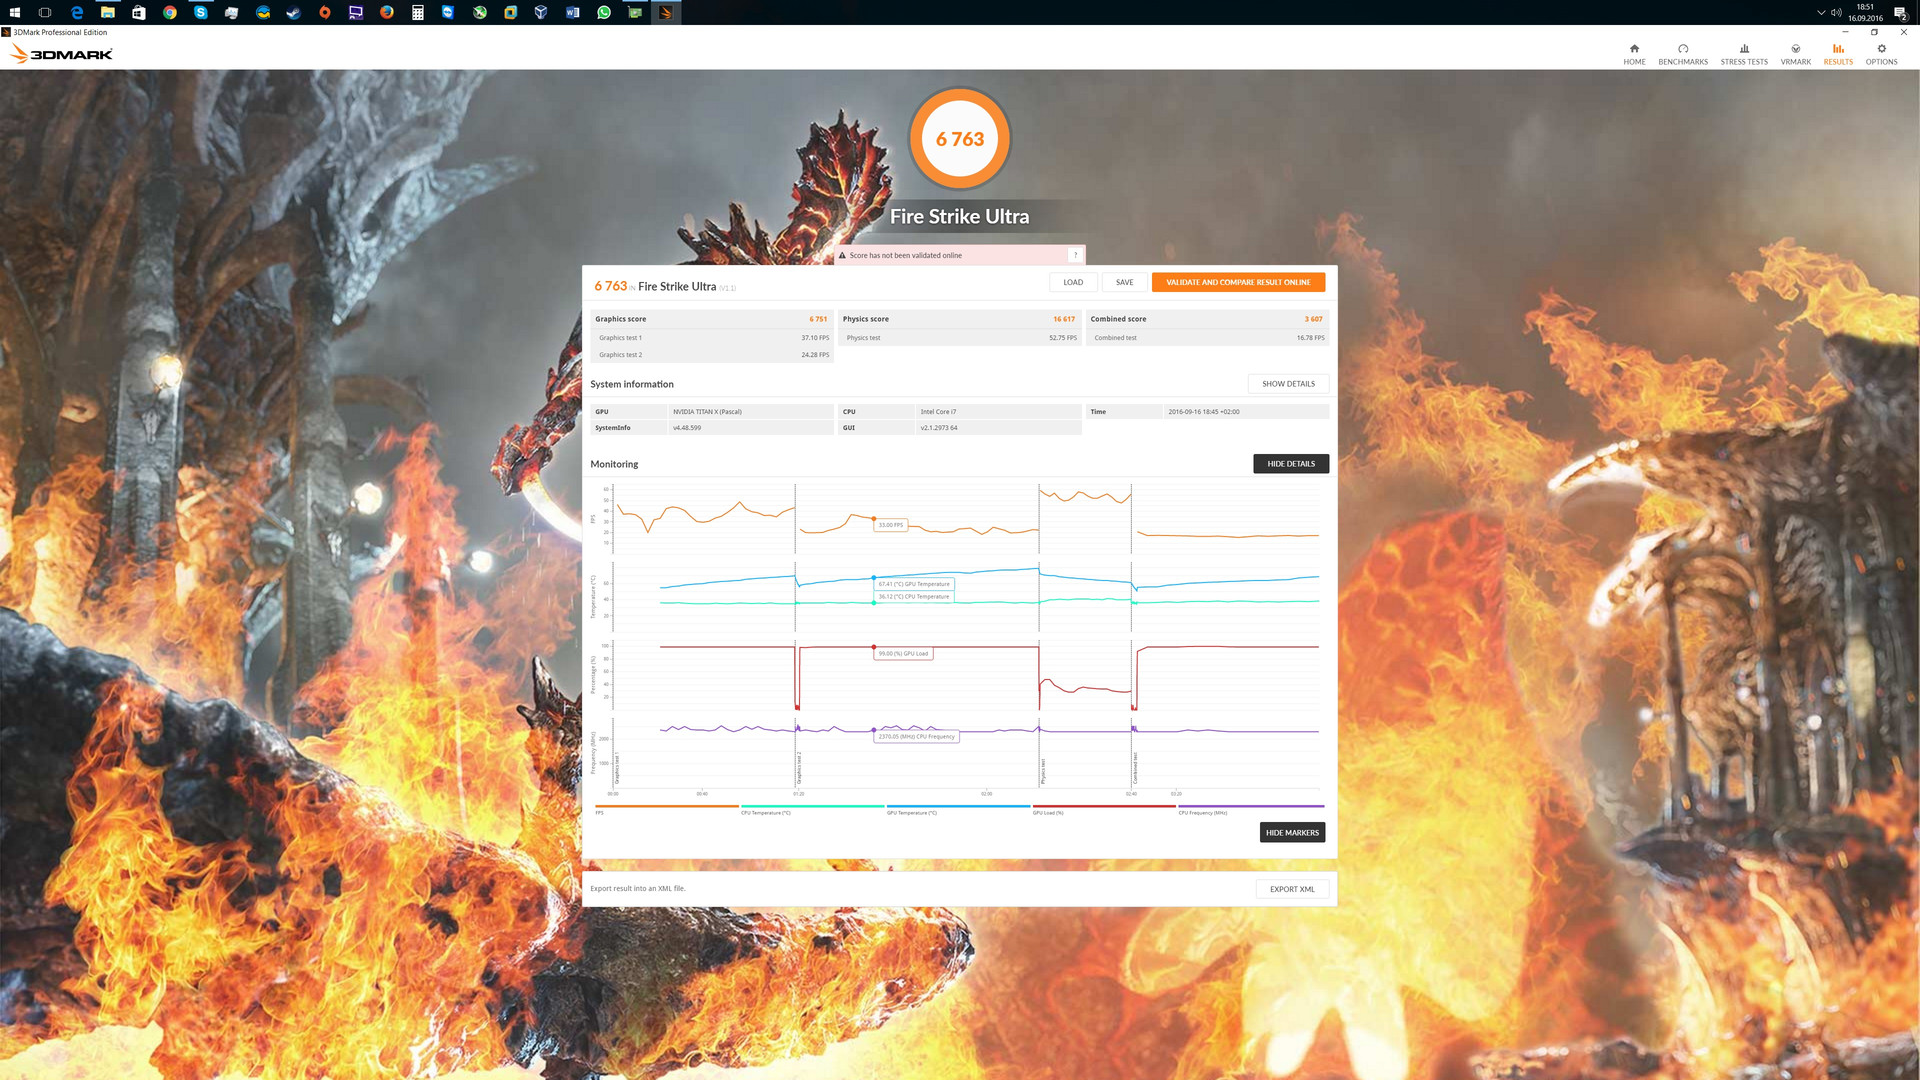
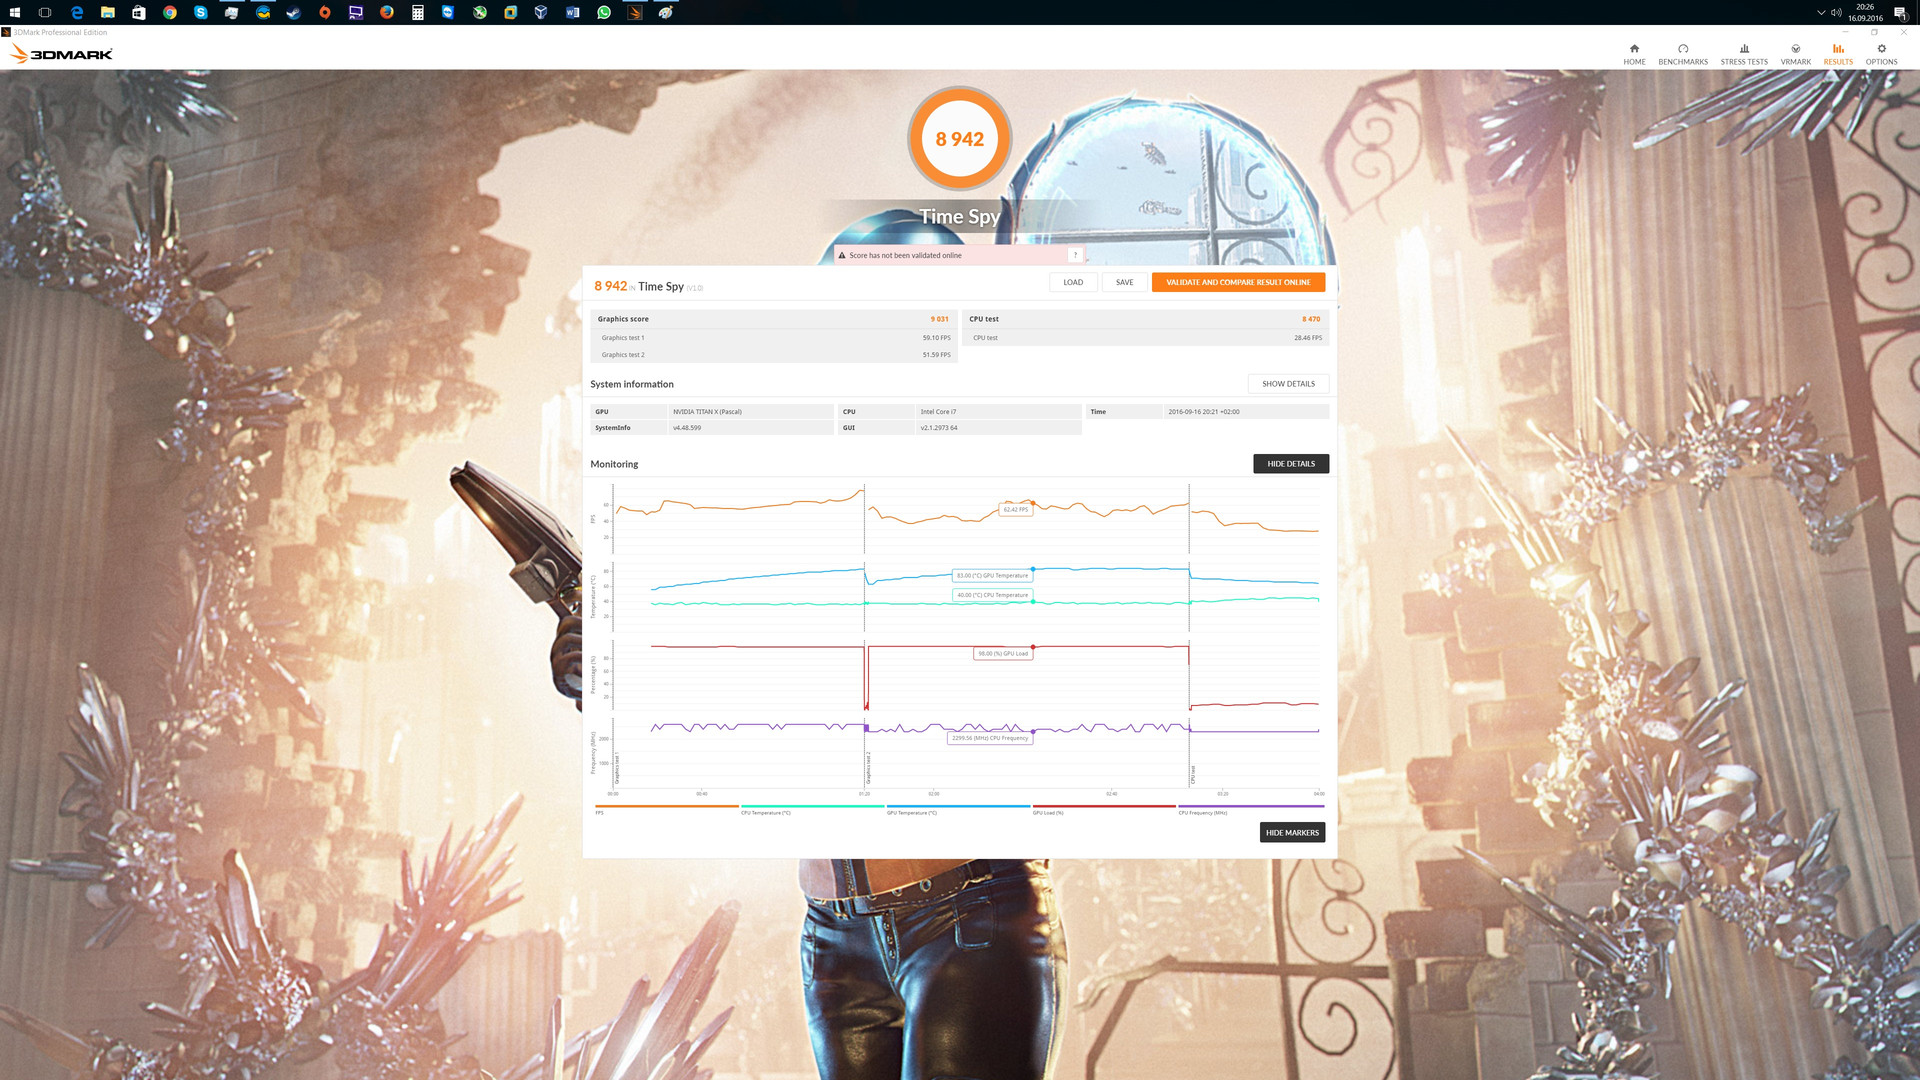
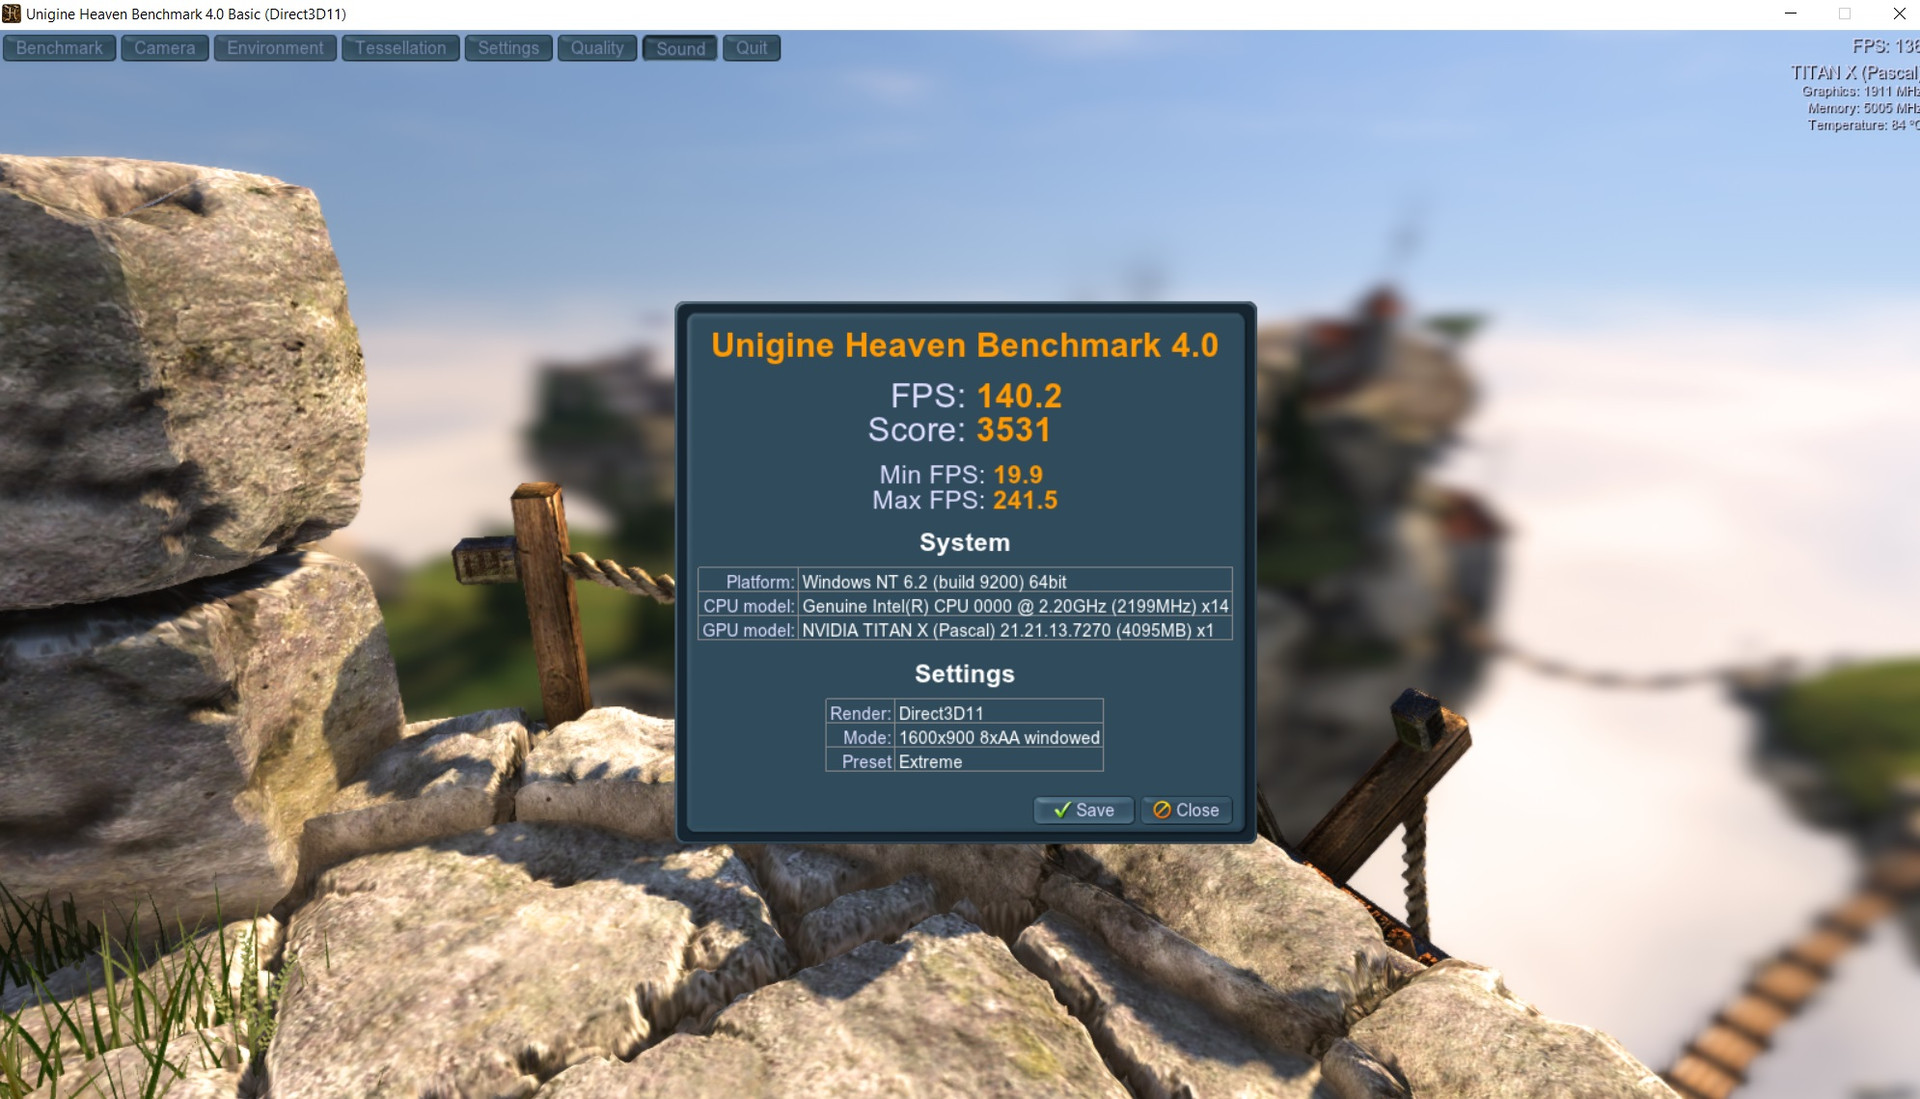
The synthetic benchmarks from Futuremark and Unigine clearly show that it tends to be the fastest consumer graphics card. With a significant difference of more than 30%, the Nvidia Titan X outperforms the former top model from the same manufacturer, the Nvidia GeForce GTX 1080 Founder's Edition . Although graphics cards with GTX 1080 chip that are overclocked ex-factory can minimize the difference, they cannot catch up with the superior Titan X.
NVIDIA Titan X Pascal Nvidia Titan X (Pascal), Intel Xeon E5-2680 v4 NVIDIA GeForce GTX 980 SLI (Laptop) MSI GT80S 6QF, Intel Core i7-6820HK NVIDIA GeForce GTX 1080 (Desktop) Nvidia GeForce GTX 1080 Founders Edition, Intel Core i7-4790K NVIDIA GeForce GTX 980 TiAsus Strix GTX 980 Ti Desktop PC, Intel Core i7-4790K NVIDIA GeForce GTX 1070 (Desktop) Nvidia GeForce GTX 1070 Founders Edition, Intel Core i7-4790K AMD Radeon R9 FuryXFX Radeon R9 Fury Pro, Intel Core i7-4790K NVIDIA GeForce GTX 980 (Laptop) SCHENKER XMG U716, Intel Core i7-6700 NVIDIA GeForce GTX 980M DogHouse Systems Mobius SS, Intel Core i7-6700K NVIDIA GeForce GTX 980 SLI (Laptop) MSI GT80S 6QF, Intel Core i7-6820HK NVIDIA GeForce GTX 1080 (Desktop) Nvidia GeForce GTX 1080 Founders Edition, Intel Core i7-4790K NVIDIA Titan X Pascal Nvidia Titan X (Pascal), Intel Xeon E5-2680 v4 NVIDIA GeForce GTX 1070 (Desktop) Nvidia GeForce GTX 1070 Founders Edition, Intel Core i7-4790K NVIDIA GeForce GTX 980 TiAsus Strix GTX 980 Ti Desktop PC, Intel Core i7-4790K AMD Radeon R9 FuryXFX Radeon R9 Fury Pro, Intel Core i7-4790K NVIDIA GeForce GTX 980 (Laptop) SCHENKER XMG U716, Intel Core i7-6700 NVIDIA GeForce GTX 980M DogHouse Systems Mobius SS, Intel Core i7-6700K NVIDIA Titan X Pascal Nvidia Titan X (Pascal), Intel Xeon E5-2680 v4 NVIDIA GeForce GTX 980 SLI (Laptop) MSI GT80S 6QF, Intel Core i7-6820HK NVIDIA GeForce GTX 1080 (Desktop) Nvidia GeForce GTX 1080 Founders Edition, Intel Core i7-4790K NVIDIA GeForce GTX 1070 (Desktop) Nvidia GeForce GTX 1070 Founders Edition, Intel Core i7-4790K NVIDIA GeForce GTX 980 TiAsus Strix GTX 980 Ti Desktop PC, Intel Core i7-4790K AMD Radeon R9 FuryXFX Radeon R9 Fury Pro, Intel Core i7-4790K NVIDIA GeForce GTX 980 (Laptop) SCHENKER XMG U716, Intel Core i7-6700 NVIDIA GeForce GTX 980M DogHouse Systems Mobius SS, Intel Core i7-6700K NVIDIA Titan X Pascal Nvidia Titan X (Pascal), Intel Xeon E5-2680 v4 NVIDIA GeForce GTX 1080 (Desktop) Nvidia GeForce GTX 1080 Founders Edition, Intel Core i7-4790K NVIDIA GeForce GTX 980 TiAsus Strix GTX 980 Ti Desktop PC, Intel Core i7-4790K AMD Radeon R9 FuryXFX Radeon R9 Fury Pro, Intel Core i7-4790K NVIDIA GeForce GTX 980M DogHouse Systems Mobius SS, Intel Core i7-6700K
very good for VR Obviously, the actual performance in games has much more significance. After we ran all the games in our benchmark list from 2015 and 2016 on the Nvidia Titan X, we can say with certainty that all current games run smoothly in 4K with a "high preset". There are often still reserves, so that the Nvidia Titan X can even cope with "ultra preset" at a resolution of 3840x2160 pixels.
At lower resolutions, the combination with a higher clocked CPU is often the better choice. The lack of multi-core support ensures that the Nvidia GeForce GTX 1080 as well as the Nvidia GeForce GTX 1070 perform better in FHD resolution than the Intel Xeon E5 2680v4 with the Nvidia Titan X. This changes with increasing the resolution, so that the Titan X can often be outperformed only by multi GPU systems in UHD resolution. Even if you ignore the price performance ratio, this GPU only makes sense when you want to run games with resolutions above 1080p and a correspondingly high preset.
NVIDIA Titan X Pascal Nvidia Titan X (Pascal), Intel Xeon E5-2680 v4 NVIDIA GeForce GTX 1080 (Desktop) Nvidia GeForce GTX 1080 Founders Edition, Intel Core i7-4790K
42 (34min - 53max ) fps-33%
AMD Radeon R9 FuryXFX Radeon R9 Fury Pro, Intel Core i7-4790K
38.9 (26min - 46max ) fps-38%
AMD Radeon R9 FuryXFX Radeon R9 Fury Pro, Intel Core i7-4790K
37.7 (26min - 46max ) fps-40%
NVIDIA GeForce GTX 1070 (Desktop) Nvidia GeForce GTX 1070 Founders Edition, Intel Core i7-4790K
35.6 (30min - 43max ) fps-43%
NVIDIA GeForce GTX 980 TiAsus Strix GTX 980 Ti Desktop PC, Intel Core i7-4790K
32.6 (24min - 42max ) fps-48%
NVIDIA GeForce GTX 980Desktop PC, Intel Core i7-6700K NVIDIA GeForce GTX 980MSchenker W504, Intel Core i7-4700MQ
NVIDIA Titan X Pascal Nvidia Titan X (Pascal), Intel Xeon E5-2680 v4 NVIDIA GeForce GTX 1080 (Desktop) Nvidia GeForce GTX 1080 Founders Edition, Intel Core i7-4790K
48.5 (19min - 65max ) fps-7%
NVIDIA GeForce GTX 980 TiAsus Strix GTX 980 Ti Desktop PC, Intel Core i7-4790K
39.8 (14min - 51max ) fps-24%
NVIDIA GeForce GTX 1070 (Desktop) Nvidia GeForce GTX 1070 Founders Edition, Intel Core i7-4790K
39.7 (17min - 52max ) fps-24%
AMD Radeon R9 FuryXFX Radeon R9 Fury Pro, Intel Core i7-4790K
34.5 (19min - 51max ) fps-34%
NVIDIA GeForce GTX 980Desktop PC, Intel Core i7-6700K
NVIDIA Titan X Pascal Nvidia Titan X (Pascal), Intel Xeon E5-2680 v4 NVIDIA GeForce GTX 1080 (Desktop) Nvidia GeForce GTX 1080 Founders Edition, Intel Core i7-4790K
49 (46min - 53max ) fps-21%
NVIDIA GeForce GTX 980 TiAsus Strix GTX 980 Ti Desktop PC, Intel Core i7-4790K
40 (37min - 44max ) fps-35%
NVIDIA GeForce GTX 1070 (Desktop) Nvidia GeForce GTX 1070 Founders Edition, Intel Core i7-4790K
38 (36min - 42max ) fps-39%
AMD Radeon R9 FuryXFX Radeon R9 Fury Pro, Intel Core i7-4790K
37 (33min - 42max ) fps-40%
NVIDIA GeForce GTX 980Desktop PC, Intel Core i7-6700K NVIDIA GeForce GTX 980MSchenker W504, Intel Core i7-4700MQ
NVIDIA Titan X Pascal Nvidia Titan X (Pascal), Intel Xeon E5-2680 v4 NVIDIA GeForce GTX 1080 (Desktop) Nvidia GeForce GTX 1080 Founders Edition, Intel Core i7-4790K
30.4 (27min - 34max ) fps-29%
NVIDIA GeForce GTX 1070 (Desktop) Nvidia GeForce GTX 1070 Founders Edition, Intel Core i7-4790K
25.6 (39min - 47max ) fps-40%
NVIDIA GeForce GTX 980 TiAsus Strix GTX 980 Ti Desktop PC, Intel Core i7-4790K
25 (24min - 28max ) fps-42%
AMD Radeon R9 FuryXFX Radeon R9 Fury Pro, Intel Core i7-4790K
22 (19min - 24max ) fps-49%
NVIDIA GeForce GTX 980Desktop PC, Intel Core i7-6700K
NVIDIA Titan X Pascal Nvidia Titan X (Pascal), Intel Xeon E5-2680 v4 NVIDIA GeForce GTX 1080 (Desktop) Nvidia GeForce GTX 1080 Founders Edition, Intel Core i7-4790K NVIDIA GeForce GTX 1080 (Desktop) Nvidia GeForce GTX 1080 Founders Edition, Intel Core i7-4790K
47.8 (43min - 54max ) fps-30%
NVIDIA GeForce GTX 980 TiAsus Strix GTX 980 Ti Desktop PC, Intel Core i7-4790K
40.6 (36min - 46max ) fps-41%
NVIDIA GeForce GTX 1070 (Desktop) Nvidia GeForce GTX 1070 Founders Edition, Intel Core i7-4790K
38.9 (35min - 44max ) fps-43%
AMD Radeon R9 FuryXFX Radeon R9 Fury Pro, Intel Core i7-4790K
32.4 (29min - 37max ) fps-53%
NVIDIA GeForce GTX 980Desktop PC, Intel Core i7-6700K NVIDIA GeForce GTX 980MSchenker W504, Intel Core i7-4700MQ
NVIDIA Titan X Pascal Nvidia Titan X (Pascal), Intel Xeon E5-2680 v4
81.6 (71min - 123max ) fps
NVIDIA GeForce GTX 1080 (Desktop) Nvidia GeForce GTX 1080 Founders Edition, Intel Core i7-4790K
62 (56min - 67max ) fps-24%
NVIDIA GeForce GTX 1070 (Desktop) Nvidia GeForce GTX 1070 Founders Edition, Intel Core i7-4790K
49.6 (44min - 53max ) fps-39%
NVIDIA GeForce GTX 980 TiAsus Strix GTX 980 Ti Desktop PC, Intel Core i7-4790K
48 (42min - 52max ) fps-41%
NVIDIA GeForce GTX 980Desktop PC, Intel Core i7-6700K AMD Radeon R9 FuryXFX Radeon R9 Fury Pro, Intel Core i7-4790K
36.3 (33min - 41max ) fps-56%
NVIDIA GeForce GTX 980MSchenker W504, Intel Core i7-4700MQ
NVIDIA Titan X Pascal Nvidia Titan X (Pascal), Intel Xeon E5-2680 v4
88.6 (79min - 103max ) fps
NVIDIA GeForce GTX 1080 (Desktop) Nvidia GeForce GTX 1080 Founders Edition, Intel Core i7-4790K
67 (58min - 79max ) fps-24%
NVIDIA GeForce GTX 980 SLI (Laptop) MSI GT80S 6QF, Intel Core i7-6820HK NVIDIA GeForce GTX 980 TiAsus Strix GTX 980 Ti Desktop PC, Intel Core i7-4790K
53 (46min - 64max ) fps-40%
NVIDIA GeForce GTX 1070 (Desktop) Nvidia GeForce GTX 1070 Founders Edition, Intel Core i7-4790K
52.7 (45min - 63max ) fps-41%
AMD Radeon R9 FuryXFX Radeon R9 Fury Pro, Intel Core i7-4790K
50 (43min - 60max ) fps-44%
NVIDIA GeForce GTX 980Desktop PC, Intel Core i7-6700K NVIDIA GeForce GTX 980MSchenker W504, Intel Core i7-4700MQ
NVIDIA Titan X Pascal Nvidia Titan X (Pascal), Intel Xeon E5-2680 v4 NVIDIA GeForce GTX 1080 (Desktop) Nvidia GeForce GTX 1080 Founders Edition, Intel Core i7-4790K
47.3 (44min - 51max ) fps-27%
NVIDIA GeForce GTX 1070 (Desktop) Nvidia GeForce GTX 1070 Founders Edition, Intel Core i7-4790K
38 (35min - 42max ) fps-42%
NVIDIA GeForce GTX 980 SLI (Laptop) MSI GT80S 6QF, Intel Core i7-6820HK NVIDIA GeForce GTX 980 TiAsus Strix GTX 980 Ti Desktop PC, Intel Core i7-4790K
37.4 (35min - 41max ) fps-43%
AMD Radeon R9 FuryXFX Radeon R9 Fury Pro, Intel Core i7-4790K
31.5 (29min - 37max ) fps-52%
NVIDIA GeForce GTX 980Desktop PC, Intel Core i7-6700K NVIDIA GeForce GTX 980MSchenker W504, Intel Core i7-4700MQ
NVIDIA Titan X Pascal Nvidia Titan X (Pascal), Intel Xeon E5-2680 v4 NVIDIA GeForce GTX 980 SLI (Laptop) MSI GT80S 6QF, Intel Core i7-6820HK NVIDIA GeForce GTX 1080 (Desktop) Nvidia GeForce GTX 1080 Founders Edition, Intel Core i7-4790K
54 (42min - 66max ) fps-27%
NVIDIA GeForce GTX 980 TiAsus Strix GTX 980 Ti Desktop PC, Intel Core i7-4790K
46 (37min - 56max ) fps-38%
NVIDIA GeForce GTX 1070 (Desktop) Nvidia GeForce GTX 1070 Founders Edition, Intel Core i7-4790K
45.2 (35min - 55max ) fps-39%
AMD Radeon R9 FuryXFX Radeon R9 Fury Pro, Intel Core i7-4790K
38.7 (30min - 49max ) fps-48%
NVIDIA GeForce GTX 980MSchenker W504, Intel Core i7-4700MQ
NVIDIA Titan X Pascal Nvidia Titan X (Pascal), Intel Xeon E5-2680 v4 NVIDIA GeForce GTX 1080 (Desktop) Nvidia GeForce GTX 1080 Founders Edition, Intel Core i7-4790K
67 (64min - 70max ) fps-24%
NVIDIA GeForce GTX 1070 (Desktop) Nvidia GeForce GTX 1070 Founders Edition, Intel Core i7-4790K NVIDIA GeForce GTX 980 TiAsus Strix GTX 980 Ti Desktop PC, Intel Core i7-4790K
52.2 (49min - 55max ) fps-41%
NVIDIA GeForce GTX 980 SLI (Laptop) MSI GT80S 6QF, Intel Core i7-6820HK AMD Radeon R9 FuryXFX Radeon R9 Fury Pro, Intel Core i7-4790K
34.3 (32min - 36max ) fps-61%
NVIDIA GeForce GTX 980MSchenker W504, Intel Core i7-4700MQ
NVIDIA GeForce GTX 1080 (Desktop) Nvidia GeForce GTX 1080 Founders Edition, Intel Core i7-4790K
109 (81min - 150max ) fps+5%
NVIDIA Titan X Pascal Nvidia Titan X (Pascal), Intel Xeon E5-2680 v4
104.1 (54min - 156max ) fps
NVIDIA GeForce GTX 1070 (Desktop) Nvidia GeForce GTX 1070 Founders Edition, Intel Core i7-4790K
100 (53min - 133max ) fps-4%
NVIDIA GeForce GTX 980 TiAsus Strix GTX 980 Ti Desktop PC, Intel Core i7-4790K
87 (64min - 132max ) fps-16%
AMD Radeon R9 FuryXFX Radeon R9 Fury Pro, Intel Core i7-4790K
64 (50min - 82max ) fps-39%
NVIDIA GeForce GTX 1070 (Desktop) Nvidia GeForce GTX 1070 Founders Edition, Intel Core i7-4790K
137 (110min - 143max ) fps+41%
NVIDIA GeForce GTX 1080 (Desktop) Nvidia GeForce GTX 1080 Founders Edition, Intel Core i7-4790K
126 (99min - 154max ) fps+30%
NVIDIA GeForce GTX 980 TiAsus Strix GTX 980 Ti Desktop PC, Intel Core i7-4790K
109 (88min - 139max ) fps+12%
NVIDIA Titan X Pascal Nvidia Titan X (Pascal), Intel Xeon E5-2680 v4
97 (66.8min - 160.3max ) fps
NVIDIA GeForce GTX 980 SLI (Laptop) MSI GT80S 6QF, Intel Core i7-6820HK AMD Radeon R9 FuryXFX Radeon R9 Fury Pro, Intel Core i7-4790K
81 (53min - 104max ) fps-16%
NVIDIA GeForce GTX 980MSchenker W504, Intel Core i7-4700MQ
NVIDIA Titan X Pascal Nvidia Titan X (Pascal), Intel Xeon E5-2680 v4
95.5 (37.9min - 174.5max ) fps
NVIDIA GeForce GTX 980 TiAsus Strix GTX 980 Ti Desktop PC, Intel Core i7-4790K NVIDIA GeForce GTX 1080 (Desktop) Nvidia GeForce GTX 1080 Founders Edition, Intel Core i7-4790K
71.2 (11.6min - 170max ) fps-25%
NVIDIA GeForce GTX 1070 (Desktop) Nvidia GeForce GTX 1070 Founders Edition, Intel Core i7-4790K AMD Radeon R9 FuryXFX Radeon R9 Fury Pro, Intel Core i7-4790K NVIDIA GeForce GTX 980MSchenker W504, Intel Core i7-4700MQ
NVIDIA Titan X Pascal Nvidia Titan X (Pascal), Intel Xeon E5-2680 v4
126.2 (107min - 152max ) fps
NVIDIA GeForce GTX 980 SLI (Laptop) MSI GT80S 6QF, Intel Core i7-6820HK NVIDIA GeForce GTX 1080 (Desktop) Nvidia GeForce GTX 1080 Founders Edition, Intel Core i7-4790K NVIDIA GeForce GTX 980 TiAsus Strix GTX 980 Ti Desktop PC, Intel Core i7-4790K
70 (63min - 84max ) fps-45%
NVIDIA GeForce GTX 1070 (Desktop) Nvidia GeForce GTX 1070 Founders Edition, Intel Core i7-4790K
69.8 (61min - 83max ) fps-45%
AMD Radeon R9 FuryXFX Radeon R9 Fury Pro, Intel Core i7-4790K
56 (49min - 65max ) fps-56%
NVIDIA GeForce GTX 980MSchenker W504, Intel Core i7-4700MQ
NVIDIA Titan X Pascal Nvidia Titan X (Pascal), Intel Xeon E5-2680 v4
165.8 (158min - 234max ) fps
NVIDIA GeForce GTX 1080 (Desktop) Nvidia GeForce GTX 1080 Founders Edition, Intel Core i7-4790K
104 (88min - 121max ) fps-37%
NVIDIA GeForce GTX 980 TiAsus Strix GTX 980 Ti Desktop PC, Intel Core i7-4790K
87 (75min - 101max ) fps-48%
NVIDIA GeForce GTX 1070 (Desktop) Nvidia GeForce GTX 1070 Founders Edition, Intel Core i7-4790K
85.5 (74min - 98max ) fps-48%
AMD Radeon R9 FuryXFX Radeon R9 Fury Pro, Intel Core i7-4790K
77 (64min - 91max ) fps-54%
NVIDIA GeForce GTX 980Desktop PC, Intel Core i7-6700K NVIDIA GeForce GTX 980MSchenker W504, Intel Core i7-4700MQ
NVIDIA Titan X Pascal Nvidia Titan X (Pascal), Intel Xeon E5-2680 v4
41.1 (35.6min - 47.6max ) fps
NVIDIA GeForce GTX 1080 (Desktop) Nvidia GeForce GTX 1080 Founders Edition, Intel Core i7-4790K
30.8 (26min - 36max ) fps-25%
NVIDIA GeForce GTX 1070 (Desktop) Nvidia GeForce GTX 1070 Founders Edition, Intel Core i7-4790K
28.3 (24min - 34max ) fps-31%
AMD Radeon R9 FuryXFX Radeon R9 Fury Pro, Intel Core i7-4790K
25.1 (11min - 34max ) fps-39%
NVIDIA GeForce GTX 980 TiAsus Strix GTX 980 Ti Desktop PC, Intel Core i7-4790K
24.8 (21.3min - 28.4max ) fps-40%
NVIDIA GeForce GTX 980Desktop PC, Intel Core i7-6700K NVIDIA GeForce GTX 980MSchenker W504, Intel Core i7-4700MQ
NVIDIA Titan X Pascal Nvidia Titan X (Pascal), Intel Xeon E5-2680 v4 NVIDIA GeForce GTX 1080 (Desktop) Nvidia GeForce GTX 1080 Founders Edition, Intel Core i7-4790K
58.5 (21min - 68max ) fps-27%
NVIDIA GeForce GTX 980 TiAsus Strix GTX 980 Ti Desktop PC, Intel Core i7-4790K
46.7 (38min - 53max ) fps-42%
AMD Radeon R9 FuryXFX Radeon R9 Fury Pro, Intel Core i7-4790K
35.7 (26min - 41max ) fps-55%
NVIDIA GeForce GTX 980Desktop PC, Intel Core i7-6700K NVIDIA GeForce GTX 980MSchenker W504, Intel Core i7-4700MQ
NVIDIA Titan X Pascal Nvidia Titan X (Pascal), Intel Xeon E5-2680 v4 NVIDIA GeForce GTX 1080 (Desktop) Nvidia GeForce GTX 1080 Founders Edition, Intel Core i7-4790K
208 (194min - 218max ) fps-23%
NVIDIA GeForce GTX 980 TiAsus Strix GTX 980 Ti Desktop PC, Intel Core i7-4790K AMD Radeon R9 FuryXFX Radeon R9 Fury Pro, Intel Core i7-4790K
157 (143min - 167max ) fps-42%
NVIDIA GeForce GTX 980 SLI (Laptop) MSI GT80S 6QF, Intel Core i7-6820HK NVIDIA GeForce GTX 980MSchenker W504, Intel Core i7-4700MQ
NVIDIA Titan X Pascal Nvidia Titan X (Pascal), Intel Xeon E5-2680 v4
106.9 (45.6min - 206.2max ) fps
NVIDIA GeForce GTX 1080 (Desktop) Nvidia GeForce GTX 1080 Founders Edition, Intel Core i7-4790K NVIDIA GeForce GTX 1070 (Desktop) Nvidia GeForce GTX 1070 Founders Edition, Intel Core i7-4790K
67.4 (52min - 88max ) fps-37%
NVIDIA GeForce GTX 980 TiAsus Strix GTX 980 Ti Desktop PC, Intel Core i7-4790K
67 (50min - 95max ) fps-37%
AMD Radeon R9 FuryXFX Radeon R9 Fury Pro, Intel Core i7-4790K
62 (47min - 76max ) fps-42%
NVIDIA GeForce GTX 980 SLI (Laptop) MSI GT80S 6QF, Intel Core i7-6820HK NVIDIA GeForce GTX 980Desktop PC, Intel Core i7-6700K NVIDIA GeForce GTX 980MSchenker W504, Intel Core i7-4700MQ
NVIDIA Titan X Pascal Nvidia Titan X (Pascal), Intel Xeon E5-2680 v4
86.4 (71min - 112max ) fps
NVIDIA GeForce GTX 1080 (Desktop) Nvidia GeForce GTX 1080 Founders Edition, Intel Core i7-4790K NVIDIA GeForce GTX 1070 (Desktop) Nvidia GeForce GTX 1070 Founders Edition, Intel Core i7-4790K
48.6 (42min - 60max ) fps-44%
NVIDIA GeForce GTX 980 TiAsus Strix GTX 980 Ti Desktop PC, Intel Core i7-4790K
46 (41min - 60max ) fps-47%
AMD Radeon R9 FuryXFX Radeon R9 Fury Pro, Intel Core i7-4790K
38.2 (33min - 51max ) fps-56%
NVIDIA GeForce GTX 980Desktop PC, Intel Core i7-6700K NVIDIA GeForce GTX 980MSchenker W504, Intel Core i7-4700MQ
NVIDIA Titan X Pascal Nvidia Titan X (Pascal), Intel Xeon E5-2680 v4 NVIDIA GeForce GTX 1080 (Desktop) Nvidia GeForce GTX 1080 Founders Edition, Intel Core i7-4790K
47 (44min - 50max ) fps-23%
NVIDIA GeForce GTX 980 TiAsus Strix GTX 980 Ti Desktop PC, Intel Core i7-4790K
38.3 (35min - 42max ) fps-37%
NVIDIA GeForce GTX 1070 (Desktop) Nvidia GeForce GTX 1070 Founders Edition, Intel Core i7-4790K
38.2 (35min - 41max ) fps-37%
AMD Radeon R9 FuryXFX Radeon R9 Fury Pro, Intel Core i7-4790K
31.5 (23min - 35max ) fps-48%
NVIDIA GeForce GTX 980Desktop PC, Intel Core i7-6700K NVIDIA GeForce GTX 980MSchenker W504, Intel Core i7-4700MQ
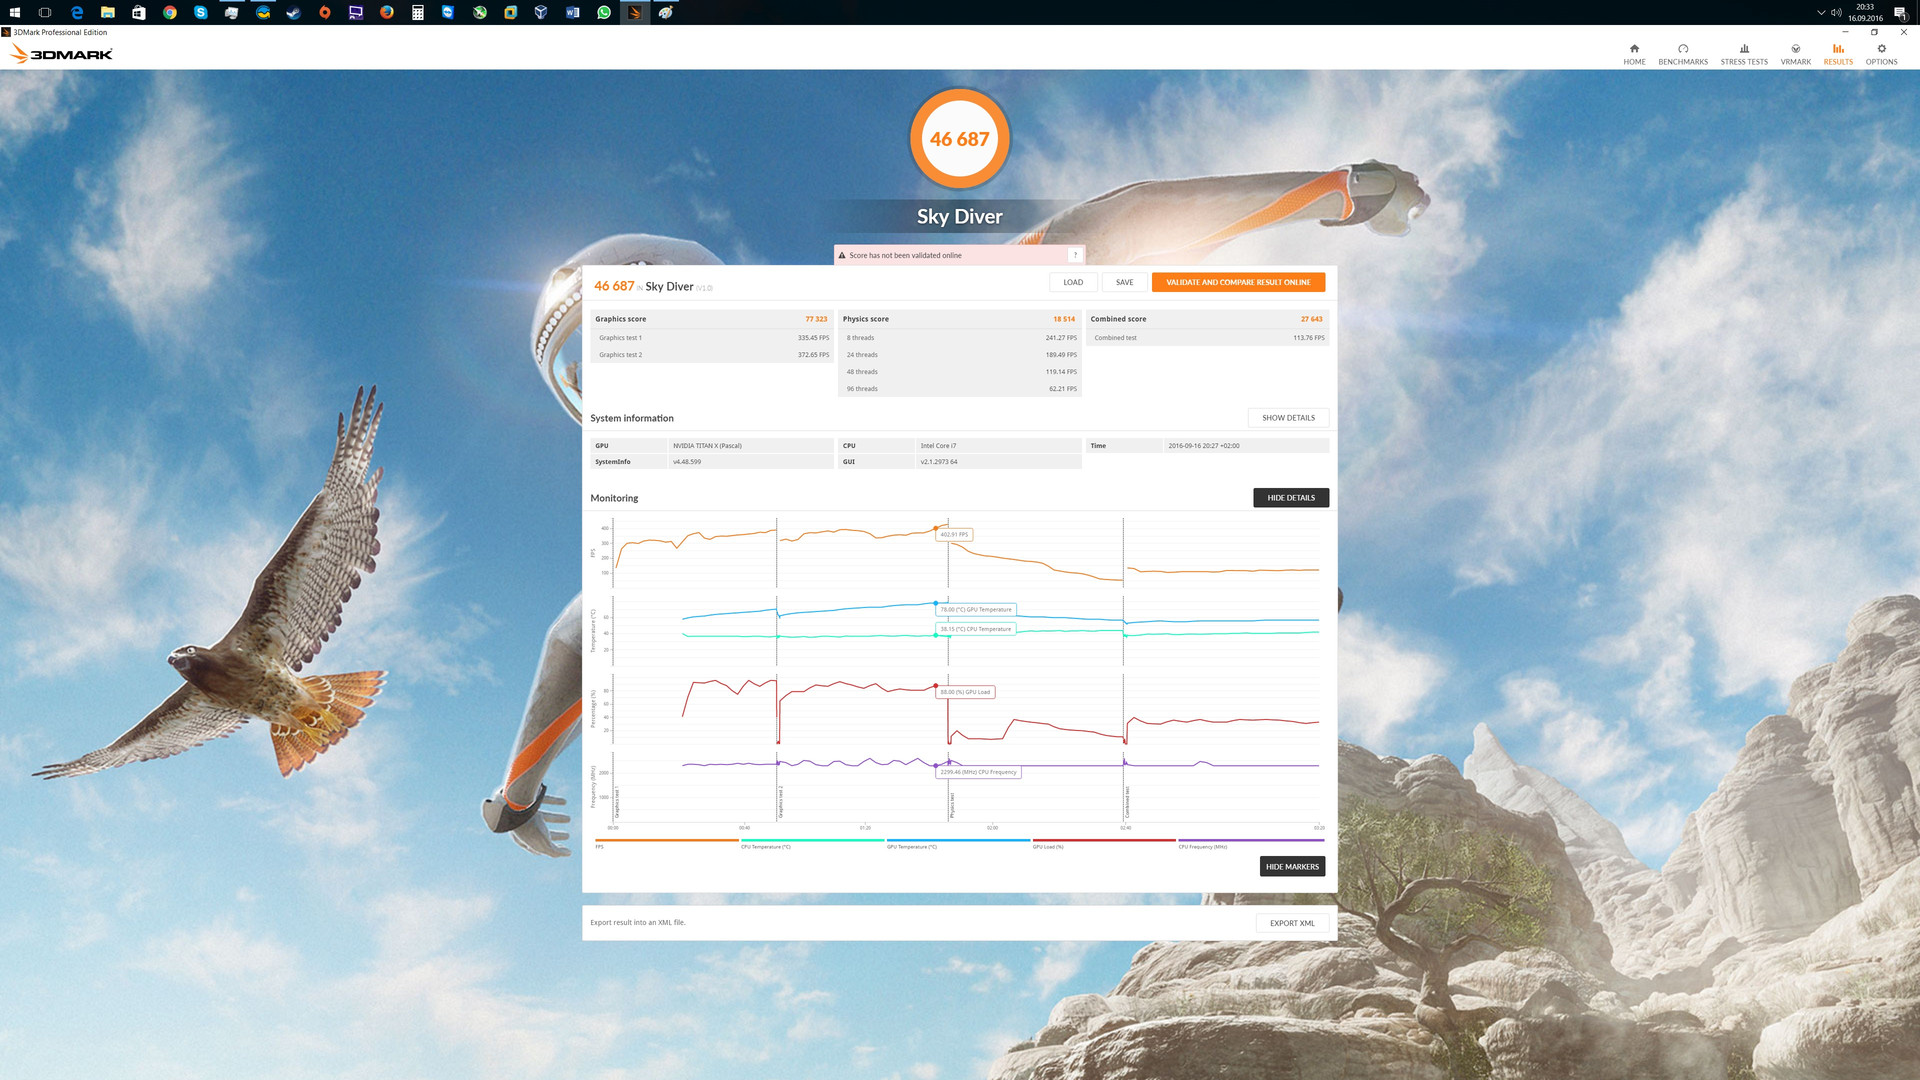
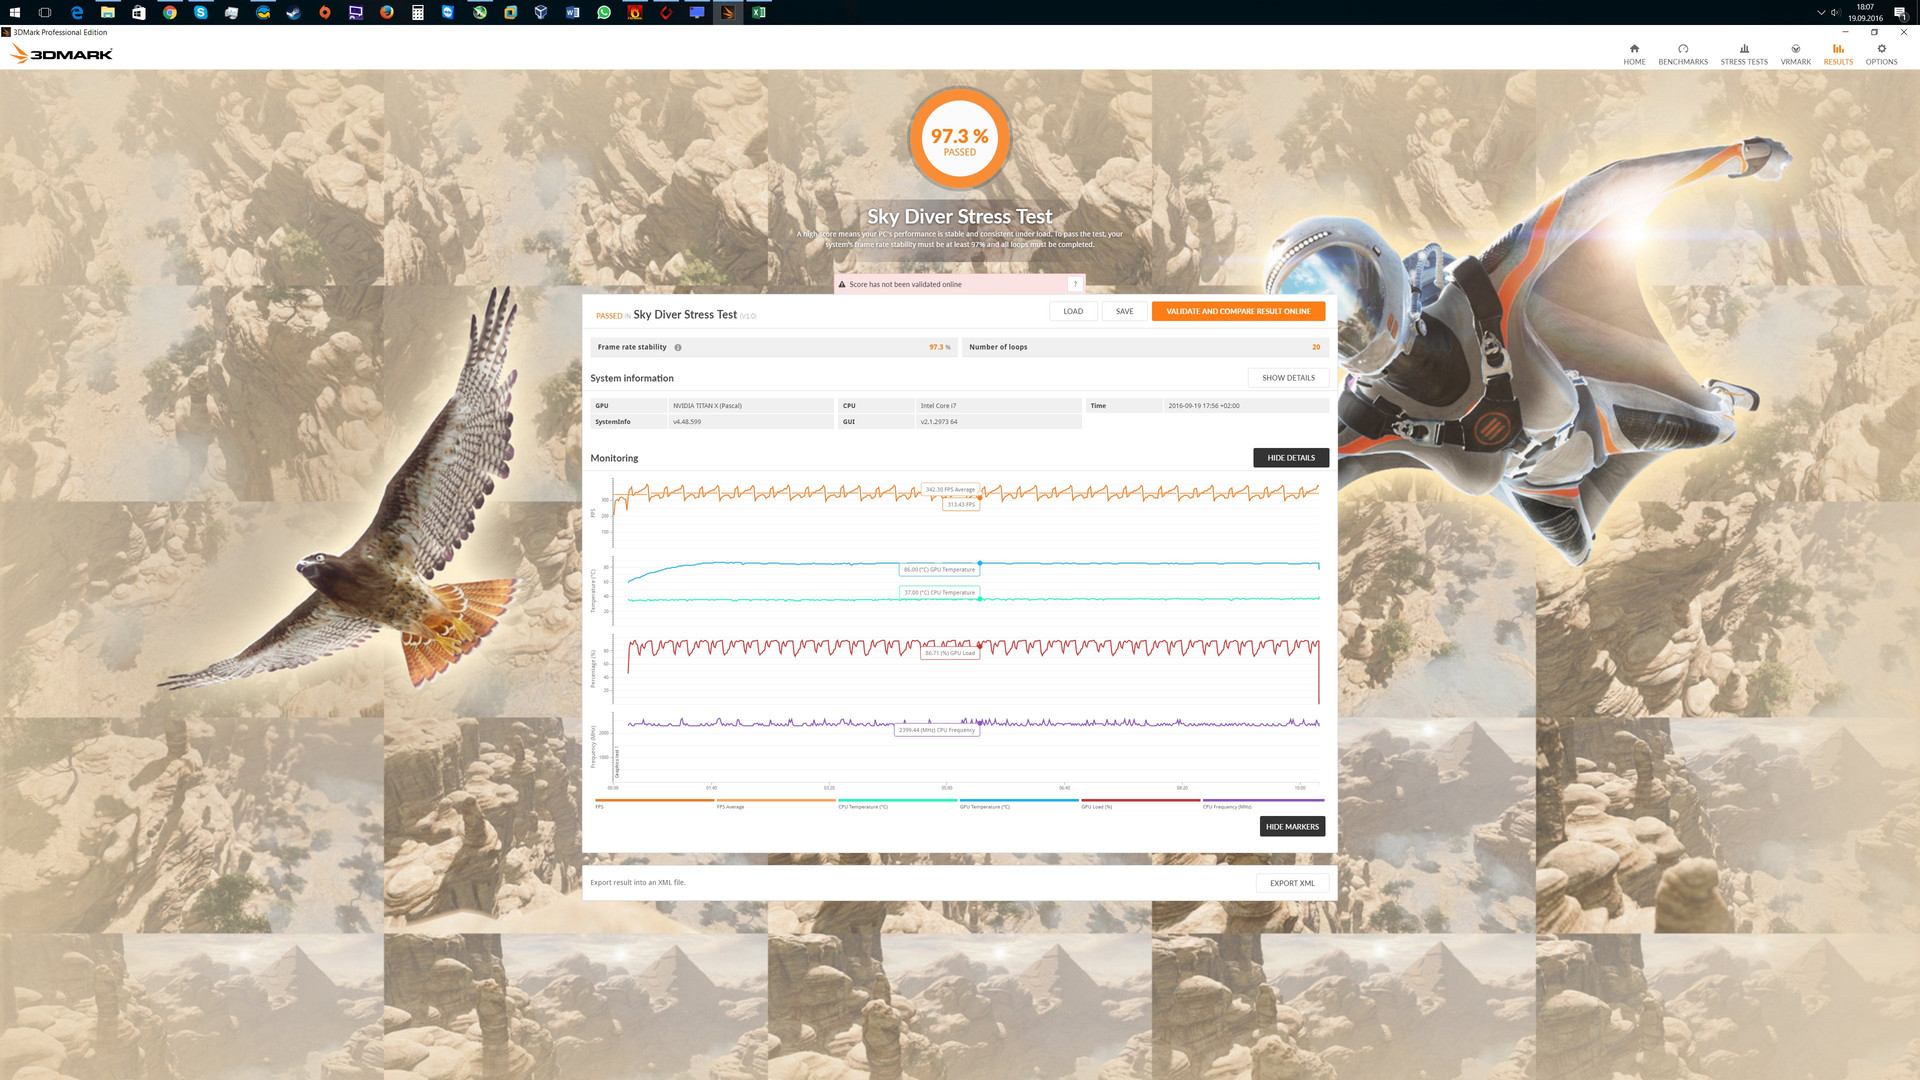
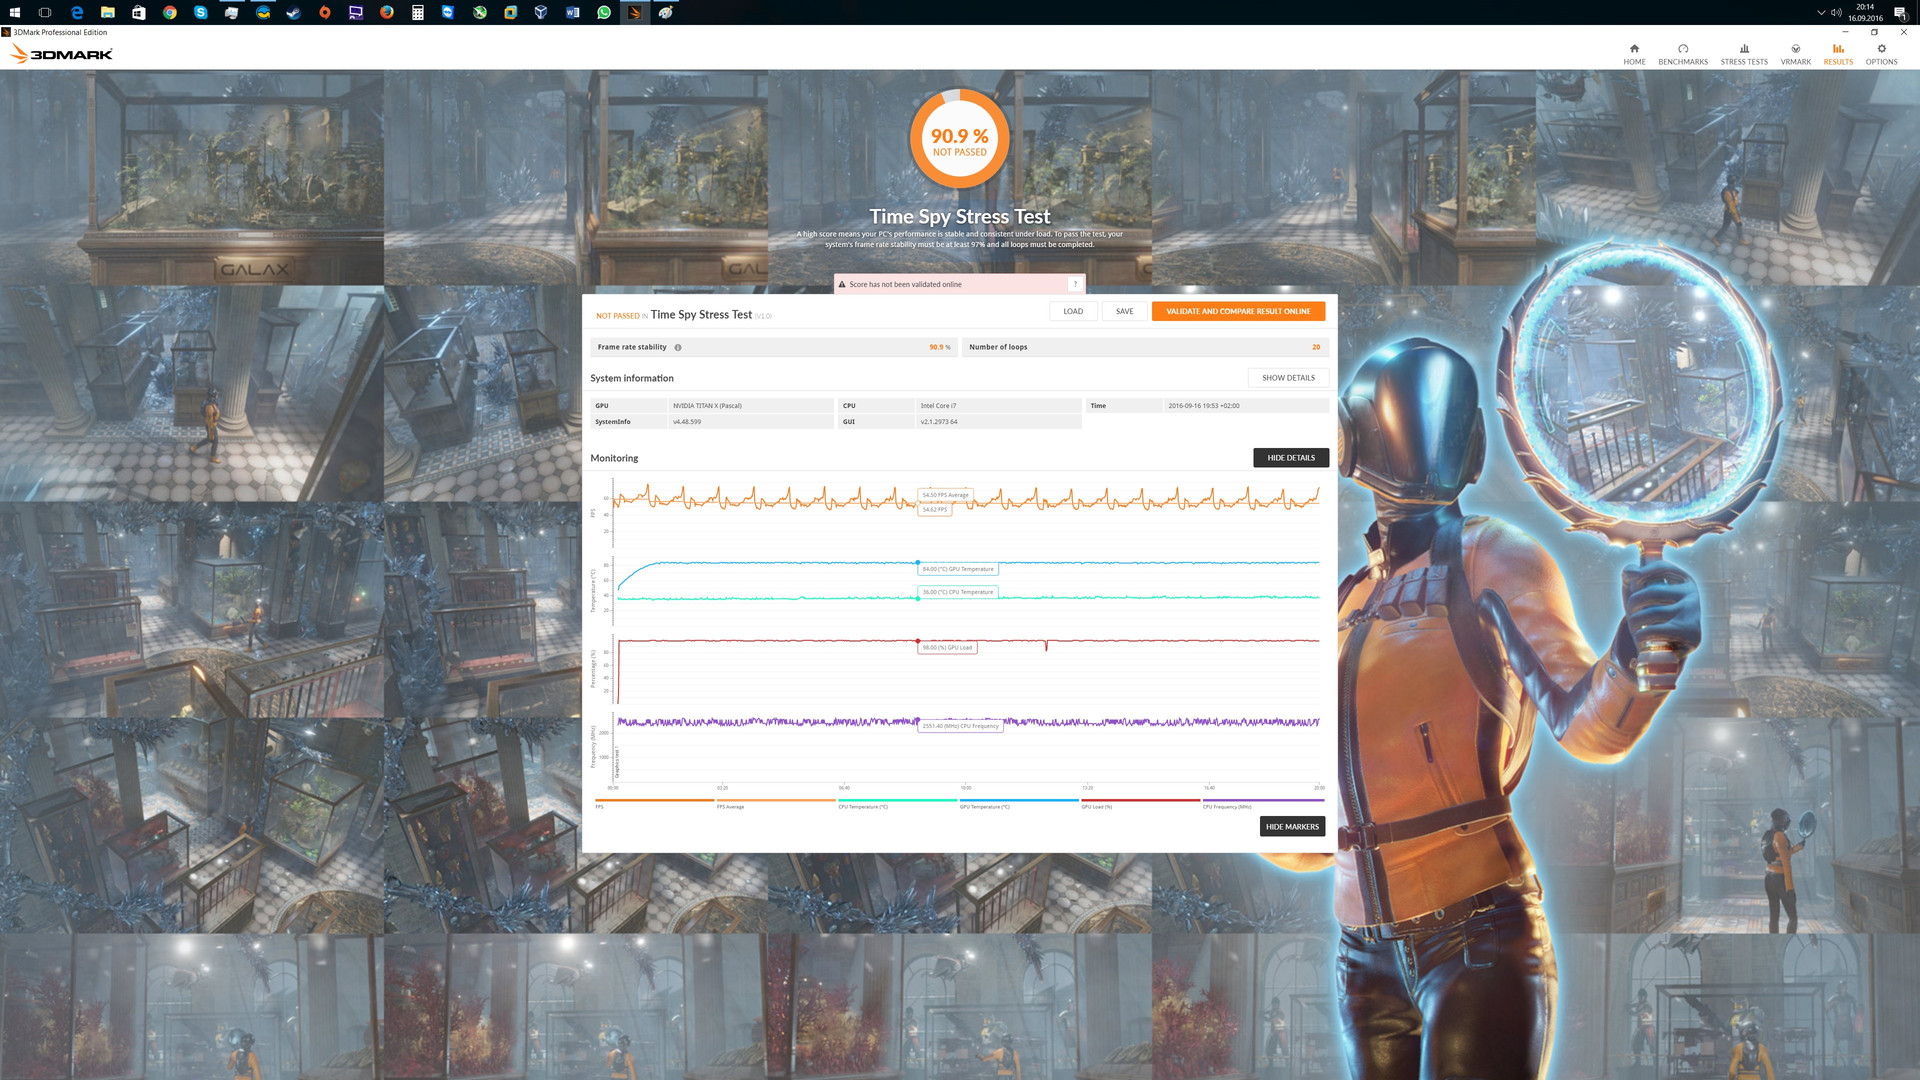
Let us turn to the aspects of stress test and performance under prolonged load. We used the program FurMark, which demands everything from the GPU with the manual settings 4K and 8x MSAA. We have increased the "Temperature Target" to 90 °C (~194 °F) for this test. The Titan X reaches a very high 1835 MHz directly after the start. After a short time the frequency hovers at 1733 MHz. Consequently, the memory clock of the Titan X remains at 5005 MHz (effectively 10010 MHz). In the stress tests we have run (“Time Spy” and “Sky Diver”), which are included in Futuremark 3DMark, our test sample achieved 90.9% and 97.3%, respectively. So far, all tests were carried out with the standard cooler and keeping the default rotation speed setting of "auto". Hence, the performance loss falls slightly under prolonged GPU stress with the standard cooler. Due to Titan X's enormous performance, this small difference can be measured, but is not noticeable.
Sky Diver Stress test (97,7%) Time Spy Stress test (90,9%) If you only consider the technical specifications and the results of the Titan X in gaming benchmarks, you might suspect that it would also be more than sufficient for professional use. However, the significantly more expensive Quadro cards from Nvidia are out of reach for the consumer card. Unfortunately, the Titan X lacks the driver support of the Quadro GPUs.
The Titan X can clearly show its strengths in LuxMark and ComputeMark. In the LuxMark benchmark, only the SLI combination from two Nvidia GeForce GTX 980 can beat the currently fastest desktop graphics card into the second place. Currently, no other graphics card can keep up with the Titan in single GPU operation. It is as much as 40% faster than the Nvidia GeForce GTX 1080 Founder's Edition .
NVIDIA GeForce GTX 980 SLI (Laptop) MSI GT80S 6QF, Intel Core i7-6820HK NVIDIA Titan X Pascal Nvidia Titan X (Pascal), Intel Xeon E5-2680 v4 NVIDIA GeForce GTX 980 TiAsus Strix GTX 980 Ti Desktop PC, Intel Core i7-4790K NVIDIA GeForce GTX 1070 (Desktop) Nvidia GeForce GTX 1070 Founders Edition, Intel Core i7-4790K NVIDIA GeForce GTX 1080 (Desktop) Nvidia GeForce GTX 1080 Founders Edition, Intel Core i7-4790K NVIDIA GeForce GTX 980 (Laptop) Eurocom Sky DLX7, Intel Core i7-6700K AMD Radeon R9 FuryXFX Radeon R9 Fury Pro, Intel Core i7-4790K NVIDIA GeForce GTX 980M DogHouse Systems Mobius SS, Intel Core i7-6700K NVIDIA Titan X Pascal Nvidia Titan X (Pascal), Intel Xeon E5-2680 v4 NVIDIA GeForce GTX 980 SLI (Laptop) MSI GT80S 6QF, Intel Core i7-6820HK NVIDIA GeForce GTX 1070 (Desktop) Nvidia GeForce GTX 1070 Founders Edition, Intel Core i7-4790K NVIDIA GeForce GTX 1080 (Desktop) Nvidia GeForce GTX 1080 Founders Edition, Intel Core i7-4790K NVIDIA GeForce GTX 980 TiAsus Strix GTX 980 Ti Desktop PC, Intel Core i7-4790K AMD Radeon R9 FuryXFX Radeon R9 Fury Pro, Intel Core i7-4790K NVIDIA GeForce GTX 980 (Laptop) Eurocom Sky DLX7, Intel Core i7-6700K NVIDIA GeForce GTX 980M DogHouse Systems Mobius SS, Intel Core i7-6700K
NVIDIA Titan X Pascal Nvidia Titan X (Pascal), Intel Xeon E5-2680 v4 NVIDIA GeForce GTX 1080 (Desktop) Nvidia GeForce GTX 1080 Founders Edition, Intel Core i7-4790K NVIDIA GeForce GTX 1070 (Desktop) Nvidia GeForce GTX 1070 Founders Edition, Intel Core i7-4790K NVIDIA GeForce GTX 980 TiAsus Strix GTX 980 Ti Desktop PC, Intel Core i7-4790K NVIDIA GeForce GTX 980 (Laptop) Eurocom Sky DLX7, Intel Core i7-6700K NVIDIA GeForce GTX 980 SLI (Laptop) MSI GT80S 6QF, Intel Core i7-6820HK AMD Radeon R9 FuryXFX Radeon R9 Fury Pro, Intel Core i7-4790K NVIDIA GeForce GTX 980M DogHouse Systems Mobius SS, Intel Core i7-6700K NVIDIA Titan X Pascal Nvidia Titan X (Pascal), Intel Xeon E5-2680 v4 NVIDIA GeForce GTX 1080 (Desktop) Nvidia GeForce GTX 1080 Founders Edition, Intel Core i7-4790K AMD Radeon R9 FuryXFX Radeon R9 Fury Pro, Intel Core i7-4790K NVIDIA GeForce GTX 1070 (Desktop) Nvidia GeForce GTX 1070 Founders Edition, Intel Core i7-4790K NVIDIA GeForce GTX 980 TiAsus Strix GTX 980 Ti Desktop PC, Intel Core i7-4790K NVIDIA GeForce GTX 980 (Laptop) Eurocom Sky DLX7, Intel Core i7-6700K NVIDIA GeForce GTX 980 SLI (Laptop) MSI GT80S 6QF, Intel Core i7-6820HK NVIDIA GeForce GTX 980M DogHouse Systems Mobius SS, Intel Core i7-6700K NVIDIA Titan X Pascal Nvidia Titan X (Pascal), Intel Xeon E5-2680 v4 NVIDIA GeForce GTX 1080 (Desktop) Nvidia GeForce GTX 1080 Founders Edition, Intel Core i7-4790K NVIDIA GeForce GTX 1070 (Desktop) Nvidia GeForce GTX 1070 Founders Edition, Intel Core i7-4790K AMD Radeon R9 FuryXFX Radeon R9 Fury Pro, Intel Core i7-4790K NVIDIA GeForce GTX 980 TiAsus Strix GTX 980 Ti Desktop PC, Intel Core i7-4790K NVIDIA GeForce GTX 980 (Laptop) Eurocom Sky DLX7, Intel Core i7-6700K NVIDIA GeForce GTX 980 SLI (Laptop) MSI GT80S 6QF, Intel Core i7-6820HK NVIDIA GeForce GTX 980M DogHouse Systems Mobius SS, Intel Core i7-6700K NVIDIA Titan X Pascal Nvidia Titan X (Pascal), Intel Xeon E5-2680 v4 NVIDIA GeForce GTX 1080 (Desktop) Nvidia GeForce GTX 1080 Founders Edition, Intel Core i7-4790K NVIDIA GeForce GTX 1070 (Desktop) Nvidia GeForce GTX 1070 Founders Edition, Intel Core i7-4790K NVIDIA GeForce GTX 980 TiAsus Strix GTX 980 Ti Desktop PC, Intel Core i7-4790K AMD Radeon R9 FuryXFX Radeon R9 Fury Pro, Intel Core i7-4790K NVIDIA GeForce GTX 980 (Laptop) Eurocom Sky DLX7, Intel Core i7-6700K NVIDIA GeForce GTX 980 SLI (Laptop) MSI GT80S 6QF, Intel Core i7-6820HK NVIDIA GeForce GTX 980M DogHouse Systems Mobius SS, Intel Core i7-6700K NVIDIA Titan X Pascal Nvidia Titan X (Pascal), Intel Xeon E5-2680 v4 AMD Radeon R9 FuryXFX Radeon R9 Fury Pro, Intel Core i7-4790K NVIDIA GeForce GTX 1080 (Desktop) Nvidia GeForce GTX 1080 Founders Edition, Intel Core i7-4790K NVIDIA GeForce GTX 980 TiAsus Strix GTX 980 Ti Desktop PC, Intel Core i7-4790K NVIDIA GeForce GTX 1070 (Desktop) Nvidia GeForce GTX 1070 Founders Edition, Intel Core i7-4790K NVIDIA GeForce GTX 980 SLI (Laptop) MSI GT80S 6QF, Intel Core i7-6820HK NVIDIA GeForce GTX 980 (Laptop) Eurocom Sky DLX7, Intel Core i7-6700K NVIDIA GeForce GTX 980M DogHouse Systems Mobius SS, Intel Core i7-6700K NVIDIA Titan X Pascal Nvidia Titan X (Pascal), Intel Xeon E5-2680 v4 NVIDIA GeForce GTX 1080 (Desktop) Nvidia GeForce GTX 1080 Founders Edition, Intel Core i7-4790K NVIDIA GeForce GTX 1070 (Desktop) Nvidia GeForce GTX 1070 Founders Edition, Intel Core i7-4790K NVIDIA GeForce GTX 980 TiAsus Strix GTX 980 Ti Desktop PC, Intel Core i7-4790K AMD Radeon R9 FuryXFX Radeon R9 Fury Pro, Intel Core i7-4790K NVIDIA GeForce GTX 980 (Laptop) Eurocom Sky DLX7, Intel Core i7-6700K NVIDIA GeForce GTX 980 SLI (Laptop) MSI GT80S 6QF, Intel Core i7-6820HK NVIDIA GeForce GTX 980M DogHouse Systems Mobius SS, Intel Core i7-6700K
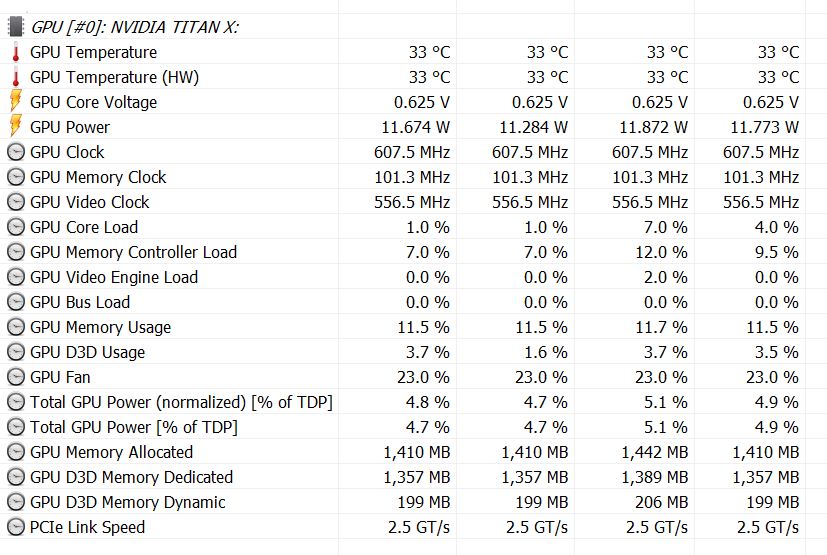
The Nvidia Titan X is not fully convincing in terms of emissions. The radial fan, which sits at the rear part of the graphics card, should blow hot air out of the case under load. This works well enough to largely keep the Boost clock, but the noise is distracting. Nevertheless, the cooler ensures that the performance of the graphics card remains high. The almost 5 minutes long video is supposed to show how the fan behaves when idling, under maximum load and during the stress test (FurMark). All three test scenarios have been recorded with open case and at a distance of about 30 cm (~1 ft). When idling or even during Windows use, the fan rotates at approximately 1100 RPM (26%). Thereby, the card reaches a temperature of 38 °C (~100 °F) and the fan is not audible. When the rotation speed is manually set to 100%, which conforms to 4800 RPM, the Titan X is quite clearly audible and silent working is not possible even when the case is closed. During the stress test, the radial fan could keep the GPU temperature at a constant 86 °C (~187 °F) with a rotation speed of 68% and the card was still clearly audible.
It is a pity that Nvidia only sells the Titan X with this cooler. Partner cards or custom designs might bring other cooling units, which might not limit the performance of the GPU that quickly.
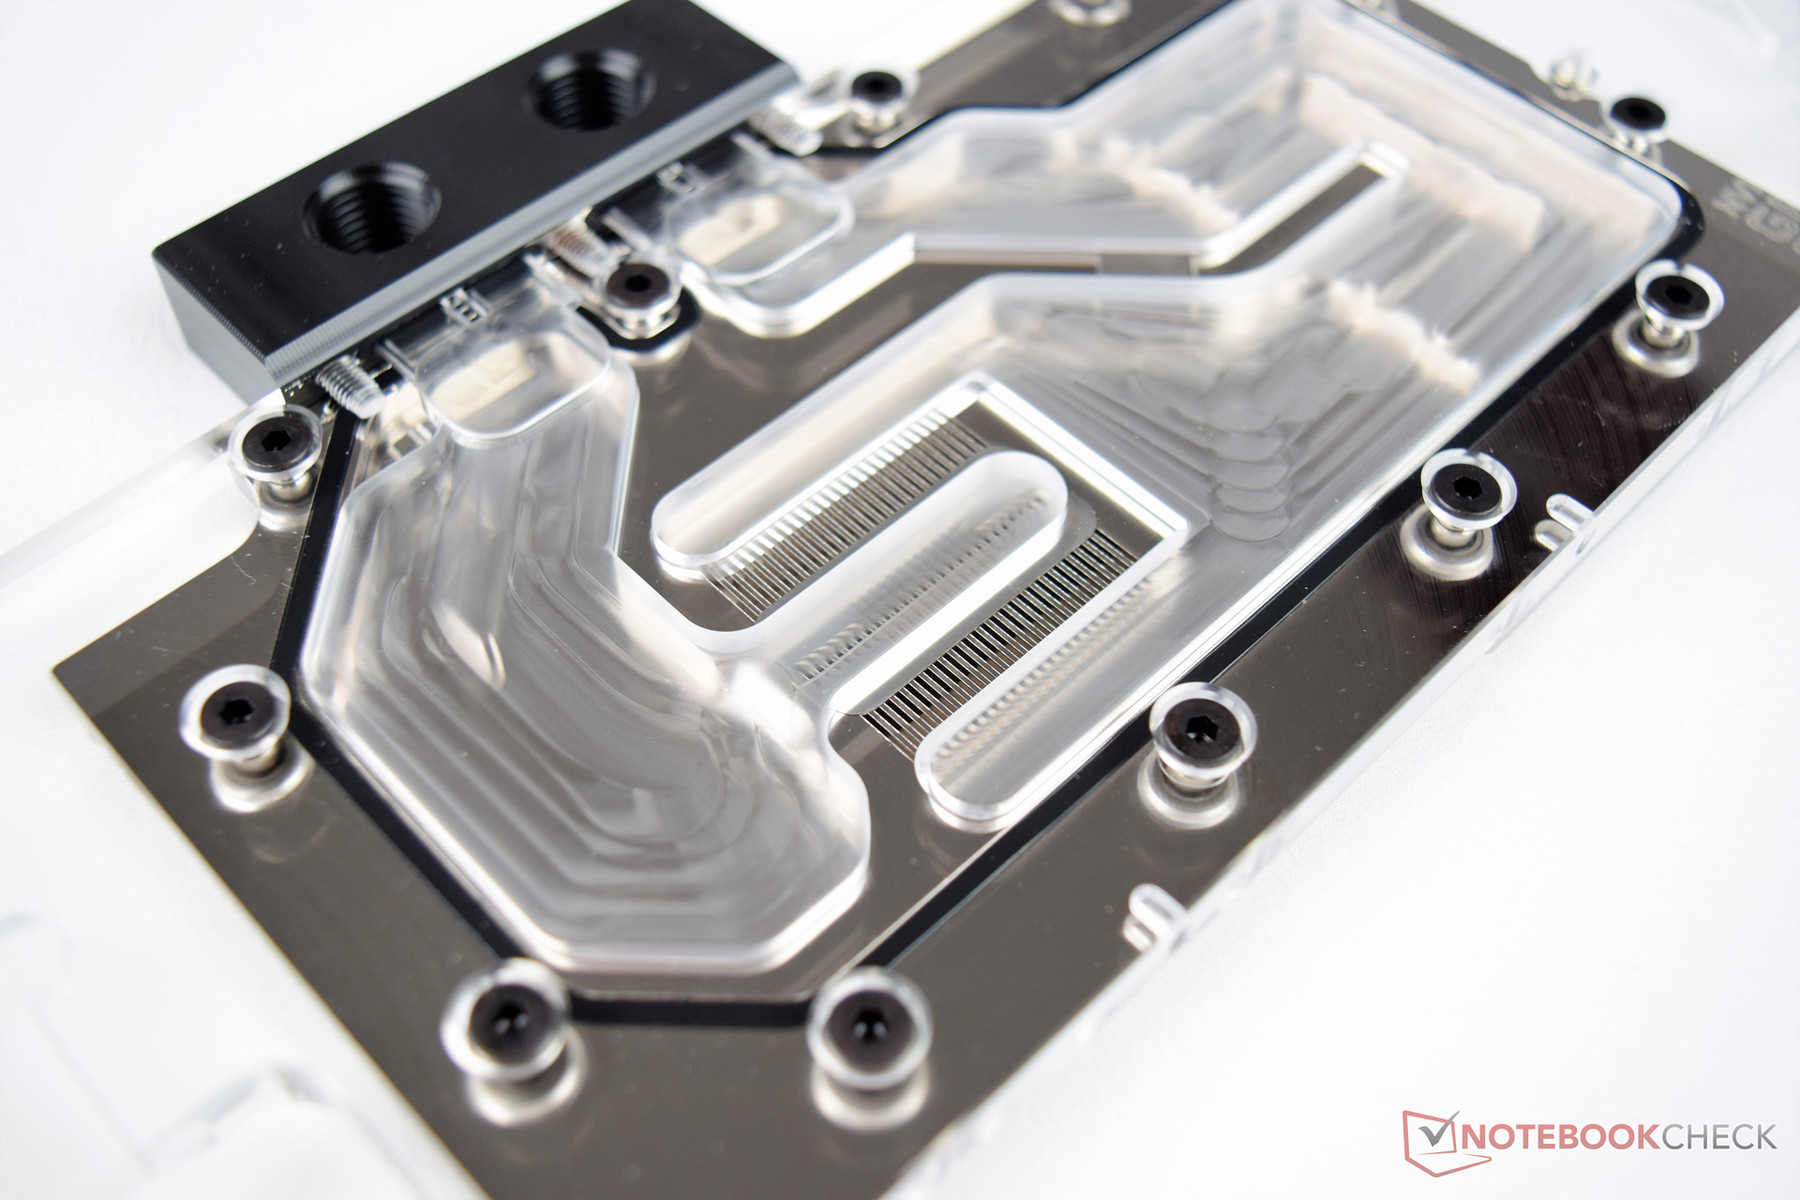
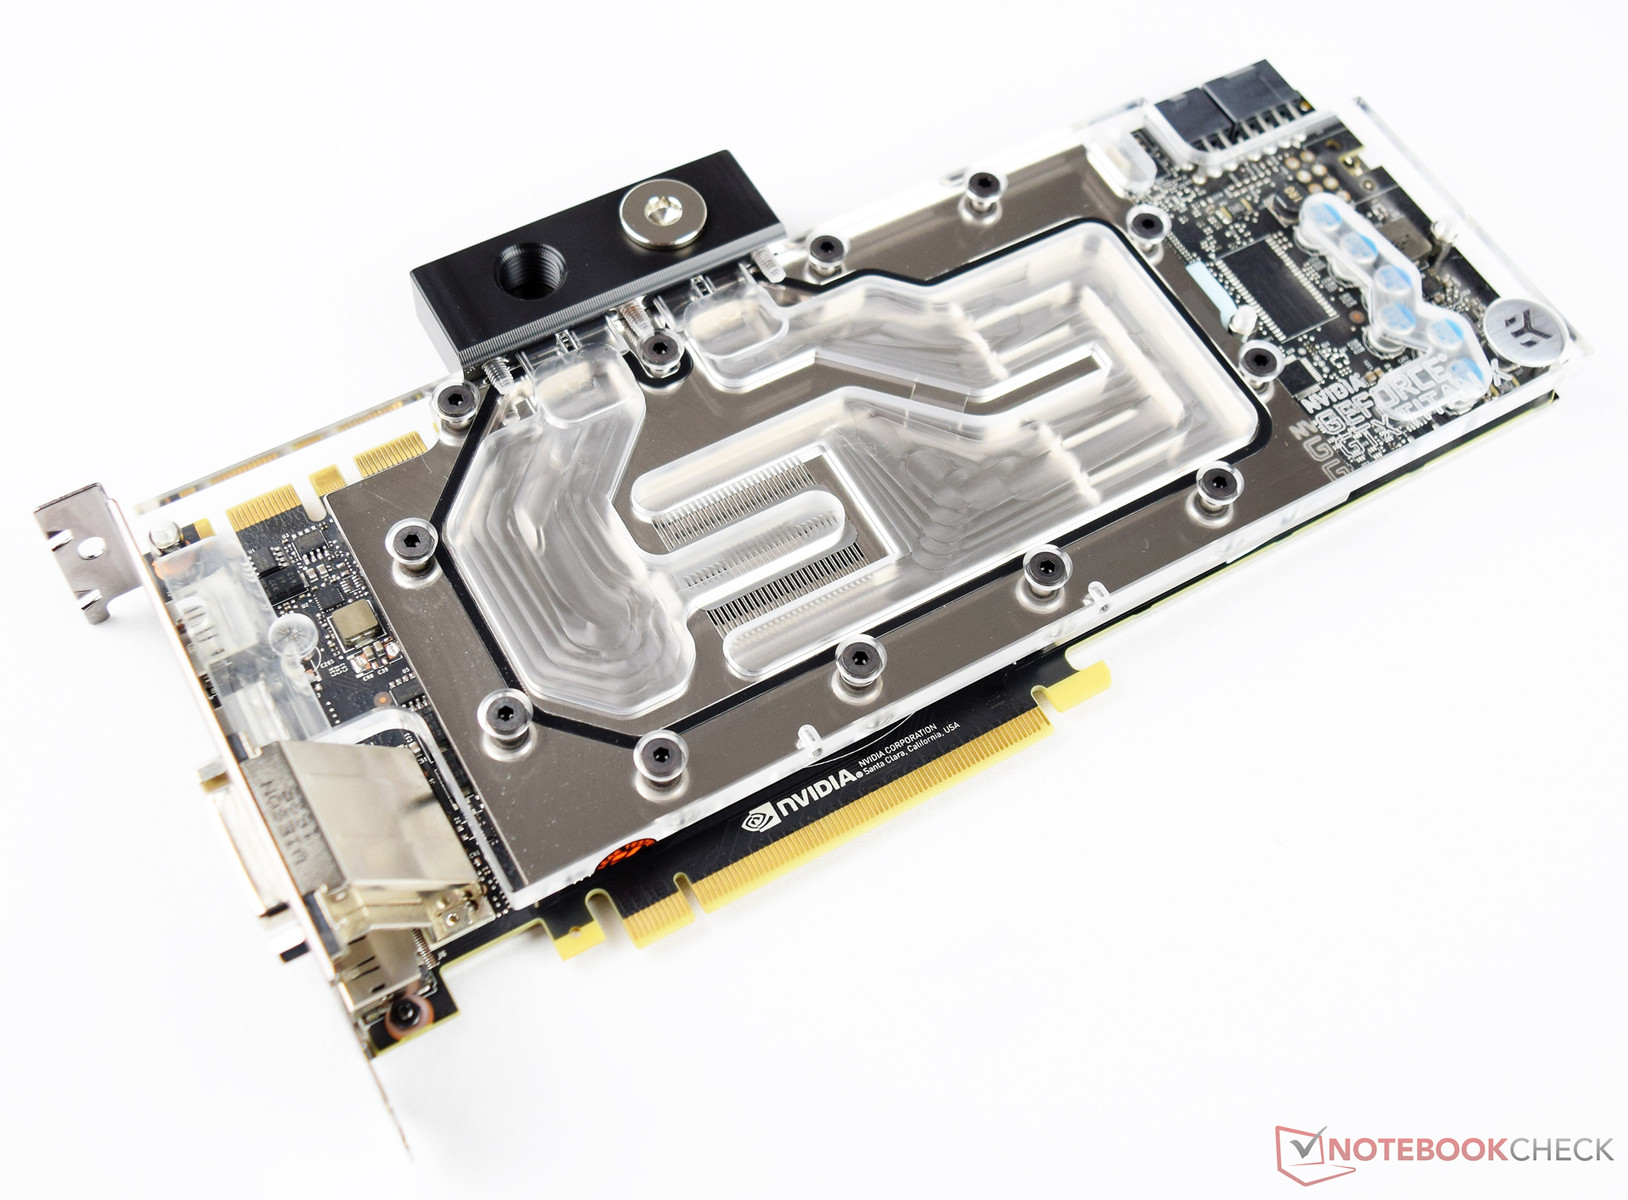
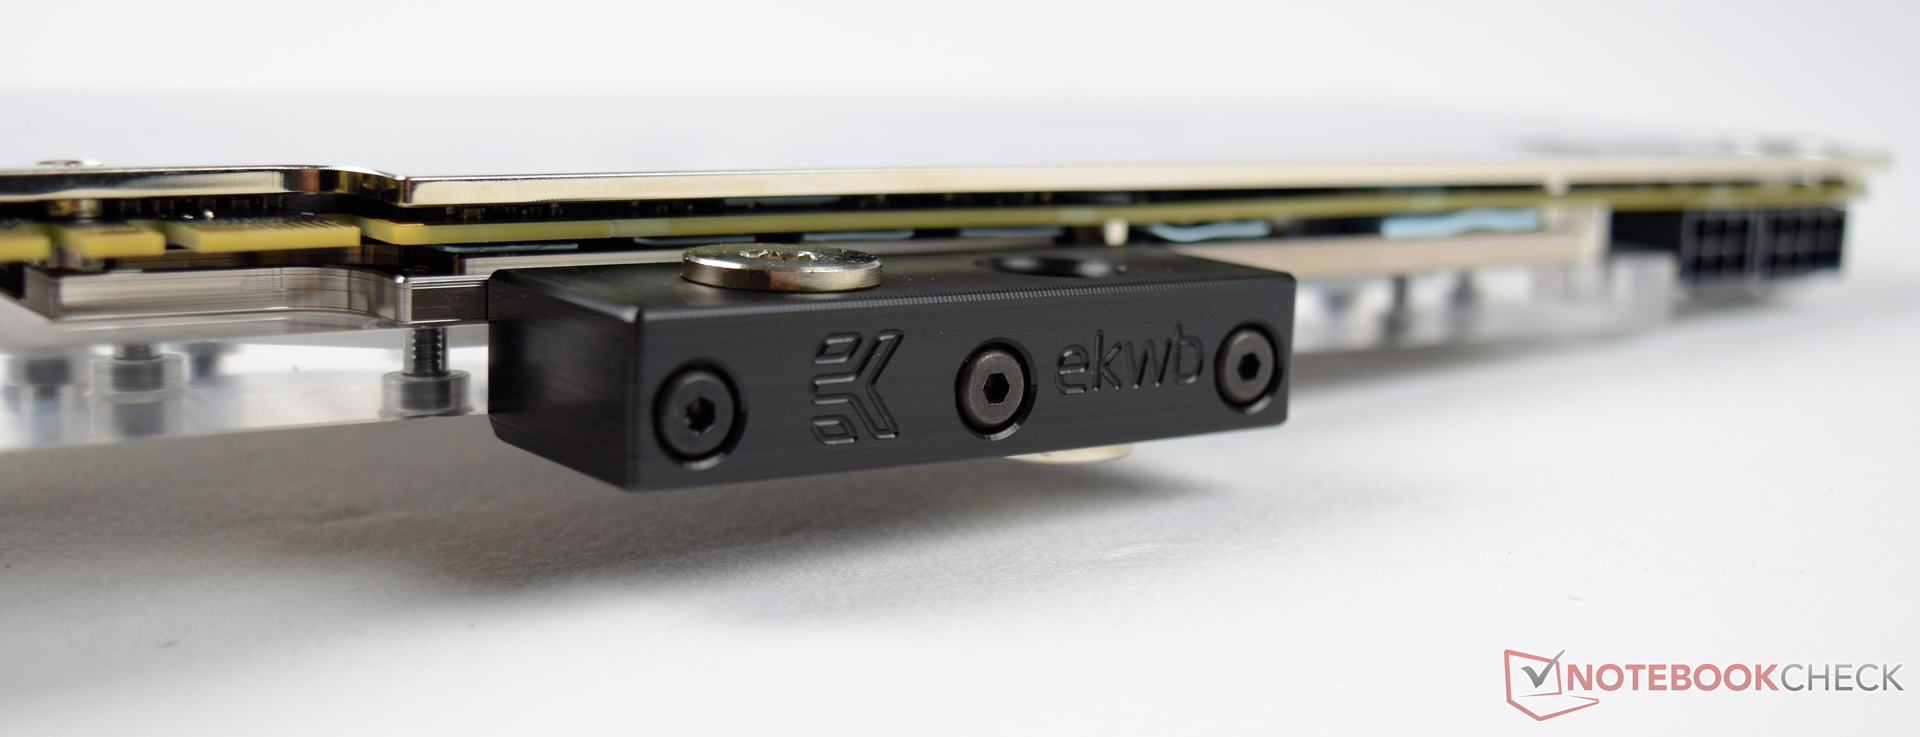
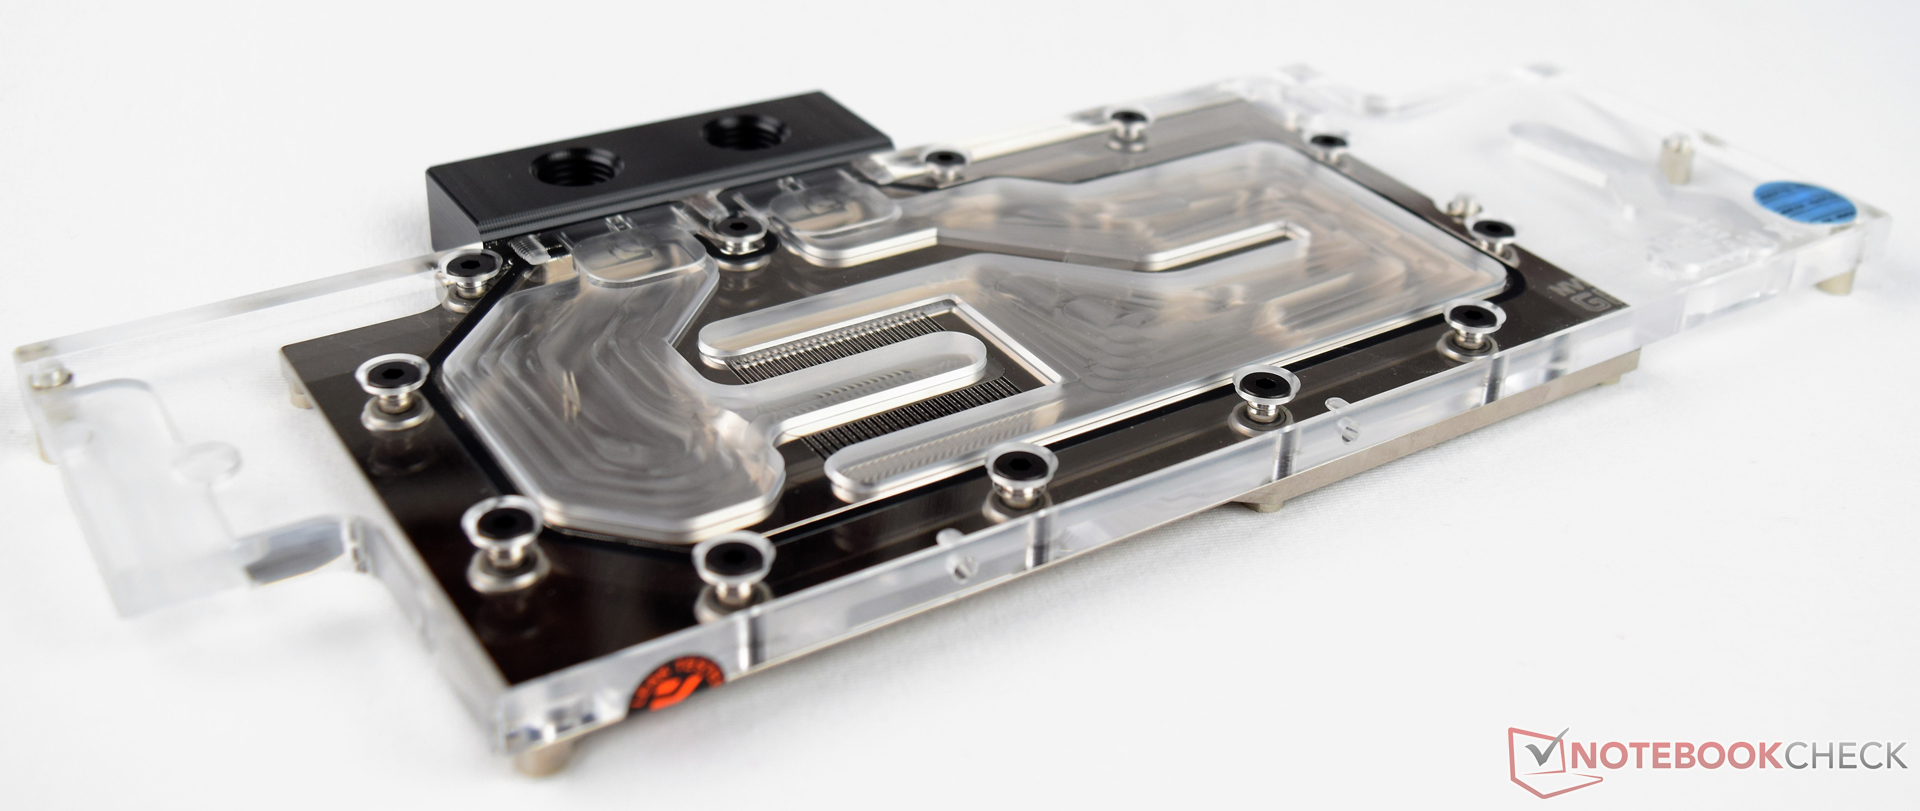
Hence, we recommend using water cooling with the Titan X. Known manufacturers offer compatible models for the Pascal based Titan X. We will explain the advantages and disadvantages here.
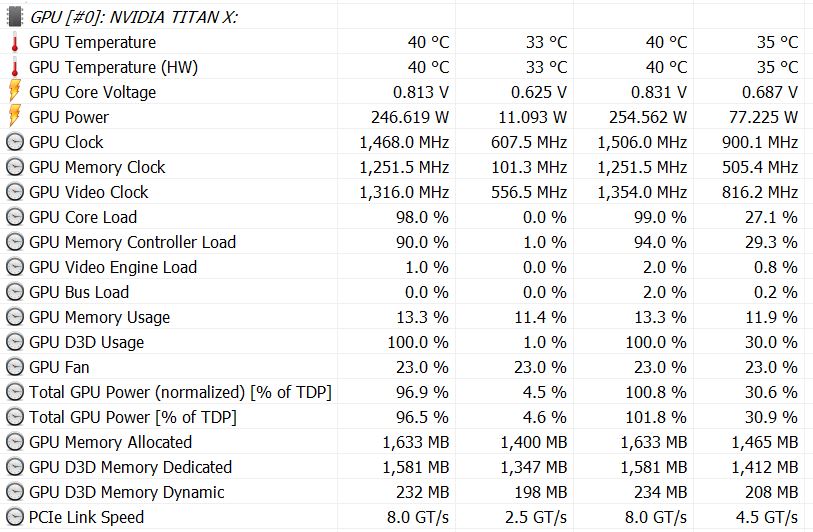
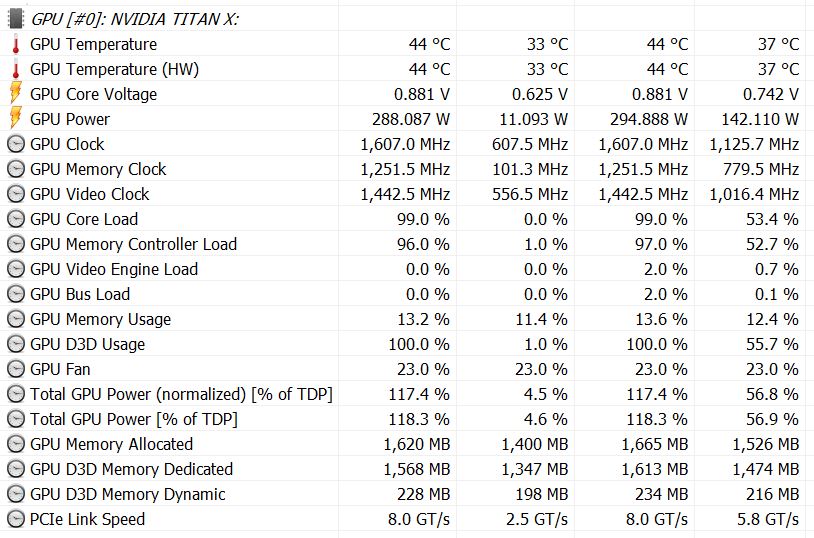
The emissions also include power consumption. The energy demand is about 12 watts in Windows use without load. With an unchanged power target of 100%, the Titan X requires a maximum of 254 watts. When manually changed to 120%, the energy demand is significantly higher and we record a maximum of 295 watts.
Power consumption when idling Power consumption under load (Power Target: 100%) Power consumption under load (Power Target: 120%)
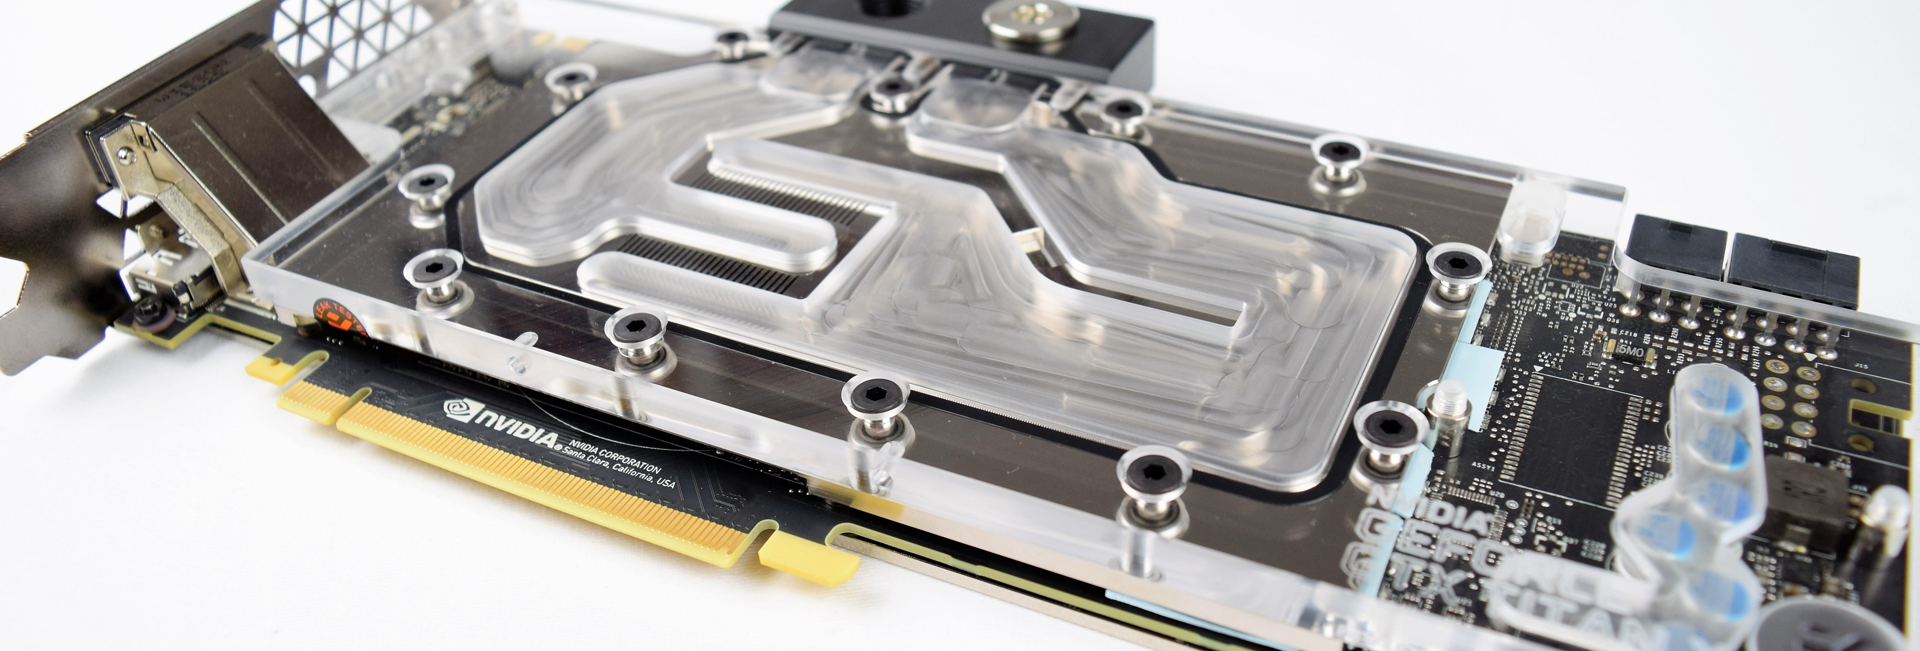
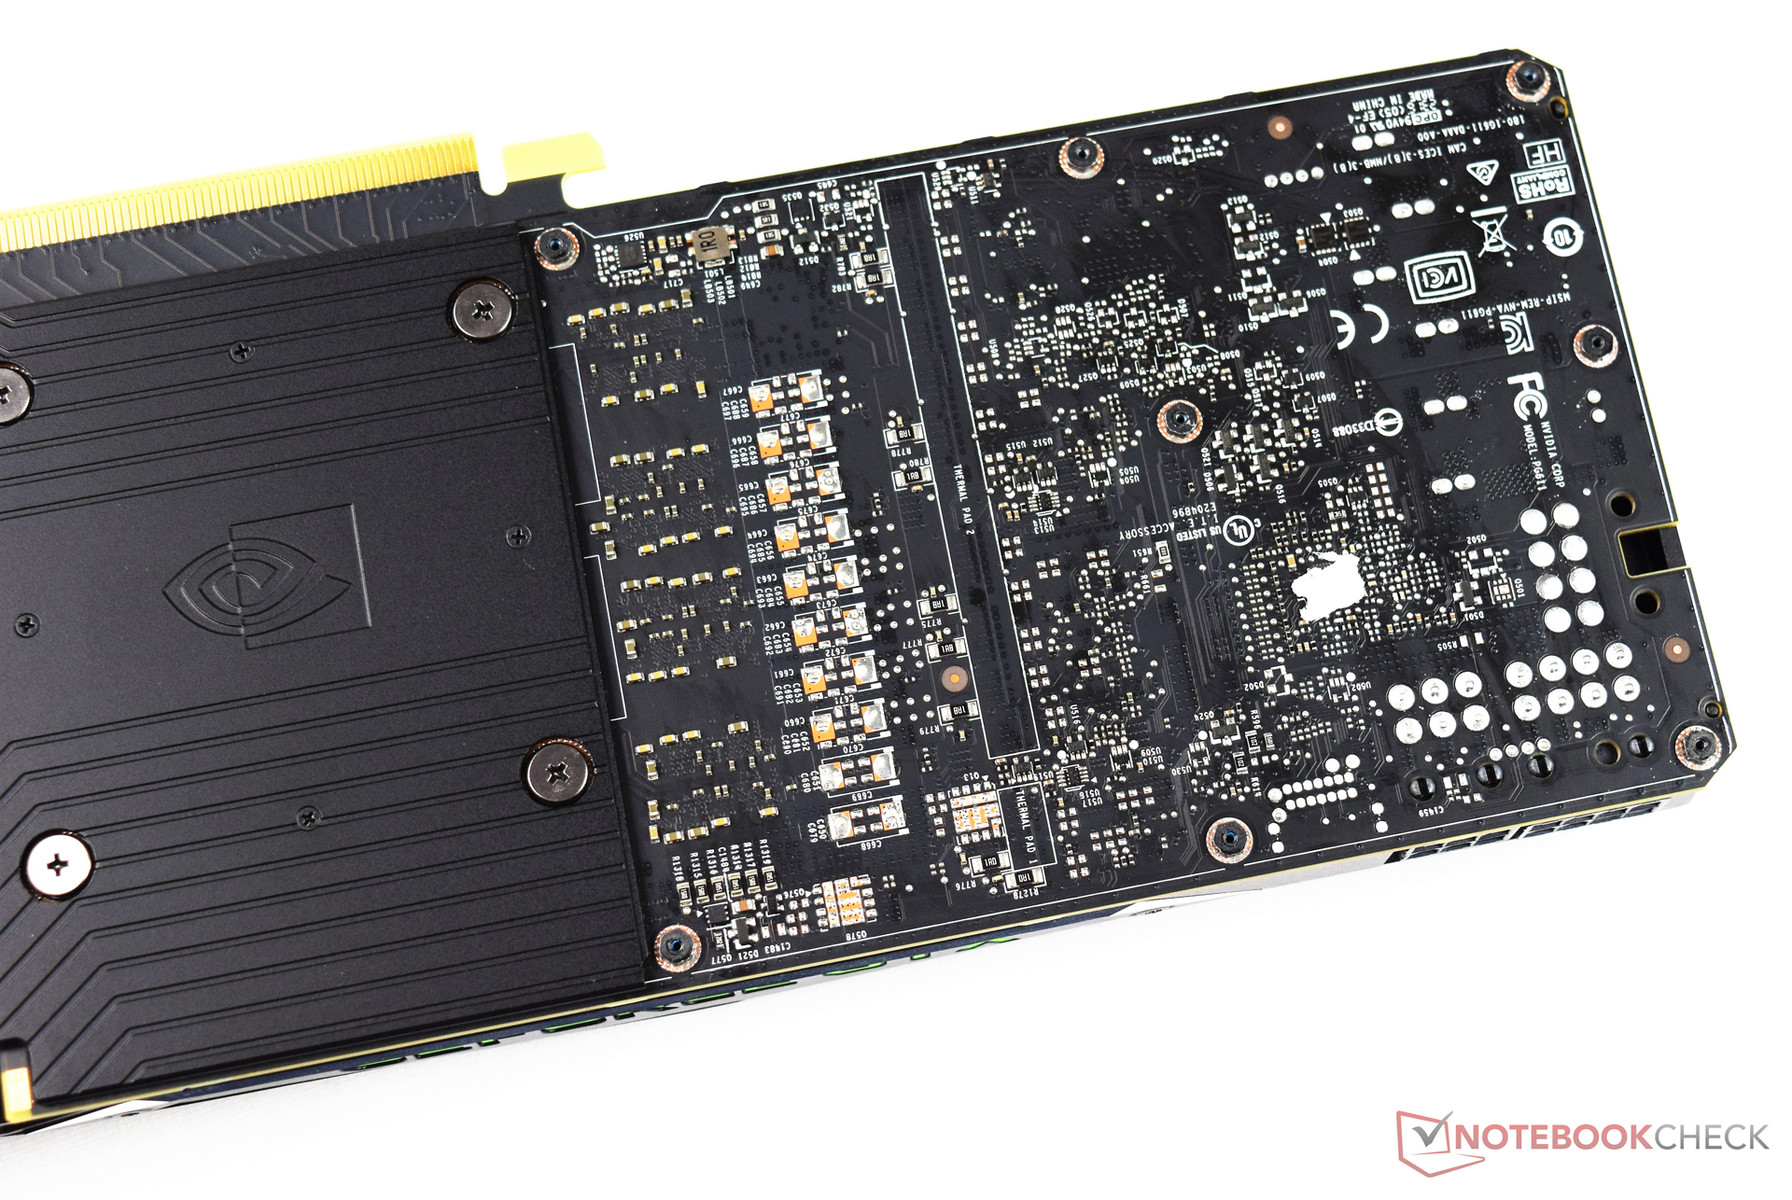
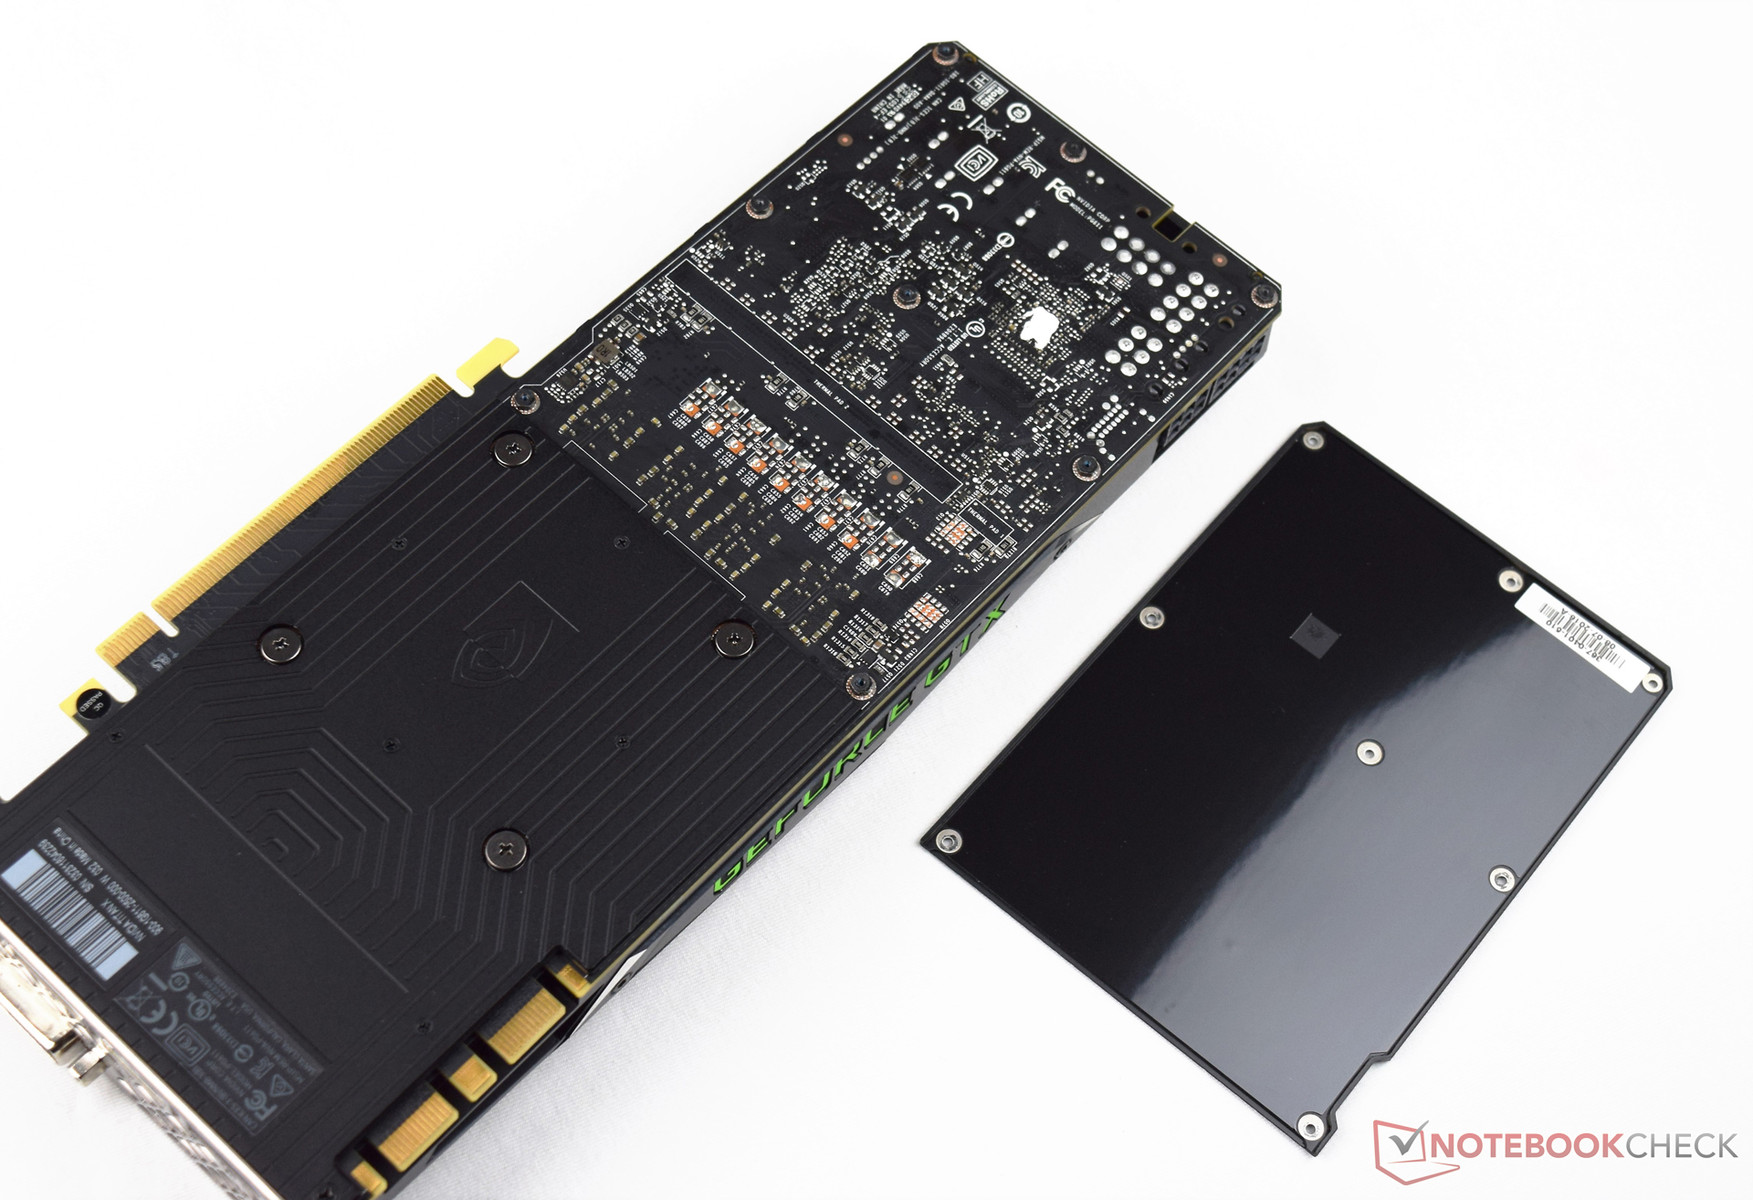
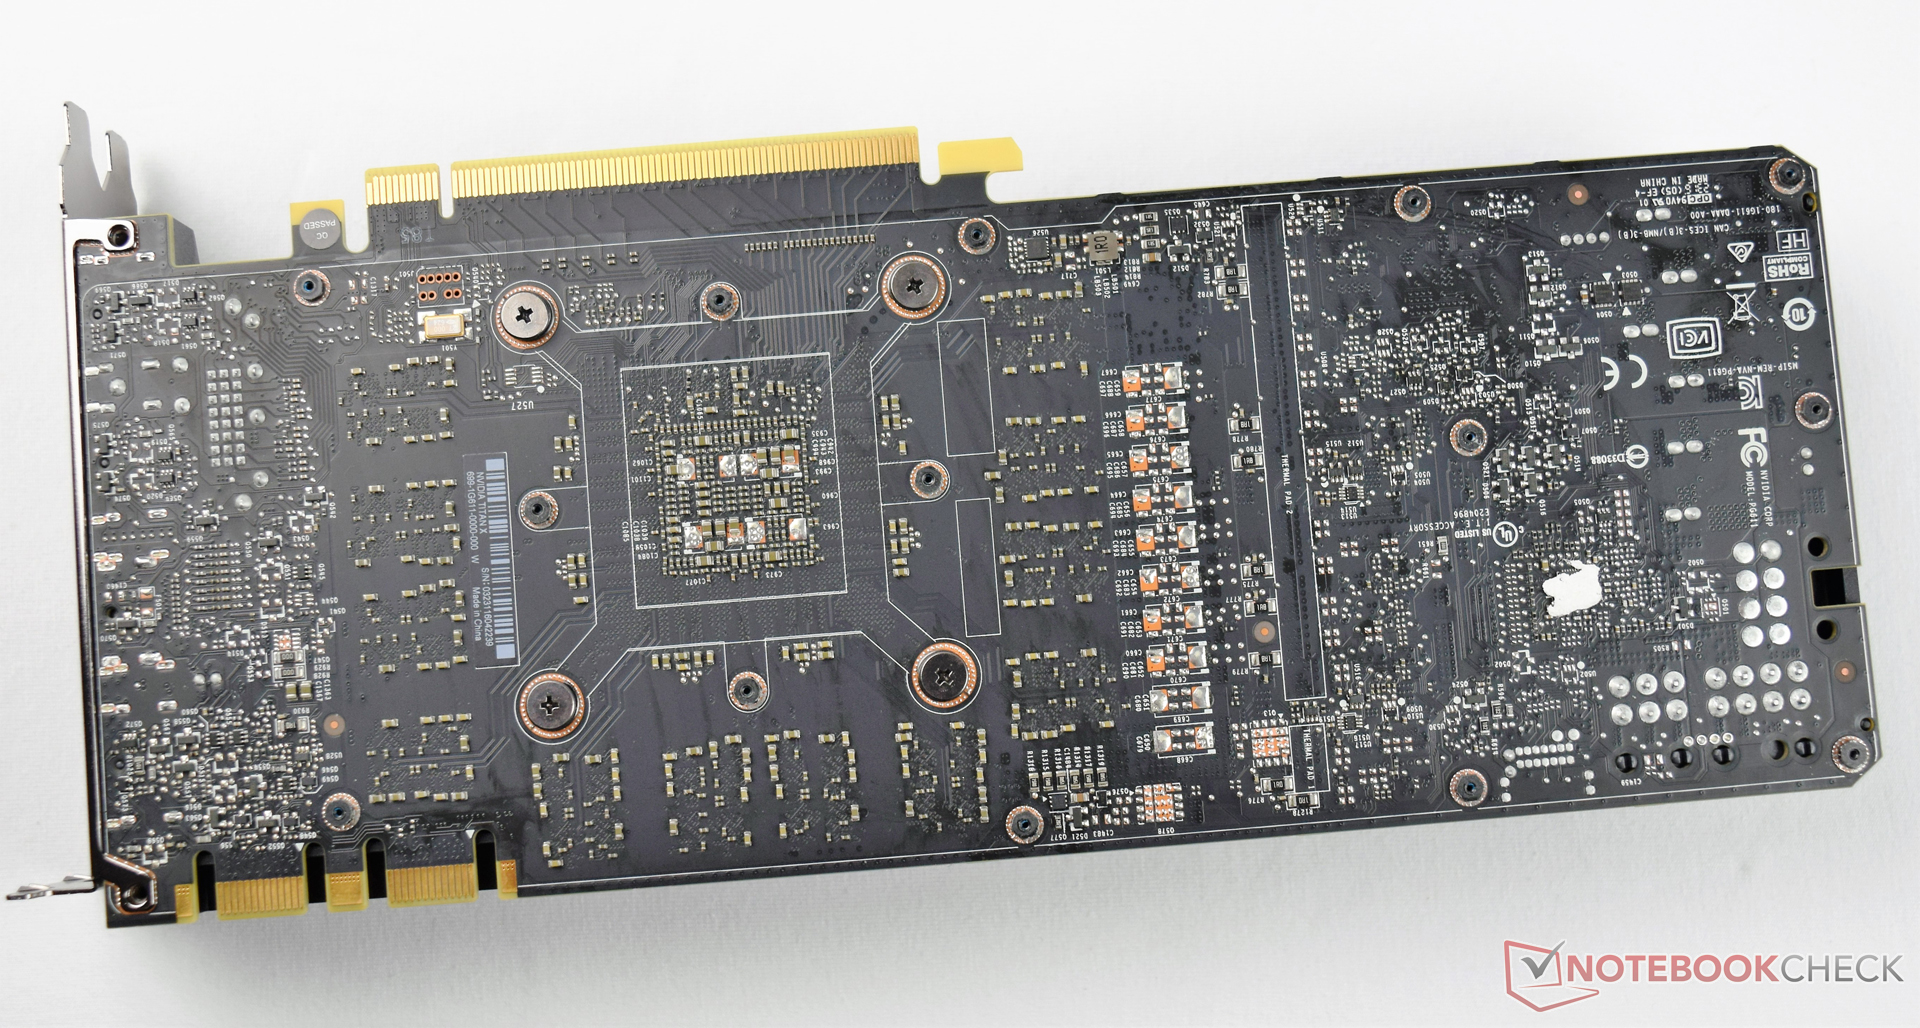
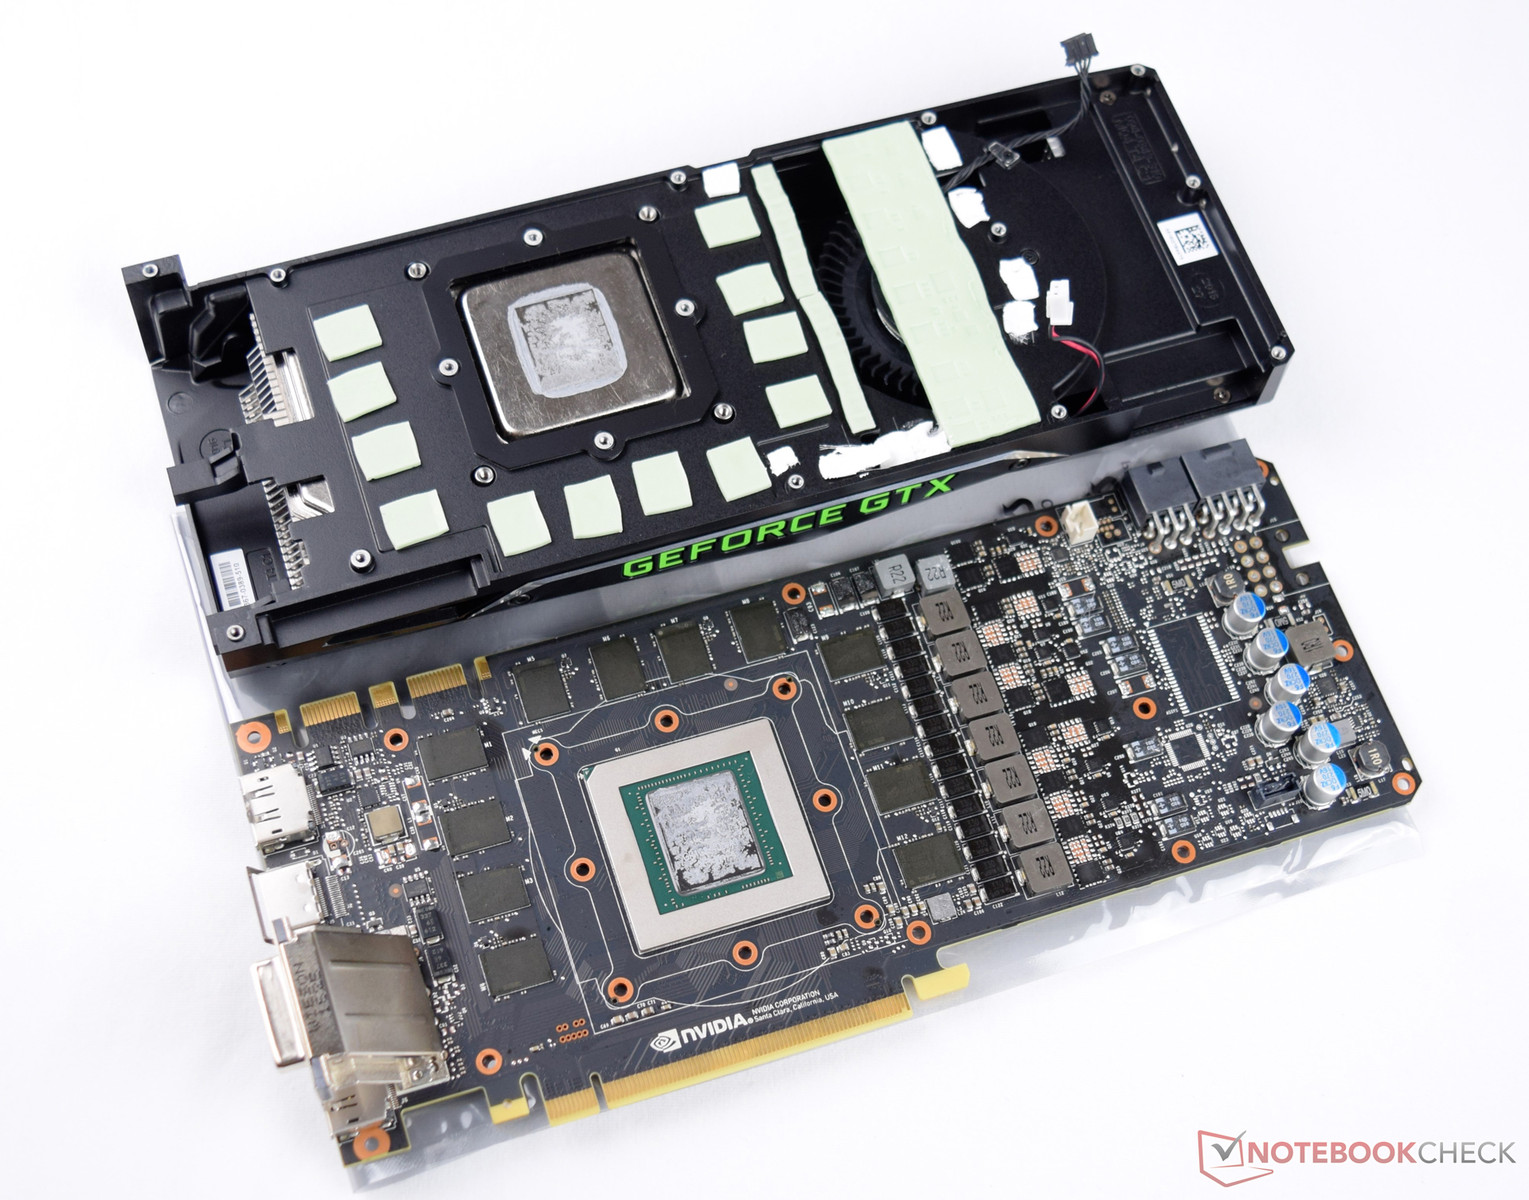
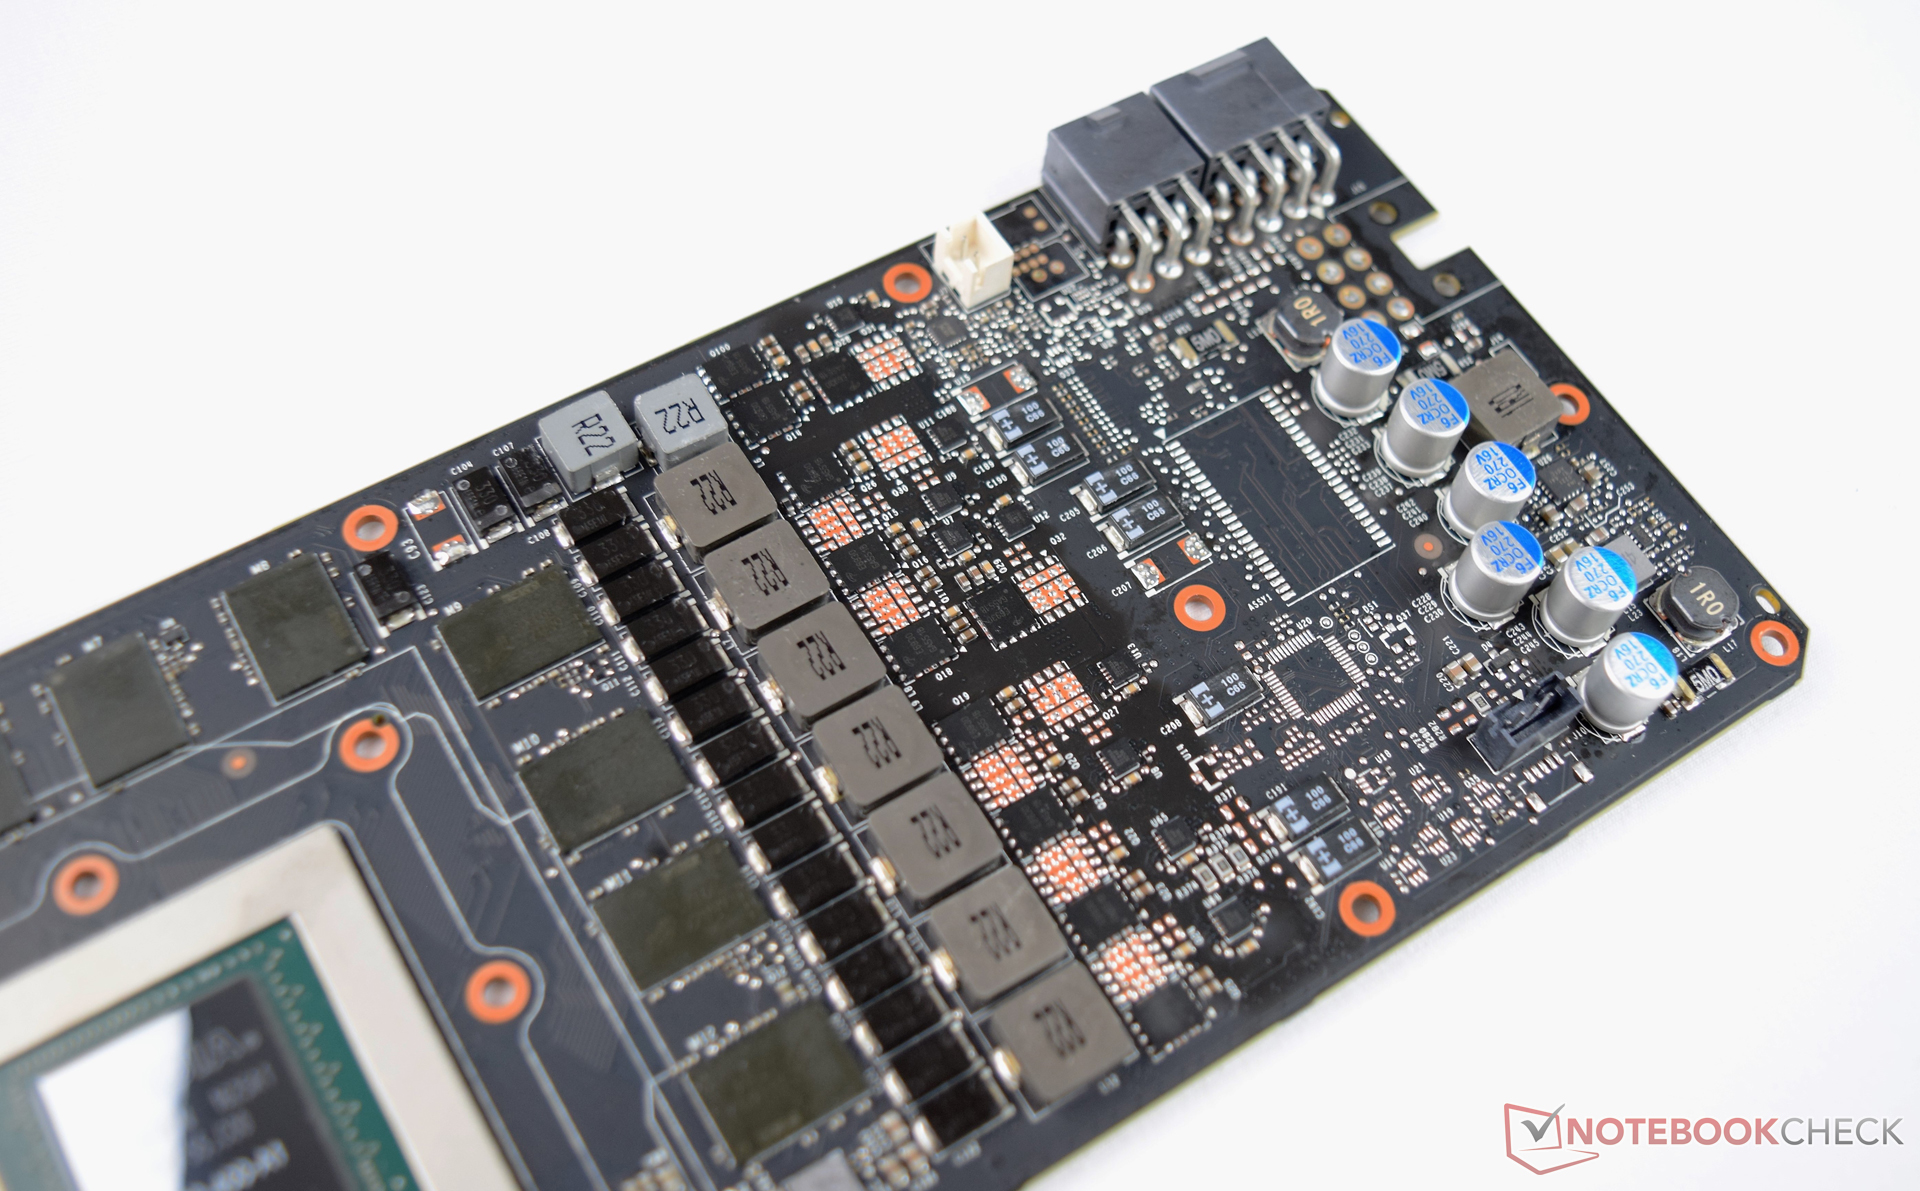
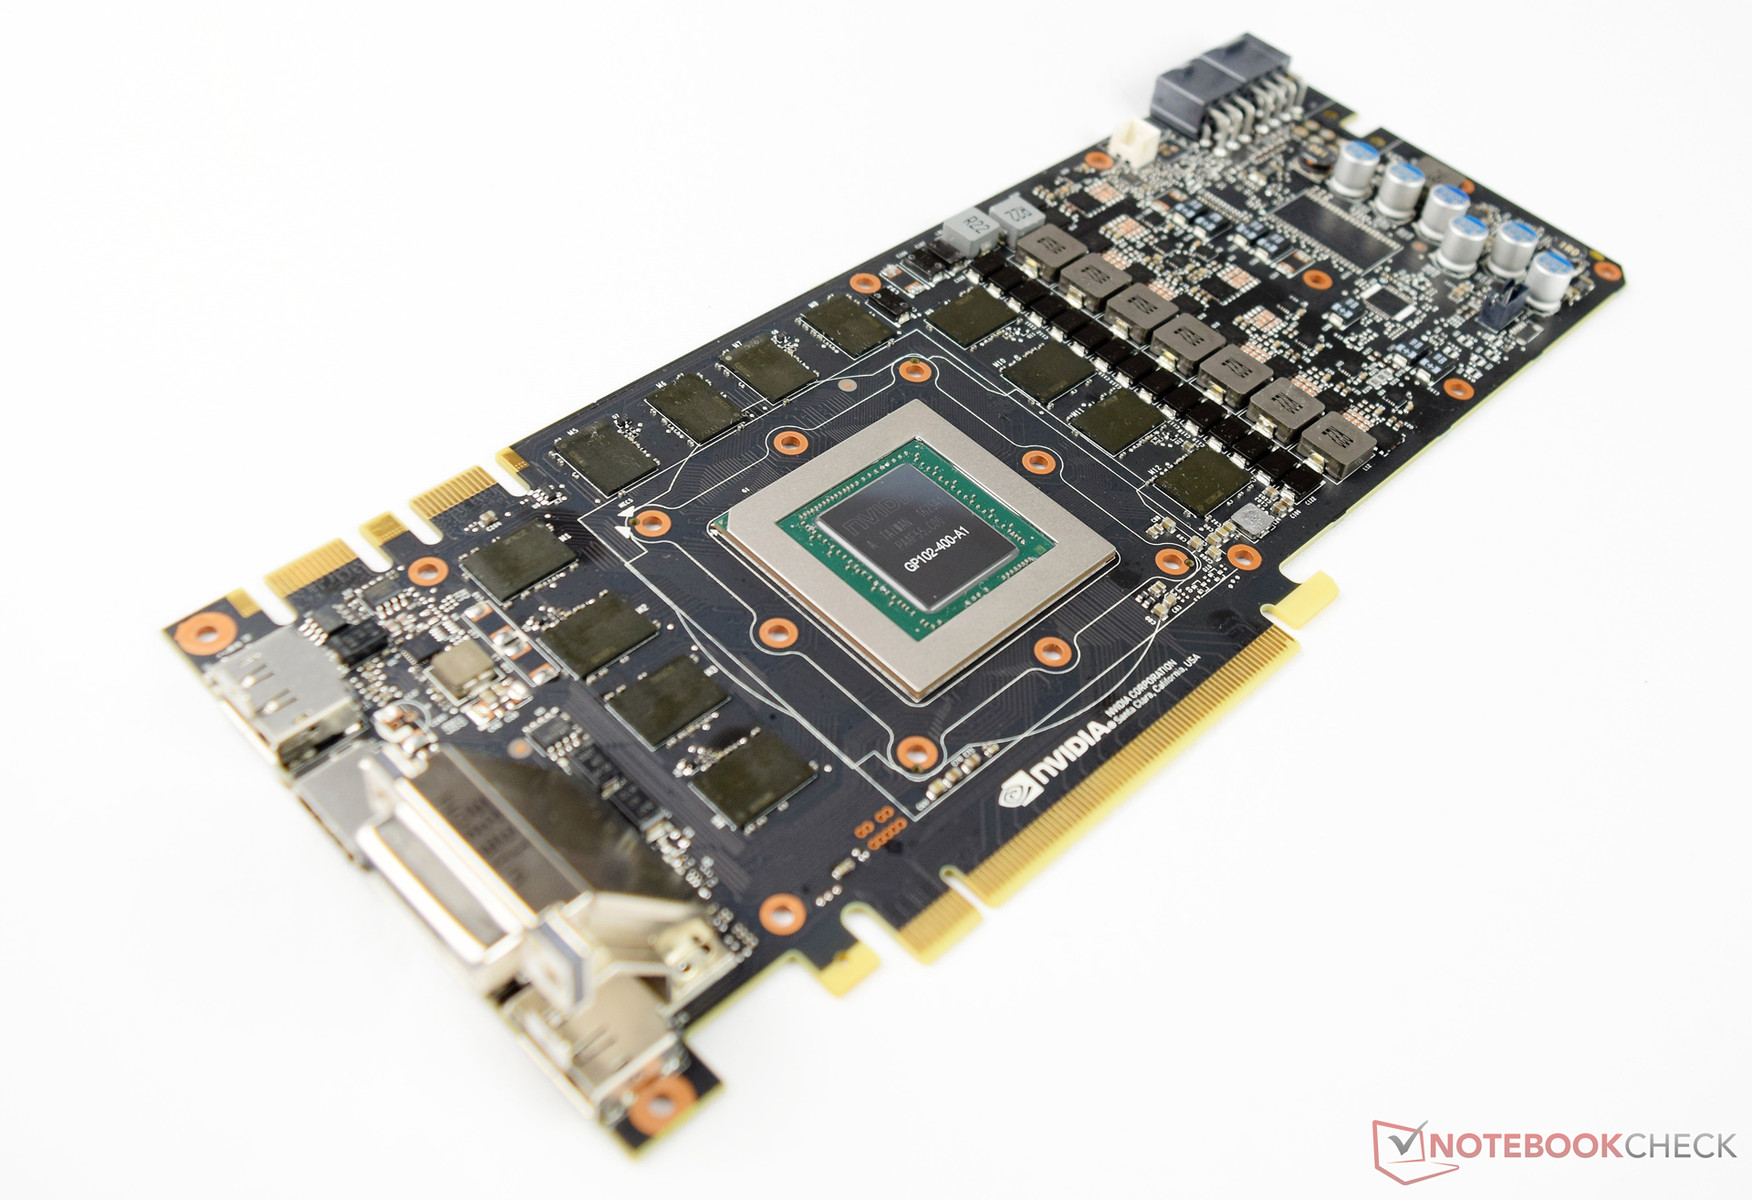
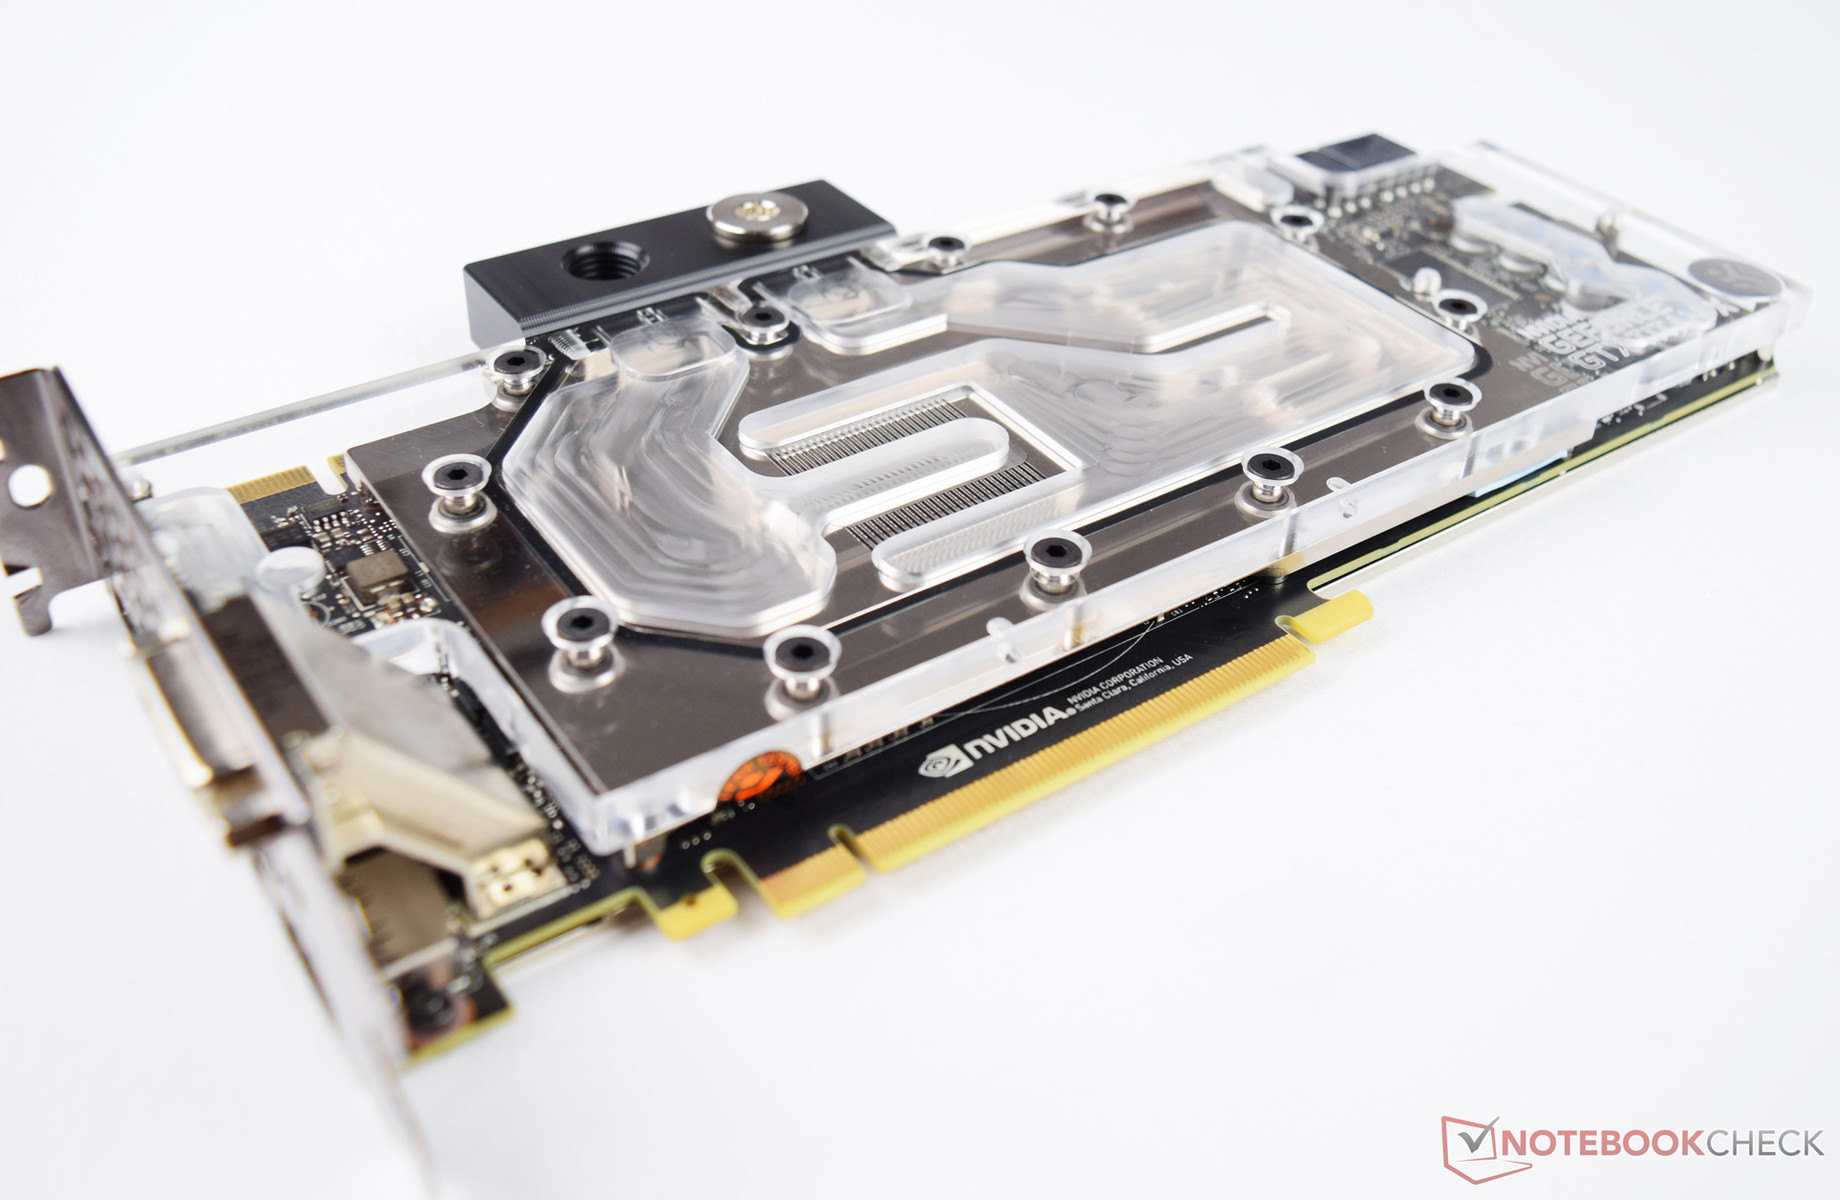
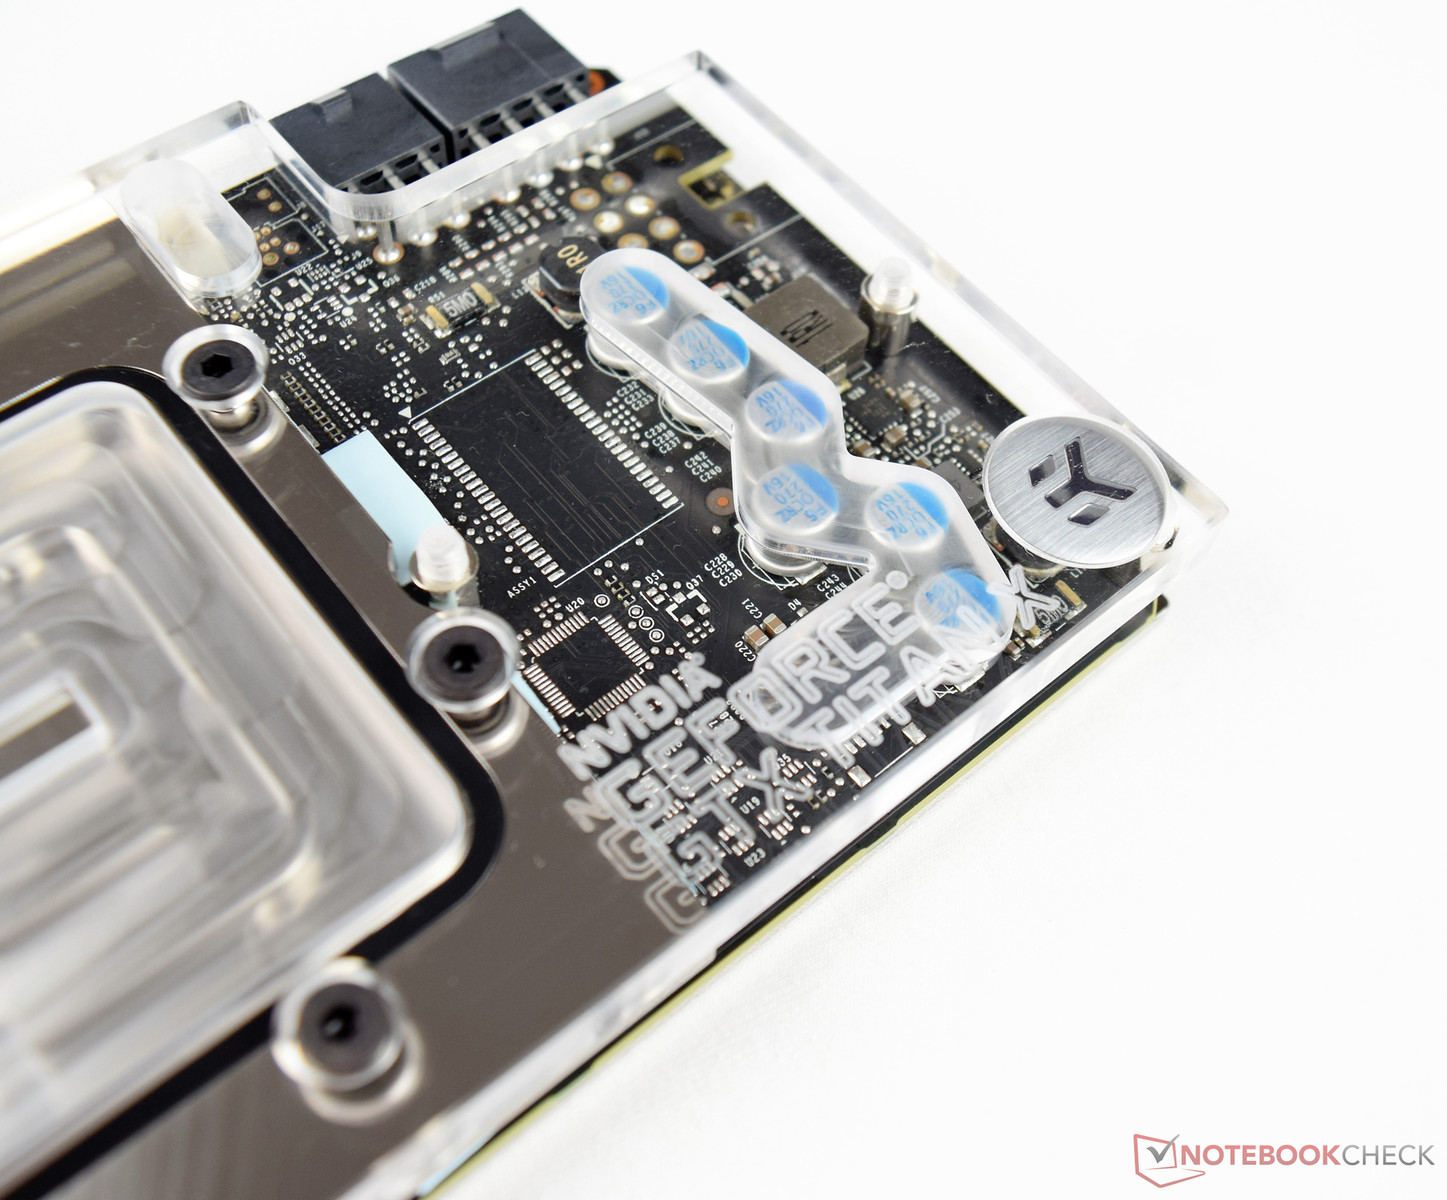
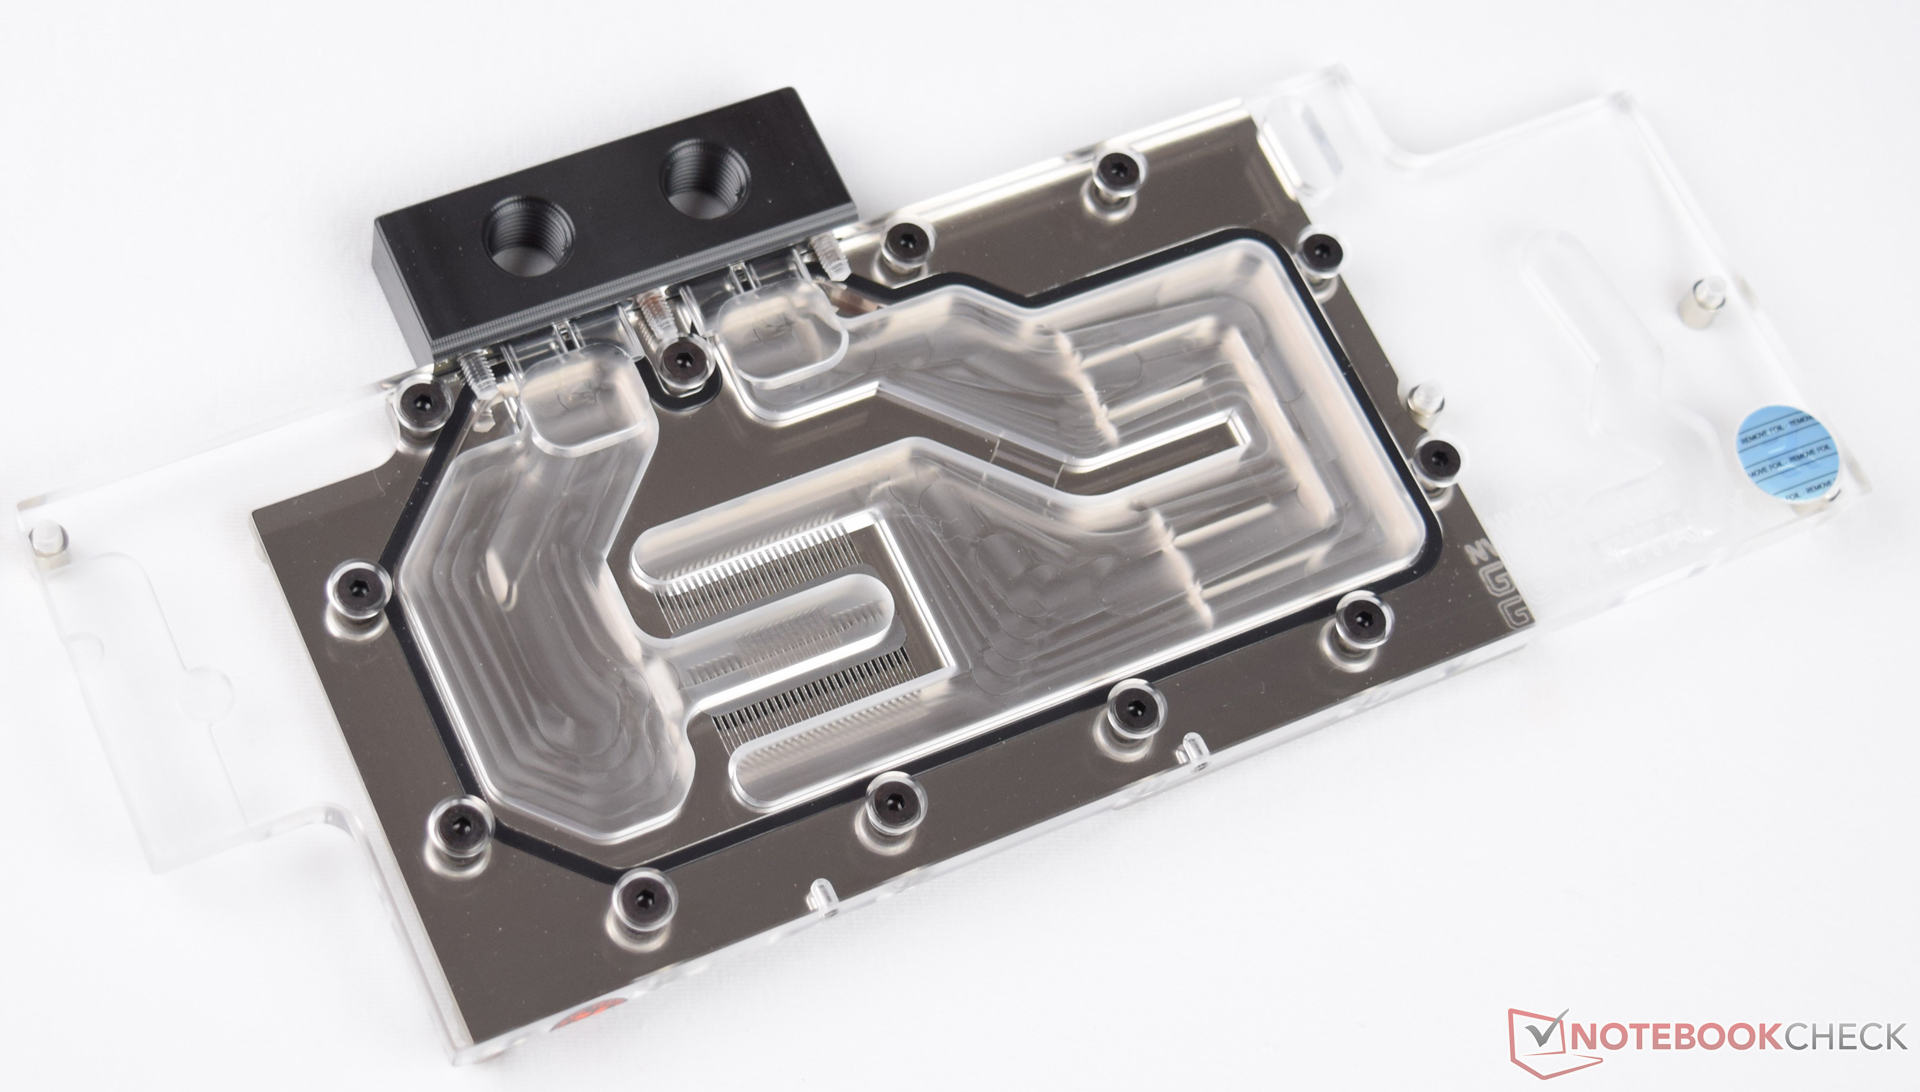
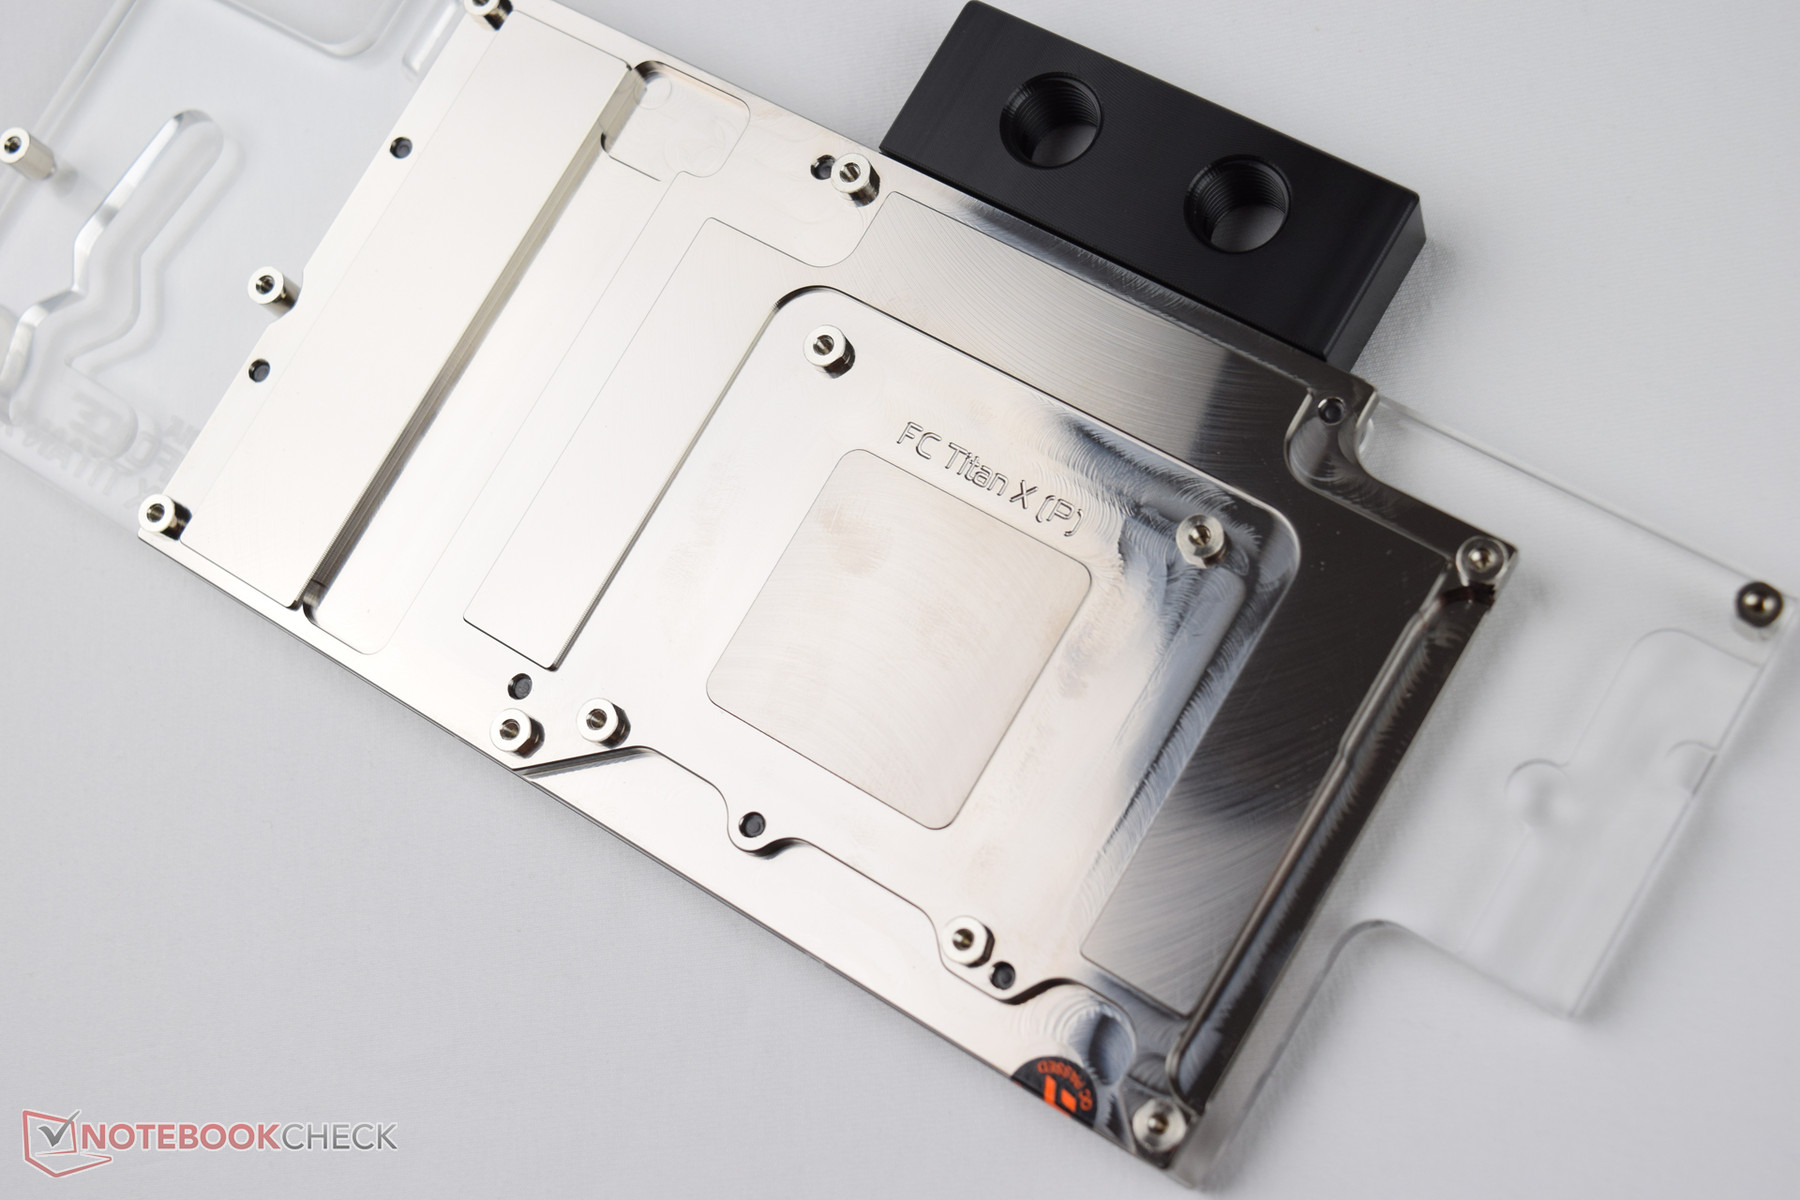
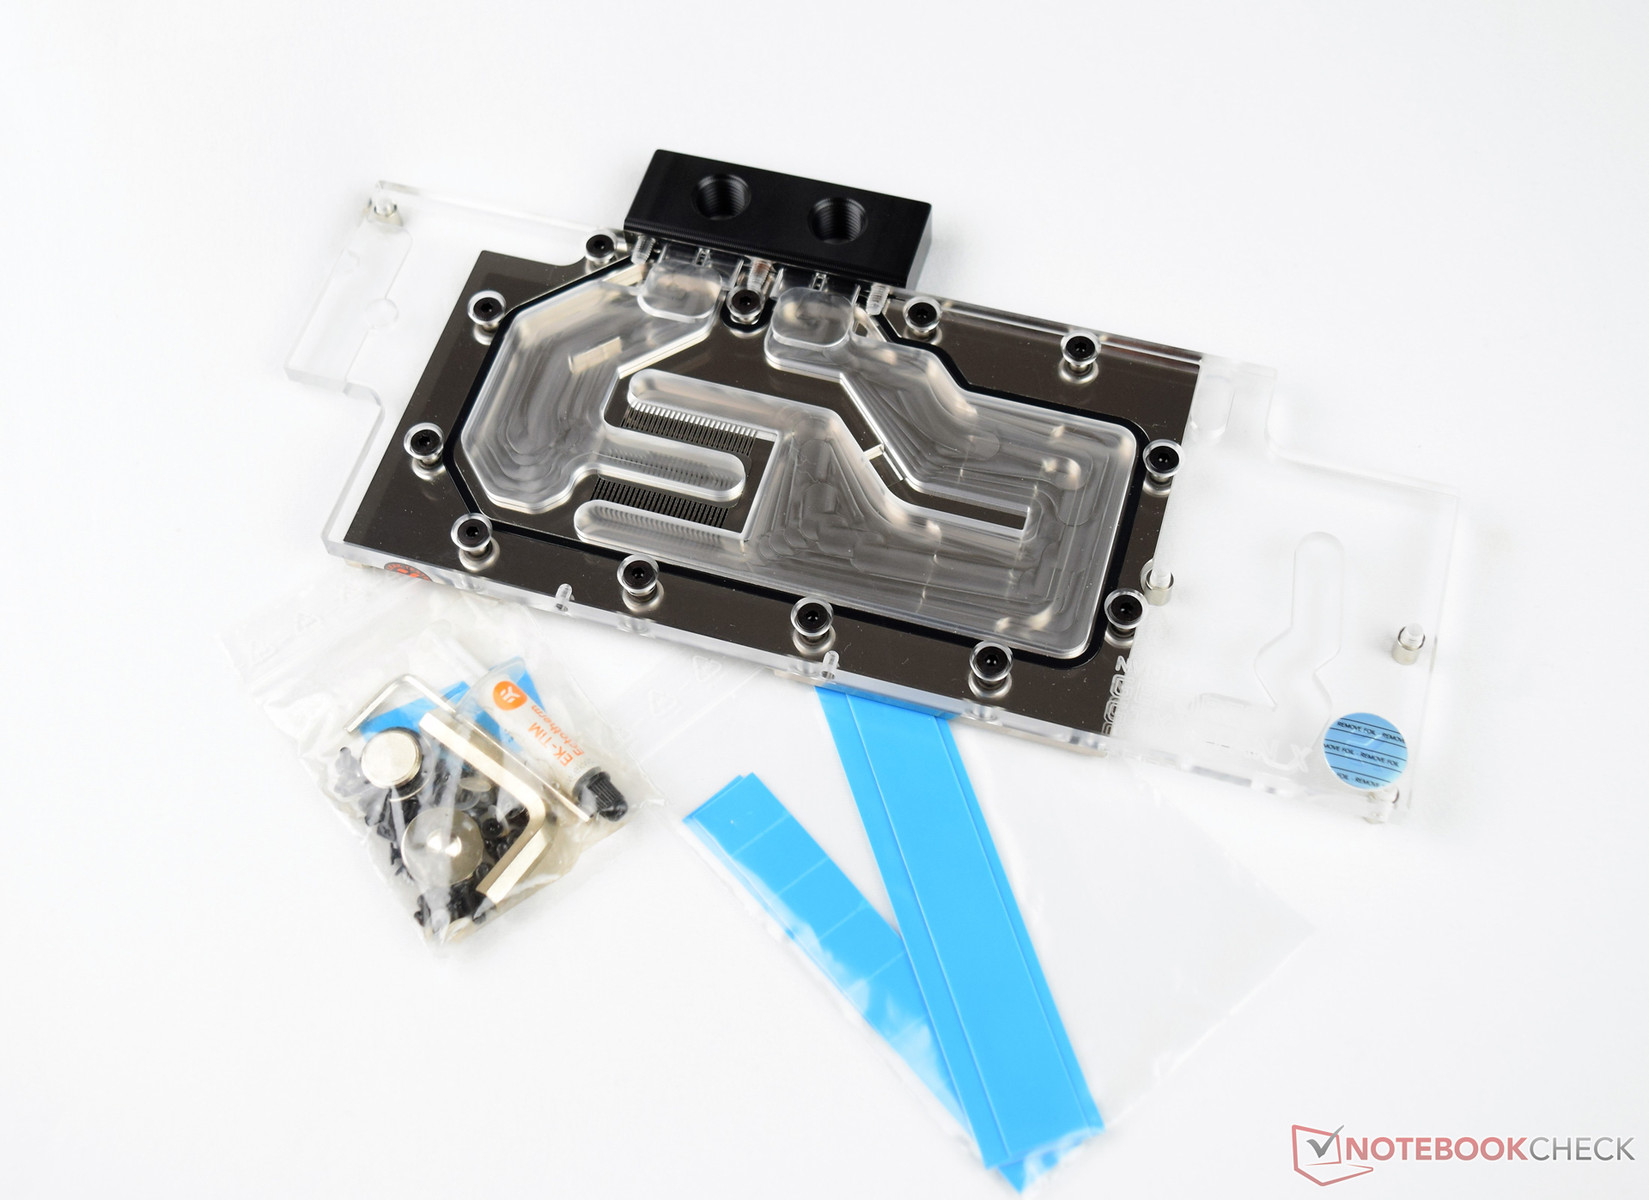
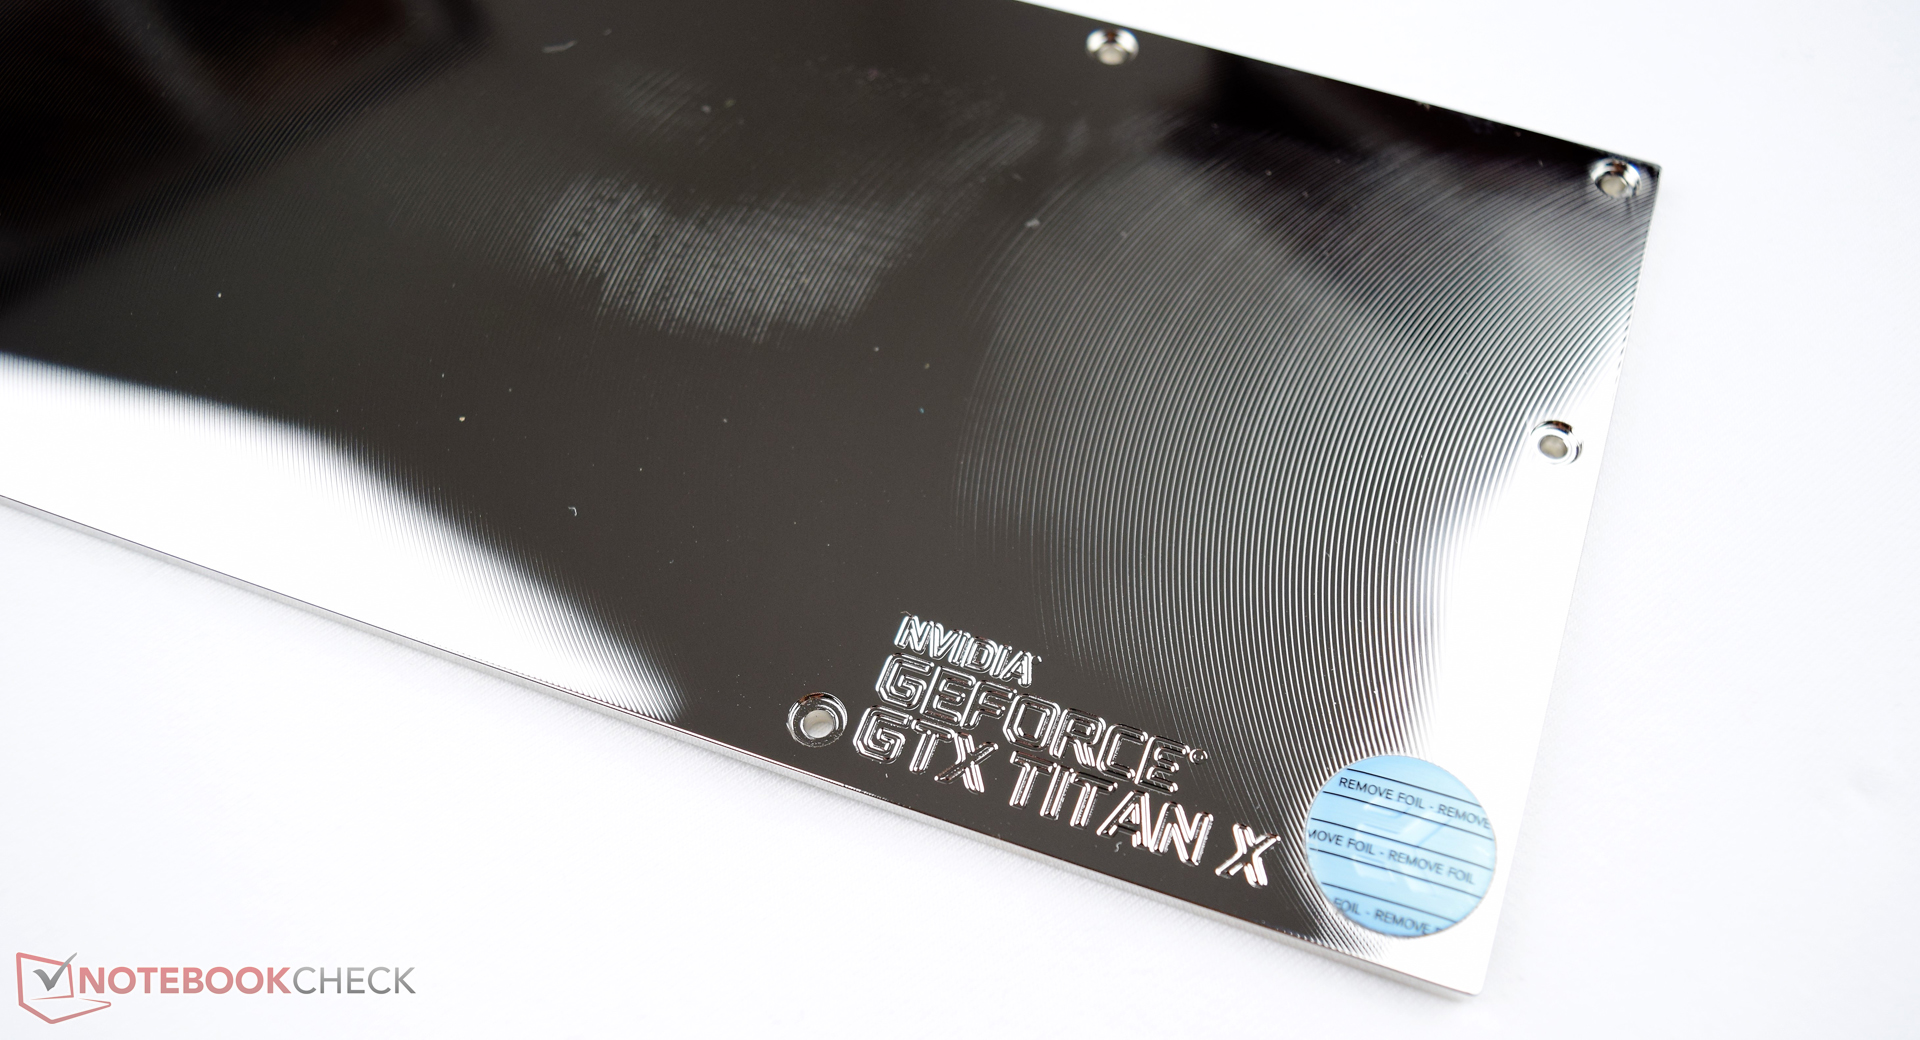
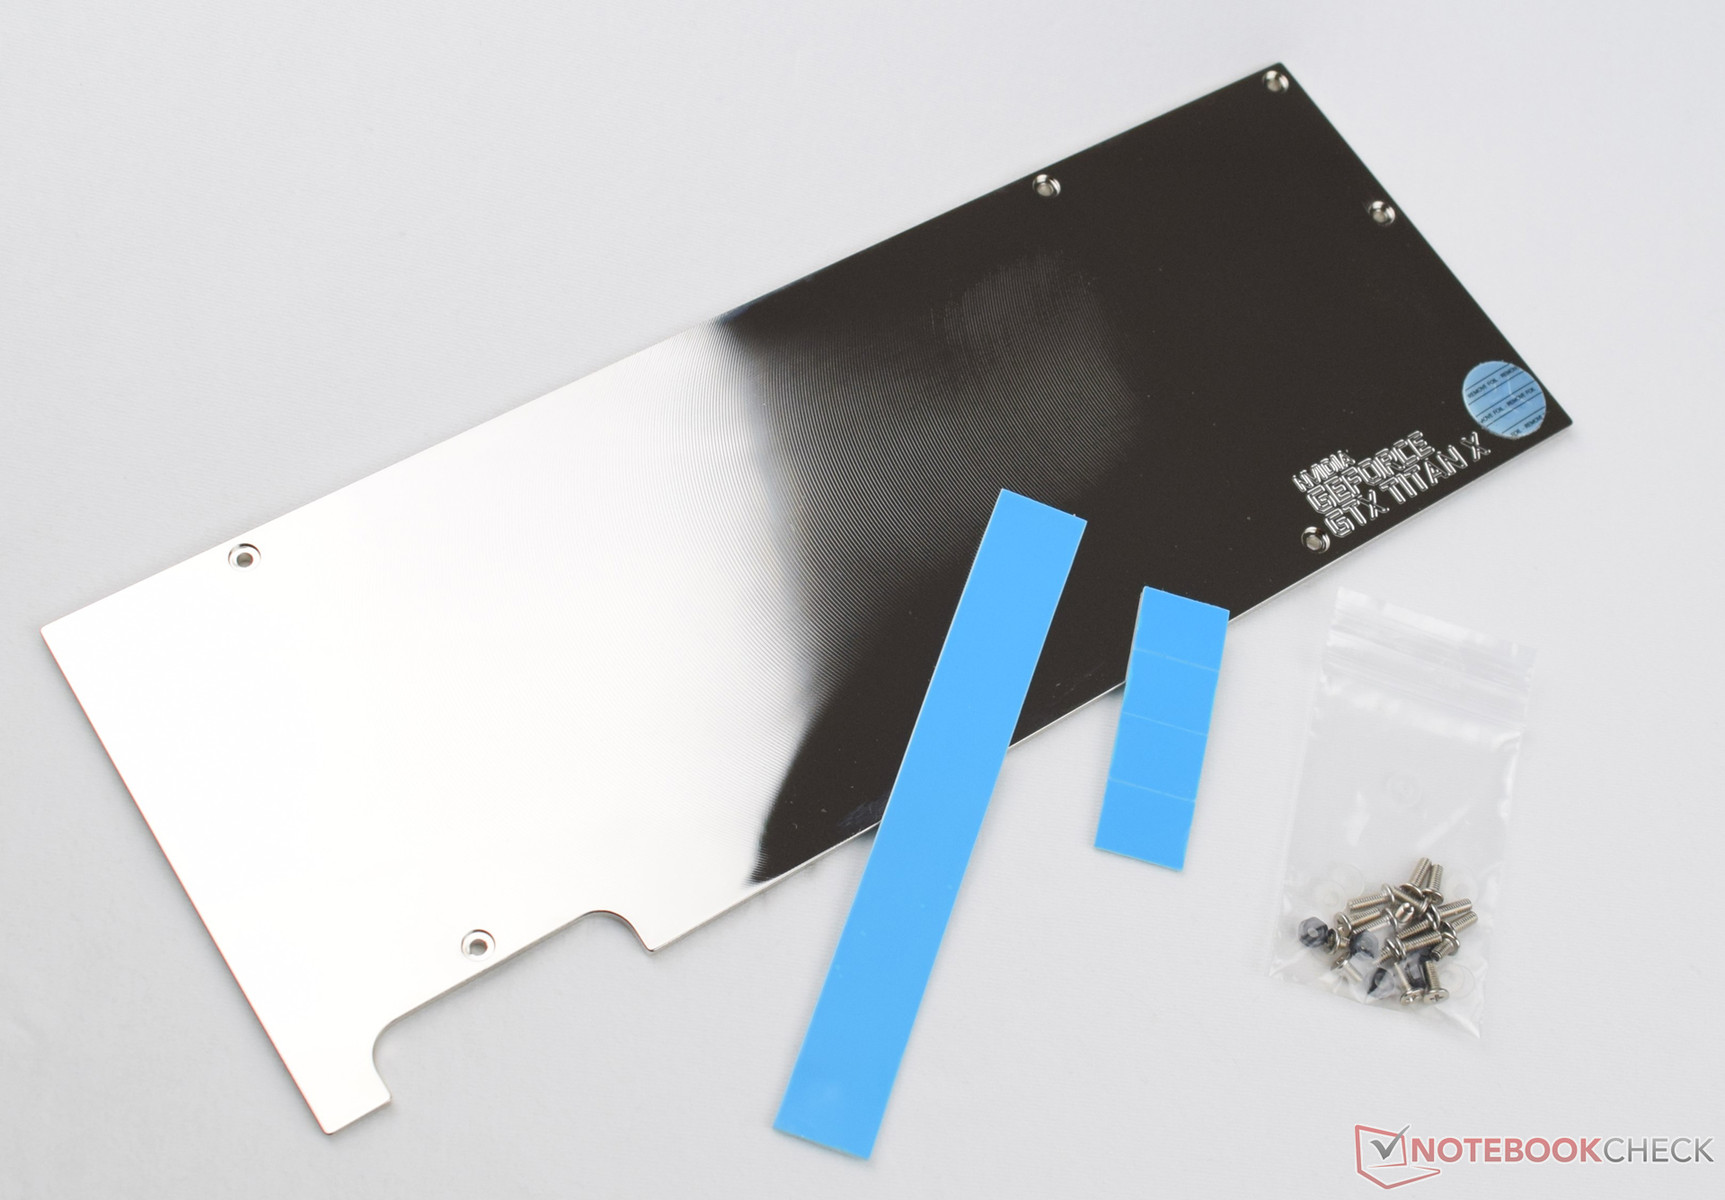
EKWB cooler compatible for the Pascal based Titan X We decided to use a compatible water cooler from EKWB with suitable backplate. You have to first remove the original backplate, which exposes all the screws connecting the cooler and PCB. Once you have removed these twenty screws, you can carefully take off the cooler. However, you have to be very careful: The cooling unit is also fixed to the PCB with two cables at the rear. Once you have disconnected these, you can finally remove the entire cooling unit (see pictures).
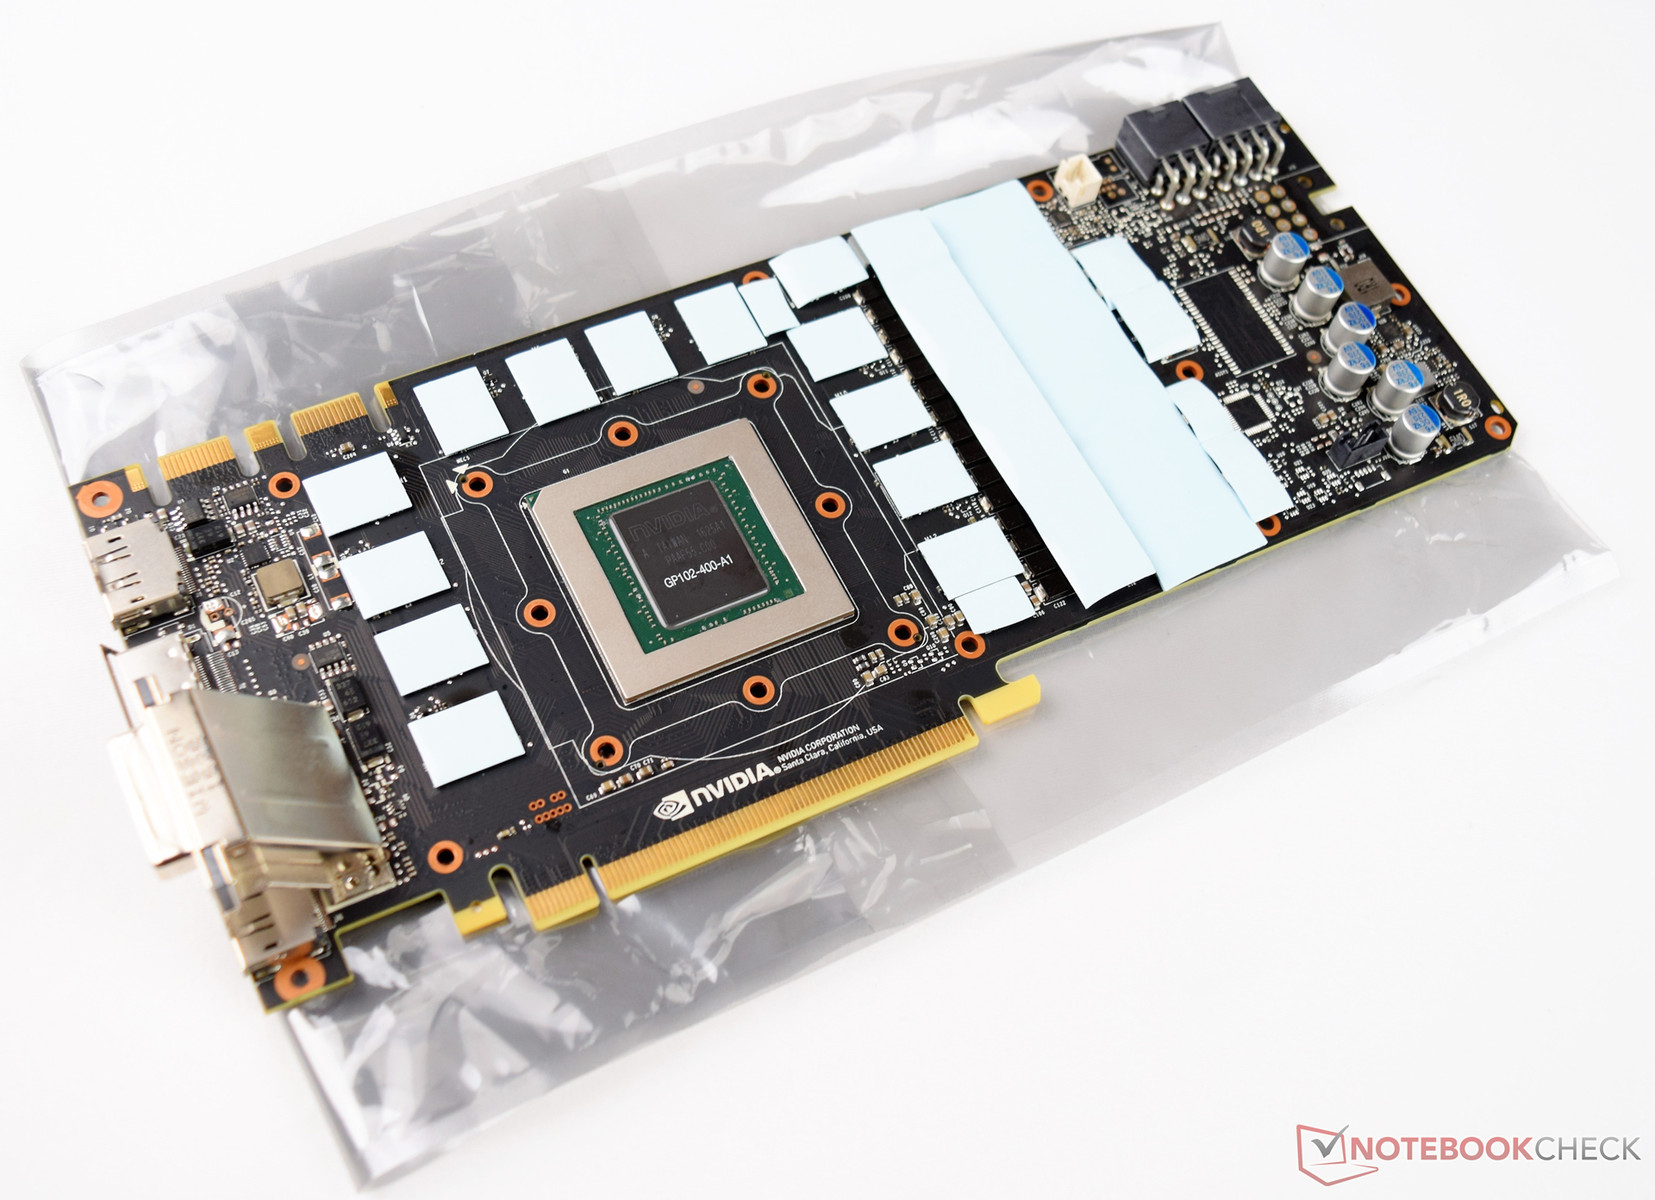
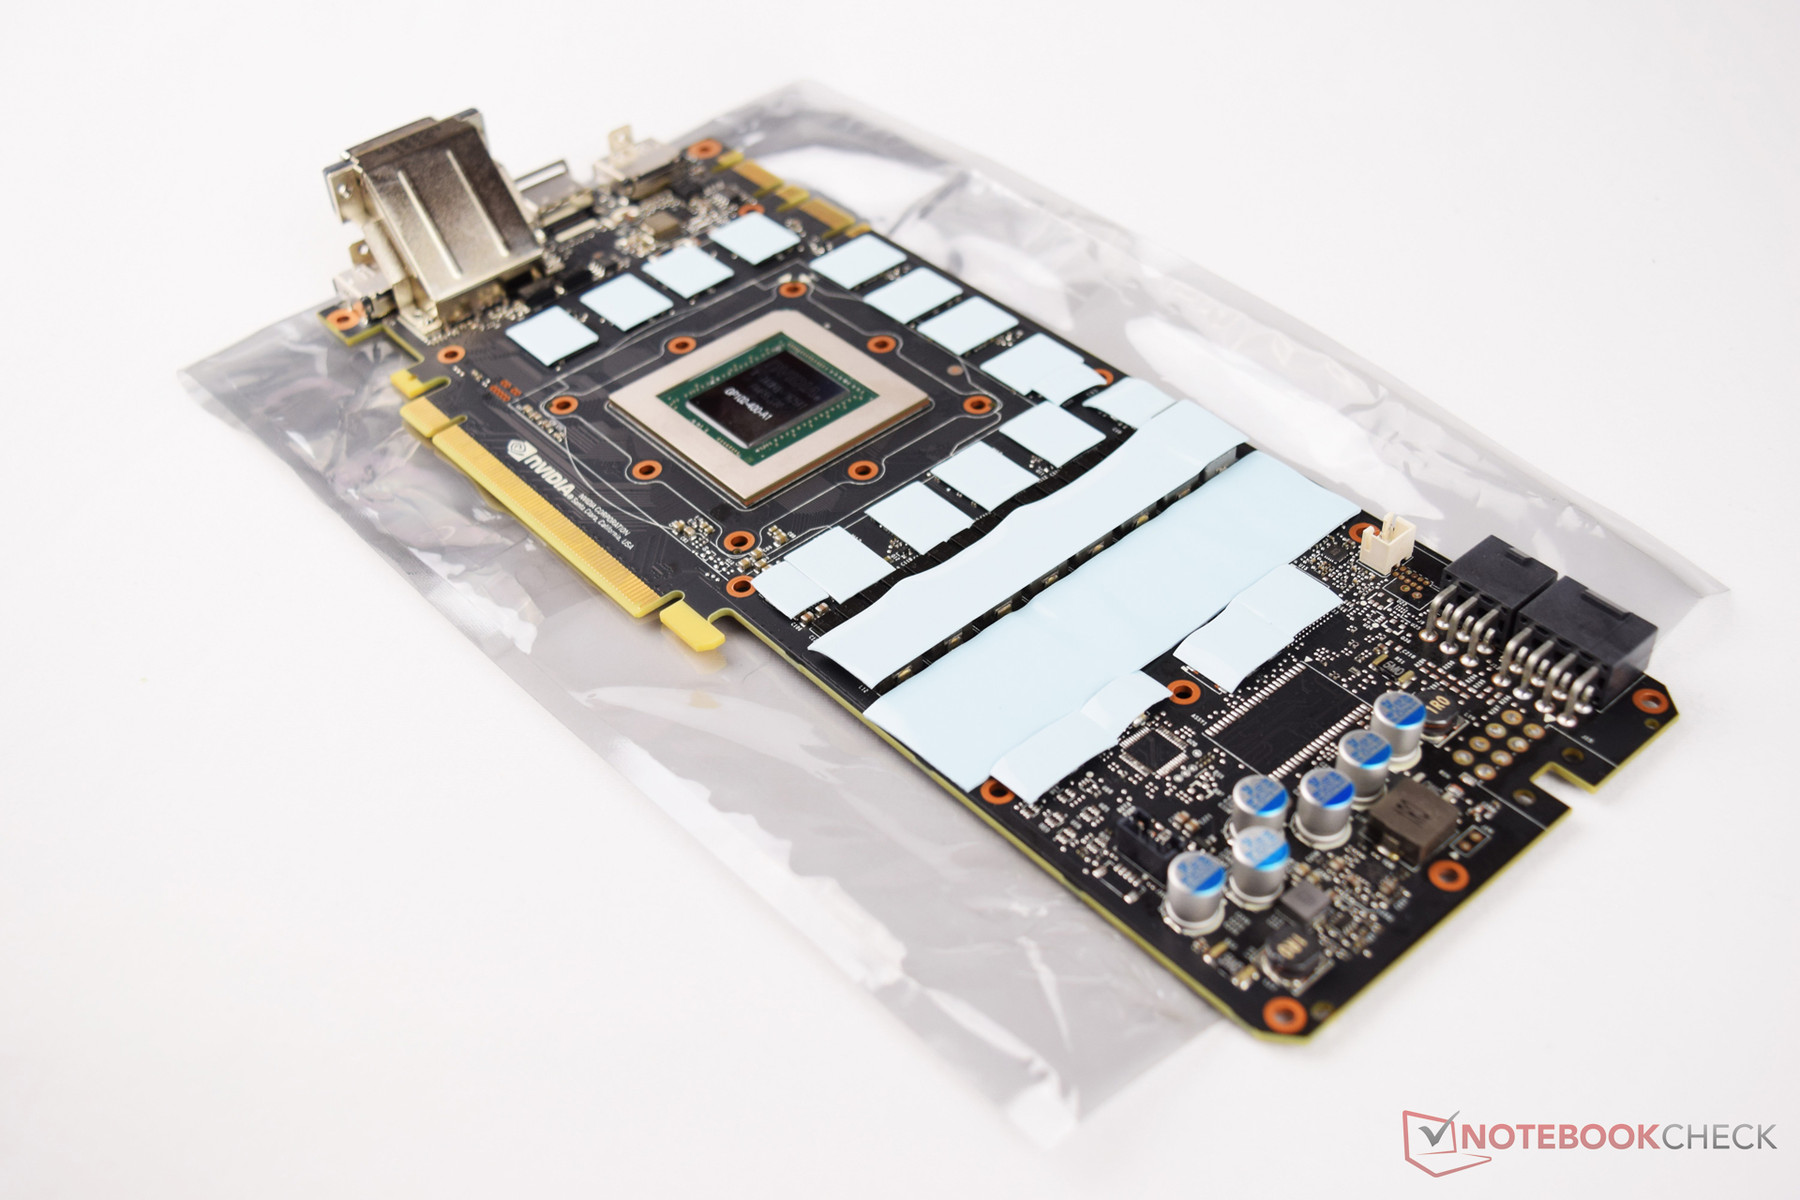
Before installing the new cooler, you have to remove all remnants of thermal grease and the thermal pads. This is easily done with a little alcohol, a dust-free cloth or a few cotton buds. The scope of delivery of the water cooler includes all suitable thermal pads in the right size. You have to put them on the right components and spread the included thermal grease on the GPU. Now, you can carefully lay the full cover water cooler on the card, which is fixed to the PCB with suitable screws. The same applies to the backplate.
the Nvidia Titan X - the fastest consumer desktop GPU so far We have deliberately ignored the price performance ratio since a price of 1299 Euros (~$1446), which Nvidia charges for their consumer range flagship, cannot be called reasonable at all. Nevertheless, buyers who are looking for something special and are also willing to pay for it, might consider buying it. However, an extra charge of 500 Euros (~$557) compared with the Nvidia GeForce GTX 1080 Founder's Edition is not reasonable since it bears no relation to the performance gain. In the meanwhile, there are many partner cards with the GTX 1080 chip , which bring even more performance due to factory-set overclocking.
Those who really dare to buy an Nvidia Titan X (Pascal), should consider implementing a water cooling circuit. With it, the Titan X will live longer thanks to lower waste heat.
If we judge the performance without considering the price, Nvidia offers the fastest single GPU so far with the Titan X. Only multi GPU systems consisting of two Nvidia GeForce GTX 1080 are able to beat the Titan X. However, the Titan X performs better if SLI support is missing. Those who follow rumors will notice that the Nvidia GeForce GTX 1080 Ti might be released in the coming months. The Internet site www.fudzilla.com mentions CES 2017 as possible release date. The technical specifications are supposed to be similar to the Titan X, but the GTX 1080 Ti will only feature 3328 CUDA cores (96 ROPs/208 TMUs). The GPU core frequency will be slightly increased compared to the Titan X (1503 MHz, Boost 1623 MHz). The price of the Nvidia GeForce GTX 1080 Ti will be in between the non-Ti model and the test model.
Who would be interested in this graphics card? Certainly the gamers. But those who still want to run games in FHD or WQHD in the near future might also be satisfied with the performance of Nvidia GeForce GTX 1080 or Nvidia GeForce GTX 1070 . Currently, the Titan X only makes sense if demanding games are supposed to run in UHD and with suitable quality settings (high/ultra preset) without stuttering.
Benchmarks Performance Rating - 3DMark 11 + Fire Strike + Time Spy
12.4 pt (37%)
...
Intel Arc A580
...
3DMark - 3DMark Time Spy Score
min: 8942 avg: 9451 median: 9417 (27%) max: 9877 Points
...
...
3DMark - 3DMark Time Spy Graphics
min: 9031 avg: 9203 median: 9076 (24%) max: 9635 Points
...
...
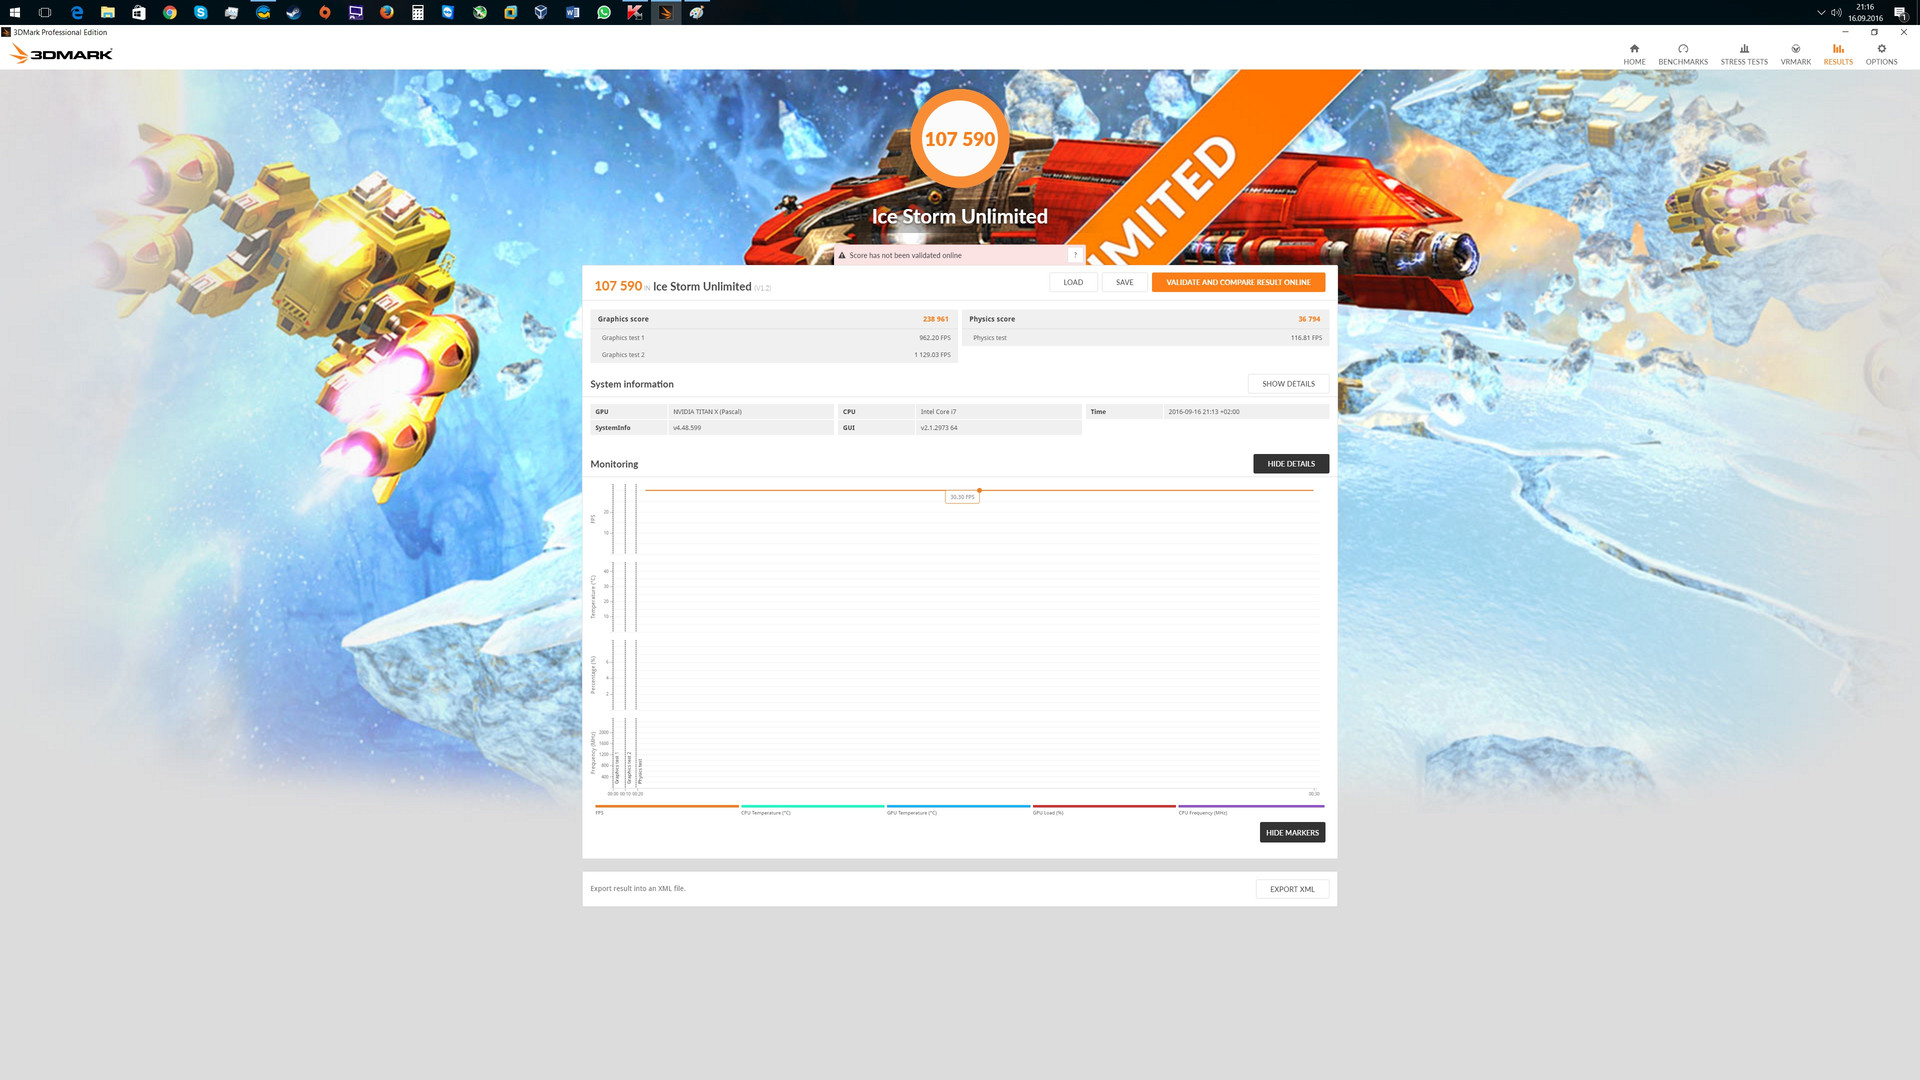
3DMark - 3DMark Ice Storm Unlimited Graphics
min: 238961 avg: 526905 median: 496070 (56%) max: 796701 Points
...
...
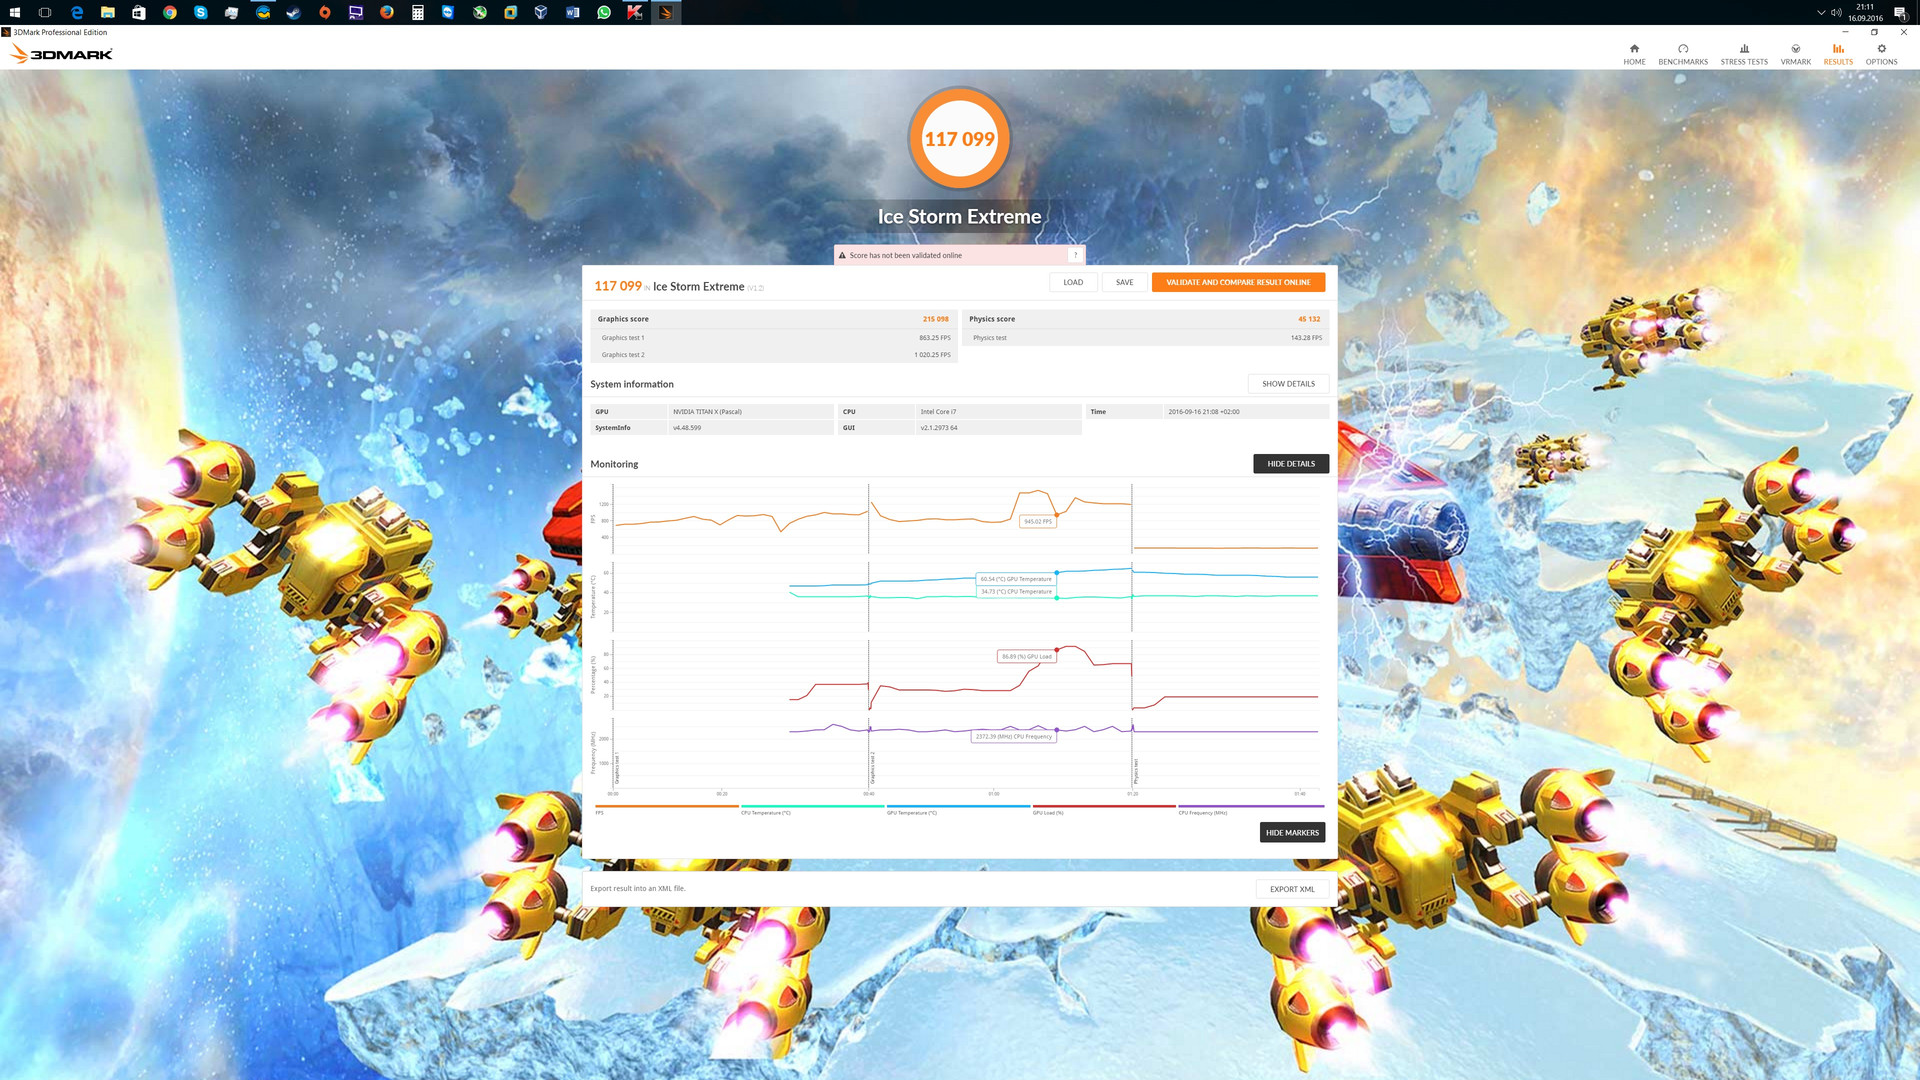
3DMark - 3DMark Ice Storm Extreme Graphics
min: 215098 avg: 382871 median: 365538 (47%) max: 546817 Points
...
Intel Arc A580
...
3DMark - 3DMark Cloud Gate Score
min: 36851 avg: 57843 median: 58418 (62%) max: 75037 Points
...
...
3DMark - 3DMark Cloud Gate Graphics
min: 102781 avg: 131615 median: 135092 (36%) max: 153552 Points
...
...
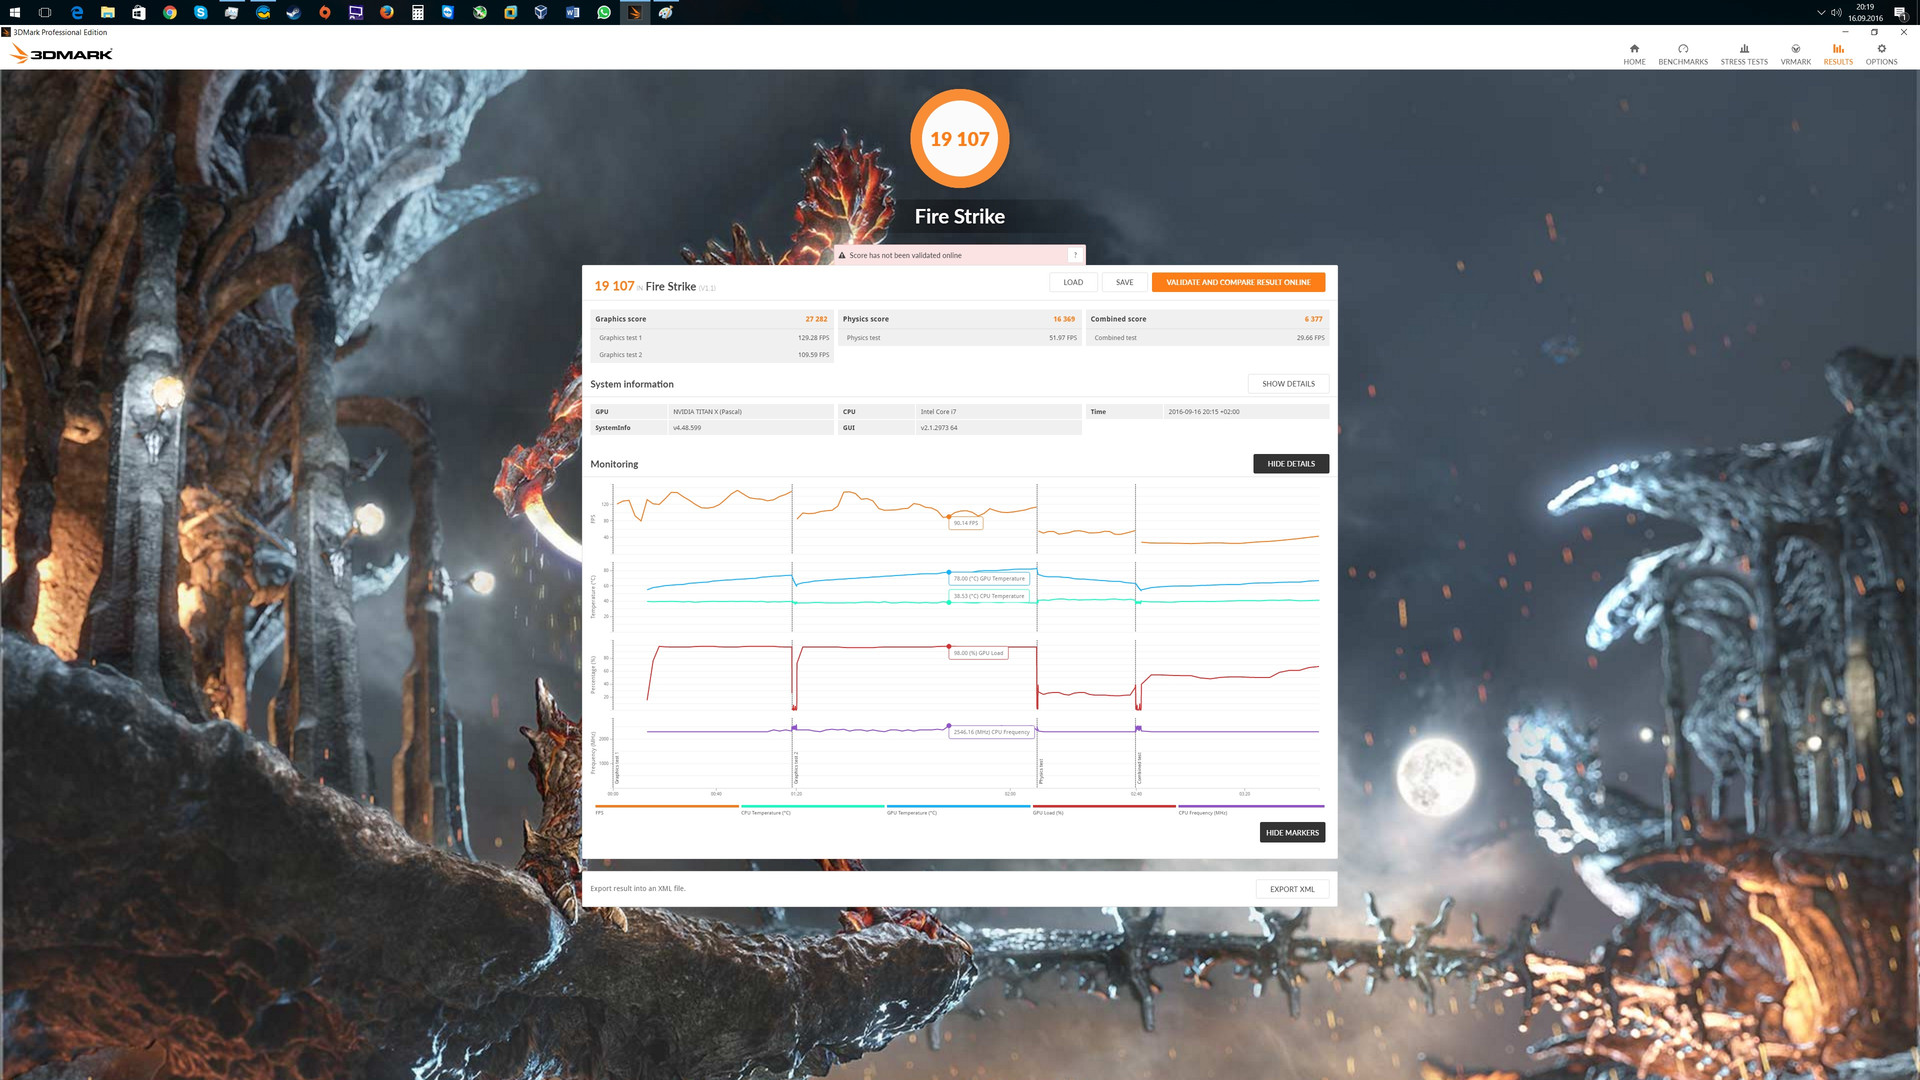
3DMark - 3DMark Fire Strike Standard Score
min: 19107 avg: 23634 median: 23165 (41%) max: 26925 Points
...
Intel Arc A580
...
3DMark - 3DMark Fire Strike Standard Graphics
min: 25642 avg: 26877 median: 27315.5 (31%) max: 27864 Points
...
Intel Arc A580
...
3DMark - 3DMark Ice Storm Graphics
min: 226697 avg: 431186 median: 405420 (49%) max: 627765 Points
...
Intel Arc A580
...
3DMark - 3DMark Wild Life Unlimited
65616 Points (33%)
...
...
3DMark - 3DMark Night Raid
min: 52892 avg: 54141 median: 54141 (51%) max: 55390 Points
...
...
3DMark - 3DMark Night Raid Graphics Score
min: 102111 avg: 104649 median: 104649 (40%) max: 107187 Points
...
Intel Arc A580
...
3DMark 11 - 3DM11 Performance Score
min: 23186 avg: 29573 median: 30628 (42%) max: 35183 Points
...
Intel Arc A580
...
3DMark 11 - 3DM11 Performance GPU
min: 27632 avg: 34424 median: 35995 (31%) max: 37012 Points
...
Intel Arc A580
...
3DMark Vantage + 3DMark Vantage - 3DM Vant. Perf. total
min: 97575 avg: 100949 median: 100948 (29%) max: 104322 Points
...
Intel Arc A580
...
3DM Vant. Perf. GPU no PhysX + 3DMark Vantage - 3DM Vant. Perf. GPU no PhysX
min: 103537 avg: 103837 median: 103837 (59%) max: 104137 Points
...
...
3DMark 03 - 3DMark 03 - Standard
101407 Points (53%)
...
NVIDIA GeForce GTX 570
AMD Radeon HD 6970
NVIDIA GeForce GTX 580
...
3DMark 05 - 3DMark 05 - Standard
min: 24206 avg: 67108 median: 86558 (95%) max: 90559 Points
...
Intel Arc A380
...
3DMark 06 3DMark 06 - Standard 1280x1024 +
min: 22088 avg: 53433 median: 69049 (90%) max: 69161 Points
...
...
Unigine Valley 1.0 - Unigine Valley 1.0 DX
min: 88.5 avg: 128.3 median: 139.8 (46%) max: 145.2 fps
...
...
SPECviewperf 12 + SPECviewperf 12 - specvp12 sw-03
min: 48.75 avg: 78.5 median: 65.1 (16%) max: 135 fps
...
...
specvp12 snx-02 + SPECviewperf 12 - specvp12 snx-02
min: 8.58 avg: 114.5 median: 107.7 (16%) max: 234 fps
...
...
specvp12 showcase-01 + SPECviewperf 12 - specvp12 showcase-01
min: 80.2 avg: 121.9 median: 131.7 (29%) max: 144 fps
...
...
specvp12 mediacal-01 + SPECviewperf 12 - specvp12 mediacal-01
min: 28.22 avg: 63.5 median: 69.8 (18%) max: 86.3 fps
...
...
specvp12 maya-04 + SPECviewperf 12 - specvp12 maya-04
min: 79.7 avg: 136.1 median: 124.3 (34%) max: 216 fps
...
...
specvp12 energy-01 + SPECviewperf 12 - specvp12 energy-01
min: 7.75 avg: 15.1 median: 16.3 (15%) max: 19.78 fps
...
...
specvp12 creo-01 + SPECviewperf 12 - specvp12 creo-01
min: 40.53 avg: 81.9 median: 59.6 (24%) max: 168 fps
...
...
specvp12 catia-04 + SPECviewperf 12 - specvp12 catia-04
min: 62.6 avg: 125.4 median: 91.9 (15%) max: 255 fps
...
...
specvp12 3dsmax-05 + SPECviewperf 12 - specvp12 3dsmax-05
min: 144 avg: 174.6 median: 151.9 (27%) max: 228 fps
...
...
SPECviewperf 13 specvp13 sw-04 + SPECviewperf 13 - specvp13 sw-04
min: 71.7 avg: 104.6 median: 82.1 (22%) max: 160 fps
...
...
specvp13 snx-03 + SPECviewperf 13 - specvp13 snx-03
min: 15.35 avg: 269.1 median: 370.9 (41%) max: 421 fps
...
...
specvp13 showcase-02 + SPECviewperf 13 - specvp13 showcase-02
min: 78.6 avg: 119.5 median: 136.8 (30%) max: 143 fps
...
...
specvp13 medical-02 + SPECviewperf 13 - specvp13 medical-02
min: 40.57 avg: 63 median: 71.4 (15%) max: 76.9 fps
...
...
specvp13 maya-05 + SPECviewperf 13 - specvp13 maya-05
min: 203 avg: 259.5 median: 236.5 (27%) max: 339 fps
...
...
specvp13 energy-02 + SPECviewperf 13 - specvp13 energy-02
min: 11.31 avg: 25.3 median: 32 (10%) max: 32.46 fps
...
...
specvp13 creo-02 + SPECviewperf 13 - specvp13 creo-02
min: 134 avg: 204.7 median: 185.2 (27%) max: 295 fps
...
...
specvp13 catia-05 + SPECviewperf 13 - specvp13 catia-05
min: 91 avg: 218.8 median: 161.4 (18%) max: 404 fps
...
Intel Arc A580
...
specvp13 3dsmax-06 + SPECviewperf 13 - specvp13 3dsmax-06
min: 143 avg: 174.8 median: 153.4 (27%) max: 228 fps
...
...
SPECviewperf 2020 specvp2020 solidworks-05 4k + SPECviewperf 2020 - specvp2020 solidworks-05 4k
min: 64.1 avg: 85.6 median: 85.6 (25%) max: 107 fps
...
...
specvp2020 snx-04 4k + SPECviewperf 2020 - specvp2020 snx-04 4k
min: 11.7 avg: 161.9 median: 161.9 (17%) max: 312 fps
...
...
specvp2020 medical-03 4k + SPECviewperf 2020 - specvp2020 medical-03 4k
min: 6.11 avg: 9.5 median: 9.5 (9%) max: 12.8 fps
...
...
specvp2020 maya-06 4k + SPECviewperf 2020 - specvp2020 maya-06 4k
min: 113 avg: 154.5 median: 154.5 (25%) max: 196 fps
...
Intel Arc A580
...
specvp2020 energy-03 4k + SPECviewperf 2020 - specvp2020 energy-03 4k
min: 13.76 avg: 26.4 median: 26.4 (6%) max: 39 fps
...
...
specvp2020 creo-03 4k + SPECviewperf 2020 - specvp2020 creo-03 4k
min: 52.9 avg: 76.2 median: 76.2 (36%) max: 99.4 fps
...
...
specvp2020 catia-06 4k + SPECviewperf 2020 - specvp2020 catia-06 4k
min: 20.53 avg: 43.7 median: 43.7 (29%) max: 66.9 fps
...
...
specvp2020 3dsmax-07 4k + SPECviewperf 2020 - specvp2020 3dsmax-07 4k
min: 42.19 avg: 55.6 median: 55.6 (23%) max: 69 fps
...
...
Cinebench R10 Cinebench R10 Shading (32bit) + Cinebench R10 - Cinebench R10 Shading (32bit)
6756 points (5%)
...
...
Cinebench R11.5 Cinebench R11.5 OpenGL 64 Bit + Cinebench R11.5 - Cinebench R11.5 OpenGL 64 Bit
min: 52 avg: 77 median: 77 (27%) max: 102 fps
...
AMD Radeon HD 6790
...
Cinebench R15 + Cinebench R15 - Cinebench R15 OpenGL 64 Bit
min: 112.2 avg: 122 median: 122 (7%) max: 131.7 fps
...
...
Cinebench R15 OpenGL Ref. Match 64 Bit + Cinebench R15 - Cinebench R15 OpenGL Ref. Match 64 Bit
99.6 % (100%)
...
...
Geekbench 6.2 - Geekbench 6.2 GPU OpenCL
69162 points (20%)
Model CPU GPU RAM Value Nvidia Titan X (Pascal) R9 7950X 230 W / 170 W Titan X Pascal 1531 / 1251 MHz 12 GB 32 GB 69162
...
...
Geekbench 6.2 - Geekbench 6.2 GPU Vulkan
81572 points (27%)
Model CPU GPU RAM Value Nvidia Titan X (Pascal) R9 7950X 230 W / 170 W Titan X Pascal 1531 / 1251 MHz 12 GB 32 GB 81572
...
Intel Arc A580
...
LuxMark v2.0 64Bit - LuxMark v2.0 Room GPU
2991 Samples/s (14%)
...
Intel Arc A580
...
LuxMark v2.0 64Bit - LuxMark v2.0 Sala GPU
6920 Samples/s (12%)
...
...
ComputeMark v2.1 - ComputeMark v2.1 Result
min: 21512 avg: 21682 median: 21682 (23%) max: 21852 points
...
...
Power Consumption - Furmark Stress Test Power Consumption - external Monitor *
min: 377 avg: 381.7 median: 381.7 (54%) max: 386.4 Watt
GPU TDP ? TDP 250 W 100% 103%
...
...
0 25 50 75 100 125 150 175 200 225 250 275 300 325 350 375 400 Tooltip Nvidia Titan X Pascal: Ø377 (352-423)
Power Consumption - The Witcher 3 Power Consumption - external Monitor *
min: 378.5 avg: 381.8 median: 381.8 (53%) max: 385 Watt
GPU TDP ? TDP 250 W 102% 100%
...
...
0 30 60 90 120 150 180 210 240 270 300 330 360 390 420 450 480 510 Tooltip Nvidia Titan X Pascal: Ø385 (351-512)
- Range of benchmark values for this graphics card
- Average benchmark values for this graphics card
* Smaller numbers mean a higher performance
v1.26
log 27. 18:45:12
#0 no ids found in url (should be separated by "_") +0s ... 0s
#1 not redirecting to Ajax server +0s ... 0s
#2 did not recreate cache, as it is less than 5 days old! Created at Thu, 25 Apr 2024 05:40:10 +0200 +0.001s ... 0.001s
#3 getting avg benchmarks for device 7461 +0.016s ... 0.017s
#4 got single benchmarks 7461 +0.022s ... 0.039s
#5 got avg benchmarks for devices +0s ... 0.039s
#6 min, max, avg, median took s +0.929s ... 0.968s
#7 return log +0s ... 0.968s
Game Benchmarks The following benchmarks stem from our benchmarks of review laptops. The performance depends on the used graphics memory, clock rate, processor, system settings, drivers, and operating systems. So the results don't have to be representative for all laptops with this GPU. For detailed information on the benchmark results, click on the fps number.
Intel Arc A380
Intel Arc A580
...
...
Intel Arc A380
Intel Arc A580
...
Intel Arc A580
...
Intel Arc A580
...
» With all tested laptops playable in detail settings high.
Additional Benchmarks
Low Preset 1280x720
69.2 [X] Nvidia Titan X Pascal Intel Core i9-14900K 3.2GHz
Titan X Pascal
min:
36.8 fps, P0.1:
42.8 fps, P1:
46.5 fps, max:
95.4 fps
...
...
...
...
Intel Arc A580
...
...
Intel Arc A580
...
...
Intel Arc A580
...
...
Intel Arc A580
...
» With all tested laptops playable in detail settings ultra.
Additional Benchmarks
Very Low Preset 1280x720
243 [X] Nvidia Titan X Pascal Intel Core i9-14900K 3.2GHz
Titan X Pascal
min:
1.485 fps, P0.1:
19.6 fps, P1:
83 fps, max:
1149 fps
...
...
...
...
...
...
...
Intel Arc A580
...
...
Intel Arc A580
...
...
...
...
» With all tested laptops playable in detail settings ultra.
Additional Benchmarks
Low Preset 1280x720
310 [X] Nvidia Titan X Pascal Intel Core i9-14900K 3.2GHz
Titan X Pascal
min:
7.25 fps, P0.1:
29.2 fps, P1:
224 fps, max:
548 fps
...
...
...
...
...
...
Intel Arc A580
...
...
Intel Arc A580
...
...
Intel Arc A580
...
» With all tested laptops playable in detail settings ultra.
Additional Benchmarks
Very Low Preset 1280x720
298 [X] Nvidia Titan X Pascal Intel Core i9-14900K 3.2GHz
Titan X Pascal
min:
27.4 fps, P0.1:
172.2 fps, P1:
247 fps, max:
539 fps
...
...
...
Intel Arc A580
...
...
Intel Arc A580
...
...
...
...
Intel Arc A580
...
...
Intel Arc A580
...
...
Intel Arc A580
...
» With all tested laptops playable in detail settings ultra.
Additional Benchmarks
Low Preset TAA 1280x720
123 [X] Nvidia Titan X Pascal Intel Core i9-14900K 3.2GHz
Titan X Pascal
...
Intel Arc A580
...
...
Intel Arc A580
...
...
Intel Arc A580
...
...
Intel Arc A580
...
...
Intel Arc A580
...
...
Intel Arc A580
...
» With all tested laptops playable in detail settings ultra.
Additional Benchmarks
Low Preset 1280x720
158.9 [X] Nvidia Titan X Pascal Intel Core i9-14900K 3.2GHz
Titan X Pascal
min:
68.4 fps, P0.1:
100.7 fps, P1:
140.6 fps, max:
219 fps
...
Intel Arc A580
...
...
Intel Arc A580
...
...
Intel Arc A580
...
...
Intel Arc A580
...
...
Intel Arc A580
...
Intel Arc A580
...
Intel Arc A580
...
» With all tested laptops playable in detail settings ultra.
Additional Benchmarks
Max. Performance 1280x720
99.5 [X] Nvidia Titan X Pascal Intel Core i9-14900K 3.2GHz
Titan X Pascal
min:
69.7 fps, P0.1:
71 fps, P1:
73.1 fps, max:
179.9 fps
...
...
...
...
...
Intel Arc A580
...
...
Intel Arc A580
...
...
Intel Arc A580
...
...
Intel Arc A580
...
» With all tested laptops playable in detail settings ultra.
Additional Benchmarks
Very Low Preset 1280x720
229 [X] Nvidia Titan X Pascal Intel Core i9-14900K 3.2GHz
Titan X Pascal
min:
60.9 fps, P0.1:
166.9 fps, P1:
184.4 fps, max:
451 fps
Intel UHD Graphics 32EUs (Alder Lake)
...
Intel Arc A580
...
...
Intel Arc A580
...
...
Intel Arc A580
...
...
...
...
...
» With all tested laptops playable in detail settings ultra.
...
Intel Arc A580
...
...
Intel Arc A580
...
...
Intel Arc A580
...
...
Intel Arc A580
...
...
Intel Arc A580
...
...
Intel Arc A580
...
» With all tested laptops playable in detail settings ultra.
...
Intel Arc A580
...
Intel UHD Graphics 32EUs (Alder Lake)
...
Intel Arc A580
...
0 100 200 300 400 500 600 Tooltip
Intel UHD Graphics 32EUs (Alder Lake)
...
Intel Arc A580
...
Intel UHD Graphics 32EUs (Alder Lake)
...
Intel Arc A580
...
...
Intel Arc A580
...
...
Intel Arc A580
...
» With all tested laptops playable in detail settings ultra.
Additional Benchmarks
Low Preset 1280x720
295 [X] Nvidia Titan X (Pascal) AMD Ryzen 9 7950X 4.5GHz
Titan X Pascal
min:
70.2 fps, P0.1:
162 fps, P1:
203 fps, max:
493 fps
...
Intel Arc A580
...
...
Intel Arc A580
...
...
Intel Arc A580
...
...
...
Intel Arc A580
...
Intel Arc A580
...
» With all tested laptops playable in detail settings high.
Additional Benchmarks
Low Preset TAA 1280x720
89 [X] Nvidia Titan X (Pascal) AMD Ryzen 9 7950X 4.5GHz
Titan X Pascal
min:
49 fps, max:
117 fps
...
Intel Arc A580
...
...
Intel Arc A580
...
...
Intel Arc A580
...
...
Intel Arc A580
...
...
Intel Arc A580
...
Intel Arc A580
...
» With all tested laptops playable in detail settings ultra.
Additional Benchmarks
Minimum Preset 1280x720
151 [X] Nvidia Titan X (Pascal) AMD Ryzen 9 7950X 4.5GHz
Titan X Pascal
...
Intel Arc A580
...
...
Intel Arc A580
...
0 100 200 300 400 500 600 700 800 Tooltip
...
Intel Arc A580
...
...
Intel Arc A580
...
0 100 200 300 400 500 600 700 800 900 1000 1100 1200 1300 1400 1500 1600 1700 1800 1900 2000 2100 Tooltip
...
...
...
Intel Arc A580
...
» With all tested laptops playable in detail settings ultra.
Additional Benchmarks
Ultra Low Preset LowAA 1280x720
215 [X] Nvidia Titan X (Pascal) AMD Ryzen 9 7950X 4.5GHz
Titan X Pascal
min:
10.7 fps, P0.1:
32.5 fps, P1:
130.1 fps, max:
363 fps
0 100 200 300 400 500 600 Tooltip
...
...
...
...
...
» The benchmarks indicate that the game is not playable in the tested settings.
Additional Benchmarks
Low Preset 1280x720
23.7 [X] Nvidia Titan X (Pascal) AMD Ryzen 9 7950X 4.5GHz
Titan X Pascal
min:
10.5 fps, P0.1:
10.9 fps, P1:
16.5 fps, max:
60.3 fps
...
Intel Arc A580
...
...
Intel Arc A580
...
...
Intel Arc A580
...
...
...
...
...
...
...
» With all tested laptops playable in detail settings high.
Additional Benchmarks
Low Preset 1280x720
93.9 [X] Nvidia Titan X (Pascal) AMD Ryzen 9 7950X 4.5GHz
Titan X Pascal
min:
20.9 fps, P0.1:
26.3 fps, P1:
70.1 fps, max:
194.4 fps
...
Intel Arc A580
...
...
...
...
Intel Arc A580
...
...
Intel Arc A580
...
...
Intel Arc A580
...
...
Intel Arc A580
...
» With all tested laptops playable in detail settings ultra.
Additional Benchmarks
Low Preset 1280x720
544.6 [X] Nvidia Titan X (Pascal) AMD Ryzen 9 7950X 4.5GHz
Titan X Pascal
...
Intel Arc A580
...
...
Intel Arc A580
...
...
Intel Arc A580
...
...
Intel Arc A580
...
...
Intel Arc A580
...
...
Intel Arc A580
...
» With all tested laptops playable in detail settings ultra.
Additional Benchmarks
Low Preset (Adaptive Quality Off) 1280x720
110 [X] Nvidia Titan X (Pascal) AMD Ryzen 9 7950X 4.5GHz
Titan X Pascal
min:
37 fps, P0.1:
43 fps, P1:
67 fps, max:
221 fps
...
...
...
...
0 100 200 300 400 500 600 Tooltip
...
...
...
...
...
...
...
» With all tested laptops playable in detail settings ultra.
Additional Benchmarks
Low Preset 1280x720
280 [X] Nvidia Titan X (Pascal) AMD Ryzen 9 7950X 4.5GHz
Titan X Pascal
min:
99.5 fps, P0.1:
192.4 fps, P1:
208 fps, max:
393 fps
Intel UHD Graphics 32EUs (Alder Lake)
...
Intel Arc A580
...
Intel UHD Graphics 32EUs (Alder Lake)
...
Intel Arc A580
...
Intel UHD Graphics 32EUs (Alder Lake)
...
...
...
...
...
...
» With all tested laptops playable in detail settings ultra.
Additional Benchmarks
Low Preset 1280x720
343 [X] Nvidia Titan X (Pascal) AMD Ryzen 9 7950X 4.5GHz
Titan X Pascal
min:
45 fps, P0.1:
125.9 fps, P1:
162.2 fps, max:
949 fps
...
Intel Arc A580
...
...
Intel Arc A580
...
...
Intel Arc A580
...
...
...
...
...
...
...
» With all tested laptops playable in detail settings ultra.
Additional Benchmarks
Low Preset (FSR off) 1280x720
133.9 [X] Nvidia Titan X (Pascal) AMD Ryzen 9 7950X 4.5GHz
Titan X Pascal
min:
89.1 fps, max:
212 fps
Steam Deck 1280x720
150 [X] Nvidia Titan X (Pascal) AMD Ryzen 9 7950X 4.5GHz
Titan X Pascal
min:
83.9 fps, max:
238 fps
...
Intel Arc A580
...
...
Intel Arc A580
...
0 100 200 300 400 500 600 700 800 Tooltip
...
Intel Arc A580
...
0 100 200 300 400 500 600 Tooltip
...
Intel Arc A580
...
...
Intel Arc A580
...
...
Intel Arc A580
...
» With all tested laptops playable in detail settings ultra.
Additional Benchmarks
Low Preset 1280x720
207 [X] Nvidia Titan X (Pascal) AMD Ryzen 9 7950X 4.5GHz
Titan X Pascal
min:
39.2 fps, P0.1:
99.4 fps, P1:
129.2 fps, max:
404 fps
...
Intel Arc A580
...
0 100 200 300 400 500 600 700 800 900 Tooltip
...
Intel Arc A580
...
...
Intel Arc A580
...
...
Intel Arc A580
...
Intel Arc A580
...
Intel Arc A580
...
» With all tested laptops playable in detail settings med..
Additional Benchmarks
Low Preset 1280x720
62.7 [X] Nvidia Titan X (Pascal) AMD Ryzen 9 7950X 4.5GHz
Titan X Pascal
min:
44.8 fps, P0.1:
46.6 fps, P1:
49.3 fps, max:
103.5 fps
...
...
...
...
...
...
...
Intel Arc A580
...
...
...
...
...
» With all tested laptops playable in detail settings ultra.
Additional Benchmarks
Low Preset 1280x720
119.6 [X] Nvidia Titan X (Pascal) AMD Ryzen 9 7950X 4.5GHz
Titan X Pascal
min:
49.9 fps, P0.1:
86.7 fps, P1:
97.6 fps, max:
185.3 fps
...
Intel Arc A380
Intel Arc A580
...
...
Intel Arc A580
...
...
Intel Arc A380
Intel Arc A580
...
Intel Arc A580
...
Intel Arc A580
...
» With all tested laptops playable in detail settings high.
Additional Benchmarks
Low 1280x720
78.6 [X] Nvidia Titan X (Pascal) AMD Ryzen 9 7950X 4.5GHz
Titan X Pascal
min:
19.9 fps, P0.1:
33.5 fps, P1:
54.1 fps, max:
145.7 fps
0 100 Tooltip : Ø120.7 (106.214-148.78)
...
Intel Arc A580
...
...
Intel Arc A580
...
...
Intel Arc A580
...
0 100 200 300 400 500 600 700 800 Tooltip
...
Intel Arc A580
...
...
Intel Arc A580
...
...
Intel Arc A580
...
» With all tested laptops playable in detail settings ultra.
Additional Benchmarks
Low Preset 1280x720
191.4 [X] Nvidia Titan X (Pascal) AMD Ryzen 9 7950X 4.5GHz
Titan X Pascal
min:
60.1 fps, P0.1:
110 fps, P1:
146.2 fps, max:
253 fps
...
Intel Arc A580
...
...
Intel Arc A580
...
...
Intel Arc A580
...
...
Intel Arc A580
...
...
Intel Arc A580
...
...
Intel Arc A580
...
» With all tested laptops playable in detail settings ultra.
Additional Benchmarks
Low Preset 1280x720
169.2 [X] Nvidia Titan X (Pascal) AMD Ryzen 9 7950X 4.5GHz
Titan X Pascal
min:
65.2 fps, P0.1:
94.9 fps, P1:
140 fps, max:
422 fps
...
Intel Arc A580
...
...
Intel Arc A580
...
...
Intel Arc A580
...
0 100 200 300 400 500 600 700 Tooltip
...
Intel Arc A580
...
...
Intel Arc A580
...
...
Intel Arc A580
...
» With all tested laptops playable in detail settings ultra.
Additional Benchmarks
Very Low Preset 1280x720
138.1 [X] Nvidia Titan X (Pascal) AMD Ryzen 9 7950X 4.5GHz
Titan X Pascal
min:
108.8 fps, P0.1:
114.5 fps, P1:
122.1 fps, max:
181.2 fps
...
Intel Arc A580
...
...
Intel Arc A580
...
...
Intel Arc A580
...
...
...
...
» With all tested laptops playable in detail settings ultra.
Additional Benchmarks
Ultra Low Preset TAA 1280x720
384 [X] Nvidia Titan X (Pascal) AMD Ryzen 9 7950X 4.5GHz
Titan X Pascal
min:
287 fps, P1:
254 fps, max:
463 fps
...
...
...
Intel Arc A580
...
Intel UHD Graphics 32EUs (Alder Lake)
...
...
Intel UHD Graphics 32EUs (Alder Lake)
...
Intel Arc A580
...
...
Intel Arc A580
...
...
Intel Arc A580
...
» With all tested laptops playable in detail settings ultra.
Additional Benchmarks
Low Preset 1280x720
381 [X] Nvidia Titan X (Pascal) AMD Ryzen 9 7950X 4.5GHz
Titan X Pascal
min:
58.3 fps, P0.1:
180.8 fps, P1:
262 fps, max:
678 fps
...
Intel Arc A580
...
...
Intel Arc A580
...
0 100 200 300 400 500 600 700 800 900 Tooltip
...
Intel Arc A580
...
...
Intel Arc A580
...
...
Intel Arc A580
...
...
Intel Arc A580
...
» With all tested laptops playable in detail settings ultra.
Additional Benchmarks
Low Preset 1280x720
113.9 [X] Nvidia Titan X (Pascal) AMD Ryzen 9 7950X 4.5GHz
Titan X Pascal
min:
38 fps, P0.1:
49.2 fps, P1:
80.8 fps, max:
175.7 fps
...
...
...
...
0 100 Tooltip : Ø144.6 (123.179-184.39)
...
Intel Arc A580
...
...
Intel Arc A580
...
...
Intel Arc A580
...
...
Intel Arc A580
...
» With all tested laptops playable in detail settings ultra.
Additional Benchmarks
Low Preset Low TAA 1280x720
338 [X] Nvidia Titan X (Pascal) AMD Ryzen 9 7950X 4.5GHz
Titan X Pascal
min:
14.1 fps, P0.1:
43.6 fps, P1:
222 fps, max:
451 fps
0 100 200 300 400 500 600 700 800 900 1000 1100 Tooltip
...
Intel Arc A580
...
...
Intel Arc A580
...
...
Intel Arc A580
...
...
Intel Arc A580
...
...
Intel Arc A580
...
...
Intel Arc A580
...
» With all tested laptops playable in detail settings ultra.
Additional Benchmarks
Low Preset 1280x720
98.1 [X] Nvidia Titan X (Pascal) AMD Ryzen 9 7950X 4.5GHz
Titan X Pascal
min:
11 fps, P0.1:
75 fps, P1:
82.2 fps, max:
138.4 fps
...
Intel Arc A580
...
...
Intel Arc A580
...
...
Intel Arc A580
...
0 100 200 300 400 500 600 700 800 900 1000 1100 1200 1300 1400 1500 1600 1700 1800 1900 2000 2100 2200 2300 Tooltip
...
Intel Arc A580
...
...
Intel Arc A580
...
...
Intel Arc A580
...
» With all tested laptops playable in detail settings ultra.
Additional Benchmarks
Prioritize Performance Preset 1280x720
188.6 [X] Nvidia Titan X (Pascal) AMD Ryzen 9 7950X 4.5GHz
Titan X Pascal
min:
18.9 fps, P0.1:
85.4 fps, P1:
149 fps, max:
243 fps
...
Intel Arc A580
...
...
Intel Arc A580
...
...
Intel Arc A580
...
...
Intel Arc A580
...
...
Intel Arc A580
...
...
Intel Arc A580
...
» With all tested laptops playable in detail settings ultra.
Additional Benchmarks
Minimum Settings 1280x720
167.8 [X] Nvidia Titan X (Pascal) AMD Ryzen 9 7950X 4.5GHz
Titan X Pascal
...
Intel Arc A580
...
...
...
...
...
...
...
0 100 200 300 400 500 600 Tooltip
...
...
...
Intel Arc A580
...
» With all tested laptops playable in detail settings ultra.
Additional Benchmarks
Ultra Low Preset 1280x720
128.1 [X] Nvidia Titan X (Pascal) AMD Ryzen 9 7950X 4.5GHz
Titan X Pascal
min:
8.62 fps, P0.1:
69.1 fps, P1:
90 fps, max:
185.5 fps
...
...
...
...
...
Intel Arc A580
...
...
Intel Arc A580
...
...
Intel Arc A580
...
...
Intel Arc A580
...
» With all tested laptops playable in detail settings ultra.
Additional Benchmarks
Low Preset 1280x720
247 [X] Nvidia Titan X (Pascal) AMD Ryzen 9 7950X 4.5GHz
Titan X Pascal
min:
68 fps, P0.1:
180.5 fps, P1:
210 fps, max:
344 fps
...
Intel Arc A580
...
...
Intel Arc A580
...
...
Intel Arc A580
...
...
Intel Arc A580
...
...
Intel Arc A580
...
...
...
» With all tested laptops playable in detail settings ultra.
Additional Benchmarks
Low Preset 1280x720
102 [X] Nvidia Titan X (Pascal) AMD Ryzen 9 7950X 4.5GHz
Titan X Pascal
0 100 Tooltip : Ø120.6 (108.197-134.15)
...
Intel Arc A580
...
...
...
...
...
...
Intel Arc A580
...
...
Intel Arc A580
...
...
Intel Arc A580
...
» With all tested laptops playable in detail settings ultra.
Additional Benchmarks
Low Preset Low TAA 1280x720
157.1 [X] Nvidia Titan X (Pascal) AMD Ryzen 9 7950X 4.5GHz
Titan X Pascal
min:
51.6 fps, P0.1:
93.1 fps, P1:
113 fps, max:
197.4 fps
...
Intel Arc A580
...
...
Intel Arc A580
...
...
Intel Arc A380
...
59.3 [X] Nvidia Titan X (Pascal) AMD Ryzen 9 7950X 4.5GHz
Titan X Pascal
min:
31.9 fps, P0.1:
36.2 fps, P1:
44.1 fps, max:
147.9 fps
59.4 [X] Nvidia Titan X (Pascal) AMD Ryzen 9 7950X 4.5GHz
Titan X Pascal
min:
27.1 fps, P0.1:
30.8 fps, P1:
43.9 fps, max:
178.2 fps
~ 59 fps
+ Compare
- Hide Comparison
+ 📈 Graph
- 📈 Hide Graph
0 100 Tooltip : Ø61.6 (48.372-95.6)
: Ø71.1 (49.3-148.3)
...
Intel Arc A580
...
...
Intel Arc A580
...
» With all tested laptops playable in detail settings ultra.
Additional Benchmarks
Low Preset TAA 1280x720
113.2 [X] Nvidia Titan X (Pascal) AMD Ryzen 9 7950X 4.5GHz
Titan X Pascal
min:
36.5 fps, P0.1:
41.6 fps, P1:
71.3 fps, max:
484 fps
...
Intel Arc A580
...
0 100 200 300 400 500 600 700 800 900 1000 1100 1200 1300 1400 1500 1600 1700 1800 1900 Tooltip
Intel UHD Graphics 32EUs (Alder Lake)
...
Intel Arc A580
...
...
Intel Arc A580
...
...
Intel Arc A580
...
...
Intel Arc A580
...
...
Intel Arc A580
...
» With all tested laptops playable in detail settings ultra.
Additional Benchmarks
Low Preset / Off 1280x720
286 [X] Nvidia Titan X (Pascal) AMD Ryzen 9 7950X 4.5GHz
Titan X Pascal
min:
19.4 fps, P0.1:
75.1 fps, P1:
209 fps, max:
425 fps
...
Intel Arc A580
...
...
Intel Arc A580
...
...
Intel Arc A580
...
...
Intel Arc A580
...
...
Intel Arc A580
...
...
Intel Arc A580
...
» With all tested laptops playable in detail settings ultra.
Additional Benchmarks
Low Preset 1280x720
323 [X] Nvidia Titan X (Pascal) AMD Ryzen 9 7950X 4.5GHz
Titan X Pascal
min:
32.5 fps, P0.1:
166.2 fps, P1:
226 fps, max:
465 fps
...
Intel Arc A580
...
...
Intel Arc A580
...
...
...
...
Intel Arc A580
...
...
Intel Arc A580
...
...
Intel Arc A580
...
» With all tested laptops playable in detail settings ultra.
Additional Benchmarks
Low Preset (without FSR Upscaling) 1280x720
178.5 [X] Nvidia Titan X (Pascal) AMD Ryzen 9 7950X 4.5GHz
Titan X Pascal
Ultra Preset (without FSR Upscaling) + Full Ray-Tracing 1920x1080
8.7 [X] Nvidia Titan X (Pascal) AMD Ryzen 9 7950X 4.5GHz
Titan X Pascal
...
...
...
...
...
...
...
Intel Arc A580
...
...
...
...
Intel Arc A580
...
» With all tested laptops playable in detail settings ultra.
Additional Benchmarks
Low Preset 1280x720
167.3 [X] Nvidia Titan X (Pascal) AMD Ryzen 9 7950X 4.5GHz
Titan X Pascal
min:
52.7 fps, P0.1:
90.1 fps, P1:
113.7 fps, max:
245 fps
...
...
...
...
...
...
...
Intel Arc A580
...
...
...
...
Intel Arc A580
...
» With all tested laptops playable in detail settings ultra.
Additional Benchmarks
Very Low Preset 1280x720
136.5 [X] Nvidia Titan X (Pascal) AMD Ryzen 9 7950X 4.5GHz
Titan X Pascal
min:
87.2 fps, P0.1:
93.9 fps, P1:
101.1 fps, max:
263 fps
...
...
...
...
...
...
...
...
...
...
...
...
» With all tested laptops playable in detail settings ultra.
Additional Benchmarks
Basic Quality Preset T2X SMAA 1280x720
166 [X] Nvidia Titan X (Pascal) AMD Ryzen 9 7950X 4.5GHz
Titan X Pascal
...
Intel Arc A580
...
...
Intel Arc A580
...
...
Intel Arc A580
...
...
Intel Arc A580
...
...
...
...
...
» With all tested laptops playable in detail settings ultra.
Additional Benchmarks
Low Preset 1280x720
68.9 [X] Nvidia Titan X (Pascal) AMD Ryzen 9 7950X 4.5GHz
Titan X Pascal
min:
59 fps, P0.1:
59.3 fps, P1:
61.2 fps, max:
79 fps
...
Intel Arc A580
...
...
Intel Arc A580
...
...
Intel Arc A580
...
...
Intel Arc A580
...
...
Intel Arc A580
...
...
Intel Arc A580
...
» With all tested laptops playable in detail settings ultra.
Additional Benchmarks
Low Preset 1280x720
126.8 [X] Nvidia Titan X (Pascal) AMD Ryzen 9 7950X 4.5GHz
Titan X Pascal
min:
67.8 fps, P0.1:
78.2 fps, P1:
95.5 fps, max:
200 fps
0 100 200 300 400 500 600 700 800 900 1000 1100 1200 1300 1400 1500 1600 1700 1800 1900 2000 2100 2200 2300 2400 2500 2600 2700 2800 2900 3000 3100 3200 3300 3400 3500 3600 3700 3800 3900 4000 4100 4200 4300 4400 4500 4600 4700 4800 4900 5000 5100 5200 5300 5400 5500 5600 5700 5800 5900 6000 6100 6200 6300 6400 6500 6600 6700 6800 6900 7000 7100 7200 7300 7400 7500 7600 7700 7800 7900 8000 8100 8200 8300 8400 8500 8600 8700 8800 8900 9000 9100 9200 9300 9400 9500 9600 9700 9800 9900 Tooltip
...
...
...
...
0 100 200 300 400 500 600 700 800 900 1000 1100 1200 1300 1400 1500 1600 1700 1800 1900 Tooltip
...
...
...
...
...
...
...
...
» With all tested laptops playable in detail settings ultra.
Additional Benchmarks
Low Rendering Quality 1280x720
320 [X] Nvidia Titan X (Pascal) AMD Ryzen 9 7950X 4.5GHz
Titan X Pascal
min:
132.1 fps, P0.1:
209 fps, P1:
233 fps, max:
436 fps
144.5 [X] Nvidia Titan X (Pascal) AMD Ryzen 9 7950X 4.5GHz
Titan X Pascal
min:
31.8 fps, P0.1:
69.7 fps, P1:
121.5 fps, max:
330 fps
149 [X] Nvidia Titan X (Pascal) AMD Ryzen 9 7900X 4.7GHz
Titan X Pascal
min:
4.78 fps, P0.1:
40.5 fps, P1:
126 fps, max:
272 fps
~ 147 fps
+ Compare
- Hide Comparison
+ 📈 Graph
- 📈 Hide Graph
0 100 200 300 400 Tooltip : Ø155.2 (126.292-423)
: Ø153.2 (103.527-206.7)
...
...
0 100 200 300 400 500 600 700 Tooltip : Ø114.3 (96-169.1)
: Ø128.8 (93.338-713)
...
...
88 [X] Nvidia Titan X (Pascal) AMD Ryzen 9 7950X 4.5GHz
Titan X Pascal
min:
37.6 fps, P0.1:
48.6 fps, P1:
71.9 fps, max:
246 fps
90.7 [X] Nvidia Titan X (Pascal) AMD Ryzen 9 7900X 4.7GHz
Titan X Pascal
min:
21.3 fps, P0.1:
45.6 fps, P1:
73 fps, max:
214 fps
~ 89 fps
+ Compare
- Hide Comparison
+ 📈 Graph
- 📈 Hide Graph
0 100 Tooltip : Ø90.8 (73.194-126.8)
: Ø93.3 (76.28-111.5)
...
...
68.6 [X] Nvidia Titan X (Pascal) AMD Ryzen 9 7950X 4.5GHz
Titan X Pascal
min:
30.6 fps, P0.1:
33.3 fps, P1:
57.9 fps, max:
209 fps
69.9 [X] Nvidia Titan X (Pascal) AMD Ryzen 9 7900X 4.7GHz
Titan X Pascal
min:
31.4 fps, P0.1:
34.4 fps, P1:
57.6 fps, max:
236 fps
~ 69 fps
+ Compare
- Hide Comparison
+ 📈 Graph
- 📈 Hide Graph
0 100 200 300 400 500 600 700 800 900 1000 1100 1200 1300 1400 1500 1600 1700 Tooltip : Ø73.8 (60.266-150.1)
: Ø107.9 (62.583-1715)
...
...
47.3 [X] Nvidia Titan X (Pascal) AMD Ryzen 9 7950X 4.5GHz
Titan X Pascal
min:
18.4 fps, P0.1:
20.3 fps, P1:
41.4 fps, max:
150.1 fps
47.8 [X] Nvidia Titan X (Pascal) AMD Ryzen 9 7900X 4.7GHz
Titan X Pascal
min:
18.7 fps, P0.1:
20.6 fps, P1:
39.8 fps, max:
210 fps
~ 48 fps
+ Compare
- Hide Comparison
+ 📈 Graph
- 📈 Hide Graph
0 Tooltip : Ø50.6 (43.252-88.9)
: Ø51.3 (44.007-100)
...
...
25.1 [X] Nvidia Titan X (Pascal) AMD Ryzen 9 7950X 4.5GHz
Titan X Pascal
min:
9.24 fps, P0.1:
9.41 fps, P1:
18.3 fps, max:
56.4 fps
25.3 [X] Nvidia Titan X (Pascal) AMD Ryzen 9 7900X 4.7GHz
Titan X Pascal
min:
9.05 fps, P0.1:
9.21 fps, P1:
18 fps, max:
47.4 fps
~ 25 fps
+ Compare
- Hide Comparison
+ 📈 Graph
- 📈 Hide Graph
0 Tooltip : Ø27.7 (22.251-50.6)
: Ø27.7 (22.005-88.2)
...
...
» With all tested laptops playable in detail settings ultra.
Additional Benchmarks
Low Preset 1280x720
198.9 [X] Nvidia Titan X (Pascal) AMD Ryzen 9 7950X 4.5GHz
Titan X Pascal
min:
26.2 fps, P0.1:
64.2 fps, P1:
161.2 fps, max:
318 fps
283 [X] Nvidia Titan X (Pascal) 918016
AMD Ryzen 9 7900X 4.7GHz
Titan X Pascal
min:
235 fps, P1:
193 fps, max:
326 fps
285 [X] Nvidia Titan X (Pascal) 923650
AMD Ryzen 9 7950X 4.5GHz
Titan X Pascal
min:
230 fps, P1:
197 fps, max:
326 fps
~ 284 fps
+ Compare
- Hide Comparison
...
Intel Arc A580
...
250 [X] Nvidia Titan X (Pascal) 918016
AMD Ryzen 9 7900X 4.7GHz
Titan X Pascal
min:
210 fps, P1:
180 fps, max:
284 fps
254 [X] Nvidia Titan X (Pascal) 923650
AMD Ryzen 9 7950X 4.5GHz
Titan X Pascal
min:
220 fps, P1:
184 fps, max:
289 fps
~ 252 fps
+ Compare
- Hide Comparison
...
Intel Arc A580
...
184.6 [X] Nvidia Titan X (Pascal) 918016
AMD Ryzen 9 7900X 4.7GHz
Titan X Pascal
min:
160 fps, P1:
141 fps, max:
202 fps
188 [X] Nvidia Titan X (Pascal) 923650
AMD Ryzen 9 7950X 4.5GHz
Titan X Pascal
min:
167 fps, P1:
144 fps, max:
209 fps
~ 186 fps
+ Compare
- Hide Comparison
...
Intel Arc A580
...
...
...
100.2 [X] Nvidia Titan X (Pascal) 918016
AMD Ryzen 9 7900X 4.7GHz
Titan X Pascal
min:
87 fps, P1:
83 fps, max:
113 fps
101.5 [X] Nvidia Titan X (Pascal) 923650
AMD Ryzen 9 7950X 4.5GHz
Titan X Pascal
min:
88 fps, P1:
85 fps, max:
115 fps
~ 101 fps
+ Compare
- Hide Comparison
...
59.5 [X] Nvidia Titan X (Pascal) 918016
AMD Ryzen 9 7900X 4.7GHz
Titan X Pascal
min:
52 fps, P1:
51 fps, max:
67 fps
59.5 [X] Nvidia Titan X (Pascal) 923650
AMD Ryzen 9 7950X 4.5GHz
Titan X Pascal
min:
51 fps, P1:
52 fps, max:
66 fps
~ 60 fps
+ Compare
- Hide Comparison
...
» With all tested laptops playable in detail settings ultra.
Additional Benchmarks
Ultra Low Preset 16xAF TAA 1280x720
425 [X] Nvidia Titan X (Pascal) AMD Ryzen 9 7900X 4.7GHz
Titan X Pascal
min:
328 fps, P1:
274 fps, max:
504 fps
444 [X] Nvidia Titan X (Pascal) AMD Ryzen 9 7950X 4.5GHz
Titan X Pascal
min:
351 fps, P1:
286 fps, max:
515 fps
337 [X] Nvidia Titan X (Pascal) AMD Ryzen 9 5900X 3.7GHz
Titan X Pascal
min:
158.1 fps, P0.1:
199.5 fps, P1:
239 fps, max:
541 fps
391 [X] Nvidia Titan X (Pascal) AMD Ryzen 9 5900X 3.7GHz
Titan X Pascal
min:
122.4 fps, P0.1:
221 fps, P1:
278 fps, max:
564 fps
~ 364 fps
+ Compare
- Hide Comparison
+ 📈 Graph
- 📈 Hide Graph
0 100 200 300 400 Tooltip : Ø340 (298.081-417.9)
: Ø396 (347.049-463.1)
...
...
198 [X] Nvidia Titan X (Pascal) AMD Ryzen 9 5900X 3.7GHz
Titan X Pascal
min:
32.4 fps, P0.1:
136.7 fps, P1:
154.2 fps, max:
315 fps
267 [X] Nvidia Titan X (Pascal) AMD Ryzen 9 5900X 3.7GHz
Titan X Pascal
min:
3.05 fps, P0.1:
159.9 fps, P1:
198.4 fps, max:
468 fps
~ 233 fps
+ Compare
- Hide Comparison
+ 📈 Graph
- 📈 Hide Graph
0 100 200 300 Tooltip : Ø199.4 (177.585-229.04)
: Ø269 (180.63-341.9)
...
...
185.4 [X] Nvidia Titan X (Pascal) AMD Ryzen 9 5900X 3.7GHz
Titan X Pascal
min:
100.7 fps, P0.1:
115.4 fps, P1:
139.1 fps, max:
339 fps
252 [X] Nvidia Titan X (Pascal) AMD Ryzen 9 5900X 3.7GHz
Titan X Pascal
min:
83.9 fps, P0.1:
155.8 fps, P1:
180.8 fps, max:
434 fps
~ 219 fps
+ Compare
- Hide Comparison
+ 📈 Graph
- 📈 Hide Graph
0 100 200 300 400 500 600 700 800 900 1000 1100 1200 1300 1400 1500 1600 1700 1800 1900 2000 2100 2200 2300 2400 2500 2600 2700 2800 2900 3000 3100 3200 3300 3400 3500 3600 3700 3800 3900 4000 4100 4200 Tooltip : Ø336 (163.273-4254)
: Ø260 (227.012-407.1)
...
...
179.2 [X] Nvidia Titan X (Pascal) AMD Ryzen 9 5900X 3.7GHz
Titan X Pascal
min:
65.7 fps, P0.1:
98.9 fps, P1:
138.9 fps, max:
349 fps
244 [X] Nvidia Titan X (Pascal) AMD Ryzen 9 5900X 3.7GHz
Titan X Pascal
min:
64.3 fps, P0.1:
156.2 fps, P1:
177.7 fps, max:
408 fps
~ 212 fps
+ Compare
- Hide Comparison
+ 📈 Graph
- 📈 Hide Graph
0 100 200 Tooltip : Ø179.9 (158.997-217.023)
: Ø246 (218.302-298.568)
...
...
0 100 200 300 Tooltip : Ø132.3 (107.242-367)
: Ø175 (148.322-209.8)
...
...
65.3 [X] Nvidia Titan X (Pascal) AMD Ryzen 9 5900X 3.7GHz
Titan X Pascal
min:
36 fps, P0.1:
43.4 fps, P1:
50.7 fps, max:
140.4 fps
93.6 [X] Nvidia Titan X (Pascal) AMD Ryzen 9 5900X 3.7GHz
Titan X Pascal
min:
27.1 fps, P0.1:
57.1 fps, P1:
71.5 fps, max:
250 fps
~ 79 fps
+ Compare
- Hide Comparison
+ 📈 Graph
- 📈 Hide Graph
0 100 Tooltip : Ø69.8 (57.89-140.7)
: Ø98 (82.63-123)
...
...
» With all tested laptops playable in detail settings ultra.
Additional Benchmarks
Low Preset 1280x720
391 [X] Nvidia Titan X (Pascal) AMD Ryzen 9 5900X 3.7GHz
Titan X Pascal
min:
37 fps, P0.1:
237 fps, P1:
276 fps, max:
555 fps
411 [X] Nvidia Titan X (Pascal) AMD Ryzen 9 5900X 3.7GHz
Titan X Pascal
min:
34.2 fps, P0.1:
230 fps, P1:
289 fps, max:
568 fps
138.9 [X] Nvidia Titan X (Pascal) AMD Ryzen 9 5900X 3.7GHz
Titan X Pascal
min:
46.1 fps, P0.1:
81.1 fps, P1:
94.7 fps, max:
245 fps
205 [X] Nvidia Titan X (Pascal) AMD Ryzen 9 5900X 3.7GHz
Titan X Pascal
min:
45.7 fps, P0.1:
100 fps, P1:
148.9 fps, max:
277 fps
~ 172 fps
+ Compare
- Hide Comparison
+ 📈 Graph
- 📈 Hide Graph
0 100 200 Tooltip : Ø142.7 (122.405-160.9)
: Ø208 (193.91-225.5)
...
...
137.9 [X] Nvidia Titan X (Pascal) AMD Ryzen 9 5900X 3.7GHz
Titan X Pascal
min:
30.2 fps, P0.1:
83.2 fps, P1:
95.3 fps, max:
238 fps
203 [X] Nvidia Titan X (Pascal) AMD Ryzen 9 5900X 3.7GHz
Titan X Pascal
min:
42 fps, P0.1:
95.2 fps, P1:
150.5 fps, max:
271 fps
~ 170 fps
+ Compare
- Hide Comparison
+ 📈 Graph
- 📈 Hide Graph
0 100 200 300 400 500 Tooltip : Ø140.4 (122.1-163.9)
: Ø216 (189.848-540)
...
...
0 100 200 300 Tooltip : Ø156.3 (118.602-391)
: Ø199.1 (188.018-216.481)
...
...
136.5 [X] Nvidia Titan X (Pascal) AMD Ryzen 9 5900X 3.7GHz
Titan X Pascal
min:
31.5 fps, P0.1:
77.8 fps, P1:
92.2 fps, max:
236 fps
202 [X] Nvidia Titan X (Pascal) AMD Ryzen 9 5900X 3.7GHz
Titan X Pascal
min:
40.3 fps, P0.1:
106.5 fps, P1:
151 fps, max:
274 fps
~ 169 fps
+ Compare
- Hide Comparison
+ 📈 Graph
- 📈 Hide Graph
0 100 200 300 Tooltip : Ø147.5 (119.664-248.3)
: Ø209 (191.24-364.4)
...
...
92.5 [X] Nvidia Titan X (Pascal) AMD Ryzen 9 5900X 3.7GHz
Titan X Pascal
min:
32.7 fps, P0.1:
49.1 fps, P1:
56.2 fps, max:
228 fps
141 [X] Nvidia Titan X (Pascal) AMD Ryzen 9 5900X 3.7GHz
Titan X Pascal
min:
34.5 fps, P0.1:
65.6 fps, P1:
95.5 fps, max:
243 fps
~ 117 fps
+ Compare
- Hide Comparison
+ 📈 Graph
- 📈 Hide Graph
0 100 200 300 Tooltip : Ø105.1 (85.89-340)
: Ø144.4 (135.024-177.7)
...
...
48 [X] Nvidia Titan X (Pascal) AMD Ryzen 9 5900X 3.7GHz
Titan X Pascal
min:
16.2 fps, P0.1:
22.5 fps, P1:
26.6 fps, max:
219 fps
73.3 [X] Nvidia Titan X (Pascal) AMD Ryzen 9 5900X 3.7GHz
Titan X Pascal
min:
33.4 fps, P0.1:
39.4 fps, P1:
42.6 fps, max:
236 fps
~ 61 fps
+ Compare
- Hide Comparison
+ 📈 Graph
- 📈 Hide Graph
0 100 Tooltip : Ø51.4 (45.044-79.9)
: Ø79.2 (70.739-143.2)
...
...
» With all tested laptops playable in detail settings ultra.
Additional Benchmarks
Lowest Settings 1280x720
224 [X] Nvidia Titan X (Pascal) AMD Ryzen 9 5900X 3.7GHz
Titan X Pascal
min:
25.6 fps, P0.1:
100.4 fps, P1:
177.9 fps, max:
279 fps
203 [X] Nvidia Titan X (Pascal) AMD Ryzen 9 5900X 3.7GHz
Titan X Pascal
min:
24.6 fps, P0.1:
87.4 fps, P1:
145.4 fps, max:
281 fps
Highest Settings + Maximum Ray Tracing 1920x1080
74.5 [X] Nvidia Titan X (Pascal) AMD Ryzen 9 5900X 3.7GHz
Titan X Pascal
min:
22.7 fps, P0.1:
36.8 fps, P1:
47.7 fps, max:
151.1 fps
14.1 [X] Nvidia Titan X (Pascal) AMD Ryzen 9 5900X 3.7GHz
Titan X Pascal
min:
5.91 fps, P0.1:
5.94 fps, P1:
6.53 fps, max:
143.3 fps
171 [X] Nvidia Titan X (Pascal) AMD Ryzen 9 5900X 3.7GHz
Titan X Pascal
176.9 [X] Nvidia Titan X (Pascal) AMD Ryzen 9 7900X 4.7GHz
Titan X Pascal
180.3 [X] Nvidia Titan X (Pascal) AMD Ryzen 9 7950X 4.5GHz
Titan X Pascal
245 [X] Nvidia Titan X (Pascal) AMD Ryzen 9 5900X 3.7GHz
Titan X Pascal
~ 193 fps
+ Compare
- Hide Comparison
...
...
141.6 [X] Nvidia Titan X (Pascal) AMD Ryzen 9 5900X 3.7GHz
Titan X Pascal
142 [X] Nvidia Titan X (Pascal) AMD Ryzen 9 7900X 4.7GHz
Titan X Pascal
146.3 [X] Nvidia Titan X (Pascal) AMD Ryzen 9 7950X 4.5GHz
Titan X Pascal
201 [X] Nvidia Titan X (Pascal) AMD Ryzen 9 5900X 3.7GHz
Titan X Pascal
~ 158 fps
+ Compare
- Hide Comparison
...
...
100.3 [X] Nvidia Titan X (Pascal) AMD Ryzen 9 7900X 4.7GHz
Titan X Pascal
103.2 [X] Nvidia Titan X (Pascal) AMD Ryzen 9 7950X 4.5GHz
Titan X Pascal
103.4 [X] Nvidia Titan X (Pascal) AMD Ryzen 9 5900X 3.7GHz
Titan X Pascal
151.3 [X] Nvidia Titan X (Pascal) AMD Ryzen 9 5900X 3.7GHz
Titan X Pascal
~ 115 fps
+ Compare
- Hide Comparison
...
...
80.5 [X] Nvidia Titan X (Pascal) AMD Ryzen 9 7900X 4.7GHz
Titan X Pascal
82.2 [X] Nvidia Titan X (Pascal) AMD Ryzen 9 7950X 4.5GHz
Titan X Pascal
84.6 [X] Nvidia Titan X (Pascal) AMD Ryzen 9 5900X 3.7GHz
Titan X Pascal
124.3 [X] Nvidia Titan X (Pascal) AMD Ryzen 9 5900X 3.7GHz
Titan X Pascal
~ 93 fps
+ Compare
- Hide Comparison
...
...
56.3 [X] Nvidia Titan X (Pascal) AMD Ryzen 9 7900X 4.7GHz
Titan X Pascal
57.6 [X] Nvidia Titan X (Pascal) AMD Ryzen 9 7950X 4.5GHz
Titan X Pascal
62.3 [X] Nvidia Titan X (Pascal) AMD Ryzen 9 5900X 3.7GHz
Titan X Pascal
92.4 [X] Nvidia Titan X (Pascal) AMD Ryzen 9 5900X 3.7GHz
Titan X Pascal
~ 67 fps
+ Compare
- Hide Comparison
...
...
30.9 [X] Nvidia Titan X (Pascal) AMD Ryzen 9 7900X 4.7GHz
Titan X Pascal
31.5 [X] Nvidia Titan X (Pascal) AMD Ryzen 9 7950X 4.5GHz
Titan X Pascal
34.1 [X] Nvidia Titan X (Pascal) AMD Ryzen 9 5900X 3.7GHz
Titan X Pascal
50.4 [X] Nvidia Titan X (Pascal) AMD Ryzen 9 5900X 3.7GHz
Titan X Pascal
~ 37 fps
+ Compare
- Hide Comparison
...
...
» With all tested laptops playable in detail settings ultra.
Additional Benchmarks
Lowest Preset (DX12) 1280x720
330 [X] Nvidia Titan X (Pascal) AMD Ryzen 9 5900X 3.7GHz
Titan X Pascal
268 [X] Nvidia Titan X (Pascal) AMD Ryzen 9 5900X 3.7GHz
Titan X Pascal
303 [X] Nvidia Titan X (Pascal) AMD Ryzen 9 7950X 4.5GHz
Titan X Pascal
79.1 [X] Nvidia Titan X (Pascal) AMD Ryzen 9 5900X 3.7GHz
Titan X Pascal
86.6 [X] Nvidia Titan X (Pascal) 1.6
AMD Ryzen 9 7950X 4.5GHz
Titan X Pascal
min:
59.3 fps, max:
220 fps
~ 83 fps
+ Compare
- Hide Comparison
...
...
70.4 [X] Nvidia Titan X (Pascal) 1.6
AMD Ryzen 9 7950X 4.5GHz
Titan X Pascal
min:
51.5 fps, max:
155.9 fps
77.6 [X] Nvidia Titan X (Pascal) AMD Ryzen 9 5900X 3.7GHz
Titan X Pascal
~ 74 fps
+ Compare
- Hide Comparison
...
Intel Arc A580
...
61.5 [X] Nvidia Titan X (Pascal) 1.6
AMD Ryzen 9 7950X 4.5GHz
Titan X Pascal
min:
45.6 fps, max:
93.4 fps
69.2 [X] Nvidia Titan X (Pascal) AMD Ryzen 9 5900X 3.7GHz
Titan X Pascal
~ 65 fps
+ Compare
- Hide Comparison
...
Intel Arc A580
...
55.5 [X] Nvidia Titan X (Pascal) 1.6
AMD Ryzen 9 7950X 4.5GHz
Titan X Pascal
min:
37.9 fps, max:
77.1 fps
59.2 [X] Nvidia Titan X (Pascal) AMD Ryzen 9 5900X 3.7GHz
Titan X Pascal
~ 57 fps
+ Compare
- Hide Comparison
...
Intel Arc A580
...
35.2 [X] Nvidia Titan X (Pascal) 1.6
AMD Ryzen 9 7950X 4.5GHz
Titan X Pascal
min:
24.2 fps, max:
46 fps
37.9 [X] Nvidia Titan X (Pascal) AMD Ryzen 9 5900X 3.7GHz
Titan X Pascal
~ 37 fps
+ Compare
- Hide Comparison
...
Intel Arc A580
...
16.6 [X] Nvidia Titan X (Pascal) 1.6
AMD Ryzen 9 7950X 4.5GHz
Titan X Pascal
min:
12.2 fps, max:
21.5 fps
17.5 [X] Nvidia Titan X (Pascal) AMD Ryzen 9 5900X 3.7GHz
Titan X Pascal
~ 17 fps
+ Compare
- Hide Comparison
...
...
» With all tested laptops playable in detail settings ultra.
Additional Benchmarks
Low Preset 1280x720
79.7 [X] Nvidia Titan X (Pascal) AMD Ryzen 9 5900X 3.7GHz
Titan X Pascal
129.9 [X] Nvidia Titan X (Pascal) AMD Ryzen 9 7950X 4.5GHz
Titan X Pascal
min:
58.9 fps, max:
250 fps
90.2 [X] Nvidia Titan X (Pascal) AMD Ryzen 9 5900X 3.7GHz
Titan X Pascal
min:
23.9 fps, P0.1:
63.6 fps, P1:
74 fps, max:
128 fps
94 [X] Nvidia Titan X (Pascal) AMD Ryzen 9 5900X 3.7GHz
Titan X Pascal
min:
25.3 fps, P0.1:
51.3 fps, P1:
73.5 fps, max:
151 fps
~ 92 fps
+ Compare
- Hide Comparison
+ 📈 Graph
- 📈 Hide Graph
0 100 Tooltip : Ø94.3 (80.254-132)
: Ø98.1 (84.638-148.5)
...
...
...
...
...
...
...
...
...
...
» With all tested laptops playable in detail settings ultra.
Additional Benchmarks
Low / Off 1280x720
100 [X] Nvidia Titan X (Pascal) AMD Ryzen 9 5900X 3.7GHz
Titan X Pascal
min:
27.5 fps, P0.1:
40 fps, P1:
68 fps, max:
175 fps
205 [X] Nvidia Titan X (Pascal) AMD Ryzen 9 5900X 3.7GHz
Titan X Pascal
224.1 [X] Nvidia Titan X (Pascal) AMD Ryzen 9 7900X 4.7GHz
Titan X Pascal
234 [X] Nvidia Titan X (Pascal) 591708
AMD Ryzen 9 7950X 4.5GHz
Titan X Pascal
min:
76.7 fps, max:
391 fps
~ 221 fps
+ Compare
- Hide Comparison
...
...
164.2 [X] Nvidia Titan X (Pascal) AMD Ryzen 9 5900X 3.7GHz
Titan X Pascal
172.6 [X] Nvidia Titan X (Pascal) AMD Ryzen 9 7900X 4.7GHz
Titan X Pascal
180.3 [X] Nvidia Titan X (Pascal) 591708
AMD Ryzen 9 7950X 4.5GHz
Titan X Pascal
min:
69.4 fps, max:
325 fps
~ 172 fps
+ Compare
- Hide Comparison
...
...
137 [X] Nvidia Titan X (Pascal) AMD Ryzen 9 5900X 3.7GHz
Titan X Pascal
139.9 [X] Nvidia Titan X (Pascal) AMD Ryzen 9 7900X 4.7GHz
Titan X Pascal
146 [X] Nvidia Titan X (Pascal) 591708
AMD Ryzen 9 7950X 4.5GHz
Titan X Pascal
min:
46.9 fps, max:
296 fps
~ 141 fps
+ Compare
- Hide Comparison
...
...
104.5 [X] Nvidia Titan X (Pascal) AMD Ryzen 9 5900X 3.7GHz
Titan X Pascal
110.4 [X] Nvidia Titan X (Pascal) AMD Ryzen 9 7900X 4.7GHz
Titan X Pascal
115.9 [X] Nvidia Titan X (Pascal) 591708
AMD Ryzen 9 7950X 4.5GHz
Titan X Pascal
min:
43.6 fps, max:
256 fps
~ 110 fps
+ Compare
- Hide Comparison
...
Intel Arc A580
...
84.4 [X] Nvidia Titan X (Pascal) AMD Ryzen 9 5900X 3.7GHz
Titan X Pascal
88.6 [X] Nvidia Titan X (Pascal) AMD Ryzen 9 7900X 4.7GHz
Titan X Pascal
91.6 [X] Nvidia Titan X (Pascal) 591708
AMD Ryzen 9 7950X 4.5GHz
Titan X Pascal
min:
53 fps, max:
243 fps
~ 88 fps
+ Compare
- Hide Comparison
...
Intel Arc A580
...
53.4 [X] Nvidia Titan X (Pascal) AMD Ryzen 9 5900X 3.7GHz
Titan X Pascal
56.1 [X] Nvidia Titan X (Pascal) AMD Ryzen 9 7900X 4.7GHz
Titan X Pascal
57.3 [X] Nvidia Titan X (Pascal) 591708
AMD Ryzen 9 7950X 4.5GHz
Titan X Pascal
min:
40.6 fps, max:
109.4 fps
~ 56 fps
+ Compare
- Hide Comparison
...
...
» With all tested laptops playable in detail settings ultra.
Additional Benchmarks
Low Preset 1280x720
204.4 [X] Nvidia Titan X (Pascal) AMD Ryzen 9 5900X 3.7GHz
Titan X Pascal
283 [X] Nvidia Titan X (Pascal) AMD Ryzen 9 7950X 4.5GHz
Titan X Pascal
min:
75.8 fps, max:
426 fps
...
...
...
...
...
...
59.9 [X] Nvidia Titan X (Pascal) AMD Ryzen 9 5900X 3.7GHz
Titan X Pascal
min:
27 fps, P0.1:
35.2 fps, P1:
51.2 fps, max:
98.4 fps
59.9 [X] Nvidia Titan X (Pascal) AMD Ryzen 9 5900X 3.7GHz
Titan X Pascal
min:
29.8 fps, P0.1:
35.8 fps, P1:
49.7 fps, max:
104.7 fps
~ 60 fps
+ Compare
- Hide Comparison
+ 📈 Graph
- 📈 Hide Graph
0 100 200 300 400 500 600 700 800 900 1000 1100 1200 1300 1400 1500 1600 1700 1800 1900 2000 2100 2200 2300 2400 2500 2600 2700 2800 2900 3000 3100 3200 3300 3400 3500 3600 3700 3800 3900 4000 4100 4200 4300 4400 4500 4600 4700 4800 4900 5000 5100 5200 5300 5400 5500 5600 5700 5800 5900 6000 6100 6200 6300 6400 6500 6600 6700 6800 6900 7000 7100 7200 7300 7400 7500 7600 7700 7800 7900 8000 8100 8200 8300 8400 8500 8600 8700 8800 8900 9000 9100 9200 9300 9400 9500 9600 9700 9800 9900 Tooltip : Ø61.8 (59.009-90.2)
: Ø422 (59.028-10149)
...
...
...
...
...
...
» With all tested laptops playable in detail settings ultra.
Additional Benchmarks
Low Preset 1280x720
59.9 [X] Nvidia Titan X (Pascal) AMD Ryzen 9 5900X 3.7GHz
Titan X Pascal
0 100 Tooltip : Ø127.8 (121.585-135.18)
...
...
...
...
...
...
...
...
...
...
» With all tested laptops playable in detail settings high.
Additional Benchmarks
Low Quality 1280x720
158 [X] Nvidia Titan X (Pascal) AMD Ryzen 9 5900X 3.7GHz
Titan X Pascal
min:
34.6 fps, P0.1:
88 fps, P1:
134 fps, max:
188 fps
...
...
...
...
...
...
...
...
...
...
...
...
» With all tested laptops playable in detail settings ultra.
Additional Benchmarks
Ultra Low Preset (with Fixed Resolution Quality) 1280x720
286 [X] Nvidia Titan X (Pascal) AMD Ryzen 9 5900X 3.7GHz
Titan X Pascal
115 [X] Nvidia Titan X (Pascal) AMD Ryzen 9 5900X 3.7GHz
Titan X Pascal
min:
81 fps, P0.1:
84.5 fps, P1:
95 fps, max:
213 fps
116.3 [X] Nvidia Titan X (Pascal) AMD Ryzen 9 7900X 4.7GHz
Titan X Pascal
min:
59.1 fps, P0.1:
75.9 fps, P1:
99.7 fps, max:
530 fps
116.6 [X] Nvidia Titan X (Pascal) AMD Ryzen 9 7950X 4.5GHz
Titan X Pascal
min:
65.4 fps, P0.1:
85.9 fps, P1:
103.6 fps, max:
295 fps
~ 116 fps
+ Compare
- Hide Comparison
+ 📈 Graph
- 📈 Hide Graph
0 100 200 Tooltip : Ø120.2 (108.711-225)
: Ø122.7 (111.06-190.1)
: Ø118.8 (109.43-144.7)
...
...
98.2 [X] Nvidia Titan X (Pascal) AMD Ryzen 9 7900X 4.7GHz
Titan X Pascal
min:
55.2 fps, P0.1:
69.3 fps, P1:
86.3 fps, max:
510 fps
98.8 [X] Nvidia Titan X (Pascal) AMD Ryzen 9 5900X 3.7GHz
Titan X Pascal
min:
70.8 fps, P0.1:
75.8 fps, P1:
82.8 fps, max:
163 fps
102.6 [X] Nvidia Titan X (Pascal) AMD Ryzen 9 7950X 4.5GHz
Titan X Pascal
min:
67.5 fps, P0.1:
84.2 fps, P1:
93 fps, max:
230 fps
~ 100 fps
+ Compare
- Hide Comparison
+ 📈 Graph
- 📈 Hide Graph
0 100 200 300 400 Tooltip : Ø113.3 (93.291-494)
: Ø113.4 (92.629-427)
: Ø104 (98.373-109.963)
...
...
82.2 [X] Nvidia Titan X (Pascal) AMD Ryzen 9 5900X 3.7GHz
Titan X Pascal
min:
58.9 fps, P0.1:
62.2 fps, P1:
70.1 fps, max:
152 fps
82.2 [X] Nvidia Titan X (Pascal) AMD Ryzen 9 7900X 4.7GHz
Titan X Pascal
min:
55.4 fps, P0.1:
61.8 fps, P1:
72.2 fps, max:
151.9 fps
84.6 [X] Nvidia Titan X (Pascal) AMD Ryzen 9 7950X 4.5GHz
Titan X Pascal
min:
43.6 fps, P0.1:
62.3 fps, P1:
75.7 fps, max:
349 fps
~ 83 fps
+ Compare
- Hide Comparison
+ 📈 Graph
- 📈 Hide Graph
0 100 200 300 400 Tooltip : Ø92.3 (77.011-281)
: Ø87.6 (77.716-173.9)
: Ø103.2 (80.62-422)
...
...
59.7 [X] Nvidia Titan X (Pascal) AMD Ryzen 9 5900X 3.7GHz
Titan X Pascal
min:
40.8 fps, P0.1:
44 fps, P1:
49.7 fps, max:
98.1 fps
60 [X] Nvidia Titan X (Pascal) AMD Ryzen 9 7950X 4.5GHz
Titan X Pascal
min:
37.5 fps, P0.1:
40.3 fps, P1:
52.8 fps, max:
147.7 fps
62.4 [X] Nvidia Titan X (Pascal) AMD Ryzen 9 7900X 4.7GHz
Titan X Pascal
min:
38.7 fps, P0.1:
48 fps, P1:
54.8 fps, max:
134.2 fps
~ 61 fps
+ Compare
- Hide Comparison
+ 📈 Graph
- 📈 Hide Graph
0 100 Tooltip : Ø64.1 (52.184-100.6)
: Ø63.3 (54.765-72.8)
: Ø65.3 (58.057-83.9)
...
...
49.3 [X] Nvidia Titan X (Pascal) AMD Ryzen 9 5900X 3.7GHz
Titan X Pascal
min:
37.1 fps, P0.1:
40.3 fps, P1:
42.2 fps, max:
77.4 fps
50 [X] Nvidia Titan X (Pascal) AMD Ryzen 9 7950X 4.5GHz
Titan X Pascal
min:
37.6 fps, P0.1:
39.1 fps, P1:
43.9 fps, max:
80.7 fps
50.9 [X] Nvidia Titan X (Pascal) AMD Ryzen 9 7900X 4.7GHz
Titan X Pascal
min:
32.6 fps, P0.1:
37 fps, P1:
43.4 fps, max:
105.3 fps
~ 50 fps
+ Compare
- Hide Comparison
+ 📈 Graph
- 📈 Hide Graph
0 100 200 300 400 500 600 700 800 900 1000 1100 1200 1300 1400 1500 1600 1700 1800 1900 2000 2100 2200 2300 2400 2500 2600 2700 2800 2900 3000 3100 3200 3300 3400 3500 3600 3700 3800 3900 4000 4100 4200 4300 4400 4500 4600 4700 4800 4900 5000 5100 5200 5300 5400 5500 5600 5700 5800 5900 6000 6100 6200 6300 6400 6500 6600 6700 6800 6900 7000 7100 7200 7300 7400 7500 7600 7700 7800 7900 8000 8100 8200 8300 8400 8500 8600 8700 8800 8900 9000 9100 9200 9300 9400 9500 9600 9700 9800 9900 Tooltip : Ø51.5 (44.51-60.4)
: Ø437 (46.5-11337)
: Ø59.9 (46.15-244.8)
...
...
33.3 [X] Nvidia Titan X (Pascal) AMD Ryzen 9 5900X 3.7GHz
Titan X Pascal
min:
26.2 fps, P0.1:
26.2 fps, P1:
30.3 fps, max:
41.8 fps
33.6 [X] Nvidia Titan X (Pascal) AMD Ryzen 9 7900X 4.7GHz
Titan X Pascal
min:
23.9 fps, P0.1:
28.3 fps, P1:
30 fps, max:
52.4 fps
34.2 [X] Nvidia Titan X (Pascal) AMD Ryzen 9 7950X 4.5GHz
Titan X Pascal
min:
26.8 fps, P0.1:
28.7 fps, P1:
30.3 fps, max:
45 fps
~ 34 fps
+ Compare
- Hide Comparison
+ 📈 Graph
- 📈 Hide Graph
0 Tooltip : Ø40.7 (31.295-96.3)
: Ø38.3 (32.055-77.9)
: Ø37.2 (31.586-50.6)
...
...
» With all tested laptops playable in detail settings ultra.
Additional Benchmarks
Low Preset 1280x720
154 [X] Nvidia Titan X (Pascal) AMD Ryzen 9 5900X 3.7GHz
Titan X Pascal
min:
41.2 fps, P0.1:
89.4 fps, P1:
110 fps, max:
390 fps
163.8 [X] Nvidia Titan X (Pascal) AMD Ryzen 9 7950X 4.5GHz
Titan X Pascal
min:
79.6 fps, P0.1:
127.1 fps, P1:
141 fps, max:
480 fps
...
...
...
...
...
...
...
...
...
» With all tested laptops playable in detail settings ultra.
Additional Benchmarks
Low Preset 1920x1080
110 [X] Nvidia Titan X (Pascal) AMD Ryzen 9 5900X 3.7GHz
Titan X Pascal
min:
28.8 fps, P0.1:
55.2 fps, P1:
83.5 fps, max:
281 fps
...
Intel Arc A380
...
...
...
...
Intel Arc A580
...
...
Intel Arc A580
...
...
Intel Arc A580
...
...
Intel Arc A580
...
» With all tested laptops playable in detail settings ultra.
Additional Benchmarks
Low Preset 1920x1080
291 [X] Nvidia Titan X (Pascal) AMD Ryzen 9 5900X 3.7GHz
Titan X Pascal
min:
36.6 fps, P0.1:
143 fps, P1:
172 fps, max:
363 fps
...
...
...
...
...
...
...
...
...
0 100 200 300 400 500 600 700 Tooltip
...
...
» With all tested laptops playable in detail settings ultra.
Additional Benchmarks
Low Preset 1920x1080
135 [X] Nvidia Titan X (Pascal) AMD Ryzen 9 5900X 3.7GHz
Titan X Pascal
min:
7.89 fps, P0.1:
67 fps, P1:
97.9 fps, max:
184 fps
178 [X] Nvidia Titan X (Pascal) AMD Ryzen 9 5900X 3.7GHz
Titan X Pascal
206 [X] Nvidia Titan X (Pascal) AMD Ryzen 9 7900X 4.7GHz
Titan X Pascal
211 [X] Nvidia Titan X (Pascal) AMD Ryzen 9 7950X 4.5GHz
Titan X Pascal
~ 198 fps
+ Compare
- Hide Comparison
...
...
115 [X] Nvidia Titan X (Pascal) AMD Ryzen 9 5900X 3.7GHz
Titan X Pascal
119 [X] Nvidia Titan X (Pascal) AMD Ryzen 9 7900X 4.7GHz
Titan X Pascal
123 [X] Nvidia Titan X (Pascal) AMD Ryzen 9 7950X 4.5GHz
Titan X Pascal
~ 119 fps
+ Compare
- Hide Comparison
...
Intel Arc A580
...
103 [X] Nvidia Titan X (Pascal) AMD Ryzen 9 5900X 3.7GHz
Titan X Pascal
106 [X] Nvidia Titan X (Pascal) AMD Ryzen 9 7900X 4.7GHz
Titan X Pascal
110 [X] Nvidia Titan X (Pascal) AMD Ryzen 9 7950X 4.5GHz
Titan X Pascal
~ 106 fps
+ Compare
- Hide Comparison
...
Intel Arc A580
...
64 [X] Nvidia Titan X (Pascal) AMD Ryzen 9 5900X 3.7GHz
Titan X Pascal
66 [X] Nvidia Titan X (Pascal) AMD Ryzen 9 7900X 4.7GHz
Titan X Pascal
68 [X] Nvidia Titan X (Pascal) AMD Ryzen 9 7950X 4.5GHz
Titan X Pascal
~ 66 fps
+ Compare
- Hide Comparison
...
...
56 [X] Nvidia Titan X (Pascal) AMD Ryzen 9 5900X 3.7GHz
Titan X Pascal
57 [X] Nvidia Titan X (Pascal) AMD Ryzen 9 7900X 4.7GHz
Titan X Pascal
58 [X] Nvidia Titan X (Pascal) AMD Ryzen 9 7950X 4.5GHz
Titan X Pascal
~ 57 fps
+ Compare
- Hide Comparison
...
Intel Arc A580
...
41 [X] Nvidia Titan X (Pascal) AMD Ryzen 9 5900X 3.7GHz
Titan X Pascal
41 [X] Nvidia Titan X (Pascal) AMD Ryzen 9 7900X 4.7GHz
Titan X Pascal
42 [X] Nvidia Titan X (Pascal) AMD Ryzen 9 7950X 4.5GHz
Titan X Pascal
~ 41 fps
+ Compare
- Hide Comparison
...
Intel Arc A580
...
» With all tested laptops playable in detail settings ultra.
Additional Benchmarks
Low Preset 1920x1080
135 [X] Nvidia Titan X (Pascal) AMD Ryzen 9 5900X 3.7GHz
Titan X Pascal
148 [X] Nvidia Titan X (Pascal) AMD Ryzen 9 7950X 4.5GHz
Titan X Pascal
...
...
0 100 200 300 400 500 600 700 800 900 1000 1100 1200 Tooltip
...
...
...
...
...
...
...
...
...
...
» With all tested laptops playable in detail settings ultra.
Additional Benchmarks
Low Preset 1920x1080
78.3 [X] Nvidia Titan X (Pascal) AMD Ryzen 9 5900X 3.7GHz
Titan X Pascal
...
...
...
...
...
...
...
...
...
...
...
...
» With all tested laptops playable in detail settings ultra.
Additional Benchmarks
Low Preset 1920x1080
143 [X] Nvidia Titan X (Pascal) AMD Ryzen 9 5900X 3.7GHz
Titan X Pascal
min:
119 fps, max:
179 fps
...
Intel Arc A580
...
...
Intel Arc A580
...
...
Intel Arc A580
...
...
Intel Arc A580
...
...
Intel Arc A580
...
...
Intel Arc A580
...
» With all tested laptops playable in detail settings ultra.
Additional Benchmarks
Low Preset 1920x1080
114 [X] Nvidia Titan X (Pascal) AMD Ryzen 9 5900X 3.7GHz
Titan X Pascal
Ultra Preset + Ultra Ray-Tracing 1920x1080
25 [X] Nvidia Titan X (Pascal) AMD Ryzen 9 5900X 3.7GHz
Titan X Pascal
...
...
...
...
0 100 200 Tooltip : Ø181.3 (140.032-238.31)
...
...
...
...
...
...
» With all tested laptops playable in detail settings ultra.
Additional Benchmarks
Low Preset (DX12) 1920x1080
292 [X] Nvidia Titan X (Pascal) AMD Ryzen 9 5900X 3.7GHz
Titan X Pascal
min:
31.1 fps, P0.1:
57.3 fps, P1:
162 fps, max:
604 fps
132 [X] Nvidia Titan X (Pascal) AMD Ryzen 9 5900X 3.7GHz
Titan X Pascal
min:
111 fps, max:
177 fps
154.8 [X] Nvidia Titan X (Pascal) AMD Ryzen 9 7900X 4.7GHz
Titan X Pascal
min:
118 fps, max:
214 fps
154.9 [X] Nvidia Titan X (Pascal) AMD Ryzen 9 7950X 4.5GHz
Titan X Pascal
min:
117 fps, max:
215 fps
~ 147 fps
+ Compare
- Hide Comparison
+ 📈 Graph
- 📈 Hide Graph
0 100 200 Tooltip : Ø132.2 (111-177)
: Ø154.8 (118-214)
: Ø154.9 (117-215)
...
...
0 100 Tooltip : Ø100.6 (83-122)
: Ø104.1 (81-126)
: Ø104.9 (84-131)
...
...
84.7 [X] Nvidia Titan X (Pascal) AMD Ryzen 9 5900X 3.7GHz
Titan X Pascal
min:
65 fps, max:
104 fps
87.4 [X] Nvidia Titan X (Pascal) AMD Ryzen 9 7900X 4.7GHz
Titan X Pascal
min:
66 fps, max:
111 fps
88.8 [X] Nvidia Titan X (Pascal) AMD Ryzen 9 7950X 4.5GHz
Titan X Pascal
min:
66 fps, max:
113 fps
~ 87 fps
+ Compare
- Hide Comparison
+ 📈 Graph
- 📈 Hide Graph
0 100 Tooltip : Ø84.7 (65-104)
: Ø87.4 (66-111)
: Ø88.8 (66-113)
...
...
76.1 [X] Nvidia Titan X (Pascal) AMD Ryzen 9 7900X 4.7GHz
Titan X Pascal
min:
55 fps, max:
101 fps
77.2 [X] Nvidia Titan X (Pascal) AMD Ryzen 9 5900X 3.7GHz
Titan X Pascal
min:
57 fps, max:
102 fps
78.4 [X] Nvidia Titan X (Pascal) AMD Ryzen 9 7950X 4.5GHz
Titan X Pascal
min:
56 fps, max:
105 fps
~ 77 fps
+ Compare
- Hide Comparison
+ 📈 Graph
- 📈 Hide Graph
0 100 Tooltip : Ø76.1 (55-101)
: Ø77.2 (57-102)
: Ø78.4 (56-105)
...
Intel Arc A580
...
0 Tooltip : Ø59.9 (46-71)
: Ø60.6 (46-71)
: Ø61.1 (48-71)
...
Intel Arc A580
...
37.7 [X] Nvidia Titan X (Pascal) AMD Ryzen 9 7900X 4.7GHz
Titan X Pascal
min:
32 fps, max:
42 fps
39 [X] Nvidia Titan X (Pascal) AMD Ryzen 9 7950X 4.5GHz
Titan X Pascal
min:
33 fps, max:
43 fps
39.6 [X] Nvidia Titan X (Pascal) AMD Ryzen 9 5900X 3.7GHz
Titan X Pascal
min:
33 fps, max:
43 fps
~ 39 fps
+ Compare
- Hide Comparison
+ 📈 Graph
- 📈 Hide Graph
0 Tooltip : Ø37.7 (32-42)
: Ø39 (33-43)
: Ø39.6 (33-43)
...
Intel Arc A580
...
» With all tested laptops playable in detail settings ultra.
Additional Benchmarks
Low Graphics Quality 1920x1080
121 [X] Nvidia Titan X (Pascal) AMD Ryzen 9 5900X 3.7GHz
Titan X Pascal
min:
96 fps, max:
151 fps
125.8 [X] Nvidia Titan X (Pascal) AMD Ryzen 9 7950X 4.5GHz
Titan X Pascal
min:
97 fps, max:
157 fps
...
...
...
...
...
...
...
» With all tested laptops playable in detail settings high.
Additional Benchmarks
Low Preset 1920x1080
95.4 [X] Nvidia Titan X (Pascal) AMD Ryzen 9 5900X 3.7GHz
Titan X Pascal
min:
20.6 fps, P0.1:
42.1 fps, P1:
72.7 fps, max:
209 fps
...
0 100 Tooltip : Ø130.2 (100.597-179.79)
...
...
0 100 Tooltip : Ø107.3 (80.837-145.606)
...
...
...
...
...
...
» With all tested laptops playable in detail settings ultra.
Additional Benchmarks
Low Video Quality 1920x1080
161 [X] Nvidia Titan X (Pascal) AMD Ryzen 9 5900X 3.7GHz
Titan X Pascal
min:
61.8 fps, P0.1:
80.9 fps, P1:
107 fps, max:
328 fps
...
...
...
...
...
...
...
...
...
...
...
» With all tested laptops playable in detail settings ultra.
Additional Benchmarks
Low Preset 1920x1080
120 [X] Nvidia Titan X (Pascal) AMD Ryzen 9 5900X 3.7GHz
Titan X Pascal
min:
65.1 fps, P0.1:
79.7 fps, P1:
95.5 fps, max:
159 fps
391 [X] Nvidia Titan X (Pascal) 874931
AMD Ryzen 9 7900X 4.7GHz
Titan X Pascal
min:
281 fps, P1:
257 fps, max:
445 fps
428 [X] Nvidia Titan X (Pascal) 831795
AMD Ryzen 9 5900X 3.7GHz
Titan X Pascal
min:
322 fps, P1:
277 fps, max:
466 fps
575 [X] Nvidia Titan X (Pascal) 874931
AMD Ryzen 9 7950X 4.5GHz
Titan X Pascal
min:
459 fps, P1:
374 fps, max:
669 fps
~ 465 fps
+ Compare
- Hide Comparison
...
Intel Arc A580
...
286 [X] Nvidia Titan X (Pascal) 831795
AMD Ryzen 9 5900X 3.7GHz
Titan X Pascal
min:
240 fps, P1:
212 fps, max:
322 fps
297 [X] Nvidia Titan X (Pascal) 874931
AMD Ryzen 9 7900X 4.7GHz
Titan X Pascal
min:
243 fps, P1:
218 fps, max:
331 fps
307 [X] Nvidia Titan X (Pascal) 874931
AMD Ryzen 9 7950X 4.5GHz
Titan X Pascal
min:
264 fps, P1:
240 fps, max:
344 fps
~ 297 fps
+ Compare
- Hide Comparison
...
Intel Arc A580
...
225 [X] Nvidia Titan X (Pascal) 831795
AMD Ryzen 9 5900X 3.7GHz
Titan X Pascal
min:
193 fps, P1:
138 fps, max:
252 fps
235 [X] Nvidia Titan X (Pascal) 874931
AMD Ryzen 9 7900X 4.7GHz
Titan X Pascal
min:
203 fps, P1:
145 fps, max:
259 fps
240 [X] Nvidia Titan X (Pascal) 874931
AMD Ryzen 9 7950X 4.5GHz
Titan X Pascal
min:
211 fps, P1:
174 fps, max:
266 fps
~ 233 fps
+ Compare
- Hide Comparison
...
Intel Arc A580
...
158 [X] Nvidia Titan X (Pascal) 831795
AMD Ryzen 9 5900X 3.7GHz
Titan X Pascal
min:
128 fps, P1:
127 fps, max:
179 fps
159.9 [X] Nvidia Titan X (Pascal) 874931
AMD Ryzen 9 7900X 4.7GHz
Titan X Pascal
min:
136 fps, P1:
135 fps, max:
185 fps
161.2 [X] Nvidia Titan X (Pascal) 874931
AMD Ryzen 9 7950X 4.5GHz
Titan X Pascal
min:
138 fps, P1:
138 fps, max:
185 fps
~ 160 fps
+ Compare
- Hide Comparison
...
...
123.2 [X] Nvidia Titan X (Pascal) 874931
AMD Ryzen 9 7900X 4.7GHz
Titan X Pascal
min:
106 fps, P1:
106 fps, max:
137 fps
124 [X] Nvidia Titan X (Pascal) 831795
AMD Ryzen 9 5900X 3.7GHz
Titan X Pascal
min:
104 fps, P1:
102 fps, max:
139 fps
125.2 [X] Nvidia Titan X (Pascal) 874931
AMD Ryzen 9 7950X 4.5GHz
Titan X Pascal
min:
109 fps, P1:
108 fps, max:
140 fps
~ 124 fps
+ Compare
- Hide Comparison
...
...
75.2 [X] Nvidia Titan X (Pascal) 874931
AMD Ryzen 9 7900X 4.7GHz
Titan X Pascal
min:
65 fps, P1:
64 fps, max:
84 fps
76 [X] Nvidia Titan X (Pascal) 874931
AMD Ryzen 9 7950X 4.5GHz
Titan X Pascal
min:
66 fps, P1:
65 fps, max:
86 fps
77.4 [X] Nvidia Titan X (Pascal) 831795
AMD Ryzen 9 5900X 3.7GHz
Titan X Pascal
min:
66 fps, P1:
65 fps, max:
86 fps
~ 76 fps
+ Compare
- Hide Comparison
...
...
» With all tested laptops playable in detail settings ultra.
...
...
...
...
...
...
...
...
...
...
» With all tested laptops playable in detail settings high.
Additional Benchmarks
Low Preset 1920x1080
144 [X] Nvidia Titan X (Pascal) AMD Ryzen 9 5900X 3.7GHz
Titan X Pascal
...
...
...
...
...
...
...
0 100 200 300 400 500 600 700 800 900 1000 1100 1200 1300 1400 Tooltip
...
...
...
...
» With all tested laptops playable in detail settings ultra.
Additional Benchmarks
Low Preset 1920x1080
167 [X] Nvidia Titan X (Pascal) AMD Ryzen 9 5900X 3.7GHz
Titan X Pascal
min:
31.8 fps, P0.1:
47.8 fps, P1:
79.5 fps, max:
432 fps
...
...
0 100 Tooltip : Ø115.9 (74.329-167.568)
...
...
» With all tested laptops playable in detail settings ultra.
...
...
...
...
0 100 200 Tooltip : Ø164.5 (137.127-202.029)
...
...
...
...
...
...
...
...
» With all tested laptops playable in detail settings ultra.
Additional Benchmarks
Prioritize Performance Preset 1920x1080
235 [X] Nvidia Titan X (Pascal) AMD Ryzen 9 5900X 3.7GHz
Titan X Pascal
min:
86 fps, P0.1:
155 fps, P1:
179 fps, max:
298 fps
...
...
...
...
0 100 Tooltip : Ø125.7 (91.877-167.012)
...
...
...
...
...
...
...
...
» With all tested laptops playable in detail settings ultra.
Additional Benchmarks
Low Preset 1920x1080
144 [X] Nvidia Titan X (Pascal) AMD Ryzen 9 5900X 3.7GHz
Titan X Pascal
min:
20 fps, P0.1:
35.8 fps, P1:
79.1 fps, max:
241 fps
...
...
...
...
...
...
...
...
...
...
...
» With all tested laptops playable in detail settings ultra.
...
...
...
...
...
...
...
...
...
...
...
...
» With all tested laptops playable in detail settings ultra.
Additional Benchmarks
Low Preset 1920x1080
84.3 [X] Nvidia Titan X (Pascal) AMD Ryzen 9 5900X 3.7GHz
Titan X Pascal
min:
21.5 fps, P0.1:
54.8 fps, P1:
67 fps, max:
150 fps
...
...
...
...
...
...
...
...
...
...
...
...
» With all tested laptops playable in detail settings ultra.
...
...
...
...
...
...
...
...
...
...
...
...
» With all tested laptops playable in detail settings ultra.
...
...
...
...
...
...
...
...
...
...
...
...
» With all tested laptops playable in detail settings ultra.
Additional Benchmarks
Highest Settings + Ultra Ray Tracing 1920x1080
24.5 [X] Nvidia Titan X (Pascal) AMD Ryzen 9 5900X 3.7GHz
Titan X Pascal
min:
13.7 fps, P0.1:
14.5 fps, P1:
18 fps, max:
109 fps
...
Intel Arc A580
...
...
...
...
...
...
Intel Arc A580
...
...
...
...
Intel Arc A580
...
» With all tested laptops playable in detail settings ultra.
166 [X] Nvidia Titan X (Pascal) AMD Ryzen 9 5900X 3.7GHz
Titan X Pascal
min:
77.6 fps, P0.1:
112.9 fps, P1:
124.6 fps, max:
226.9 fps
fps
+ Compare
- Hide Comparison
...
...
...
...
...
...
...
...
...
...
...
Intel Arc A580
...
» With all tested laptops playable in detail settings ultra.
...
Intel Arc A580
...
...
...
...
Intel Arc A580
...
...
Intel Arc A580
...
...
Intel Arc A580
...
...
Intel Arc A580
...
» With all tested laptops playable in detail settings ultra.
Additional Benchmarks
Ultra Preset + Ultra Ray Tracing (DX12) 1920x1080
22.5 [X] Nvidia Titan X (Pascal) AMD Ryzen 9 3900X 3.8GHz
Titan X Pascal
min:
11.83 fps, P1:
16.6 fps, max:
30.04 fps
...
...
...
...
...
...
...
...
...
...
...
...
» With all tested laptops playable in detail settings ultra.
0 100 200 300 400 500 Tooltip 1.5.5.7: Ø435 (366.133-540.7)
...
...
0 100 200 300 Tooltip 1.5.5.7: Ø319 (298.415-343.2)
...
...
0 100 200 300 Tooltip 1.5.5.7: Ø268 (243.258-331.5)
...
...
0 100 200 300 400 500 600 Tooltip 1.5.5.7: Ø255 (221.697-608)
...
...
0 100 200 Tooltip 1.5.5.7: Ø168.8 (155.081-230.4)
...
...
0 100 200 300 400 Tooltip 1.5.5.7: Ø104.7 (89.115-465)
...
...
» With all tested laptops playable in detail settings ultra.
...
...
...
...
...
...
...
...
...
...
» With all tested laptops playable in detail settings high.
...
...
...
...
...
...
...
...
...
...
...
» With all tested laptops playable in detail settings ultra.
...
...
...
0 (!) [X] Nvidia Titan X (Pascal) AMD Ryzen 9 5900X 3.7GHz
Titan X Pascal
fps
+ Compare
- Hide Comparison
...
0 (!) [X] Nvidia Titan X (Pascal) AMD Ryzen 9 5900X 3.7GHz
Titan X Pascal
fps
+ Compare
- Hide Comparison
...
0 (!) [X] Nvidia Titan X (Pascal) AMD Ryzen 9 5900X 3.7GHz
Titan X Pascal
fps
+ Compare
- Hide Comparison
...
0 (!) [X] Nvidia Titan X (Pascal) AMD Ryzen 9 5900X 3.7GHz
Titan X Pascal
fps
+ Compare
- Hide Comparison
...
» With all tested laptops playable in detail settings med..
...
...
...
...
...
...
...
...
...
...
...
...
» With all tested laptops playable in detail settings ultra.
...
...
...
Intel Arc A580
...
...
Intel Arc A580
...
...
Intel Arc A580
...
...
Intel Arc A580
...
...
Intel Arc A580
...
» With all tested laptops playable in detail settings ultra.
...
Intel Arc A580
...
...
Intel Arc A580
...
...
Intel Arc A580
...
...
Intel Arc A580
...
...
Intel Arc A580
...
...
Intel Arc A580
...
» With all tested laptops playable in detail settings ultra.
291 [X] Nvidia Titan X (Pascal) 675864
AMD Ryzen 9 3900X 3.8GHz
Titan X Pascal
min:
231 fps, max:
318 fps
477 [X] Nvidia Titan X (Pascal) 759689
AMD Ryzen 9 7900X 4.7GHz
Titan X Pascal
min:
408 fps, max:
529 fps
495 [X] Nvidia Titan X (Pascal) 759689
AMD Ryzen 9 7950X 4.5GHz
Titan X Pascal
min:
417 fps, max:
552 fps
~ 421 fps
+ Compare
- Hide Comparison
...
...
245 [X] Nvidia Titan X (Pascal) 675864
AMD Ryzen 9 3900X 3.8GHz
Titan X Pascal
min:
209 fps, max:
280 fps
275 [X] Nvidia Titan X (Pascal) 759689
AMD Ryzen 9 7900X 4.7GHz
Titan X Pascal
min:
235 fps, max:
317 fps
285 [X] Nvidia Titan X (Pascal) 759689
AMD Ryzen 9 7950X 4.5GHz
Titan X Pascal
min:
233 fps, max:
330 fps
~ 268 fps
+ Compare
- Hide Comparison
...
...
202 [X] Nvidia Titan X (Pascal) 675864
AMD Ryzen 9 3900X 3.8GHz
Titan X Pascal
min:
178 fps, max:
236 fps
221 [X] Nvidia Titan X (Pascal) 759689
AMD Ryzen 9 7900X 4.7GHz
Titan X Pascal
min:
183 fps, max:
255 fps
226 [X] Nvidia Titan X (Pascal) 759689
AMD Ryzen 9 7950X 4.5GHz
Titan X Pascal
min:
199 fps, max:
265 fps
~ 216 fps
+ Compare
- Hide Comparison
...
...
141 [X] Nvidia Titan X (Pascal) 675864
AMD Ryzen 9 3900X 3.8GHz
Titan X Pascal
min:
114 fps, max:
168 fps
149.7 [X] Nvidia Titan X (Pascal) 759689
AMD Ryzen 9 7900X 4.7GHz
Titan X Pascal
min:
116 fps, max:
187 fps
153.5 [X] Nvidia Titan X (Pascal) 759689
AMD Ryzen 9 7950X 4.5GHz
Titan X Pascal
min:
119 fps, max:
185 fps
~ 148 fps
+ Compare
- Hide Comparison
...
...
109 [X] Nvidia Titan X (Pascal) 675864
AMD Ryzen 9 3900X 3.8GHz
Titan X Pascal
min:
88 fps, max:
132 fps
117.7 [X] Nvidia Titan X (Pascal) 759689
AMD Ryzen 9 7900X 4.7GHz
Titan X Pascal
min:
94 fps, max:
140 fps
119.2 [X] Nvidia Titan X (Pascal) 759689
AMD Ryzen 9 7950X 4.5GHz
Titan X Pascal
min:
96 fps, max:
141 fps
~ 115 fps
+ Compare
- Hide Comparison
...
...
64.9 [X] Nvidia Titan X (Pascal) 675864
AMD Ryzen 9 3900X 3.8GHz
Titan X Pascal
min:
53 fps, max:
74 fps
69.5 [X] Nvidia Titan X (Pascal) 759689
AMD Ryzen 9 7900X 4.7GHz
Titan X Pascal
min:
58 fps, max:
82 fps
69.5 [X] Nvidia Titan X (Pascal) 759689
AMD Ryzen 9 7950X 4.5GHz
Titan X Pascal
min:
58 fps, max:
82 fps
~ 68 fps
+ Compare
- Hide Comparison
...
...
» With all tested laptops playable in detail settings ultra.
...
...
...
...
...
...
» With all tested laptops playable in detail settings high.
...
...
...
...
...
...
...
...
...
...
» With all tested laptops playable in detail settings ultra.
...
...
...
...
...
...
...
...
...
...
...
...
» With all tested laptops playable in detail settings ultra.
...
...
...
...
...
...
...
...
...
» With all tested laptops playable in detail settings high.
...
...
...
...
...
...
...
...
...
...
...
...
» With all tested laptops playable in detail settings ultra.
...
...
...
...
...
...
...
...
...
...
...
...
» With all tested laptops playable in detail settings ultra.
...
...
...
...
...
...
...
» With all tested laptops playable in detail settings ultra.
...
...
...
...
...
...
...
...
» With all tested laptops playable in detail settings ultra.
...
...
...
...
...
...
...
...
...
...
...
» With all tested laptops playable in detail settings ultra.
Additional Benchmarks
Maximum Settings with Raytracing T2X Filmic SMAA 1920x1080
42.8 [X] Nvidia Titan X (Pascal) AMD Ryzen 9 3900X 3.8GHz
Titan X Pascal
P1:
24.6 fps
Maximum Settings with Raytracing T2X Filmic SMAA 3840x2160
15.3 [X] Nvidia Titan X (Pascal) AMD Ryzen 9 3900X 3.8GHz
Titan X Pascal
P1:
8.2 fps
...
...
...
...
...
...
...
» With all tested laptops playable in detail settings ultra.
...
...
...
...
...
...
...
...
...
» With all tested laptops playable in detail settings ultra.
...
...
...
...
...
...
...
...
...
...
...
» With all tested laptops playable in detail settings ultra.
148.5 [X] Nvidia Titan X (Pascal) AMD Ryzen 9 3900X 3.8GHz
Titan X Pascal
233 [X] Nvidia Titan X (Pascal) AMD Ryzen 9 7900X 4.7GHz
Titan X Pascal
239 [X] Nvidia Titan X (Pascal) AMD Ryzen 9 7950X 4.5GHz
Titan X Pascal
~ 207 fps
+ Compare
- Hide Comparison
...
...
128.5 [X] Nvidia Titan X (Pascal) AMD Ryzen 9 3900X 3.8GHz
Titan X Pascal
154 [X] Nvidia Titan X (Pascal) AMD Ryzen 9 7900X 4.7GHz
Titan X Pascal
159.3 [X] Nvidia Titan X (Pascal) AMD Ryzen 9 7950X 4.5GHz
Titan X Pascal
~ 147 fps
+ Compare
- Hide Comparison
...
...
100.7 [X] Nvidia Titan X (Pascal) AMD Ryzen 9 3900X 3.8GHz
Titan X Pascal
107.5 [X] Nvidia Titan X (Pascal) AMD Ryzen 9 7900X 4.7GHz
Titan X Pascal
109.9 [X] Nvidia Titan X (Pascal) AMD Ryzen 9 7950X 4.5GHz
Titan X Pascal
~ 106 fps
+ Compare
- Hide Comparison
...
...
81.5 [X] Nvidia Titan X (Pascal) AMD Ryzen 9 3900X 3.8GHz
Titan X Pascal
84.1 [X] Nvidia Titan X (Pascal) AMD Ryzen 9 7900X 4.7GHz
Titan X Pascal
85.8 [X] Nvidia Titan X (Pascal) AMD Ryzen 9 7950X 4.5GHz
Titan X Pascal
~ 84 fps
+ Compare
- Hide Comparison
...
...
58.3 [X] Nvidia Titan X (Pascal) AMD Ryzen 9 3900X 3.8GHz
Titan X Pascal
59.3 [X] Nvidia Titan X (Pascal) AMD Ryzen 9 7900X 4.7GHz
Titan X Pascal
60.1 [X] Nvidia Titan X (Pascal) AMD Ryzen 9 7950X 4.5GHz
Titan X Pascal
~ 59 fps
+ Compare
- Hide Comparison
...
Intel Arc A580
...
32 [X] Nvidia Titan X (Pascal) AMD Ryzen 9 3900X 3.8GHz
Titan X Pascal
32.4 [X] Nvidia Titan X (Pascal) AMD Ryzen 9 7900X 4.7GHz
Titan X Pascal
32.8 [X] Nvidia Titan X (Pascal) AMD Ryzen 9 7950X 4.5GHz
Titan X Pascal
~ 32 fps
+ Compare
- Hide Comparison
...
...
» With all tested laptops playable in detail settings ultra.
Additional Benchmarks
Very Low Overall Quality (DX11) 1920x1080
217 [X] Nvidia Titan X (Pascal) AMD Ryzen 9 7950X 4.5GHz
Titan X Pascal
...
...
...
Intel Arc A580
...
...
Intel Arc A580
...
...
Intel Arc A580
...
...
Intel Arc A580
...
» With all tested laptops playable in detail settings high.
Additional Benchmarks
High Quality Preset & High Ray Tracing Preset (DX12) 1920x1080
22.1 [X] Nvidia Titan X (Pascal) AMD Ryzen 9 3900X 3.8GHz
Titan X Pascal
min:
19 fps, max:
25 fps
...
...
...
...
...
...
...
...
...
...
...
...
» With all tested laptops playable in detail settings ultra.
...
...
...
Intel Arc A580
...
...
Intel Arc A580
...
...
...
...
Intel Arc A580
...
...
Intel Arc A580
...
» With all tested laptops playable in detail settings ultra.
...
...
...
...
...
...
...
...
...
...
...
...
» With all tested laptops playable in detail settings ultra.
...
...
Intel Arc A580
...
...
...
...
...
...
...
...
...
...
» With all tested laptops playable in detail settings ultra.
...
Intel Arc A580
...
...
...
...
...
...
...
...
...
...
Intel Arc A580
...
» With all tested laptops playable in detail settings ultra.
...
...
...
...
...
...
...
...
...
...
...
» With all tested laptops playable in detail settings ultra.
...
...
...
...
...
...
...
...
...
...
...
» With all tested laptops playable in detail settings ultra.
117 [X] Nvidia Titan X (Pascal) AMD Ryzen 7 2700X 3.7GHz
Titan X Pascal
min:
89 fps, max:
169 fps
194 [X] Nvidia Titan X (Pascal) AMD Ryzen 9 7900X 4.7GHz
Titan X Pascal
min:
145 fps, max:
290 fps
200 [X] Nvidia Titan X (Pascal) AMD Ryzen 9 7950X 4.5GHz
Titan X Pascal
min:
150 fps, max:
300 fps
~ 170 fps
+ Compare
- Hide Comparison
+ 📈 Graph
- 📈 Hide Graph
0 100 200 Tooltip : Ø193.9 (145-290)
: Ø199.9 (150-300)
...
Intel Arc A580
...
103 [X] Nvidia Titan X (Pascal) AMD Ryzen 7 2700X 3.7GHz
Titan X Pascal
min:
81 fps, max:
152 fps
150 [X] Nvidia Titan X (Pascal) AMD Ryzen 9 7900X 4.7GHz
Titan X Pascal
min:
127 fps, max:
183 fps
154 [X] Nvidia Titan X (Pascal) AMD Ryzen 9 7950X 4.5GHz
Titan X Pascal
min:
131 fps, max:
187 fps
~ 136 fps
+ Compare
- Hide Comparison
+ 📈 Graph
- 📈 Hide Graph
0 100 Tooltip : Ø150.4 (127-183)
: Ø154 (131-187)
...
Intel Arc A580
...
99 [X] Nvidia Titan X (Pascal) AMD Ryzen 7 2700X 3.7GHz
Titan X Pascal
min:
78 fps, max:
143 fps
140 [X] Nvidia Titan X (Pascal) AMD Ryzen 9 7900X 4.7GHz
Titan X Pascal
min:
118 fps, max:
168 fps
144 [X] Nvidia Titan X (Pascal) AMD Ryzen 9 7950X 4.5GHz
Titan X Pascal
min:
122 fps, max:
172 fps
~ 128 fps
+ Compare
- Hide Comparison
+ 📈 Graph
- 📈 Hide Graph
0 100 Tooltip : Ø140.1 (118-168)
: Ø144.4 (122-172)
...
Intel Arc A580
...
90 [X] Nvidia Titan X (Pascal) AMD Ryzen 7 2700X 3.7GHz
Titan X Pascal
min:
63 fps, max:
143 fps
127 [X] Nvidia Titan X (Pascal) AMD Ryzen 9 7900X 4.7GHz
Titan X Pascal
min:
100 fps, max:
162 fps
131 [X] Nvidia Titan X (Pascal) AMD Ryzen 9 7950X 4.5GHz
Titan X Pascal
min:
98 fps, max:
165 fps
~ 116 fps
+ Compare
- Hide Comparison
+ 📈 Graph
- 📈 Hide Graph
0 100 Tooltip : Ø127.1 (100-162)
: Ø130.8 (98-165)
...
...
84 [X] Nvidia Titan X (Pascal) AMD Ryzen 7 2700X 3.7GHz
Titan X Pascal
min:
63 fps, max:
119 fps
101 [X] Nvidia Titan X (Pascal) AMD Ryzen 9 7900X 4.7GHz
Titan X Pascal
min:
80 fps, max:
123 fps
102 [X] Nvidia Titan X (Pascal) AMD Ryzen 9 7950X 4.5GHz
Titan X Pascal
min:
80 fps, max:
125 fps
~ 96 fps
+ Compare
- Hide Comparison
+ 📈 Graph
- 📈 Hide Graph
0 100 Tooltip : Ø100.6 (80-123)
: Ø102.4 (80-125)
...
Intel Arc A580
...
55 [X] Nvidia Titan X (Pascal) AMD Ryzen 9 7900X 4.7GHz
Titan X Pascal
min:
45 fps, max:
68 fps
56 [X] Nvidia Titan X (Pascal) AMD Ryzen 7 2700X 3.7GHz
Titan X Pascal
min:
46 fps, max:
69 fps
56 [X] Nvidia Titan X (Pascal) AMD Ryzen 9 7950X 4.5GHz
Titan X Pascal
min:
45 fps, max:
69 fps
~ 56 fps
+ Compare
- Hide Comparison
+ 📈 Graph
- 📈 Hide Graph
0 Tooltip : Ø55.1 (45-68)
: Ø56.2 (45-69)
...
Intel Arc A580
...
» With all tested laptops playable in detail settings ultra.
127.7 [X] Nvidia Titan X (Pascal) AMD Ryzen 7 2700X 3.7GHz
Titan X Pascal
min:
72 fps, max:
195 fps
240 [X] Nvidia Titan X (Pascal) AMD Ryzen 9 7900X 4.7GHz
Titan X Pascal
min:
107.17 fps, max:
421.76 fps
246 [X] Nvidia Titan X (Pascal) AMD Ryzen 9 7950X 4.5GHz
Titan X Pascal
min:
113.22 fps, max:
430.29 fps
~ 205 fps
+ Compare
- Hide Comparison
...
Intel Arc A580
...
103.3 [X] Nvidia Titan X (Pascal) AMD Ryzen 7 2700X 3.7GHz
Titan X Pascal
min:
50 fps, max:
164 fps
123.5 [X] Nvidia Titan X (Pascal) AMD Ryzen 9 7900X 4.7GHz
Titan X Pascal
min:
53.95 fps, max:
224.47 fps
129.2 [X] Nvidia Titan X (Pascal) AMD Ryzen 9 7950X 4.5GHz
Titan X Pascal
min:
55.99 fps, max:
230.95 fps
~ 119 fps
+ Compare
- Hide Comparison
...
...
81.2 [X] Nvidia Titan X (Pascal) AMD Ryzen 7 2700X 3.7GHz
Titan X Pascal
min:
38 fps, max:
133 fps
91.3 [X] Nvidia Titan X (Pascal) AMD Ryzen 9 7900X 4.7GHz
Titan X Pascal
min:
42.69 fps, max:
171.38 fps
95 [X] Nvidia Titan X (Pascal) AMD Ryzen 9 7950X 4.5GHz
Titan X Pascal
min:
44.68 fps, max:
164.18 fps
~ 89 fps
+ Compare
- Hide Comparison
...
Intel Arc A580
...
67.3 [X] Nvidia Titan X (Pascal) AMD Ryzen 7 2700X 3.7GHz
Titan X Pascal
min:
34 fps, max:
112 fps
72.1 [X] Nvidia Titan X (Pascal) AMD Ryzen 9 7900X 4.7GHz
Titan X Pascal
min:
36.4 fps, max:
137.68 fps
74.8 [X] Nvidia Titan X (Pascal) AMD Ryzen 9 7950X 4.5GHz
Titan X Pascal
min:
38.26 fps, max:
131.94 fps
~ 71 fps
+ Compare
- Hide Comparison
...
Intel Arc A580
...
54.2 [X] Nvidia Titan X (Pascal) AMD Ryzen 7 2700X 3.7GHz
Titan X Pascal
min:
31 fps, max:
87 fps
57.5 [X] Nvidia Titan X (Pascal) AMD Ryzen 9 7900X 4.7GHz
Titan X Pascal
min:
31.72 fps, max:
112.16 fps
59.3 [X] Nvidia Titan X (Pascal) AMD Ryzen 9 7950X 4.5GHz
Titan X Pascal
min:
32.93 fps, max:
102.57 fps
~ 57 fps
+ Compare
- Hide Comparison
...
Intel Arc A580
...
35.3 [X] Nvidia Titan X (Pascal) AMD Ryzen 7 2700X 3.7GHz
Titan X Pascal
min:
23 fps, max:
52 fps
36.3 [X] Nvidia Titan X (Pascal) AMD Ryzen 9 7900X 4.7GHz
Titan X Pascal
min:
22.64 fps, max:
57.32 fps
37.1 [X] Nvidia Titan X (Pascal) AMD Ryzen 9 7950X 4.5GHz
Titan X Pascal
min:
23.11 fps, max:
56.55 fps
~ 36 fps
+ Compare
- Hide Comparison
...
Intel Arc A580
...
» With all tested laptops playable in detail settings ultra.
...
...
...
...
...
...
...
...
...
...
...
» With all tested laptops playable in detail settings ultra.
...
...
...
...
...
...
...
» With all tested laptops playable in detail settings ultra.
...
...
...
...
...
...
...
...
...
» With all tested laptops playable in detail settings ultra.
...
...
...
...
...
...
...
...
...
...
» With all tested laptops playable in detail settings ultra.
...
...
...
...
...
...
...
...
...
» With all tested laptops playable in detail settings ultra.
...
...
...
...
...
...
...
...
...
...
» With all tested laptops playable in detail settings ultra.
...
...
...
...
...
...
...
...
...
» With all tested laptops playable in detail settings ultra.
...
...
...
...
...
...
» With all tested laptops playable in detail settings ultra.
...
Intel Arc A580
...
...
Intel Arc A580
...
...
Intel Arc A580
...
...
Intel Arc A580
...
...
Intel Arc A580
...
» With all tested laptops playable in detail settings ultra.
...
...
...
...
...
Intel Arc A580
...
...
...
...
...
» With all tested laptops playable in detail settings ultra.
...
...
...
...
...
...
...
...
...
» With all tested laptops playable in detail settings ultra.
117 [X] NVIDIA Titan X Pascal AMD Ryzen Threadripper 1950X 3.4GHz
Titan X Pascal
279 [X] Nvidia Titan X (Pascal) AMD Ryzen 9 7950X 4.5GHz
Titan X Pascal
max:
426.2 fps
285 [X] Nvidia Titan X (Pascal) AMD Ryzen 9 7900X 4.7GHz
Titan X Pascal
max:
492.1 fps
~ 227 fps
+ Compare
- Hide Comparison
...
...
112 [X] NVIDIA Titan X Pascal AMD Ryzen Threadripper 1950X 3.4GHz
Titan X Pascal
136.3 [X] Nvidia Titan X (Pascal) AMD Ryzen 9 7950X 4.5GHz
Titan X Pascal
max:
243.5 fps
137.3 [X] Nvidia Titan X (Pascal) AMD Ryzen 9 7900X 4.7GHz
Titan X Pascal
max:
244.5 fps
~ 129 fps
+ Compare
- Hide Comparison
...
Intel Arc A580
...
109 [X] NVIDIA Titan X Pascal AMD Ryzen Threadripper 1950X 3.4GHz
Titan X Pascal
125.9 [X] Nvidia Titan X (Pascal) AMD Ryzen 9 7900X 4.7GHz
Titan X Pascal
max:
210.9 fps
126.2 [X] Nvidia Titan X (Pascal) AMD Ryzen 9 7950X 4.5GHz
Titan X Pascal
max:
222.2 fps
~ 120 fps
+ Compare
- Hide Comparison
...
...
87 [X] Nvidia Titan X (Pascal) AMD Ryzen 9 7950X 4.5GHz
Titan X Pascal
max:
194.5 fps
103 [X] NVIDIA Titan X Pascal AMD Ryzen Threadripper 1950X 3.4GHz
Titan X Pascal
113.8 [X] Nvidia Titan X (Pascal) AMD Ryzen 9 7900X 4.7GHz
Titan X Pascal
max:
193.1 fps
~ 101 fps
+ Compare
- Hide Comparison
...
Intel Arc A580
...
78 [X] Nvidia Titan X (Pascal) AMD Ryzen 9 7900X 4.7GHz
Titan X Pascal
max:
126.5 fps
78.4 [X] Nvidia Titan X (Pascal) AMD Ryzen 9 7950X 4.5GHz
Titan X Pascal
max:
127.8 fps
~ 78 fps
+ Compare
- Hide Comparison
...
Intel Arc A580
...
42.3 [X] Nvidia Titan X (Pascal) AMD Ryzen 9 7950X 4.5GHz
Titan X Pascal
max:
63.5 fps
42.4 [X] Nvidia Titan X (Pascal) AMD Ryzen 9 7900X 4.7GHz
Titan X Pascal
max:
63.3 fps
43 [X] NVIDIA Titan X Pascal AMD Ryzen Threadripper 1950X 3.4GHz
Titan X Pascal
~ 43 fps
+ Compare
- Hide Comparison
...
Intel Arc A580
...
» With all tested laptops playable in detail settings ultra.
Additional Benchmarks
Lowest Preset 1920x1080
214 [X] Nvidia Titan X (Pascal) AMD Ryzen 9 7950X 4.5GHz
Titan X Pascal
max:
400.3 fps
416 [X] Nvidia Titan X (Pascal) 1.47.22.14 D3D12
AMD Ryzen 9 3900X 3.8GHz
Titan X Pascal
min:
233 fps, P1:
313 fps, max:
675 fps
515 [X] Nvidia Titan X (Pascal) 1.47.22.14 D3D12
AMD Ryzen 9 7900X 4.7GHz
Titan X Pascal
min:
297 fps, P1:
425 fps, max:
742 fps
545 [X] Nvidia Titan X (Pascal) 1.47.22.14 D3D12
AMD Ryzen 9 7950X 4.5GHz
Titan X Pascal
min:
88.5 fps, P1:
447 fps, max:
820 fps
~ 492 fps
+ Compare
- Hide Comparison
...
Intel Arc A580
...
248 [X] Nvidia Titan X (Pascal) 1.47.22.14 D3D12
AMD Ryzen 9 3900X 3.8GHz
Titan X Pascal
min:
188 fps, P1:
203 fps, max:
352 fps
251 [X] Nvidia Titan X (Pascal) 1.47.22.14 D3D12
AMD Ryzen 9 7900X 4.7GHz
Titan X Pascal
min:
208 fps, P1:
211 fps, max:
335 fps
256 [X] Nvidia Titan X (Pascal) 1.47.22.14 D3D12
AMD Ryzen 9 7950X 4.5GHz
Titan X Pascal
min:
210 fps, P1:
216 fps, max:
384 fps
~ 252 fps
+ Compare
- Hide Comparison
...
Intel Arc A580
...
189 [X] Nvidia Titan X (Pascal) 1.47.22.14 D3D12
AMD Ryzen 9 3900X 3.8GHz
Titan X Pascal
min:
138 fps, P1:
141 fps, max:
294 fps
194.2 [X] Nvidia Titan X (Pascal) 1.47.22.14 D3D12
AMD Ryzen 9 7900X 4.7GHz
Titan X Pascal
min:
141.4 fps, P1:
144.3 fps, max:
287 fps
196.9 [X] Nvidia Titan X (Pascal) 1.47.22.14 D3D12
AMD Ryzen 9 7950X 4.5GHz
Titan X Pascal
min:
141.6 fps, P1:
146.6 fps, max:
298 fps
~ 193 fps
+ Compare
- Hide Comparison
...
...
161 [X] Nvidia Titan X (Pascal) 1.47.22.14 D3D12
AMD Ryzen 9 3900X 3.8GHz
Titan X Pascal
min:
121 fps, P1:
124 fps, max:
304 fps
167.4 [X] Nvidia Titan X (Pascal) 1.47.22.14 D3D12
AMD Ryzen 9 7900X 4.7GHz
Titan X Pascal
min:
124.4 fps, P1:
127.7 fps, max:
243 fps
169.5 [X] Nvidia Titan X (Pascal) 1.47.22.14 D3D12
AMD Ryzen 9 7950X 4.5GHz
Titan X Pascal
min:
123.9 fps, P1:
127.8 fps, max:
246 fps
~ 166 fps
+ Compare
- Hide Comparison
...
Intel Arc A580
...
117 [X] Nvidia Titan X (Pascal) 1.47.22.14 D3D12
AMD Ryzen 9 3900X 3.8GHz
Titan X Pascal
min:
92.5 fps, P1:
94.6 fps, max:
168 fps
122.3 [X] Nvidia Titan X (Pascal) 1.47.22.14 D3D12
AMD Ryzen 9 7900X 4.7GHz
Titan X Pascal
min:
95.5 fps, P1:
97.3 fps, max:
174.3 fps
122.3 [X] Nvidia Titan X (Pascal) 1.47.22.14 D3D12
AMD Ryzen 9 7950X 4.5GHz
Titan X Pascal
min:
95.7 fps, P1:
97.8 fps, max:
201 fps
~ 121 fps
+ Compare
- Hide Comparison
...
...
67.5 [X] Nvidia Titan X (Pascal) 1.47.22.14 D3D12
AMD Ryzen 9 3900X 3.8GHz
Titan X Pascal
min:
54.1 fps, P1:
56.5 fps, max:
92.8 fps
69.5 [X] Nvidia Titan X (Pascal) 1.47.22.14 D3D12
AMD Ryzen 9 7900X 4.7GHz
Titan X Pascal
min:
57.9 fps, P1:
59.5 fps, max:
96.3 fps
69.7 [X] Nvidia Titan X (Pascal) 1.47.22.14 D3D12
AMD Ryzen 9 7950X 4.5GHz
Titan X Pascal
min:
56 fps, P1:
58.4 fps, max:
96.5 fps
~ 69 fps
+ Compare
- Hide Comparison
...
Intel Arc A580
...
» With all tested laptops playable in detail settings ultra.
...
...
...
...
...
...
...
...
...
» With all tested laptops playable in detail settings ultra.
...
...
...
...
...
...
» With all tested laptops playable in detail settings ultra.
...
...
...
...
...
...
...
...
...
...
» With all tested laptops playable in detail settings ultra.
96 [X] NVIDIA Titan X Pascal AMD Ryzen Threadripper 1950X 3.4GHz
Titan X Pascal
min:
77 fps, max:
116 fps
232 [X] Nvidia Titan X (Pascal) AMD Ryzen 9 7900X 4.7GHz
Titan X Pascal
min:
178 fps, max:
296 fps
242 [X] Nvidia Titan X (Pascal) AMD Ryzen 9 7950X 4.5GHz
Titan X Pascal
min:
188 fps, max:
304 fps
~ 190 fps
+ Compare
- Hide Comparison
+ 📈 Graph
- 📈 Hide Graph
0 100 200 300 Tooltip : Ø232 (178-296)
: Ø242 (188-304)
...
Intel Arc A580
...
88 [X] NVIDIA Titan X Pascal AMD Ryzen Threadripper 1950X 3.4GHz
Titan X Pascal
min:
72 fps, max:
115 fps
162 [X] Nvidia Titan X (Pascal) AMD Ryzen 9 7900X 4.7GHz
Titan X Pascal
min:
147 fps, max:
178 fps
166 [X] Nvidia Titan X (Pascal) AMD Ryzen 9 7950X 4.5GHz
Titan X Pascal
min:
153 fps, max:
187 fps
~ 139 fps
+ Compare
- Hide Comparison
+ 📈 Graph
- 📈 Hide Graph
0 100 Tooltip : Ø161.7 (147-178)
: Ø166.5 (153-187)
...
Intel Arc A580
...
84 [X] NVIDIA Titan X Pascal AMD Ryzen Threadripper 1950X 3.4GHz
Titan X Pascal
min:
69 fps, max:
110 fps
149 [X] Nvidia Titan X (Pascal) AMD Ryzen 9 7900X 4.7GHz
Titan X Pascal
min:
138 fps, max:
176 fps
152 [X] Nvidia Titan X (Pascal) AMD Ryzen 9 7950X 4.5GHz
Titan X Pascal
min:
140 fps, max:
179 fps
~ 128 fps
+ Compare
- Hide Comparison
+ 📈 Graph
- 📈 Hide Graph
0 100 Tooltip : Ø148.6 (138-176)
: Ø152.5 (140-179)
...
Intel Arc A580
...
80 [X] NVIDIA Titan X Pascal AMD Ryzen Threadripper 1950X 3.4GHz
Titan X Pascal
min:
64 fps, max:
107 fps
140 [X] Nvidia Titan X (Pascal) AMD Ryzen 9 7900X 4.7GHz
Titan X Pascal
min:
127 fps, max:
161 fps
144 [X] Nvidia Titan X (Pascal) AMD Ryzen 9 7950X 4.5GHz
Titan X Pascal
min:
130 fps, max:
164 fps
~ 121 fps
+ Compare
- Hide Comparison
+ 📈 Graph
- 📈 Hide Graph
0 100 Tooltip : Ø139.5 (127-161)
: Ø144.2 (130-164)
...
...
0 100 Tooltip : Ø99.1 (87-118)
: Ø102.6 (92-121)
...
...
52 [X] Nvidia Titan X (Pascal) AMD Ryzen 9 7900X 4.7GHz
Titan X Pascal
min:
46 fps, max:
64 fps
53 [X] NVIDIA Titan X Pascal AMD Ryzen Threadripper 1950X 3.4GHz
Titan X Pascal
min:
46 fps, max:
64 fps
53 [X] Nvidia Titan X (Pascal) AMD Ryzen 9 7950X 4.5GHz
Titan X Pascal
min:
46 fps, max:
65 fps
~ 53 fps
+ Compare
- Hide Comparison
+ 📈 Graph
- 📈 Hide Graph
0 Tooltip : Ø52.2 (46-64)
: Ø53.1 (46-65)
...
...
» With all tested laptops playable in detail settings ultra.
Additional Benchmarks
Low Preset TAA 1920x1080
187 [X] Nvidia Titan X (Pascal) AMD Ryzen 9 7950X 4.5GHz
Titan X Pascal
min:
168 fps, max:
207 fps
...
...
...
...
...
...
...
...
» With all tested laptops playable in detail settings high.
...
...
...
...
...
...
...
...
...
» With all tested laptops playable in detail settings ultra.
148.9 [X] Intel Xeon E5-2680 v4 2.4GHz
Titan X Pascal
min:
103 fps, max:
185 fps
231 [X] Nvidia Titan X (Pascal) 1.3
AMD Ryzen 9 7900X 4.7GHz
Titan X Pascal
233 [X] Nvidia Titan X (Pascal) 1.3
AMD Ryzen 9 7950X 4.5GHz
Titan X Pascal
~ 204 fps
+ Compare
- Hide Comparison
...
...
124.7 [X] Intel Xeon E5-2680 v4 2.4GHz
Titan X Pascal
min:
86 fps, max:
158 fps
140.5 [X] Nvidia Titan X (Pascal) 1.3
AMD Ryzen 9 7900X 4.7GHz
Titan X Pascal
140.6 [X] Nvidia Titan X (Pascal) 1.3
AMD Ryzen 9 7950X 4.5GHz
Titan X Pascal
~ 135 fps
+ Compare
- Hide Comparison
...
...
91 [X] Intel Xeon E5-2680 v4 2.4GHz
Titan X Pascal
min:
26 fps, max:
147 fps
104.7 [X] Nvidia Titan X (Pascal) 1.3
AMD Ryzen 9 7950X 4.5GHz
Titan X Pascal
105.6 [X] Nvidia Titan X (Pascal) 1.3
AMD Ryzen 9 7900X 4.7GHz
Titan X Pascal
~ 100 fps
+ Compare
- Hide Comparison
...
...
...
...
43.4 [X] Nvidia Titan X (Pascal) 1.3
AMD Ryzen 9 7950X 4.5GHz
Titan X Pascal
43.5 [X] Intel Xeon E5-2680 v4 2.4GHz
Titan X Pascal
min:
26 fps, max:
61 fps
44.3 [X] Nvidia Titan X (Pascal) 1.3
AMD Ryzen 9 7900X 4.7GHz
Titan X Pascal
~ 44 fps
+ Compare
- Hide Comparison
...
...
» With all tested laptops playable in detail settings high.
...
...
...
...
...
...
» With all tested laptops playable in detail settings ultra.
...
...
...
...
...
» With all tested laptops playable in detail settings ultra.
...
...
...
...
...
...
...
...
...
» With all tested laptops playable in detail settings ultra.
...
...
...
...
...
» With all tested laptops playable in detail settings ultra.
...
Intel Arc A580
...
...
...
...
...
...
...
...
» With all tested laptops playable in detail settings ultra.
...
...
...
...
...
...
...
...
...
...
» With all tested laptops playable in detail settings ultra.
...
...
...
...
» With all tested laptops playable in detail settings ultra.
...
...
...
...
...
» With all tested laptops playable in detail settings ultra.
...
...
...
...
...
...
...
» With all tested laptops playable in detail settings ultra.
...
...
...
...
...
...
...
» With all tested laptops playable in detail settings ultra.
...
...
...
...
...
...
» With all tested laptops playable in detail settings ultra.
...
...
...
...
...
...
» With all tested laptops playable in detail settings ultra.
...
...
...
...
...
...
...
...
...
...
» With all tested laptops playable in detail settings ultra.
...
...
...
...
...
...
...
...
...
» With all tested laptops playable in detail settings ultra.
...
...
...
...
...
...
...
...
...
» With all tested laptops playable in detail settings ultra.
...
...
...
...
...
...
...
» With all tested laptops playable in detail settings high.
...
...
...
...
...
» With all tested laptops playable in detail settings ultra.
...
...
...
...
...
...
...
» With all tested laptops playable in detail settings ultra.
...
...
...
...
...
...
» With all tested laptops playable in detail settings ultra.
...
...
...
...
...
...
...
...
» With all tested laptops playable in detail settings ultra.
...
...
...
...
...
...
» With all tested laptops playable in detail settings ultra.
...
...
...
...
...
» With all tested laptops playable in detail settings ultra.
...
...
...
...
...
...
...
...
» With all tested laptops playable in detail settings ultra.
...
...
...
...
...
...
...
...
...
» With all tested laptops playable in detail settings ultra.
...
...
...
...
...
...
» With all tested laptops playable in detail settings ultra.
...
...
...
...
...
...
» With all tested laptops playable in detail settings ultra.
...
...
...
...
...
...
» With all tested laptops playable in detail settings ultra.
...
...
...
...
...
...
...
...
...
» With all tested laptops playable in detail settings ultra.
...
...
...
...
...
...
...
...
...
» With all tested laptops playable in detail settings ultra.
...
...
...
...
» With all tested laptops playable in detail settings high.
...
...
...
...
...
» With all tested laptops playable in detail settings ultra.
...
...
...
...
...
...
...
...
...
» With all tested laptops playable in detail settings ultra.
...
...
...
...
...
» With all tested laptops playable in detail settings ultra.
Additional Benchmarks
Medium 4x AF Off AA 1920x1080
120.3 [X] Intel Xeon E5-2680 v4 2.4GHz
Titan X Pascal
min:
81 fps, max:
145 fps
...
...
...
...
...
» With all tested laptops playable in detail settings ultra.
Additional Benchmarks
Medium Preset 4xAF 1920x1080
142.2 [X] Intel Xeon E5-2680 v4 2.4GHz
Titan X Pascal
min:
114 fps, max:
174 fps
...
...
...
...
...
...
...
...
...
» With all tested laptops playable in detail settings ultra.
Additional Benchmarks
Medium (Render Scale 100 %) 2xAF FXAA 1920x1080
299.6 [X] Intel Xeon E5-2680 v4 2.4GHz
Titan X Pascal
min:
290 fps, max:
301 fps
...
...
...
...
...
...
...
...
...
» With all tested laptops playable in detail settings ultra.
Additional Benchmarks
Medium Preset 1920x1080
136.1 [X] Intel Xeon E5-2680 v4 2.4GHz
Titan X Pascal
min:
99 fps, max:
181 fps
...
...
...
...
» With all tested laptops playable in detail settings high.
...
...
...
...
...
» With all tested laptops playable in detail settings ultra.
...
...
...
...
...
» With all tested laptops playable in detail settings ultra.
...
...
...
...
...
...
...
» With all tested laptops playable in detail settings ultra.
Additional Benchmarks
Medium Preset 4xAF 1920x1080
189.8 [X] Intel Xeon E5-2680 v4 2.4GHz
Titan X Pascal
Low Preset 1xAF 1920x1080
255.5 [X] Intel Xeon E5-2680 v4 2.4GHz
Titan X Pascal
Ultra Preset 16xAF 3840x2160
52.8 [X] Intel Xeon E5-2680 v4 2.4GHz
Titan X Pascal
...
...
...
...
...
...
...
...
...
» With all tested laptops playable in detail settings ultra.
Additional Benchmarks
Low Preset 1920x1080
98 [X] Intel Xeon E5-2680 v4 2.4GHz
Titan X Pascal
min:
74 fps, max:
117 fps
...
...
...
...
...
» With all tested laptops playable in detail settings ultra.
Additional Benchmarks
Low Preset TrilinearAF 1920x1080
98.2 [X] Intel Xeon E5-2680 v4 2.4GHz
Titan X Pascal
min:
75 fps, max:
146 fps
...
...
...
...
...
...
...
...
...
...
» With all tested laptops playable in detail settings ultra.
...
...
...
...
...
...
» With all tested laptops playable in detail settings ultra.
Additional Benchmarks
Ultra Preset 16xAF TAA 3840x2160
88.7 [X] Intel Xeon E5-2680 v4 2.4GHz
Titan X Pascal
min:
45.7 fps, max:
146.1 fps
...
...
...
...
...
» With all tested laptops playable in detail settings ultra.
...
...
...
...
...
...
...
...
» With all tested laptops playable in detail settings ultra.
...
...
...
...
...
» With all tested laptops playable in detail settings ultra.
...
...
...
...
...
...
» With all tested laptops playable in detail settings ultra.
...
...
...
...
...
...
...
» With all tested laptops playable in detail settings ultra.
...
...
...
...
» With all tested laptops playable in detail settings ultra.
...
...
...
...
...
...
...
...
...
» With all tested laptops playable in detail settings ultra.
295.8 [X] Nvidia Titan X (Pascal) AMD Ryzen 9 7900X 4.7GHz
Titan X Pascal
min:
225.3 fps, max:
-1 fps
303.7 [X] Nvidia Titan X (Pascal) AMD Ryzen 9 7950X 4.5GHz
Titan X Pascal
min:
248.7 fps, max:
-1 fps
~ 300 fps
+ Compare
- Hide Comparison
...
245.1 [X] Nvidia Titan X (Pascal) AMD Ryzen 9 7900X 4.7GHz
Titan X Pascal
min:
211 fps, max:
-1 fps
272.2 [X] Nvidia Titan X (Pascal) AMD Ryzen 9 7950X 4.5GHz
Titan X Pascal
min:
232.8 fps, max:
-1 fps
~ 259 fps
+ Compare
- Hide Comparison
...
...
241.2 [X] Nvidia Titan X (Pascal) AMD Ryzen 9 7900X 4.7GHz
Titan X Pascal
min:
198.6 fps, max:
-1 fps
263 [X] Nvidia Titan X (Pascal) AMD Ryzen 9 7950X 4.5GHz
Titan X Pascal
min:
223.2 fps, max:
-1 fps
~ 252 fps
+ Compare
- Hide Comparison
...
...
224.1 [X] Nvidia Titan X (Pascal) AMD Ryzen 9 7900X 4.7GHz
Titan X Pascal
min:
188.7 fps, max:
-1 fps
240.6 [X] Nvidia Titan X (Pascal) AMD Ryzen 9 7950X 4.5GHz
Titan X Pascal
min:
204.9 fps, max:
-1 fps
~ 232 fps
+ Compare
- Hide Comparison
...
...
159 [X] Nvidia Titan X (Pascal) AMD Ryzen 9 7900X 4.7GHz
Titan X Pascal
min:
132.9 fps, max:
-1 fps
160.5 [X] Nvidia Titan X (Pascal) AMD Ryzen 9 7950X 4.5GHz
Titan X Pascal
min:
137.8 fps, max:
-1 fps
~ 160 fps
+ Compare
- Hide Comparison
...
...
» With all tested laptops playable in detail settings ultra.
269.8 [X] Intel Xeon E5-2680 v4 2.4GHz
Titan X Pascal
min:
234 fps, max:
312 fps
451 [X] Nvidia Titan X (Pascal) AMD Ryzen 9 7900X 4.7GHz
Titan X Pascal
min:
55.9 fps, P0.1:
143.5 fps, P1:
307 fps, max:
1082 fps
483 [X] Nvidia Titan X (Pascal) AMD Ryzen 9 7950X 4.5GHz
Titan X Pascal
min:
96.9 fps, P0.1:
296 fps, P1:
396 fps, max:
1318 fps
~ 401 fps
+ Compare
- Hide Comparison
+ 📈 Graph
- 📈 Hide Graph
0 100 200 300 400 500 600 700 800 Tooltip : Ø462 (419.52-801)
: Ø488 (459.969-563.6)
...
Intel Arc A580
...
225.6 [X] Intel Xeon E5-2680 v4 2.4GHz
Titan X Pascal
min:
199 fps, max:
276 fps
299 [X] Nvidia Titan X (Pascal) AMD Ryzen 9 7900X 4.7GHz
Titan X Pascal
min:
67.7 fps, P0.1:
142.9 fps, P1:
226 fps, max:
823 fps
319 [X] Nvidia Titan X (Pascal) AMD Ryzen 9 7950X 4.5GHz
Titan X Pascal
min:
93.4 fps, P0.1:
223 fps, P1:
268 fps, max:
801 fps
~ 281 fps
+ Compare
- Hide Comparison
+ 📈 Graph
- 📈 Hide Graph
0 100 200 300 400 500 Tooltip : Ø302 (273.642-341.4)
: Ø329 (291.163-560)
...
Intel Arc A580
...
159.7 [X] Intel Xeon E5-2680 v4 2.4GHz
Titan X Pascal
min:
135 fps, max:
186 fps
183.9 [X] Nvidia Titan X (Pascal) AMD Ryzen 9 7900X 4.7GHz
Titan X Pascal
min:
36.7 fps, P0.1:
95.8 fps, P1:
148.4 fps, max:
485 fps
199.3 [X] Nvidia Titan X (Pascal) AMD Ryzen 9 7950X 4.5GHz
Titan X Pascal
min:
66 fps, P0.1:
136.9 fps, P1:
169.7 fps, max:
608 fps
~ 181 fps
+ Compare
- Hide Comparison
+ 📈 Graph
- 📈 Hide Graph
0 100 200 300 400 500 600 700 800 900 1000 1100 1200 1300 1400 1500 1600 1700 1800 1900 2000 2100 2200 2300 2400 2500 2600 2700 2800 2900 3000 3100 Tooltip : Ø286 (163.44-3102)
: Ø202 (180.66-231.1)
...
Intel Arc A580
...
89.5 [X] Intel Xeon E5-2680 v4 2.4GHz
Titan X Pascal
min:
77 fps, max:
105 fps
94.5 [X] Nvidia Titan X (Pascal) AMD Ryzen 9 7900X 4.7GHz
Titan X Pascal
min:
49.2 fps, P0.1:
64.4 fps, P1:
75.5 fps, max:
294 fps
102.1 [X] Nvidia Titan X (Pascal) AMD Ryzen 9 7950X 4.5GHz
Titan X Pascal
min:
66.6 fps, P0.1:
74.4 fps, P1:
86.4 fps, max:
261 fps
~ 95 fps
+ Compare
- Hide Comparison
+ 📈 Graph
- 📈 Hide Graph
0 100 200 300 400 500 Tooltip : Ø99.9 (82.349-203.3)
: Ø113.6 (91.29-556)
...
...
68.1 [X] Intel Xeon E5-2680 v4 2.4GHz
Titan X Pascal
min:
59 fps, max:
77 fps
68.1 [X] Nvidia Titan X (Pascal) AMD Ryzen 9 7900X 4.7GHz
Titan X Pascal
min:
35.5 fps, P0.1:
53.7 fps, P1:
59.1 fps, max:
439 fps
70.8 [X] Nvidia Titan X (Pascal) AMD Ryzen 9 7950X 4.5GHz
Titan X Pascal
min:
45.3 fps, P0.1:
53.2 fps, P1:
62.7 fps, max:
123.1 fps
~ 69 fps
+ Compare
- Hide Comparison
+ 📈 Graph
- 📈 Hide Graph
0 100 200 Tooltip : Ø73.4 (62.034-200.7)
: Ø74.7 (64.27-108.1)
...
...
» With all tested laptops playable in detail settings ultra.
Additional Benchmarks
Ultra Graphics & Postprocessing (HBAO+) 3840x2160
48.3 [X] Nvidia Titan X (Pascal) AMD Ryzen 9 7950X 4.5GHz
Titan X Pascal
min:
39 fps, P0.1:
40.2 fps, P1:
42.7 fps, max:
66.7 fps
Medium Graphics & Postprocessing 1920x1080
223 [X] Nvidia Titan X (Pascal) AMD Ryzen 9 7950X 4.5GHz
Titan X Pascal
min:
97.9 fps, P0.1:
156.3 fps, P1:
188 fps, max:
747 fps
...
...
...
...
...
...
...
...
...
...
» With all tested laptops playable in detail settings ultra.
168.5 [X] Intel Xeon E5-2680 v4 2.4GHz
Titan X Pascal
min:
4.6 fps, max:
276.6 fps
187.4 [X] Nvidia Titan X (Pascal) AMD Ryzen 9 7900X 4.7GHz
Titan X Pascal
min:
7.02 fps, P1:
200 fps, max:
673 fps
187.8 [X] Nvidia Titan X (Pascal) AMD Ryzen 9 7950X 4.5GHz
Titan X Pascal
min:
7.74 fps, P1:
200 fps, max:
703 fps
~ 181 fps
+ Compare
- Hide Comparison
...
...
161.9 [X] Intel Xeon E5-2680 v4 2.4GHz
Titan X Pascal
min:
5.4 fps, max:
261.2 fps
187.2 [X] Nvidia Titan X (Pascal) AMD Ryzen 9 7900X 4.7GHz
Titan X Pascal
min:
7.66 fps, P1:
200 fps, max:
400 fps
187.6 [X] Nvidia Titan X (Pascal) AMD Ryzen 9 7950X 4.5GHz
Titan X Pascal
min:
5.96 fps, P1:
200 fps, max:
623 fps
~ 179 fps
+ Compare
- Hide Comparison
...
...
136.3 [X] Intel Xeon E5-2680 v4 2.4GHz
Titan X Pascal
min:
26.4 fps, max:
241.5 fps
186.1 [X] Nvidia Titan X (Pascal) AMD Ryzen 9 7900X 4.7GHz
Titan X Pascal
min:
4.52 fps, P1:
166.7 fps, max:
546 fps
187.6 [X] Nvidia Titan X (Pascal) AMD Ryzen 9 7950X 4.5GHz
Titan X Pascal
min:
6.32 fps, P1:
200 fps, max:
540 fps
~ 170 fps
+ Compare
- Hide Comparison
...
...
112.5 [X] Intel Xeon E5-2680 v4 2.4GHz
Titan X Pascal
min:
5.6 fps, max:
194.8 fps
134.5 [X] Nvidia Titan X (Pascal) AMD Ryzen 9 7900X 4.7GHz
Titan X Pascal
min:
9.11 fps, P1:
90.9 fps, max:
274 fps
137.7 [X] Nvidia Titan X (Pascal) AMD Ryzen 9 7950X 4.5GHz
Titan X Pascal
min:
6.26 fps, P1:
90.9 fps, max:
260 fps
~ 128 fps
+ Compare
- Hide Comparison
...
...
101.9 [X] Nvidia Titan X (Pascal) AMD Ryzen 9 7900X 4.7GHz
Titan X Pascal
min:
48.4 fps, P1:
71.4 fps, max:
207 fps
103.5 [X] Nvidia Titan X (Pascal) AMD Ryzen 9 7950X 4.5GHz
Titan X Pascal
min:
6.62 fps, P1:
71.4 fps, max:
279 fps
~ 103 fps
+ Compare
- Hide Comparison
...
...
95.5 [X] Intel Xeon E5-2680 v4 2.4GHz
Titan X Pascal
min:
37.9 fps, max:
174.5 fps
98.5 [X] Nvidia Titan X (Pascal) AMD Ryzen 9 7900X 4.7GHz
Titan X Pascal
min:
7.19 fps, P1:
76.9 fps, max:
380 fps
100.1 [X] Nvidia Titan X (Pascal) AMD Ryzen 9 7950X 4.5GHz
Titan X Pascal
min:
14 fps, P1:
76.9 fps, max:
253 fps
~ 98 fps
+ Compare
- Hide Comparison
...
...
» With all tested laptops playable in detail settings ultra.
Additional Benchmarks
Highest Settings possible 16xAF 4xMSAA + FXAA 3840x2160
51.7 [X] Nvidia Titan X (Pascal) AMD Ryzen 9 7900X 4.7GHz
Titan X Pascal
min:
6.34 fps, P1:
40 fps, max:
205 fps
52.4 [X] Nvidia Titan X (Pascal) AMD Ryzen 9 7950X 4.5GHz
Titan X Pascal
min:
6.25 fps, P1:
40 fps, max:
213 fps
Normal/Off 4xAF 1920x1080
187.1 [X] Nvidia Titan X (Pascal) AMD Ryzen 9 7900X 4.7GHz
Titan X Pascal
min:
4.73 fps, P1:
166.7 fps, max:
589 fps
187.7 [X] Nvidia Titan X (Pascal) AMD Ryzen 9 7950X 4.5GHz
Titan X Pascal
min:
7.63 fps, P1:
200 fps, max:
613 fps
Lowest Settings possible 1920x1080
187.5 [X] Nvidia Titan X (Pascal) AMD Ryzen 9 7900X 4.7GHz
Titan X Pascal
min:
9.35 fps, P1:
200 fps, max:
542 fps
187.8 [X] Nvidia Titan X (Pascal) AMD Ryzen 9 7950X 4.5GHz
Titan X Pascal
min:
5.74 fps, P1:
200 fps, max:
737 fps
...
...
...
...
...
» With all tested laptops playable in detail settings ultra.
...
...
...
...
...
...
...
...
...
» With all tested laptops playable in detail settings ultra.
...
...
...
...
...
...
...
» With all tested laptops playable in detail settings ultra.
...
...
...
...
...
...
...
...
» With all tested laptops playable in detail settings ultra.
 Deutsch
 English
 Español
 Français
 Italiano
 Nederlands
 Polski
 Português
 Русский
 Türkçe
 Svenska
 Chinese
 Magyar