

Nvidia GeForce GTX 1070 Founders Edition Review
For the original German review, see here.
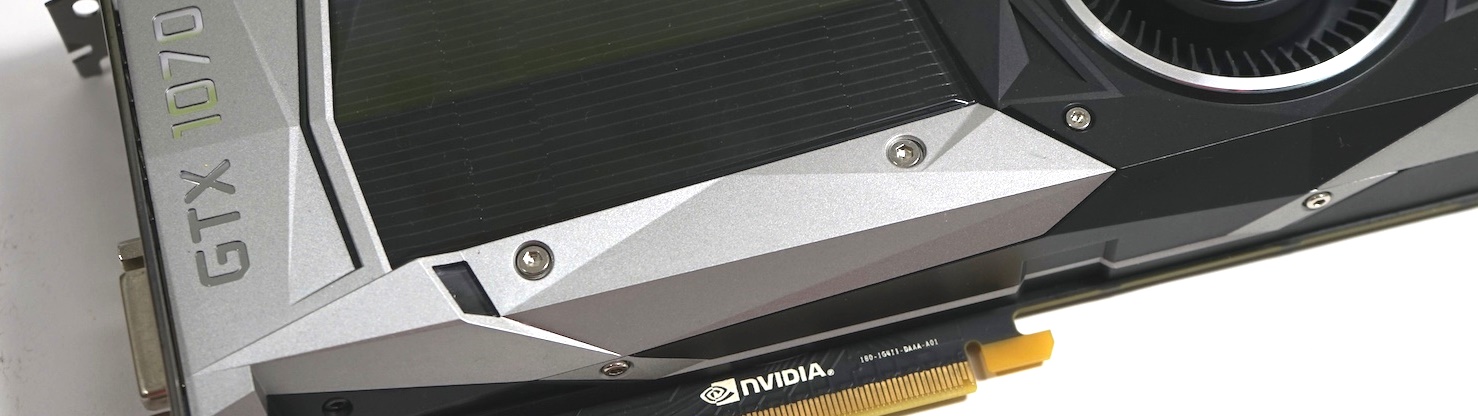
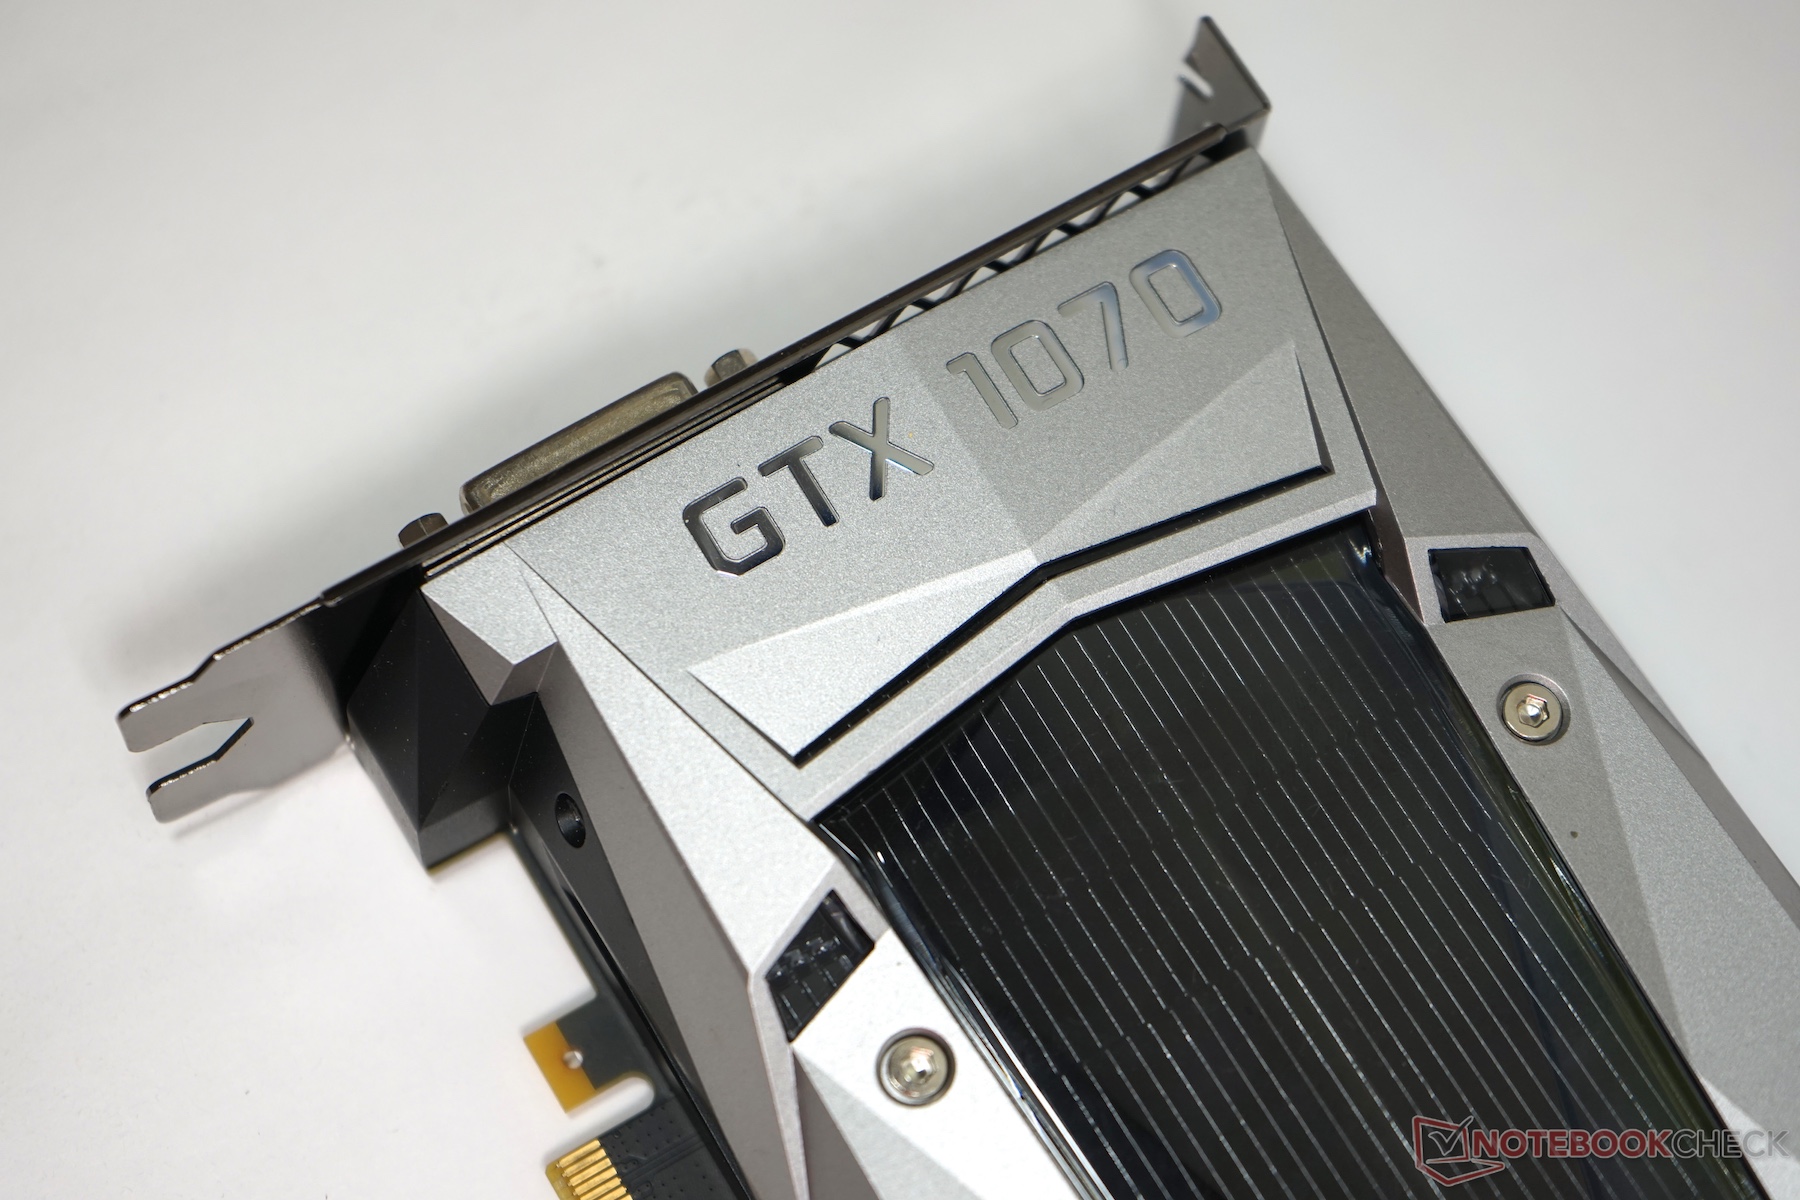
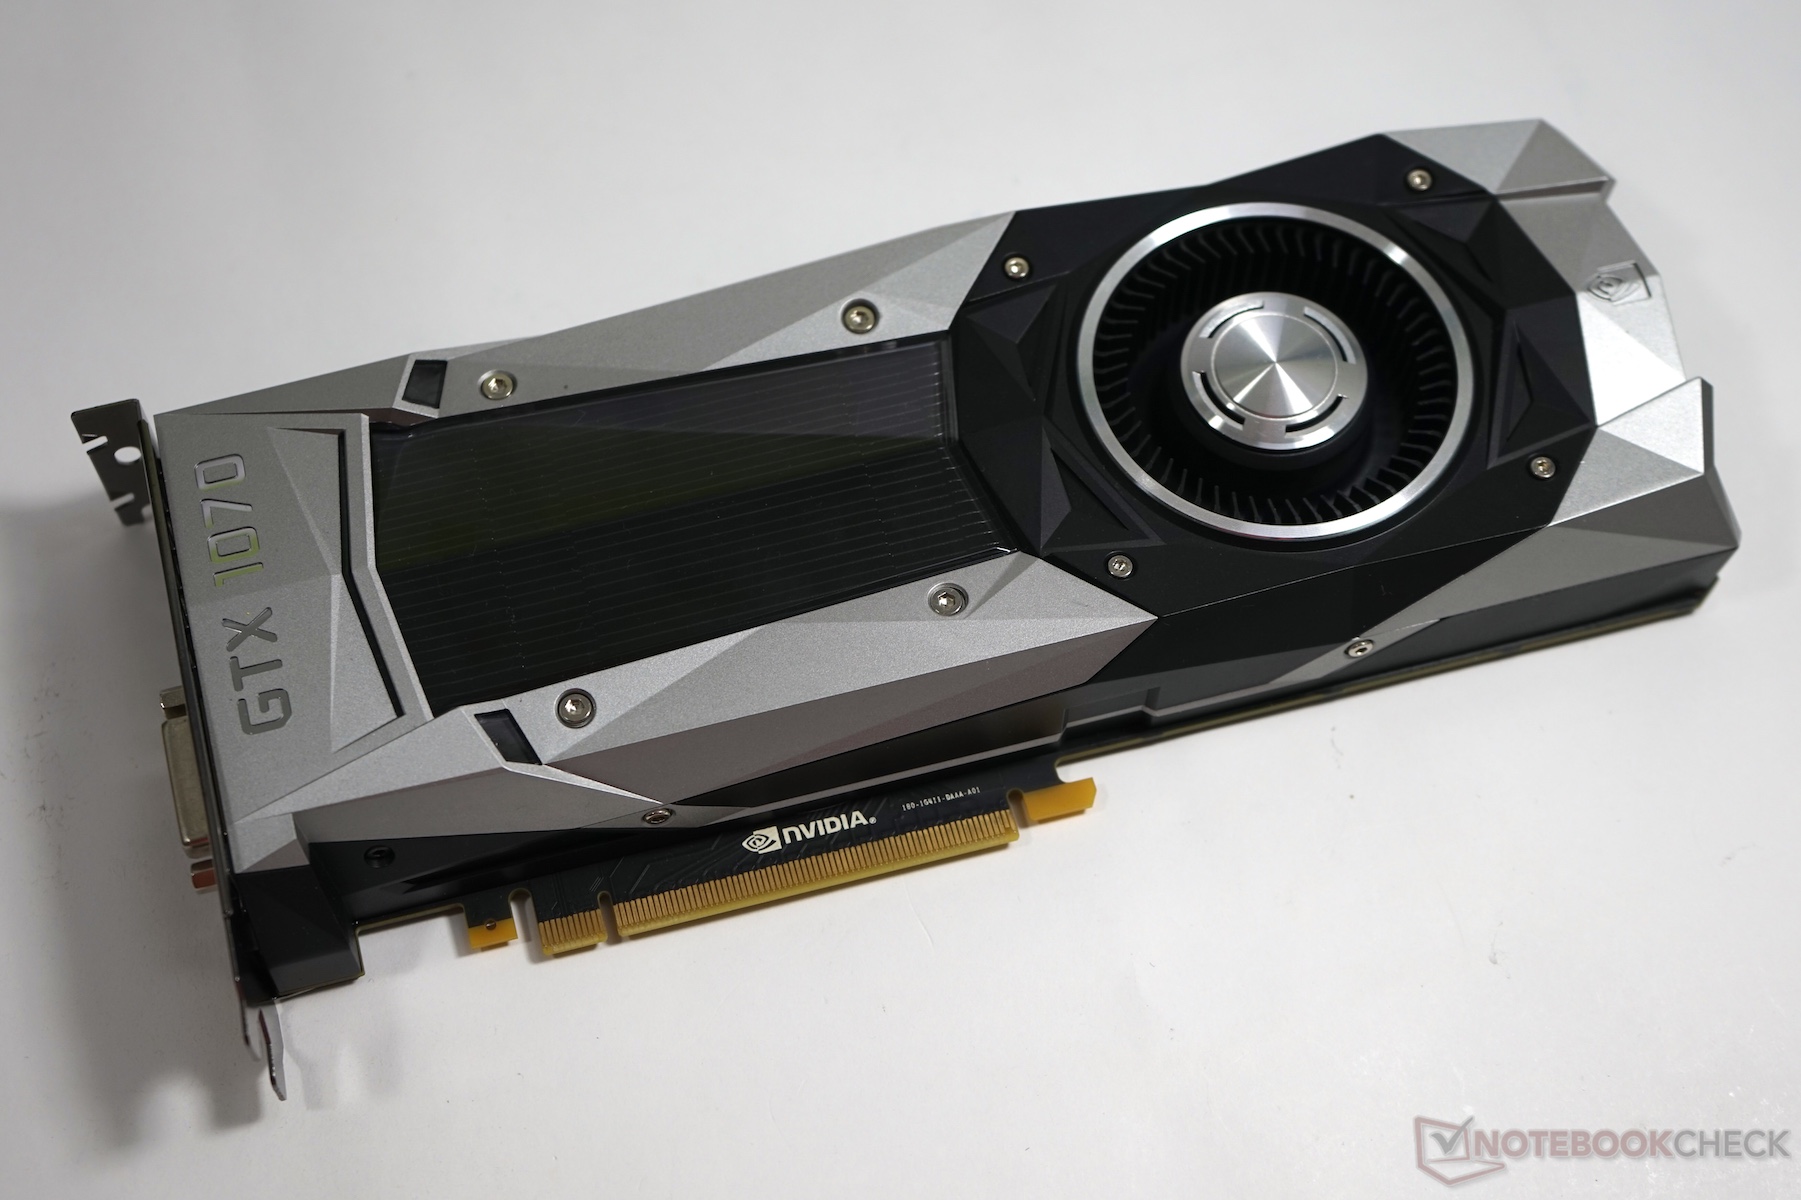
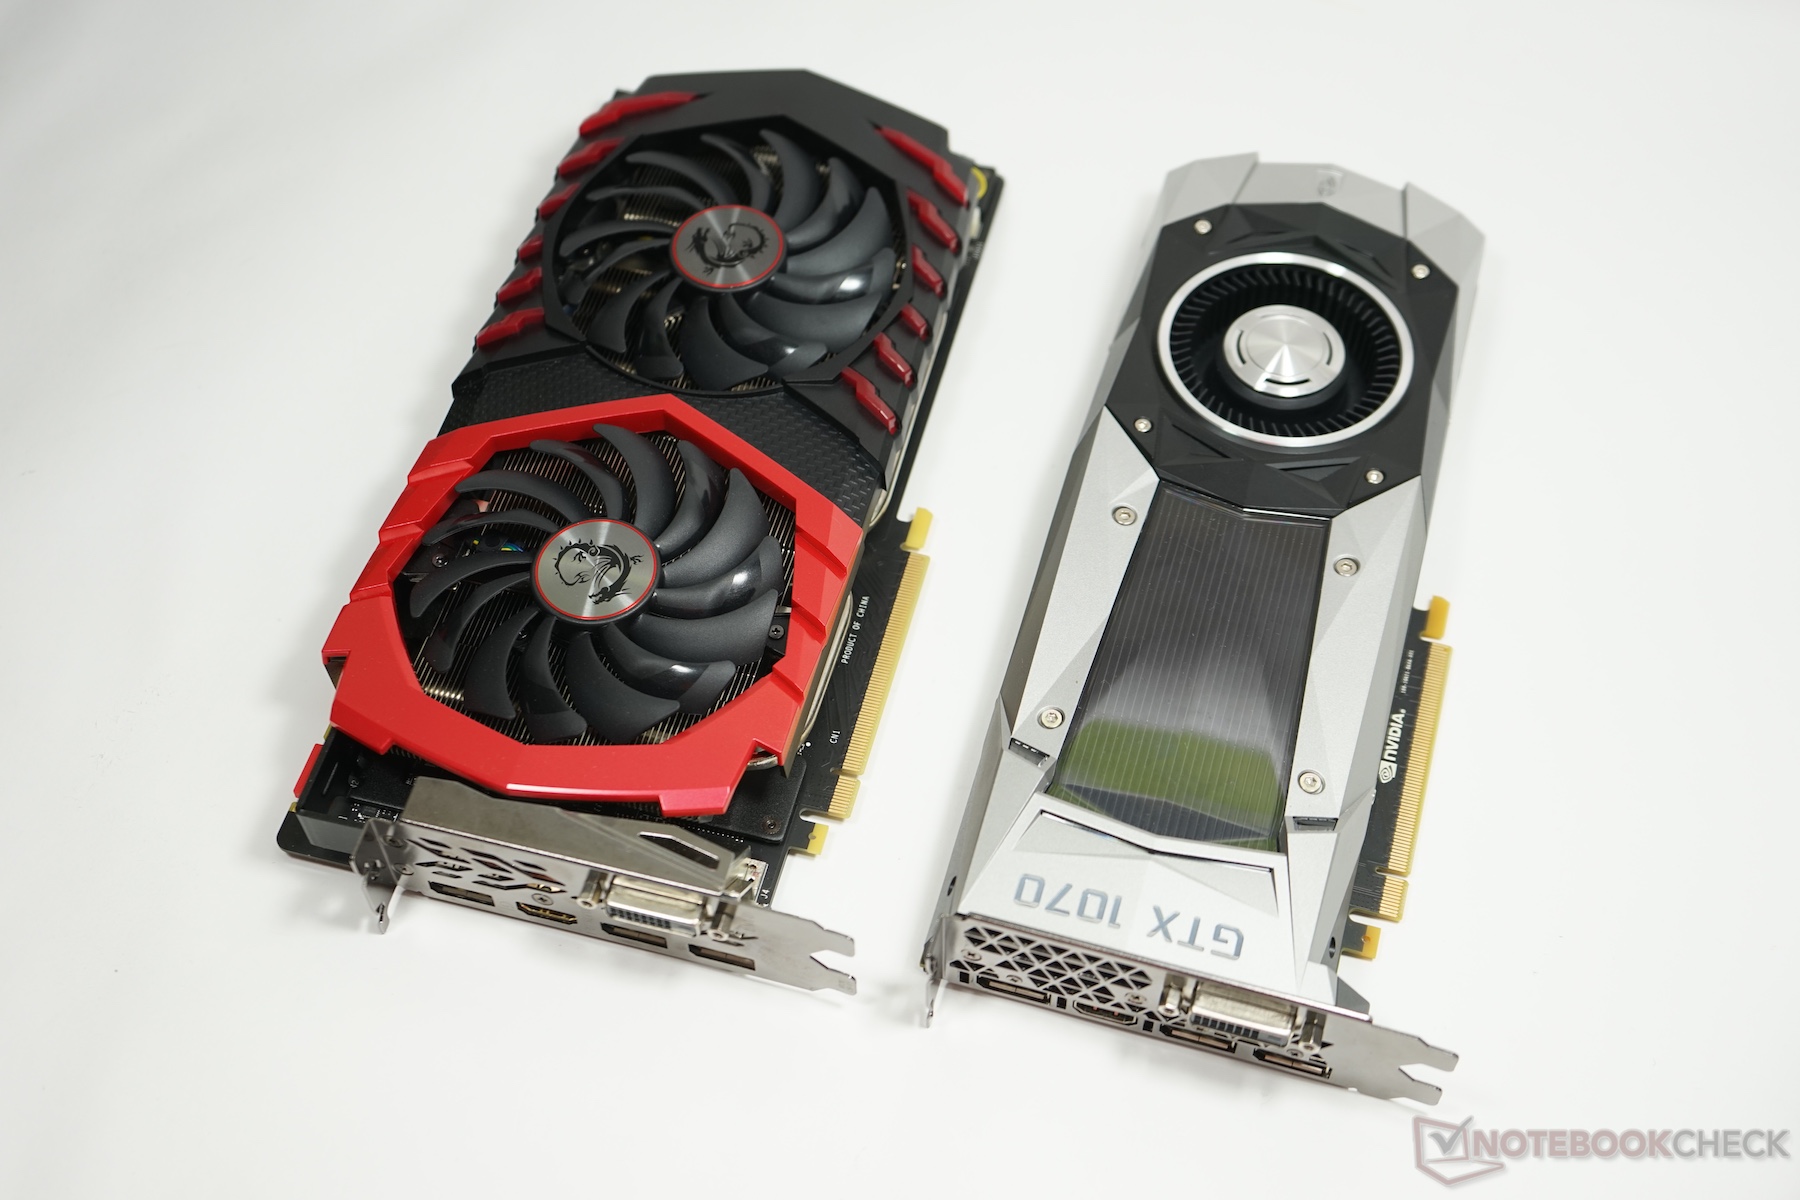
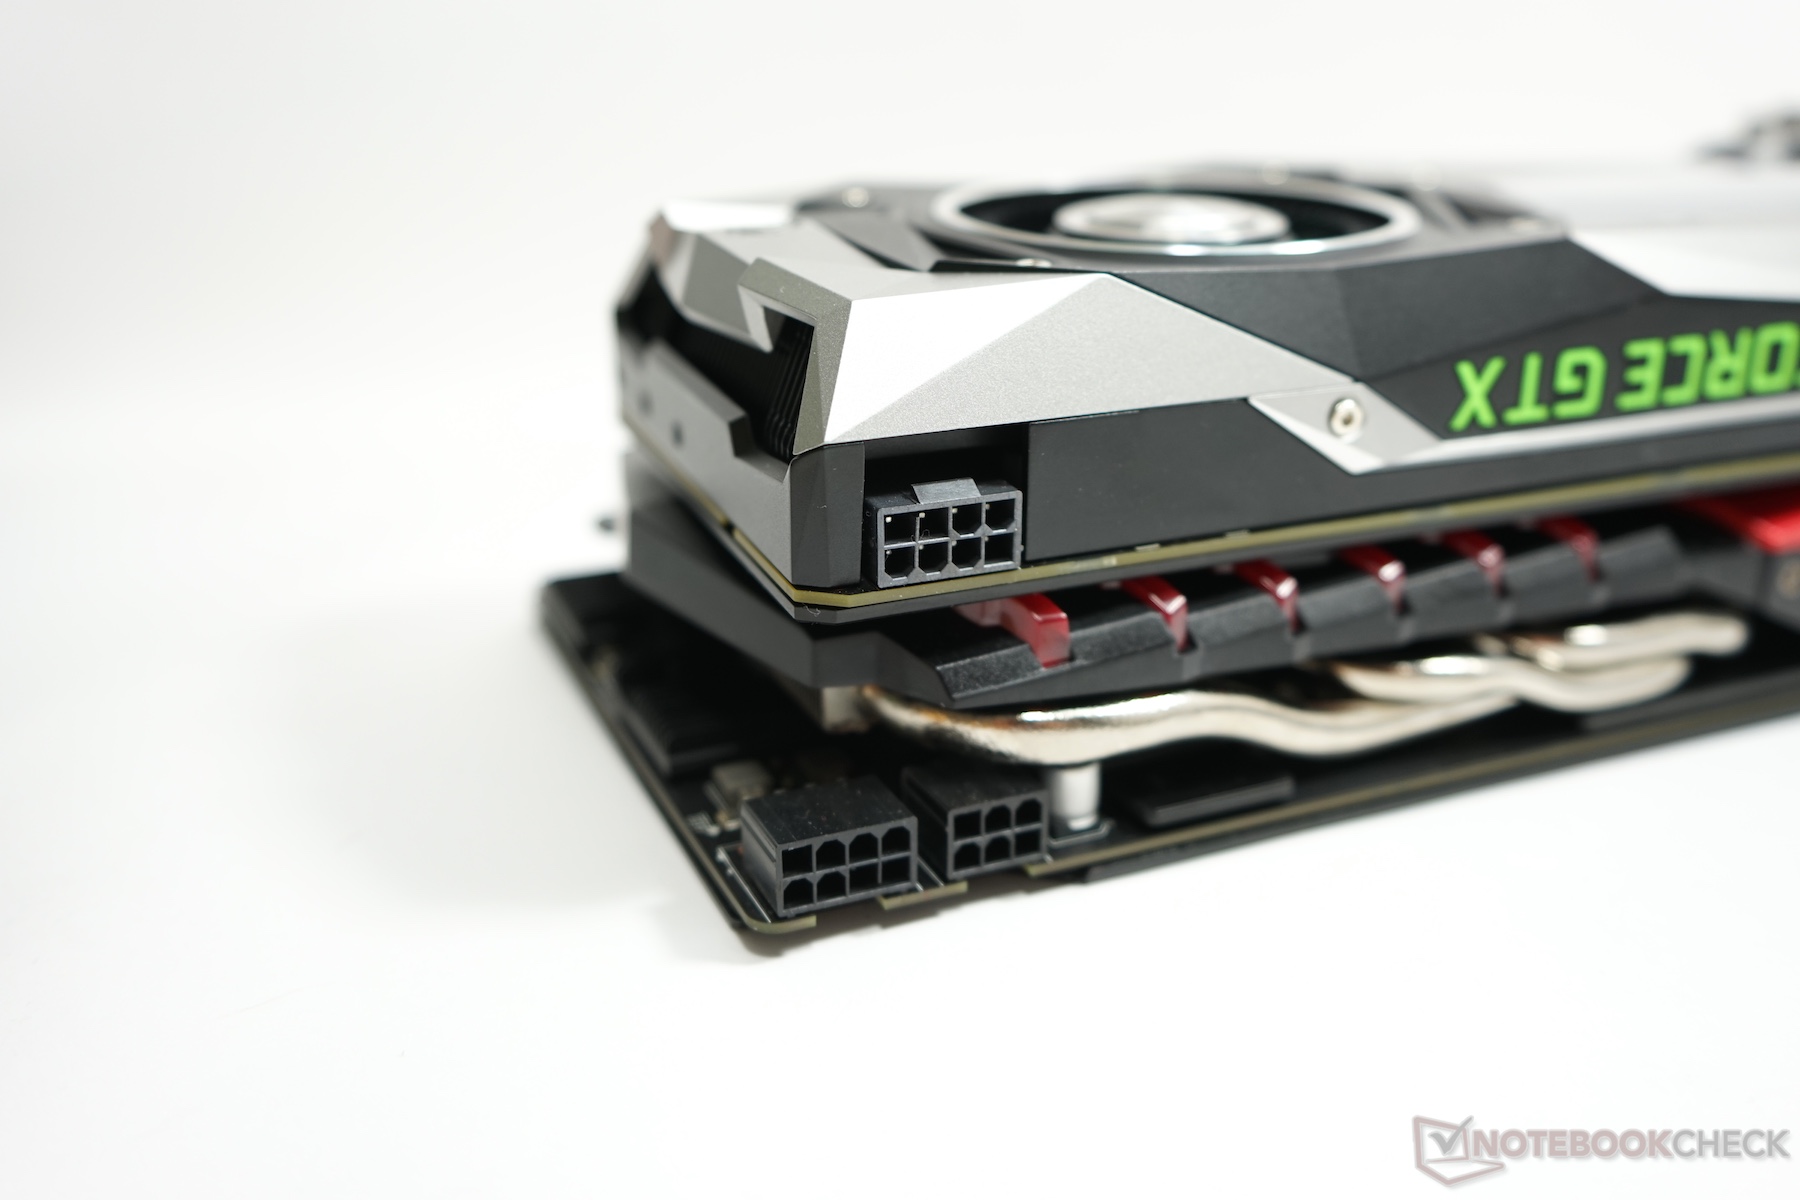
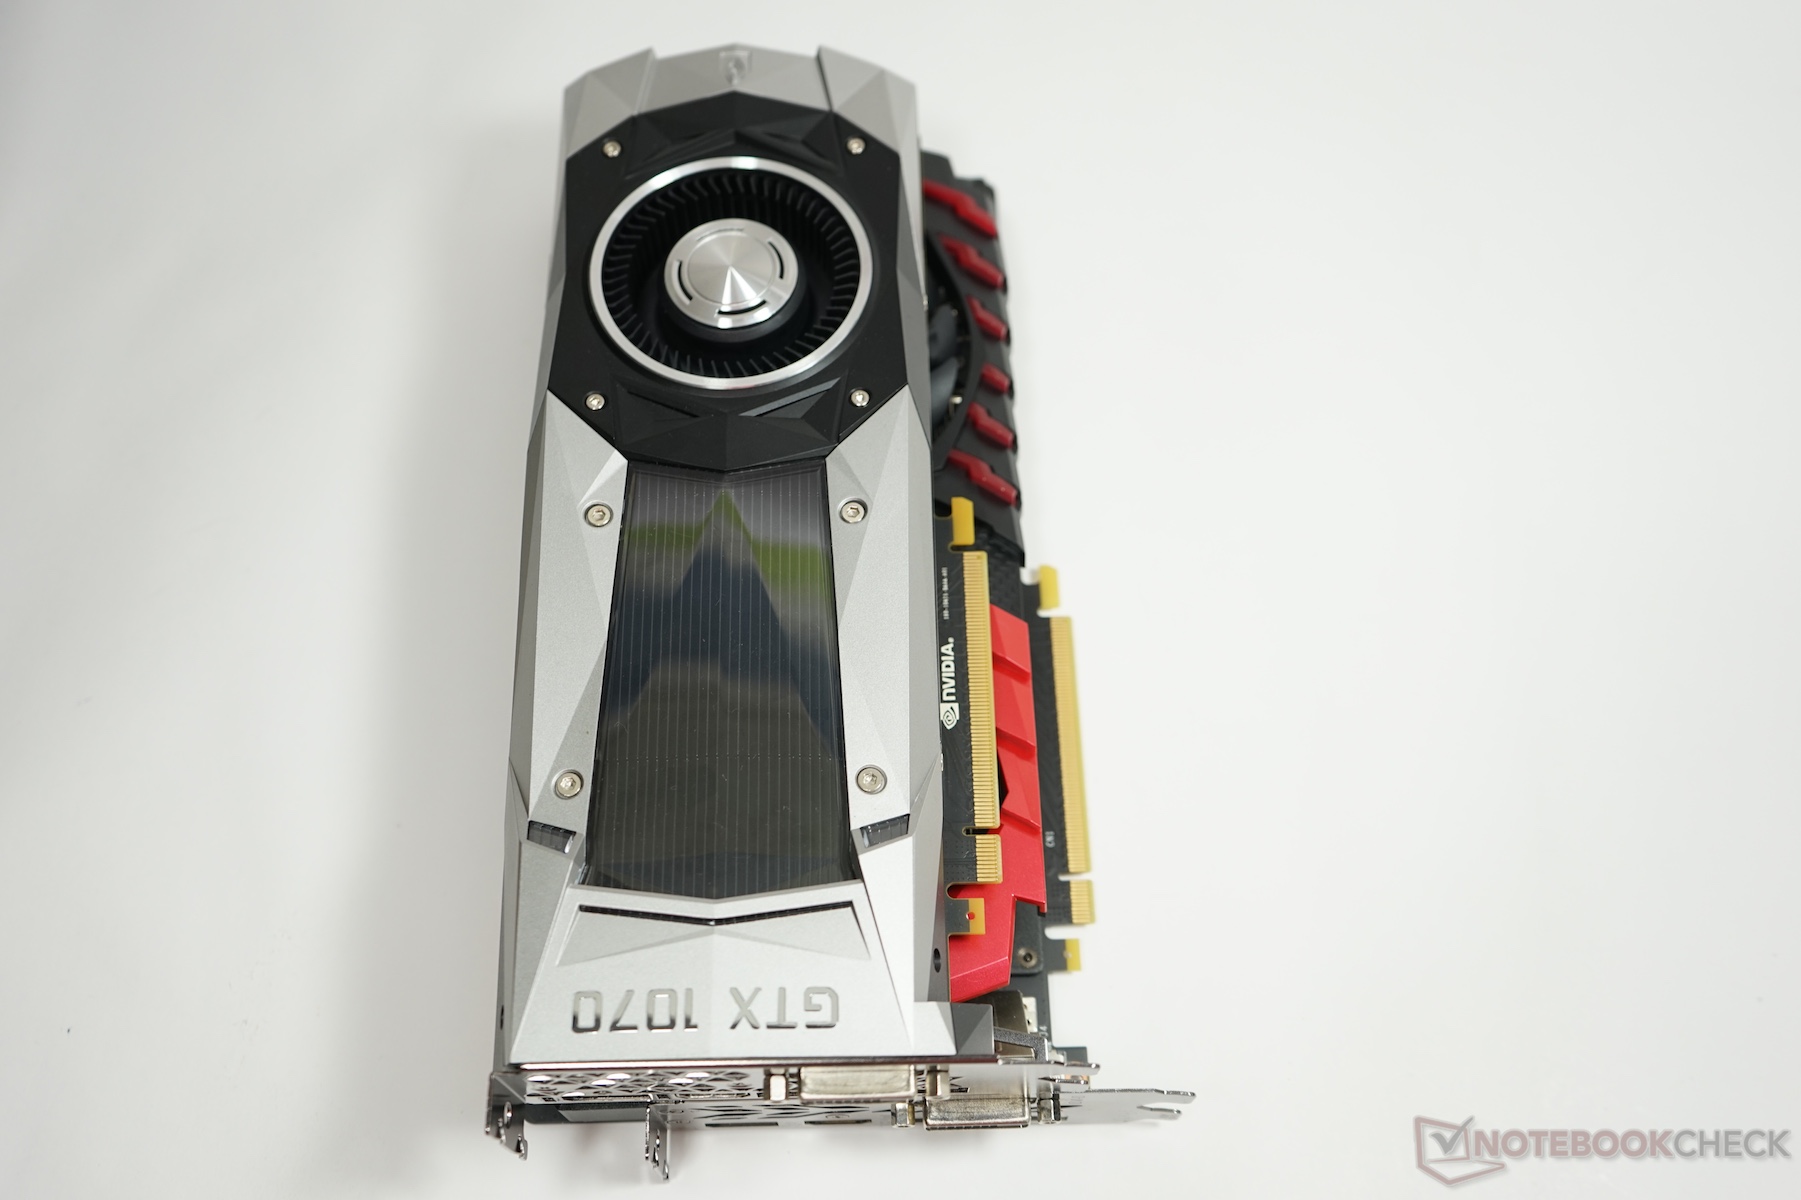
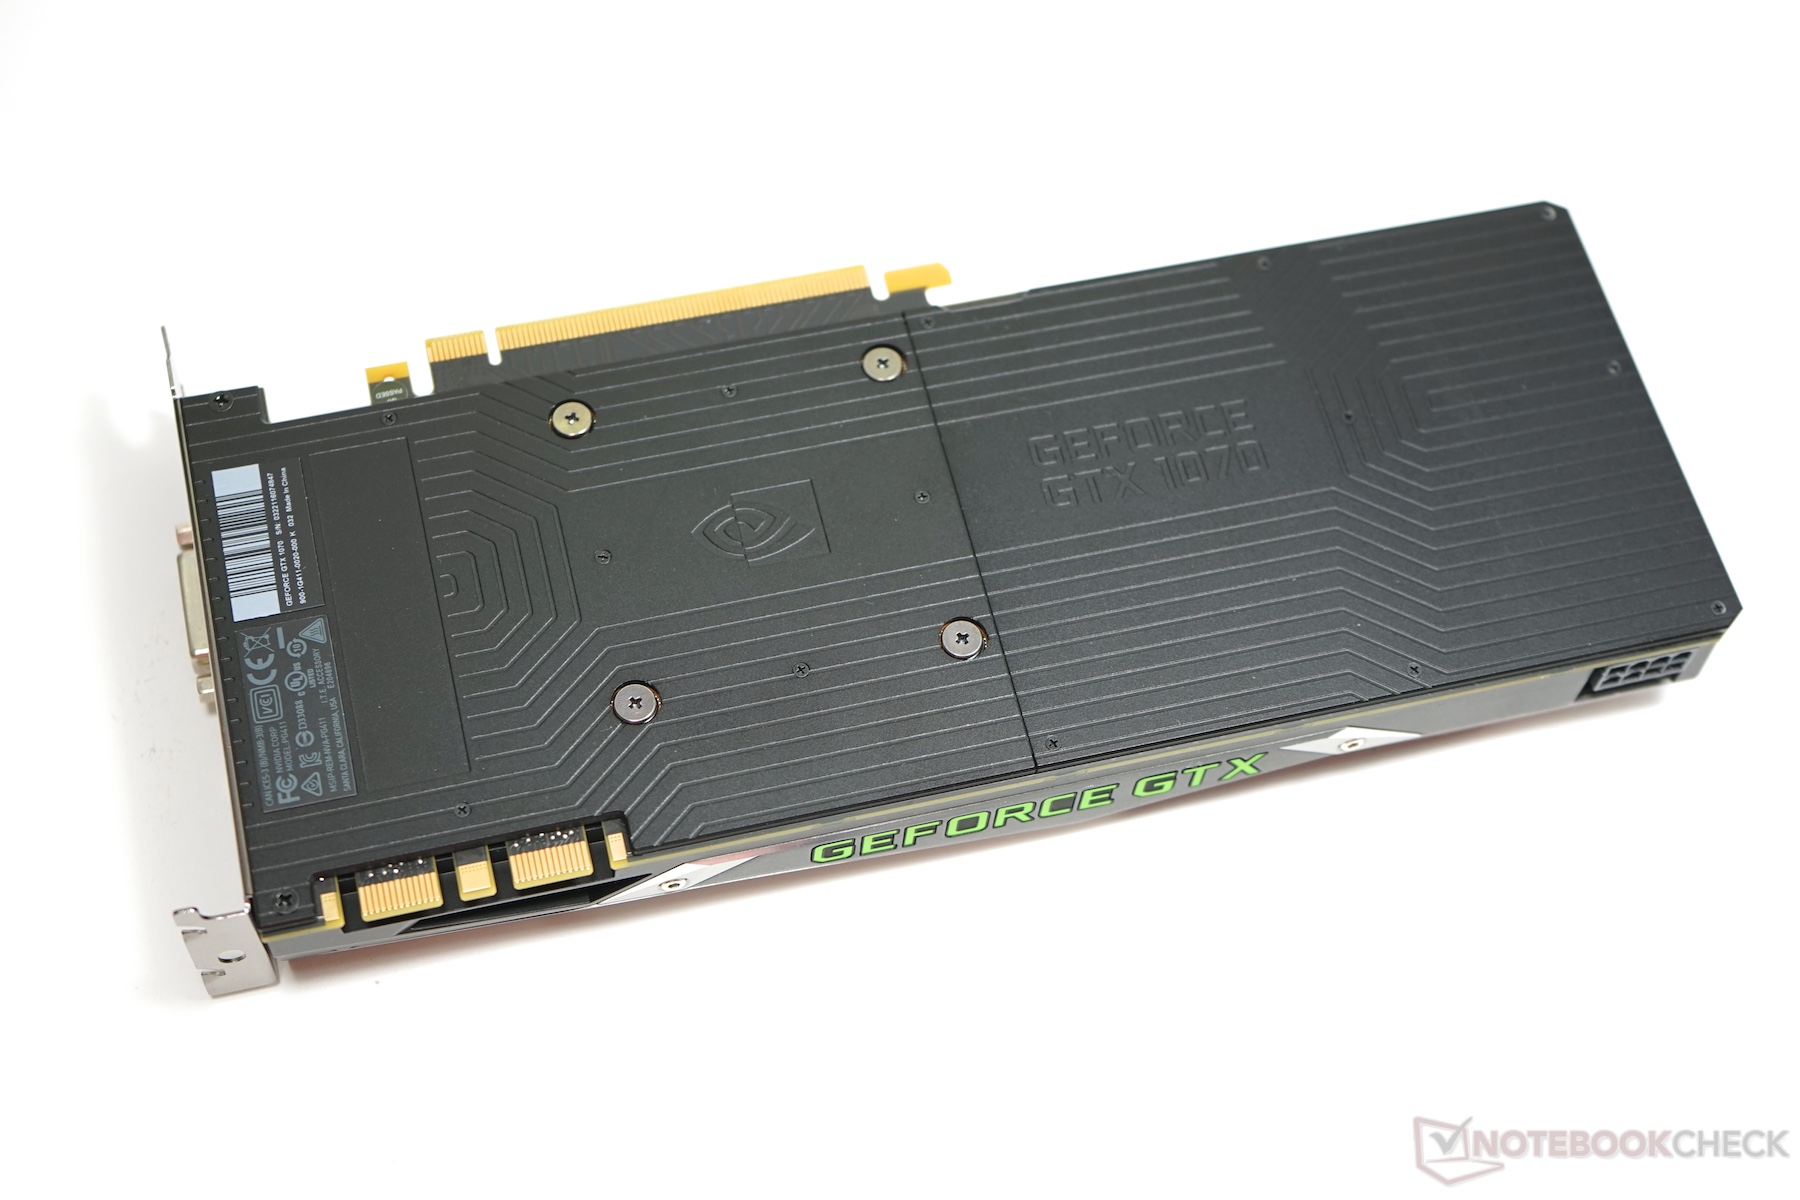
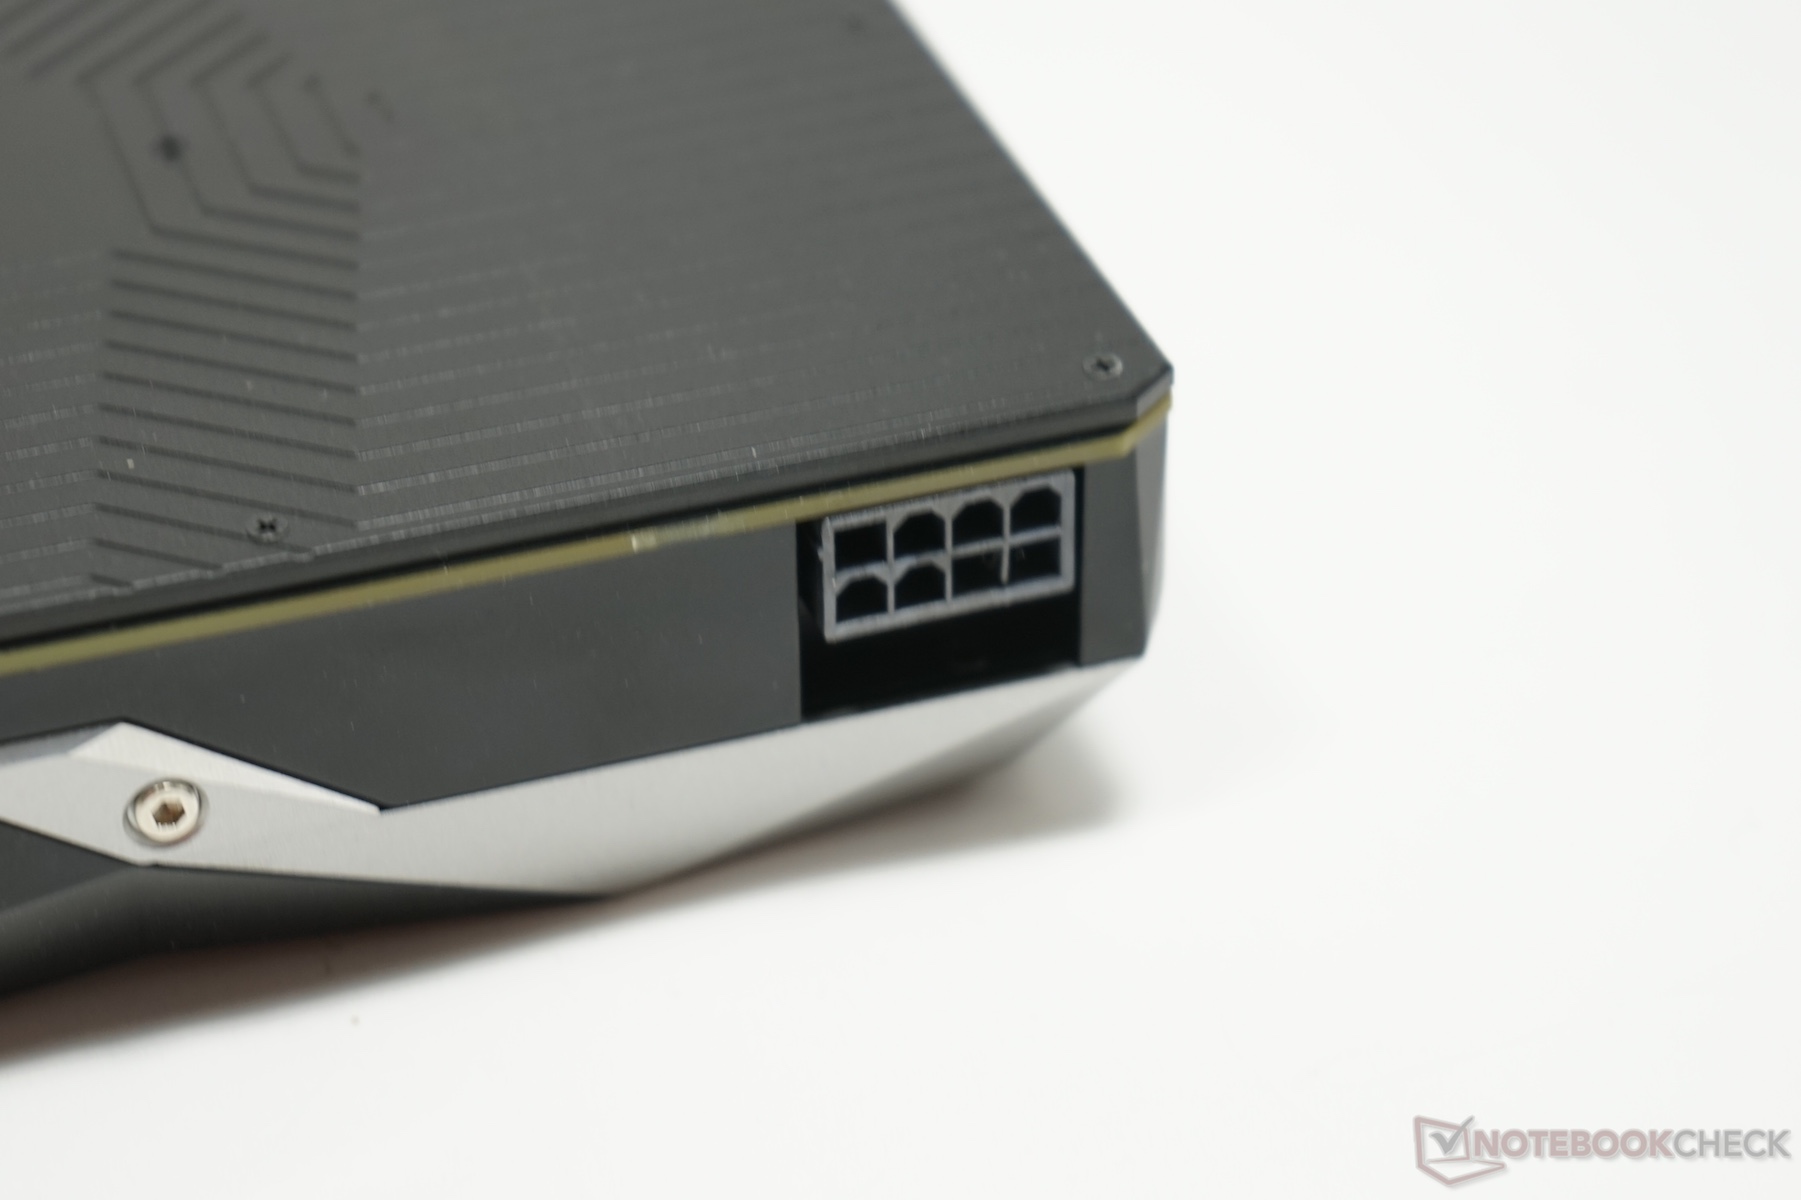
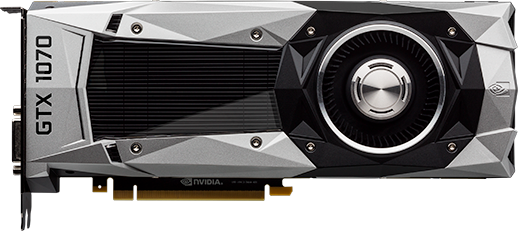
26.6 cm long (~10.5 in), 2 slots wide, 1x 8-pin power-in, and a 65 mm (~2.6 in) radial fan are the visible key features of the Nvidia GeForce GTX 1070 Founder's Edition. The cooling unit is more or less identical to that of the larger sibling. Only the label reveals which components are hidden behind it. Subjectively, the graphics card appears very high-end. The full cover back plate does not only contribute to this impression, but also protects the components. A green glowing "GEFORCE GTX" label decorates the side, which is an eye-catcher in cases with side window.
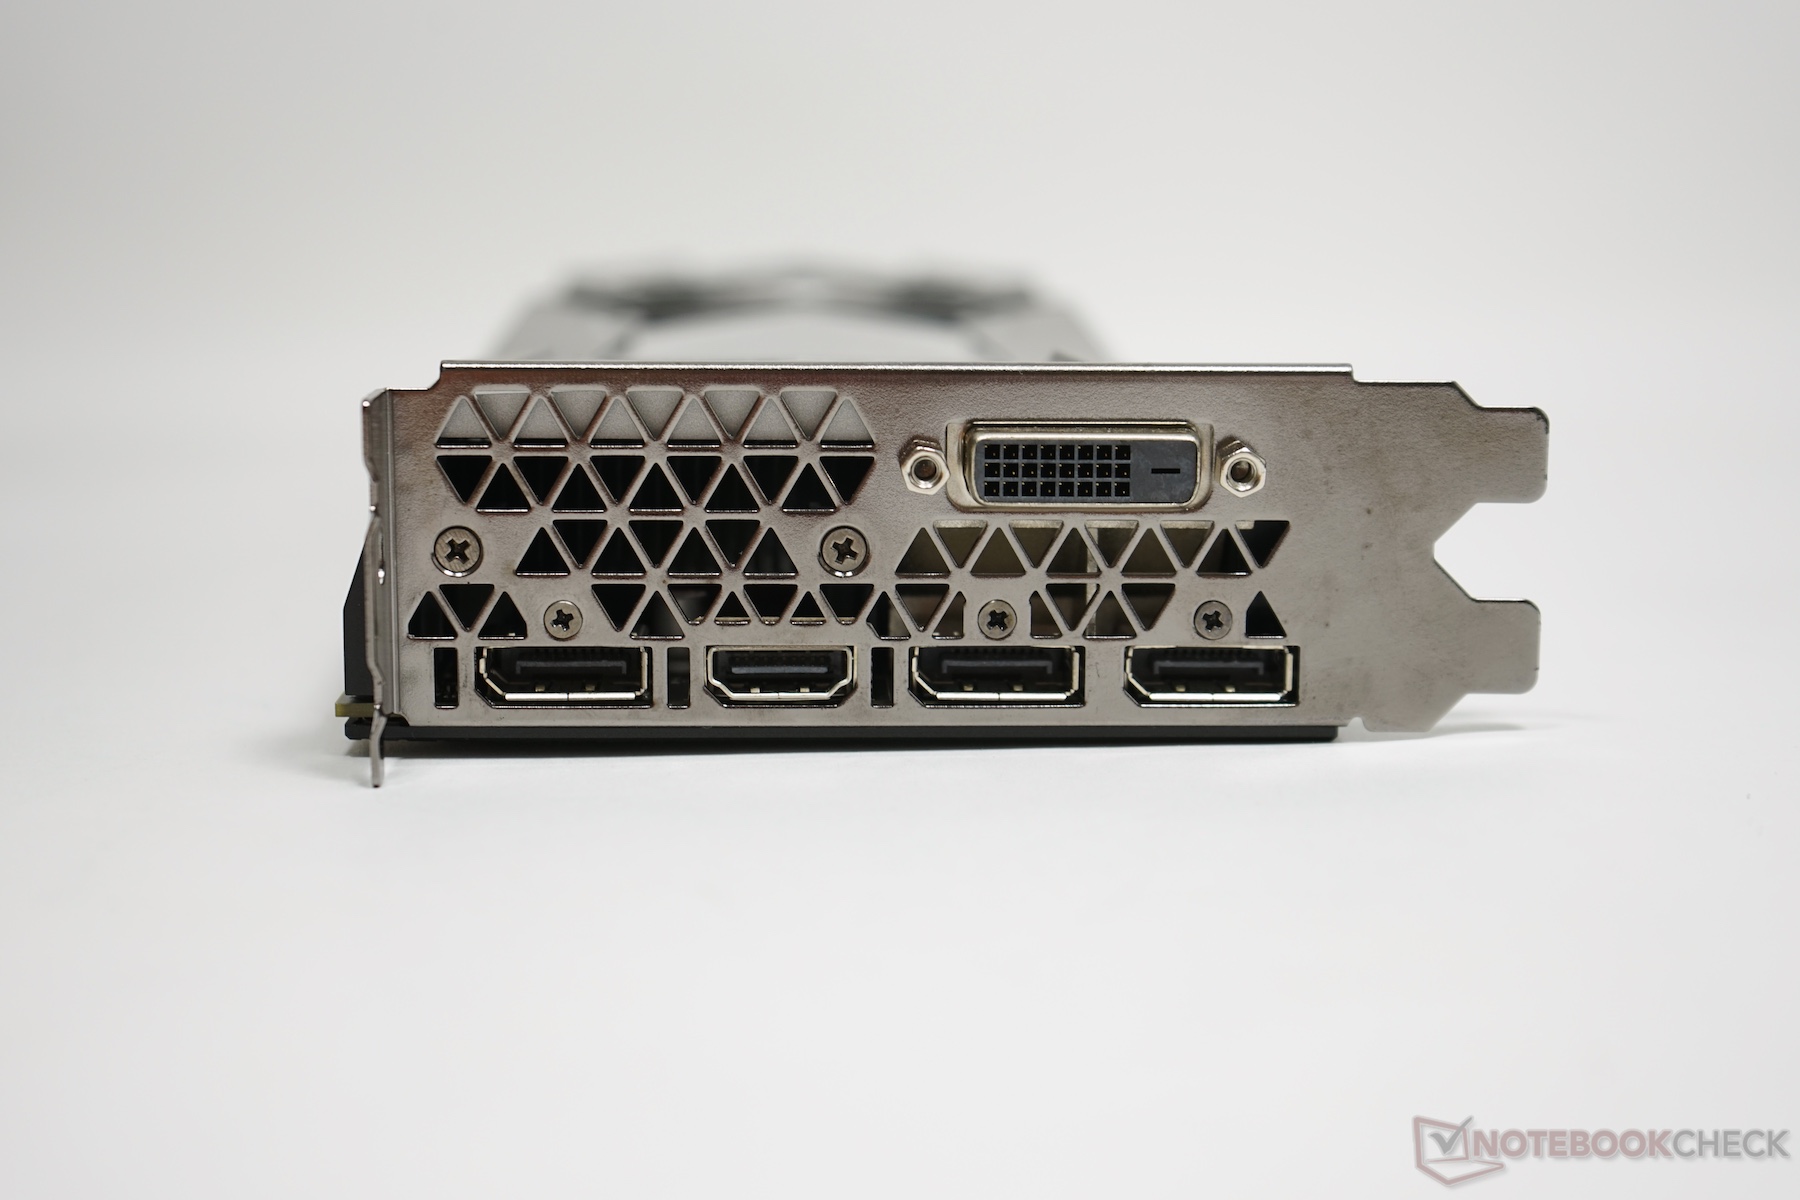
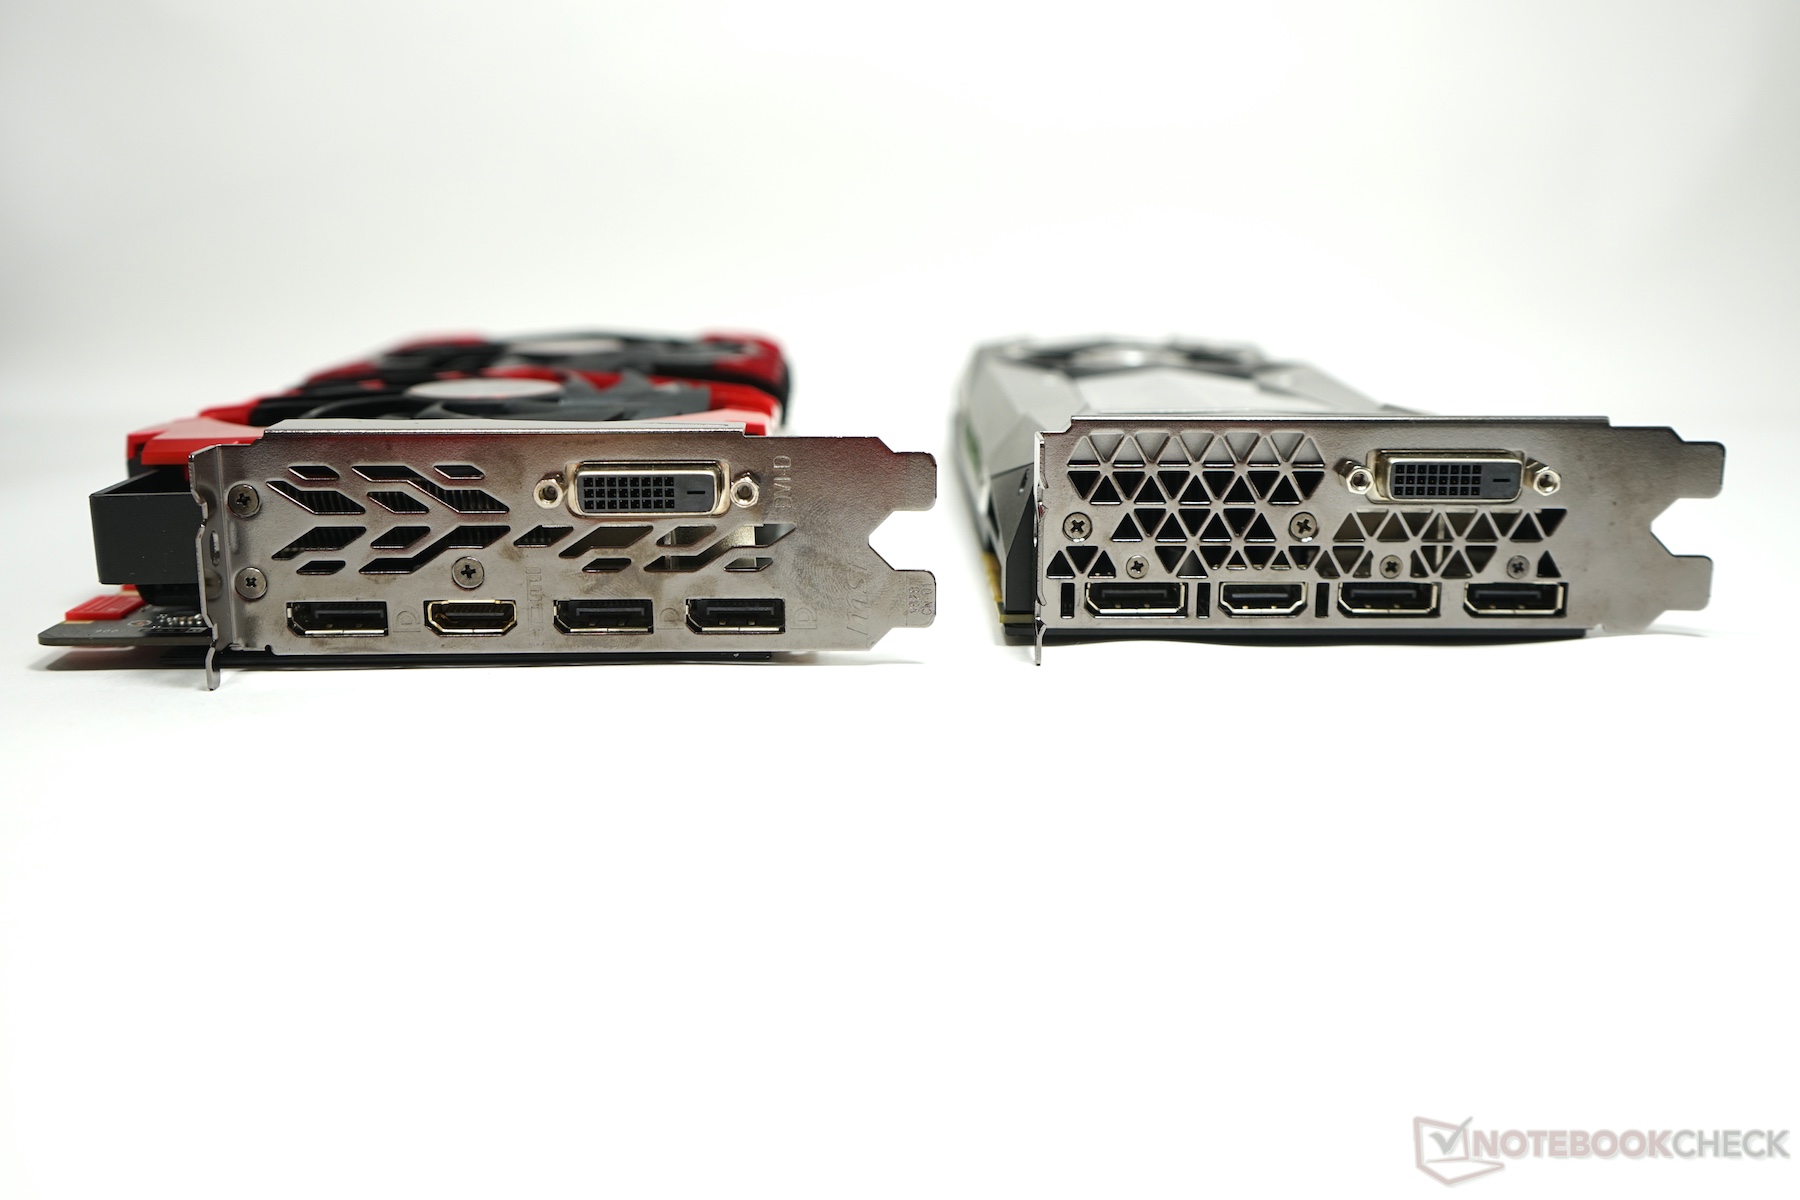
The Nvidia GeForce GTX 1070 Founder's Edition features a dual-link DVI port, an HDMI 2.0 port and three DisplayPorts on the external side. Inside, the performance can be increased by connecting a second graphics card via the SLI interface. However, it is necessary that games support SLI for a performance gain.
The Nvidia GeForce GTX 1070 Founder's Edition is the reference model from Nvidia. This model carries the suffix "Founder's Edition". This graphics card will always be sold with standard clock rates and the same cooling system.
Our test system:
Intel Core i7-4790K (non-overclocked), 16 GB DDR3, Asus Z97-Deluxe, Asus PB287Q 4K Monitor, Intel SSD 530 (240 GB, System), OCZ Trion 100 SSD (480 GB, benchmarks), Microsoft Windows 10 64-bit
Clock Rates
The Nvidia GeForce GTX 1070 Founder's Edition features a base clock of 1506 MHz. Nvidia specifies a Turbo clock of 1683 MHz. Our GPUz render test reported a maximum clock of 1898 MHz. However, this is a theoretical value, which can only be reached for a few seconds when the GPU temperature is very low. Later in the tests, the clock frequency hovers at 1835 MHz. The reference card's clock rates are often significantly above 1700 MHz in the gaming benchmarks.
Synthetic Benchmarks
The Nvidia GeForce GTX 1070 Founder's Edition ranks in just above the older GTX 980 Ti in the synthetic benchmarks. However, graphics cards of the GTX 980 Ti series, which are overclocked out-of-the-box, are able to outperform the GTX 1070 reference cards. Nevertheless, the Nvidia GeForce GTX 1070 is the more modern graphics card and significantly more energy efficient than the predecessor generation. The GTX 1080 is somewhat faster than its smaller sibling by up to 24%.
| 3DMark | |
| 3840x2160 Fire Strike Ultra Graphics | |
| NVIDIA GeForce GTX 1080 (Desktop) | |
| NVIDIA GeForce GTX 1070 (Desktop) | |
| NVIDIA GeForce GTX 1070 (Desktop) | |
| NVIDIA GeForce GTX 980 Ti | |
| AMD Radeon R9 Fury | |
| NVIDIA GeForce GTX 980 | |
| NVIDIA GeForce GTX 970 | |
| AMD Radeon RX 480 (Desktop) | |
| 1920x1080 Fire Strike Graphics | |
| NVIDIA GeForce GTX 1080 (Desktop) | |
| NVIDIA GeForce GTX 1070 (Desktop) | |
| NVIDIA GeForce GTX 980 Ti | |
| NVIDIA GeForce GTX 1070 (Desktop) | |
| AMD Radeon R9 Fury | |
| NVIDIA GeForce GTX 980 | |
| AMD Radeon RX 480 (Desktop) | |
| NVIDIA GeForce GTX 970 | |
| NVIDIA GeForce GTX 970 | |
| 1280x720 Sky Diver Graphics | |
| NVIDIA GeForce GTX 1080 (Desktop) | |
| NVIDIA GeForce GTX 1070 (Desktop) | |
| NVIDIA GeForce GTX 1070 (Desktop) | |
| NVIDIA GeForce GTX 980 Ti | |
| AMD Radeon R9 Fury | |
| NVIDIA GeForce GTX 970 | |
| AMD Radeon RX 480 (Desktop) | |
| NVIDIA GeForce GTX 970 | |
| 1280x720 Cloud Gate Standard Graphics | |
| NVIDIA GeForce GTX 1080 (Desktop) | |
| NVIDIA GeForce GTX 1070 (Desktop) | |
| NVIDIA GeForce GTX 1070 (Desktop) | |
| NVIDIA GeForce GTX 980 Ti | |
| AMD Radeon R9 Fury | |
| NVIDIA GeForce GTX 970 | |
| AMD Radeon RX 480 (Desktop) | |
| NVIDIA GeForce GTX 970 | |
| 2560x1440 Time Spy Graphics | |
| NVIDIA GeForce GTX 1080 (Desktop) | |
| NVIDIA GeForce GTX 1070 (Desktop) | |
| NVIDIA GeForce GTX 1070 (Desktop) | |
| NVIDIA GeForce GTX 980 Ti | |
| AMD Radeon R9 Fury | |
| AMD Radeon RX 480 (Desktop) | |
| NVIDIA GeForce GTX 970 | |
| 3DMark 11 - 1280x720 Performance GPU | |
| NVIDIA GeForce GTX 1080 (Desktop) | |
| NVIDIA GeForce GTX 1070 (Desktop) | |
| NVIDIA GeForce GTX 1070 (Desktop) | |
| NVIDIA GeForce GTX 980 Ti | |
| AMD Radeon RX 480 (Desktop) | |
| NVIDIA GeForce GTX 980 | |
| AMD Radeon R9 Fury | |
| NVIDIA GeForce GTX 970 | |
| NVIDIA GeForce GTX 970 | |
| Unigine Heaven 4.0 - Extreme Preset DX11 | |
| NVIDIA GeForce GTX 1080 (Desktop) | |
| NVIDIA GeForce GTX 1070 (Desktop) | |
| NVIDIA GeForce GTX 1070 (Desktop) | |
| NVIDIA GeForce GTX 980 Ti | |
| NVIDIA GeForce GTX 980 | |
| AMD Radeon R9 Fury | |
| NVIDIA GeForce GTX 970 | |
| AMD Radeon RX 480 (Desktop) | |
| Unigine Valley 1.0 - 1920x1080 Extreme HD DirectX AA:x8 | |
| NVIDIA GeForce GTX 1080 (Desktop) | |
| NVIDIA GeForce GTX 1070 (Desktop) | |
| NVIDIA GeForce GTX 1070 (Desktop) | |
| NVIDIA GeForce GTX 980 Ti | |
| AMD Radeon R9 Fury | |
| NVIDIA GeForce GTX 970 | |
| AMD Radeon RX 480 (Desktop) | |
Gaming Performance
As with the GTX 1070 from MSI, the Founder's Edition also ensures decent performance. Most games run smoothly in 4K with high preset. Depending on game and preset, the GeForce GTX 1070 Founder's Edition is about 10% slower than the MSI card, which, however, is overclocked out-of-the-box. In terms of gaming performance, the two rivals, GeForce GTX 1070 Founder's Edition and GeForce GTX 980 Ti are on par.
| Mirror's Edge Catalyst | |
| 1920x1080 Ultra Preset AF:16x | |
| NVIDIA GeForce GTX 1080 (Desktop) | |
| NVIDIA GeForce GTX 1070 (Desktop) | |
| NVIDIA GeForce GTX 1070 (Desktop) | |
| NVIDIA GeForce GTX 980 Ti | |
| AMD Radeon R9 Fury | |
| NVIDIA GeForce GTX 980 | |
| NVIDIA GeForce GTX 970 | |
| AMD Radeon RX 480 (Desktop) | |
| AMD Radeon R9 290X | |
| 3840x2160 High Preset AF:16x | |
| NVIDIA GeForce GTX 1080 (Desktop) | |
| NVIDIA GeForce GTX 1070 (Desktop) | |
| NVIDIA GeForce GTX 980 Ti | |
| NVIDIA GeForce GTX 1070 (Desktop) | |
| AMD Radeon R9 Fury | |
| AMD Radeon R9 290X | |
| NVIDIA GeForce GTX 980 | |
| NVIDIA GeForce GTX 970 | |
| AMD Radeon RX 480 (Desktop) | |
| Overwatch | |
| 1920x1080 Epic (Render Scale 100 %) AA:SM AF:16x | |
| NVIDIA GeForce GTX 1080 (Desktop) | |
| NVIDIA GeForce GTX 1070 (Desktop) | |
| NVIDIA GeForce GTX 1070 (Desktop) | |
| NVIDIA GeForce GTX 980 Ti | |
| AMD Radeon RX 480 (Desktop) | |
| AMD Radeon R9 Fury | |
| NVIDIA GeForce GTX 980 | |
| NVIDIA GeForce GTX 970 | |
| AMD Radeon R9 290X | |
| 3840x2160 High (Render Scale 100 %) AA:SM AF:4x | |
| NVIDIA GeForce GTX 1080 (Desktop) | |
| NVIDIA GeForce GTX 1070 (Desktop) | |
| NVIDIA GeForce GTX 980 Ti | |
| NVIDIA GeForce GTX 1070 (Desktop) | |
| AMD Radeon R9 Fury | |
| AMD Radeon R9 290X | |
| NVIDIA GeForce GTX 980 | |
| NVIDIA GeForce GTX 970 | |
| AMD Radeon RX 480 (Desktop) | |
| Doom | |
| 1920x1080 Ultra Preset AA:SM | |
| NVIDIA GeForce GTX 1080 (Desktop) | |
| NVIDIA GeForce GTX 1070 (Desktop) | |
| NVIDIA GeForce GTX 1070 (Desktop) | |
| NVIDIA GeForce GTX 980 Ti | |
| NVIDIA GeForce GTX 980 | |
| NVIDIA GeForce GTX 970 | |
| AMD Radeon R9 Fury | |
| AMD Radeon RX 480 (Desktop) | |
| 3840x2160 High Preset AA:FX | |
| NVIDIA GeForce GTX 1080 (Desktop) | |
| NVIDIA GeForce GTX 1070 (Desktop) | |
| NVIDIA GeForce GTX 1070 (Desktop) | |
| NVIDIA GeForce GTX 980 Ti | |
| AMD Radeon R9 Fury | |
| NVIDIA GeForce GTX 980 | |
| NVIDIA GeForce GTX 970 | |
| AMD Radeon RX 480 (Desktop) | |
| Need for Speed 2016 | |
| 1920x1080 Ultra / On AA:T | |
| NVIDIA GeForce GTX 1080 (Desktop) | |
| NVIDIA GeForce GTX 1070 (Desktop) | |
| NVIDIA GeForce GTX 1070 (Desktop) | |
| NVIDIA GeForce GTX 980 Ti | |
| NVIDIA GeForce GTX 980 | |
| NVIDIA GeForce GTX 970 | |
| AMD Radeon RX 480 (Desktop) | |
| AMD Radeon R9 Fury | |
| AMD Radeon R9 290X | |
| 3840x2160 High / On AA:FX | |
| NVIDIA GeForce GTX 1080 (Desktop) | |
| NVIDIA GeForce GTX 1070 (Desktop) | |
| NVIDIA GeForce GTX 980 Ti | |
| NVIDIA GeForce GTX 1070 (Desktop) | |
| AMD Radeon R9 Fury | |
| NVIDIA GeForce GTX 980 | |
| AMD Radeon R9 290X | |
| AMD Radeon RX 480 (Desktop) | |
| NVIDIA GeForce GTX 970 | |
| Hitman 2016 | |
| 1920x1080 Ultra / On AA:SM AF:16x | |
| NVIDIA GeForce GTX 1080 (Desktop) | |
| NVIDIA GeForce GTX 1070 (Desktop) | |
| NVIDIA GeForce GTX 1070 (Desktop) | |
| NVIDIA GeForce GTX 980 Ti | |
| AMD Radeon RX 480 (Desktop) | |
| AMD Radeon RX 480 (Desktop) | |
| AMD Radeon R9 Fury | |
| AMD Radeon R9 Fury | |
| AMD Radeon R9 290X | |
| NVIDIA GeForce GTX 980 | |
| NVIDIA GeForce GTX 970 | |
| 3840x2160 High / On AA:FX AF:8x | |
| NVIDIA GeForce GTX 1080 (Desktop) | |
| NVIDIA GeForce GTX 1070 (Desktop) | |
| AMD Radeon R9 Fury | |
| AMD Radeon R9 Fury | |
| NVIDIA GeForce GTX 1070 (Desktop) | |
| NVIDIA GeForce GTX 980 Ti | |
| AMD Radeon R9 290X | |
| AMD Radeon RX 480 (Desktop) | |
| AMD Radeon RX 480 (Desktop) | |
| NVIDIA GeForce GTX 980 | |
| NVIDIA GeForce GTX 970 | |
| The Division | |
| 1920x1080 Ultra Preset AF:16x | |
| NVIDIA GeForce GTX 1080 (Desktop) | |
| NVIDIA GeForce GTX 1070 (Desktop) | |
| NVIDIA GeForce GTX 1070 (Desktop) | |
| NVIDIA GeForce GTX 980 Ti | |
| AMD Radeon R9 Fury | |
| NVIDIA GeForce GTX 980 | |
| AMD Radeon RX 480 (Desktop) | |
| NVIDIA GeForce GTX 970 | |
| AMD Radeon R9 290X | |
| 3840x2160 High Preset AF:8x | |
| NVIDIA GeForce GTX 1080 (Desktop) | |
| NVIDIA GeForce GTX 1070 (Desktop) | |
| NVIDIA GeForce GTX 980 Ti | |
| NVIDIA GeForce GTX 1070 (Desktop) | |
| AMD Radeon R9 Fury | |
| AMD Radeon R9 290X | |
| AMD Radeon RX 480 (Desktop) | |
| NVIDIA GeForce GTX 980 | |
| NVIDIA GeForce GTX 970 | |
| Far Cry Primal | |
| 1920x1080 Ultra Preset AA:SM | |
| NVIDIA GeForce GTX 1080 (Desktop) | |
| NVIDIA GeForce GTX 1070 (Desktop) | |
| NVIDIA GeForce GTX 1070 (Desktop) | |
| NVIDIA GeForce GTX 980 Ti | |
| AMD Radeon R9 Fury | |
| NVIDIA GeForce GTX 980 | |
| AMD Radeon RX 480 (Desktop) | |
| NVIDIA GeForce GTX 970 | |
| 3840x2160 High Preset AA:SM | |
| NVIDIA GeForce GTX 1080 (Desktop) | |
| NVIDIA GeForce GTX 1070 (Desktop) | |
| NVIDIA GeForce GTX 980 Ti | |
| NVIDIA GeForce GTX 1070 (Desktop) | |
| AMD Radeon R9 Fury | |
| NVIDIA GeForce GTX 980 | |
| AMD Radeon RX 480 (Desktop) | |
| NVIDIA GeForce GTX 970 | |
| XCOM 2 | |
| 1920x1080 Maximum Preset (8xMSAA instead of FXAA) AA:8xMS AF:16x | |
| NVIDIA GeForce GTX 1080 (Desktop) | |
| NVIDIA GeForce GTX 1070 (Desktop) | |
| NVIDIA GeForce GTX 1070 (Desktop) | |
| NVIDIA GeForce GTX 980 Ti | |
| AMD Radeon R9 Fury | |
| NVIDIA GeForce GTX 980 | |
| NVIDIA GeForce GTX 970 | |
| AMD Radeon RX 480 (Desktop) | |
| 3840x2160 High Preset AA:FX AF:8x | |
| NVIDIA GeForce GTX 1080 (Desktop) | |
| NVIDIA GeForce GTX 1070 (Desktop) | |
| NVIDIA GeForce GTX 1070 (Desktop) | |
| NVIDIA GeForce GTX 980 Ti | |
| AMD Radeon R9 Fury | |
| NVIDIA GeForce GTX 980 | |
| AMD Radeon RX 480 (Desktop) | |
| NVIDIA GeForce GTX 970 | |
| Rise of the Tomb Raider | |
| 3840x2160 High Preset AA:FX AF:4x | |
| NVIDIA GeForce GTX 1080 (Desktop) | |
| NVIDIA GeForce GTX 1080 (Desktop) | |
| NVIDIA GeForce GTX 1070 (Desktop) | |
| NVIDIA GeForce GTX 980 Ti | |
| NVIDIA GeForce GTX 1070 (Desktop) | |
| AMD Radeon R9 Fury | |
| NVIDIA GeForce GTX 980 | |
| AMD Radeon R9 290X | |
| AMD Radeon RX 480 (Desktop) | |
| AMD Radeon RX 480 (Desktop) | |
| NVIDIA GeForce GTX 970 | |
| 1920x1080 Very High Preset AA:FX AF:16x | |
| NVIDIA GeForce GTX 1080 (Desktop) | |
| NVIDIA GeForce GTX 1080 (Desktop) | |
| NVIDIA GeForce GTX 1080 (Desktop) | |
| NVIDIA GeForce GTX 1070 (Desktop) | |
| NVIDIA GeForce GTX 1070 (Desktop) | |
| NVIDIA GeForce GTX 980 Ti | |
| NVIDIA GeForce GTX 980 | |
| NVIDIA GeForce GTX 970 | |
| AMD Radeon R9 Fury | |
| AMD Radeon RX 480 (Desktop) | |
| AMD Radeon R9 290X | |
| Just Cause 3 | |
| 3840x2160 High / On AA:FX AF:8x | |
| NVIDIA GeForce GTX 1080 (Desktop) | |
| NVIDIA GeForce GTX 1070 (Desktop) | |
| NVIDIA GeForce GTX 1070 (Desktop) | |
| NVIDIA GeForce GTX 980 Ti | |
| NVIDIA GeForce GTX 980 | |
| AMD Radeon R9 Fury | |
| NVIDIA GeForce GTX 970 | |
| AMD Radeon RX 480 (Desktop) | |
| AMD Radeon R9 390X | |
| 1920x1080 Very High / On AA:SM AF:16x | |
| NVIDIA GeForce GTX 1080 (Desktop) | |
| NVIDIA GeForce GTX 1070 (Desktop) | |
| NVIDIA GeForce GTX 1070 (Desktop) | |
| NVIDIA GeForce GTX 980 Ti | |
| NVIDIA GeForce GTX 980 | |
| AMD Radeon RX 480 (Desktop) | |
| NVIDIA GeForce GTX 970 | |
| AMD Radeon R9 Fury | |
| AMD Radeon R9 390X | |
| Rainbow Six Siege | |
| 1920x1080 Ultra Preset AA:T AF:16x | |
| NVIDIA GeForce GTX 1080 (Desktop) | |
| NVIDIA GeForce GTX 1070 (Desktop) | |
| NVIDIA GeForce GTX 1070 (Desktop) | |
| NVIDIA GeForce GTX 980 Ti | |
| AMD Radeon RX 480 (Desktop) | |
| NVIDIA GeForce GTX 970 | |
| AMD Radeon R9 Fury | |
| NVIDIA GeForce GTX 980 | |
| AMD Radeon R9 390X | |
| 3840x2160 High Preset AA:T AF:4x | |
| NVIDIA GeForce GTX 1080 (Desktop) | |
| NVIDIA GeForce GTX 1070 (Desktop) | |
| NVIDIA GeForce GTX 1070 (Desktop) | |
| NVIDIA GeForce GTX 980 Ti | |
| AMD Radeon R9 Fury | |
| AMD Radeon R9 390X | |
| NVIDIA GeForce GTX 980 | |
| AMD Radeon RX 480 (Desktop) | |
| NVIDIA GeForce GTX 970 | |
| Assassin's Creed Syndicate | |
| 1920x1080 Ultra High Preset AA:4x MSAA + FX | |
| NVIDIA GeForce GTX 1080 (Desktop) | |
| NVIDIA GeForce GTX 1070 (Desktop) | |
| NVIDIA GeForce GTX 1070 (Desktop) | |
| NVIDIA GeForce GTX 980 Ti | |
| NVIDIA GeForce GTX 980 | |
| NVIDIA GeForce GTX 980 (Laptop) | |
| NVIDIA GeForce GTX 970 | |
| AMD Radeon RX 480 (Desktop) | |
| AMD Radeon R9 Fury | |
| AMD Radeon R9 390X | |
| AMD Radeon R9 290X | |
| 3840x2160 High Preset AA:FX | |
| NVIDIA GeForce GTX 1080 (Desktop) | |
| NVIDIA GeForce GTX 1070 (Desktop) | |
| NVIDIA GeForce GTX 1070 (Desktop) | |
| NVIDIA GeForce GTX 980 Ti | |
| AMD Radeon R9 Fury | |
| NVIDIA GeForce GTX 980 (Laptop) | |
| NVIDIA GeForce GTX 980 | |
| AMD Radeon R9 390X | |
| AMD Radeon R9 290X | |
| AMD Radeon RX 480 (Desktop) | |
| NVIDIA GeForce GTX 970 | |
| Star Wars Battlefront | |
| 1920x1080 Ultra Preset AA:FX | |
| NVIDIA GeForce GTX 1080 (Desktop) | |
| NVIDIA GeForce GTX 1070 (Desktop) | |
| NVIDIA GeForce GTX 1070 (Desktop) | |
| NVIDIA GeForce GTX 980 Ti | |
| AMD Radeon R9 Fury | |
| NVIDIA GeForce GTX 980 | |
| AMD Radeon R9 290X | |
| AMD Radeon R9 390X | |
| NVIDIA GeForce GTX 980 (Laptop) | |
| AMD Radeon RX 480 (Desktop) | |
| NVIDIA GeForce GTX 970 | |
| 3840x2160 High Preset AA:FX | |
| NVIDIA GeForce GTX 1080 (Desktop) | |
| NVIDIA GeForce GTX 1070 (Desktop) | |
| NVIDIA GeForce GTX 980 Ti | |
| NVIDIA GeForce GTX 1070 (Desktop) | |
| AMD Radeon R9 Fury | |
| AMD Radeon R9 290X | |
| AMD Radeon R9 390X | |
| NVIDIA GeForce GTX 980 | |
| NVIDIA GeForce GTX 980 (Laptop) | |
| AMD Radeon RX 480 (Desktop) | |
| NVIDIA GeForce GTX 970 | |
| Fallout 4 | |
| 1920x1080 Ultra Preset AA:T AF:16x | |
| NVIDIA GeForce GTX 1080 (Desktop) | |
| NVIDIA GeForce GTX 1070 (Desktop) | |
| NVIDIA GeForce GTX 1070 (Desktop) | |
| NVIDIA GeForce GTX 980 Ti | |
| AMD Radeon R9 Fury | |
| NVIDIA GeForce GTX 980 (Laptop) | |
| NVIDIA GeForce GTX 970 | |
| AMD Radeon R9 390X | |
| AMD Radeon RX 480 (Desktop) | |
| AMD Radeon R9 290X | |
| 3840x2160 High Preset AA:T AF:16x | |
| NVIDIA GeForce GTX 1080 (Desktop) | |
| NVIDIA GeForce GTX 1070 (Desktop) | |
| NVIDIA GeForce GTX 980 Ti | |
| NVIDIA GeForce GTX 1070 (Desktop) | |
| AMD Radeon R9 Fury | |
| NVIDIA GeForce GTX 980 (Laptop) | |
| AMD Radeon R9 390X | |
| AMD Radeon R9 290X | |
| NVIDIA GeForce GTX 970 | |
| AMD Radeon RX 480 (Desktop) | |
| Call of Duty: Black Ops 3 | |
| 1920x1080 Extra / On AA:T2x SM | |
| NVIDIA GeForce GTX 1080 (Desktop) | |
| NVIDIA GeForce GTX 1070 (Desktop) | |
| NVIDIA GeForce GTX 1070 (Desktop) | |
| NVIDIA GeForce GTX 980 Ti | |
| AMD Radeon RX 480 (Desktop) | |
| NVIDIA GeForce GTX 980 (Laptop) | |
| AMD Radeon R9 390X | |
| AMD Radeon R9 Fury | |
| AMD Radeon R9 290X | |
| 3840x2160 High / On AA:FX | |
| NVIDIA GeForce GTX 1080 (Desktop) | |
| NVIDIA GeForce GTX 1070 (Desktop) | |
| NVIDIA GeForce GTX 980 Ti | |
| NVIDIA GeForce GTX 1070 (Desktop) | |
| AMD Radeon R9 390X | |
| AMD Radeon R9 Fury | |
| AMD Radeon RX 480 (Desktop) | |
| NVIDIA GeForce GTX 980 (Laptop) | |
| AMD Radeon R9 290X | |
| NVIDIA GeForce GTX 970 | |
| Anno 2205 | |
| 1920x1080 Ultra High Preset AA:8x | |
| NVIDIA GeForce GTX 1080 (Desktop) | |
| NVIDIA GeForce GTX 1070 (Desktop) | |
| NVIDIA GeForce GTX 1070 (Desktop) | |
| NVIDIA GeForce GTX 980 Ti | |
| AMD Radeon R9 Fury | |
| NVIDIA GeForce GTX 980 (Laptop) | |
| AMD Radeon RX 480 (Desktop) | |
| AMD Radeon R9 390X | |
| NVIDIA GeForce GTX 970 | |
| AMD Radeon R9 290X | |
| 3840x2160 High Preset AA:4x | |
| NVIDIA GeForce GTX 1080 (Desktop) | |
| NVIDIA GeForce GTX 1070 (Desktop) | |
| NVIDIA GeForce GTX 1070 (Desktop) | |
| NVIDIA GeForce GTX 980 Ti | |
| AMD Radeon R9 Fury | |
| NVIDIA GeForce GTX 980 (Laptop) | |
| NVIDIA GeForce GTX 970 | |
| AMD Radeon R9 390X | |
| AMD Radeon R9 290X | |
| AMD Radeon RX 480 (Desktop) | |
| World of Warships | |
| 1920x1080 Very High Preset AA:High FX AF:16x | |
| NVIDIA GeForce GTX 1070 (Desktop) | |
| NVIDIA GeForce GTX 1080 (Desktop) | |
| NVIDIA GeForce GTX 980 Ti | |
| NVIDIA GeForce GTX 1070 (Desktop) | |
| NVIDIA GeForce GTX 970 | |
| AMD Radeon R9 290X | |
| AMD Radeon R9 Fury | |
| AMD Radeon R9 390X | |
| 3840 x 2160 Very High Preset AA:High FX AF:16x | |
| NVIDIA GeForce GTX 1080 (Desktop) | |
| NVIDIA GeForce GTX 1070 (Desktop) | |
| NVIDIA GeForce GTX 1070 (Desktop) | |
| NVIDIA GeForce GTX 980 Ti | |
| AMD Radeon R9 Fury | |
| NVIDIA GeForce GTX 970 | |
| AMD Radeon R9 290X | |
| AMD Radeon R9 390X | |
| AMD Radeon RX 480 (Desktop) | |
| Mad Max | |
| 1920x1080 Very High Preset AF:12x | |
| NVIDIA GeForce GTX 1080 (Desktop) | |
| NVIDIA GeForce GTX 1070 (Desktop) | |
| NVIDIA GeForce GTX 1070 (Desktop) | |
| NVIDIA GeForce GTX 980 Ti | |
| AMD Radeon R9 Fury | |
| NVIDIA GeForce GTX 980 (Laptop) | |
| NVIDIA GeForce GTX 970 | |
| AMD Radeon R9 290X | |
| AMD Radeon RX 480 (Desktop) | |
| AMD Radeon R9 390X | |
| 3840x2160 High Preset AF:6x | |
| NVIDIA GeForce GTX 1080 (Desktop) | |
| NVIDIA GeForce GTX 1070 (Desktop) | |
| NVIDIA GeForce GTX 980 Ti | |
| NVIDIA GeForce GTX 1070 (Desktop) | |
| AMD Radeon R9 Fury | |
| NVIDIA GeForce GTX 980 (Laptop) | |
| AMD Radeon R9 290X | |
| AMD Radeon R9 390X | |
| NVIDIA GeForce GTX 970 | |
| AMD Radeon RX 480 (Desktop) | |
| Metal Gear Solid V - 3840x2160 High / On | |
| NVIDIA GeForce GTX 1080 (Desktop) | |
| NVIDIA GeForce GTX 1070 (Desktop) | |
| NVIDIA GeForce GTX 1070 (Desktop) | |
| AMD Radeon R9 Fury | |
| NVIDIA GeForce GTX 980 (Laptop) | |
| AMD Radeon R9 390X | |
| AMD Radeon R9 290X | |
| NVIDIA GeForce GTX 970 | |
| AMD Radeon RX 480 (Desktop) | |
| Dirt Rally | |
| 1920x1080 Ultra Preset AA:4x MS | |
| NVIDIA GeForce GTX 980 Ti | |
| NVIDIA GeForce GTX 1070 (Desktop) | |
| NVIDIA GeForce GTX 1080 (Desktop) | |
| NVIDIA GeForce GTX 1070 (Desktop) | |
| AMD Radeon R9 290X | |
| NVIDIA GeForce GTX 980 (Laptop) | |
| NVIDIA GeForce GTX 970 | |
| AMD Radeon R9 Fury | |
| AMD Radeon R9 390X | |
| AMD Radeon RX 480 (Desktop) | |
| 3840x2160 High Preset | |
| NVIDIA GeForce GTX 1070 (Desktop) | |
| NVIDIA GeForce GTX 970 | |
| NVIDIA GeForce GTX 1070 (Desktop) | |
| NVIDIA GeForce GTX 1080 (Desktop) | |
| NVIDIA GeForce GTX 980 Ti | |
| NVIDIA GeForce GTX 980 (Laptop) | |
| AMD Radeon R9 Fury | |
| AMD Radeon R9 290X | |
| AMD Radeon R9 390X | |
| AMD Radeon RX 480 (Desktop) | |
| The Witcher 3 | |
| 1920x1080 Ultra Graphics & Postprocessing (HBAO+) | |
| NVIDIA GeForce GTX 1080 (Desktop) | |
| NVIDIA GeForce GTX 1070 (Desktop) | |
| NVIDIA GeForce GTX 980 Ti | |
| AMD Radeon R9 Fury | |
| NVIDIA GeForce GTX 980 (Laptop) | |
| AMD Radeon RX 480 (Desktop) | |
| NVIDIA GeForce GTX 970 | |
| AMD Radeon R9 390X | |
| AMD Radeon R9 290X | |
| 3840x2160 High Graphics & Postprocessing (Nvidia HairWorks Off) | |
| NVIDIA GeForce GTX 1080 (Desktop) | |
| NVIDIA GeForce GTX 1070 (Desktop) | |
| NVIDIA GeForce GTX 980 Ti | |
| NVIDIA GeForce GTX 1070 (Desktop) | |
| AMD Radeon R9 Fury | |
| NVIDIA GeForce GTX 980 (Laptop) | |
| AMD Radeon R9 390X | |
| NVIDIA GeForce GTX 970 | |
| AMD Radeon R9 290X | |
| AMD Radeon RX 480 (Desktop) | |
| GTA V | |
| 1920x1080 Highest AA:4xMSAA + FX AF:16x | |
| NVIDIA GeForce GTX 1080 (Desktop) | |
| NVIDIA GeForce GTX 1070 (Desktop) | |
| NVIDIA GeForce GTX 1070 (Desktop) | |
| NVIDIA GeForce GTX 980 Ti | |
| NVIDIA GeForce GTX 980 (Laptop) | |
| NVIDIA GeForce GTX 970 | |
| AMD Radeon RX 480 (Desktop) | |
| AMD Radeon R9 290X | |
| NVIDIA GeForce GTX 970 | |
| 3840x2160 High/On (Advanced Graphics Off) AA:FX AF:8x | |
| NVIDIA GeForce GTX 980 Ti | |
| NVIDIA GeForce GTX 1080 (Desktop) | |
| NVIDIA GeForce GTX 1070 (Desktop) | |
| NVIDIA GeForce GTX 980 (Laptop) | |
| NVIDIA GeForce GTX 1070 (Desktop) | |
| AMD Radeon R9 290X | |
| NVIDIA GeForce GTX 970 | |
| AMD Radeon R9 Fury | |
| NVIDIA GeForce GTX 970 | |
| AMD Radeon RX 480 (Desktop) | |
| Dragon Age: Inquisition - 1920x1080 Ultra Graphics Quality AA:2x MS | |
| NVIDIA GeForce GTX 1080 (Desktop) | |
| NVIDIA GeForce GTX 1070 (Desktop) | |
| NVIDIA GeForce GTX 1070 (Desktop) | |
| NVIDIA GeForce GTX 980 Ti | |
| AMD Radeon R9 390X | |
| NVIDIA GeForce GTX 970 | |
| NVIDIA GeForce GTX 980 (Laptop) | |
| AMD Radeon RX 480 (Desktop) | |
| AMD Radeon RX 480 (Desktop) | |
| AMD Radeon R9 Fury | |
| NVIDIA GeForce GTX 970 | |
| Alien: Isolation - 1920x1080 Ultra, On, Shadow Map 2048, HDAO AA:2x SM AF:16x | |
| NVIDIA GeForce GTX 1080 (Desktop) | |
| NVIDIA GeForce GTX 1070 (Desktop) | |
| NVIDIA GeForce GTX 1070 (Desktop) | |
| AMD Radeon R9 Fury | |
| NVIDIA GeForce GTX 980 (Laptop) | |
| AMD Radeon RX 480 (Desktop) | |
| NVIDIA GeForce GTX 970 | |
| Middle-earth: Shadow of Mordor - 1920x1080 Ultra Preset (HD Package) | |
| NVIDIA GeForce GTX 1070 (Desktop) | |
| NVIDIA GeForce GTX 1070 (Desktop) | |
| AMD Radeon R9 Fury | |
| AMD Radeon R9 390X | |
| NVIDIA GeForce GTX 980 (Laptop) | |
| AMD Radeon RX 480 (Desktop) | |
| NVIDIA GeForce GTX 970 | |
| NVIDIA GeForce GTX 970 | |
| Battlefield 4 | |
| 3840x2160 High Preset | |
| NVIDIA GeForce GTX 1080 (Desktop) | |
| NVIDIA GeForce GTX 1070 (Desktop) | |
| NVIDIA GeForce GTX 980 Ti | |
| NVIDIA GeForce GTX 1070 (Desktop) | |
| AMD Radeon R9 Fury | |
| NVIDIA GeForce GTX 980 (Laptop) | |
| AMD Radeon R9 390X | |
| NVIDIA GeForce GTX 970 | |
| AMD Radeon R9 290X | |
| NVIDIA GeForce GTX 970 | |
| AMD Radeon RX 480 (Desktop) | |
| 1920x1080 Ultra Preset AA:4x MS | |
| NVIDIA GeForce GTX 1080 (Desktop) | |
| NVIDIA GeForce GTX 1070 (Desktop) | |
| NVIDIA GeForce GTX 1070 (Desktop) | |
| NVIDIA GeForce GTX 980 Ti | |
| AMD Radeon R9 Fury | |
| NVIDIA GeForce GTX 980 (Laptop) | |
| NVIDIA GeForce GTX 970 | |
| AMD Radeon R9 390X | |
| NVIDIA GeForce GTX 970 | |
| AMD Radeon RX 480 (Desktop) | |
| Metro: Last Light - 1920x1080 Very High (DX11) AF:16x | |
| NVIDIA GeForce GTX 1080 (Desktop) | |
| NVIDIA GeForce GTX 1070 (Desktop) | |
| NVIDIA GeForce GTX 1070 (Desktop) | |
| NVIDIA GeForce GTX 980 Ti | |
| NVIDIA GeForce GTX 980 (Laptop) | |
| NVIDIA GeForce GTX 970 | |
| AMD Radeon R9 Fury | |
| AMD Radeon R9 390X | |
| AMD Radeon RX 480 (Desktop) | |
| NVIDIA GeForce GTX 970 | |
| BioShock Infinite - 1920x1080 Ultra Preset, DX11 (DDOF) | |
| NVIDIA GeForce GTX 1080 (Desktop) | |
| NVIDIA GeForce GTX 980 Ti | |
| NVIDIA GeForce GTX 1070 (Desktop) | |
| NVIDIA GeForce GTX 1070 (Desktop) | |
| NVIDIA GeForce GTX 980 (Laptop) | |
| NVIDIA GeForce GTX 970 | |
| AMD Radeon R9 390X | |
| AMD Radeon RX 480 (Desktop) | |
| NVIDIA GeForce GTX 970 | |
| Crysis 3 - 1920x1080 Very High Preset AA:2xSM AF:16x | |
| NVIDIA GeForce GTX 1080 (Desktop) | |
| NVIDIA GeForce GTX 1070 (Desktop) | |
| NVIDIA GeForce GTX 980 Ti | |
| NVIDIA GeForce GTX 1070 (Desktop) | |
| AMD Radeon R9 Fury | |
| NVIDIA GeForce GTX 980 (Laptop) | |
| AMD Radeon R9 390X | |
| NVIDIA GeForce GTX 970 | |
| AMD Radeon RX 480 (Desktop) | |
| NVIDIA GeForce GTX 970 | |
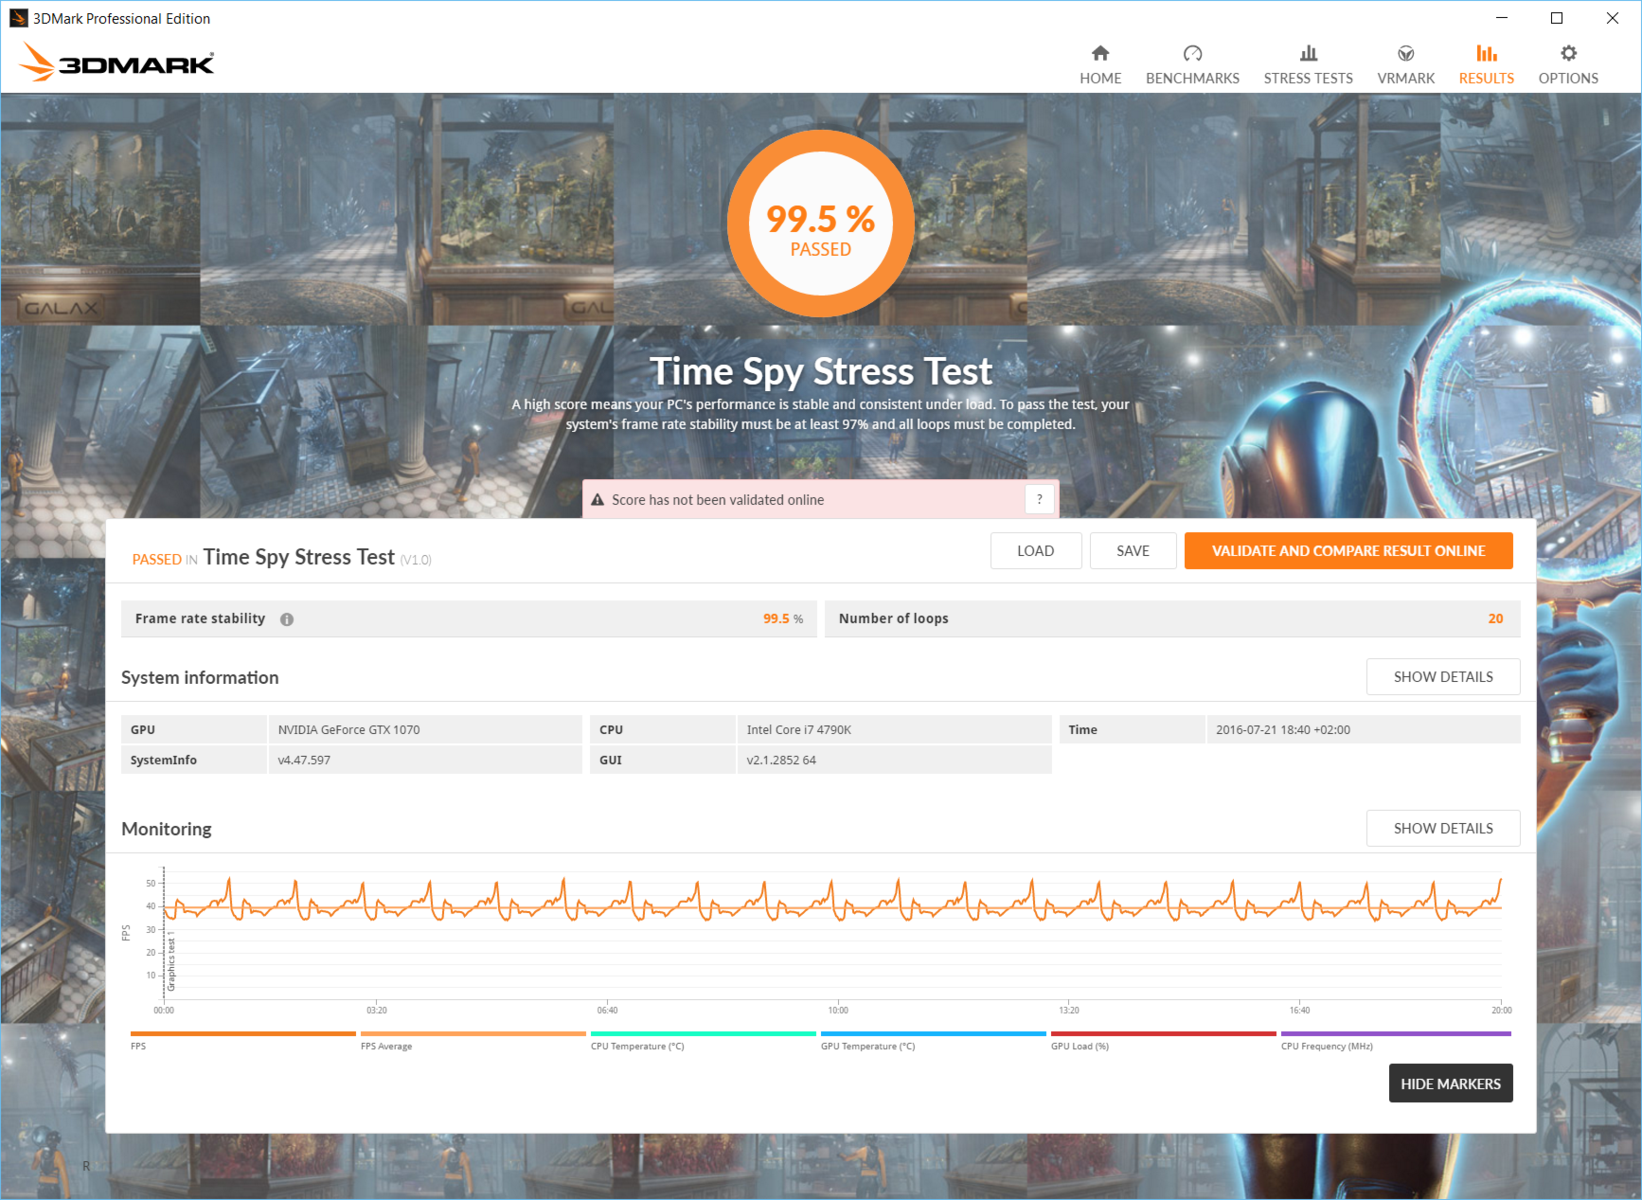
Stress Test
The performance of the GeForce GTX 1070 Founders' Edition remains stable when permanent load is applied. In the stress test which includes Futuremark in 3DMark (Time Spy DX12 test) our test card achieves a stability of very good 99.5% after 20 runs and still good 97.7% stability after another try. In view of the stress test results, a performance loss is unlikely during prolonged gaming sessions.

Compute Performance
The Nvidia GeForce GTX 1070 Founder's Edition features 8 Compute Units for general calculations, which can be addressed via OpenCL, DirectCompute, and CUDA. In terms of performance, the GTX 1070 Founders Edition ranks in behind its larger sibling. However, the GTX 980 Ti from Asus is leading in the LuxMark v2.0 Room Test. The ComputeMark v2.1 benchmark comes up with the familiar ranking again: GTX 1080 ahead of GTX 1070 and GTX 980Ti.
| LuxMark v2.0 64Bit | |
| Room GPUs-only | |
| NVIDIA GeForce GTX 980 Ti | |
| NVIDIA GeForce GTX 1070 (Desktop) | |
| NVIDIA GeForce GTX 1070 (Desktop) | |
| NVIDIA GeForce GTX 1080 (Desktop) | |
| NVIDIA GeForce GTX 970 | |
| AMD Radeon RX 480 (Desktop) | |
| AMD Radeon R9 Fury | |
| Sala GPUs-only | |
| NVIDIA GeForce GTX 1070 (Desktop) | |
| NVIDIA GeForce GTX 1080 (Desktop) | |
| NVIDIA GeForce GTX 980 Ti | |
| NVIDIA GeForce GTX 1070 (Desktop) | |
| AMD Radeon RX 480 (Desktop) | |
| AMD Radeon R9 Fury | |
| NVIDIA GeForce GTX 970 | |
| ComputeMark v2.1 | |
| 1024x600 Normal, QJuliaRayTrace | |
| NVIDIA GeForce GTX 1080 (Desktop) | |
| NVIDIA GeForce GTX 1070 (Desktop) | |
| NVIDIA GeForce GTX 1070 (Desktop) | |
| NVIDIA GeForce GTX 980 Ti | |
| AMD Radeon R9 Fury | |
| NVIDIA GeForce GTX 970 | |
| AMD Radeon RX 480 (Desktop) | |
| 1024x600 Normal, Mandel Scalar | |
| NVIDIA GeForce GTX 1080 (Desktop) | |
| AMD Radeon R9 Fury | |
| NVIDIA GeForce GTX 1070 (Desktop) | |
| NVIDIA GeForce GTX 1070 (Desktop) | |
| NVIDIA GeForce GTX 980 Ti | |
| AMD Radeon RX 480 (Desktop) | |
| NVIDIA GeForce GTX 970 | |
| 1024x600 Normal, Mandel Vector | |
| NVIDIA GeForce GTX 1080 (Desktop) | |
| NVIDIA GeForce GTX 1070 (Desktop) | |
| NVIDIA GeForce GTX 1070 (Desktop) | |
| AMD Radeon R9 Fury | |
| NVIDIA GeForce GTX 980 Ti | |
| AMD Radeon RX 480 (Desktop) | |
| NVIDIA GeForce GTX 970 | |
| 1024x600 Normal, Fluid 2DTexArr | |
| NVIDIA GeForce GTX 1080 (Desktop) | |
| NVIDIA GeForce GTX 1070 (Desktop) | |
| NVIDIA GeForce GTX 980 Ti | |
| NVIDIA GeForce GTX 1070 (Desktop) | |
| AMD Radeon R9 Fury | |
| AMD Radeon RX 480 (Desktop) | |
| NVIDIA GeForce GTX 970 | |
| 1024x600 Normal, Fluid 3DTex | |
| AMD Radeon R9 Fury | |
| NVIDIA GeForce GTX 1080 (Desktop) | |
| NVIDIA GeForce GTX 980 Ti | |
| NVIDIA GeForce GTX 1070 (Desktop) | |
| NVIDIA GeForce GTX 1070 (Desktop) | |
| AMD Radeon RX 480 (Desktop) | |
| NVIDIA GeForce GTX 970 | |
| 1024x600 Normal, Score | |
| NVIDIA GeForce GTX 1080 (Desktop) | |
| NVIDIA GeForce GTX 1070 (Desktop) | |
| NVIDIA GeForce GTX 1070 (Desktop) | |
| NVIDIA GeForce GTX 980 Ti | |
| AMD Radeon R9 Fury | |
| AMD Radeon RX 480 (Desktop) | |
| NVIDIA GeForce GTX 970 | |
Emissions
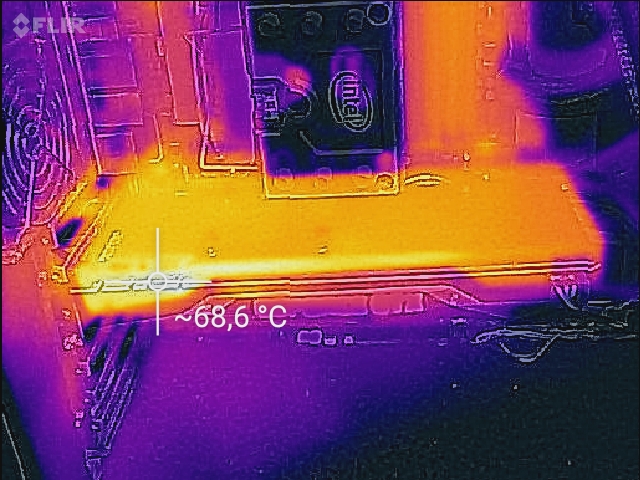
The emissions of the Founder's Edition of the Nvidia GeForce GTX 1070 are almost identical to its larger sibling's. This is due to the identical cooling system, which blows warm air directly out of the case with a radial fan. Because of the GTX 1070's slightly lower performance, the fan does not need to run as fast as the GTX 1080's. This positively affects system noise. When idling, we could not record a noise. It takes a few minutes under permanent load before the fan control increases the rotation speed of the radial fan in order to cool the GPU. However, the load system noise is not annoying and remains well below 50 dB(A).
The Nvidia GeForce GTX also suffers from coil whining, when the frame rate exceeds 200 fps. However, there are no such problems when G-Sync is active.
The power consumption of our test system is 66 watts (Desktop Windows 10, one 4K display connected via DisplayPort) without dedicated GPU. When idling, we measure 68 watts with GeForce GTX 1070. During the game “The Witcher 3” with Ultra preset we measured a power consumption of 243 watts. With the tool FurMark, we reach a maximum of 253 watts. Thus, the GeForce GTX 1070 needs about 40 watts less energy than the GeForce GTX 1080. Overall, Nvidia has significantly improved efficiency compared to the older Maxwell architecture.
Verdict
The GeForce GTX 1070 reference card from Nvidia carries the suffix Founder's Edition. It will also be available from popular graphics card manufacturers. However, this will not change the look or technology. The Pascal architecture could already convince us in the review of the Nvidia GeForce GTX 1080 Founder's Edition. With the smaller variant, Nvidia has a powerful graphics card, which indeed brings sufficient performance for running 4K games smoothly. Its price is upper mid-range. The performance of the graphics cards is similar to the GeForce GTX 980 Ti's.
The Nvidia GeForce GTX 1070 Founder's Edition convinced us with decent performance and moderate power consumption (power consumption of the GPU: max. 150 watts).
Those who want to buy a GeForce GTX 1070 with a custom design can expect even higher performance. Several renowned manufacturers equip their variants with two power ports. Thus, there are graphics cards, which are already overclocked ex-factory, which can be overclocked even higher, thanks to better power supply. The MSI GTX 1070 Gaming Z convinced e.g. with efficient and quiet cooling in our review, but falls slightly behind in efficiency.
Price comparison
