AMD Radeon R5 (Beema/Carrizo-L)
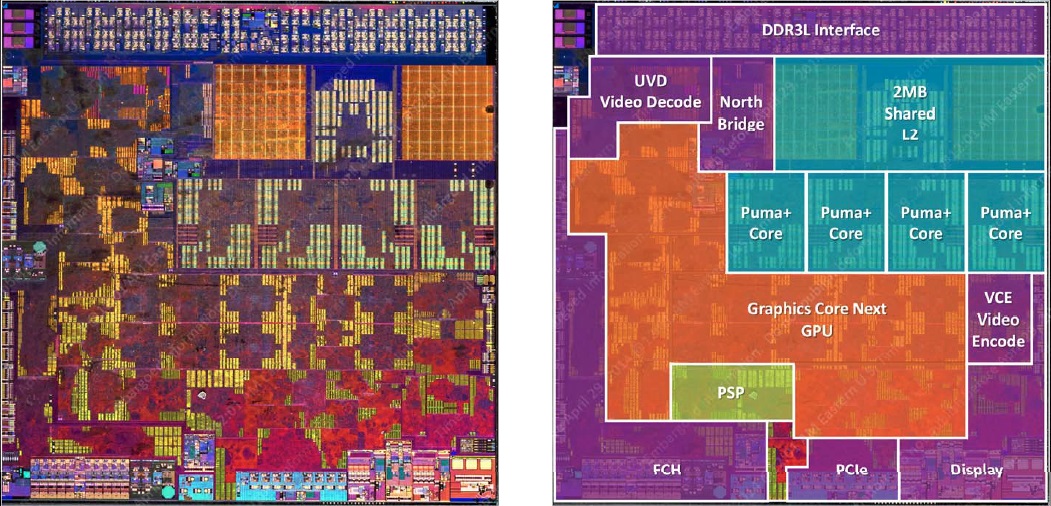
The AMD Radeon R5 is an integrated DirectX 12 graphics card found in some AMD Beema and Carrizo-L APUs (for example, the A8-6410 or A8-7410 ). It offers 128 shader cores across two Compute Units and based on the GCN architecture. Clock speeds can be up to 850 MHz. The graphics card does not have dedicated VRAM and will access main system memory (single-channel DDR3L-1866).
Using its UVD (Unified Video Decoder), the GPU can support the CPU when decoding videos up to 4K. In addition, the chip integrates a specialized video encoder called VCE. Video streams can output via VGA, DVI, HDMI 1.4a and DisplayPort 1.2 to up to two external monitors.
The performance of the Radeon R5 is slightly above a Radeon HD 7470M or the Intel HD Graphics 4200 . Typically, only older or less demanding games like FIFA
Radeon R Series Codename Beema Architecture GCN 1.1 Pipelines 128 - unified Core Speed 850 (Boost) MHz Memory Bus Width 64 Bit Shared Memory yes API DirectX 12 (FL 12_0), Shader 5.0 technology 28 nm Date of Announcement 29.04.2014
CPU in Radeon R5 (Beema/Carrizo-L) GPU Base Speed GPU Boost / Turbo AMD A8-7410 4 x 2200 MHz, 12 - 25 W 300 MHz 850 MHz AMD A8-6410 4 x 2000 MHz, 15 W ? MHz 800 MHz min. - max. 300 - ? MHz 800 - 850 MHz
Benchmarks Performance Rating - 3DMark 11 + Fire Strike + Time Spy
0.2 pt (1%)
...
AMD Radeon R5 (Beema/Carrizo-L)
...
max:
3DMark - 3DMark Ice Storm Unlimited Graphics
36807 Points (4%)
...
AMD Radeon R5 (Beema/Carrizo-L)
...
max:
3DMark - 3DMark Cloud Gate Score
min: 2071 avg: 2757 median: 2882 (3%) max: 3024 Points
...
AMD Radeon R5 (Beema/Carrizo-L)
...
max:
3DMark - 3DMark Cloud Gate Graphics
min: 3225 avg: 3352 median: 3317 (1%) max: 3479 Points
...
AMD Radeon R5 (Beema/Carrizo-L)
...
max:
3DMark - 3DMark Fire Strike Standard Score
min: 480 avg: 503 median: 510 (1%) max: 522 Points
...
AMD Radeon R5 (Beema/Carrizo-L)
...
max:
3DMark - 3DMark Fire Strike Standard Graphics
min: 515 avg: 538 median: 539 (1%) max: 560 Points
...
AMD Radeon R5 (Beema/Carrizo-L)
...
max:
3DMark - 3DMark Ice Storm Graphics
min: 35815 avg: 36863 median: 36890 (4%) max: 38840 Points
...
AMD Radeon R5 (Beema/Carrizo-L)
...
max:
3DMark 11 - 3DM11 Performance Score
min: 815 avg: 849 median: 831 (1%) max: 970 Points
...
AMD Radeon R5 (Beema/Carrizo-L)
...
max:
3DMark 11 - 3DM11 Performance GPU
min: 744 avg: 777 median: 764 (1%) max: 899 Points
...
AMD Radeon R5 (Beema/Carrizo-L)
...
max:
3DMark Vantage + 3DMark Vantage - 3DM Vant. Perf. total
2698 Points (1%)
...
AMD Radeon R5 (Beema/Carrizo-L)
...
max:
3DM Vant. Perf. GPU no PhysX + 3DMark Vantage - 3DM Vant. Perf. GPU no PhysX
2259 Points (1%)
...
AMD Radeon R5 (Beema/Carrizo-L)
...
max:
3DMark 06 3DMark 06 - Standard 1280x1024 +
min: 4731 avg: 4956 median: 4956 (7%) max: 5181 Points
...
AMD Radeon R5 (Beema/Carrizo-L)
...
max:
3DMark 06 - Standard 1024x768 +
5181 Points (7%)
...
AMD Radeon R5 (Beema/Carrizo-L)
...
Unigine Heaven 2.1 - Heaven 2.1 high
9.7 fps (2%)
...
AMD Radeon R5 (Beema/Carrizo-L)
...
Cinebench R10 Cinebench R10 Shading (32bit) + Cinebench R10 - Cinebench R10 Shading (32bit)
min: 1746 avg: 2576 median: 2779 (2%) max: 2860 points
...
AMD Radeon R5 (Beema/Carrizo-L)
...
Cinebench R11.5 Cinebench R11.5 OpenGL 64 Bit + Cinebench R11.5 - Cinebench R11.5 OpenGL 64 Bit
min: 14.51 avg: 15.5 median: 15.4 (5%) max: 16.29 fps
...
AMD Radeon R5 (Beema/Carrizo-L)
...
max:
Cinebench R15 + Cinebench R15 - Cinebench R15 OpenGL 64 Bit
min: 15.92 avg: 17 median: 17 (1%) max: 17.77 fps
...
AMD Radeon R5 (Beema/Carrizo-L)
...
Cinebench R15 OpenGL Ref. Match 64 Bit + Cinebench R15 - Cinebench R15 OpenGL Ref. Match 64 Bit
98 % (98%)
...
AMD Radeon R5 (Beema/Carrizo-L)
...
GFXBench (DX / GLBenchmark) 2.7 + GFXBench (DX / GLBenchmark) 2.7 - GFXBench T-Rex HD Offscreen C24Z16
51 fps (0%)
...
AMD Radeon R5 (Beema/Carrizo-L)
...
LuxMark v2.0 64Bit - LuxMark v2.0 Room GPU
88 Samples/s (0%)
...
AMD Radeon R5 (Beema/Carrizo-L)
...
max:
LuxMark v2.0 64Bit - LuxMark v2.0 Sala GPU
149 Samples/s (0%)
...
AMD Radeon R5 (Beema/Carrizo-L)
...
max:
ComputeMark v2.1 - ComputeMark v2.1 Result
min: 445 avg: 494.5 median: 494.5 (1%) max: 544 points
...
AMD Radeon R5 (Beema/Carrizo-L)
...
max:
- Range of benchmark values for this graphics card
- Average benchmark values for this graphics card
* Smaller numbers mean a higher performance
Game Benchmarks The following benchmarks stem from our benchmarks of review laptops. The performance depends on the used graphics memory, clock rate, processor, system settings, drivers, and operating systems. So the results don't have to be representative for all laptops with this GPU. For detailed information on the benchmark results, click on the fps number.
AMD Radeon R5 (Beema/Carrizo-L)
...
» The benchmarks indicate that the game is not playable in the tested settings.
AMD Radeon R5 (Beema/Carrizo-L)
...
max:
» The benchmarks indicate that the game is not playable in the tested settings.
AMD Radeon R5 (Beema/Carrizo-L)
...
max:
» The benchmarks indicate that the game is not playable in the tested settings.
...
AMD Radeon R5 (Beema/Carrizo-L)
...
max:
» The benchmarks indicate that the game is not playable in the tested settings.
AMD Radeon R5 (Beema/Carrizo-L)
...
max:
» The benchmarks indicate that the game is not playable in the tested settings.
AMD Radeon R5 (Beema/Carrizo-L)
...
max:
Intel Arc A580
» The benchmarks indicate that the game is not playable in the tested settings.
AMD Radeon R5 (Beema/Carrizo-L)
...
max:
» The benchmarks indicate that the game is not playable in the tested settings.
AMD Radeon R5 (Beema/Carrizo-L)
...
max:
» The benchmarks indicate that the game is not playable in the tested settings.
AMD Radeon R5 (Beema/Carrizo-L)
...
max:
» The benchmarks indicate that the game is not playable in the tested settings.
...
AMD Radeon R5 (Beema/Carrizo-L)
...
max:
» The benchmarks indicate that the game is not playable in the tested settings.
...
AMD Radeon R5 (Beema/Carrizo-L)
...
max:
» The benchmarks indicate that the game is not playable in the tested settings.
AMD Radeon R5 (Beema/Carrizo-L)
...
» The benchmarks indicate that the game is not playable in the tested settings.
AMD Radeon R5 (Beema/Carrizo-L)
...
max:
» The benchmarks indicate that the game is not playable in the tested settings.
AMD Radeon R5 (Beema/Carrizo-L)
...
max:
» The benchmarks indicate that the game is not playable in the tested settings.
AMD Radeon R5 (Beema/Carrizo-L)
...
max:
» The benchmarks indicate that the game is not playable in the tested settings.
AMD Radeon R5 (Beema/Carrizo-L)
...
max:
» The benchmarks indicate that the game is not playable in the tested settings.
AMD Radeon R5 (Beema/Carrizo-L)
...
max:
» The benchmarks indicate that the game is not playable in the tested settings.
AMD Radeon R5 (Beema/Carrizo-L)
...
» The benchmarks indicate that the game is not playable in the tested settings.
AMD Radeon R5 (Beema/Carrizo-L)
...
max:
» The benchmarks indicate that the game is not playable in the tested settings.
AMD Radeon R5 (Beema/Carrizo-L)
...
max:
» The benchmarks indicate that the game is not playable in the tested settings.
AMD Radeon R5 (Beema/Carrizo-L)
...
max:
» The benchmarks indicate that the game is not playable in the tested settings.
AMD Radeon R5 (Beema/Carrizo-L)
...
max:
» The benchmarks indicate that the game is not playable in the tested settings.
AMD Radeon R5 (Beema/Carrizo-L)
...
max:
» The benchmarks indicate that the game is not playable in the tested settings.
...
AMD Radeon R5 (Beema/Carrizo-L)
...
max:
» The benchmarks indicate that the game is not playable in the tested settings.
AMD Radeon R5 (Beema/Carrizo-L)
...
max:
» The benchmarks indicate that the game is not playable in the tested settings.
AMD Radeon R5 (Beema/Carrizo-L)
...
» The benchmarks indicate that the game is not playable in the tested settings.
...
AMD Radeon R5 (Beema/Carrizo-L)
...
max:
» The benchmarks indicate that the game is not playable in the tested settings.
AMD Radeon R5 (Beema/Carrizo-L)
...
» With all tested laptops playable in detail settings low.
AMD Radeon R5 (Beema/Carrizo-L)
...
max:
» The benchmarks indicate that the game is not playable in the tested settings.
AMD Radeon R5 (Beema/Carrizo-L)
...
max:
» The benchmarks indicate that the game is not playable in the tested settings.
AMD Radeon R5 (Beema/Carrizo-L)
...
max:
» The benchmarks indicate that the game is not playable in the tested settings.
AMD Radeon R5 (Beema/Carrizo-L)
...
max:
» The benchmarks indicate that the game is not playable in the tested settings.
AMD Radeon R5 (Beema/Carrizo-L)
...
max:
» The benchmarks indicate that the game is not playable in the tested settings.
AMD Radeon R5 (Beema/Carrizo-L)
...
max:
» The benchmarks indicate that the game is not playable in the tested settings.
AMD Radeon R5 (Beema/Carrizo-L)
...
max:
» The benchmarks indicate that the game is not playable in the tested settings.
AMD Radeon R5 (Beema/Carrizo-L)
...
» The benchmarks indicate that the game is not playable in the tested settings.
AMD Radeon R5 (Beema/Carrizo-L)
...
» The benchmarks indicate that the game is not playable in the tested settings.
AMD Radeon R5 (Beema/Carrizo-L)
...
max:
» The benchmarks indicate that the game is not playable in the tested settings.
AMD Radeon R5 (Beema/Carrizo-L)
...
AMD Radeon R5 (Beema/Carrizo-L)
...
» The benchmarks indicate that the game is not playable in the tested settings.
AMD Radeon R5 (Beema/Carrizo-L)
...
AMD Radeon R5 (Beema/Carrizo-L)
...
max:
» The benchmarks indicate that the game is not playable in the tested settings.
...
AMD Radeon R5 (Beema/Carrizo-L)
...
» The benchmarks indicate that the game is not playable in the tested settings.
AMD Radeon R5 (Beema/Carrizo-L)
...
» The benchmarks indicate that the game is not playable in the tested settings.
AMD Radeon R5 (Beema/Carrizo-L)
...
max:
» The benchmarks indicate that the game is not playable in the tested settings.
AMD Radeon R5 (Beema/Carrizo-L)
...
max:
...
AMD Radeon R5 (Beema/Carrizo-L)
...
max:
» The benchmarks indicate that the game is not playable in the tested settings.
AMD Radeon R5 (Beema/Carrizo-L)
...
max:
AMD Radeon R5 (Beema/Carrizo-L)
...
max:
» The benchmarks indicate that the game is not playable in the tested settings.
AMD Radeon R5 (Beema/Carrizo-L)
...
max:
AMD Radeon R5 (Beema/Carrizo-L)
...
max:
» The benchmarks indicate that the game is not playable in the tested settings.
AMD Radeon R5 (Beema/Carrizo-L)
...
max:
AMD Radeon R5 (Beema/Carrizo-L)
...
max:
» The benchmarks indicate that the game is not playable in the tested settings.
AMD Radeon R5 (Beema/Carrizo-L)
...
max:
AMD Radeon R5 (Beema/Carrizo-L)
...
max:
» The benchmarks indicate that the game is not playable in the tested settings.
AMD Radeon R5 (Beema/Carrizo-L)
...
...
AMD Radeon R5 (Beema/Carrizo-L)
...
» With all tested laptops playable in detail settings low.
AMD Radeon R5 (Beema/Carrizo-L)
...
max:
AMD Radeon R5 (Beema/Carrizo-L)
...
max:
» The benchmarks indicate that the game is not playable in the tested settings.
...
AMD Radeon R5 (Beema/Carrizo-L)
...
AMD Radeon R5 (Beema/Carrizo-L)
...
» The benchmarks indicate that the game is not playable in the tested settings.
AMD Radeon R5 (Beema/Carrizo-L)
...
max:
AMD Radeon R5 (Beema/Carrizo-L)
...
max:
» The benchmarks indicate that the game is not playable in the tested settings.
AMD Radeon R5 (Beema/Carrizo-L)
...
max:
» The benchmarks indicate that the game is not playable in the tested settings.
AMD Radeon R5 (Beema/Carrizo-L)
...
AMD Radeon R5 (Beema/Carrizo-L)
...
» The benchmarks indicate that the game is not playable in the tested settings.
AMD Radeon R5 (Beema/Carrizo-L)
...
» The benchmarks indicate that the game is not playable in the tested settings.
AMD Radeon R5 (Beema/Carrizo-L)
...
AMD Radeon R5 (Beema/Carrizo-L)
...
» The benchmarks indicate that the game is not playable in the tested settings.
AMD Radeon R5 (Beema/Carrizo-L)
...
max:
AMD Radeon R5 (Beema/Carrizo-L)
...
max:
» The benchmarks indicate that the game is not playable in the tested settings.
AMD Radeon R5 (Beema/Carrizo-L)
...
AMD Radeon R5 (Beema/Carrizo-L)
...
max:
» The benchmarks indicate that the game is not playable in the tested settings.
AMD Radeon R5 (Beema/Carrizo-L)
...
AMD Radeon R5 (Beema/Carrizo-L)
...
» The benchmarks indicate that the game is not playable in the tested settings.
AMD Radeon R5 (Beema/Carrizo-L)
...
max:
AMD Radeon R5 (Beema/Carrizo-L)
...
max:
» The benchmarks indicate that the game is not playable in the tested settings.
...
AMD Radeon R5 (Beema/Carrizo-L)
...
max:
...
AMD Radeon R5 (Beema/Carrizo-L)
...
max:
» The benchmarks indicate that the game is not playable in the tested settings.
AMD Radeon R5 (Beema/Carrizo-L)
...
max:
AMD Radeon R5 (Beema/Carrizo-L)
...
max:
» The benchmarks indicate that the game is not playable in the tested settings.
AMD Radeon R5 (Beema/Carrizo-L)
...
AMD Radeon R5 (Beema/Carrizo-L)
...
max:
» The benchmarks indicate that the game is not playable in the tested settings.
AMD Radeon R5 (Beema/Carrizo-L)
...
AMD Radeon R5 (Beema/Carrizo-L)
...
» The benchmarks indicate that the game is not playable in the tested settings.
AMD Radeon R5 (Beema/Carrizo-L)
...
max:
AMD Radeon R5 (Beema/Carrizo-L)
...
max:
» The benchmarks indicate that the game is not playable in the tested settings.
AMD Radeon R5 (Beema/Carrizo-L)
...
AMD Radeon R5 (Beema/Carrizo-L)
...
» The benchmarks indicate that the game is not playable in the tested settings.
AMD Radeon R5 (Beema/Carrizo-L)
...
max:
AMD Radeon R5 (Beema/Carrizo-L)
...
max:
» The benchmarks indicate that the game is not playable in the tested settings.
...
AMD Radeon R5 (Beema/Carrizo-L)
...
max:
...
AMD Radeon R5 (Beema/Carrizo-L)
...
max:
» The benchmarks indicate that the game is not playable in the tested settings.
...
AMD Radeon R5 (Beema/Carrizo-L)
...
...
AMD Radeon R5 (Beema/Carrizo-L)
...
» The benchmarks indicate that the game is not playable in the tested settings.
AMD Radeon R5 (Beema/Carrizo-L)
...
max:
...
AMD Radeon R5 (Beema/Carrizo-L)
...
max:
» The benchmarks indicate that the game is not playable in the tested settings.
AMD Radeon R5 (Beema/Carrizo-L)
...
AMD Radeon R5 (Beema/Carrizo-L)
...
» The benchmarks indicate that the game is not playable in the tested settings.
AMD Radeon R5 (Beema/Carrizo-L)
...
max:
AMD Radeon R5 (Beema/Carrizo-L)
...
max:
» The benchmarks indicate that the game is not playable in the tested settings.
AMD Radeon R5 (Beema/Carrizo-L)
...
...
AMD Radeon R5 (Beema/Carrizo-L)
...
max:
» With most tested laptops playable in detail settings low.
...
AMD Radeon R5 (Beema/Carrizo-L)
...
max:
...
AMD Radeon R5 (Beema/Carrizo-L)
...
max:
» The benchmarks indicate that the game is not playable in the tested settings.
...
AMD Radeon R5 (Beema/Carrizo-L)
...
...
AMD Radeon R5 (Beema/Carrizo-L)
...
» The benchmarks indicate that the game is not playable in the tested settings.
AMD Radeon R5 (Beema/Carrizo-L)
...
AMD Radeon R5 (Beema/Carrizo-L)
...
» The benchmarks indicate that the game is not playable in the tested settings.
...
AMD Radeon R5 (Beema/Carrizo-L)
...
max:
...
AMD Radeon R5 (Beema/Carrizo-L)
...
max:
» The benchmarks indicate that the game is not playable in the tested settings.
AMD Radeon R5 (Beema/Carrizo-L)
...
AMD Radeon R5 (Beema/Carrizo-L)
...
» The benchmarks indicate that the game is not playable in the tested settings.
...
AMD Radeon R5 (Beema/Carrizo-L)
...
max:
AMD Radeon R5 (Beema/Carrizo-L)
...
» The benchmarks indicate that the game is not playable in the tested settings.
...
AMD Radeon R5 (Beema/Carrizo-L)
...
max:
...
AMD Radeon R5 (Beema/Carrizo-L)
...
...
AMD Radeon R5 (Beema/Carrizo-L)
...
» The benchmarks indicate that the game is not playable in the tested settings.
AMD Radeon R5 (Beema/Carrizo-L)
...
AMD Radeon R5 (Beema/Carrizo-L)
...
» The benchmarks indicate that the game is not playable in the tested settings.
AMD Radeon R5 (Beema/Carrizo-L)
...
AMD Radeon R5 (Beema/Carrizo-L)
...
» The benchmarks indicate that the game is not playable in the tested settings.
...
AMD Radeon R5 (Beema/Carrizo-L)
...
max:
AMD Radeon R5 (Beema/Carrizo-L)
...
max:
» The benchmarks indicate that the game is not playable in the tested settings.
...
AMD Radeon R5 (Beema/Carrizo-L)
...
AMD Radeon R5 (Beema/Carrizo-L)
...
AMD Radeon R5 (Beema/Carrizo-L)
...
» The benchmarks indicate that the game is not playable in the tested settings.
...
AMD Radeon R5 (Beema/Carrizo-L)
...
...
AMD Radeon R5 (Beema/Carrizo-L)
...
max:
» The benchmarks indicate that the game is not playable in the tested settings.
AMD Radeon R5 (Beema/Carrizo-L)
...
max:
...
AMD Radeon R5 (Beema/Carrizo-L)
...
max:
» With all tested laptops playable in detail settings low.
...
AMD Radeon R5 (Beema/Carrizo-L)
...
...
AMD Radeon R5 (Beema/Carrizo-L)
...
max:
AMD Radeon R5 (Beema/Carrizo-L)
...
max:
AMD Radeon R5 (Beema/Carrizo-L)
...
» The benchmarks indicate that the game is not playable in the tested settings.
...
AMD Radeon R5 (Beema/Carrizo-L)
...
...
AMD Radeon R5 (Beema/Carrizo-L)
...
AMD Radeon R5 (Beema/Carrizo-L)
...
max:
AMD Radeon R5 (Beema/Carrizo-L)
...
max:
» With all tested laptops playable in detail settings low.
AMD Radeon R5 (Beema/Carrizo-L)
...
max:
AMD Radeon R5 (Beema/Carrizo-L)
...
max:
AMD Radeon R5 (Beema/Carrizo-L)
...
max:
AMD Radeon R5 (Beema/Carrizo-L)
...
» The benchmarks indicate that the game is not playable in the tested settings.
AMD Radeon R5 (Beema/Carrizo-L)
...
AMD Radeon R5 (Beema/Carrizo-L)
...
AMD Radeon R5 (Beema/Carrizo-L)
...
AMD Radeon R5 (Beema/Carrizo-L)
...
» The benchmarks indicate that the game is not playable in the tested settings.
AMD Radeon R5 (Beema/Carrizo-L)
...
max:
AMD Radeon R5 (Beema/Carrizo-L)
...
max:
AMD Radeon R5 (Beema/Carrizo-L)
...
max:
AMD Radeon R5 (Beema/Carrizo-L)
...
max:
» The benchmarks indicate that the game is not playable in the tested settings.
AMD Radeon R5 (Beema/Carrizo-L)
...
max:
AMD Radeon R5 (Beema/Carrizo-L)
...
AMD Radeon R5 (Beema/Carrizo-L)
...
AMD Radeon R5 (Beema/Carrizo-L)
...
» The benchmarks indicate that the game is not playable in the tested settings.
AMD Radeon R5 (Beema/Carrizo-L)
...
AMD Radeon R5 (Beema/Carrizo-L)
...
AMD Radeon R5 (Beema/Carrizo-L)
...
AMD Radeon R5 (Beema/Carrizo-L)
...
» The benchmarks indicate that the game is not playable in the tested settings.
AMD Radeon R5 (Beema/Carrizo-L)
...
AMD Radeon R5 (Beema/Carrizo-L)
...
max:
AMD Radeon R5 (Beema/Carrizo-L)
...
max:
AMD Radeon R5 (Beema/Carrizo-L)
...
» The benchmarks indicate that the game is not playable in the tested settings.
...
AMD Radeon R5 (Beema/Carrizo-L)
...
...
AMD Radeon R5 (Beema/Carrizo-L)
...
...
AMD Radeon R5 (Beema/Carrizo-L)
...
AMD Radeon R5 (Beema/Carrizo-L)
...
» The benchmarks indicate that the game is not playable in the tested settings.
...
AMD Radeon R5 (Beema/Carrizo-L)
...
max:
...
AMD Radeon R5 (Beema/Carrizo-L)
...
max:
...
AMD Radeon R5 (Beema/Carrizo-L)
...
max:
» The benchmarks indicate that the game is not playable in the tested settings.
...
AMD Radeon R5 (Beema/Carrizo-L)
...
max:
AMD Radeon R5 (Beema/Carrizo-L)
...
AMD Radeon R5 (Beema/Carrizo-L)
...
» The benchmarks indicate that the game is not playable in the tested settings.
...
AMD Radeon R5 (Beema/Carrizo-L)
...
max:
...
AMD Radeon R5 (Beema/Carrizo-L)
...
max:
...
AMD Radeon R5 (Beema/Carrizo-L)
...
max:
» The benchmarks indicate that the game is not playable in the tested settings.
...
AMD Radeon R5 (Beema/Carrizo-L)
...
max:
AMD Radeon R5 (Beema/Carrizo-L)
...
max:
...
AMD Radeon R5 (Beema/Carrizo-L)
...
max:
AMD Radeon R5 (Beema/Carrizo-L)
...
max:
» With all tested laptops playable in detail settings high.
AMD Radeon R5 (Beema/Carrizo-L)
...
AMD Radeon R5 (Beema/Carrizo-L)
...
AMD Radeon R5 (Beema/Carrizo-L)
...
» The benchmarks indicate that the game is not playable in the tested settings.
...
AMD Radeon R5 (Beema/Carrizo-L)
...
max:
...
AMD Radeon R5 (Beema/Carrizo-L)
...
...
AMD Radeon R5 (Beema/Carrizo-L)
...
» The benchmarks indicate that the game is not playable in the tested settings.
...
AMD Radeon R5 (Beema/Carrizo-L)
...
...
AMD Radeon R5 (Beema/Carrizo-L)
...
AMD Radeon R5 (Beema/Carrizo-L)
...
» The benchmarks indicate that the game is not playable in the tested settings.
...
AMD Radeon R5 (Beema/Carrizo-L)
...
max:
...
AMD Radeon R5 (Beema/Carrizo-L)
...
max:
AMD Radeon R5 (Beema/Carrizo-L)
...
» The benchmarks indicate that the game is not playable in the tested settings.
...
AMD Radeon R5 (Beema/Carrizo-L)
...
max:
...
AMD Radeon R5 (Beema/Carrizo-L)
...
max:
» The benchmarks indicate that the game is not playable in the tested settings.
...
AMD Radeon R5 (Beema/Carrizo-L)
...
AMD Radeon R5 (Beema/Carrizo-L)
...
AMD Radeon R5 (Beema/Carrizo-L)
...
AMD Radeon R5 (Beema/Carrizo-L)
...
» The benchmarks indicate that the game is not playable in the tested settings.
...
AMD Radeon R5 (Beema/Carrizo-L)
...
...
AMD Radeon R5 (Beema/Carrizo-L)
...
max:
...
AMD Radeon R5 (Beema/Carrizo-L)
...
max:
» With all tested laptops playable in detail settings low.
...
AMD Radeon R5 (Beema/Carrizo-L)
...
AMD Radeon R5 (Beema/Carrizo-L)
...
AMD Radeon R5 (Beema/Carrizo-L)
...
AMD Radeon R5 (Beema/Carrizo-L)
...
max:
» The benchmarks indicate that the game is not playable in the tested settings.
...
AMD Radeon R5 (Beema/Carrizo-L)
...
...
AMD Radeon R5 (Beema/Carrizo-L)
...
...
AMD Radeon R5 (Beema/Carrizo-L)
...
...
AMD Radeon R5 (Beema/Carrizo-L)
...
max:
» The benchmarks indicate that the game is not playable in the tested settings.
...
AMD Radeon R5 (Beema/Carrizo-L)
...
...
AMD Radeon R5 (Beema/Carrizo-L)
...
AMD Radeon R5 (Beema/Carrizo-L)
...
AMD Radeon R5 (Beema/Carrizo-L)
...
» With all tested laptops playable in detail settings low.
...
AMD Radeon R5 (Beema/Carrizo-L)
...
...
AMD Radeon R5 (Beema/Carrizo-L)
...
...
AMD Radeon R5 (Beema/Carrizo-L)
...
AMD Radeon R5 (Beema/Carrizo-L)
...
» The benchmarks indicate that the game is not playable in the tested settings.
AMD Radeon R5 (Beema/Carrizo-L)
...
max:
AMD Radeon R5 (Beema/Carrizo-L)
...
max:
AMD Radeon R5 (Beema/Carrizo-L)
...
max:
AMD Radeon R5 (Beema/Carrizo-L)
...
max:
» The benchmarks indicate that the game is not playable in the tested settings.
...
AMD Radeon R5 (Beema/Carrizo-L)
...
...
AMD Radeon R5 (Beema/Carrizo-L)
...
...
AMD Radeon R5 (Beema/Carrizo-L)
...
» With all tested laptops playable in detail settings low.
AMD Radeon R5 (Beema/Carrizo-L)
...
AMD Radeon R5 (Beema/Carrizo-L)
...
AMD Radeon R5 (Beema/Carrizo-L)
...
AMD Radeon R5 (Beema/Carrizo-L)
...
» The benchmarks indicate that the game is not playable in the tested settings.
AMD Radeon R5 (Beema/Carrizo-L)
...
AMD Radeon R5 (Beema/Carrizo-L)
...
» The benchmarks indicate that the game is not playable in the tested settings.
...
AMD Radeon R5 (Beema/Carrizo-L)
...
AMD Radeon R5 (Beema/Carrizo-L)
...
...
AMD Radeon R5 (Beema/Carrizo-L)
...
AMD Radeon R5 (Beema/Carrizo-L)
...
» The benchmarks indicate that the game is not playable in the tested settings.
...
AMD Radeon R5 (Beema/Carrizo-L)
...
...
AMD Radeon R5 (Beema/Carrizo-L)
...
...
AMD Radeon R5 (Beema/Carrizo-L)
...
» The benchmarks indicate that the game is not playable in the tested settings.
...
AMD Radeon R5 (Beema/Carrizo-L)
...
...
AMD Radeon R5 (Beema/Carrizo-L)
...
AMD Radeon R5 (Beema/Carrizo-L)
...
» The benchmarks indicate that the game is not playable in the tested settings.
...
AMD Radeon R5 (Beema/Carrizo-L)
...
...
AMD Radeon R5 (Beema/Carrizo-L)
...
...
AMD Radeon R5 (Beema/Carrizo-L)
...
» The benchmarks indicate that the game is not playable in the tested settings.
AMD Radeon R5 (Beema/Carrizo-L)
...
AMD Radeon R5 (Beema/Carrizo-L)
...
AMD Radeon R5 (Beema/Carrizo-L)
...
AMD Radeon R5 (Beema/Carrizo-L)
...
» The benchmarks indicate that the game is not playable in the tested settings.
AMD Radeon R5 (Beema/Carrizo-L)
...
AMD Radeon R5 (Beema/Carrizo-L)
...
AMD Radeon R5 (Beema/Carrizo-L)
...
» The benchmarks indicate that the game is not playable in the tested settings.
...
AMD Radeon R5 (Beema/Carrizo-L)
...
...
AMD Radeon R5 (Beema/Carrizo-L)
...
...
AMD Radeon R5 (Beema/Carrizo-L)
...
» With all tested laptops playable in detail settings med..
...
AMD Radeon R5 (Beema/Carrizo-L)
...
...
AMD Radeon R5 (Beema/Carrizo-L)
...
AMD Radeon R5 (Beema/Carrizo-L)
...
» The benchmarks indicate that the game is not playable in the tested settings.
...
AMD Radeon R5 (Beema/Carrizo-L)
...
...
AMD Radeon R5 (Beema/Carrizo-L)
...
...
AMD Radeon R5 (Beema/Carrizo-L)
...
...
AMD Radeon R5 (Beema/Carrizo-L)
...
max:
» With all tested laptops playable in detail settings low.
...
AMD Radeon R5 (Beema/Carrizo-L)
...
AMD Radeon R5 (Beema/Carrizo-L)
...
» The benchmarks indicate that the game is not playable in the tested settings.
...
AMD Radeon R5 (Beema/Carrizo-L)
...
max:
...
AMD Radeon R5 (Beema/Carrizo-L)
...
...
AMD Radeon R5 (Beema/Carrizo-L)
...
AMD Radeon R5 (Beema/Carrizo-L)
...
» The benchmarks indicate that the game is not playable in the tested settings.
...
AMD Radeon R5 (Beema/Carrizo-L)
...
...
AMD Radeon R5 (Beema/Carrizo-L)
...
...
AMD Radeon R5 (Beema/Carrizo-L)
...
AMD Radeon R5 (Beema/Carrizo-L)
...
» The benchmarks indicate that the game is not playable in the tested settings.
...
AMD Radeon R5 (Beema/Carrizo-L)
...
...
AMD Radeon R5 (Beema/Carrizo-L)
...
...
AMD Radeon R5 (Beema/Carrizo-L)
...
» The benchmarks indicate that the game is not playable in the tested settings.
...
AMD Radeon R5 (Beema/Carrizo-L)
...
...
AMD Radeon R5 (Beema/Carrizo-L)
...
» With all tested laptops playable in detail settings low.
...
AMD Radeon R5 (Beema/Carrizo-L)
...
...
AMD Radeon R5 (Beema/Carrizo-L)
...
...
AMD Radeon R5 (Beema/Carrizo-L)
...
» With all tested laptops playable in detail settings low.
...
AMD Radeon R5 (Beema/Carrizo-L)
...
...
AMD Radeon R5 (Beema/Carrizo-L)
...
» With all tested laptops playable in detail settings low.
...
AMD Radeon R5 (Beema/Carrizo-L)
...
...
AMD Radeon R5 (Beema/Carrizo-L)
...
...
AMD Radeon R5 (Beema/Carrizo-L)
...
» With all tested laptops playable in detail settings low.
...
AMD Radeon R5 (Beema/Carrizo-L)
...
...
AMD Radeon R5 (Beema/Carrizo-L)
...
» With all tested laptops playable in detail settings low.
...
AMD Radeon R5 (Beema/Carrizo-L)
...
...
AMD Radeon R5 (Beema/Carrizo-L)
...
» With all tested laptops playable in detail settings low.
...
AMD Radeon R5 (Beema/Carrizo-L)
...
...
AMD Radeon R5 (Beema/Carrizo-L)
...
» With all tested laptops playable in detail settings med..
For more games that might be playable and a list of all games and graphics cards visit our Gaming List
v1.26
log 18. 01:34:07
#0 no ids found in url (should be separated by "_") +0s ... 0s
#1 not redirecting to Ajax server +0s ... 0s
#2 did not recreate cache, as it is less than 5 days old! Created at Tue, 16 Apr 2024 05:39:00 +0200 +0.001s ... 0.001s
#3 composed specs +0.082s ... 0.083s
#4 did output specs +0s ... 0.083s
#5 start showIntegratedCPUs +0s ... 0.083s
#6 getting avg benchmarks for device 5750 +0.04s ... 0.123s
#7 got single benchmarks 5750 +0.034s ... 0.158s
#8 got avg benchmarks for devices +0s ... 0.158s
#9 min, max, avg, median took s +0.658s ... 0.815s
#10 before gaming benchmark output +0s ... 0.815s
#11 Got 323 rows for game benchmarks. +0.027s ... 0.842s
#12 composed SQL query for gamebenchmarks +0s ... 0.842s
#13 got data and put it in $dataArray +0.111s ... 0.954s
#14 benchmarks composed for output. +2.922s ... 3.876s
#15 return log +0.055s ... 3.931s
Notebook reviews with AMD Radeon R5 (Beema/Carrizo-L) graphics card
Lenovo IdeaPad 110-15ACL (A8-7410, HD) Laptop Review No stamina. Lenovo's 15.6-inch laptop is available for approximately 350 Euros (~$372). The laptop's highlights are its 1-TB hard drive and 8 GB of working memo...
AMD A8-7410 | AMD Radeon R5 (Beema/Carrizo-L) | 15.60" | 2.2 kg
Lenovo G51-35 80M8002HGE Notebook Review Just for starters. Lenovo's G51 shows just what is needed for first contact with the laptop world. The manufacturer presents a 15.6-inch device that unfortunate...
AMD A8-7410 | AMD Radeon R5 (Beema/Carrizo-L) | 15.60" | 2.2 kg
Acer Aspire E5-722 662J Notebook Review Virtuous office worker. Acer presents a sturdy 17-inch laptop in the form of the Aspire E5-722. As a low-cost office device, it does many things right. What are...
AMD A6-7310 | AMD Radeon R5 (Beema/Carrizo-L) | 17.30" | 2.7 kg
Acer Aspire ES1-521-87DN Notebook Review Overpriced. The Aspire cannot boast with exceedingly high computing power. Then again, it pleases with a very low operating noise and decent keyboard. However, ...
AMD A8-6410 | AMD Radeon R5 (Beema/Carrizo-L) | 15.60" | 2.4 kg
Toshiba Satellite C55D-C-10P Carrizo-L Notebook Review Extortionate price? Toshiba charges a steep price for a simple 15-incher which does not even feature a dedicated graphics card. What are the advantages of the C...
AMD A8-7410 | AMD Radeon R5 (Beema/Carrizo-L) | 15.60" | 2.2 kg
HP Pavilion 13-a093na x360 : AMD A8-6410, 13.30", 1.8 kgReview » HP Pavilion 13-a093na x360 Convertible Review Update
HP 15-g005ng : AMD A8-6410, 15.60", 2.2 kgReview » HP 15-g005ng Notebook Review
HP Pavilion 17-f050ng : AMD A8-6410, 17.30", 2.6 kgReview » HP Pavilion 17z Notebook Review
Lenovo Ideapad 110-15ACL 80TJ00H0GE : AMD A8-7410, 15.60", 2.2 kgExternal Review » Lenovo Ideapad 110-15ACL 80TJ00H0GE
Lenovo Ideapad 110-15ACL : AMD A8-7410, 15.60"External Review » Lenovo Ideapad 110-15ACL
HP 17-y013na : AMD A8-7410, 17.30", 2.7 kgExternal Review » HP 17-y013na
Acer Aspire ES1-522-84WU : AMD A8-7410, 15.60", 2.4 kgExternal Review » Acer Aspire ES1-522-84WU
HP 15-ba023ng : AMD A8-7410, 15.60", 2 kgExternal Review » HP 15-ba023ng
HP 15-ba056ng : AMD A8-7410, 15.60", 2 kgExternal Review » HP 15-ba056ng
HP 15-af119ng : AMD A8-7410, 15.60", 2.2 kgExternal Review » HP 15-af119ng
HP 255 G4 : AMD A8-7410, 15.60", 2.1 kgExternal Review » HP 255 G4
Toshiba Satellite C55DT-C5245 : AMD A8-7410, 15.60", 2.2 kgExternal Review » Toshiba Satellite C55DT-C5245
HP Pavilion 15-P054ND : AMD A8-6410, 15.60", 2.3 kgExternal Review » HP Pavilion 15-P054ND
HP Pavilion 13-a020nr x360 (K1Q28EA) : AMD A8-6410, 13.30", 2 kgExternal Review » HP Pavilion 13-a020nr x360 (K1Q28EA)
HP 15-g005ng : AMD A8-6410, 15.60", 2.2 kgExternal Review » HP 15-g003sm G1M03EA
Toshiba Satellite C55D-C-10P Carrizo-L : AMD A8-7410, 15.60", 2.2 kgArticle » Analysis and Benchmarks of the AMD Carrizo-L Notebook Platform
Please share our article, every link counts!
» Comparison of GPUs
» Benchmark List
» Notebook Gaming List
Class 1
Class 2 Radeon PRO W6600M *
Class 3 UHD Graphics 32EUs
UHD Graphics 750
Class 4
Class 5 * Approximate position of the graphics adapter
Working For Notebookcheck
Are you a techie who knows how to translate? Then join our Team!
Details here
Top 10 Laptops Multimedia , Budget Multimedia , Gaming , Budget Gaming , Lightweight Gaming , Business , Budget Office , Workstation , Subnotebooks , Ultrabooks , Chromebooks
under 300 USD/Euros , under 500 USD/Euros , 1,000 USD/Euros , for University Students , Best Displays
Top 10 Smartphones Smartphones , Phablets , ≤6-inch , Camera Smartphones
Klaus Hinum (Update: 2017-09- 5)
 Deutsch
 English
 Español
 Français
 Italiano
 Nederlands
 Polski
 Português
 Русский
 Türkçe
 Svenska
 Chinese
 Magyar