NVIDIA GeForce RTX 4070 Laptop GPU
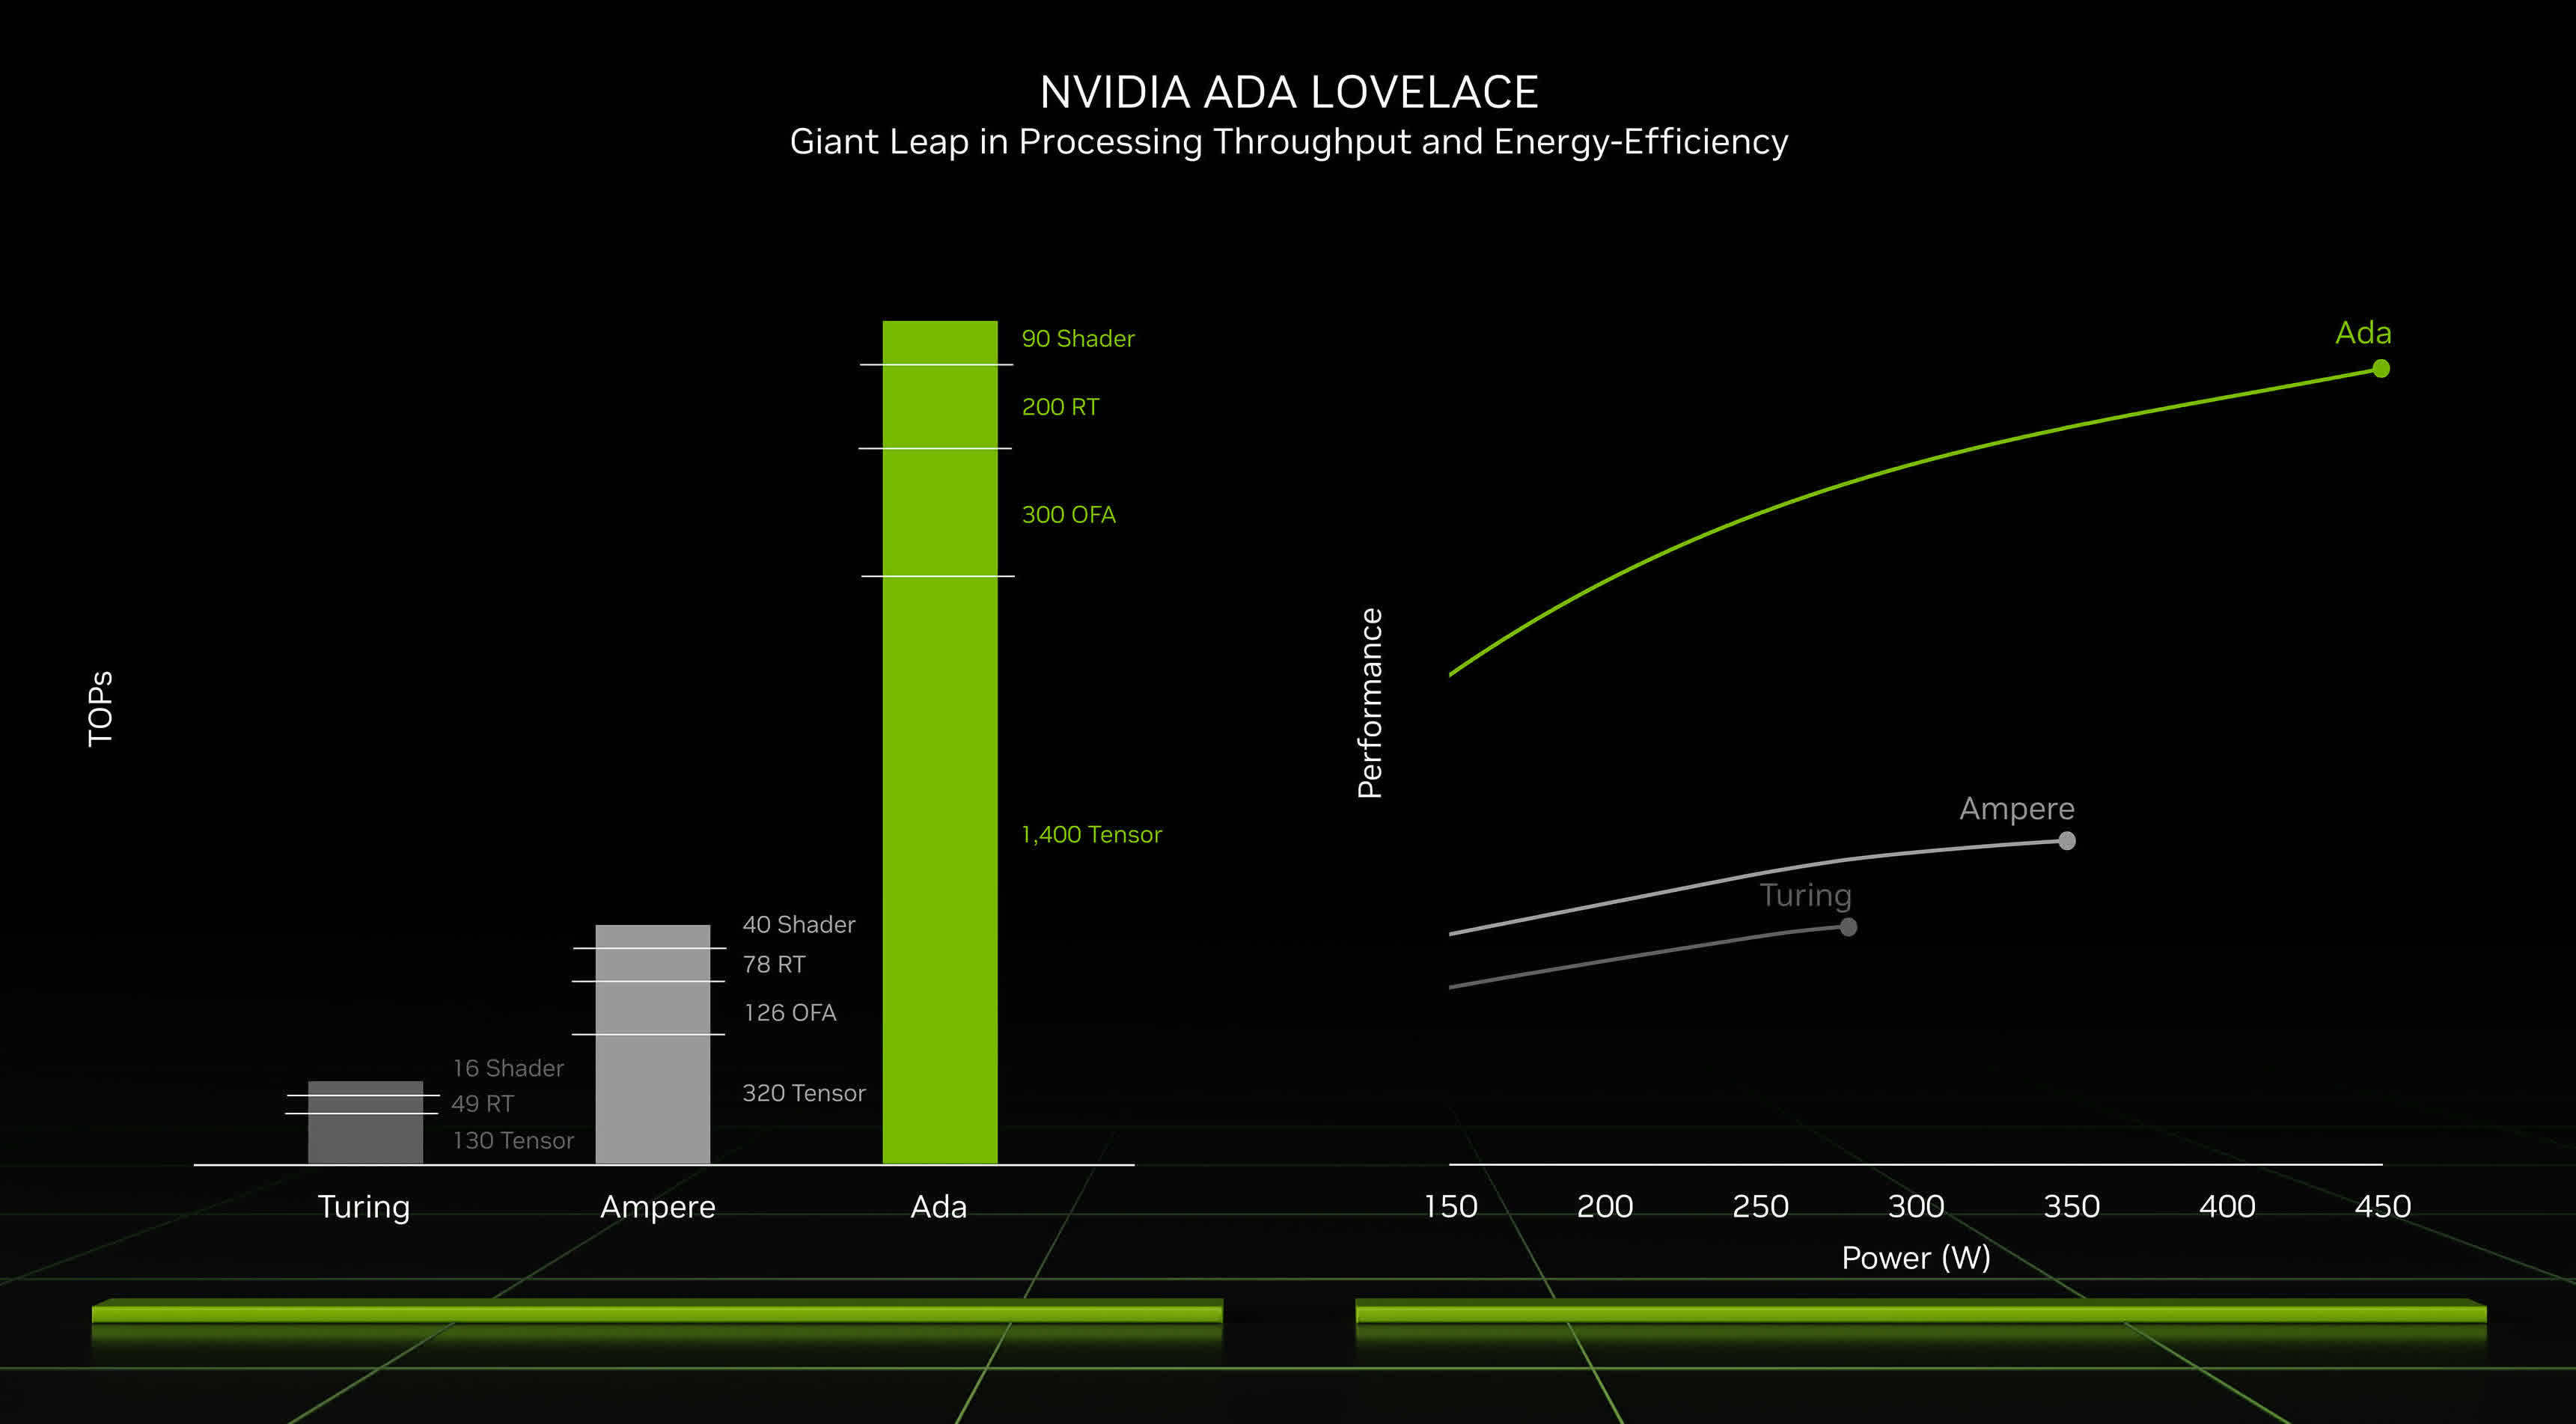
The NVIDIA GeForce RTX 4070 Laptop GPU (Codename GN21-X6) is a high-end laptop GPU. It is based on the AD106 chip and use the Ada Lovelace architecture. The RTX 4070 offers 4,608 cores (of the 7,680 in the AD106) and a 128 Bit memory bus. The RTX 4070 mobile uses 8 GB GDDR6 dedicated graphics memory with a clock speed of 16 Gbps (effective). The TGP (Total Graphics Power) can be configured between 35 and 115 Watt (+ 15-25 Watt Dynamic Boost from the CPU) leading to different performance levels (the desktop RTX 4070 Ti uses 285 Watt for comparisons). The boost clock speed ranges from 1230 MHz (at 35 Watt TGP) up to 2175 MHz (115W). Therefore, the performance is also depending a lot on the power setting used for the RTX 4080 mobile in the laptop.
The performance should be below the desktop RTX 4070 Ti and therefore best suited for 2k and maximum details for demanding games of 2022.
Our synthetic benchmarks of an average RTX 4070 mobile show a performance slightly below a mobile RTX 3080 Ti . However, with reduced power limits, the performance is clearly suffering, e.g. only 70% in Time Spy for a version with 60W TDP. In games, a fast RTX 4070 is best suited for QHD gaming, where some very demanding games wont reach the 60 fps limit (and may have to run at 1080p, reduced settings or using DLSS). See below for detailed gaming benchmarks of various cards.
The RTX 4070 offers 144 tensor cores (4th gen) that enable DLSS 3 including frame generation for supported games. Furthermore, 36 raytracing cores (4rd gen) can be used for raytracing effects in supported games.
The AD106 chip is manufactured in 5nm at TSMC (4N process).
GeForce RTX 4000 Laptop GPU Series Codename GN21-X6 Architecture Ada Lovelace Pipelines 4608 - unified TMUs 144 ROPs 48 Raytracing Cores 36 Tensor / AI Cores 144 Core Speed 1605 - 2175 (Boost) MHz Theoretical Performance 15.6 TFLOPS FP16, 15.6 TFLOPS FP32 Cache L2: 32 MB Memory Speed 16000 effective = 2000 MHz Memory Bus Width 128 Bit Memory Type GDDR6 Max. Amount of Memory 8 GB Shared Memory no Memory Bandwidth 256 GB/s API DirectX 12 Ultimate, Shader 6.7, OpenGL 4.6, OpenCL 3.0, Vulkan 1.3 Power Consumption 115 Watt (35 - 115 Watt TGP) technology 5 nm PCIe 4.0 x16 Displays 4 Displays (max.), HDMI 2.1, DisplayPort 1.4a Notebook Size large Date of Announcement 03.01.2023 Link to Manufacturer Page www.nvidia.com Predecessor GeForce RTX 3070 Laptop GPU
Benchmarks Performance Rating - 3DMark 11 + Fire Strike + Time Spy
13.6 pt (41%)
...
NVIDIA GeForce RTX 4070 Laptop GPU
max:
3DMark - 3DMark Time Spy Score
min: 5860 avg: 11936 median: 12134 (35%) max: 13871 Points
GPU TDP ? TDP 50 W TDP 60 W TDP 65 W TDP 70 W TDP 80 W TDP 90 W TDP 95 W TDP 100 W TDP 105 W TDP 115 W TDP 120 W TDP 130 W TDP 140 W 98% 46% 72% 77% 76% 84% 86% 90% 93% 93% 100% 89% 95% 97%
...
NVIDIA GeForce RTX 4070 Laptop GPU
...
max:
3DMark - 3DMark Time Spy Graphics
min: 6241 avg: 11762 median: 11990 (32%) max: 13391 Points
GPU TDP ? TDP 50 W TDP 60 W TDP 65 W TDP 70 W TDP 80 W TDP 90 W TDP 95 W TDP 100 W TDP 105 W TDP 115 W TDP 120 W TDP 130 W TDP 140 W 99% 50% 74% 77% 75% 89% 88% 93% 97% 95% 98% 90% 94% 100%
...
NVIDIA GeForce RTX 4070 Laptop GPU
...
max:
3DMark - 3DMark Ice Storm Unlimited Graphics
min: 603749 avg: 612986 median: 612986 (69%) max: 622222 Points
GPU TDP 105 W TDP 140 W 97% 100%
...
NVIDIA GeForce RTX 4070 Laptop GPU
max:
3DMark - 3DMark Ice Storm Extreme Graphics
min: 105935 avg: 293783 median: 293782 (38%) max: 481630 Points
GPU TDP 105 W TDP 140 W 22% 100%
...
NVIDIA GeForce RTX 4070 Laptop GPU
...
max:
3DMark - 3DMark Cloud Gate Score
min: 34191 avg: 60926 median: 62921 (67%) max: 70329 Points
GPU TDP 60 W TDP 100 W TDP 105 W TDP 120 W TDP 130 W TDP 140 W 52% 95% 88% 100% 82% 98%
...
NVIDIA GeForce RTX 4070 Laptop GPU
...
max:
3DMark - 3DMark Cloud Gate Graphics
min: 54238 avg: 149792 median: 161738 (43%) max: 193851 Points
GPU TDP 60 W TDP 100 W TDP 105 W TDP 120 W TDP 130 W TDP 140 W 31% 88% 70% 100% 64% 93%
...
NVIDIA GeForce RTX 4070 Laptop GPU
max:
3DMark - 3DMark Fire Strike Standard Score
min: 13535 avg: 25618 median: 26019 (46%) max: 29200 Points
GPU TDP ? TDP 50 W TDP 60 W TDP 65 W TDP 70 W TDP 80 W TDP 90 W TDP 95 W TDP 100 W TDP 105 W TDP 115 W TDP 120 W TDP 130 W TDP 140 W 99% 50% 74% 77% 81% 86% 92% 89% 96% 91% 95% 96% 91% 100%
...
NVIDIA GeForce RTX 4070 Laptop GPU
max:
3DMark - 3DMark Fire Strike Standard Graphics
min: 16212 avg: 29225 median: 29892 (34%) max: 33451 Points
GPU TDP ? TDP 50 W TDP 60 W TDP 65 W TDP 70 W TDP 80 W TDP 90 W TDP 95 W TDP 100 W TDP 105 W TDP 115 W TDP 120 W TDP 130 W TDP 140 W 99% 53% 74% 75% 80% 87% 92% 97% 99% 95% 92% 99% 92% 100%
...
NVIDIA GeForce RTX 4070 Laptop GPU
max:
3DMark - 3DMark Ice Storm Graphics
min: 93493 avg: 208478 median: 173633 (21%) max: 445451 Points
GPU TDP 100 W TDP 105 W TDP 120 W TDP 140 W 42% 27% 55% 100%
...
NVIDIA GeForce RTX 4070 Laptop GPU
...
max:
3DMark - 3DMark Wild Life Extreme Unlimited
min: 17684 avg: 21519 median: 22084 (26%) max: 24275 Points
GPU TDP 60 W TDP 90 W TDP 95 W TDP 100 W TDP 115 W TDP 130 W TDP 140 W 73% 84% 89% 93% 94% 93% 100%
...
NVIDIA GeForce RTX 4070 Laptop GPU
max:
3DMark - 3DMark Night Raid
min: 48102 avg: 52618 median: 52211.5 (49%) max: 57948 Points
GPU TDP 100 W TDP 105 W TDP 140 W 86% 89% 100%
...
NVIDIA GeForce RTX 4070 Laptop GPU
max:
3DMark - 3DMark Night Raid Graphics Score
min: 84468 avg: 106476 median: 99644.5 (38%) max: 142145 Points
GPU TDP 100 W TDP 105 W TDP 140 W 68% 66% 100%
...
NVIDIA GeForce RTX 4070 Laptop GPU
max:
3DMark 11 - 3DM11 Performance Score
min: 22258 avg: 33635 median: 34455 (48%) max: 37906 Points
GPU TDP ? TDP 50 W TDP 60 W TDP 65 W TDP 70 W TDP 80 W TDP 90 W TDP 95 W TDP 100 W TDP 105 W TDP 115 W TDP 120 W TDP 130 W TDP 140 W 99% 63% 78% 84% 84% 89% 94% 93% 97% 98% 100% 96% 95% 99%
...
NVIDIA GeForce RTX 4070 Laptop GPU
...
max:
3DMark 11 - 3DM11 Performance GPU
min: 24229 avg: 40358 median: 41011 (35%) max: 46434 Points
GPU TDP ? TDP 50 W TDP 60 W TDP 65 W TDP 70 W TDP 80 W TDP 90 W TDP 95 W TDP 100 W TDP 105 W TDP 115 W TDP 120 W TDP 130 W TDP 140 W 98% 58% 76% 78% 78% 89% 91% 97% 97% 98% 96% 95% 94% 100%
...
NVIDIA GeForce RTX 4070 Laptop GPU
...
max:
3DMark Vantage + 3DMark Vantage - 3DM Vant. Perf. total
min: 94245 avg: 97154 median: 97153.5 (28%) max: 100062 Points
GPU TDP 105 W TDP 140 W 94% 100%
...
NVIDIA GeForce RTX 4070 Laptop GPU
max:
3DM Vant. Perf. GPU no PhysX + 3DMark Vantage - 3DM Vant. Perf. GPU no PhysX
min: 100299 avg: 106532 median: 106532 (60%) max: 112764 Points
GPU TDP 105 W TDP 140 W 89% 100%
...
NVIDIA GeForce RTX 4070 Laptop GPU
max:
3DMark 05 - 3DMark 05 - Standard
53254 Points (58%)
...
NVIDIA GeForce RTX 4070 Laptop GPU
max:
3DMark 06 3DMark 06 - Standard 1280x1024 +
min: 47449 avg: 58072 median: 57775 (75%) max: 64608 Points
GPU TDP 105 W TDP 140 W 100% 90%
...
NVIDIA GeForce RTX 4070 Laptop GPU
max:
Unigine Valley 1.0 - Unigine Valley 1.0 DX
min: 108.4 avg: 115.1 median: 115.1 (38%) max: 121.7 fps
GPU TDP 105 W TDP 140 W 89% 100%
...
NVIDIA GeForce RTX 4070 Laptop GPU
max:
Blender - Blender 3.3 Classroom CUDA *
min: 32 avg: 41.6 median: 35 (5%) max: 172 Seconds
GPU TDP ? TDP 50 W TDP 60 W TDP 65 W TDP 70 W TDP 80 W TDP 90 W TDP 95 W TDP 100 W TDP 105 W TDP 115 W TDP 120 W TDP 130 W TDP 140 W 100% 107% 108% 108% 108% 109% 108% 109% 103% 109% 109% 108% 108% 109%
...
NVIDIA GeForce RTX 4070 Laptop GPU
...
Blender - Blender 3.3 Classroom OPTIX *
min: 18 avg: 21.5 median: 21 (8%) max: 28 Seconds
GPU TDP ? TDP 50 W TDP 60 W TDP 65 W TDP 70 W TDP 80 W TDP 90 W TDP 95 W TDP 100 W TDP 105 W TDP 115 W TDP 120 W TDP 130 W TDP 140 W 103% 100% 102% 101% 102% 102% 102% 102% 103% 102% 103% 102% 103% 103%
...
NVIDIA GeForce RTX 4070 Laptop GPU
...
Blender - Blender 3.3 Classroom HIP *
330 Seconds (27%)
...
NVIDIA GeForce RTX 4070 Laptop GPU
...
SPECviewperf 12 + SPECviewperf 12 - specvp12 sw-03
79.8 fps (20%)
...
NVIDIA GeForce RTX 4070 Laptop GPU
...
max:
specvp12 snx-02 + SPECviewperf 12 - specvp12 snx-02
11.4 fps (2%)
...
NVIDIA GeForce RTX 4070 Laptop GPU
...
max:
specvp12 showcase-01 + SPECviewperf 12 - specvp12 showcase-01
117 fps (25%)
...
NVIDIA GeForce RTX 4070 Laptop GPU
max:
specvp12 mediacal-01 + SPECviewperf 12 - specvp12 mediacal-01
89.3 fps (23%)
...
NVIDIA GeForce RTX 4070 Laptop GPU
max:
specvp12 maya-04 + SPECviewperf 12 - specvp12 maya-04
204 fps (56%)
...
NVIDIA GeForce RTX 4070 Laptop GPU
max:
specvp12 energy-01 + SPECviewperf 12 - specvp12 energy-01
20.8 fps (19%)
...
NVIDIA GeForce RTX 4070 Laptop GPU
max:
specvp12 creo-01 + SPECviewperf 12 - specvp12 creo-01
66.2 fps (26%)
...
NVIDIA GeForce RTX 4070 Laptop GPU
...
max:
specvp12 catia-04 + SPECviewperf 12 - specvp12 catia-04
109 fps (18%)
...
NVIDIA GeForce RTX 4070 Laptop GPU
...
max:
specvp12 3dsmax-05 + SPECviewperf 12 - specvp12 3dsmax-05
234 fps (41%)
...
NVIDIA GeForce RTX 4070 Laptop GPU
max:
SPECviewperf 13 specvp13 sw-04 + SPECviewperf 13 - specvp13 sw-04
min: 109.63 avg: 113 median: 114 (31%) max: 115.44 fps
GPU TDP 105 W TDP 130 W TDP 140 W 99% 95% 100%
...
NVIDIA GeForce RTX 4070 Laptop GPU
...
max:
specvp13 snx-03 + SPECviewperf 13 - specvp13 snx-03
min: 20.7 avg: 22.1 median: 22.8 (3%) max: 22.97 fps
GPU TDP 105 W TDP 130 W TDP 140 W 90% 99% 100%
...
NVIDIA GeForce RTX 4070 Laptop GPU
...
max:
specvp13 showcase-02 + SPECviewperf 13 - specvp13 showcase-02
min: 111.17 avg: 116.8 median: 117 (25%) max: 122.16 fps
GPU TDP 105 W TDP 130 W TDP 140 W 96% 91% 100%
...
NVIDIA GeForce RTX 4070 Laptop GPU
...
max:
specvp13 medical-02 + SPECviewperf 13 - specvp13 medical-02
min: 74.35 avg: 77.5 median: 77.9 (16%) max: 80.13 fps
GPU TDP 105 W TDP 130 W TDP 140 W 97% 93% 100%
...
NVIDIA GeForce RTX 4070 Laptop GPU
...
max:
specvp13 maya-05 + SPECviewperf 13 - specvp13 maya-05
min: 319.16 avg: 337.8 median: 338 (38%) max: 356.37 fps
GPU TDP 105 W TDP 130 W TDP 140 W 95% 90% 100%
...
NVIDIA GeForce RTX 4070 Laptop GPU
max:
specvp13 energy-02 + SPECviewperf 13 - specvp13 energy-02
min: 41 avg: 41.7 median: 41.9 (14%) max: 42.07 fps
GPU TDP 105 W TDP 130 W TDP 140 W 97% 100% 100%
...
NVIDIA GeForce RTX 4070 Laptop GPU
...
specvp13 creo-02 + SPECviewperf 13 - specvp13 creo-02
min: 241.03 avg: 251.1 median: 249 (36%) max: 263.41 fps
GPU TDP 105 W TDP 130 W TDP 140 W 95% 92% 100%
...
NVIDIA GeForce RTX 4070 Laptop GPU
max:
specvp13 catia-05 + SPECviewperf 13 - specvp13 catia-05
min: 150.22 avg: 154.3 median: 154 (17%) max: 158.82 fps
GPU TDP 105 W TDP 130 W TDP 140 W 97% 95% 100%
...
NVIDIA GeForce RTX 4070 Laptop GPU
...
max:
specvp13 3dsmax-06 + SPECviewperf 13 - specvp13 3dsmax-06
min: 215.97 avg: 231.1 median: 234 (41%) max: 243.42 fps
GPU TDP 105 W TDP 130 W TDP 140 W 96% 89% 100%
...
NVIDIA GeForce RTX 4070 Laptop GPU
max:
SPECviewperf 2020 specvp2020 solidworks-05 1080p + SPECviewperf 2020 - specvp2020 solidworks-05 1080p
min: 249.69 avg: 258.3 median: 254.4 (49%) max: 271.1 fps
GPU TDP 130 W TDP 140 W 96% 100%
...
NVIDIA GeForce RTX 4070 Laptop GPU
specvp2020 snx-04 1080p + SPECviewperf 2020 - specvp2020 snx-04 1080p
min: 22 avg: 22.7 median: 22.5 (4%) max: 24.4 fps
GPU TDP 130 W TDP 140 W 99% 100%
...
NVIDIA GeForce RTX 4070 Laptop GPU
...
max:
specvp2020 medical-03 1080p + SPECviewperf 2020 - specvp2020 medical-03 1080p
min: 32.2 avg: 34.7 median: 34.8 (25%) max: 36.9 fps
GPU TDP 130 W TDP 140 W 100% 100%
...
NVIDIA GeForce RTX 4070 Laptop GPU
...
max:
specvp2020 maya-06 1080p + SPECviewperf 2020 - specvp2020 maya-06 1080p
min: 355.1 avg: 382.5 median: 390 (57%) max: 407.77 fps
GPU TDP 130 W TDP 140 W 94% 100%
...
NVIDIA GeForce RTX 4070 Laptop GPU
max:
specvp2020 energy-03 1080p + SPECviewperf 2020 - specvp2020 energy-03 1080p
min: 41.3 avg: 42 median: 42 (34%) max: 42.9 fps
GPU TDP 130 W TDP 140 W 100% 100%
...
NVIDIA GeForce RTX 4070 Laptop GPU
max:
specvp2020 creo-03 1080p + SPECviewperf 2020 - specvp2020 creo-03 1080p
min: 108.9 avg: 114.2 median: 113 (56%) max: 121.2 fps
GPU TDP 130 W TDP 140 W 99% 100%
...
NVIDIA GeForce RTX 4070 Laptop GPU
max:
specvp2020 catia-06 1080p + SPECviewperf 2020 - specvp2020 catia-06 1080p
min: 63.45 avg: 65.4 median: 64.2 (41%) max: 68.6 fps
GPU TDP 130 W TDP 140 W 96% 100%
...
NVIDIA GeForce RTX 4070 Laptop GPU
...
max:
specvp2020 3dsmax-07 1080p + SPECviewperf 2020 - specvp2020 3dsmax-07 1080p
min: 96.87 avg: 98.3 median: 97.8 (44%) max: 99.85 fps
GPU TDP 130 W TDP 140 W 98% 100%
...
NVIDIA GeForce RTX 4070 Laptop GPU
...
max:
specvp2020 solidworks-05 4k + SPECviewperf 2020 - specvp2020 solidworks-05 4k
min: 115.11 avg: 183.1 median: 183.1 (54%) max: 251 fps
GPU TDP 105 W TDP 140 W 100% 46%
...
NVIDIA GeForce RTX 4070 Laptop GPU
max:
specvp2020 snx-04 4k + SPECviewperf 2020 - specvp2020 snx-04 4k
min: 17.96 avg: 19.3 median: 19.3 (2%) max: 20.6 fps
GPU TDP 105 W TDP 140 W 100% 87%
...
NVIDIA GeForce RTX 4070 Laptop GPU
...
max:
specvp2020 medical-03 4k + SPECviewperf 2020 - specvp2020 medical-03 4k
min: 13.87 avg: 24.9 median: 24.9 (24%) max: 35.9 fps
GPU TDP 105 W TDP 140 W 100% 39%
...
NVIDIA GeForce RTX 4070 Laptop GPU
max:
specvp2020 maya-06 4k + SPECviewperf 2020 - specvp2020 maya-06 4k
min: 213.77 avg: 299.9 median: 299.9 (49%) max: 386 fps
GPU TDP 105 W TDP 140 W 100% 55%
...
NVIDIA GeForce RTX 4070 Laptop GPU
max:
specvp2020 energy-03 4k + SPECviewperf 2020 - specvp2020 energy-03 4k
min: 28.25 avg: 34.6 median: 34.6 (8%) max: 41 fps
GPU TDP 105 W TDP 140 W 100% 69%
...
NVIDIA GeForce RTX 4070 Laptop GPU
max:
specvp2020 creo-03 4k + SPECviewperf 2020 - specvp2020 creo-03 4k
min: 90.79 avg: 99.4 median: 99.4 (47%) max: 108 fps
GPU TDP 105 W TDP 140 W 100% 84%
...
NVIDIA GeForce RTX 4070 Laptop GPU
max:
specvp2020 catia-06 4k + SPECviewperf 2020 - specvp2020 catia-06 4k
min: 37.72 avg: 51.9 median: 51.9 (34%) max: 66.1 fps
GPU TDP 105 W TDP 140 W 100% 57%
...
NVIDIA GeForce RTX 4070 Laptop GPU
...
max:
specvp2020 3dsmax-07 4k + SPECviewperf 2020 - specvp2020 3dsmax-07 4k
min: 69.84 avg: 82.1 median: 82.1 (34%) max: 94.3 fps
GPU TDP 105 W TDP 140 W 100% 74%
...
NVIDIA GeForce RTX 4070 Laptop GPU
...
max:
Cinebench R10 Cinebench R10 Shading (32bit) + Cinebench R10 - Cinebench R10 Shading (32bit)
min: 17026 avg: 20292 median: 19835 (14%) max: 24016 points
GPU TDP 90 W TDP 105 W TDP 140 W 71% 83% 100%
...
NVIDIA GeForce RTX 4070 Laptop GPU
...
Cinebench R11.5 Cinebench R11.5 OpenGL 64 Bit + Cinebench R11.5 - Cinebench R11.5 OpenGL 64 Bit
min: 164.48 avg: 178.2 median: 178.2 (62%) max: 191.9 fps
GPU TDP 105 W TDP 140 W 86% 100%
...
NVIDIA GeForce RTX 4070 Laptop GPU
...
max:
Cinebench R15 + Cinebench R15 - Cinebench R15 OpenGL 64 Bit
min: 138.8 avg: 225.8 median: 225 (13%) max: 292 fps
GPU TDP ? TDP 50 W TDP 60 W TDP 65 W TDP 70 W TDP 80 W TDP 90 W TDP 95 W TDP 100 W TDP 105 W TDP 115 W TDP 120 W TDP 130 W TDP 140 W 85% 82% 61% 76% 77% 63% 76% 84% 69% 78% 95% 69% 100% 85%
...
NVIDIA GeForce RTX 4070 Laptop GPU
...
Cinebench R15 OpenGL Ref. Match 64 Bit + Cinebench R15 - Cinebench R15 OpenGL Ref. Match 64 Bit
99.6 % (100%)
GPU TDP ? TDP 50 W TDP 60 W TDP 65 W TDP 70 W TDP 80 W TDP 90 W TDP 95 W TDP 100 W TDP 105 W TDP 115 W TDP 120 W TDP 130 W TDP 140 W 100% 100% 100% 100% 100% 100% 100% 100% 100% 100% 100% 100% 100% 100%
...
NVIDIA GeForce RTX 4070 Laptop GPU
...
GFXBench - GFXBench 5.0 4K Aztec Ruins High Tier Offscreen
127.6 fps (52%)
...
NVIDIA GeForce RTX 4070 Laptop GPU
GFXBench - GFXBench 5.0 Aztec Ruins High Tier Offscreen
288.5 fps (52%)
...
NVIDIA GeForce RTX 4070 Laptop GPU
GFXBench - GFXBench 5.0 Aztec Ruins Normal Tier Offscreen
736 fps (55%)
...
NVIDIA GeForce RTX 4070 Laptop GPU
GFXBench - GFXBench Car Chase Offscreen
617 fps (69%)
...
NVIDIA GeForce RTX 4070 Laptop GPU
GFXBench 3.1 - GFXBench Manhattan ES 3.1 Offscreen
743 fps (16%)
...
NVIDIA GeForce RTX 4070 Laptop GPU
...
GFXBench 3.0 - GFXBench 3.0 Manhattan Offscreen
990 fps (58%)
...
NVIDIA GeForce RTX 4070 Laptop GPU
GFXBench (DX / GLBenchmark) 2.7 + GFXBench (DX / GLBenchmark) 2.7 - GFXBench T-Rex HD Offscreen C24Z16
2674 fps (21%)
...
NVIDIA GeForce RTX 4070 Laptop GPU
...
Basemark GPU 1.2 - Basemark GPU 1.2 Vulkan Official Medium Offscreen 1080
min: 104.6 avg: 476.9 median: 235 (1%) max: 1452 fps
GPU TDP ? TDP 50 W TDP 60 W TDP 70 W TDP 80 W TDP 90 W TDP 95 W TDP 100 W TDP 115 W TDP 120 W TDP 130 W TDP 140 W 100% 20% 24% 80% 17% 21% 22% 21% 24% 8% 9% 50%
...
NVIDIA GeForce RTX 4070 Laptop GPU
...
max:
Basemark GPU 1.2 - Basemark GPU 1.2 Vulkan Official High Offscreen 2160
3.6 fps (1%)
GPU TDP 50 W TDP 70 W TDP 130 W TDP 140 W 100% 100% 100% 100%
NVIDIA GeForce RTX 4070 Laptop GPU
...
Geekbench 6.2 - Geekbench 6.2 GPU OpenCL
min: 101474 avg: 116444 median: 117792 (34%) max: 129836 points
GPU TDP ? TDP 60 W TDP 80 W TDP 90 W TDP 100 W TDP 105 W TDP 115 W TDP 120 W TDP 130 W TDP 140 W 96% 88% 90% 92% 96% 94% 84% 98% 100% 99%
...
NVIDIA GeForce RTX 4070 Laptop GPU
max:
Geekbench 6.2 - Geekbench 6.2 GPU Vulkan
min: 9035 avg: 60080 median: 34157 (11%) max: 120033 points
GPU TDP ? TDP 60 W TDP 80 W TDP 90 W TDP 100 W TDP 115 W TDP 120 W TDP 140 W 100% 31% 22% 27% 25% 8% 16% 62%
...
NVIDIA GeForce RTX 4070 Laptop GPU
max:
LuxMark v2.0 64Bit - LuxMark v2.0 Room GPU
4727 Samples/s (21%)
...
NVIDIA GeForce RTX 4070 Laptop GPU
max:
LuxMark v2.0 64Bit - LuxMark v2.0 Sala GPU
10800 Samples/s (19%)
...
NVIDIA GeForce RTX 4070 Laptop GPU
max:
ComputeMark v2.1 - ComputeMark v2.1 Result
min: 24129 avg: 25731 median: 25731 (28%) max: 27333 points
GPU TDP 105 W TDP 140 W 88% 100%
...
NVIDIA GeForce RTX 4070 Laptop GPU
...
max:
Power Consumption - Furmark Stress Test Power Consumption - external Monitor *
min: 76.1 avg: 155.1 median: 162.5 (23%) max: 276 Watt
GPU TDP 50 W TDP 60 W TDP 65 W TDP 70 W TDP 80 W TDP 90 W TDP 95 W TDP 100 W TDP 105 W TDP 115 W TDP 120 W TDP 130 W TDP 140 W 119% 118% 117% 116% 112% 113% 109% 108% 107% 103% 111% 101% 100%
...
NVIDIA GeForce RTX 4070 Laptop GPU
...
max:
0 15 30 45 60 75 90 105 120 135 150 165 180 195 210 225 Tooltip Dell XPS 16 9640: Ø76.1 (63-86.8)
Dell XPS 15 9530 RTX 4070: Ø80.8 (74.7-100)
Asus ROG Flow Z13 ACRNM: Ø90.9 (83-114.2)
Samsung Galaxy Book3 Ultra 16, i9-13900H RTX 4070: Ø93 (70.3-99.7)
Dell XPS 17 9730 RTX 4070: Ø95.4 (92.2-121.3)
Asus ROG Zephyrus G14 2024 GA403U: Ø103.6 (99.1-114.6)
Acer Nitro 17 AN17-41-R9LN: Ø111.9 (106.9-117.7)
Asus ROG Zephyrus G16 2024 GU605M: Ø116.4 (111.4-126.3)
Asus Zenbook Pro 14 OLED UX6404VI: Ø118.6 (114.5-140)
HP Victus 16-r0077ng: Ø120.6 (116.5-133.9)
Asus ROG Flow X16 GV601VI: Ø129.5 (121.5-142.5)
SCHENKER VISION 16 Pro (M23): Ø130.1 (123.2-144.6)
HP Omen 16-xf0376ng: Ø133.4 (131.8-137.6)
MSI Stealth 16 Studio A13VG: Ø137.2 (132.68-161.38)
HP Omen Transcend 16-u1095ng: Ø137.2 (134-145.6)
Acer Nitro 16 AN16-41: Ø137.9 (128.9-151.7)
MSI Stealth 16 Mercedes-AMG Motorsport A13VG: Ø141 (130.8-146.6)
Lenovo Yoga Pro 9 16IMH9: Ø142.8 (135.5-155.9)
XMG Pro 16 Studio (Mid 23): Ø152.1 (142.8-172.5)
Gigabyte AERO 16 OLED BSF: Ø157.2 (148.52-172.69)
Aorus 16X 2024: Ø162.1 (152.6-169.2)
Lenovo Legion 7 16 IRX G9: Ø162.8 (154.1-200)
Lenovo Legion Slim 7i 16 Gen 8: Ø163.8 (158.5-182)
Asus ROG Strix G17 G713PI: Ø165.8 (157.3-171.2)
SCHENKER XMG Fusion 15 (Early 24): Ø167.2 (164.2-172.9)
MSI Pulse 17 B13VGK: Ø170.2 (165.42-190.7)
SCHENKER XMG CORE 16 (L23): Ø174.3 (168.88-181.28)
Asus ROG Strix G18 G814JI: Ø176 (164.8-186.7)
Razer Blade 14 RZ09-0508: Ø176.4 (168.4-196.8)
Acer Predator Helios Neo 16 PHN16-72: Ø177.9 (169.4-226)
Razer Blade 14 RTX 4070: Ø179 (158.9-200)
Aorus 15 BSF: Ø179.3 (175-196)
Asus TUF Gaming A17 FA707XI-NS94: Ø181.9 (165.7-190.2)
HP Omen Transcend 16: Ø186.3 (175.4-207)
Aorus 15X ASF: Ø194 (184.9-208)
Asus ProArt Studiobook 16 OLED H7604: Ø195.7 (185.7-202)
Alienware m16 R2: Ø197.8 (187.5-211)
Razer Blade 18 RTX 4070: Ø198.8 (181.6-228)
Uniwill GM6PX7X RTX 4070: Ø207 (201-211)
Medion Erazer Major X20: Ø211 (207-216)
Lenovo Legion Pro 5 16ARX8: Ø211 (203-215)
SCHENKER XMG Focus 17 (E23): Ø220 (212.03-229.87)
Power Consumption - The Witcher 3 Power Consumption - external Monitor *
min: 81.2 avg: 154.2 median: 161.8 (23%) max: 196.4 Watt
GPU TDP 35 W TDP 50 W TDP 60 W TDP 65 W TDP 70 W TDP 80 W TDP 90 W TDP 95 W TDP 100 W TDP 105 W TDP 115 W TDP 120 W TDP 130 W TDP 140 W 115% 114% 113% 111% 114% 107% 112% 107% 107% 107% 100% 108% 101% 101%
...
NVIDIA GeForce RTX 4070 Laptop GPU
...
max:
0 15 30 45 60 75 90 105 120 135 150 165 180 195 210 225 Tooltip Dell XPS 15 9530 RTX 4070: Ø81.2 (79.2-86.9)
Asus ROG Flow Z13 ACRNM: Ø100.9 (94.7-113.3)
SCHENKER XMG Neo 17 2023 Engineering Sample: Ø102.4 (97.5-128.7)
Samsung Galaxy Book3 Ultra 16, i9-13900H RTX 4070: Ø104 (81.6-106)
Asus ROG Zephyrus G14 2024 GA403U: Ø106.5 (103.9-110)
Dell XPS 17 9730 RTX 4070: Ø106.8 (103.6-112.3)
Dell XPS 16 9640: Ø117.1 (113.3-121.6)
Asus ROG Zephyrus G16 2024 GU605M: Ø122 (118.4-124.8)
SCHENKER XMG Neo 17 2023 Engineering Sample: Ø125.5 (122-138.7)
MSI Stealth 16 Studio A13VG: Ø127.3 (110.58-147.31)
Asus Zenbook Pro 14 OLED UX6404VI: Ø127.9 (118.7-132)
HP Victus 16-r0077ng: Ø135.6 (131.2-141.4)
Asus ROG Flow X16 GV601VI: Ø135.7 (132.8-151.8)
MSI Stealth 16 Mercedes-AMG Motorsport A13VG: Ø136.8 (131.6-155.5)
Acer Nitro 17 AN17-41-R9LN: Ø137.5 (129.8-149.9)
HP Omen 16-xf0376ng: Ø138.5 (132.9-144.6)
SCHENKER VISION 16 Pro (M23): Ø141.5 (138.5-148.1)
HP Omen Transcend 16-u1095ng: Ø142.9 (132.4-150.1)
SCHENKER XMG Neo 17 2023 Engineering Sample: Ø143.2 (136.8-208)
MSI Pulse 17 B13VGK: Ø147.3 (141.56-155.31)
Acer Nitro 16 AN16-41: Ø147.5 (141.3-152.6)
Lenovo Yoga Pro 9 16IMH9: Ø149.6 (143.5-152.7)
Gigabyte AERO 16 OLED BSF: Ø158.6 (152.66-167.99)
SCHENKER XMG Neo 17 2023 Engineering Sample: Ø161.8 (156.5-172.3)
Razer Blade 14 RTX 4070: Ø163.1 (158.7-175.8)
Asus ROG Strix G18 G814JI: Ø164.9 (158.8-176.1)
Aorus 16X 2024: Ø165.8 (148.9-169.3)
Lenovo Legion Slim 7i 16 Gen 8: Ø167.5 (163.8-179.6)
Asus ROG Strix G17 G713PI: Ø169.3 (160.8-185.5)
Aorus 15 BSF: Ø169.3 (158.3-181.9)
Aorus 15X ASF: Ø175.3 (164.3-201)
XMG Pro 16 Studio (Mid 23): Ø177.1 (172.2-188.6)
Uniwill GM6PX7X RTX 4070: Ø178.3 (173.5-193)
Razer Blade 14 RZ09-0508: Ø178.5 (168-185.7)
Lenovo Legion 7 16 IRX G9: Ø180.8 (173.6-186.8)
Acer Predator Helios Neo 16 PHN16-72: Ø181.8 (175.6-198.4)
SCHENKER XMG CORE 16 (L23): Ø181.8 (170.33-191.61)
SCHENKER XMG Neo 17 2023 Engineering Sample: Ø182.4 (175.8-209)
Medion Erazer Major X20: Ø184.9 (177.1-196.5)
Alienware m16 R2: Ø186.8 (182.9-201)
Asus TUF Gaming A17 FA707XI-NS94: Ø187.5 (172-204)
SCHENKER XMG Fusion 15 (Early 24): Ø187.8 (163.3-206)
Lenovo Legion Pro 5 16ARX8: Ø190.6 (186.4-199)
SCHENKER XMG Focus 17 (E23): Ø193.2 (188.84-197.63)
Asus ProArt Studiobook 16 OLED H7604: Ø193.5 (178.3-205)
Razer Blade 18 RTX 4070: Ø194.2 (190.3-223)
HP Omen Transcend 16: Ø196.4 (176.7-230)
Power Consumption - Witcher 3 Power Consumption *
min: 95.4 avg: 162.5 median: 168.8 (37%) max: 265 Watt
GPU TDP 50 W TDP 60 W TDP 65 W TDP 70 W TDP 80 W TDP 90 W TDP 95 W TDP 100 W TDP 105 W TDP 115 W TDP 120 W TDP 130 W TDP 140 W 135% 128% 132% 128% 123% 125% 115% 111% 117% 100% 117% 102% 103%
...
NVIDIA GeForce RTX 4070 Laptop GPU
...
0 15 30 45 60 75 90 105 120 135 150 165 180 195 210 225 Tooltip Dell XPS 15 9530 RTX 4070: Ø95.4 (82.9-105.7)
Samsung Galaxy Book3 Ultra 16, i9-13900H RTX 4070: Ø100.9 (71.1-104.4)
Asus ROG Flow Z13 ACRNM: Ø104.4 (99.4-115.2)
Asus ROG Zephyrus G14 2024 GA403U: Ø109.7 (106.8-115.5)
Dell XPS 17 9730 RTX 4070: Ø113.7 (106.5-118.1)
Dell XPS 16 9640: Ø126.4 (123.3-133.4)
Asus ROG Zephyrus G16 2024 GU605M: Ø127.5 (122.2-135.3)
MSI Pulse 17 B13VGK: Ø130.5 (121.03-169.72)
MSI Stealth 16 Studio A13VG: Ø130.5 (121.03-169.72)
Asus Zenbook Pro 14 OLED UX6404VI: Ø132.2 (129.8-137.2)
MSI Stealth 16 Mercedes-AMG Motorsport A13VG: Ø140 (135.2-154.5)
HP Omen 16-xf0376ng: Ø140.9 (128.2-145.2)
HP Victus 16-r0077ng: Ø141.8 (138.7-146.4)
Acer Nitro 17 AN17-41-R9LN: Ø147.5 (144.2-158.7)
SCHENKER VISION 16 Pro (M23): Ø147.7 (144.6-151.8)
HP Omen Transcend 16-u1095ng: Ø148.4 (143.6-156)
Acer Nitro 16 AN16-41: Ø154.8 (151.7-164.2)
Asus ROG Flow X16 GV601VI: Ø157.5 (153.7-161.2)
Gigabyte AERO 16 OLED BSF: Ø158.5 (151.96-174.25)
Lenovo Yoga Pro 9 16IMH9: Ø159.6 (156.5-163.4)
Razer Blade 14 RTX 4070: Ø165.8 (159.7-181.8)
Lenovo Legion Slim 7i 16 Gen 8: Ø171.8 (165.1-182)
Aorus 16X 2024: Ø172.6 (167.4-181.2)
Aorus 15 BSF: Ø175.8 (165-189.6)
Asus ROG Strix G18 G814JI: Ø178.6 (174.2-191.1)
SCHENKER XMG CORE 16 (L23): Ø179 (165.22-211.94)
Asus ROG Strix G17 G713PI: Ø179.8 (170.9-206)
XMG Pro 16 Studio (Mid 23): Ø181.5 (173.7-188.4)
Razer Blade 14 RZ09-0508: Ø182.1 (171.6-190.8)
Uniwill GM6PX7X RTX 4070: Ø185.3 (181-198.3)
Aorus 15X ASF: Ø185.4 (181.4-204)
Alienware m16 R2: Ø188.1 (183.5-201)
Lenovo Legion 7 16 IRX G9: Ø188.4 (182.2-195.1)
Lenovo Legion Pro 5 16ARX8: Ø189.6 (178.6-202)
Asus TUF Gaming A17 FA707XI-NS94: Ø189.7 (174.6-215)
Acer Predator Helios Neo 16 PHN16-72: Ø190.6 (179.2-203)
Medion Erazer Major X20: Ø191.6 (183.8-199.7)
SCHENKER XMG Fusion 15 (Early 24): Ø192.7 (182.8-220)
Asus ProArt Studiobook 16 OLED H7604: Ø196.5 (178-212)
Razer Blade 18 RTX 4070: Ø202 (195.8-215)
HP Omen Transcend 16: Ø206 (187.4-239)
SCHENKER XMG Focus 17 (E23): Ø211 (196.76-225.43)
Power Consumption - Witcher 3 ultra Power Efficiency
min: 0.4151 avg: 0.7 median: 0.7 (67%) max: 0.885 fps per Watt
GPU TDP 50 W TDP 60 W TDP 65 W TDP 70 W TDP 80 W TDP 90 W TDP 95 W TDP 100 W TDP 105 W TDP 115 W TDP 130 W TDP 140 W 83% 79% 90% 96% 87% 100% 81% 82% 83% 68% 74% 73%
...
NVIDIA GeForce RTX 4070 Laptop GPU
...
Power Consumption - Witcher 3 ultra Power Efficiency - external Monitor
min: 0.553 avg: 0.7 median: 0.7 (60%) max: 0.912 fps per Watt
GPU TDP 35 W TDP 50 W TDP 60 W TDP 65 W TDP 70 W TDP 80 W TDP 90 W TDP 95 W TDP 100 W TDP 105 W TDP 115 W TDP 130 W TDP 140 W 80% 88% 82% 85% 99% 84% 100% 82% 89% 81% 69% 74% 74%
...
NVIDIA GeForce RTX 4070 Laptop GPU
...
Emissions Witcher 3 Fan Noise + Emissions - Witcher 3 Fan Noise
min: 40.1 avg: 49.5 median: 49.2 (79%) max: 57.94 dB(A)
GPU TDP 50 W TDP 60 W TDP 65 W TDP 70 W TDP 80 W TDP 90 W TDP 95 W TDP 100 W TDP 105 W TDP 115 W TDP 120 W TDP 130 W TDP 140 W 74% 92% 83% 88% 86% 88% 98% 92% 89% 100% 85% 95% 93%
...
NVIDIA GeForce RTX 4070 Laptop GPU
...
Clock Speed - GPU Clock Witcher 3 ultra
min: 1860 avg: 2217 median: 2295 (90%) max: 2460 MHz
GPU TDP 105 W TDP 130 W TDP 140 W 82% 98% 100%
...
NVIDIA GeForce RTX 4070 Laptop GPU
...
- Range of benchmark values for this graphics card
- Average benchmark values for this graphics card
* Smaller numbers mean a higher performance
Game Benchmarks The following benchmarks stem from our benchmarks of review laptops. The performance depends on the used graphics memory, clock rate, processor, system settings, drivers, and operating systems. So the results don't have to be representative for all laptops with this GPU. For detailed information on the benchmark results, click on the fps number.
68.8 [X] XMG Pro 15 E23 Intel Core i9-13900HX 1.6GHz
NVIDIA GeForce RTX 4070 Laptop GPU
min:
33.5 fps, P0.1:
35.1 fps, P1:
49.4 fps, max:
95.1 fps
83.9 [X] SCHENKER XMG Fusion 15 (Early 24) Intel Core i9-14900HX 1.6GHz
NVIDIA GeForce RTX 4070 Laptop GPU
min:
21.5 fps, P0.1:
28.1 fps, P1:
60.7 fps, max:
112.3 fps
~ 76 fps
+ Compare
- Hide Comparison
+ 📈 Graph
- 📈 Hide Graph
0 Tooltip : Ø68.8 (56.8-76.4)
XMG Fusion 15 (Early 24): Ø83.7 (69.7-93.9)
NVIDIA GeForce RTX 4070 Laptop GPU
max:
65.7 [X] XMG Pro 15 E23 Intel Core i9-13900HX 1.6GHz
NVIDIA GeForce RTX 4070 Laptop GPU
min:
33.2 fps, P0.1:
35.7 fps, P1:
49.7 fps, max:
89.3 fps
80 [X] SCHENKER XMG Fusion 15 (Early 24) Intel Core i9-14900HX 1.6GHz
NVIDIA GeForce RTX 4070 Laptop GPU
min:
32.5 fps, P0.1:
42.2 fps, P1:
60.3 fps, max:
104.6 fps
~ 73 fps
+ Compare
- Hide Comparison
+ 📈 Graph
- 📈 Hide Graph
0 Tooltip : Ø65.6 (56.5-73.7)
XMG Fusion 15 (Early 24): Ø79.6 (69.5-89.3)
...
NVIDIA GeForce RTX 4070 Laptop GPU
...
max:
57.4 [X] XMG Pro 15 E23 Intel Core i9-13900HX 1.6GHz
NVIDIA GeForce RTX 4070 Laptop GPU
min:
31.8 fps, P0.1:
36.9 fps, P1:
44 fps, max:
71.2 fps
61.3 [X] SCHENKER XMG Fusion 15 (Early 24) Intel Core i9-14900HX 1.6GHz
NVIDIA GeForce RTX 4070 Laptop GPU
min:
37.3 fps, P0.1:
38.9 fps, P1:
48.6 fps, max:
72 fps
~ 59 fps
+ Compare
- Hide Comparison
+ 📈 Graph
- 📈 Hide Graph
0 Tooltip : Ø57.4 (51.9-64.3)
XMG Fusion 15 (Early 24): Ø61.2 (55.7-67)
NVIDIA GeForce RTX 4070 Laptop GPU
max:
NVIDIA GeForce RTX 4070 Laptop GPU
max:
NVIDIA GeForce RTX 4070 Laptop GPU
max:
» With all tested laptops playable in detail settings high.
Additional Benchmarks
Low Preset 1280x720
87.4 [X] SCHENKER XMG Fusion 15 (Early 24) Intel Core i9-14900HX 1.6GHz
NVIDIA GeForce RTX 4070 Laptop GPU
min:
39.8 fps, P0.1:
46.2 fps, P1:
58.3 fps, max:
120.8 fps
0 100 Tooltip 16X 2024: Ø92.2 (84.9-98.2)
Predator Helios Neo 16 PHN16-72: Ø106.3 (97-119.3)
NVIDIA GeForce RTX 4070 Laptop GPU
max:
77.3 [X] Aorus 16X 2024 Intel Core i9-14900HX 1.6GHz
NVIDIA GeForce RTX 4070 Laptop GPU
min:
34.5 fps, P0.1:
43.5 fps, P1:
53.1 fps, max:
132.9 fps
83.7 94.3 [X] XMG Pro 15 E23 Intel Core i9-13900HX 1.6GHz
NVIDIA GeForce RTX 4070 Laptop GPU
min:
47 fps, P0.1:
64.6 fps, P1:
68.9 fps, max:
149.7 fps
101.4 [X] Acer Predator Helios Neo 16 PHN16-72 Intel Core i7-14700HX 3.9GHz
NVIDIA GeForce RTX 4070 Laptop GPU
min:
62.9 fps, P0.1:
69.2 fps, P1:
75.1 fps, max:
161.2 fps
103.4 104.2 ~ 94 fps
+ Compare
- Hide Comparison
+ 📈 Graph
- 📈 Hide Graph
0 100 Tooltip 16X 2024: Ø77.2 (66.1-112.5)
: Ø93.7 (87.7-110.2)
Predator Helios Neo 16 PHN16-72: Ø100.6 (93.1-115.7)
NVIDIA GeForce RTX 4070 Laptop GPU
max:
58.5 71.7 [X] XMG Pro 15 E23 Intel Core i9-13900HX 1.6GHz
NVIDIA GeForce RTX 4070 Laptop GPU
min:
50.6 fps, P0.1:
55.2 fps, P1:
59.2 fps, max:
126.4 fps
73.2 73.4 [X] Aorus 16X 2024 Intel Core i9-14900HX 1.6GHz
NVIDIA GeForce RTX 4070 Laptop GPU
min:
33.4 fps, P0.1:
39 fps, P1:
54 fps, max:
113.3 fps
75.4 79.8 [X] Acer Predator Helios Neo 16 PHN16-72 Intel Core i7-14700HX 3.9GHz
NVIDIA GeForce RTX 4070 Laptop GPU
min:
56.3 fps, P0.1:
58 fps, P1:
63.6 fps, max:
133 fps
~ 72 fps
+ Compare
- Hide Comparison
+ 📈 Graph
- 📈 Hide Graph
0 Tooltip : Ø71.6 (65.5-83.2)
16X 2024: Ø73.2 (69.2-78.2)
Predator Helios Neo 16 PHN16-72: Ø79.8 (71.1-92.1)
...
NVIDIA GeForce RTX 4070 Laptop GPU
...
max:
53.2 64.4 65.4 70.3 [X] XMG Pro 15 E23 Intel Core i9-13900HX 1.6GHz
NVIDIA GeForce RTX 4070 Laptop GPU
min:
55.5 fps, P0.1:
56.1 fps, P1:
58.3 fps, max:
143.2 fps
71.1 [X] Aorus 16X 2024 Intel Core i9-14900HX 1.6GHz
NVIDIA GeForce RTX 4070 Laptop GPU
min:
30.5 fps, P0.1:
44 fps, P1:
51.9 fps, max:
119 fps
76.7 [X] Acer Predator Helios Neo 16 PHN16-72 Intel Core i7-14700HX 3.9GHz
NVIDIA GeForce RTX 4070 Laptop GPU
min:
55 fps, P0.1:
57.7 fps, P1:
62 fps, max:
127.1 fps
~ 67 fps
+ Compare
- Hide Comparison
+ 📈 Graph
- 📈 Hide Graph
0 Tooltip : Ø70.2 (63.1-91.2)
16X 2024: Ø70.6 (66.4-75.8)
Predator Helios Neo 16 PHN16-72: Ø76.4 (69.4-90.6)
NVIDIA GeForce RTX 4070 Laptop GPU
...
max:
40.3 49.9 54 [X] XMG Pro 15 E23 Intel Core i9-13900HX 1.6GHz
NVIDIA GeForce RTX 4070 Laptop GPU
min:
44.2 fps, P0.1:
45.2 fps, P1:
47.1 fps, max:
78.2 fps
54.5 [X] Aorus 16X 2024 Intel Core i9-14900HX 1.6GHz
NVIDIA GeForce RTX 4070 Laptop GPU
min:
41.8 fps, P0.1:
42.4 fps, P1:
45 fps, max:
86.5 fps
56.1 59.1 [X] Acer Predator Helios Neo 16 PHN16-72 Intel Core i7-14700HX 3.9GHz
NVIDIA GeForce RTX 4070 Laptop GPU
min:
46.9 fps, P0.1:
47.4 fps, P1:
49.9 fps, max:
86.9 fps
~ 52 fps
+ Compare
- Hide Comparison
+ 📈 Graph
- 📈 Hide Graph
0 Tooltip : Ø53.6 (50.4-60.8)
16X 2024: Ø54.3 (50.2-59.4)
Predator Helios Neo 16 PHN16-72: Ø59.1 (54.7-68.4)
NVIDIA GeForce RTX 4070 Laptop GPU
...
max:
NVIDIA GeForce RTX 4070 Laptop GPU
max:
NVIDIA GeForce RTX 4070 Laptop GPU
max:
» With all tested laptops playable in detail settings ultra.
185.9 [X] Aorus 16X 2024 Intel Core i9-14900HX 1.6GHz
NVIDIA GeForce RTX 4070 Laptop GPU
min:
13.1 fps, P0.1:
37.4 fps, P1:
101.7 fps, max:
606 fps
212 [X] XMG Pro 15 E23 Intel Core i9-13900HX 1.6GHz
NVIDIA GeForce RTX 4070 Laptop GPU
min:
35 fps
222 [X] SCHENKER XMG Fusion 15 (Early 24) Intel Core i9-14900HX 1.6GHz
NVIDIA GeForce RTX 4070 Laptop GPU
min:
5.6 fps, P0.1:
15 fps, P1:
155.7 fps, max:
455 fps
~ 207 fps
+ Compare
- Hide Comparison
+ 📈 Graph
- 📈 Hide Graph
0 100 200 Tooltip 16X 2024: Ø185.6 (138.7-241)
XMG Fusion 15 (Early 24): Ø222 (123.9-294)
NVIDIA GeForce RTX 4070 Laptop GPU
...
max:
157.3 [X] Aorus 16X 2024 Intel Core i9-14900HX 1.6GHz
NVIDIA GeForce RTX 4070 Laptop GPU
min:
9.8 fps, P0.1:
31.5 fps, P1:
82.6 fps, max:
373 fps
191 [X] XMG Pro 15 E23 Intel Core i9-13900HX 1.6GHz
NVIDIA GeForce RTX 4070 Laptop GPU
min:
19 fps
209 [X] SCHENKER XMG Fusion 15 (Early 24) Intel Core i9-14900HX 1.6GHz
NVIDIA GeForce RTX 4070 Laptop GPU
min:
12.8 fps, P0.1:
42.5 fps, P1:
141.5 fps, max:
417 fps
~ 186 fps
+ Compare
- Hide Comparison
+ 📈 Graph
- 📈 Hide Graph
0 100 200 Tooltip 16X 2024: Ø157.9 (113.7-196.9)
XMG Fusion 15 (Early 24): Ø207 (152.4-247)
NVIDIA GeForce RTX 4070 Laptop GPU
...
max:
151.1 [X] Aorus 16X 2024 Intel Core i9-14900HX 1.6GHz
NVIDIA GeForce RTX 4070 Laptop GPU
min:
31.4 fps, P0.1:
49.8 fps, P1:
75.8 fps, max:
399 fps
178 [X] XMG Pro 15 E23 Intel Core i9-13900HX 1.6GHz
NVIDIA GeForce RTX 4070 Laptop GPU
min:
72 fps
196.5 [X] SCHENKER XMG Fusion 15 (Early 24) Intel Core i9-14900HX 1.6GHz
NVIDIA GeForce RTX 4070 Laptop GPU
min:
34.5 fps, P0.1:
80.1 fps, P1:
126.5 fps, max:
368 fps
~ 175 fps
+ Compare
- Hide Comparison
+ 📈 Graph
- 📈 Hide Graph
0 100 200 Tooltip 16X 2024: Ø151.1 (121.6-182)
XMG Fusion 15 (Early 24): Ø196 (154-237)
NVIDIA GeForce RTX 4070 Laptop GPU
...
max:
114 [X] XMG Pro 15 E23 Intel Core i9-13900HX 1.6GHz
NVIDIA GeForce RTX 4070 Laptop GPU
min:
18 fps
124.7 [X] Aorus 16X 2024 Intel Core i9-14900HX 1.6GHz
NVIDIA GeForce RTX 4070 Laptop GPU
min:
21.3 fps, P0.1:
36.4 fps, P1:
57.1 fps, max:
284 fps
126 [X] SCHENKER XMG Fusion 15 (Early 24) Intel Core i9-14900HX 1.6GHz
NVIDIA GeForce RTX 4070 Laptop GPU
min:
31.5 fps, P0.1:
37.7 fps, P1:
88.8 fps, max:
270 fps
~ 122 fps
+ Compare
- Hide Comparison
+ 📈 Graph
- 📈 Hide Graph
0 100 Tooltip 16X 2024: Ø124.4 (109.6-148.3)
XMG Fusion 15 (Early 24): Ø125.7 (112.2-143)
NVIDIA GeForce RTX 4070 Laptop GPU
...
max:
64.7 [X] Aorus 16X 2024 Intel Core i9-14900HX 1.6GHz
NVIDIA GeForce RTX 4070 Laptop GPU
min:
22.8 fps, P0.1:
23.8 fps, P1:
30.9 fps, max:
202 fps
72 [X] XMG Pro 15 E23 Intel Core i9-13900HX 1.6GHz
NVIDIA GeForce RTX 4070 Laptop GPU
min:
29 fps
76.6 [X] SCHENKER XMG Fusion 15 (Early 24) Intel Core i9-14900HX 1.6GHz
NVIDIA GeForce RTX 4070 Laptop GPU
min:
24.8 fps, P0.1:
34.2 fps, P1:
53.6 fps, max:
195 fps
~ 71 fps
+ Compare
- Hide Comparison
+ 📈 Graph
- 📈 Hide Graph
0 Tooltip 16X 2024: Ø64.4 (45-78.6)
XMG Fusion 15 (Early 24): Ø76.3 (69.9-85.1)
NVIDIA GeForce RTX 4070 Laptop GPU
max:
NVIDIA GeForce RTX 4070 Laptop GPU
max:
NVIDIA GeForce RTX 4070 Laptop GPU
max:
» With all tested laptops playable in detail settings ultra.
0 100 200 Tooltip 16X 2024: Ø170.1 (143.3-242)
NVIDIA GeForce RTX 4070 Laptop GPU
max:
0 100 200 300 Tooltip 16X 2024: Ø156.3 (138.1-196.9)
: Ø209 (180.454-359.9)
...
NVIDIA GeForce RTX 4070 Laptop GPU
...
max:
0 100 200 Tooltip 16X 2024: Ø156.3 (138.6-214)
: Ø179.3 (135.02-201.158)
...
NVIDIA GeForce RTX 4070 Laptop GPU
max:
0 100 Tooltip 16X 2024: Ø133.8 (124.7-141.9)
: Ø142.3 (134.297-152.9)
...
NVIDIA GeForce RTX 4070 Laptop GPU
max:
0 Tooltip 16X 2024: Ø80.3 (75.4-85.3)
: Ø82.7 (76.13-95.7)
NVIDIA GeForce RTX 4070 Laptop GPU
max:
NVIDIA GeForce RTX 4070 Laptop GPU
max:
» With all tested laptops playable in detail settings ultra.
...
NVIDIA GeForce RTX 4070 Laptop GPU
max:
...
NVIDIA GeForce RTX 4070 Laptop GPU
...
max:
...
NVIDIA GeForce RTX 4070 Laptop GPU
...
max:
...
NVIDIA GeForce RTX 4070 Laptop GPU
...
max:
NVIDIA GeForce RTX 4070 Laptop GPU
max:
NVIDIA GeForce RTX 4070 Laptop GPU
max:
NVIDIA GeForce RTX 4070 Laptop GPU
max:
» With all tested laptops playable in detail settings ultra.
...
NVIDIA GeForce RTX 4070 Laptop GPU
max:
...
NVIDIA GeForce RTX 4070 Laptop GPU
max:
0 100 Tooltip Omen Transcend 16-u1095ng: Ø96.3 (87.233-140.9)
: Ø110.1 (101.367-132.77)
...
NVIDIA GeForce RTX 4070 Laptop GPU
max:
0 100 Tooltip Omen Transcend 16-u1095ng: Ø94.4 (85.283-135.1)
: Ø111.9 (97.012-184.3)
...
NVIDIA GeForce RTX 4070 Laptop GPU
max:
0 100 Tooltip Omen Transcend 16-u1095ng: Ø75.4 (65.024-143.6)
: Ø81 (70.714-165.1)
NVIDIA GeForce RTX 4070 Laptop GPU
max:
NVIDIA GeForce RTX 4070 Laptop GPU
max:
» With all tested laptops playable in detail settings ultra.
0 100 200 300 400 500 600 700 800 900 1000 1100 1200 1300 1400 1500 1600 1700 1800 1900 2000 2100 2200 2300 2400 2500 2600 2700 2800 2900 3000 3100 3200 3300 3400 3500 3600 Tooltip
...
NVIDIA GeForce RTX 4070 Laptop GPU
max:
0 100 Tooltip : Ø64.2 (54.092-80.57)
Omen Transcend 16-u1095ng: Ø74.3 (57.257-127.7)
...
NVIDIA GeForce RTX 4070 Laptop GPU
max:
0 100 200 Tooltip : Ø62.8 (42.374-273)
Omen Transcend 16-u1095ng: Ø60 (47.357-116)
...
NVIDIA GeForce RTX 4070 Laptop GPU
max:
0 100 Tooltip : Ø48.4 (34.107-108.9)
Omen Transcend 16-u1095ng: Ø43.8 (36.122-52.21)
NVIDIA GeForce RTX 4070 Laptop GPU
max:
0 100 200 300 400 500 600 700 800 900 1000 1100 1200 1300 1400 1500 1600 1700 1800 1900 2000 Tooltip
NVIDIA GeForce RTX 4070 Laptop GPU
max:
NVIDIA GeForce RTX 4070 Laptop GPU
max:
» With all tested laptops playable in detail settings ultra.
...
NVIDIA GeForce RTX 4070 Laptop GPU
max:
0 100 Tooltip Omen Transcend 16-u1095ng: Ø104.9 (91.764-125.2)
: Ø111.7 (94.145-120.917)
...
NVIDIA GeForce RTX 4070 Laptop GPU
max:
0 100 Tooltip Omen Transcend 16-u1095ng: Ø103.9 (86.01-182.6)
: Ø112.3 (90.43-133)
...
NVIDIA GeForce RTX 4070 Laptop GPU
max:
0 100 Tooltip Omen Transcend 16-u1095ng: Ø74.3 (63.39-117.4)
: Ø83.2 (73.044-92.521)
NVIDIA GeForce RTX 4070 Laptop GPU
max:
NVIDIA GeForce RTX 4070 Laptop GPU
max:
0 100 200 300 400 500 600 700 800 900 1000 1100 1200 1300 1400 1500 1600 1700 1800 1900 2000 2100 2200 2300 2400 2500 2600 2700 2800 2900 3000 3100 3200 3300 3400 3500 3600 3700 3800 3900 4000 Tooltip
NVIDIA GeForce RTX 4070 Laptop GPU
max:
» With all tested laptops playable in detail settings ultra.
...
NVIDIA GeForce RTX 4070 Laptop GPU
max:
0 100 200 300 400 500 600 Tooltip : Ø364 (343.04-445.4)
Omen Transcend 16-u1095ng: Ø374 (334.32-674)
...
NVIDIA GeForce RTX 4070 Laptop GPU
max:
0 100 200 300 400 500 600 Tooltip : Ø372 (347.37-638)
Omen Transcend 16-u1095ng: Ø361 (337.389-391)
...
NVIDIA GeForce RTX 4070 Laptop GPU
max:
0 100 200 300 Tooltip Omen Transcend 16-u1095ng: Ø327 (270.683-359.102)
: Ø359 (333.279-366.55)
NVIDIA GeForce RTX 4070 Laptop GPU
max:
NVIDIA GeForce RTX 4070 Laptop GPU
max:
» With all tested laptops playable in detail settings ultra.
...
NVIDIA GeForce RTX 4070 Laptop GPU
max:
0 100 200 Tooltip Omen Transcend 16-u1095ng: Ø195.7 (143.2-221.52)
: Ø210 (144.08-254.162)
...
NVIDIA GeForce RTX 4070 Laptop GPU
max:
0 100 200 300 Tooltip Omen Transcend 16-u1095ng: Ø138.2 (110.01-198.5)
: Ø167.6 (116.092-334)
...
NVIDIA GeForce RTX 4070 Laptop GPU
...
max:
0 100 200 Tooltip Omen Transcend 16-u1095ng: Ø90.8 (69.665-185.9)
: Ø107.7 (76.64-214.5)
NVIDIA GeForce RTX 4070 Laptop GPU
max:
NVIDIA GeForce RTX 4070 Laptop GPU
max:
NVIDIA GeForce RTX 4070 Laptop GPU
max:
» With all tested laptops playable in detail settings ultra.
...
NVIDIA GeForce RTX 4070 Laptop GPU
max:
0 100 200 Tooltip Omen Transcend 16-u1095ng: Ø172.8 (143.08-212.4)
: Ø184.4 (159.297-206.8)
...
NVIDIA GeForce RTX 4070 Laptop GPU
...
max:
0 100 200 Tooltip Omen Transcend 16-u1095ng: Ø133.9 (111.31-162)
: Ø161.2 (124.203-203.8)
...
NVIDIA GeForce RTX 4070 Laptop GPU
max:
0 100 200 300 400 500 600 700 800 900 1000 1100 1200 1300 1400 1500 1600 1700 1800 1900 2000 2100 2200 2300 2400 2500 Tooltip Omen Transcend 16-u1095ng: Ø87.6 (71.05-138.7)
: Ø203 (80.026-2581)
NVIDIA GeForce RTX 4070 Laptop GPU
max:
NVIDIA GeForce RTX 4070 Laptop GPU
max:
NVIDIA GeForce RTX 4070 Laptop GPU
max:
» With all tested laptops playable in detail settings ultra.
Additional Benchmarks
Epic Preset + Epic RTX Global Illumination 1920x1080
142.2 [X] XMG Pro 15 E23 Intel Core i9-13900HX 1.6GHz
NVIDIA GeForce RTX 4070 Laptop GPU
min:
59.3 fps, P0.1:
88.9 fps, P1:
106.5 fps, max:
202 fps
...
NVIDIA GeForce RTX 4070 Laptop GPU
max:
...
NVIDIA GeForce RTX 4070 Laptop GPU
max:
...
NVIDIA GeForce RTX 4070 Laptop GPU
max:
49 49 54 [X] Asus ROG Flow X16 GV601VI Intel Core i9-13900H 1.9GHz
NVIDIA GeForce RTX 4070 Laptop GPU
min:
4 fps, max:
78 fps
58 [X] XMG Pro 15 E23 Intel Core i9-13900HX 1.6GHz
NVIDIA GeForce RTX 4070 Laptop GPU
min:
43 fps
62 ~ 54 fps
+ Compare
- Hide Comparison
...
NVIDIA GeForce RTX 4070 Laptop GPU
max:
32 33 38 [X] XMG Pro 15 E23 Intel Core i9-13900HX 1.6GHz
NVIDIA GeForce RTX 4070 Laptop GPU
min:
29 fps
41 42 [X] Asus ROG Flow X16 GV601VI Intel Core i9-13900H 1.9GHz
NVIDIA GeForce RTX 4070 Laptop GPU
min:
27 fps, max:
50 fps
~ 37 fps
+ Compare
- Hide Comparison
NVIDIA GeForce RTX 4070 Laptop GPU
max:
NVIDIA GeForce RTX 4070 Laptop GPU
max:
NVIDIA GeForce RTX 4070 Laptop GPU
max:
» With all tested laptops playable in detail settings ultra.
...
NVIDIA GeForce RTX 4070 Laptop GPU
max:
...
NVIDIA GeForce RTX 4070 Laptop GPU
max:
...
NVIDIA GeForce RTX 4070 Laptop GPU
max:
...
NVIDIA GeForce RTX 4070 Laptop GPU
max:
NVIDIA GeForce RTX 4070 Laptop GPU
max:
NVIDIA GeForce RTX 4070 Laptop GPU
max:
NVIDIA GeForce RTX 4070 Laptop GPU
max:
» With all tested laptops playable in detail settings ultra.
0 100 Tooltip Stealth 16 Mercedes-AMG Motorsport A13VG: Ø93.5 (82.392-121.1)
: Ø97 (84.69-112.7)
...
NVIDIA GeForce RTX 4070 Laptop GPU
max:
0 100 200 300 400 Tooltip Stealth 16 Mercedes-AMG Motorsport A13VG: Ø94.2 (78.85-481)
: Ø91 (77.52-109.793)
...
NVIDIA GeForce RTX 4070 Laptop GPU
max:
0 100 200 Tooltip Stealth 16 Mercedes-AMG Motorsport A13VG: Ø83.3 (66.309-258.8)
: Ø83.9 (69.77-128.5)
...
NVIDIA GeForce RTX 4070 Laptop GPU
max:
0 100 200 300 400 500 600 700 800 900 1000 1100 1200 1300 1400 1500 1600 Tooltip Stealth 16 Mercedes-AMG Motorsport A13VG: Ø122.8 (55.272-1667)
: Ø94.1 (62.526-734)
NVIDIA GeForce RTX 4070 Laptop GPU
max:
NVIDIA GeForce RTX 4070 Laptop GPU
max:
NVIDIA GeForce RTX 4070 Laptop GPU
max:
» With all tested laptops playable in detail settings ultra.
74.3 [X] SCHENKER XMG Fusion 15 (Early 24) Intel Core i9-14900HX 1.6GHz
NVIDIA GeForce RTX 4070 Laptop GPU
min:
33.7 fps, P0.1:
35.4 fps, P1:
40.7 fps, max:
166.3 fps
79.6 [X] XMG Pro 15 E23 Intel Core i9-13900HX 1.6GHz
NVIDIA GeForce RTX 4070 Laptop GPU
min:
34.3 fps, P0.1:
41.6 fps, P1:
52.5 fps, max:
129.2 fps
82.8 [X] Acer Predator Helios Neo 16 PHN16-72 Intel Core i7-14700HX 3.9GHz
NVIDIA GeForce RTX 4070 Laptop GPU
min:
40.8 fps, P0.1:
42.4 fps, P1:
56.8 fps, max:
118.8 fps
~ 79 fps
+ Compare
- Hide Comparison
+ 📈 Graph
- 📈 Hide Graph
0 100 Tooltip XMG Fusion 15 (Early 24): Ø74.3 (70.2-78.6)
: Ø83.8 (71.893-116.9)
Predator Helios Neo 16 PHN16-72: Ø83 (74.9-93)
...
NVIDIA GeForce RTX 4070 Laptop GPU
max:
66.9 71.4 [X] SCHENKER XMG Fusion 15 (Early 24) Intel Core i9-14900HX 1.6GHz
NVIDIA GeForce RTX 4070 Laptop GPU
min:
26.4 fps, P0.1:
31.8 fps, P1:
42.4 fps, max:
160.1 fps
75.7 [X] XMG Pro 15 E23 Intel Core i9-13900HX 1.6GHz
NVIDIA GeForce RTX 4070 Laptop GPU
min:
38.5 fps, P0.1:
47.4 fps, P1:
54.9 fps, max:
116.9 fps
76.3 [X] Acer Predator Helios Neo 16 PHN16-72 Intel Core i7-14700HX 3.9GHz
NVIDIA GeForce RTX 4070 Laptop GPU
min:
23.4 fps, P0.1:
33 fps, P1:
52.2 fps, max:
109.7 fps
~ 73 fps
+ Compare
- Hide Comparison
+ 📈 Graph
- 📈 Hide Graph
0 100 Tooltip Stealth 16 Mercedes-AMG Motorsport A13VG: Ø72.6 (59.74-135.9)
XMG Fusion 15 (Early 24): Ø71.3 (64.2-73.2)
: Ø78.6 (66.089-104.6)
Predator Helios Neo 16 PHN16-72: Ø76.3 (63.3-82.8)
...
NVIDIA GeForce RTX 4070 Laptop GPU
max:
65.1 68.9 [X] Acer Predator Helios Neo 16 PHN16-72 Intel Core i7-14700HX 3.9GHz
NVIDIA GeForce RTX 4070 Laptop GPU
min:
30.8 fps, P0.1:
35.8 fps, P1:
47.5 fps, max:
98.4 fps
70 [X] XMG Pro 15 E23 Intel Core i9-13900HX 1.6GHz
NVIDIA GeForce RTX 4070 Laptop GPU
min:
35.3 fps, P0.1:
37.2 fps, P1:
47.7 fps, max:
126.9 fps
70.1 [X] SCHENKER XMG Fusion 15 (Early 24) Intel Core i9-14900HX 1.6GHz
NVIDIA GeForce RTX 4070 Laptop GPU
min:
30.2 fps, P0.1:
35.2 fps, P1:
41.2 fps, max:
156.8 fps
~ 69 fps
+ Compare
- Hide Comparison
+ 📈 Graph
- 📈 Hide Graph
0 100 200 300 Tooltip Stealth 16 Mercedes-AMG Motorsport A13VG: Ø67.4 (56.033-77.5)
Predator Helios Neo 16 PHN16-72: Ø68.9 (61.7-73.7)
: Ø100 (61.499-311)
XMG Fusion 15 (Early 24): Ø70.1 (58.7-74.8)
...
NVIDIA GeForce RTX 4070 Laptop GPU
max:
40.2 [X] XMG Pro 15 E23 Intel Core i9-13900HX 1.6GHz
NVIDIA GeForce RTX 4070 Laptop GPU
min:
15 fps, P0.1:
19.6 fps, P1:
27.3 fps, max:
129.5 fps
42.3 42.8 [X] SCHENKER XMG Fusion 15 (Early 24) Intel Core i9-14900HX 1.6GHz
NVIDIA GeForce RTX 4070 Laptop GPU
min:
10.4 fps, P0.1:
22.7 fps, P1:
29.2 fps, max:
117 fps
43.8 [X] Acer Predator Helios Neo 16 PHN16-72 Intel Core i7-14700HX 3.9GHz
NVIDIA GeForce RTX 4070 Laptop GPU
min:
12.5 fps, P0.1:
22.8 fps, P1:
27.7 fps, max:
100.7 fps
~ 42 fps
+ Compare
- Hide Comparison
+ 📈 Graph
- 📈 Hide Graph
0 Tooltip : Ø47.4 (36.766-72.1)
Stealth 16 Mercedes-AMG Motorsport A13VG: Ø44.2 (37.053-53.42)
XMG Fusion 15 (Early 24): Ø42.8 (37.9-49)
Predator Helios Neo 16 PHN16-72: Ø43.8 (37.8-47.9)
NVIDIA GeForce RTX 4070 Laptop GPU
max:
0 100 200 300 400 500 600 700 800 900 1000 1100 1200 1300 1400 1500 1600 1700 1800 1900 2000 2100 2200 2300 2400 2500 2600 2700 2800 2900 3000 3100 3200 3300 3400 3500 3600 3700 3800 3900 4000 4100 4200 4300 4400 4500 4600 4700 4800 4900 5000 5100 5200 5300 Tooltip
NVIDIA GeForce RTX 4070 Laptop GPU
max:
NVIDIA GeForce RTX 4070 Laptop GPU
max:
» With all tested laptops playable in detail settings high.
Additional Benchmarks
High Preset + High Ray Tracing 1920x1080
31.7 [X] XMG Pro 15 E23 Intel Core i9-13900HX 1.6GHz
NVIDIA GeForce RTX 4070 Laptop GPU
min:
14.2 fps, P0.1:
15.8 fps, P1:
23.2 fps, max:
95.4 fps
0 100 Tooltip XMG Pro 16 Studio (Mid 23): Ø97.7 (85.635-113.524)
...
NVIDIA GeForce RTX 4070 Laptop GPU
max:
0 100 Tooltip XMG Pro 16 Studio (Mid 23): Ø89.5 (72.51-142.5)
: Ø88.2 (78.03-128.8)
...
NVIDIA GeForce RTX 4070 Laptop GPU
max:
0 100 200 300 Tooltip : Ø68.6 (58.387-163.2)
XMG Pro 16 Studio (Mid 23): Ø80.7 (58.743-382)
...
NVIDIA GeForce RTX 4070 Laptop GPU
...
max:
0 Tooltip : Ø48.2 (42.03-67.8)
XMG Pro 16 Studio (Mid 23): Ø48.3 (42.043-73.7)
...
NVIDIA GeForce RTX 4070 Laptop GPU
max:
0 Tooltip XMG Pro 16 Studio (Mid 23): Ø33.3 (26.095-68.9)
: Ø34 (28.07-69.9)
NVIDIA GeForce RTX 4070 Laptop GPU
max:
NVIDIA GeForce RTX 4070 Laptop GPU
max:
NVIDIA GeForce RTX 4070 Laptop GPU
max:
» With all tested laptops playable in detail settings ultra.
Additional Benchmarks
Low Preset 1280x720
...
NVIDIA GeForce RTX 4070 Laptop GPU
max:
...
NVIDIA GeForce RTX 4070 Laptop GPU
max:
...
NVIDIA GeForce RTX 4070 Laptop GPU
max:
...
NVIDIA GeForce RTX 4070 Laptop GPU
max:
...
NVIDIA GeForce RTX 4070 Laptop GPU
max:
...
NVIDIA GeForce RTX 4070 Laptop GPU
max:
» With all tested laptops playable in detail settings ultra.
Additional Benchmarks
Low Preset 1280x720
143 150 [X] Acer Predator Helios Neo 16 PHN16-72 Intel Core i7-14700HX 3.9GHz
NVIDIA GeForce RTX 4070 Laptop GPU
min:
24 fps, max:
193 fps
~ 147 fps
+ Compare
- Hide Comparison
...
NVIDIA GeForce RTX 4070 Laptop GPU
max:
132 137 [X] XMG Pro 15 E23 Intel Core i9-13900HX 1.6GHz
NVIDIA GeForce RTX 4070 Laptop GPU
min:
8 fps
141 [X] Acer Predator Helios Neo 16 PHN16-72 Intel Core i7-14700HX 3.9GHz
NVIDIA GeForce RTX 4070 Laptop GPU
min:
33 fps, max:
183 fps
~ 137 fps
+ Compare
- Hide Comparison
...
NVIDIA GeForce RTX 4070 Laptop GPU
max:
125 129 [X] XMG Pro 15 E23 Intel Core i9-13900HX 1.6GHz
NVIDIA GeForce RTX 4070 Laptop GPU
min:
10 fps
133 [X] Acer Predator Helios Neo 16 PHN16-72 Intel Core i7-14700HX 3.9GHz
NVIDIA GeForce RTX 4070 Laptop GPU
min:
68 fps, max:
173 fps
~ 129 fps
+ Compare
- Hide Comparison
...
NVIDIA GeForce RTX 4070 Laptop GPU
max:
97 [X] XMG Pro 15 E23 Intel Core i9-13900HX 1.6GHz
NVIDIA GeForce RTX 4070 Laptop GPU
min:
16 fps
97 [X] Asus ROG Flow X16 GV601VI Intel Core i9-13900H 1.9GHz
NVIDIA GeForce RTX 4070 Laptop GPU
min:
137 fps, max:
139 fps
99 99 [X] Acer Predator Helios Neo 16 PHN16-72 Intel Core i7-14700HX 3.9GHz
NVIDIA GeForce RTX 4070 Laptop GPU
min:
3 fps, P0.1:
25 fps, P1:
57 fps, max:
139 fps
~ 98 fps
+ Compare
- Hide Comparison
...
NVIDIA GeForce RTX 4070 Laptop GPU
...
max:
74 [X] XMG Pro 15 E23 Intel Core i9-13900HX 1.6GHz
NVIDIA GeForce RTX 4070 Laptop GPU
min:
2 fps
75 78 [X] Asus ROG Flow X16 GV601VI Intel Core i9-13900H 1.9GHz
NVIDIA GeForce RTX 4070 Laptop GPU
min:
21 fps, max:
107 fps
80 [X] Acer Predator Helios Neo 16 PHN16-72 Intel Core i7-14700HX 3.9GHz
NVIDIA GeForce RTX 4070 Laptop GPU
min:
4 fps, max:
115 fps
~ 77 fps
+ Compare
- Hide Comparison
...
NVIDIA GeForce RTX 4070 Laptop GPU
max:
NVIDIA GeForce RTX 4070 Laptop GPU
max:
NVIDIA GeForce RTX 4070 Laptop GPU
max:
» With all tested laptops playable in detail settings ultra.
...
NVIDIA GeForce RTX 4070 Laptop GPU
max:
...
NVIDIA GeForce RTX 4070 Laptop GPU
max:
...
NVIDIA GeForce RTX 4070 Laptop GPU
...
max:
NVIDIA GeForce RTX 4070 Laptop GPU
max:
NVIDIA GeForce RTX 4070 Laptop GPU
max:
» With all tested laptops playable in detail settings ultra.
0 100 200 Tooltip Stealth 16 Mercedes-AMG Motorsport A13VG: Ø164.6 (108.6-290.6)
: Ø182.5 (120.15-266.58)
...
NVIDIA GeForce RTX 4070 Laptop GPU
max:
0 100 200 Tooltip Stealth 16 Mercedes-AMG Motorsport A13VG: Ø160.8 (94.19-222.8)
: Ø182.6 (123.35-235.8)
...
NVIDIA GeForce RTX 4070 Laptop GPU
max:
0 100 200 Tooltip Stealth 16 Mercedes-AMG Motorsport A13VG: Ø135.7 (94.386-256.7)
: Ø136.5 (72.501-202.235)
...
NVIDIA GeForce RTX 4070 Laptop GPU
max:
0 100 Tooltip Stealth 16 Mercedes-AMG Motorsport A13VG: Ø96.4 (51.208-179)
: Ø98.3 (83.287-124.58)
NVIDIA GeForce RTX 4070 Laptop GPU
max:
NVIDIA GeForce RTX 4070 Laptop GPU
max:
» With all tested laptops playable in detail settings ultra.
...
NVIDIA GeForce RTX 4070 Laptop GPU
...
max:
81.6 [X] Aorus 16X 2024 2.02
Intel Core i9-14900HX 1.6GHz
NVIDIA GeForce RTX 4070 Laptop GPU
min:
35.7 fps, max:
105.8 fps
87.6 [X] Dell XPS 16 9640 2.11
Intel Core Ultra 7 155H 3.8GHz
NVIDIA GeForce RTX 4070 Laptop GPU
min:
71.6 fps, max:
106.8 fps
90 99.4 106.3 [X] Acer Predator Helios Neo 16 PHN16-72 2.02
Intel Core i7-14700HX 3.9GHz
NVIDIA GeForce RTX 4070 Laptop GPU
min:
48.6 fps, max:
132.5 fps
106.8 113.2 114.1 [X] Alienware m16 R2 2.02
Intel Core Ultra 7 155H 3.8GHz
NVIDIA GeForce RTX 4070 Laptop GPU
min:
12.9 fps, max:
155 fps
117.1 118.1 118.9 120 [X] XMG Pro 15 E23 Intel Core i9-13900HX 1.6GHz
NVIDIA GeForce RTX 4070 Laptop GPU
min:
44 fps
124 124.5 [X] SCHENKER XMG Fusion 15 (Early 24) 2.02
Intel Core i9-14900HX 1.6GHz
NVIDIA GeForce RTX 4070 Laptop GPU
min:
74.3 fps, max:
174.7 fps
~ 109 fps
+ Compare
- Hide Comparison
...
NVIDIA GeForce RTX 4070 Laptop GPU
...
max:
74.7 [X] Dell XPS 16 9640 2.11
Intel Core Ultra 7 155H 3.8GHz
NVIDIA GeForce RTX 4070 Laptop GPU
min:
62.9 fps, max:
92.9 fps
76.9 [X] Aorus 16X 2024 2.02
Intel Core i9-14900HX 1.6GHz
NVIDIA GeForce RTX 4070 Laptop GPU
min:
28.4 fps, max:
98.5 fps
77 84.4 90.5 91.5 [X] Asus ROG Flow X16 GV601VI 2.01
Intel Core i9-13900H 1.9GHz
NVIDIA GeForce RTX 4070 Laptop GPU
min:
31.4 fps, max:
136.5 fps
95.6 [X] Alienware m16 R2 2.02
Intel Core Ultra 7 155H 3.8GHz
NVIDIA GeForce RTX 4070 Laptop GPU
min:
35.4 fps, max:
135.1 fps
96.4 [X] Acer Predator Helios Neo 16 PHN16-72 2.02
Intel Core i7-14700HX 3.9GHz
NVIDIA GeForce RTX 4070 Laptop GPU
min:
37.7 fps, max:
144 fps
98.3 99.4 99.6 100.2 102 [X] XMG Pro 15 E23 Intel Core i9-13900HX 1.6GHz
NVIDIA GeForce RTX 4070 Laptop GPU
min:
52 fps
102.2 103.6 [X] SCHENKER XMG Fusion 15 (Early 24) Intel Core i9-14900HX 1.6GHz
NVIDIA GeForce RTX 4070 Laptop GPU
~ 93 fps
+ Compare
- Hide Comparison
...
NVIDIA GeForce RTX 4070 Laptop GPU
...
max:
64.3 [X] Dell XPS 16 9640 2.11
Intel Core Ultra 7 155H 3.8GHz
NVIDIA GeForce RTX 4070 Laptop GPU
min:
53.3 fps, max:
83.8 fps
69 73.9 75.8 [X] Aorus 16X 2024 2.02
Intel Core i9-14900HX 1.6GHz
NVIDIA GeForce RTX 4070 Laptop GPU
min:
32.9 fps, max:
129.2 fps
76.9 83.1 [X] Alienware m16 R2 2.02
Intel Core Ultra 7 155H 3.8GHz
NVIDIA GeForce RTX 4070 Laptop GPU
min:
28.4 fps, max:
132.1 fps
83.3 [X] Acer Predator Helios Neo 16 PHN16-72 2.02
Intel Core i7-14700HX 3.9GHz
NVIDIA GeForce RTX 4070 Laptop GPU
min:
37.9 fps, max:
130.8 fps
83.5 [X] Asus ROG Flow X16 GV601VI 2.01
Intel Core i9-13900H 1.9GHz
NVIDIA GeForce RTX 4070 Laptop GPU
min:
36.5 fps, max:
126.2 fps
84 [X] Aorus 16X 2024 2.02, Turbo
Intel Core i9-14900HX 1.6GHz
NVIDIA GeForce RTX 4070 Laptop GPU
min:
35.6 fps, max:
130.7 fps
85.2 86.3 87 [X] SCHENKER XMG Fusion 15 (Early 24) 2.02
Intel Core i9-14900HX 1.6GHz
NVIDIA GeForce RTX 4070 Laptop GPU
min:
55.2 fps, max:
134 fps
87.1 87.9 88.6 89.5 [X] XMG Pro 15 E23 Intel Core i9-13900HX 1.6GHz
NVIDIA GeForce RTX 4070 Laptop GPU
min:
53 fps
90.5 [X] Acer Predator Helios Neo 16 PHN16-72 2.02, Turbo
Intel Core i7-14700HX 3.9GHz
NVIDIA GeForce RTX 4070 Laptop GPU
min:
25.3 fps, max:
139.5 fps
90.7 [X] SCHENKER XMG Fusion 15 (Early 24) 2.02, Overboost
Intel Core i9-14900HX 1.6GHz
NVIDIA GeForce RTX 4070 Laptop GPU
min:
67.4 fps, max:
143.1 fps
~ 83 fps
+ Compare
- Hide Comparison
...
NVIDIA GeForce RTX 4070 Laptop GPU
max:
39.6 [X] Dell XPS 16 9640 2.11
Intel Core Ultra 7 155H 3.8GHz
NVIDIA GeForce RTX 4070 Laptop GPU
min:
32.7 fps, max:
51.5 fps
43.6 43.7 47.8 49.4 [X] Aorus 16X 2024 2.02
Intel Core i9-14900HX 1.6GHz
NVIDIA GeForce RTX 4070 Laptop GPU
min:
29.5 fps, max:
75.5 fps
51.4 51.7 [X] Acer Predator Helios Neo 16 PHN16-72 Intel Core i7-14700HX 3.9GHz
NVIDIA GeForce RTX 4070 Laptop GPU
51.8 51.9 [X] Aorus 16X 2024 2.02, Turbo
Intel Core i9-14900HX 1.6GHz
NVIDIA GeForce RTX 4070 Laptop GPU
min:
32.6 fps, max:
120.6 fps
52.1 52.6 [X] SCHENKER XMG Fusion 15 (Early 24) 2.02
Intel Core i9-14900HX 1.6GHz
NVIDIA GeForce RTX 4070 Laptop GPU
min:
39.5 fps, max:
76.8 fps
52.7 [X] Alienware m16 R2 2.02
Intel Core Ultra 7 155H 3.8GHz
NVIDIA GeForce RTX 4070 Laptop GPU
min:
40.5 fps, max:
73.7 fps
52.8 53 [X] Acer Predator Helios Neo 16 PHN16-72 2.02, Turbo
Intel Core i7-14700HX 3.9GHz
NVIDIA GeForce RTX 4070 Laptop GPU
min:
33.8 fps, max:
124.3 fps
54.9 [X] Asus ROG Flow X16 GV601VI 2.01
Intel Core i9-13900H 1.9GHz
NVIDIA GeForce RTX 4070 Laptop GPU
min:
29.8 fps, max:
78.1 fps
55.4 [X] XMG Pro 15 E23 Intel Core i9-13900HX 1.6GHz
NVIDIA GeForce RTX 4070 Laptop GPU
min:
43 fps
55.6 [X] SCHENKER XMG Fusion 15 (Early 24) 2.02, Overboost
Intel Core i9-14900HX 1.6GHz
NVIDIA GeForce RTX 4070 Laptop GPU
min:
42.5 fps, max:
79.9 fps
57.1 ~ 51 fps
+ Compare
- Hide Comparison
...
NVIDIA GeForce RTX 4070 Laptop GPU
...
max:
...
NVIDIA GeForce RTX 4070 Laptop GPU
...
max:
NVIDIA GeForce RTX 4070 Laptop GPU
max:
» With all tested laptops playable in detail settings ultra.
Additional Benchmarks
Low Preset (FSR off) 1280x720
126.2 [X] Alienware m16 R2 2.02
Intel Core Ultra 7 155H 3.8GHz
NVIDIA GeForce RTX 4070 Laptop GPU
min:
74.7 fps, max:
159.7 fps
149.9 [X] Acer Predator Helios Neo 16 PHN16-72 Intel Core i7-14700HX 3.9GHz
NVIDIA GeForce RTX 4070 Laptop GPU
min:
27.8 fps, max:
190.5 fps
120.6 [X] Aorus 16X 2024 Intel Core i9-14900HX 1.6GHz
NVIDIA GeForce RTX 4070 Laptop GPU
min:
40.9 fps, max:
193.9 fps
175.5 [X] SCHENKER XMG Fusion 15 (Early 24) Intel Core i9-14900HX 1.6GHz
NVIDIA GeForce RTX 4070 Laptop GPU
min:
96 fps, max:
232 fps
Ray Tracing Ultra Preset (DLSS off) 1920x1080
41.2 [X] XMG Pro 15 E23 Intel Core i9-13900HX 1.6GHz
NVIDIA GeForce RTX 4070 Laptop GPU
min:
30 fps
42.4 [X] Alienware m16 R2 2.02
Intel Core Ultra 7 155H 3.8GHz
NVIDIA GeForce RTX 4070 Laptop GPU
min:
28.4 fps, max:
54.2 fps
43.4 [X] Acer Predator Helios Neo 16 PHN16-72 Intel Core i7-14700HX 3.9GHz
NVIDIA GeForce RTX 4070 Laptop GPU
min:
19.4 fps, max:
62.5 fps
40.9 [X] Aorus 16X 2024 Intel Core i9-14900HX 1.6GHz
NVIDIA GeForce RTX 4070 Laptop GPU
min:
21.5 fps, max:
64.3 fps
43.4 [X] Aorus 16X 2024 2.02, Turbo
Intel Core i9-14900HX 1.6GHz
NVIDIA GeForce RTX 4070 Laptop GPU
min:
16.1 fps, max:
60 fps
43.8 [X] SCHENKER XMG Fusion 15 (Early 24) Intel Core i9-14900HX 1.6GHz
NVIDIA GeForce RTX 4070 Laptop GPU
min:
34.3 fps, max:
56.5 fps
46.8 [X] SCHENKER XMG Fusion 15 (Early 24) 2.02, Overboost
Intel Core i9-14900HX 1.6GHz
NVIDIA GeForce RTX 4070 Laptop GPU
min:
23.6 fps, max:
96.1 fps
45.2 [X] Acer Predator Helios Neo 16 PHN16-72 2.02, Turbo
Intel Core i7-14700HX 3.9GHz
NVIDIA GeForce RTX 4070 Laptop GPU
min:
25.9 fps, max:
97.3 fps
Steam Deck 1280x720
126.2 [X] Alienware m16 R2 2.02
Intel Core Ultra 7 155H 3.8GHz
NVIDIA GeForce RTX 4070 Laptop GPU
min:
49.8 fps, max:
156.4 fps
146.8 [X] Acer Predator Helios Neo 16 PHN16-72 Intel Core i7-14700HX 3.9GHz
NVIDIA GeForce RTX 4070 Laptop GPU
min:
67.7 fps, max:
185.1 fps
124.8 [X] Aorus 16X 2024 Intel Core i9-14900HX 1.6GHz
NVIDIA GeForce RTX 4070 Laptop GPU
min:
43.6 fps, max:
189.2 fps
174.9 [X] SCHENKER XMG Fusion 15 (Early 24) Intel Core i9-14900HX 1.6GHz
NVIDIA GeForce RTX 4070 Laptop GPU
min:
108.6 fps, max:
226 fps
Ultra Preset (FSR on) 1920x1080
96.5 [X] Alienware m16 R2 2.02
Intel Core Ultra 7 155H 3.8GHz
NVIDIA GeForce RTX 4070 Laptop GPU
min:
49.1 fps, max:
144.5 fps
81.6 [X] Aorus 16X 2024 Intel Core i9-14900HX 1.6GHz
NVIDIA GeForce RTX 4070 Laptop GPU
min:
36.8 fps, max:
149.3 fps
100.9 [X] Aorus 16X 2024 2.02, Turbo
Intel Core i9-14900HX 1.6GHz
NVIDIA GeForce RTX 4070 Laptop GPU
min:
41.3 fps, max:
155.2 fps
Ray Tracing Ultra Preset (DLSS off, no Path Tracing) 3840x2160
7 [X] Alienware m16 R2 2.02
Intel Core Ultra 7 155H 3.8GHz
NVIDIA GeForce RTX 4070 Laptop GPU
min:
1.058 fps, max:
55.6 fps
0 100 200 Tooltip XMG Pro 16 Studio (Mid 23): Ø208 (183.1-250.49)
...
NVIDIA GeForce RTX 4070 Laptop GPU
max:
0 100 200 300 Tooltip XMG Pro 16 Studio (Mid 23): Ø189.1 (163.479-360.8)
: Ø190.1 (169.201-222.43)
...
NVIDIA GeForce RTX 4070 Laptop GPU
max:
0 100 200 300 400 500 600 700 800 900 1000 1100 1200 1300 1400 1500 1600 1700 1800 1900 2000 2100 2200 2300 2400 2500 2600 2700 2800 2900 3000 3100 3200 3300 3400 3500 3600 3700 3800 3900 4000 4100 4200 4300 4400 4500 4600 4700 4800 4900 5000 5100 5200 5300 5400 5500 5600 5700 5800 5900 6000 6100 6200 6300 6400 6500 6600 6700 6800 6900 7000 7100 7200 7300 7400 7500 7600 7700 7800 7900 8000 8100 8200 8300 8400 8500 8600 8700 8800 8900 9000 9100 9200 9300 9400 9500 9600 9700 9800 9900 Tooltip XMG Pro 16 Studio (Mid 23): Ø2033 (143.386-65528)
: Ø170.7 (149.056-245.2)
...
NVIDIA GeForce RTX 4070 Laptop GPU
...
max:
0 100 200 300 Tooltip XMG Pro 16 Studio (Mid 23): Ø142.3 (127.139-163.7)
: Ø156.9 (135.45-337.6)
...
NVIDIA GeForce RTX 4070 Laptop GPU
max:
0 100 Tooltip XMG Pro 16 Studio (Mid 23): Ø104.1 (88.238-148.1)
: Ø101.4 (92.001-124.2)
...
NVIDIA GeForce RTX 4070 Laptop GPU
...
max:
...
NVIDIA GeForce RTX 4070 Laptop GPU
max:
NVIDIA GeForce RTX 4070 Laptop GPU
max:
» With all tested laptops playable in detail settings ultra.
Additional Benchmarks
Low Preset 1280x720
...
NVIDIA GeForce RTX 4070 Laptop GPU
...
max:
...
NVIDIA GeForce RTX 4070 Laptop GPU
...
max:
...
NVIDIA GeForce RTX 4070 Laptop GPU
...
max:
NVIDIA GeForce RTX 4070 Laptop GPU
...
max:
NVIDIA GeForce RTX 4070 Laptop GPU
max:
» With all tested laptops playable in detail settings ultra.
0 100 Tooltip Victus 16-r0077ng: Ø68.1 (56.09-147.9)
: Ø72 (61.176-134.8)
...
NVIDIA GeForce RTX 4070 Laptop GPU
max:
0 Tooltip Victus 16-r0077ng: Ø55.4 (44.399-75.1)
: Ø53.8 (45.232-60.06)
...
NVIDIA GeForce RTX 4070 Laptop GPU
max:
0 Tooltip Victus 16-r0077ng: Ø46.9 (40.372-52.398)
: Ø52.6 (42.494-98.8)
...
NVIDIA GeForce RTX 4070 Laptop GPU
max:
NVIDIA GeForce RTX 4070 Laptop GPU
max:
NVIDIA GeForce RTX 4070 Laptop GPU
max:
» With all tested laptops playable in detail settings ultra.
92.1 [X] Acer Nitro 17 AN17-41-R9LN AMD Ryzen 7 7735HS 3.2GHz
NVIDIA GeForce RTX 4070 Laptop GPU
min:
60.9 fps, P0.1:
61.4 fps, P1:
68.9 fps, max:
132.5 fps
102.5 [X] HP Victus 16-r0077ng Intel Core i7-13700H 1.8GHz
NVIDIA GeForce RTX 4070 Laptop GPU
min:
15.6 fps, P0.1:
45.3 fps, P1:
72.3 fps, max:
149.1 fps
109.7 [X] XMG Pro 15 E23 Intel Core i9-13900HX 1.6GHz
NVIDIA GeForce RTX 4070 Laptop GPU
min:
64.9 fps, P0.1:
73.1 fps, P1:
80.8 fps, max:
164.1 fps
110.1 [X] HP Omen 16-xf0376ng AMD Ryzen 7 7840HS 3.8GHz
NVIDIA GeForce RTX 4070 Laptop GPU
min:
50.7 fps, P0.1:
71 fps, P1:
84.3 fps, max:
142.9 fps
~ 104 fps
+ Compare
- Hide Comparison
+ 📈 Graph
- 📈 Hide Graph
0 100 200 300 Tooltip Nitro 17 AN17-41-R9LN: Ø95.9 (77.82-127.1)
Victus 16-r0077ng: Ø104.6 (84.413-129.1)
: Ø121.9 (92.241-376)
Omen 16-xf0376ng: Ø114.7 (96.401-139.4)
...
NVIDIA GeForce RTX 4070 Laptop GPU
max:
91.1 [X] Acer Nitro 17 AN17-41-R9LN AMD Ryzen 7 7735HS 3.2GHz
NVIDIA GeForce RTX 4070 Laptop GPU
min:
57.6 fps, P0.1:
60.6 fps, P1:
68.5 fps, max:
128.4 fps
101.9 [X] HP Victus 16-r0077ng Intel Core i7-13700H 1.8GHz
NVIDIA GeForce RTX 4070 Laptop GPU
min:
7.91 fps, P0.1:
27.8 fps, P1:
71.5 fps, max:
159.3 fps
109.2 [X] XMG Pro 15 E23 Intel Core i9-13900HX 1.6GHz
NVIDIA GeForce RTX 4070 Laptop GPU
min:
66.5 fps, P0.1:
75.6 fps, P1:
83 fps, max:
177.8 fps
109.4 [X] HP Omen 16-xf0376ng AMD Ryzen 7 7840HS 3.8GHz
NVIDIA GeForce RTX 4070 Laptop GPU
min:
40.2 fps, P0.1:
55 fps, P1:
81.8 fps, max:
151.8 fps
~ 103 fps
+ Compare
- Hide Comparison
+ 📈 Graph
- 📈 Hide Graph
0 100 200 Tooltip Nitro 17 AN17-41-R9LN: Ø93.6 (76.542-123.74)
Victus 16-r0077ng: Ø103.9 (84.816-120.11)
: Ø117.6 (90.94-221.5)
Omen 16-xf0376ng: Ø116.5 (95.909-230.6)
...
NVIDIA GeForce RTX 4070 Laptop GPU
max:
87.2 [X] Acer Nitro 17 AN17-41-R9LN AMD Ryzen 7 7735HS 3.2GHz
NVIDIA GeForce RTX 4070 Laptop GPU
min:
30.4 fps, P0.1:
55.8 fps, P1:
64 fps, max:
125.1 fps
97 [X] HP Victus 16-r0077ng Intel Core i7-13700H 1.8GHz
NVIDIA GeForce RTX 4070 Laptop GPU
min:
17.3 fps, P0.1:
21.6 fps, P1:
65.4 fps, max:
144.1 fps
106.4 [X] XMG Pro 15 E23 Intel Core i9-13900HX 1.6GHz
NVIDIA GeForce RTX 4070 Laptop GPU
min:
37.5 fps, P0.1:
50 fps, P1:
79.5 fps, max:
150.3 fps
107 [X] HP Omen 16-xf0376ng AMD Ryzen 7 7840HS 3.8GHz
NVIDIA GeForce RTX 4070 Laptop GPU
min:
52.8 fps, P0.1:
64 fps, P1:
78.6 fps, max:
148.9 fps
~ 99 fps
+ Compare
- Hide Comparison
+ 📈 Graph
- 📈 Hide Graph
0 100 200 300 400 500 600 700 800 Tooltip Nitro 17 AN17-41-R9LN: Ø89.5 (72.34-114)
Victus 16-r0077ng: Ø99.6 (89.868-110.32)
: Ø110.2 (91.032-151.4)
Omen 16-xf0376ng: Ø135.1 (95.069-874)
...
NVIDIA GeForce RTX 4070 Laptop GPU
max:
0 100 Tooltip Nitro 17 AN17-41-R9LN: Ø80.1 (68.192-104.3)
: Ø86.5 (80.061-113.7)
NVIDIA GeForce RTX 4070 Laptop GPU
max:
NVIDIA GeForce RTX 4070 Laptop GPU
max:
» With all tested laptops playable in detail settings ultra.
56 [X] HP Victus 16-r0077ng Intel Core i7-13700H 1.8GHz
NVIDIA GeForce RTX 4070 Laptop GPU
min:
4.86 fps, P0.1:
8.3 fps, P1:
28.1 fps, max:
110.3 fps
57.1 [X] Acer Nitro 17 AN17-41-R9LN AMD Ryzen 7 7735HS 3.2GHz
NVIDIA GeForce RTX 4070 Laptop GPU
min:
8.95 fps, P0.1:
11.2 fps, P1:
29.5 fps, max:
96.4 fps
57.3 [X] HP Omen 16-xf0376ng AMD Ryzen 7 7840HS 3.8GHz
NVIDIA GeForce RTX 4070 Laptop GPU
min:
8.33 fps, P0.1:
17.1 fps, P1:
31.9 fps, max:
104.5 fps
61.6 [X] XMG Pro 15 E23 Intel Core i9-13900HX 1.6GHz
NVIDIA GeForce RTX 4070 Laptop GPU
min:
9.05 fps, P0.1:
15.8 fps, P1:
38.1 fps, max:
145.6 fps
~ 58 fps
+ Compare
- Hide Comparison
+ 📈 Graph
- 📈 Hide Graph
0 100 Tooltip Victus 16-r0077ng: Ø58.2 (43.37-73.32)
Nitro 17 AN17-41-R9LN: Ø59.9 (42.3-80.2)
Omen 16-xf0376ng: Ø59.5 (45.773-76.6)
: Ø65.2 (47.863-113)
...
NVIDIA GeForce RTX 4070 Laptop GPU
max:
46.1 [X] HP Victus 16-r0077ng Intel Core i7-13700H 1.8GHz
NVIDIA GeForce RTX 4070 Laptop GPU
min:
4.47 fps, P0.1:
6.52 fps, P1:
23.1 fps, max:
96 fps
46.9 [X] Acer Nitro 17 AN17-41-R9LN AMD Ryzen 7 7735HS 3.2GHz
NVIDIA GeForce RTX 4070 Laptop GPU
min:
7.47 fps, P0.1:
13.1 fps, P1:
29.9 fps, max:
85.6 fps
46.9 [X] HP Omen 16-xf0376ng AMD Ryzen 7 7840HS 3.8GHz
NVIDIA GeForce RTX 4070 Laptop GPU
min:
9.42 fps, P0.1:
11 fps, P1:
21.8 fps, max:
104.2 fps
49.9 [X] XMG Pro 15 E23 Intel Core i9-13900HX 1.6GHz
NVIDIA GeForce RTX 4070 Laptop GPU
min:
17.2 fps, P0.1:
19.5 fps, P1:
26.5 fps, max:
138.2 fps
~ 47 fps
+ Compare
- Hide Comparison
+ 📈 Graph
- 📈 Hide Graph
0 100 200 Tooltip Victus 16-r0077ng: Ø50 (34.126-83.5)
Nitro 17 AN17-41-R9LN: Ø55.4 (36.384-243)
Omen 16-xf0376ng: Ø51.4 (30.494-90.8)
: Ø53.2 (41.366-74.2)
...
NVIDIA GeForce RTX 4070 Laptop GPU
max:
0 100 200 300 400 500 600 700 800 Tooltip Nitro 17 AN17-41-R9LN: Ø56.5 (26.088-820)
: Ø38.4 (28.518-89.2)
NVIDIA GeForce RTX 4070 Laptop GPU
max:
NVIDIA GeForce RTX 4070 Laptop GPU
max:
NVIDIA GeForce RTX 4070 Laptop GPU
max:
» With all tested laptops playable in detail settings ultra.
113.2 [X] XMG Pro 15 E23 Intel Core i9-13900HX 1.6GHz
NVIDIA GeForce RTX 4070 Laptop GPU
min:
38.5 fps, P0.1:
48.8 fps, P1:
86.6 fps, max:
147.7 fps
124.7 [X] Acer Nitro 17 AN17-41-R9LN AMD Ryzen 7 7735HS 3.2GHz
NVIDIA GeForce RTX 4070 Laptop GPU
min:
41.4 fps, P0.1:
45.9 fps, P1:
79 fps, max:
186.7 fps
133.8 [X] HP Victus 16-r0077ng Intel Core i7-13700H 1.8GHz
NVIDIA GeForce RTX 4070 Laptop GPU
min:
29.2 fps, P0.1:
33.1 fps, P1:
67.3 fps, max:
190.2 fps
143.1 [X] HP Omen 16-xf0376ng AMD Ryzen 7 7840HS 3.8GHz
NVIDIA GeForce RTX 4070 Laptop GPU
min:
27.6 fps, P0.1:
39.1 fps, P1:
65.7 fps, max:
220 fps
~ 129 fps
+ Compare
- Hide Comparison
+ 📈 Graph
- 📈 Hide Graph
0 100 200 300 Tooltip : Ø115.5 (102.723-135)
Nitro 17 AN17-41-R9LN: Ø127.8 (121.99-140.6)
Victus 16-r0077ng: Ø136.1 (122.033-146.17)
Omen 16-xf0376ng: Ø157.2 (121.66-336.9)
...
NVIDIA GeForce RTX 4070 Laptop GPU
max:
106.5 [X] XMG Pro 15 E23 Intel Core i9-13900HX 1.6GHz
NVIDIA GeForce RTX 4070 Laptop GPU
min:
33.5 fps, P0.1:
57.9 fps, P1:
81.7 fps, max:
161.5 fps
119.9 [X] Acer Nitro 17 AN17-41-R9LN AMD Ryzen 7 7735HS 3.2GHz
NVIDIA GeForce RTX 4070 Laptop GPU
min:
36.1 fps, P0.1:
40.9 fps, P1:
75.7 fps, max:
176.3 fps
126.7 [X] HP Victus 16-r0077ng Intel Core i7-13700H 1.8GHz
NVIDIA GeForce RTX 4070 Laptop GPU
min:
33.8 fps, P0.1:
39.8 fps, P1:
83.7 fps, max:
166.9 fps
132.4 [X] HP Omen 16-xf0376ng AMD Ryzen 7 7840HS 3.8GHz
NVIDIA GeForce RTX 4070 Laptop GPU
min:
29.3 fps, P0.1:
32.4 fps, P1:
59.5 fps, max:
202 fps
~ 121 fps
+ Compare
- Hide Comparison
+ 📈 Graph
- 📈 Hide Graph
0 100 200 300 400 500 Tooltip : Ø108.2 (98.914-129.673)
Nitro 17 AN17-41-R9LN: Ø122.2 (113.351-131.42)
Victus 16-r0077ng: Ø158.2 (124.193-559)
Omen 16-xf0376ng: Ø134.5 (125.029-149.47)
...
NVIDIA GeForce RTX 4070 Laptop GPU
max:
105.3 [X] Acer Nitro 17 AN17-41-R9LN AMD Ryzen 7 7735HS 3.2GHz
NVIDIA GeForce RTX 4070 Laptop GPU
min:
34.2 fps, P0.1:
41.1 fps, P1:
63 fps, max:
169.5 fps
106.1 [X] XMG Pro 15 E23 Intel Core i9-13900HX 1.6GHz
NVIDIA GeForce RTX 4070 Laptop GPU
min:
32.5 fps, P0.1:
50 fps, P1:
71.6 fps, max:
152.1 fps
106.6 [X] HP Victus 16-r0077ng Intel Core i7-13700H 1.8GHz
NVIDIA GeForce RTX 4070 Laptop GPU
min:
23.2 fps, P0.1:
33.1 fps, P1:
76 fps, max:
147.6 fps
111.1 [X] HP Omen 16-xf0376ng AMD Ryzen 7 7840HS 3.8GHz
NVIDIA GeForce RTX 4070 Laptop GPU
min:
21.6 fps, P0.1:
27.8 fps, P1:
46.4 fps, max:
181.8 fps
~ 107 fps
+ Compare
- Hide Comparison
+ 📈 Graph
- 📈 Hide Graph
0 100 Tooltip Nitro 17 AN17-41-R9LN: Ø107 (99.067-116.298)
: Ø109.7 (86.716-127.108)
Victus 16-r0077ng: Ø109.5 (99.472-121.4)
Omen 16-xf0376ng: Ø112.2 (104.441-122.91)
...
NVIDIA GeForce RTX 4070 Laptop GPU
max:
0 100 Tooltip Nitro 17 AN17-41-R9LN: Ø82.3 (76.04-92.56)
: Ø94.1 (79.155-113.2)
NVIDIA GeForce RTX 4070 Laptop GPU
max:
NVIDIA GeForce RTX 4070 Laptop GPU
max:
» With all tested laptops playable in detail settings ultra.
135.7 137.1 [X] Aorus 15 BSF Intel Core i7-13700H 1.8GHz
NVIDIA GeForce RTX 4070 Laptop GPU
min:
24.1 fps, P0.1:
38.7 fps, P1:
92.1 fps, max:
331 fps
155.6 157.2 [X] SCHENKER XMG Fusion 15 (Early 24) Intel Core i9-14900HX 1.6GHz
NVIDIA GeForce RTX 4070 Laptop GPU
min:
40.2 fps, P0.1:
75.8 fps, P1:
132.5 fps, max:
389 fps
162.1 163 [X] Acer Predator Helios Neo 16 PHN16-72 Intel Core i7-14700HX 3.9GHz
NVIDIA GeForce RTX 4070 Laptop GPU
min:
24.8 fps, P0.1:
97.8 fps, P1:
123 fps, max:
260 fps
166.3 168.7 176 ~ 158 fps
+ Compare
- Hide Comparison
+ 📈 Graph
- 📈 Hide Graph
0 100 200 300 400 500 600 700 800 900 1000 1100 1200 1300 1400 1500 1600 1700 1800 1900 2000 2100 2200 2300 2400 2500 Tooltip 15 BSF: Ø232 (122.99-2547)
XMG Fusion 15 (Early 24): Ø157.6 (145.7-167.5)
Predator Helios Neo 16 PHN16-72: Ø163.2 (134.4-184.6)
...
NVIDIA GeForce RTX 4070 Laptop GPU
max:
107.1 113.9 [X] Acer Nitro 17 AN17-41-R9LN AMD Ryzen 7 7735HS 3.2GHz
NVIDIA GeForce RTX 4070 Laptop GPU
min:
26.3 fps, P0.1:
51.9 fps, P1:
87.4 fps, max:
199.7 fps
114.2 [X] Aorus 15 BSF Intel Core i7-13700H 1.8GHz
NVIDIA GeForce RTX 4070 Laptop GPU
min:
6.19 fps, P0.1:
33.9 fps, P1:
79.6 fps, max:
255 fps
115.2 [X] HP Victus 16-r0077ng Intel Core i7-13700H 1.8GHz
NVIDIA GeForce RTX 4070 Laptop GPU
min:
22.2 fps, P0.1:
36.8 fps, P1:
62.2 fps, max:
269 fps
121.2 [X] SCHENKER XMG Fusion 15 (Early 24) Intel Core i9-14900HX 1.6GHz
NVIDIA GeForce RTX 4070 Laptop GPU
min:
40.8 fps, P0.1:
44.2 fps, P1:
102.1 fps, max:
271 fps
125.4 [X] XMG Pro 15 E23 Intel Core i9-13900HX 1.6GHz
NVIDIA GeForce RTX 4070 Laptop GPU
min:
25.6 fps, P0.1:
28.7 fps, P1:
59.4 fps, max:
387 fps
127.9 135.5 [X] Acer Predator Helios Neo 16 PHN16-72 Intel Core i7-14700HX 3.9GHz
NVIDIA GeForce RTX 4070 Laptop GPU
min:
67.6 fps, P0.1:
85.1 fps, P1:
102.1 fps, max:
193.3 fps
136.5 136.6 148.9 150.8 ~ 128 fps
+ Compare
- Hide Comparison
+ 📈 Graph
- 📈 Hide Graph
0 100 Tooltip Nitro 17 AN17-41-R9LN: Ø115.8 (101.176-128.87)
15 BSF: Ø117.3 (98.25-159.1)
Victus 16-r0077ng: Ø119.5 (108.39-149)
XMG Fusion 15 (Early 24): Ø121.2 (114.1-131.1)
: Ø128.9 (118.315-143.4)
Predator Helios Neo 16 PHN16-72: Ø135.6 (124.6-147.6)
...
NVIDIA GeForce RTX 4070 Laptop GPU
max:
89.2 91.4 [X] Aorus 15 BSF Intel Core i7-13700H 1.8GHz
NVIDIA GeForce RTX 4070 Laptop GPU
min:
24.9 fps, P0.1:
32.8 fps, P1:
60.1 fps, max:
208 fps
93.5 95.3 [X] Acer Nitro 17 AN17-41-R9LN AMD Ryzen 7 7735HS 3.2GHz
NVIDIA GeForce RTX 4070 Laptop GPU
min:
24.3 fps, P0.1:
38.4 fps, P1:
71.9 fps, max:
179.7 fps
99.1 [X] HP Victus 16-r0077ng Intel Core i7-13700H 1.8GHz
NVIDIA GeForce RTX 4070 Laptop GPU
min:
27.4 fps, P0.1:
33.1 fps, P1:
50.4 fps, max:
229 fps
105.6 [X] XMG Pro 15 E23 Intel Core i9-13900HX 1.6GHz
NVIDIA GeForce RTX 4070 Laptop GPU
min:
25.5 fps, P0.1:
28.8 fps, P1:
51.7 fps, max:
279 fps
106.1 [X] SCHENKER XMG Fusion 15 (Early 24) Intel Core i9-14900HX 1.6GHz
NVIDIA GeForce RTX 4070 Laptop GPU
min:
40.7 fps, P0.1:
59.1 fps, P1:
89.9 fps, max:
225 fps
115.7 119.1 [X] Acer Predator Helios Neo 16 PHN16-72 Intel Core i7-14700HX 3.9GHz
NVIDIA GeForce RTX 4070 Laptop GPU
min:
67.5 fps, P0.1:
84.5 fps, P1:
92.4 fps, max:
183.2 fps
119.9 128.5 129.3 ~ 108 fps
+ Compare
- Hide Comparison
+ 📈 Graph
- 📈 Hide Graph
0 100 200 300 400 Tooltip 15 BSF: Ø111.9 (84.069-464)
Nitro 17 AN17-41-R9LN: Ø100 (85.573-118.4)
Victus 16-r0077ng: Ø102.8 (93.146-170.8)
: Ø113 (99.079-242.7)
XMG Fusion 15 (Early 24): Ø106.2 (99.8-115)
Predator Helios Neo 16 PHN16-72: Ø119.1 (108.2-129.4)
...
NVIDIA GeForce RTX 4070 Laptop GPU
max:
71.3 88.5 [X] Aorus 15 BSF Intel Core i7-13700H 1.8GHz
NVIDIA GeForce RTX 4070 Laptop GPU
min:
29.4 fps, P0.1:
33.7 fps, P1:
62.1 fps, max:
278 fps
91.8 94.4 [X] Acer Nitro 17 AN17-41-R9LN AMD Ryzen 7 7735HS 3.2GHz
NVIDIA GeForce RTX 4070 Laptop GPU
min:
35.7 fps, P0.1:
43.2 fps, P1:
77.2 fps, max:
205 fps
95.4 [X] HP Victus 16-r0077ng Intel Core i7-13700H 1.8GHz
NVIDIA GeForce RTX 4070 Laptop GPU
min:
26.9 fps, P0.1:
35 fps, P1:
50.4 fps, max:
206 fps
100.2 [X] XMG Pro 15 E23 Intel Core i9-13900HX 1.6GHz
NVIDIA GeForce RTX 4070 Laptop GPU
min:
26.8 fps, P0.1:
27.9 fps, P1:
40.5 fps, max:
275 fps
105 [X] SCHENKER XMG Fusion 15 (Early 24) Intel Core i9-14900HX 1.6GHz
NVIDIA GeForce RTX 4070 Laptop GPU
min:
60.3 fps, P0.1:
63.9 fps, P1:
89.7 fps, max:
228 fps
114.7 115 117 [X] Acer Predator Helios Neo 16 PHN16-72 Intel Core i7-14700HX 3.9GHz
NVIDIA GeForce RTX 4070 Laptop GPU
min:
72.8 fps, P0.1:
80.4 fps, P1:
90.5 fps, max:
171.3 fps
117.7 125.6 128.5 ~ 105 fps
+ Compare
- Hide Comparison
+ 📈 Graph
- 📈 Hide Graph
0 100 Tooltip 15 BSF: Ø95.7 (82.566-189.3)
Nitro 17 AN17-41-R9LN: Ø97.5 (88.123-115.5)
Victus 16-r0077ng: Ø100.4 (90.886-139.9)
: Ø107.2 (95.763-176.5)
XMG Fusion 15 (Early 24): Ø105 (98.3-112.9)
Predator Helios Neo 16 PHN16-72: Ø117.1 (107.6-126.2)
...
NVIDIA GeForce RTX 4070 Laptop GPU
max:
54.4 60.2 [X] Aorus 15 BSF Intel Core i7-13700H 1.8GHz
NVIDIA GeForce RTX 4070 Laptop GPU
min:
20.6 fps, P0.1:
21.5 fps, P1:
35.1 fps, max:
210 fps
62.5 [X] Acer Nitro 17 AN17-41-R9LN AMD Ryzen 7 7735HS 3.2GHz
NVIDIA GeForce RTX 4070 Laptop GPU
min:
26.8 fps, P0.1:
34.9 fps, P1:
52.6 fps, max:
238 fps
63.8 70.9 [X] XMG Pro 15 E23 Intel Core i9-13900HX 1.6GHz
NVIDIA GeForce RTX 4070 Laptop GPU
min:
25.7 fps, P0.1:
29.6 fps, P1:
41.5 fps, max:
281 fps
71.9 79.8 81.1 82.1 [X] SCHENKER XMG Fusion 15 (Early 24) Intel Core i9-14900HX 1.6GHz
NVIDIA GeForce RTX 4070 Laptop GPU
min:
30.4 fps, P0.1:
49.4 fps, P1:
68.2 fps, max:
249 fps
82.8 [X] Acer Predator Helios Neo 16 PHN16-72 Intel Core i7-14700HX 3.9GHz
NVIDIA GeForce RTX 4070 Laptop GPU
min:
61.9 fps, P0.1:
63.9 fps, P1:
68.7 fps, max:
121.1 fps
88.3 89.6 ~ 74 fps
+ Compare
- Hide Comparison
+ 📈 Graph
- 📈 Hide Graph
0 100 Tooltip 15 BSF: Ø66.7 (56.955-137.1)
Nitro 17 AN17-41-R9LN: Ø66.7 (56.101-133.9)
: Ø74.8 (65.079-111.1)
XMG Fusion 15 (Early 24): Ø82.3 (75.6-91)
Predator Helios Neo 16 PHN16-72: Ø82.9 (76.3-90.8)
...
NVIDIA GeForce RTX 4070 Laptop GPU
max:
...
NVIDIA GeForce RTX 4070 Laptop GPU
max:
NVIDIA GeForce RTX 4070 Laptop GPU
max:
» With all tested laptops playable in detail settings ultra.
Additional Benchmarks
Low Preset 1280x720
162.7 [X] Aorus 15 BSF Intel Core i7-13700H 1.8GHz
NVIDIA GeForce RTX 4070 Laptop GPU
min:
29.8 fps, P0.1:
42.5 fps, P1:
82.2 fps, max:
350 fps
0 100 Tooltip 15 BSF: Ø93.3 (79.16-116.2)
...
NVIDIA GeForce RTX 4070 Laptop GPU
max:
72.3 [X] Acer Nitro 17 AN17-41-R9LN AMD Ryzen 7 7735HS 3.2GHz
NVIDIA GeForce RTX 4070 Laptop GPU
min:
51.9 fps, P0.1:
60.5 fps, P1:
63.6 fps, max:
83.1 fps
72.5 [X] HP Victus 16-r0077ng Intel Core i7-13700H 1.8GHz
NVIDIA GeForce RTX 4070 Laptop GPU
min:
39.4 fps, P0.1:
54.2 fps, P1:
61.1 fps, max:
89 fps
78.8 [X] Aorus 15 BSF Intel Core i7-13700H 1.8GHz
NVIDIA GeForce RTX 4070 Laptop GPU
min:
59.8 fps, P0.1:
60.7 fps, P1:
64.7 fps, max:
115.6 fps
79.5 [X] XMG Pro 15 E23 Intel Core i9-13900HX 1.6GHz
NVIDIA GeForce RTX 4070 Laptop GPU
min:
61.2 fps, P0.1:
62.6 fps, P1:
65.4 fps, max:
104.2 fps
~ 76 fps
+ Compare
- Hide Comparison
+ 📈 Graph
- 📈 Hide Graph
0 100 200 300 Tooltip Nitro 17 AN17-41-R9LN: Ø81.4 (68.173-169.7)
Victus 16-r0077ng: Ø75.2 (63.226-91.8)
15 BSF: Ø98 (66.052-348)
: Ø88.3 (68.249-231.7)
...
NVIDIA GeForce RTX 4070 Laptop GPU
max:
58 [X] HP Victus 16-r0077ng Intel Core i7-13700H 1.8GHz
NVIDIA GeForce RTX 4070 Laptop GPU
min:
23.8 fps, P0.1:
27.5 fps, P1:
35.4 fps, max:
76.6 fps
60.2 [X] Acer Nitro 17 AN17-41-R9LN AMD Ryzen 7 7735HS 3.2GHz
NVIDIA GeForce RTX 4070 Laptop GPU
min:
23 fps, P0.1:
28.8 fps, P1:
41.4 fps, max:
75.1 fps
62.3 [X] Aorus 15 BSF Intel Core i7-13700H 1.8GHz
NVIDIA GeForce RTX 4070 Laptop GPU
min:
28 fps, P0.1:
36.1 fps, P1:
42.5 fps, max:
88.4 fps
64.7 [X] XMG Pro 15 E23 Intel Core i9-13900HX 1.6GHz
NVIDIA GeForce RTX 4070 Laptop GPU
min:
35 fps, P0.1:
38.8 fps, P1:
44 fps, max:
88.7 fps
~ 61 fps
+ Compare
- Hide Comparison
+ 📈 Graph
- 📈 Hide Graph
0 100 200 300 400 500 600 700 800 900 Tooltip Victus 16-r0077ng: Ø61.5 (47.31-82.7)
Nitro 17 AN17-41-R9LN: Ø61.4 (47.34-71.52)
15 BSF: Ø72.1 (49.114-171.4)
: Ø101.1 (50.109-955)
...
NVIDIA GeForce RTX 4070 Laptop GPU
max:
52.3 [X] HP Victus 16-r0077ng Intel Core i7-13700H 1.8GHz
NVIDIA GeForce RTX 4070 Laptop GPU
min:
22.6 fps, P0.1:
25.3 fps, P1:
35.1 fps, max:
71.5 fps
56.3 [X] Acer Nitro 17 AN17-41-R9LN AMD Ryzen 7 7735HS 3.2GHz
NVIDIA GeForce RTX 4070 Laptop GPU
min:
19.3 fps, P0.1:
21.7 fps, P1:
38.3 fps, max:
73.2 fps
57.1 [X] Aorus 15 BSF Intel Core i7-13700H 1.8GHz
NVIDIA GeForce RTX 4070 Laptop GPU
min:
28.2 fps, P0.1:
31.3 fps, P1:
38.4 fps, max:
84.5 fps
58.1 [X] XMG Pro 15 E23 Intel Core i9-13900HX 1.6GHz
NVIDIA GeForce RTX 4070 Laptop GPU
min:
26 fps, P0.1:
27 fps, P1:
36.2 fps, max:
82.9 fps
~ 56 fps
+ Compare
- Hide Comparison
+ 📈 Graph
- 📈 Hide Graph
0 100 200 300 400 500 600 700 800 900 1000 1100 1200 1300 1400 1500 1600 1700 1800 1900 Tooltip Victus 16-r0077ng: Ø55 (44.04-81.2)
Nitro 17 AN17-41-R9LN: Ø127.2 (46.32-1933)
15 BSF: Ø101.9 (48.95-1121)
: Ø64.5 (44.487-116.1)
...
NVIDIA GeForce RTX 4070 Laptop GPU
max:
0 100 200 300 400 500 Tooltip Nitro 17 AN17-41-R9LN: Ø89.1 (40.9-559)
15 BSF: Ø51.2 (40.184-81)
: Ø51.9 (40.556-87.1)
NVIDIA GeForce RTX 4070 Laptop GPU
max:
NVIDIA GeForce RTX 4070 Laptop GPU
max:
» With all tested laptops playable in detail settings ultra.
Additional Benchmarks
Very Low Preset 1280x720
109.7 [X] Aorus 15 BSF Intel Core i7-13700H 1.8GHz
NVIDIA GeForce RTX 4070 Laptop GPU
min:
61.7 fps, P0.1:
68.6 fps, P1:
94.9 fps, max:
122 fps
Very High Preset + Very High Raytracing TAA 1920x1080
44.8 [X] XMG Pro 15 E23 Intel Core i9-13900HX 1.6GHz
NVIDIA GeForce RTX 4070 Laptop GPU
min:
1.446 fps, P0.1:
13.6 fps, P1:
20.5 fps, max:
76.5 fps
43.4 [X] Aorus 15 BSF Intel Core i7-13700H 1.8GHz
NVIDIA GeForce RTX 4070 Laptop GPU
min:
14.9 fps, P0.1:
16.3 fps, P1:
28.8 fps, max:
66 fps
Very High Preset + Very High Raytracing + DLSS Quality + FG 3840x2160
13.3 [X] XMG Pro 15 E23 Intel Core i9-13900HX 1.6GHz
NVIDIA GeForce RTX 4070 Laptop GPU
min:
4.87 fps, P0.1:
4.92 fps, P1:
5.61 fps
...
NVIDIA GeForce RTX 4070 Laptop GPU
max:
...
NVIDIA GeForce RTX 4070 Laptop GPU
max:
...
NVIDIA GeForce RTX 4070 Laptop GPU
max:
49.5 55.5 [X] Dell XPS 16 9640 1082038
Intel Core Ultra 7 155H 3.8GHz
NVIDIA GeForce RTX 4070 Laptop GPU
min:
40 fps, P1:
42 fps, max:
68 fps
55.8 62.5 [X] Asus ROG Flow X16 GV601VI 1057599
Intel Core i9-13900H 1.9GHz
NVIDIA GeForce RTX 4070 Laptop GPU
min:
47 fps, P1:
47 fps, max:
76 fps
67.6 68 [X] XMG Pro 15 E23 Intel Core i9-13900HX 1.6GHz
NVIDIA GeForce RTX 4070 Laptop GPU
min:
55 fps
68.9 [X] Lenovo Yoga Pro 9 16IMH9 1082038
Intel Core Ultra 9 185H 3.8GHz
NVIDIA GeForce RTX 4070 Laptop GPU
min:
55 fps, P1:
54 fps, max:
81 fps
70.1 71 71.7 [X] Aorus 15 BSF 1012607
Intel Core i7-13700H 1.8GHz
NVIDIA GeForce RTX 4070 Laptop GPU
min:
56 fps, P1:
51 fps, max:
83 fps
77 100 [X] MSI Pulse 17 B13VGK 1008687
Intel Core i7-13700H 1.8GHz
NVIDIA GeForce RTX 4070 Laptop GPU
min:
81 fps, P1:
58 fps, max:
115 fps
~ 68 fps
+ Compare
- Hide Comparison
...
NVIDIA GeForce RTX 4070 Laptop GPU
max:
35.2 [X] Dell XPS 16 9640 1082038
Intel Core Ultra 7 155H 3.8GHz
NVIDIA GeForce RTX 4070 Laptop GPU
min:
14 fps, P1:
27 fps, max:
42 fps
36 36 39.4 [X] Asus ROG Flow X16 GV601VI 1057599
Intel Core i9-13900H 1.9GHz
NVIDIA GeForce RTX 4070 Laptop GPU
min:
31 fps, P1:
31 fps, max:
44 fps
43.9 44 [X] Lenovo Yoga Pro 9 16IMH9 1082038
Intel Core Ultra 9 185H 3.8GHz
NVIDIA GeForce RTX 4070 Laptop GPU
min:
28 fps, P1:
34 fps, max:
52 fps
45 45.6 46 [X] XMG Pro 15 E23 Intel Core i9-13900HX 1.6GHz
NVIDIA GeForce RTX 4070 Laptop GPU
min:
37 fps
46.3 [X] Aorus 15 BSF 1012607
Intel Core i7-13700H 1.8GHz
NVIDIA GeForce RTX 4070 Laptop GPU
min:
37 fps, P1:
35 fps, max:
54 fps
49 ~ 42 fps
+ Compare
- Hide Comparison
...
NVIDIA GeForce RTX 4070 Laptop GPU
max:
NVIDIA GeForce RTX 4070 Laptop GPU
...
max:
NVIDIA GeForce RTX 4070 Laptop GPU
max:
» With all tested laptops playable in detail settings ultra.
Additional Benchmarks
Ultra Low Preset TAA 1280x720
232 [X] MSI Pulse 17 B13VGK 1008687
Intel Core i7-13700H 1.8GHz
NVIDIA GeForce RTX 4070 Laptop GPU
min:
167 fps, P1:
91 fps, max:
285 fps
237 [X] Aorus 15 BSF Intel Core i7-13700H 1.8GHz
NVIDIA GeForce RTX 4070 Laptop GPU
min:
198 fps, P1:
140 fps, max:
285 fps
0 100 200 300 400 500 600 700 800 900 1000 1100 1200 1300 1400 1500 1600 1700 1800 1900 2000 2100 2200 2300 2400 2500 2600 2700 2800 2900 3000 3100 3200 3300 3400 3500 3600 3700 3800 3900 4000 4100 4200 4300 4400 4500 4600 4700 4800 4900 5000 5100 5200 5300 5400 5500 5600 5700 5800 5900 6000 Tooltip : Ø521 (205.343-6083)
Stealth 16 Studio A13VG: Ø258 (221.436-284)
...
NVIDIA GeForce RTX 4070 Laptop GPU
max:
0 100 200 Tooltip : Ø230 (199.014-262.1)
Stealth 16 Studio A13VG: Ø237 (200.714-266.99)
...
NVIDIA GeForce RTX 4070 Laptop GPU
max:
0 100 200 Tooltip : Ø211 (177.26-299.2)
Stealth 16 Studio A13VG: Ø212 (175.83-264.2)
...
NVIDIA GeForce RTX 4070 Laptop GPU
max:
0 100 200 300 400 Tooltip Stealth 16 Studio A13VG: Ø190.4 (145.093-411)
: Ø184.6 (152.38-211.62)
...
NVIDIA GeForce RTX 4070 Laptop GPU
max:
0 100 200 Tooltip Stealth 16 Studio A13VG: Ø112.1 (66.67-222.3)
: Ø123.8 (102.482-153.7)
NVIDIA GeForce RTX 4070 Laptop GPU
max:
NVIDIA GeForce RTX 4070 Laptop GPU
max:
NVIDIA GeForce RTX 4070 Laptop GPU
max:
» With all tested laptops playable in detail settings ultra.
Additional Benchmarks
Low Preset 1280x720
0 100 Tooltip Stealth 16 Studio A13VG: Ø97.2 (78.85-137.4)
...
NVIDIA GeForce RTX 4070 Laptop GPU
max:
0 100 Tooltip Stealth 16 Studio A13VG: Ø83.1 (72.025-110)
: Ø87.5 (67.346-115.8)
...
NVIDIA GeForce RTX 4070 Laptop GPU
max:
0 100 Tooltip Stealth 16 Studio A13VG: Ø78.1 (64.368-85.97)
: Ø83.8 (66.83-119.8)
...
NVIDIA GeForce RTX 4070 Laptop GPU
...
max:
0 100 Tooltip Stealth 16 Studio A13VG: Ø78.9 (58.431-163.5)
: Ø76.4 (65.027-90.7)
...
NVIDIA GeForce RTX 4070 Laptop GPU
max:
0 Tooltip : Ø50.7 (39.33-80.8)
Stealth 16 Studio A13VG: Ø49.6 (40.017-59.4)
NVIDIA GeForce RTX 4070 Laptop GPU
...
max:
NVIDIA GeForce RTX 4070 Laptop GPU
max:
» With all tested laptops playable in detail settings ultra.
Additional Benchmarks
Low Preset 1280x720
Epic Preset + Ray Tracing 1920x1080
56.7 [X] XMG Pro 15 E23 Intel Core i9-13900HX 1.6GHz
NVIDIA GeForce RTX 4070 Laptop GPU
min:
15.1 fps, P0.1:
17.1 fps, P1:
29.5 fps, max:
107.3 fps
0 100 200 Tooltip Nitro 16 AN16-41: Ø169.3 (90.13-206.14)
...
NVIDIA GeForce RTX 4070 Laptop GPU
max:
0 100 200 300 400 Tooltip Nitro 16 AN16-41: Ø193.6 (137.81-489)
: Ø226 (192.136-292.7)
...
NVIDIA GeForce RTX 4070 Laptop GPU
max:
0 100 200 Tooltip Nitro 16 AN16-41: Ø155.3 (124.65-204.6)
: Ø204 (168.02-286.5)
...
NVIDIA GeForce RTX 4070 Laptop GPU
max:
0 100 200 300 Tooltip Nitro 16 AN16-41: Ø153.5 (122.822-326.1)
: Ø180.7 (156.272-218.4)
...
NVIDIA GeForce RTX 4070 Laptop GPU
max:
0 100 200 300 400 500 600 700 800 900 1000 1100 1200 1300 1400 1500 1600 1700 1800 1900 2000 2100 2200 2300 2400 2500 2600 2700 2800 2900 3000 3100 3200 3300 3400 3500 3600 Tooltip Nitro 16 AN16-41: Ø314 (92.04-3610)
: Ø122.7 (102.89-170.8)
NVIDIA GeForce RTX 4070 Laptop GPU
max:
NVIDIA GeForce RTX 4070 Laptop GPU
max:
» With all tested laptops playable in detail settings ultra.
Additional Benchmarks
Low Preset Low TAA 1280x720
171 [X] Acer Nitro 16 AN16-41 AMD Ryzen 7 7735HS 3.2GHz
NVIDIA GeForce RTX 4070 Laptop GPU
min:
90 fps, P0.1:
97.7 fps, P1:
126.4 fps, max:
222 fps
0 100 200 300 400 500 600 700 800 900 1000 Tooltip 15X ASF: Ø86.4 (60.16-641)
Nitro 16 AN16-41: Ø120.9 (74.026-1006)
Stealth 16 Studio A13VG: Ø117.9 (96.225-144.1)
...
NVIDIA GeForce RTX 4070 Laptop GPU
max:
0 100 200 300 400 500 600 Tooltip 15X ASF: Ø65.6 (52.015-138)
Nitro 16 AN16-41: Ø96.5 (69.817-555)
Stealth 16 Studio A13VG: Ø115.3 (82.838-636)
...
NVIDIA GeForce RTX 4070 Laptop GPU
max:
0 100 200 300 400 500 Tooltip 15X ASF: Ø62 (15.36-128.7)
Nitro 16 AN16-41: Ø83.5 (65.362-174.9)
Stealth 16 Studio A13VG: Ø97.8 (72.198-540)
...
NVIDIA GeForce RTX 4070 Laptop GPU
max:
0 100 Tooltip 15X ASF: Ø60.5 (48.821-180.2)
Nitro 16 AN16-41: Ø72.3 (57.082-111.6)
Stealth 16 Studio A13VG: Ø77.8 (64.14-101.8)
...
NVIDIA GeForce RTX 4070 Laptop GPU
max:
0 100 Tooltip Nitro 16 AN16-41: Ø45.8 (32.699-81.7)
Stealth 16 Studio A13VG: Ø47.5 (35.237-114.1)
15X ASF: Ø57.6 (23.151-95.8)
NVIDIA GeForce RTX 4070 Laptop GPU
...
max:
NVIDIA GeForce RTX 4070 Laptop GPU
max:
» With all tested laptops playable in detail settings ultra.
Additional Benchmarks
Low Preset 1280x720
92.9 [X] Aorus 15X ASF Intel Core i7-13700HX 1.5GHz
NVIDIA GeForce RTX 4070 Laptop GPU
min:
24.1 fps, P0.1:
42.4 fps, P1:
57.6 fps, max:
147 fps
109.4 [X] Acer Nitro 16 AN16-41 AMD Ryzen 7 7735HS 3.2GHz
NVIDIA GeForce RTX 4070 Laptop GPU
min:
15.2 fps, P0.1:
45 fps, P1:
61.4 fps, max:
171.9 fps
0 100 200 Tooltip Nitro 16 AN16-41: Ø123.1 (47.513-145.9)
Stealth 16 Studio A13VG: Ø168.6 (142.731-247.8)
15X ASF: Ø190.8 (148.495-234.4)
...
NVIDIA GeForce RTX 4070 Laptop GPU
max:
108.3 [X] HP Victus 16-r0077ng Intel Core i7-13700H 1.8GHz
NVIDIA GeForce RTX 4070 Laptop GPU
min:
4.34 fps, P0.1:
23.6 fps, P1:
73.3 fps, max:
163.7 fps
117.6 [X] Acer Nitro 16 AN16-41 AMD Ryzen 7 7735HS 3.2GHz
NVIDIA GeForce RTX 4070 Laptop GPU
min:
16.3 fps, P0.1:
49.4 fps, P1:
80.4 fps, max:
180.3 fps
123.4 [X] MSI Stealth 16 Studio A13VG Intel Core i7-13700H 1.8GHz
NVIDIA GeForce RTX 4070 Laptop GPU
min:
21.9 fps, P0.1:
42.9 fps, P1:
79.7 fps, max:
193.8 fps
133.5 [X] Aorus 15X ASF Intel Core i7-13700HX 1.5GHz
NVIDIA GeForce RTX 4070 Laptop GPU
min:
24.8 fps, P0.1:
83.3 fps, P1:
113.6 fps, max:
185.9 fps
~ 121 fps
+ Compare
- Hide Comparison
+ 📈 Graph
- 📈 Hide Graph
0 100 200 Tooltip Victus 16-r0077ng: Ø118.2 (76.16-267.4)
Nitro 16 AN16-41: Ø120.2 (84.044-149.3)
Stealth 16 Studio A13VG: Ø131.2 (108.192-221.9)
15X ASF: Ø136.9 (123.496-189.1)
...
NVIDIA GeForce RTX 4070 Laptop GPU
max:
105.5 [X] HP Victus 16-r0077ng Intel Core i7-13700H 1.8GHz
NVIDIA GeForce RTX 4070 Laptop GPU
min:
50.8 fps, P0.1:
64.8 fps, P1:
86.1 fps, max:
143.5 fps
111.5 [X] Acer Nitro 16 AN16-41 AMD Ryzen 7 7735HS 3.2GHz
NVIDIA GeForce RTX 4070 Laptop GPU
min:
8.75 fps, P0.1:
49.6 fps, P1:
93.3 fps, max:
141.6 fps
113.1 [X] MSI Stealth 16 Studio A13VG Intel Core i7-13700H 1.8GHz
NVIDIA GeForce RTX 4070 Laptop GPU
min:
19.2 fps, P0.1:
42.8 fps, P1:
85.7 fps, max:
172.3 fps
120.8 [X] Aorus 15X ASF Intel Core i7-13700HX 1.5GHz
NVIDIA GeForce RTX 4070 Laptop GPU
min:
5.94 fps, P0.1:
59.4 fps, P1:
100.4 fps, max:
168.7 fps
~ 113 fps
+ Compare
- Hide Comparison
+ 📈 Graph
- 📈 Hide Graph
0 100 Tooltip Victus 16-r0077ng: Ø110.7 (94.06-143.8)
Nitro 16 AN16-41: Ø118.1 (101-159.3)
Stealth 16 Studio A13VG: Ø115 (101.87-131.42)
15X ASF: Ø127.3 (114.075-171.9)
...
NVIDIA GeForce RTX 4070 Laptop GPU
max:
74.8 [X] HP Victus 16-r0077ng Intel Core i7-13700H 1.8GHz
NVIDIA GeForce RTX 4070 Laptop GPU
min:
24.5 fps, P0.1:
41.7 fps, P1:
51.9 fps, max:
113 fps
80.5 [X] Acer Nitro 16 AN16-41 AMD Ryzen 7 7735HS 3.2GHz
NVIDIA GeForce RTX 4070 Laptop GPU
min:
12.2 fps, P0.1:
26.8 fps, P1:
60.9 fps, max:
105.1 fps
82.4 [X] MSI Stealth 16 Studio A13VG Intel Core i7-13700H 1.8GHz
NVIDIA GeForce RTX 4070 Laptop GPU
min:
14.4 fps, P0.1:
35 fps, P1:
57.2 fps, max:
120.3 fps
86.7 [X] Aorus 15X ASF Intel Core i7-13700HX 1.5GHz
NVIDIA GeForce RTX 4070 Laptop GPU
min:
31.4 fps, P0.1:
44.3 fps, P1:
63.7 fps, max:
111 fps
~ 81 fps
+ Compare
- Hide Comparison
+ 📈 Graph
- 📈 Hide Graph
0 100 Tooltip Victus 16-r0077ng: Ø79.2 (66.335-115.5)
Nitro 16 AN16-41: Ø84.4 (70.39-106.5)
Stealth 16 Studio A13VG: Ø85 (74.21-107.4)
15X ASF: Ø87.9 (78.886-104.4)
...
NVIDIA GeForce RTX 4070 Laptop GPU
max:
0 Tooltip Nitro 16 AN16-41: Ø61.1 (54.054-88.1)
Stealth 16 Studio A13VG: Ø63.6 (56.046-71.8)
15X ASF: Ø63.4 (58.07-77.2)
NVIDIA GeForce RTX 4070 Laptop GPU
max:
» With all tested laptops playable in detail settings ultra.
Additional Benchmarks
Prioritize Performance Preset 1280x720
231 [X] Aorus 15X ASF Intel Core i7-13700HX 1.5GHz
NVIDIA GeForce RTX 4070 Laptop GPU
min:
30.9 fps, P0.1:
115.5 fps, P1:
156.4 fps, max:
363 fps
120.6 [X] Acer Nitro 16 AN16-41 AMD Ryzen 7 7735HS 3.2GHz
NVIDIA GeForce RTX 4070 Laptop GPU
min:
21.8 fps, P0.1:
50.7 fps, P1:
100.6 fps, max:
160.7 fps
...
NVIDIA GeForce RTX 4070 Laptop GPU
max:
...
NVIDIA GeForce RTX 4070 Laptop GPU
max:
...
NVIDIA GeForce RTX 4070 Laptop GPU
max:
...
NVIDIA GeForce RTX 4070 Laptop GPU
max:
...
NVIDIA GeForce RTX 4070 Laptop GPU
max:
NVIDIA GeForce RTX 4070 Laptop GPU
max:
» With all tested laptops playable in detail settings ultra.
Additional Benchmarks
Minimum Settings 1280x720
307.4 [X] Aorus 15X ASF Intel Core i7-13700HX 1.5GHz
NVIDIA GeForce RTX 4070 Laptop GPU
P0.1:
66 fpsP1:
122 fps
0 100 Tooltip 15X ASF: Ø102.4 (91.766-157.9)
...
NVIDIA GeForce RTX 4070 Laptop GPU
max:
73.3 [X] Acer Nitro 17 AN17-41-R9LN AMD Ryzen 7 7735HS 3.2GHz
NVIDIA GeForce RTX 4070 Laptop GPU
min:
48.4 fps, P0.1:
52.8 fps, P1:
62.1 fps, max:
94.8 fps
86.8 [X] Aorus 15X ASF Intel Core i7-13700HX 1.5GHz
NVIDIA GeForce RTX 4070 Laptop GPU
min:
19.7 fps, P0.1:
42.8 fps, P1:
56 fps, max:
155.6 fps
88.1 [X] HP Omen 16-xf0376ng AMD Ryzen 7 7840HS 3.8GHz
NVIDIA GeForce RTX 4070 Laptop GPU
min:
13.9 fps, P0.1:
41.5 fps, P1:
64.7 fps, max:
143.4 fps
92.1 [X] HP Victus 16-r0077ng Intel Core i7-13700H 1.8GHz
NVIDIA GeForce RTX 4070 Laptop GPU
min:
62.3 fps, P0.1:
68.2 fps, P1:
73.6 fps, max:
145.5 fps
~ 85 fps
+ Compare
- Hide Comparison
+ 📈 Graph
- 📈 Hide Graph
0 100 Tooltip Nitro 17 AN17-41-R9LN: Ø75.8 (70.07-115.3)
15X ASF: Ø89 (73.01-103.23)
Omen 16-xf0376ng: Ø93 (78.305-142.1)
Victus 16-r0077ng: Ø96.7 (84.067-149.9)
...
NVIDIA GeForce RTX 4070 Laptop GPU
max:
71.9 [X] Acer Nitro 17 AN17-41-R9LN AMD Ryzen 7 7735HS 3.2GHz
NVIDIA GeForce RTX 4070 Laptop GPU
min:
54.3 fps, P0.1:
57.6 fps, P1:
61.1 fps, max:
111.5 fps
83.3 [X] Aorus 15X ASF Intel Core i7-13700HX 1.5GHz
NVIDIA GeForce RTX 4070 Laptop GPU
min:
34.6 fps, P0.1:
46.9 fps, P1:
59.6 fps, max:
147.3 fps
85.8 [X] HP Omen 16-xf0376ng AMD Ryzen 7 7840HS 3.8GHz
NVIDIA GeForce RTX 4070 Laptop GPU
min:
25.3 fps, P0.1:
49 fps, P1:
69.8 fps, max:
134 fps
88.5 [X] HP Victus 16-r0077ng Intel Core i7-13700H 1.8GHz
NVIDIA GeForce RTX 4070 Laptop GPU
min:
42.2 fps, P0.1:
47.1 fps, P1:
55.4 fps, max:
155.2 fps
~ 82 fps
+ Compare
- Hide Comparison
+ 📈 Graph
- 📈 Hide Graph
0 100 200 Tooltip Nitro 17 AN17-41-R9LN: Ø74.7 (67.045-131.2)
15X ASF: Ø86.7 (71.106-119)
Omen 16-xf0376ng: Ø92 (80.35-202.1)
Victus 16-r0077ng: Ø94.3 (66.326-141.4)
...
NVIDIA GeForce RTX 4070 Laptop GPU
max:
71.1 [X] Acer Nitro 17 AN17-41-R9LN AMD Ryzen 7 7735HS 3.2GHz
NVIDIA GeForce RTX 4070 Laptop GPU
min:
53.6 fps, P0.1:
58.4 fps, P1:
60.7 fps, max:
95.9 fps
82.3 [X] Aorus 15X ASF Intel Core i7-13700HX 1.5GHz
NVIDIA GeForce RTX 4070 Laptop GPU
min:
34.1 fps, P0.1:
49.3 fps, P1:
61.1 fps, max:
140.5 fps
85.4 [X] HP Omen 16-xf0376ng AMD Ryzen 7 7840HS 3.8GHz
NVIDIA GeForce RTX 4070 Laptop GPU
min:
54.8 fps, P0.1:
64.6 fps, P1:
72.6 fps, max:
135.8 fps
87.5 [X] HP Victus 16-r0077ng Intel Core i7-13700H 1.8GHz
NVIDIA GeForce RTX 4070 Laptop GPU
min:
34.6 fps, P0.1:
39.6 fps, P1:
55.4 fps, max:
126.1 fps
~ 82 fps
+ Compare
- Hide Comparison
+ 📈 Graph
- 📈 Hide Graph
0 100 200 300 400 500 600 700 800 900 1000 1100 1200 1300 1400 1500 1600 1700 1800 1900 2000 2100 2200 2300 2400 2500 2600 2700 2800 2900 3000 3100 3200 3300 3400 3500 3600 3700 3800 3900 4000 4100 4200 4300 4400 4500 4600 4700 4800 4900 5000 5100 5200 5300 5400 5500 5600 5700 5800 5900 6000 6100 6200 6300 6400 6500 6600 6700 6800 6900 7000 7100 7200 Tooltip Nitro 17 AN17-41-R9LN: Ø75.1 (67.16-108.8)
15X ASF: Ø84.1 (70.016-105)
Omen 16-xf0376ng: Ø282 (81.18-7289)
Victus 16-r0077ng: Ø91.9 (66.003-123.5)
...
NVIDIA GeForce RTX 4070 Laptop GPU
max:
0 100 200 300 Tooltip Nitro 17 AN17-41-R9LN: Ø66.7 (39.32-117.5)
15X ASF: Ø81.5 (55.285-392)
NVIDIA GeForce RTX 4070 Laptop GPU
max:
» With all tested laptops playable in detail settings ultra.
Additional Benchmarks
Ultra Low Preset 1280x720
101.8 [X] Aorus 15X ASF Intel Core i7-13700HX 1.5GHz
NVIDIA GeForce RTX 4070 Laptop GPU
min:
6.46 fps, P0.1:
31 fps, P1:
67.9 fps, max:
145 fps
0 100 200 300 400 500 Tooltip Nitro 16 AN16-41: Ø178.5 (166.857-197.5)
15X ASF: Ø207 (182.3-516)
...
NVIDIA GeForce RTX 4070 Laptop GPU
max:
131.7 [X] HP Victus 16-r0077ng Intel Core i7-13700H 1.8GHz
NVIDIA GeForce RTX 4070 Laptop GPU
min:
16.2 fps, P0.1:
76.6 fps, P1:
102 fps, max:
176.7 fps
132.5 [X] Acer Nitro 17 AN17-41-R9LN AMD Ryzen 7 7735HS 3.2GHz
NVIDIA GeForce RTX 4070 Laptop GPU
min:
36.4 fps, P0.1:
55.3 fps, P1:
112.6 fps, max:
157.5 fps
147.4 [X] Acer Nitro 16 AN16-41 AMD Ryzen 7 7735HS 3.2GHz
NVIDIA GeForce RTX 4070 Laptop GPU
min:
45 fps, P0.1:
103.8 fps, P1:
125.7 fps, max:
177.2 fps
158.3 [X] Aorus 15X ASF Intel Core i7-13700HX 1.5GHz
NVIDIA GeForce RTX 4070 Laptop GPU
min:
79.6 fps, P0.1:
106 fps, P1:
126.7 fps, max:
204 fps
~ 142 fps
+ Compare
- Hide Comparison
+ 📈 Graph
- 📈 Hide Graph
0 100 200 300 Tooltip Victus 16-r0077ng: Ø138.5 (114.68-290.7)
Nitro 17 AN17-41-R9LN: Ø138.2 (121.365-323.4)
Nitro 16 AN16-41: Ø150.9 (138.001-191.6)
15X ASF: Ø165.3 (144.18-304.7)
...
NVIDIA GeForce RTX 4070 Laptop GPU
...
max:
86.2 [X] HP Victus 16-r0077ng Intel Core i7-13700H 1.8GHz
NVIDIA GeForce RTX 4070 Laptop GPU
min:
46.6 fps, P0.1:
52.9 fps, P1:
67.4 fps, max:
112.6 fps
95 [X] Acer Nitro 17 AN17-41-R9LN AMD Ryzen 7 7735HS 3.2GHz
NVIDIA GeForce RTX 4070 Laptop GPU
min:
37.5 fps, P0.1:
64.9 fps, P1:
79.4 fps, max:
127.1 fps
95.1 [X] Acer Nitro 16 AN16-41 AMD Ryzen 7 7735HS 3.2GHz
NVIDIA GeForce RTX 4070 Laptop GPU
min:
50.2 fps, P0.1:
71.9 fps, P1:
81.2 fps, max:
141.3 fps
96.4 [X] Aorus 15X ASF Intel Core i7-13700HX 1.5GHz
NVIDIA GeForce RTX 4070 Laptop GPU
min:
50.9 fps, P0.1:
72 fps, P1:
78.6 fps, max:
149 fps
~ 93 fps
+ Compare
- Hide Comparison
+ 📈 Graph
- 📈 Hide Graph
0 100 200 Tooltip Victus 16-r0077ng: Ø91.8 (77.128-243)
Nitro 17 AN17-41-R9LN: Ø101.3 (87.534-217.3)
Nitro 16 AN16-41: Ø102.9 (88.047-259.6)
15X ASF: Ø99.1 (90.12-124.9)
...
NVIDIA GeForce RTX 4070 Laptop GPU
max:
70.4 [X] HP Victus 16-r0077ng Intel Core i7-13700H 1.8GHz
NVIDIA GeForce RTX 4070 Laptop GPU
min:
20.9 fps, P0.1:
40.5 fps, P1:
54.2 fps, max:
98.6 fps
74.2 [X] Acer Nitro 17 AN17-41-R9LN AMD Ryzen 7 7735HS 3.2GHz
NVIDIA GeForce RTX 4070 Laptop GPU
min:
44.9 fps, P0.1:
54.3 fps, P1:
63 fps, max:
121.3 fps
78 [X] Acer Nitro 16 AN16-41 AMD Ryzen 7 7735HS 3.2GHz
NVIDIA GeForce RTX 4070 Laptop GPU
min:
41.8 fps, P0.1:
61.5 fps, P1:
67.9 fps, max:
110.9 fps
79 [X] Aorus 15X ASF Intel Core i7-13700HX 1.5GHz
NVIDIA GeForce RTX 4070 Laptop GPU
min:
39.3 fps, P0.1:
60.2 fps, P1:
65.2 fps, max:
115.3 fps
~ 75 fps
+ Compare
- Hide Comparison
+ 📈 Graph
- 📈 Hide Graph
0 100 200 300 Tooltip Victus 16-r0077ng: Ø74.7 (65.077-163.9)
Nitro 17 AN17-41-R9LN: Ø77 (69.107-103)
Nitro 16 AN16-41: Ø85.2 (71.032-359)
15X ASF: Ø82.5 (73.087-136.7)
...
NVIDIA GeForce RTX 4070 Laptop GPU
max:
0 100 Tooltip Nitro 17 AN17-41-R9LN: Ø55 (48.002-107.9)
Nitro 16 AN16-41: Ø62.1 (54.017-103.3)
15X ASF: Ø64.6 (55.1-169)
NVIDIA GeForce RTX 4070 Laptop GPU
max:
» With all tested laptops playable in detail settings ultra.
Additional Benchmarks
Low Preset 1280x720
208 [X] Aorus 15X ASF Intel Core i7-13700HX 1.5GHz
NVIDIA GeForce RTX 4070 Laptop GPU
min:
68.6 fps, P0.1:
142.8 fps, P1:
172 fps, max:
264 fps
181.7 [X] Acer Nitro 16 AN16-41 AMD Ryzen 7 7735HS 3.2GHz
NVIDIA GeForce RTX 4070 Laptop GPU
min:
69.8 fps, P0.1:
139.8 fps, P1:
155.4 fps, max:
218 fps
...
NVIDIA GeForce RTX 4070 Laptop GPU
max:
...
NVIDIA GeForce RTX 4070 Laptop GPU
max:
...
NVIDIA GeForce RTX 4070 Laptop GPU
max:
...
NVIDIA GeForce RTX 4070 Laptop GPU
max:
NVIDIA GeForce RTX 4070 Laptop GPU
max:
NVIDIA GeForce RTX 4070 Laptop GPU
max:
» With all tested laptops playable in detail settings ultra.
Additional Benchmarks
Low Preset 1280x720
150 [X] Aorus 15X ASF Intel Core i7-13700HX 1.5GHz
NVIDIA GeForce RTX 4070 Laptop GPU
min:
80 fps, max:
264 fps
144 [X] Aorus 15 BSF Intel Core i7-13700H 1.8GHz
NVIDIA GeForce RTX 4070 Laptop GPU
min:
69 fps, max:
218 fps
Epic Preset + Epic Ray-Tracing 1920x1080
74 [X] Aorus 15 BSF Intel Core i7-13700H 1.8GHz
NVIDIA GeForce RTX 4070 Laptop GPU
min:
42 fps, max:
123 fps
0 100 Tooltip ROG Strix G18 G814JI: Ø144.1 (132.119-154.8)
...
NVIDIA GeForce RTX 4070 Laptop GPU
max:
0 100 200 Tooltip ROG Strix G18 G814JI: Ø127.8 (109.016-242.5)
...
NVIDIA GeForce RTX 4070 Laptop GPU
max:
0 100 200 300 400 500 600 700 800 900 1000 1100 1200 1300 1400 1500 1600 1700 1800 1900 2000 2100 2200 2300 2400 2500 2600 2700 2800 2900 3000 3100 3200 3300 3400 3500 3600 3700 3800 3900 Tooltip ROG Strix G18 G814JI: Ø280 (90.752-3900)
...
NVIDIA GeForce RTX 4070 Laptop GPU
max:
0 100 Tooltip ROG Strix G18 G814JI: Ø78.5 (64.012-149.5)
...
NVIDIA GeForce RTX 4070 Laptop GPU
max:
0 100 Tooltip ROG Strix G18 G814JI: Ø32.1 (25.454-101.8)
NVIDIA GeForce RTX 4070 Laptop GPU
max:
» With all tested laptops playable in detail settings ultra.
Additional Benchmarks
Ultra Preset + Full Ray Tracing High TAA 1920x1080
0 100 200 Tooltip 15X ASF: Ø111 (89.903-247.6)
Stealth 16 Studio A13VG: Ø107.6 (85.24-166.2)
...
NVIDIA GeForce RTX 4070 Laptop GPU
max:
0 100 Tooltip 15X ASF: Ø98 (83.908-115)
Stealth 16 Studio A13VG: Ø101.2 (83.34-125.91)
...
NVIDIA GeForce RTX 4070 Laptop GPU
max:
0 100 Tooltip 15X ASF: Ø89.5 (72.022-146.4)
Stealth 16 Studio A13VG: Ø88.5 (75.134-104.44)
...
NVIDIA GeForce RTX 4070 Laptop GPU
max:
0 100 200 300 400 500 Tooltip 15X ASF: Ø113.8 (68.194-561)
Stealth 16 Studio A13VG: Ø98.1 (72.145-194.8)
...
NVIDIA GeForce RTX 4070 Laptop GPU
max:
0 100 Tooltip 15X ASF: Ø57.5 (47.927-125.1)
Stealth 16 Studio A13VG: Ø60.7 (50.35-73.2)
...
NVIDIA GeForce RTX 4070 Laptop GPU
max:
...
NVIDIA GeForce RTX 4070 Laptop GPU
max:
» With all tested laptops playable in detail settings ultra.
Additional Benchmarks
Low Preset TAA 1280x720
135.5 [X] Aorus 15X ASF Intel Core i7-13700HX 1.5GHz
NVIDIA GeForce RTX 4070 Laptop GPU
min:
34.2 fps, P0.1:
36.6 fps, P1:
52.5 fps, max:
498 fps
0 100 200 300 Tooltip XMG Fusion 15 (Early 24): Ø271 (227-305)
...
NVIDIA GeForce RTX 4070 Laptop GPU
max:
0 100 200 Tooltip XMG Fusion 15 (Early 24): Ø215 (190-237)
...
NVIDIA GeForce RTX 4070 Laptop GPU
max:
0 100 Tooltip XMG Fusion 15 (Early 24): Ø176.3 (150-190.7)
...
NVIDIA GeForce RTX 4070 Laptop GPU
max:
0 Tooltip XMG Fusion 15 (Early 24): Ø86.6 (73.5-93.3)
...
NVIDIA GeForce RTX 4070 Laptop GPU
...
max:
NVIDIA GeForce RTX 4070 Laptop GPU
...
max:
NVIDIA GeForce RTX 4070 Laptop GPU
...
max:
» With all tested laptops playable in detail settings ultra.
Additional Benchmarks
RT Ultra Preset / On FXAA 1920x1080
40.4 [X] SCHENKER XMG Fusion 15 (Early 24) Intel Core i9-14900HX 1.6GHz
NVIDIA GeForce RTX 4070 Laptop GPU
min:
8.77 fps, P0.1:
13.8 fps, P1:
30.3 fps, max:
155 fps
0 100 200 300 Tooltip Stealth 16 Studio A13VG: Ø227 (176.915-307.4)
15X ASF: Ø239 (192.09-290.02)
...
NVIDIA GeForce RTX 4070 Laptop GPU
max:
0 100 200 300 Tooltip Victus 16-r0077ng: Ø173 (141.394-222.5)
ROG Strix G18 G814JI: Ø182.7 (152.326-263.6)
Stealth 16 Studio A13VG: Ø185.3 (142.629-302.1)
15X ASF: Ø189.6 (148.159-223.042)
...
NVIDIA GeForce RTX 4070 Laptop GPU
max:
126.7 [X] HP Victus 16-r0077ng Intel Core i7-13700H 1.8GHz
NVIDIA GeForce RTX 4070 Laptop GPU
min:
31.8 fps, P0.1:
57.7 fps, P1:
79.8 fps, max:
207 fps
131.6 [X] Asus ROG Strix G18 G814JI Intel Core i7-13650HX 1.9GHz
NVIDIA GeForce RTX 4070 Laptop GPU
min:
7.46 fps, P0.1:
21.1 fps, P1:
83.7 fps, max:
235 fps
134.1 [X] MSI Stealth 16 Studio A13VG Intel Core i7-13700H 1.8GHz
NVIDIA GeForce RTX 4070 Laptop GPU
min:
39.1 fps, P0.1:
45.8 fps, P1:
85.8 fps, max:
262 fps
141.6 [X] Aorus 15X ASF Intel Core i7-13700HX 1.5GHz
NVIDIA GeForce RTX 4070 Laptop GPU
min:
17.8 fps, P0.1:
61 fps, P1:
83.2 fps, max:
286 fps
~ 134 fps
+ Compare
- Hide Comparison
+ 📈 Graph
- 📈 Hide Graph
0 100 200 300 400 Tooltip Victus 16-r0077ng: Ø129.7 (109.018-161.1)
ROG Strix G18 G814JI: Ø134.4 (106.186-167.6)
Stealth 16 Studio A13VG: Ø145.2 (108.085-363)
15X ASF: Ø154.4 (97.9-434)
...
NVIDIA GeForce RTX 4070 Laptop GPU
max:
0 100 200 300 Tooltip Victus 16-r0077ng: Ø106.9 (84.071-176.6)
ROG Strix G18 G814JI: Ø114.7 (91.36-170)
Stealth 16 Studio A13VG: Ø121.5 (89.45-374)
15X ASF: Ø115.5 (80.627-139.1)
...
NVIDIA GeForce RTX 4070 Laptop GPU
max:
0 100 200 300 400 500 600 700 800 900 1000 Tooltip ROG Strix G18 G814JI: Ø107.8 (57.2-1005)
Stealth 16 Studio A13VG: Ø70.3 (53.365-133.2)
15X ASF: Ø71.9 (50.409-104.5)
...
NVIDIA GeForce RTX 4070 Laptop GPU
max:
0 100 Tooltip ROG Strix G18 G814JI: Ø35.1 (23.154-156.7)
NVIDIA GeForce RTX 4070 Laptop GPU
max:
» With all tested laptops playable in detail settings ultra.
Additional Benchmarks
Low Preset 1280x720
269 [X] Aorus 15X ASF Intel Core i7-13700HX 1.5GHz
NVIDIA GeForce RTX 4070 Laptop GPU
min:
83.5 fps, P0.1:
100.8 fps, P1:
174.3 fps, max:
462 fps
...
NVIDIA GeForce RTX 4070 Laptop GPU
max:
...
NVIDIA GeForce RTX 4070 Laptop GPU
max:
...
NVIDIA GeForce RTX 4070 Laptop GPU
...
max:
...
NVIDIA GeForce RTX 4070 Laptop GPU
...
max:
...
NVIDIA GeForce RTX 4070 Laptop GPU
...
max:
...
NVIDIA GeForce RTX 4070 Laptop GPU
...
max:
» With all tested laptops playable in detail settings ultra.
Additional Benchmarks
Low Preset (without FSR Upscaling) 1280x720
Ultra Preset (without FSR Upscaling) + Full Ray-Tracing 1920x1080
0 100 Tooltip 15X ASF: Ø122.4 (105.115-179.5)
...
NVIDIA GeForce RTX 4070 Laptop GPU
max:
0 100 Tooltip 15X ASF: Ø117.2 (100.738-153.9)
ROG Strix G18 G814JI: Ø133.8 (120.237-157.5)
...
NVIDIA GeForce RTX 4070 Laptop GPU
max:
0 100 200 300 400 500 600 700 800 900 1000 1100 1200 1300 1400 1500 1600 1700 Tooltip 15X ASF: Ø146.1 (88.1-1752)
ROG Strix G18 G814JI: Ø112.1 (94.193-125.99)
...
NVIDIA GeForce RTX 4070 Laptop GPU
max:
0 100 200 Tooltip 15X ASF: Ø100.5 (77.713-297)
ROG Strix G18 G814JI: Ø100.2 (86.15-121.5)
...
NVIDIA GeForce RTX 4070 Laptop GPU
max:
0 100 Tooltip ROG Strix G18 G814JI: Ø70.6 (60.038-89.7)
15X ASF: Ø80.4 (32.376-112.3)
NVIDIA GeForce RTX 4070 Laptop GPU
max:
0 Tooltip ROG Strix G18 G814JI: Ø41.2 (29.624-70.9)
NVIDIA GeForce RTX 4070 Laptop GPU
max:
» With all tested laptops playable in detail settings ultra.
Additional Benchmarks
Low Preset 1280x720
119.6 [X] Aorus 15X ASF Intel Core i7-13700HX 1.5GHz
NVIDIA GeForce RTX 4070 Laptop GPU
min:
64.3 fps, P0.1:
73.2 fps, P1:
90.6 fps, max:
149.3 fps
...
NVIDIA GeForce RTX 4070 Laptop GPU
max:
...
NVIDIA GeForce RTX 4070 Laptop GPU
max:
...
NVIDIA GeForce RTX 4070 Laptop GPU
...
max:
NVIDIA GeForce RTX 4070 Laptop GPU
...
max:
» With all tested laptops playable in detail settings ultra.
Additional Benchmarks
Very High Preset + Ray-Tracing TAA 1920x0180
...
NVIDIA GeForce RTX 4070 Laptop GPU
...
max:
...
NVIDIA GeForce RTX 4070 Laptop GPU
max:
59 71 72 72 72 [X] Lenovo Yoga Pro 9i RTX4070 Intel Core i9-13905H 1.9GHz
NVIDIA GeForce RTX 4070 Laptop GPU
min:
36 fps
74 76 76 [X] Asus ROG Flow X16 GV601VI Intel Core i9-13900H 1.9GHz
NVIDIA GeForce RTX 4070 Laptop GPU
min:
37 fps
77 ~ 72 fps
+ Compare
- Hide Comparison
...
NVIDIA GeForce RTX 4070 Laptop GPU
max:
NVIDIA GeForce RTX 4070 Laptop GPU
max:
NVIDIA GeForce RTX 4070 Laptop GPU
max:
» With all tested laptops playable in detail settings ultra.
0 100 200 300 400 500 600 700 800 900 1000 1100 1200 1300 1400 Tooltip 15X ASF: Ø189.3 (88.29-1482)
Stealth 16 Studio A13VG: Ø96.8 (88.1-113.5)
...
NVIDIA GeForce RTX 4070 Laptop GPU
max:
0 100 Tooltip 15X ASF: Ø93.6 (83.589-111.6)
Stealth 16 Studio A13VG: Ø96 (85.269-111.94)
...
NVIDIA GeForce RTX 4070 Laptop GPU
max:
0 100 Tooltip 15X ASF: Ø93.2 (78.017-121.5)
Stealth 16 Studio A13VG: Ø88.6 (82.784-110.7)
...
NVIDIA GeForce RTX 4070 Laptop GPU
max:
0 100 200 Tooltip 15X ASF: Ø83.9 (77.273-89.338)
Stealth 16 Studio A13VG: Ø89.8 (76.601-232.7)
...
NVIDIA GeForce RTX 4070 Laptop GPU
max:
0 Tooltip 15X ASF: Ø66.4 (59.84-82.4)
Stealth 16 Studio A13VG: Ø64.7 (59.027-78.7)
...
NVIDIA GeForce RTX 4070 Laptop GPU
max:
» With all tested laptops playable in detail settings ultra.
Additional Benchmarks
Low Preset 1280x720
0 100 200 300 400 500 600 700 800 900 1000 1100 1200 1300 1400 Tooltip Omen 16-xf0376ng: Ø72.1 (59.13-170.6)
ROG Strix G18 G814JI: Ø115.1 (67.481-1464)
...
NVIDIA GeForce RTX 4070 Laptop GPU
max:
0 100 Tooltip Omen 16-xf0376ng: Ø63.7 (53.042-132.6)
ROG Strix G18 G814JI: Ø70 (59.035-110.5)
...
NVIDIA GeForce RTX 4070 Laptop GPU
max:
0 100 200 300 Tooltip Omen 16-xf0376ng: Ø62.3 (49.562-185.4)
ROG Strix G18 G814JI: Ø75.2 (51.102-363)
...
NVIDIA GeForce RTX 4070 Laptop GPU
...
max:
0 Tooltip ROG Strix G18 G814JI: Ø45.5 (37.086-87.8)
...
NVIDIA GeForce RTX 4070 Laptop GPU
...
max:
0 Tooltip ROG Strix G18 G814JI: Ø24.8 (21.547-36.4)
...
NVIDIA GeForce RTX 4070 Laptop GPU
...
max:
» With all tested laptops playable in detail settings ultra.
0 100 Tooltip 15X ASF: Ø169.6 (156.162-198.5)
...
NVIDIA GeForce RTX 4070 Laptop GPU
max:
0 100 200 300 400 500 600 Tooltip ROG Strix G18 G814JI: Ø156.9 (113.152-629)
...
NVIDIA GeForce RTX 4070 Laptop GPU
max:
0 100 200 300 400 500 600 Tooltip ROG Strix G18 G814JI: Ø134.2 (95.322-654)
...
NVIDIA GeForce RTX 4070 Laptop GPU
max:
0 100 200 300 400 500 600 700 800 900 1000 1100 1200 1300 1400 1500 1600 1700 Tooltip ROG Strix G18 G814JI: Ø134.9 (80.407-1772)
...
NVIDIA GeForce RTX 4070 Laptop GPU
max:
0 100 200 Tooltip ROG Strix G18 G814JI: Ø69.7 (55.508-204)
...
NVIDIA GeForce RTX 4070 Laptop GPU
max:
0 Tooltip ROG Strix G18 G814JI: Ø33 (22.141-81.4)
...
NVIDIA GeForce RTX 4070 Laptop GPU
max:
» With all tested laptops playable in detail settings ultra.
138.5 151 [X] Lenovo Yoga Pro 9i RTX4070 959964
Intel Core i9-13905H 1.9GHz
NVIDIA GeForce RTX 4070 Laptop GPU
min:
124 fps, P1:
90 fps, max:
179 fps
155.1 192.3 [X] Asus ROG Flow Z13 ACRNM 959964
Intel Core i9-13900H 1.9GHz
NVIDIA GeForce RTX 4070 Laptop GPU
min:
150 fps, P1:
109 fps, max:
220 fps
192.9 194.5 206 220 225 [X] Acer Nitro 16 AN16-41 959964
AMD Ryzen 7 7735HS 3.2GHz
NVIDIA GeForce RTX 4070 Laptop GPU
min:
166 fps, P1:
138 fps, max:
258 fps
232 [X] Razer Blade 14 RTX 4070 959964
AMD Ryzen 9 7940HS 4GHz
NVIDIA GeForce RTX 4070 Laptop GPU
min:
177 fps, P1:
142 fps, max:
265 fps
235 [X] Alienware m16 R2 959964
Intel Core Ultra 7 155H 3.8GHz
NVIDIA GeForce RTX 4070 Laptop GPU
min:
175 fps, P1:
138 fps, max:
268 fps
239 [X] MSI Pulse 17 B13VGK 959964
Intel Core i7-13700H 1.8GHz
NVIDIA GeForce RTX 4070 Laptop GPU
min:
173 fps, P1:
92 fps, max:
284 fps
247 256 [X] Aorus 15X ASF 959964
Intel Core i7-13700HX 1.5GHz
NVIDIA GeForce RTX 4070 Laptop GPU
min:
208 fps, P1:
124 fps, max:
321 fps
256 258 262 [X] Medion Erazer Major X20 959964
Intel Core i9-13900HX 1.6GHz
NVIDIA GeForce RTX 4070 Laptop GPU
min:
213 fps, P1:
141 fps, max:
310 fps
275 279 [X] MSI Raider GE68 HX 13VG, i7-13700HX 959964
Intel Core i7-13700HX 1.5GHz
NVIDIA GeForce RTX 4070 Laptop GPU
min:
206 fps, P1:
153 fps, max:
328 fps
301 [X] HP Omen Transcend 16 959964
Intel Core i9-13900HX 1.6GHz
NVIDIA GeForce RTX 4070 Laptop GPU
min:
219 fps, P1:
159 fps, max:
358 fps
310 [X] Uniwill GM6PX7X RTX 4070 959964
Intel Core i7-13700HX 1.5GHz
NVIDIA GeForce RTX 4070 Laptop GPU
min:
232 fps, P1:
187 fps, max:
364 fps
311 320 ~ 237 fps
+ Compare
- Hide Comparison
...
NVIDIA GeForce RTX 4070 Laptop GPU
...
max:
133.8 145.8 [X] Lenovo Yoga Pro 9i RTX4070 959964
Intel Core i9-13905H 1.9GHz
NVIDIA GeForce RTX 4070 Laptop GPU
min:
105 fps, P1:
83 fps, max:
209 fps
148.5 190 [X] Asus ROG Flow Z13 ACRNM 959964
Intel Core i9-13900H 1.9GHz
NVIDIA GeForce RTX 4070 Laptop GPU
min:
142 fps, P1:
102 fps, max:
224 fps
196.4 199.7 200 214 220 221 [X] Razer Blade 14 RTX 4070 959964
AMD Ryzen 9 7940HS 4GHz
NVIDIA GeForce RTX 4070 Laptop GPU
min:
171 fps, P1:
140 fps, max:
253 fps
222 [X] Acer Nitro 16 AN16-41 959964
AMD Ryzen 7 7735HS 3.2GHz
NVIDIA GeForce RTX 4070 Laptop GPU
min:
172 fps, P1:
141 fps, max:
258 fps
225 [X] Alienware m16 R2 959964
Intel Core Ultra 7 155H 3.8GHz
NVIDIA GeForce RTX 4070 Laptop GPU
min:
174 fps, P1:
138 fps, max:
264 fps
228 [X] MSI Pulse 17 B13VGK 959964
Intel Core i7-13700H 1.8GHz
NVIDIA GeForce RTX 4070 Laptop GPU
min:
173 fps, P1:
82 fps, max:
288 fps
240 242 246 251 [X] Aorus 15X ASF 959964
Intel Core i7-13700HX 1.5GHz
NVIDIA GeForce RTX 4070 Laptop GPU
min:
186 fps, P1:
130 fps, max:
299 fps
261 264 [X] Medion Erazer Major X20 959964
Intel Core i9-13900HX 1.6GHz
NVIDIA GeForce RTX 4070 Laptop GPU
min:
213 fps, P1:
152 fps, max:
318 fps
273 [X] MSI Raider GE68 HX 13VG, i7-13700HX 959964
Intel Core i7-13700HX 1.5GHz
NVIDIA GeForce RTX 4070 Laptop GPU
min:
203 fps, P1:
153 fps, max:
307 fps
275 289 [X] HP Omen Transcend 16 959964
Intel Core i9-13900HX 1.6GHz
NVIDIA GeForce RTX 4070 Laptop GPU
min:
220 fps, P1:
156 fps, max:
341 fps
300 306 [X] Uniwill GM6PX7X RTX 4070 959964
Intel Core i7-13700HX 1.5GHz
NVIDIA GeForce RTX 4070 Laptop GPU
min:
227 fps, P1:
195 fps, max:
347 fps
312 ~ 232 fps
+ Compare
- Hide Comparison
...
NVIDIA GeForce RTX 4070 Laptop GPU
...
max:
109 111.2 123.5 140.1 [X] Lenovo Yoga Pro 9i RTX4070 959964
Intel Core i9-13905H 1.9GHz
NVIDIA GeForce RTX 4070 Laptop GPU
min:
116 fps, P1:
79 fps, max:
179 fps
158.2 163 [X] Asus ROG Flow Z13 ACRNM 959964
Intel Core i9-13900H 1.9GHz
NVIDIA GeForce RTX 4070 Laptop GPU
min:
136 fps, P1:
73 fps, max:
192 fps
166.3 168.1 173.8 182 183 183.4 186.7 [X] MSI Pulse 17 B13VGK 959964
Intel Core i7-13700H 1.8GHz
NVIDIA GeForce RTX 4070 Laptop GPU
min:
152 fps, P1:
65 fps, max:
228 fps
189.4 [X] Razer Blade 14 RTX 4070 959964
AMD Ryzen 9 7940HS 4GHz
NVIDIA GeForce RTX 4070 Laptop GPU
min:
160 fps, P1:
112 fps, max:
225 fps
193.7 [X] Aorus 15X ASF 959964
Intel Core i7-13700HX 1.5GHz
NVIDIA GeForce RTX 4070 Laptop GPU
min:
166 fps, P1:
103 fps, max:
225 fps
195.2 205 [X] Acer Nitro 16 AN16-41 959964
AMD Ryzen 7 7735HS 3.2GHz
NVIDIA GeForce RTX 4070 Laptop GPU
min:
164 fps, P1:
128 fps, max:
235 fps
206 [X] Medion Erazer Major X20 959964
Intel Core i9-13900HX 1.6GHz
NVIDIA GeForce RTX 4070 Laptop GPU
min:
175 fps, P1:
119 fps, max:
236 fps
210 211 217 217 [X] Alienware m16 R2 959964
Intel Core Ultra 7 155H 3.8GHz
NVIDIA GeForce RTX 4070 Laptop GPU
min:
162 fps, P1:
127 fps, max:
248 fps
219 221 [X] HP Omen Transcend 16 959964
Intel Core i9-13900HX 1.6GHz
NVIDIA GeForce RTX 4070 Laptop GPU
min:
192 fps, P1:
130 fps, max:
253 fps
222 225 [X] MSI Raider GE68 HX 13VG, i7-13700HX 959964
Intel Core i7-13700HX 1.5GHz
NVIDIA GeForce RTX 4070 Laptop GPU
min:
196 fps, P1:
134 fps, max:
255 fps
231 [X] Uniwill GM6PX7X RTX 4070 959964
Intel Core i7-13700HX 1.5GHz
NVIDIA GeForce RTX 4070 Laptop GPU
min:
201 fps, P1:
151 fps, max:
261 fps
235 245 ~ 189 fps
+ Compare
- Hide Comparison
...
NVIDIA GeForce RTX 4070 Laptop GPU
max:
39.2 54 59.4 60.7 61.8 [X] Asus ROG Flow Z13 ACRNM 959964
Intel Core i9-13900H 1.9GHz
NVIDIA GeForce RTX 4070 Laptop GPU
min:
52 fps, P1:
38 fps, max:
73 fps
65.6 66.6 67 71 [X] MSI Pulse 17 B13VGK 959964
Intel Core i7-13700H 1.8GHz
NVIDIA GeForce RTX 4070 Laptop GPU
min:
60 fps, P1:
39 fps, max:
87 fps
71.4 [X] Lenovo Yoga Pro 9i RTX4070 959964
Intel Core i9-13905H 1.9GHz
NVIDIA GeForce RTX 4070 Laptop GPU
min:
57 fps, P1:
40 fps, max:
84 fps
71.8 72.6 76.6 76.7 77.8 78.2 78.7 [X] Aorus 15X ASF 959964
Intel Core i7-13700HX 1.5GHz
NVIDIA GeForce RTX 4070 Laptop GPU
min:
66 fps, P1:
49 fps, max:
90 fps
79.3 [X] Acer Nitro 16 AN16-41 959964
AMD Ryzen 7 7735HS 3.2GHz
NVIDIA GeForce RTX 4070 Laptop GPU
min:
66 fps, P1:
59 fps, max:
94 fps
79.3 [X] HP Omen Transcend 16 959964
Intel Core i9-13900HX 1.6GHz
NVIDIA GeForce RTX 4070 Laptop GPU
min:
63 fps, P1:
43 fps, max:
93 fps
79.3 [X] MSI Raider GE68 HX 13VG, i7-13700HX 959964
Intel Core i7-13700HX 1.5GHz
NVIDIA GeForce RTX 4070 Laptop GPU
min:
69 fps, P1:
65 fps, max:
93 fps
81.5 81.7 83.1 83.6 [X] Alienware m16 R2 959964
Intel Core Ultra 7 155H 3.8GHz
NVIDIA GeForce RTX 4070 Laptop GPU
min:
72 fps, P1:
69 fps, max:
98 fps
83.8 83.9 [X] Medion Erazer Major X20 959964
Intel Core i9-13900HX 1.6GHz
NVIDIA GeForce RTX 4070 Laptop GPU
min:
73 fps, P1:
64 fps, max:
98 fps
84.1 84.2 88.7 ~ 74 fps
+ Compare
- Hide Comparison
...
NVIDIA GeForce RTX 4070 Laptop GPU
...
max:
10.6 36 39.4 40.9 [X] Asus ROG Flow Z13 ACRNM 959964
Intel Core i9-13900H 1.9GHz
NVIDIA GeForce RTX 4070 Laptop GPU
min:
34 fps, P1:
32 fps, max:
47 fps
42.4 44.3 44.3 44.3 46.2 47 47.1 47.8 [X] Lenovo Yoga Pro 9i RTX4070 959964
Intel Core i9-13905H 1.9GHz
NVIDIA GeForce RTX 4070 Laptop GPU
min:
36 fps, P1:
30 fps, max:
54 fps
48.4 49 49.7 50.3 [X] Acer Nitro 16 AN16-41 959964
AMD Ryzen 7 7735HS 3.2GHz
NVIDIA GeForce RTX 4070 Laptop GPU
min:
43 fps, P1:
41 fps, max:
58 fps
50.4 [X] HP Omen Transcend 16 959964
Intel Core i9-13900HX 1.6GHz
NVIDIA GeForce RTX 4070 Laptop GPU
min:
43 fps, P1:
38 fps, max:
60 fps
50.8 51.1 [X] MSI Raider GE68 HX 13VG, i7-13700HX 959964
Intel Core i7-13700HX 1.5GHz
NVIDIA GeForce RTX 4070 Laptop GPU
min:
44 fps, P1:
42 fps, max:
60 fps
51.9 52.2 [X] Aorus 15X ASF 959964
Intel Core i7-13700HX 1.5GHz
NVIDIA GeForce RTX 4070 Laptop GPU
min:
44 fps, P1:
39 fps, max:
61 fps
52.9 [X] Alienware m16 R2 959964
Intel Core Ultra 7 155H 3.8GHz
NVIDIA GeForce RTX 4070 Laptop GPU
min:
46 fps, P1:
45 fps, max:
62 fps
53.3 [X] Medion Erazer Major X20 959964
Intel Core i9-13900HX 1.6GHz
NVIDIA GeForce RTX 4070 Laptop GPU
min:
43 fps, P1:
40 fps, max:
61 fps
53.8 54.7 54.8 55.1 58.8 ~ 47 fps
+ Compare
- Hide Comparison
...
NVIDIA GeForce RTX 4070 Laptop GPU
...
max:
...
NVIDIA GeForce RTX 4070 Laptop GPU
max:
» With all tested laptops playable in detail settings ultra.
Additional Benchmarks
Ultra Low Preset 16xAF TAA 1280x720
333 [X] Aorus 15X ASF Intel Core i7-13700HX 1.5GHz
NVIDIA GeForce RTX 4070 Laptop GPU
min:
252 fps, P1:
212 fps, max:
376 fps
63.1 [X] no model min:
39 fps, P1:
40 fps, max:
75 fps
308 [X] MSI Pulse 17 B13VGK 1008687
Intel Core i7-13700H 1.8GHz
NVIDIA GeForce RTX 4070 Laptop GPU
min:
232 fps, P1:
186 fps, max:
341 fps
196.4 [X] Lenovo Yoga Pro 9i RTX4070 Intel Core i9-13905H 1.9GHz
NVIDIA GeForce RTX 4070 Laptop GPU
min:
125 fps, P1:
103 fps, max:
272 fps
366 [X] HP Omen Transcend 16 Intel Core i9-13900HX 1.6GHz
NVIDIA GeForce RTX 4070 Laptop GPU
min:
270 fps, P1:
222 fps, max:
410 fps
335 [X] MSI Raider GE68 HX 13VG, i7-13700HX 959964
Intel Core i7-13700HX 1.5GHz
NVIDIA GeForce RTX 4070 Laptop GPU
min:
243 fps, P1:
208 fps, max:
370 fps
282 [X] Alienware m16 R2 2.02
Intel Core Ultra 7 155H 3.8GHz
NVIDIA GeForce RTX 4070 Laptop GPU
min:
215 fps, P1:
182 fps, max:
311 fps
0 100 200 Tooltip ROG Strix G18 G814JI: Ø217 (166.01-269.65)
...
NVIDIA GeForce RTX 4070 Laptop GPU
max:
0 100 200 300 Tooltip ROG Strix G18 G814JI: Ø206 (166.444-317.6)
...
NVIDIA GeForce RTX 4070 Laptop GPU
max:
0 100 200 Tooltip ROG Strix G18 G814JI: Ø200 (170.53-260.3)
...
NVIDIA GeForce RTX 4070 Laptop GPU
max:
0 100 Tooltip ROG Strix G18 G814JI: Ø150.3 (134.49-181)
...
NVIDIA GeForce RTX 4070 Laptop GPU
max:
0 100 Tooltip ROG Strix G18 G814JI: Ø83 (71.342-166.2)
...
NVIDIA GeForce RTX 4070 Laptop GPU
max:
» With all tested laptops playable in detail settings ultra.
0 100 200 300 Tooltip ROG Strix G18 G814JI: Ø178.8 (159.18-325.6)
...
NVIDIA GeForce RTX 4070 Laptop GPU
max:
0 100 200 Tooltip ROG Strix G18 G814JI: Ø175.5 (147.545-266.7)
...
NVIDIA GeForce RTX 4070 Laptop GPU
max:
0 100 Tooltip ROG Strix G18 G814JI: Ø169.2 (146.09-196.5)
...
NVIDIA GeForce RTX 4070 Laptop GPU
max:
0 100 Tooltip ROG Strix G18 G814JI: Ø112.2 (99.957-154.9)
...
NVIDIA GeForce RTX 4070 Laptop GPU
max:
0 100 Tooltip ROG Strix G18 G814JI: Ø61.2 (49.468-137.1)
...
NVIDIA GeForce RTX 4070 Laptop GPU
max:
» With all tested laptops playable in detail settings ultra.
Additional Benchmarks
Highest Settings + Maximum Ray Tracing 1920x1080
...
NVIDIA GeForce RTX 4070 Laptop GPU
max:
...
NVIDIA GeForce RTX 4070 Laptop GPU
max:
...
NVIDIA GeForce RTX 4070 Laptop GPU
...
max:
...
NVIDIA GeForce RTX 4070 Laptop GPU
...
max:
...
NVIDIA GeForce RTX 4070 Laptop GPU
...
max:
...
NVIDIA GeForce RTX 4070 Laptop GPU
...
max:
» With all tested laptops playable in detail settings ultra.
Additional Benchmarks
Lowest Preset (DX12) 1280x720
...
NVIDIA GeForce RTX 4070 Laptop GPU
max:
...
NVIDIA GeForce RTX 4070 Laptop GPU
...
max:
...
NVIDIA GeForce RTX 4070 Laptop GPU
...
max:
48 65 71 71.6 81.7 [X] Asus ROG Flow X16 GV601VI Intel Core i9-13900H 1.9GHz
NVIDIA GeForce RTX 4070 Laptop GPU
min:
45.52 fps, max:
117.95 fps
82 82 83.3 83.6 [X] Lenovo Yoga Pro 9i RTX4070 Intel Core i9-13905H 1.9GHz
NVIDIA GeForce RTX 4070 Laptop GPU
min:
21.38 fps, max:
143.88 fps
84.8 86 86.7 87 87.5 [X] HP Omen Transcend 16 Intel Core i9-13900HX 1.6GHz
NVIDIA GeForce RTX 4070 Laptop GPU
min:
22.3 fps, max:
140.9 fps
88.8 [X] MSI Raider GE68 HX 13VG, i7-13700HX Intel Core i7-13700HX 1.5GHz
NVIDIA GeForce RTX 4070 Laptop GPU
min:
47.93 fps, max:
138.39 fps
90 [X] Aorus 15 BSF Intel Core i7-13700H 1.8GHz
NVIDIA GeForce RTX 4070 Laptop GPU
min:
57.9 fps, max:
131.9 fps
90.7 91 91 92.1 93.6 98.9 102.3 110 [X] MSI Raider GE78 HX 13VI Intel Core i9-13980HX 1.6GHz
NVIDIA GeForce RTX 4070 Laptop GPU
min:
51.15 fps, max:
159.45 fps
~ 85 fps
+ Compare
- Hide Comparison
...
NVIDIA GeForce RTX 4070 Laptop GPU
max:
30 42 43 51.6 [X] Asus ROG Flow X16 GV601VI Intel Core i9-13900H 1.9GHz
NVIDIA GeForce RTX 4070 Laptop GPU
52 53.1 53.3 53.4 [X] Aorus 15 BSF Intel Core i7-13700H 1.8GHz
NVIDIA GeForce RTX 4070 Laptop GPU
min:
41.5 fps, max:
74.2 fps
53.5 53.9 54 54 54.4 54.5 [X] MSI Raider GE68 HX 13VG, i7-13700HX Intel Core i7-13700HX 1.5GHz
NVIDIA GeForce RTX 4070 Laptop GPU
min:
32.08 fps, max:
95.34 fps
54.5 54.5 55.4 55.6 57 57.5 [X] MSI Raider GE78 HX 13VI Intel Core i9-13980HX 1.6GHz
NVIDIA GeForce RTX 4070 Laptop GPU
58.1 61 61 [X] Lenovo Yoga Pro 9i RTX4070 Intel Core i9-13905H 1.9GHz
NVIDIA GeForce RTX 4070 Laptop GPU
min:
33.32 fps, max:
97.22 fps
63.9 ~ 53 fps
+ Compare
- Hide Comparison
...
NVIDIA GeForce RTX 4070 Laptop GPU
...
max:
...
NVIDIA GeForce RTX 4070 Laptop GPU
max:
» With all tested laptops playable in detail settings ultra.
Additional Benchmarks
Low Preset 1280x720
129 [X] Aorus 15 BSF Intel Core i7-13700H 1.8GHz
NVIDIA GeForce RTX 4070 Laptop GPU
min:
55 fps, max:
174.7 fps
Ray Tracing Ultra Preset (DLSS off) 1920x1080
41 [X] Aorus 15 BSF Intel Core i7-13700H 1.8GHz
NVIDIA GeForce RTX 4070 Laptop GPU
min:
29.4 fps, max:
54.6 fps
Ray Tracing Ultra Preset (DLSS off) 3840x2160
0 100 Tooltip ROG Strix G18 G814JI: Ø119.9 (117.397-122.74)
...
NVIDIA GeForce RTX 4070 Laptop GPU
0 100 200 Tooltip ROG Strix G18 G814JI: Ø126.3 (117.008-225.2)
...
NVIDIA GeForce RTX 4070 Laptop GPU
0 100 Tooltip ROG Strix G18 G814JI: Ø116.1 (105.094-151.8)
...
NVIDIA GeForce RTX 4070 Laptop GPU
0 100 200 Tooltip ROG Strix G18 G814JI: Ø88.6 (72.121-235.6)
...
NVIDIA GeForce RTX 4070 Laptop GPU
0 Tooltip ROG Strix G18 G814JI: Ø42 (36.852-54.5)
NVIDIA GeForce RTX 4070 Laptop GPU
max:
» With all tested laptops playable in detail settings ultra.
...
NVIDIA GeForce RTX 4070 Laptop GPU
max:
...
NVIDIA GeForce RTX 4070 Laptop GPU
...
max:
...
NVIDIA GeForce RTX 4070 Laptop GPU
...
max:
...
NVIDIA GeForce RTX 4070 Laptop GPU
...
max:
...
NVIDIA GeForce RTX 4070 Laptop GPU
max:
» With all tested laptops playable in detail settings ultra.
Additional Benchmarks
Low Preset 1280x720
0 Tooltip ROG Strix G18 G814JI: Ø62.1 (58.012-77.4)
...
NVIDIA GeForce RTX 4070 Laptop GPU
max:
0 100 200 300 400 500 600 700 Tooltip ROG Strix G18 G814JI: Ø100.6 (58.109-715)
...
NVIDIA GeForce RTX 4070 Laptop GPU
...
max:
0 Tooltip ROG Strix G18 G814JI: Ø61.4 (58.553-78.5)
...
NVIDIA GeForce RTX 4070 Laptop GPU
max:
0 Tooltip ROG Strix G18 G814JI: Ø64.8 (57.313-97.7)
...
NVIDIA GeForce RTX 4070 Laptop GPU
max:
0 Tooltip ROG Strix G18 G814JI: Ø49 (42.138-94)
NVIDIA GeForce RTX 4070 Laptop GPU
max:
» With all tested laptops playable in detail settings ultra.
...
NVIDIA GeForce RTX 4070 Laptop GPU
max:
...
NVIDIA GeForce RTX 4070 Laptop GPU
max:
...
NVIDIA GeForce RTX 4070 Laptop GPU
max:
» With all tested laptops playable in detail settings high.
Additional Benchmarks
High Quality Raytracing 1920x1080
...
NVIDIA GeForce RTX 4070 Laptop GPU
max:
...
NVIDIA GeForce RTX 4070 Laptop GPU
max:
...
NVIDIA GeForce RTX 4070 Laptop GPU
max:
...
NVIDIA GeForce RTX 4070 Laptop GPU
max:
...
NVIDIA GeForce RTX 4070 Laptop GPU
max:
» With all tested laptops playable in detail settings ultra.
0 100 Tooltip Stealth 16 Studio A13VG: Ø145.2 (134.51-158.7)
...
NVIDIA GeForce RTX 4070 Laptop GPU
max:
0 100 Tooltip Stealth 16 Studio A13VG: Ø124.2 (112.184-177.8)
...
NVIDIA GeForce RTX 4070 Laptop GPU
max:
0 100 Tooltip Stealth 16 Studio A13VG: Ø99.5 (91.409-146.1)
...
NVIDIA GeForce RTX 4070 Laptop GPU
max:
0 Tooltip Stealth 16 Studio A13VG: Ø70.6 (63.44-80.68)
...
NVIDIA GeForce RTX 4070 Laptop GPU
max:
0 Tooltip Stealth 16 Studio A13VG: Ø62.1 (53.55-93)
...
NVIDIA GeForce RTX 4070 Laptop GPU
max:
...
NVIDIA GeForce RTX 4070 Laptop GPU
max:
» With all tested laptops playable in detail settings ultra.
Additional Benchmarks
Low Preset 1280x720
0 100 200 Tooltip ROG Strix G18 G814JI: Ø179.1 (160.071-214.7)
...
NVIDIA GeForce RTX 4070 Laptop GPU
0 100 Tooltip ROG Strix G18 G814JI: Ø152.5 (139.16-175.4)
...
NVIDIA GeForce RTX 4070 Laptop GPU
0 100 Tooltip ROG Strix G18 G814JI: Ø146 (132.85-174.2)
...
NVIDIA GeForce RTX 4070 Laptop GPU
0 100 Tooltip ROG Strix G18 G814JI: Ø104.6 (94.459-115.6)
...
NVIDIA GeForce RTX 4070 Laptop GPU
0 Tooltip ROG Strix G18 G814JI: Ø59.4 (53.415-72.6)
...
NVIDIA GeForce RTX 4070 Laptop GPU
» With all tested laptops playable in detail settings ultra.
0 100 200 Tooltip ROG Strix G18 G814JI: Ø209 (-0.03368-292.8)
...
NVIDIA GeForce RTX 4070 Laptop GPU
max:
0 100 200 Tooltip ROG Strix G18 G814JI: Ø152.3 (-0.03515-235.9)
...
NVIDIA GeForce RTX 4070 Laptop GPU
max:
0 100 200 Tooltip ROG Strix G18 G814JI: Ø144.8 (-0.03703-202.3)
...
NVIDIA GeForce RTX 4070 Laptop GPU
max:
0 100 Tooltip ROG Strix G18 G814JI: Ø140.1 (-0.04085-191)
...
NVIDIA GeForce RTX 4070 Laptop GPU
max:
0 100 200 Tooltip ROG Strix G18 G814JI: Ø99.3 (-0.04035-218.6)
...
NVIDIA GeForce RTX 4070 Laptop GPU
max:
» With all tested laptops playable in detail settings ultra.
...
NVIDIA GeForce RTX 4070 Laptop GPU
max:
...
NVIDIA GeForce RTX 4070 Laptop GPU
max:
...
NVIDIA GeForce RTX 4070 Laptop GPU
max:
...
NVIDIA GeForce RTX 4070 Laptop GPU
max:
...
NVIDIA GeForce RTX 4070 Laptop GPU
max:
» With all tested laptops playable in detail settings ultra.
...
NVIDIA GeForce RTX 4070 Laptop GPU
max:
...
NVIDIA GeForce RTX 4070 Laptop GPU
max:
...
NVIDIA GeForce RTX 4070 Laptop GPU
max:
...
NVIDIA GeForce RTX 4070 Laptop GPU
max:
...
NVIDIA GeForce RTX 4070 Laptop GPU
max:
» With all tested laptops playable in detail settings ultra.
Additional Benchmarks
Ultra Preset + Ultra Ray-Tracing 1920x1080
0 100 200 300 400 500 Tooltip ROG Strix G18 G814JI: Ø267 (197.704-550)
...
NVIDIA GeForce RTX 4070 Laptop GPU
0 100 200 Tooltip ROG Strix G18 G814JI: Ø224 (188.1-285.5)
...
NVIDIA GeForce RTX 4070 Laptop GPU
0 100 200 Tooltip ROG Strix G18 G814JI: Ø212 (173.999-274.325)
...
NVIDIA GeForce RTX 4070 Laptop GPU
0 100 Tooltip ROG Strix G18 G814JI: Ø132.7 (114.08-167.3)
...
NVIDIA GeForce RTX 4070 Laptop GPU
0 Tooltip ROG Strix G18 G814JI: Ø76.1 (63.334-89.27)
...
NVIDIA GeForce RTX 4070 Laptop GPU
max:
» With all tested laptops playable in detail settings ultra.
0 100 200 Tooltip Stealth 16 Studio A13VG: Ø168.8 (149-232)
...
NVIDIA GeForce RTX 4070 Laptop GPU
max:
0 100 Tooltip Stealth 16 Studio A13VG: Ø143 (125-168)
...
NVIDIA GeForce RTX 4070 Laptop GPU
max:
0 100 Tooltip Stealth 16 Studio A13VG: Ø126.5 (108-146)
...
NVIDIA GeForce RTX 4070 Laptop GPU
...
max:
0 100 Tooltip Stealth 16 Studio A13VG: Ø114.5 (90-133)
...
NVIDIA GeForce RTX 4070 Laptop GPU
...
max:
0 Tooltip Stealth 16 Studio A13VG: Ø86.7 (74-96)
...
NVIDIA GeForce RTX 4070 Laptop GPU
...
max:
...
NVIDIA GeForce RTX 4070 Laptop GPU
max:
» With all tested laptops playable in detail settings ultra.
Additional Benchmarks
Low Graphics Quality 1920x1080
Ultra Graphics Quality + HD Textures + DXR TAA 1920x1080
0 100 200 300 400 500 Tooltip ROG Strix G18 G814JI: Ø158.1 (125.28-573)
...
NVIDIA GeForce RTX 4070 Laptop GPU
0 100 Tooltip ROG Strix G18 G814JI: Ø134.6 (105.706-181)
...
NVIDIA GeForce RTX 4070 Laptop GPU
0 100 Tooltip ROG Strix G18 G814JI: Ø110.2 (91.135-143.86)
...
NVIDIA GeForce RTX 4070 Laptop GPU
0 Tooltip ROG Strix G18 G814JI: Ø67.7 (54.38-87.19)
NVIDIA GeForce RTX 4070 Laptop GPU
0 Tooltip ROG Strix G18 G814JI: Ø42 (34.244-77.5)
NVIDIA GeForce RTX 4070 Laptop GPU
max:
» With all tested laptops playable in detail settings ultra.
...
NVIDIA GeForce RTX 4070 Laptop GPU
max:
...
NVIDIA GeForce RTX 4070 Laptop GPU
max:
...
NVIDIA GeForce RTX 4070 Laptop GPU
...
max:
...
NVIDIA GeForce RTX 4070 Laptop GPU
max:
...
NVIDIA GeForce RTX 4070 Laptop GPU
max:
...
NVIDIA GeForce RTX 4070 Laptop GPU
max:
» With all tested laptops playable in detail settings ultra.
0 100 200 300 400 500 600 700 800 900 1000 1100 1200 1300 1400 1500 1600 1700 1800 1900 2000 2100 2200 2300 2400 2500 2600 2700 2800 2900 3000 3100 3200 3300 3400 3500 3600 3700 3800 3900 4000 4100 4200 4300 4400 4500 4600 4700 4800 4900 5000 5100 5200 5300 5400 5500 5600 5700 5800 5900 6000 6100 6200 6300 6400 6500 6600 6700 Tooltip ROG Strix G18 G814JI: Ø320 (161.12-6795)
...
NVIDIA GeForce RTX 4070 Laptop GPU
0 100 200 Tooltip ROG Strix G18 G814JI: Ø159.4 (148.15-211.1)
...
NVIDIA GeForce RTX 4070 Laptop GPU
0 100 Tooltip ROG Strix G18 G814JI: Ø120.9 (110.076-135.541)
...
NVIDIA GeForce RTX 4070 Laptop GPU
max:
0 Tooltip ROG Strix G18 G814JI: Ø86.5 (81.028-99.97)
...
NVIDIA GeForce RTX 4070 Laptop GPU
max:
0 Tooltip ROG Strix G18 G814JI: Ø47.4 (42.202-59.7)
...
NVIDIA GeForce RTX 4070 Laptop GPU
max:
» With all tested laptops playable in detail settings ultra.
0 100 200 Tooltip ROG Strix G18 G814JI: Ø221 (174.923-265.6)
...
NVIDIA GeForce RTX 4070 Laptop GPU
max:
0 100 200 Tooltip ROG Strix G18 G814JI: Ø214 (168.59-255.6)
...
NVIDIA GeForce RTX 4070 Laptop GPU
max:
0 100 200 Tooltip ROG Strix G18 G814JI: Ø193.3 (153.01-237)
...
NVIDIA GeForce RTX 4070 Laptop GPU
0 100 Tooltip ROG Strix G18 G814JI: Ø130.1 (108.02-161.9)
...
NVIDIA GeForce RTX 4070 Laptop GPU
max:
0 100 Tooltip ROG Strix G18 G814JI: Ø66.7 (59.67-106.3)
...
NVIDIA GeForce RTX 4070 Laptop GPU
max:
» With all tested laptops playable in detail settings ultra.
Additional Benchmarks
Ray Tracing Preset 1920x1080
0 100 200 Tooltip ROG Strix G18 G814JI: Ø167.1 (125.108-231.21)
...
NVIDIA GeForce RTX 4070 Laptop GPU
max:
0 100 200 Tooltip ROG Strix G18 G814JI: Ø147.6 (117.01-202.9)
...
NVIDIA GeForce RTX 4070 Laptop GPU
max:
0 100 Tooltip ROG Strix G18 G814JI: Ø131.5 (104.07-172.122)
...
NVIDIA GeForce RTX 4070 Laptop GPU
max:
0 100 Tooltip ROG Strix G18 G814JI: Ø97.7 (79.73-164.7)
...
NVIDIA GeForce RTX 4070 Laptop GPU
max:
0 Tooltip ROG Strix G18 G814JI: Ø48.5 (39.15-58.49)
...
NVIDIA GeForce RTX 4070 Laptop GPU
max:
» With all tested laptops playable in detail settings ultra.
...
NVIDIA GeForce RTX 4070 Laptop GPU
max:
...
NVIDIA GeForce RTX 4070 Laptop GPU
max:
...
NVIDIA GeForce RTX 4070 Laptop GPU
max:
...
NVIDIA GeForce RTX 4070 Laptop GPU
max:
...
NVIDIA GeForce RTX 4070 Laptop GPU
max:
...
NVIDIA GeForce RTX 4070 Laptop GPU
max:
» With all tested laptops playable in detail settings ultra.
Additional Benchmarks
Minimum Settings 1920x1080
...
NVIDIA GeForce RTX 4070 Laptop GPU
max:
...
NVIDIA GeForce RTX 4070 Laptop GPU
max:
...
NVIDIA GeForce RTX 4070 Laptop GPU
max:
» With all tested laptops playable in detail settings ultra.
...
NVIDIA GeForce RTX 4070 Laptop GPU
max:
...
NVIDIA GeForce RTX 4070 Laptop GPU
...
max:
...
NVIDIA GeForce RTX 4070 Laptop GPU
...
max:
...
NVIDIA GeForce RTX 4070 Laptop GPU
max:
» With all tested laptops playable in detail settings ultra.
Additional Benchmarks
Ultra Preset + Ultra Ray Tracing (DX12) 1920x1080
0 100 Tooltip 15X ASF: Ø161.4 (101.28-178.9)
...
NVIDIA GeForce RTX 4070 Laptop GPU
0 100 Tooltip 15X ASF: Ø120.6 (102.165-168.9)
...
NVIDIA GeForce RTX 4070 Laptop GPU
0 100 200 300 Tooltip 15X ASF: Ø89.3 (59.276-326)
...
NVIDIA GeForce RTX 4070 Laptop GPU
0 100 200 300 400 500 600 700 800 900 1000 1100 1200 1300 Tooltip 15X ASF: Ø88.3 (56.115-1333)
...
NVIDIA GeForce RTX 4070 Laptop GPU
0 100 200 300 400 500 Tooltip 15X ASF: Ø60.9 (47.227-533)
...
NVIDIA GeForce RTX 4070 Laptop GPU
» With all tested laptops playable in detail settings ultra.
Additional Benchmarks
Low-End TAAAA 1920x1080
151.8 [X] Aorus 15X ASF Intel Core i7-13700HX 1.5GHz
NVIDIA GeForce RTX 4070 Laptop GPU
min:
36.4 fps, P0.1:
68.2 fps, P1:
97.5 fps, max:
185.7 fps
...
NVIDIA GeForce RTX 4070 Laptop GPU
max:
...
NVIDIA GeForce RTX 4070 Laptop GPU
max:
...
NVIDIA GeForce RTX 4070 Laptop GPU
max:
...
NVIDIA GeForce RTX 4070 Laptop GPU
max:
» With all tested laptops playable in detail settings ultra.
...
NVIDIA GeForce RTX 4070 Laptop GPU
max:
...
NVIDIA GeForce RTX 4070 Laptop GPU
max:
...
NVIDIA GeForce RTX 4070 Laptop GPU
max:
...
NVIDIA GeForce RTX 4070 Laptop GPU
max:
...
NVIDIA GeForce RTX 4070 Laptop GPU
max:
» With all tested laptops playable in detail settings ultra.
...
NVIDIA GeForce RTX 4070 Laptop GPU
...
max:
...
NVIDIA GeForce RTX 4070 Laptop GPU
...
max:
...
NVIDIA GeForce RTX 4070 Laptop GPU
max:
...
NVIDIA GeForce RTX 4070 Laptop GPU
max:
...
NVIDIA GeForce RTX 4070 Laptop GPU
max:
...
NVIDIA GeForce RTX 4070 Laptop GPU
max:
» With all tested laptops playable in detail settings ultra.
Additional Benchmarks
Very Low Overall Quality (DX11) 1920x1080
0 100 200 Tooltip Stealth 16 Studio A13VG: Ø164.5 (121-234)
...
NVIDIA GeForce RTX 4070 Laptop GPU
max:
0 100 Tooltip Stealth 16 Studio A13VG: Ø140 (111-194)
...
NVIDIA GeForce RTX 4070 Laptop GPU
max:
0 100 Tooltip Stealth 16 Studio A13VG: Ø134.6 (108-184)
...
NVIDIA GeForce RTX 4070 Laptop GPU
max:
0 100 Tooltip Stealth 16 Studio A13VG: Ø120.5 (88-175)
...
NVIDIA GeForce RTX 4070 Laptop GPU
max:
0 100 Tooltip Stealth 16 Studio A13VG: Ø104.6 (81-138)
...
NVIDIA GeForce RTX 4070 Laptop GPU
max:
» With all tested laptops playable in detail settings ultra.
...
NVIDIA GeForce RTX 4070 Laptop GPU
max:
...
NVIDIA GeForce RTX 4070 Laptop GPU
...
max:
...
NVIDIA GeForce RTX 4070 Laptop GPU
...
max:
...
NVIDIA GeForce RTX 4070 Laptop GPU
...
max:
...
NVIDIA GeForce RTX 4070 Laptop GPU
...
max:
...
NVIDIA GeForce RTX 4070 Laptop GPU
max:
» With all tested laptops playable in detail settings ultra.
Additional Benchmarks
Ultra Quality DXR 16xAF 1920x1080
...
NVIDIA GeForce RTX 4070 Laptop GPU
max:
...
NVIDIA GeForce RTX 4070 Laptop GPU
max:
...
NVIDIA GeForce RTX 4070 Laptop GPU
...
max:
...
NVIDIA GeForce RTX 4070 Laptop GPU
max:
...
NVIDIA GeForce RTX 4070 Laptop GPU
...
max:
...
NVIDIA GeForce RTX 4070 Laptop GPU
...
max:
» With all tested laptops playable in detail settings ultra.
Additional Benchmarks
Lowest Preset 1920x1080
315 334 [X] Dell XPS 15 9530 RTX 4070 1.47.22.14 D3D12
Intel Core i7-13700H 1.8GHz
NVIDIA GeForce RTX 4070 Laptop GPU
min:
48.1 fps, P1:
198.8 fps, max:
507 fps
340 [X] Lenovo Yoga Pro 9i RTX4070 1.47.22.14 D3D12
Intel Core i9-13905H 1.9GHz
NVIDIA GeForce RTX 4070 Laptop GPU
min:
71.7 fps, P1:
164.1 fps, max:
578 fps
362 367 [X] SCHENKER XMG CORE 16 (L23) 1.47.22.14 D3D12
AMD Ryzen 7 7840HS 3.8GHz
NVIDIA GeForce RTX 4070 Laptop GPU
min:
185.4 fps, P1:
287 fps, max:
581 fps
370 375 [X] Acer Nitro 16 AN16-41 1.47.22.14 D3D12
AMD Ryzen 7 7735HS 3.2GHz
NVIDIA GeForce RTX 4070 Laptop GPU
min:
189.2 fps, P1:
270 fps, max:
621 fps
390 [X] Razer Blade 14 RTX 4070 1.47.22.14 D3D12
AMD Ryzen 9 7940HS 4GHz
NVIDIA GeForce RTX 4070 Laptop GPU
min:
203 fps, P1:
289 fps, max:
633 fps
393 [X] Asus ROG Flow Z13 ACRNM 1.47.22.14 D3D12
Intel Core i9-13900H 1.9GHz
NVIDIA GeForce RTX 4070 Laptop GPU
min:
107.2 fps, P1:
272 fps, max:
602 fps
414 [X] HP Omen Transcend 16 1.47.22.14 D3D12
Intel Core i9-13900HX 1.6GHz
NVIDIA GeForce RTX 4070 Laptop GPU
min:
82 fps, P1:
312 fps, max:
554 fps
418 423 427 [X] Alienware m16 R2 1.47.22.14 D3D12
Intel Core Ultra 7 155H 3.8GHz
NVIDIA GeForce RTX 4070 Laptop GPU
min:
219 fps, P1:
315 fps, max:
618 fps
431 [X] Dell XPS 17 9730 RTX 4070 1.47.22.14 D3D12
Intel Core i7-13700H 1.8GHz
NVIDIA GeForce RTX 4070 Laptop GPU
min:
56.3 fps, P1:
307 fps, max:
624 fps
436 455 [X] Aorus 16X 2024 1.47.22.14 D3D12
Intel Core i9-14900HX 1.6GHz
NVIDIA GeForce RTX 4070 Laptop GPU
min:
143.7 fps, P1:
270 fps, max:
702 fps
464 [X] Razer Blade 18 RTX 4070 1.47.22.14 D3D12
Intel Core i9-13950HX 1.6GHz
NVIDIA GeForce RTX 4070 Laptop GPU
min:
23.5 fps, P1:
346 fps, max:
637 fps
468 [X] MSI Pulse 17 B13VGK 1.47.22.14 D3D12
Intel Core i7-13700H 1.8GHz
NVIDIA GeForce RTX 4070 Laptop GPU
min:
30.9 fps, P1:
305 fps, max:
669 fps
470 [X] MSI Stealth 16 Studio A13VG 1.47.22.14 D3D12
Intel Core i7-13700H 1.8GHz
NVIDIA GeForce RTX 4070 Laptop GPU
min:
52.7 fps, P1:
326 fps, max:
709 fps
476 481 [X] Gigabyte AERO 16 OLED BSF 1.47.22.14 D3D12
Intel Core i9-13900H 1.9GHz
NVIDIA GeForce RTX 4070 Laptop GPU
min:
40.8 fps, P1:
348 fps, max:
762 fps
483 485 [X] Aorus 15 BSF 1.47.22.14 D3D12
Intel Core i7-13700H 1.8GHz
NVIDIA GeForce RTX 4070 Laptop GPU
min:
8.5 fps, P1:
330 fps, max:
734 fps
490 [X] Medion Erazer Major X20 1.47.22.14 D3D12
Intel Core i9-13900HX 1.6GHz
NVIDIA GeForce RTX 4070 Laptop GPU
min:
182.9 fps, P1:
370 fps, max:
680 fps
490 [X] Acer Predator Helios Neo 16 PHN16-72 1.47.22.14 D3D12
Intel Core i7-14700HX 3.9GHz
NVIDIA GeForce RTX 4070 Laptop GPU
min:
113.8 fps, P1:
378 fps, max:
672 fps
496 [X] Lenovo Legion Pro 5 16IRX9 1.47.22.14 D3D12
Intel Core i9-14900HX 1.6GHz
NVIDIA GeForce RTX 4070 Laptop GPU
min:
284 fps, P1:
378 fps, max:
653 fps
537 [X] Aorus 15X ASF 1.47.22.14 D3D12
Intel Core i7-13700HX 1.5GHz
NVIDIA GeForce RTX 4070 Laptop GPU
min:
42.6 fps, P1:
395 fps, max:
763 fps
544 [X] XMG Pro 16 Studio (Mid 23) 1.47.22.14 D3D12
Intel Core i9-13900H 1.9GHz
NVIDIA GeForce RTX 4070 Laptop GPU
min:
150.4 fps, P1:
383 fps, max:
812 fps
558 [X] SCHENKER XMG Fusion 15 (Early 24) 1.47.22.14 D3D12
Intel Core i9-14900HX 1.6GHz
NVIDIA GeForce RTX 4070 Laptop GPU
min:
91 fps, P1:
437 fps, max:
785 fps
567 [X] Uniwill GM6PX7X RTX 4070 1.47.22.14 D3D12
Intel Core i7-13700HX 1.5GHz
NVIDIA GeForce RTX 4070 Laptop GPU
min:
119.6 fps, P1:
419 fps, max:
825 fps
636 [X] Lenovo Legion Pro 5 16ARX8 1.47.22.14 D3D12
AMD Ryzen 7 7745HX 3.6GHz
NVIDIA GeForce RTX 4070 Laptop GPU
min:
124.2 fps, P1:
480 fps, max:
899 fps
~ 448 fps
+ Compare
- Hide Comparison
...
NVIDIA GeForce RTX 4070 Laptop GPU
max:
162.1 172.1 [X] Dell XPS 15 9530 RTX 4070 1.47.22.14 D3D12
Intel Core i7-13700H 1.8GHz
NVIDIA GeForce RTX 4070 Laptop GPU
min:
51 fps, P1:
133.7 fps, max:
274 fps
224 [X] HP Victus 16-r0077ng 1.47.22.14 D3D12
Intel Core i7-13700H 1.8GHz
NVIDIA GeForce RTX 4070 Laptop GPU
min:
21.5 fps, P1:
163.6 fps, max:
367 fps
238 [X] Dell XPS 17 9730 RTX 4070 1.47.22.14 D3D12
Intel Core i7-13700H 1.8GHz
NVIDIA GeForce RTX 4070 Laptop GPU
min:
50.1 fps, P1:
186.8 fps, max:
346 fps
242 [X] Lenovo Yoga Pro 9i RTX4070 1.47.22.14 D3D12
Intel Core i9-13905H 1.9GHz
NVIDIA GeForce RTX 4070 Laptop GPU
min:
48.5 fps, P1:
119.7 fps, max:
443 fps
249 [X] Asus ROG Flow Z13 ACRNM 1.47.22.14 D3D12
Intel Core i9-13900H 1.9GHz
NVIDIA GeForce RTX 4070 Laptop GPU
min:
42.5 fps, P1:
194.6 fps, max:
390 fps
249 258 261 270 272 273 [X] Acer Nitro 16 AN16-41 1.47.22.14 D3D12
AMD Ryzen 7 7735HS 3.2GHz
NVIDIA GeForce RTX 4070 Laptop GPU
min:
146.3 fps, P1:
211 fps, max:
440 fps
276 277 [X] HP Omen 16-xf0376ng 1.47.22.14 D3D12
AMD Ryzen 7 7840HS 3.8GHz
NVIDIA GeForce RTX 4070 Laptop GPU
min:
114.7 fps, P1:
215 fps, max:
428 fps
277 [X] Aorus 16X 2024 1.47.22.14 D3D12
Intel Core i9-14900HX 1.6GHz
NVIDIA GeForce RTX 4070 Laptop GPU
min:
150.7 fps, P1:
226 fps, max:
393 fps
278 [X] Acer Nitro 17 AN17-41-R9LN 1.47.22.14 D3D12
AMD Ryzen 7 7735HS 3.2GHz
NVIDIA GeForce RTX 4070 Laptop GPU
min:
121.9 fps, P1:
212 fps, max:
439 fps
280 [X] XMG Pro 16 Studio (Mid 23) 1.47.22.14 D3D12
Intel Core i9-13900H 1.9GHz
NVIDIA GeForce RTX 4070 Laptop GPU
min:
28.2 fps, P1:
233 fps, max:
508 fps
286 [X] MSI Stealth 16 Studio A13VG 1.47.22.14 D3D12
Intel Core i7-13700H 1.8GHz
NVIDIA GeForce RTX 4070 Laptop GPU
min:
19.2 fps, P1:
220 fps, max:
423 fps
295 [X] Razer Blade 14 RTX 4070 1.47.22.14 D3D12
AMD Ryzen 9 7940HS 4GHz
NVIDIA GeForce RTX 4070 Laptop GPU
min:
83.2 fps, P1:
233 fps, max:
449 fps
295 [X] MSI Pulse 17 B13VGK 1.47.22.14 D3D12
Intel Core i7-13700H 1.8GHz
NVIDIA GeForce RTX 4070 Laptop GPU
min:
49.3 fps, P1:
239 fps, max:
474 fps
295 [X] Aorus 15 BSF 1.47.22.14 D3D12
Intel Core i7-13700H 1.8GHz
NVIDIA GeForce RTX 4070 Laptop GPU
min:
45.3 fps, P1:
243 fps, max:
537 fps
300 [X] Gigabyte AERO 16 OLED BSF 1.47.22.14 D3D12
Intel Core i9-13900H 1.9GHz
NVIDIA GeForce RTX 4070 Laptop GPU
min:
35 fps, P1:
233 fps, max:
468 fps
300 [X] Aorus 15X ASF 1.47.22.14 D3D12
Intel Core i7-13700HX 1.5GHz
NVIDIA GeForce RTX 4070 Laptop GPU
min:
26.7 fps, P1:
247 fps, max:
494 fps
300 302 [X] SCHENKER XMG CORE 16 (L23) 1.47.22.14 D3D12
AMD Ryzen 7 7840HS 3.8GHz
NVIDIA GeForce RTX 4070 Laptop GPU
min:
94 fps, P1:
238 fps, max:
473 fps
305 [X] Acer Predator Helios Neo 16 PHN16-72 1.47.22.14 D3D12
Intel Core i7-14700HX 3.9GHz
NVIDIA GeForce RTX 4070 Laptop GPU
min:
17.5 fps, P1:
252 fps, max:
441 fps
308 [X] Alienware m16 R2 1.47.22.14 D3D12
Intel Core Ultra 7 155H 3.8GHz
NVIDIA GeForce RTX 4070 Laptop GPU
min:
91.3 fps, P1:
238 fps, max:
467 fps
309 [X] Asus ROG Strix G18 G814JI 1.47.22.14 D3D12
Intel Core i7-13650HX 1.9GHz
NVIDIA GeForce RTX 4070 Laptop GPU
min:
35.5 fps, P1:
245 fps, max:
490 fps
310 [X] Medion Erazer Major X20 1.47.22.14 D3D12
Intel Core i9-13900HX 1.6GHz
NVIDIA GeForce RTX 4070 Laptop GPU
min:
133.3 fps, P1:
246 fps, max:
523 fps
310 [X] HP Omen Transcend 16 1.47.22.14 D3D12
Intel Core i9-13900HX 1.6GHz
NVIDIA GeForce RTX 4070 Laptop GPU
min:
55.6 fps, P1:
256 fps, max:
462 fps
311 313 [X] SCHENKER XMG Fusion 15 (Early 24) 1.47.22.14 D3D12
Intel Core i9-14900HX 1.6GHz
NVIDIA GeForce RTX 4070 Laptop GPU
min:
29.6 fps, P1:
270 fps, max:
545 fps
315 [X] Razer Blade 18 RTX 4070 1.47.22.14 D3D12
Intel Core i9-13950HX 1.6GHz
NVIDIA GeForce RTX 4070 Laptop GPU
min:
22.4 fps, P1:
261 fps, max:
480 fps
316 326 332 [X] Uniwill GM6PX7X RTX 4070 1.47.22.14 D3D12
Intel Core i7-13700HX 1.5GHz
NVIDIA GeForce RTX 4070 Laptop GPU
min:
106.5 fps, P1:
285 fps, max:
550 fps
334 [X] Lenovo Legion Pro 5 16ARX8 1.47.22.14 D3D12
AMD Ryzen 7 7745HX 3.6GHz
NVIDIA GeForce RTX 4070 Laptop GPU
min:
29.5 fps, P1:
289 fps, max:
606 fps
340 [X] Lenovo Legion Pro 5 16IRX9 1.47.22.14 D3D12
Intel Core i9-14900HX 1.6GHz
NVIDIA GeForce RTX 4070 Laptop GPU
min:
110.7 fps, P1:
285 fps, max:
488 fps
~ 283 fps
+ Compare
- Hide Comparison
...
NVIDIA GeForce RTX 4070 Laptop GPU
max:
136.6 [X] Dell XPS 15 9530 RTX 4070 1.47.22.14 D3D12
Intel Core i7-13700H 1.8GHz
NVIDIA GeForce RTX 4070 Laptop GPU
min:
47.4 fps, P1:
97.1 fps, max:
251 fps
150.6 173.9 192 [X] Dell XPS 17 9730 RTX 4070 1.47.22.14 D3D12
Intel Core i7-13700H 1.8GHz
NVIDIA GeForce RTX 4070 Laptop GPU
min:
49.9 fps, P1:
142.3 fps, max:
311 fps
192.4 [X] HP Victus 16-r0077ng 1.47.22.14 D3D12
Intel Core i7-13700H 1.8GHz
NVIDIA GeForce RTX 4070 Laptop GPU
min:
35.9 fps, P1:
140.8 fps, max:
301 fps
202 [X] Asus ROG Flow Z13 ACRNM 1.47.22.14 D3D12
Intel Core i9-13900H 1.9GHz
NVIDIA GeForce RTX 4070 Laptop GPU
min:
71.4 fps, P1:
142.3 fps, max:
353 fps
202 211 213 215 215 [X] Lenovo Yoga Pro 9i RTX4070 1.47.22.14 D3D12
Intel Core i9-13905H 1.9GHz
NVIDIA GeForce RTX 4070 Laptop GPU
min:
46.7 fps, P1:
118 fps, max:
436 fps
220 220 221 [X] Acer Nitro 16 AN16-41 1.47.22.14 D3D12
AMD Ryzen 7 7735HS 3.2GHz
NVIDIA GeForce RTX 4070 Laptop GPU
min:
35.6 fps, P1:
162.5 fps, max:
387 fps
221 [X] HP Omen 16-xf0376ng 1.47.22.14 D3D12
AMD Ryzen 7 7840HS 3.8GHz
NVIDIA GeForce RTX 4070 Laptop GPU
min:
74.9 fps, P1:
161.3 fps, max:
396 fps
223 225 [X] Acer Nitro 17 AN17-41-R9LN 1.47.22.14 D3D12
AMD Ryzen 7 7735HS 3.2GHz
NVIDIA GeForce RTX 4070 Laptop GPU
min:
128.3 fps, P1:
170.2 fps, max:
367 fps
227 [X] Asus ROG Flow X16 GV601VI 1.47.22.14 D3D12
Intel Core i9-13900H 1.9GHz
NVIDIA GeForce RTX 4070 Laptop GPU
min:
21 fps, P1:
164.7 fps, max:
368 fps
230 [X] MSI Stealth 16 Studio A13VG 1.47.22.14 D3D12
Intel Core i7-13700H 1.8GHz
NVIDIA GeForce RTX 4070 Laptop GPU
min:
44.4 fps, P1:
167.2 fps, max:
404 fps
231 [X] Aorus 15 BSF 1.47.22.14 D3D12
Intel Core i7-13700H 1.8GHz
NVIDIA GeForce RTX 4070 Laptop GPU
min:
17.1 fps, P1:
170.5 fps, max:
499 fps
232 [X] XMG Pro 16 Studio (Mid 23) 1.47.22.14 D3D12
Intel Core i9-13900H 1.9GHz
NVIDIA GeForce RTX 4070 Laptop GPU
min:
91.1 fps, P1:
172.3 fps, max:
472 fps
233 [X] MSI Pulse 17 B13VGK 1.47.22.14 D3D12
Intel Core i7-13700H 1.8GHz
NVIDIA GeForce RTX 4070 Laptop GPU
min:
40.9 fps, P1:
170 fps, max:
472 fps
233 [X] Aorus 16X 2024 1.47.22.14 D3D12
Intel Core i9-14900HX 1.6GHz
NVIDIA GeForce RTX 4070 Laptop GPU
min:
56.6 fps, P1:
173.8 fps, max:
372 fps
235 [X] Aorus 15X ASF 1.47.22.14 D3D12
Intel Core i7-13700HX 1.5GHz
NVIDIA GeForce RTX 4070 Laptop GPU
min:
24.9 fps, P1:
171.3 fps, max:
536 fps
235 [X] Razer Blade 14 RTX 4070 1.47.22.14 D3D12
AMD Ryzen 9 7940HS 4GHz
NVIDIA GeForce RTX 4070 Laptop GPU
min:
109.2 fps, P1:
173.3 fps, max:
392 fps
237 [X] Gigabyte AERO 16 OLED BSF 1.47.22.14 D3D12
Intel Core i9-13900H 1.9GHz
NVIDIA GeForce RTX 4070 Laptop GPU
min:
55.9 fps, P1:
158.3 fps, max:
451 fps
243 [X] Razer Blade 18 RTX 4070 1.47.22.14 D3D12
Intel Core i9-13950HX 1.6GHz
NVIDIA GeForce RTX 4070 Laptop GPU
min:
24.9 fps, P1:
176.9 fps, max:
470 fps
244 [X] Medion Erazer Major X20 1.47.22.14 D3D12
Intel Core i9-13900HX 1.6GHz
NVIDIA GeForce RTX 4070 Laptop GPU
min:
34.6 fps, P1:
179.5 fps, max:
452 fps
244 244 [X] Acer Predator Helios Neo 16 PHN16-72 1.47.22.14 D3D12
Intel Core i7-14700HX 3.9GHz
NVIDIA GeForce RTX 4070 Laptop GPU
min:
57 fps, P1:
183.3 fps, max:
406 fps
245 [X] Asus ROG Strix G18 G814JI 1.47.22.14 D3D12
Intel Core i7-13650HX 1.9GHz
NVIDIA GeForce RTX 4070 Laptop GPU
min:
28.8 fps, P1:
174.5 fps, max:
415 fps
245 [X] HP Omen Transcend 16 1.47.22.14 D3D12
Intel Core i9-13900HX 1.6GHz
NVIDIA GeForce RTX 4070 Laptop GPU
min:
92.7 fps, P1:
178.3 fps, max:
412 fps
245 [X] SCHENKER XMG Fusion 15 (Early 24) 1.47.22.14 D3D12
Intel Core i9-14900HX 1.6GHz
NVIDIA GeForce RTX 4070 Laptop GPU
min:
46.6 fps, P1:
183.4 fps, max:
461 fps
247 [X] SCHENKER XMG Focus 17 (E23) 1.47.22.14 D3D12
Intel Core i9-13900HX 1.6GHz
NVIDIA GeForce RTX 4070 Laptop GPU
min:
34.4 fps, P1:
177.8 fps, max:
468 fps
249 [X] Asus ROG Strix G17 G713PI 1.47.22.14 D3D12
AMD Ryzen 9 7945HX 2.5GHz
NVIDIA GeForce RTX 4070 Laptop GPU
min:
74.3 fps, P1:
183.1 fps, max:
416 fps
249 [X] SCHENKER XMG CORE 16 (L23) 1.47.22.14 D3D12
AMD Ryzen 7 7840HS 3.8GHz
NVIDIA GeForce RTX 4070 Laptop GPU
min:
74.1 fps, P1:
181.8 fps, max:
426 fps
250 252 255 [X] Uniwill GM6PX7X RTX 4070 1.47.22.14 D3D12
Intel Core i7-13700HX 1.5GHz
NVIDIA GeForce RTX 4070 Laptop GPU
min:
101 fps, P1:
187.5 fps, max:
482 fps
255 [X] Alienware m16 R2 1.47.22.14 D3D12
Intel Core Ultra 7 155H 3.8GHz
NVIDIA GeForce RTX 4070 Laptop GPU
min:
90 fps, P1:
189.9 fps, max:
445 fps
259 260 [X] Lenovo Legion Pro 5 16ARX8 1.47.22.14 D3D12
AMD Ryzen 7 7745HX 3.6GHz
NVIDIA GeForce RTX 4070 Laptop GPU
min:
45.1 fps, P1:
190.7 fps, max:
472 fps
268 [X] Lenovo Legion Pro 5 16IRX9 1.47.22.14 D3D12
Intel Core i9-14900HX 1.6GHz
NVIDIA GeForce RTX 4070 Laptop GPU
min:
62 fps, P1:
196.9 fps, max:
446 fps
~ 227 fps
+ Compare
- Hide Comparison
...
NVIDIA GeForce RTX 4070 Laptop GPU
...
max:
117.7 [X] Dell XPS 15 9530 RTX 4070 1.47.22.14 D3D12
Intel Core i7-13700H 1.8GHz
NVIDIA GeForce RTX 4070 Laptop GPU
min:
64.5 fps, P1:
88.7 fps, max:
286 fps
129.3 142.7 148.7 165.4 [X] Dell XPS 17 9730 RTX 4070 1.47.22.14 D3D12
Intel Core i7-13700H 1.8GHz
NVIDIA GeForce RTX 4070 Laptop GPU
min:
25.2 fps, P1:
123.2 fps, max:
281 fps
174.8 [X] Asus ROG Flow Z13 ACRNM 1.47.22.14 D3D12
Intel Core i9-13900H 1.9GHz
NVIDIA GeForce RTX 4070 Laptop GPU
min:
57 fps, P1:
127.6 fps, max:
295 fps
175 180.5 [X] Lenovo Yoga Pro 9i RTX4070 1.47.22.14 D3D12
Intel Core i9-13905H 1.9GHz
NVIDIA GeForce RTX 4070 Laptop GPU
min:
19 fps, P1:
101.4 fps, max:
416 fps
187.1 190.3 [X] HP Omen 16-xf0376ng 1.47.22.14 D3D12
AMD Ryzen 7 7840HS 3.8GHz
NVIDIA GeForce RTX 4070 Laptop GPU
min:
22.4 fps, P1:
141.8 fps, max:
348 fps
190.6 192 [X] HP Victus 16-r0077ng 1.47.22.14 D3D12
Intel Core i7-13700H 1.8GHz
NVIDIA GeForce RTX 4070 Laptop GPU
min:
24.8 fps, P1:
138.8 fps, max:
304 fps
192.6 [X] Acer Nitro 16 AN16-41 1.47.22.14 D3D12
AMD Ryzen 7 7735HS 3.2GHz
NVIDIA GeForce RTX 4070 Laptop GPU
min:
25.1 fps, P1:
144.3 fps, max:
374 fps
194 194.2 195 [X] Acer Nitro 17 AN17-41-R9LN 1.47.22.14 D3D12
AMD Ryzen 7 7735HS 3.2GHz
NVIDIA GeForce RTX 4070 Laptop GPU
min:
53.9 fps, P1:
148.4 fps, max:
311 fps
196.7 196.9 [X] Asus ROG Flow X16 GV601VI 1.47.22.14 D3D12
Intel Core i9-13900H 1.9GHz
NVIDIA GeForce RTX 4070 Laptop GPU
min:
39.6 fps, P1:
146.3 fps, max:
305 fps
200 [X] MSI Stealth 16 Studio A13VG 1.47.22.14 D3D12
Intel Core i7-13700H 1.8GHz
NVIDIA GeForce RTX 4070 Laptop GPU
min:
31.2 fps, P1:
147.4 fps, max:
396 fps
201 [X] Aorus 15X ASF 1.47.22.14 D3D12
Intel Core i7-13700HX 1.5GHz
NVIDIA GeForce RTX 4070 Laptop GPU
min:
45.1 fps, P1:
149.8 fps, max:
379 fps
202 [X] MSI Pulse 17 B13VGK 1.47.22.14 D3D12
Intel Core i7-13700H 1.8GHz
NVIDIA GeForce RTX 4070 Laptop GPU
min:
20.2 fps, max:
432.4 fps
202 [X] Aorus 15 BSF 1.47.22.14 D3D12
Intel Core i7-13700H 1.8GHz
NVIDIA GeForce RTX 4070 Laptop GPU
min:
30.6 fps, P1:
150.9 fps, max:
430 fps
202 [X] XMG Pro 16 Studio (Mid 23) 1.47.22.14 D3D12
Intel Core i9-13900H 1.9GHz
NVIDIA GeForce RTX 4070 Laptop GPU
min:
47.3 fps, P1:
151 fps, max:
408 fps
203 [X] Razer Blade 14 RTX 4070 1.47.22.14 D3D12
AMD Ryzen 9 7940HS 4GHz
NVIDIA GeForce RTX 4070 Laptop GPU
min:
69.2 fps, P1:
151.6 fps, max:
334 fps
204 [X] Gigabyte AERO 16 OLED BSF 1.47.22.14 D3D12
Intel Core i9-13900H 1.9GHz
NVIDIA GeForce RTX 4070 Laptop GPU
min:
39 fps, P1:
153.9 fps, max:
368 fps
204 [X] Aorus 16X 2024 1.47.22.14 D3D12
Intel Core i9-14900HX 1.6GHz
NVIDIA GeForce RTX 4070 Laptop GPU
min:
69.2 fps, P1:
153 fps, max:
316 fps
208 [X] Razer Blade 18 RTX 4070 1.47.22.14 D3D12
Intel Core i9-13950HX 1.6GHz
NVIDIA GeForce RTX 4070 Laptop GPU
min:
39.5 fps, P1:
154.8 fps, max:
454 fps
208 [X] Medion Erazer Major X20 1.47.22.14 D3D12
Intel Core i9-13900HX 1.6GHz
NVIDIA GeForce RTX 4070 Laptop GPU
min:
11.2 fps, P1:
156.4 fps, max:
397 fps
208 [X] HP Omen Transcend 16 1.47.22.14 D3D12
Intel Core i9-13900HX 1.6GHz
NVIDIA GeForce RTX 4070 Laptop GPU
min:
60.7 fps, P1:
153.8 fps, max:
393 fps
209 [X] Asus ROG Strix G18 G814JI 1.47.22.14 D3D12
Intel Core i7-13650HX 1.9GHz
NVIDIA GeForce RTX 4070 Laptop GPU
min:
45 fps, P1:
152.5 fps, max:
384 fps
209 [X] MSI Raider GE68 HX 13VG, i7-13700HX 1.47.22.14 D3D12
Intel Core i7-13700HX 1.5GHz
NVIDIA GeForce RTX 4070 Laptop GPU
min:
66.4 fps, P1:
156.5 fps, max:
318 fps
210 [X] Asus ROG Strix G17 G713PI 1.47.22.14 D3D12
AMD Ryzen 9 7945HX 2.5GHz
NVIDIA GeForce RTX 4070 Laptop GPU
min:
60.1 fps, P1:
158 fps, max:
345 fps
211 [X] SCHENKER XMG Focus 17 (E23) 1.47.22.14 D3D12
Intel Core i9-13900HX 1.6GHz
NVIDIA GeForce RTX 4070 Laptop GPU
min:
12.3 fps, P1:
156.1 fps, max:
413 fps
213 213 [X] Acer Predator Helios Neo 16 PHN16-72 1.47.22.14 D3D12
Intel Core i7-14700HX 3.9GHz
NVIDIA GeForce RTX 4070 Laptop GPU
min:
26.4 fps, P1:
161.7 fps, max:
361 fps
214 214 214 [X] SCHENKER XMG Fusion 15 (Early 24) 1.47.22.14 D3D12
Intel Core i9-14900HX 1.6GHz
NVIDIA GeForce RTX 4070 Laptop GPU
min:
38.2 fps, P1:
161.4 fps, max:
520 fps
217 [X] Uniwill GM6PX7X RTX 4070 1.47.22.14 D3D12
Intel Core i7-13700HX 1.5GHz
NVIDIA GeForce RTX 4070 Laptop GPU
min:
90 fps, P1:
162.3 fps, max:
415 fps
218 [X] SCHENKER XMG CORE 16 (L23) 1.47.22.14 D3D12
AMD Ryzen 7 7840HS 3.8GHz
NVIDIA GeForce RTX 4070 Laptop GPU
min:
57.2 fps, P1:
162.5 fps, max:
376 fps
219 [X] Alienware m16 R2 1.47.22.14 D3D12
Intel Core Ultra 7 155H 3.8GHz
NVIDIA GeForce RTX 4070 Laptop GPU
min:
38.5 fps, P1:
163.7 fps, max:
327 fps
219 [X] Acer Predator Helios Neo 16 PHN16-72 1.47.22.14 D3D12, Turbo
Intel Core i7-14700HX 3.9GHz
NVIDIA GeForce RTX 4070 Laptop GPU
min:
19.1 fps, P1:
165.9 fps, max:
376 fps
220 222 [X] SCHENKER XMG Fusion 15 (Early 24) 1.47.22.14 D3D12, Overboost
Intel Core i9-14900HX 1.6GHz
NVIDIA GeForce RTX 4070 Laptop GPU
min:
29.4 fps, P1:
167.7 fps, max:
457 fps
223 [X] Lenovo Legion Pro 5 16ARX8 1.47.22.14 D3D12
AMD Ryzen 7 7745HX 3.6GHz
NVIDIA GeForce RTX 4070 Laptop GPU
min:
89 fps, P1:
167.8 fps, max:
433 fps
228 234 [X] Lenovo Legion Pro 5 16IRX9 1.47.22.14 D3D12
Intel Core i9-14900HX 1.6GHz
NVIDIA GeForce RTX 4070 Laptop GPU
min:
27.8 fps, P1:
175.8 fps, max:
388 fps
~ 198 fps
+ Compare
- Hide Comparison
...
NVIDIA GeForce RTX 4070 Laptop GPU
...
max:
79.9 [X] Dell XPS 15 9530 RTX 4070 1.47.22.14 D3D12
Intel Core i7-13700H 1.8GHz
NVIDIA GeForce RTX 4070 Laptop GPU
min:
57.9 fps, P1:
63.7 fps, max:
164.8 fps
95.3 106.2 113.6 [X] Dell XPS 17 9730 RTX 4070 1.47.22.14 D3D12
Intel Core i7-13700H 1.8GHz
NVIDIA GeForce RTX 4070 Laptop GPU
min:
34.5 fps, P1:
91.1 fps, max:
230 fps
116 122.8 [X] Asus ROG Flow Z13 ACRNM 1.47.22.14 D3D12
Intel Core i9-13900H 1.9GHz
NVIDIA GeForce RTX 4070 Laptop GPU
min:
31.1 fps, P1:
96.1 fps, max:
287 fps
123.4 126.3 126.7 129 [X] Acer Nitro 16 AN16-41 1.47.22.14 D3D12
AMD Ryzen 7 7735HS 3.2GHz
NVIDIA GeForce RTX 4070 Laptop GPU
min:
62.9 fps, P1:
106.6 fps, max:
249 fps
131.4 [X] Medion Erazer Major X20 1.47.22.14 D3D12
Intel Core i9-13900HX 1.6GHz
NVIDIA GeForce RTX 4070 Laptop GPU
min:
42.2 fps, P1:
78.3 fps, max:
219 fps
131.6 132 132 [X] MSI Stealth 16 Studio A13VG 1.47.22.14 D3D12
Intel Core i7-13700H 1.8GHz
NVIDIA GeForce RTX 4070 Laptop GPU
min:
23 fps, P1:
107.4 fps, max:
335 fps
132.8 [X] XMG Pro 16 Studio (Mid 23) 1.47.22.14 D3D12
Intel Core i9-13900H 1.9GHz
NVIDIA GeForce RTX 4070 Laptop GPU
min:
62.3 fps, P1:
109.2 fps, max:
405 fps
133.1 [X] Asus ROG Flow X16 GV601VI 1.47.22.14 D3D12
Intel Core i9-13900H 1.9GHz
NVIDIA GeForce RTX 4070 Laptop GPU
min:
46.7 fps, P1:
107.8 fps, max:
281 fps
133.2 [X] Aorus 15X ASF 1.47.22.14 D3D12
Intel Core i7-13700HX 1.5GHz
NVIDIA GeForce RTX 4070 Laptop GPU
min:
34.5 fps, P1:
106 fps, max:
361 fps
133.3 [X] HP Omen Transcend 16 1.47.22.14 D3D12
Intel Core i9-13900HX 1.6GHz
NVIDIA GeForce RTX 4070 Laptop GPU
min:
67.8 fps, P1:
108.9 fps, max:
284 fps
133.5 [X] Lenovo Yoga Pro 9i RTX4070 1.47.22.14 D3D12
Intel Core i9-13905H 1.9GHz
NVIDIA GeForce RTX 4070 Laptop GPU
min:
21.1 fps, P1:
89.6 fps, max:
287 fps
133.6 [X] Aorus 15 BSF 1.47.22.14 D3D12
Intel Core i7-13700H 1.8GHz
NVIDIA GeForce RTX 4070 Laptop GPU
min:
18.4 fps, P1:
109.6 fps, max:
337 fps
134.3 [X] Razer Blade 14 RTX 4070 1.47.22.14 D3D12
AMD Ryzen 9 7940HS 4GHz
NVIDIA GeForce RTX 4070 Laptop GPU
min:
28.6 fps, P1:
109.1 fps, max:
282 fps
135.2 [X] SCHENKER XMG Focus 17 (E23) 1.47.22.14 D3D12
Intel Core i9-13900HX 1.6GHz
NVIDIA GeForce RTX 4070 Laptop GPU
min:
20.7 fps, P1:
109.9 fps, max:
372 fps
136.2 [X] Aorus 16X 2024 1.47.22.14 D3D12
Intel Core i9-14900HX 1.6GHz
NVIDIA GeForce RTX 4070 Laptop GPU
min:
32.7 fps, P1:
110 fps, max:
248 fps
136.7 [X] Razer Blade 18 RTX 4070 1.47.22.14 D3D12
Intel Core i9-13950HX 1.6GHz
NVIDIA GeForce RTX 4070 Laptop GPU
min:
54.8 fps, P1:
112.1 fps, max:
402 fps
138.1 [X] Asus ROG Strix G17 G713PI 1.47.22.14 D3D12
AMD Ryzen 9 7945HX 2.5GHz
NVIDIA GeForce RTX 4070 Laptop GPU
min:
24.1 fps, P1:
113.9 fps, max:
330 fps
138.7 [X] Acer Predator Helios Neo 16 PHN16-72 1.47.22.14 D3D12
Intel Core i7-14700HX 3.9GHz
NVIDIA GeForce RTX 4070 Laptop GPU
min:
12.4 fps, P1:
112.7 fps, max:
285 fps
138.8 [X] Gigabyte AERO 16 OLED BSF 1.47.22.14 D3D12
Intel Core i9-13900H 1.9GHz
NVIDIA GeForce RTX 4070 Laptop GPU
min:
26.7 fps, P1:
113.2 fps, max:
259 fps
139 139.2 [X] SCHENKER XMG Fusion 15 (Early 24) 1.47.22.14 D3D12
Intel Core i9-14900HX 1.6GHz
NVIDIA GeForce RTX 4070 Laptop GPU
min:
49.8 fps, P1:
114.8 fps, max:
457 fps
139.3 139.8 141.7 [X] Alienware m16 R2 1.47.22.14 D3D12
Intel Core Ultra 7 155H 3.8GHz
NVIDIA GeForce RTX 4070 Laptop GPU
min:
32.6 fps, P1:
117.2 fps, max:
261 fps
142.3 [X] Acer Predator Helios Neo 16 PHN16-72 1.47.22.14 D3D12, Turbo
Intel Core i7-14700HX 3.9GHz
NVIDIA GeForce RTX 4070 Laptop GPU
min:
35.2 fps, P1:
116.8 fps, max:
315 fps
143 143.3 [X] Uniwill GM6PX7X RTX 4070 1.47.22.14 D3D12
Intel Core i7-13700HX 1.5GHz
NVIDIA GeForce RTX 4070 Laptop GPU
min:
73.8 fps, P1:
118 fps, max:
280 fps
145.6 [X] SCHENKER XMG Fusion 15 (Early 24) 1.47.22.14 D3D12, Overboost
Intel Core i9-14900HX 1.6GHz
NVIDIA GeForce RTX 4070 Laptop GPU
min:
12.9 fps, P1:
119.4 fps, max:
580 fps
146.4 [X] Lenovo Legion Pro 5 16ARX8 1.47.22.14 D3D12
AMD Ryzen 7 7745HX 3.6GHz
NVIDIA GeForce RTX 4070 Laptop GPU
min:
23.1 fps, P1:
121.3 fps, max:
397 fps
149.2 150.9 [X] Lenovo Legion Pro 5 16IRX9 1.47.22.14 D3D12
Intel Core i9-14900HX 1.6GHz
NVIDIA GeForce RTX 4070 Laptop GPU
min:
13.9 fps, P1:
126.9 fps, max:
384 fps
~ 132 fps
+ Compare
- Hide Comparison
...
NVIDIA GeForce RTX 4070 Laptop GPU
max:
42.7 [X] Dell XPS 15 9530 RTX 4070 1.47.22.14 D3D12
Intel Core i7-13700H 1.8GHz
NVIDIA GeForce RTX 4070 Laptop GPU
min:
7 fps, P1:
36.3 fps, max:
133.2 fps
61.7 [X] Dell XPS 17 9730 RTX 4070 1.47.22.14 D3D12
Intel Core i7-13700H 1.8GHz
NVIDIA GeForce RTX 4070 Laptop GPU
min:
19.4 fps, P1:
51.8 fps, max:
210 fps
67.6 [X] Gigabyte AERO 16 OLED BSF 1.47.22.14 D3D12
Intel Core i9-13900H 1.9GHz
NVIDIA GeForce RTX 4070 Laptop GPU
min:
8 fps, P1:
54.8 fps, max:
286 fps
70.4 [X] Razer Blade 14 RTX 4070 1.47.22.14 D3D12
AMD Ryzen 9 7940HS 4GHz
NVIDIA GeForce RTX 4070 Laptop GPU
min:
28.6 fps, P1:
59.4 fps, max:
210 fps
71.4 [X] HP Omen Transcend 16 1.47.22.14 D3D12
Intel Core i9-13900HX 1.6GHz
NVIDIA GeForce RTX 4070 Laptop GPU
min:
37.3 fps, P1:
61.1 fps, max:
152.9 fps
71.9 [X] Razer Blade 18 RTX 4070 1.47.22.14 D3D12
Intel Core i9-13950HX 1.6GHz
NVIDIA GeForce RTX 4070 Laptop GPU
min:
29.8 fps, P1:
61.4 fps, max:
255 fps
72.6 73.8 [X] Alienware m16 R2 1.47.22.14 D3D12
Intel Core Ultra 7 155H 3.8GHz
NVIDIA GeForce RTX 4070 Laptop GPU
min:
58.5 fps, P1:
61.5 fps, max:
98.3 fps
74.7 75.3 [X] Uniwill GM6PX7X RTX 4070 1.47.22.14 D3D12
Intel Core i7-13700HX 1.5GHz
NVIDIA GeForce RTX 4070 Laptop GPU
min:
51 fps, P1:
63.3 fps, max:
134 fps
75.7 76.8 [X] Lenovo Legion Pro 5 16ARX8 1.47.22.14 D3D12
AMD Ryzen 7 7745HX 3.6GHz
NVIDIA GeForce RTX 4070 Laptop GPU
min:
63.5 fps, P1:
65.8 fps, max:
103.2 fps
77.9 [X] Lenovo Legion Pro 5 16IRX9 1.47.22.14 D3D12
Intel Core i9-14900HX 1.6GHz
NVIDIA GeForce RTX 4070 Laptop GPU
min:
58 fps, P1:
66 fps, max:
131.2 fps
~ 70 fps
+ Compare
- Hide Comparison
...
NVIDIA GeForce RTX 4070 Laptop GPU
...
max:
» With all tested laptops playable in detail settings ultra.
0 100 200 Tooltip Nitro 16 AN16-41: Ø140.7 (103-183)
15 BSF: Ø177.7 (143-218)
15X ASF: Ø182.5 (143-225)
16X 2024: Ø184.2 (121-252)
Predator Helios Neo 16 PHN16-72: Ø186.7 (120-238)
Erazer Major X20: Ø188 (142-234)
Stealth 16 Studio A13VG: Ø190.2 (138-233)
Legion Pro 5 16IRX9: Ø190.6 (143-241)
XMG Fusion 15 (Early 24): Ø204 (149-255)
...
NVIDIA GeForce RTX 4070 Laptop GPU
max:
0 100 200 Tooltip Nitro 16 AN16-41: Ø120.3 (90-156)
16X 2024: Ø124.2 (81-175)
Predator Helios Neo 16 PHN16-72: Ø134 (98-170)
Blade 14 RZ09-0508: Ø138.4 (98-186)
m16 R2: Ø145.6 (113-197)
15 BSF: Ø155.5 (128-207)
15X ASF: Ø156.8 (107-205)
Stealth 16 Studio A13VG: Ø156.9 (128-197)
Erazer Major X20: Ø160.6 (123-205)
XMG Fusion 15 (Early 24): Ø175.7 (129-222)
Legion Pro 5 16IRX9: Ø182.5 (138-239)
...
NVIDIA GeForce RTX 4070 Laptop GPU
max:
0 100 200 Tooltip Galaxy Book3 Ultra 16, i9-13900H RTX 4070: Ø97.7 (73-136)
16X 2024: Ø113.5 (85-167)
Nitro 16 AN16-41: Ø116.3 (88-153)
ROG Flow X16 GV601VI: Ø117.1 (76-147)
Predator Helios Neo 16 PHN16-72: Ø122.3 (92-161)
Blade 14 RZ09-0508: Ø132.7 (106-179)
m16 R2: Ø133.7 (105-182)
ROG Strix G17 G713PI: Ø141.3 (108-180)
XMG Focus 17 (E23): Ø145.3 (116-189)
15 BSF: Ø148.8 (114-192)
Stealth 16 Studio A13VG: Ø150.1 (121-186)
15X ASF: Ø150.6 (121-198)
Erazer Major X20: Ø153.3 (101-201)
XMG Fusion 15 (Early 24): Ø165.7 (121-214)
Legion Pro 5 16IRX9: Ø169.5 (133-220)
...
NVIDIA GeForce RTX 4070 Laptop GPU
max:
0 100 200 Tooltip Galaxy Book3 Ultra 16, i9-13900H RTX 4070: Ø91.7 (69-122)
ROG Flow X16 GV601VI: Ø102.7 (72-137)
Nitro 16 AN16-41: Ø108.7 (81-141)
16X 2024: Ø108.9 (76-160)
TUF Gaming A17 FA707XI-NS94: Ø120.9 (96-162)
Blade 14 RZ09-0508: Ø122.8 (95-162)
m16 R2: Ø123.2 (95-167)
Predator Helios Neo 16 PHN16-72: Ø123 (88-160)
ROG Strix G17 G713PI: Ø131.7 (102-170)
XMG Focus 17 (E23): Ø136.2 (101-176)
15 BSF: Ø140.1 (109-186)
15X ASF: Ø140.9 (110-184)
Stealth 16 Studio A13VG: Ø143 (112-179)
Erazer Major X20: Ø144.4 (104-192)
XMG Fusion 15 (Early 24): Ø156.7 (109-206)
Legion Pro 5 16IRX9: Ø158.1 (121-212)
...
NVIDIA GeForce RTX 4070 Laptop GPU
...
max:
0 100 Tooltip Galaxy Book3 Ultra 16, i9-13900H RTX 4070: Ø79 (55-97)
16X 2024: Ø98.4 (72-131)
Nitro 16 AN16-41: Ø102.3 (78-120)
ROG Flow X16 GV601VI: Ø101.6 (87-122)
15X ASF: Ø111.5 (99-128)
XMG Focus 17 (E23): Ø111.9 (93-135)
Stealth 16 Studio A13VG: Ø113.4 (102-133)
Predator Helios Neo 16 PHN16-72: Ø112.8 (82-140)
ROG Strix G17 G713PI: Ø113.9 (95-134)
TUF Gaming A17 FA707XI-NS94: Ø114 (87-142)
Blade 14 RZ09-0508: Ø114 (93-140)
m16 R2: Ø114.6 (96-141)
15 BSF: Ø116.6 (94-140)
Erazer Major X20: Ø121.7 (99-145)
XMG Fusion 15 (Early 24): Ø124.4 (102-147)
Legion Pro 5 16IRX9: Ø128.3 (108-153)
...
NVIDIA GeForce RTX 4070 Laptop GPU
...
max:
0 Tooltip Blade 14 RZ09-0508: Ø60.8 (53-71)
m16 R2: Ø60.9 (54-71)
TUF Gaming A17 FA707XI-NS94: Ø62.4 (54-73)
Legion Pro 5 16IRX9: Ø65.3 (57-77)
...
NVIDIA GeForce RTX 4070 Laptop GPU
...
max:
» With all tested laptops playable in detail settings ultra.
Additional Benchmarks
Low Preset TAA 1920x1080
175 [X] Aorus 15X ASF Intel Core i7-13700HX 1.5GHz
NVIDIA GeForce RTX 4070 Laptop GPU
min:
111 fps, max:
219 fps
170 [X] Aorus 15 BSF Intel Core i7-13700H 1.8GHz
NVIDIA GeForce RTX 4070 Laptop GPU
min:
119 fps, max:
212 fps
150 [X] Acer Predator Helios Neo 16 PHN16-72 Intel Core i7-14700HX 3.9GHz
NVIDIA GeForce RTX 4070 Laptop GPU
min:
108 fps, max:
208 fps
136 [X] Aorus 16X 2024 Intel Core i9-14900HX 1.6GHz
NVIDIA GeForce RTX 4070 Laptop GPU
min:
93 fps, max:
189 fps
196 [X] SCHENKER XMG Fusion 15 (Early 24) Intel Core i9-14900HX 1.6GHz
NVIDIA GeForce RTX 4070 Laptop GPU
min:
149 fps, max:
241 fps
...
NVIDIA GeForce RTX 4070 Laptop GPU
...
max:
...
NVIDIA GeForce RTX 4070 Laptop GPU
...
max:
...
NVIDIA GeForce RTX 4070 Laptop GPU
...
max:
...
NVIDIA GeForce RTX 4070 Laptop GPU
...
max:
» With all tested laptops playable in detail settings high.
...
NVIDIA GeForce RTX 4070 Laptop GPU
...
max:
...
NVIDIA GeForce RTX 4070 Laptop GPU
...
max:
...
NVIDIA GeForce RTX 4070 Laptop GPU
...
max:
...
NVIDIA GeForce RTX 4070 Laptop GPU
...
max:
...
NVIDIA GeForce RTX 4070 Laptop GPU
max:
» With all tested laptops playable in detail settings high.
89.8 [X] Dell XPS 16 9640 Intel Core Ultra 7 155H 3.8GHz
NVIDIA GeForce RTX 4070 Laptop GPU
min:
87 fps, max:
-1 fps
135.8 137.7 149.5 [X] Lenovo Yoga Pro 9i RTX4070 Intel Core i9-13905H 1.9GHz
NVIDIA GeForce RTX 4070 Laptop GPU
min:
122.7 fps, max:
-1 fps
149.6 161.2 161.6 162.3 164.1 [X] HP Omen 16-xf0376ng AMD Ryzen 7 7840HS 3.8GHz
NVIDIA GeForce RTX 4070 Laptop GPU
min:
145.9 fps, max:
-1 fps
164.7 165.3 166.4 166.8 [X] Alienware m16 R2 Intel Core Ultra 7 155H 3.8GHz
NVIDIA GeForce RTX 4070 Laptop GPU
min:
145 fps, max:
-1 fps
171 171.7 173.9 174 [X] MSI Pulse 17 B13VGK Intel Core i7-13700H 1.8GHz
NVIDIA GeForce RTX 4070 Laptop GPU
min:
153.1 fps, max:
-1 fps
178.3 178.4 186.9 [X] Aorus 15 BSF Intel Core i7-13700H 1.8GHz
NVIDIA GeForce RTX 4070 Laptop GPU
min:
164.3 fps, max:
-1 fps
189.5 189.6 191.9 [X] Aorus 15X ASF Intel Core i7-13700HX 1.5GHz
NVIDIA GeForce RTX 4070 Laptop GPU
min:
161.5 fps, max:
-1 fps
192.8 [X] Asus ROG Flow X16 GV601VI Intel Core i9-13900H 1.9GHz
NVIDIA GeForce RTX 4070 Laptop GPU
min:
166.6 fps, max:
-1 fps
193.5 199.2 202 203 203 [X] MSI Raider GE68 HX 13VG, i7-13700HX Intel Core i7-13700HX 1.5GHz
NVIDIA GeForce RTX 4070 Laptop GPU
min:
175.3 fps, max:
-1 fps
205 210 212 213 215 222 [X] Acer Predator Helios Neo 16 PHN16-72 Turbo
Intel Core i7-14700HX 3.9GHz
NVIDIA GeForce RTX 4070 Laptop GPU
min:
193.5 fps, max:
-1 fps
225 230 231 232 [X] Acer Predator Helios Neo 16 PHN16-72 Intel Core i7-14700HX 3.9GHz
NVIDIA GeForce RTX 4070 Laptop GPU
min:
200.2 fps, max:
-1 fps
233 233 [X] Aorus 16X 2024 Intel Core i9-14900HX 1.6GHz
NVIDIA GeForce RTX 4070 Laptop GPU
min:
199.2 fps, max:
-1 fps
234 [X] SCHENKER XMG Fusion 15 (Early 24) Intel Core i9-14900HX 1.6GHz
NVIDIA GeForce RTX 4070 Laptop GPU
min:
204.3 fps, max:
-1 fps
238 247 [X] SCHENKER XMG Fusion 15 (Early 24) Overboost
Intel Core i9-14900HX 1.6GHz
NVIDIA GeForce RTX 4070 Laptop GPU
min:
210.4 fps, max:
-1 fps
~ 190 fps
+ Compare
- Hide Comparison
...
NVIDIA GeForce RTX 4070 Laptop GPU
...
max:
89.6 [X] Dell XPS 16 9640 Intel Core Ultra 7 155H 3.8GHz
NVIDIA GeForce RTX 4070 Laptop GPU
min:
85.4 fps, max:
-1 fps
122.8 130.5 [X] Lenovo Yoga Pro 9i RTX4070 Intel Core i9-13905H 1.9GHz
NVIDIA GeForce RTX 4070 Laptop GPU
min:
102.1 fps, max:
-1 fps
131.9 140.6 144.5 146.4 146.8 147.9 149 [X] Alienware m16 R2 Intel Core Ultra 7 155H 3.8GHz
NVIDIA GeForce RTX 4070 Laptop GPU
min:
122.5 fps, max:
-1 fps
149.2 [X] HP Omen 16-xf0376ng AMD Ryzen 7 7840HS 3.8GHz
NVIDIA GeForce RTX 4070 Laptop GPU
min:
133.8 fps, max:
-1 fps
149.8 152 152.5 153.5 155.7 157 158 [X] MSI Pulse 17 B13VGK Intel Core i7-13700H 1.8GHz
NVIDIA GeForce RTX 4070 Laptop GPU
min:
133.1 fps, max:
-1 fps
161.3 163.1 167.6 [X] Aorus 15 BSF Intel Core i7-13700H 1.8GHz
NVIDIA GeForce RTX 4070 Laptop GPU
min:
146.7 fps, max:
-1 fps
169 173.2 174.3 [X] Asus ROG Flow X16 GV601VI Intel Core i9-13900H 1.9GHz
NVIDIA GeForce RTX 4070 Laptop GPU
min:
153.6 fps, max:
-1 fps
174.5 178.9 181.1 [X] Aorus 15X ASF Intel Core i7-13700HX 1.5GHz
NVIDIA GeForce RTX 4070 Laptop GPU
min:
149 fps, max:
-1 fps
182.3 183.2 183.3 185.1 [X] MSI Raider GE68 HX 13VG, i7-13700HX Intel Core i7-13700HX 1.5GHz
NVIDIA GeForce RTX 4070 Laptop GPU
min:
160.3 fps, max:
-1 fps
187.5 187.9 192 192.8 198.8 [X] Acer Predator Helios Neo 16 PHN16-72 Turbo
Intel Core i7-14700HX 3.9GHz
NVIDIA GeForce RTX 4070 Laptop GPU
min:
169.7 fps, max:
-1 fps
200 203 205 205 206 207 [X] SCHENKER XMG Fusion 15 (Early 24) Intel Core i9-14900HX 1.6GHz
NVIDIA GeForce RTX 4070 Laptop GPU
min:
181.4 fps, max:
-1 fps
208 [X] Aorus 16X 2024 Intel Core i9-14900HX 1.6GHz
NVIDIA GeForce RTX 4070 Laptop GPU
min:
180.5 fps, max:
-1 fps
208 [X] Acer Predator Helios Neo 16 PHN16-72 Intel Core i7-14700HX 3.9GHz
NVIDIA GeForce RTX 4070 Laptop GPU
min:
180.8 fps, max:
-1 fps
216 [X] SCHENKER XMG Fusion 15 (Early 24) Overboost
Intel Core i9-14900HX 1.6GHz
NVIDIA GeForce RTX 4070 Laptop GPU
min:
188 fps, max:
-1 fps
~ 170 fps
+ Compare
- Hide Comparison
...
NVIDIA GeForce RTX 4070 Laptop GPU
...
max:
89.5 [X] Dell XPS 16 9640 Intel Core Ultra 7 155H 3.8GHz
NVIDIA GeForce RTX 4070 Laptop GPU
min:
84.4 fps, max:
-1 fps
99.7 114.5 118.9 126.3 127.7 [X] Lenovo Yoga Pro 9i RTX4070 Intel Core i9-13905H 1.9GHz
NVIDIA GeForce RTX 4070 Laptop GPU
min:
106.5 fps, max:
-1 fps
135.9 138.1 139.3 140.7 142.2 142.8 143.6 144.1 [X] HP Omen 16-xf0376ng AMD Ryzen 7 7840HS 3.8GHz
NVIDIA GeForce RTX 4070 Laptop GPU
min:
127.8 fps, max:
-1 fps
145.3 146.3 [X] MSI Pulse 17 B13VGK Intel Core i7-13700H 1.8GHz
NVIDIA GeForce RTX 4070 Laptop GPU
min:
125.3 fps, max:
-1 fps
147.6 148.1 149.5 [X] Alienware m16 R2 Intel Core Ultra 7 155H 3.8GHz
NVIDIA GeForce RTX 4070 Laptop GPU
min:
128.3 fps, max:
-1 fps
150.9 152.4 160.5 161.1 [X] Aorus 15X ASF Intel Core i7-13700HX 1.5GHz
NVIDIA GeForce RTX 4070 Laptop GPU
min:
137.1 fps, max:
-1 fps
162.4 [X] Aorus 15 BSF Intel Core i7-13700H 1.8GHz
NVIDIA GeForce RTX 4070 Laptop GPU
min:
141.4 fps, max:
-1 fps
164.4 165.9 167 168.7 [X] Asus ROG Flow X16 GV601VI Intel Core i9-13900H 1.9GHz
NVIDIA GeForce RTX 4070 Laptop GPU
min:
147.4 fps, max:
-1 fps
169.8 169.9 171.5 172.5 [X] MSI Raider GE68 HX 13VG, i7-13700HX Intel Core i7-13700HX 1.5GHz
NVIDIA GeForce RTX 4070 Laptop GPU
min:
147.4 fps, max:
-1 fps
175.8 176.5 177.3 184.4 187.2 188.1 [X] Acer Predator Helios Neo 16 PHN16-72 Turbo
Intel Core i7-14700HX 3.9GHz
NVIDIA GeForce RTX 4070 Laptop GPU
min:
162.7 fps, max:
-1 fps
188.4 191 191.8 193.4 194.9 [X] Acer Predator Helios Neo 16 PHN16-72 Intel Core i7-14700HX 3.9GHz
NVIDIA GeForce RTX 4070 Laptop GPU
min:
167.2 fps, max:
-1 fps
195.4 196.5 [X] SCHENKER XMG Fusion 15 (Early 24) Intel Core i9-14900HX 1.6GHz
NVIDIA GeForce RTX 4070 Laptop GPU
min:
171.5 fps, max:
-1 fps
196.7 199.1 [X] Aorus 16X 2024 Intel Core i9-14900HX 1.6GHz
NVIDIA GeForce RTX 4070 Laptop GPU
min:
170.6 fps, max:
-1 fps
203 [X] SCHENKER XMG Fusion 15 (Early 24) Overboost
Intel Core i9-14900HX 1.6GHz
NVIDIA GeForce RTX 4070 Laptop GPU
min:
177.1 fps, max:
-1 fps
~ 161 fps
+ Compare
- Hide Comparison
...
NVIDIA GeForce RTX 4070 Laptop GPU
...
max:
89.7 [X] Dell XPS 16 9640 Intel Core Ultra 7 155H 3.8GHz
NVIDIA GeForce RTX 4070 Laptop GPU
min:
83.8 fps, max:
-1 fps
97.4 108.3 114.8 119.5 [X] Lenovo Yoga Pro 9i RTX4070 Intel Core i9-13905H 1.9GHz
NVIDIA GeForce RTX 4070 Laptop GPU
min:
98.2 fps, max:
-1 fps
120.7 126.9 130 131.6 131.6 134.8 135 136.1 136.1 137 137.8 [X] HP Omen 16-xf0376ng AMD Ryzen 7 7840HS 3.8GHz
NVIDIA GeForce RTX 4070 Laptop GPU
min:
120.3 fps, max:
-1 fps
138.5 [X] MSI Pulse 17 B13VGK Intel Core i7-13700H 1.8GHz
NVIDIA GeForce RTX 4070 Laptop GPU
min:
118.6 fps, max:
-1 fps
139 139.7 [X] Alienware m16 R2 Intel Core Ultra 7 155H 3.8GHz
NVIDIA GeForce RTX 4070 Laptop GPU
min:
120.9 fps, max:
-1 fps
143.8 144.5 149.4 [X] Aorus 15X ASF Intel Core i7-13700HX 1.5GHz
NVIDIA GeForce RTX 4070 Laptop GPU
min:
125.9 fps, max:
-1 fps
149.9 [X] Aorus 15 BSF Intel Core i7-13700H 1.8GHz
NVIDIA GeForce RTX 4070 Laptop GPU
min:
129.9 fps, max:
-1 fps
154.1 154.7 154.7 156.9 158.3 [X] Asus ROG Flow X16 GV601VI Intel Core i9-13900H 1.9GHz
NVIDIA GeForce RTX 4070 Laptop GPU
min:
138.4 fps, max:
-1 fps
158.8 162.2 162.8 163.4 164.5 165.3 166.3 [X] MSI Raider GE68 HX 13VG, i7-13700HX Intel Core i7-13700HX 1.5GHz
NVIDIA GeForce RTX 4070 Laptop GPU
min:
140.3 fps, max:
-1 fps
168.4 170.2 171.6 175.4 [X] Acer Predator Helios Neo 16 PHN16-72 Turbo
Intel Core i7-14700HX 3.9GHz
NVIDIA GeForce RTX 4070 Laptop GPU
min:
152.2 fps, max:
-1 fps
178.6 179.5 180.6 180.9 [X] Aorus 16X 2024 Intel Core i9-14900HX 1.6GHz
NVIDIA GeForce RTX 4070 Laptop GPU
min:
156.5 fps, max:
-1 fps
181.7 [X] Acer Predator Helios Neo 16 PHN16-72 Intel Core i7-14700HX 3.9GHz
NVIDIA GeForce RTX 4070 Laptop GPU
min:
153.5 fps, max:
-1 fps
182 182.1 [X] SCHENKER XMG Fusion 15 (Early 24) Intel Core i9-14900HX 1.6GHz
NVIDIA GeForce RTX 4070 Laptop GPU
min:
158.8 fps, max:
-1 fps
185.3 187.5 [X] SCHENKER XMG Fusion 15 (Early 24) Overboost
Intel Core i9-14900HX 1.6GHz
NVIDIA GeForce RTX 4070 Laptop GPU
min:
160.5 fps, max:
-1 fps
~ 151 fps
+ Compare
- Hide Comparison
...
NVIDIA GeForce RTX 4070 Laptop GPU
...
max:
...
NVIDIA GeForce RTX 4070 Laptop GPU
...
max:
» With all tested laptops playable in detail settings ultra.
...
NVIDIA GeForce RTX 4070 Laptop GPU
max:
...
NVIDIA GeForce RTX 4070 Laptop GPU
max:
0 100 200 Tooltip 16X 2024: Ø223 (195.9-246)
...
NVIDIA GeForce RTX 4070 Laptop GPU
max:
69.8 71 75 [X] SCHENKER XMG Neo 17 2023 Engineering Sample Intel Core i9-13900HX 1.6GHz
NVIDIA GeForce RTX 4070 Laptop GPU
83.2 87.8 [X] Dell XPS 16 9640 Intel Core Ultra 7 155H 3.8GHz
NVIDIA GeForce RTX 4070 Laptop GPU
min:
77 fps, P1:
83 fps, max:
95 fps
94 [X] SCHENKER XMG Neo 17 2023 Engineering Sample Intel Core i9-13900HX 1.6GHz
NVIDIA GeForce RTX 4070 Laptop GPU
96.2 97.1 98.6 103 [X] SCHENKER XMG Neo 17 2023 Engineering Sample Intel Core i9-13900HX 1.6GHz
NVIDIA GeForce RTX 4070 Laptop GPU
105.3 105.4 106.9 [X] MSI Pulse 17 B13VGK Intel Core i7-13700H 1.8GHz
NVIDIA GeForce RTX 4070 Laptop GPU
min:
99 fps, P1:
101 fps, max:
115 fps
107.1 107.8 109.5 110 110 111.8 112 113.1 113.2 113.9 114 114 115 116 116 [X] SCHENKER XMG Neo 17 2023 Engineering Sample Intel Core i9-13900HX 1.6GHz
NVIDIA GeForce RTX 4070 Laptop GPU
116.8 117 [X] Aorus 15X ASF Intel Core i7-13700HX 1.5GHz
NVIDIA GeForce RTX 4070 Laptop GPU
min:
101 fps, max:
132 fps
117 [X] Aorus 15 BSF Intel Core i7-13700H 1.8GHz
NVIDIA GeForce RTX 4070 Laptop GPU
min:
103 fps, max:
135 fps
117.9 118.4 119 119 119.8 120 120.4 [X] MSI Raider GE68 HX 13VG, i7-13700HX Intel Core i7-13700HX 1.5GHz
NVIDIA GeForce RTX 4070 Laptop GPU
P0.1:
48.6 fpsP1:
93.7 fps
120.7 121 121.1 [X] Lenovo Yoga Pro 9i RTX4070 Intel Core i9-13905H 1.9GHz
NVIDIA GeForce RTX 4070 Laptop GPU
P0.1:
40.5 fpsP1:
67.8 fps
121.3 [X] Alienware m16 R2 Intel Core Ultra 7 155H 3.8GHz
NVIDIA GeForce RTX 4070 Laptop GPU
min:
115 fps, max:
128 fps
122 123.2 123.3 [X] Asus ROG Flow X16 GV601VI Intel Core i9-13900H 1.9GHz
NVIDIA GeForce RTX 4070 Laptop GPU
min:
106 fps, P1:
108.6 fps, max:
139 fps
124 127 127.2 [X] Acer Predator Helios Neo 16 PHN16-72 Intel Core i7-14700HX 3.9GHz
NVIDIA GeForce RTX 4070 Laptop GPU
min:
107 fps, max:
145 fps
128 [X] SCHENKER XMG Fusion 15 (Early 24) Intel Core i9-14900HX 1.6GHz
NVIDIA GeForce RTX 4070 Laptop GPU
min:
110 fps, max:
144 fps
129 [X] Acer Predator Helios Neo 16 PHN16-72 Turbo
Intel Core i7-14700HX 3.9GHz
NVIDIA GeForce RTX 4070 Laptop GPU
133 [X] SCHENKER XMG Fusion 15 (Early 24) Overboost
Intel Core i9-14900HX 1.6GHz
NVIDIA GeForce RTX 4070 Laptop GPU
133.7 ~ 112 fps
+ Compare
- Hide Comparison
+ 📈 Graph
- 📈 Hide Graph
0 100 Tooltip Galaxy Book3 Ultra 16, i9-13900H RTX 4070: Ø77.2 (70-83)
ROG Flow Z13 ACRNM: Ø83.2 (79-91)
XPS 16 9640: Ø87.8 (77-95)
XPS 17 9730 RTX 4070: Ø89.4 (84-96)
ROG Zephyrus G14 2024 GA403U: Ø97.1 (88-103)
ROG Zephyrus G16 2024 GU605M: Ø98.6 (94-104)
Zenbook Pro 14 OLED UX6404VI: Ø105.3 (99-112)
VISION 16 Pro (M23): Ø105.4 (100-113)
Pulse 17 B13VGK: Ø106.9 (99-115)
ProArt Studiobook 16 OLED H7604: Ø107.1 (95-113)
Yoga Pro 9 16IMH9: Ø107.8 (103-114)
Blade 14 RTX 4070: Ø106.5 (94-113)
Nitro 17 AN17-41-R9LN: Ø108.3 (103-113)
Stealth 16 Mercedes-AMG Motorsport A13VG: Ø102.5 (90-112)
Omen Transcend 16: Ø105.7 (97-112)
Omen 16-xf0376ng: Ø106.6 (94-113)
Legion 7 16 IRX G9: Ø113.1 (101-119)
Nitro 16 AN16-41: Ø111.1 (107-116)
Blade 18 RTX 4070: Ø105.4 (98-112)
Victus 16-r0077ng: Ø107.8 (102-118)
Omen Transcend 16-u1095ng: Ø113.2 (109-118)
XMG Focus 17 (E23): Ø109.3 (103-115)
AERO 16 OLED BSF: Ø113.3 (107-120)
Blade 14 RZ09-0508: Ø113.7 (107-119)
15X ASF: Ø115.6 (108-120)
15 BSF: Ø116.4 (112-119)
Legion Slim 7i 16 Gen 8: Ø113.7 (100-120)
XMG Pro 16 Studio (Mid 23): Ø116.1 (103-121)
ROG Strix G18 G814JI: Ø117.1 (108-121)
Stealth 16 Studio A13VG: Ø117.1 (108-122)
Legion Pro 5 16ARX8: Ø112.3 (106-121)
XMG CORE 16 (L23): Ø118.4 (110-125)
TUF Gaming A17 FA707XI-NS94: Ø111.2 (105-118)
ROG Strix G17 G713PI: Ø118.2 (110-124)
m16 R2: Ø110 (97-116)
16X 2024: Ø118.5 (0-123)
GM6PX7X RTX 4070: Ø108.4 (96-116)
ROG Flow X16 GV601VI: Ø123.3 (106-139)
Erazer Major X20: Ø123.2 (0-126)
Predator Helios Neo 16 PHN16-72: Ø124.9 (116-131)
XMG Fusion 15 (Early 24): Ø126.2 (113-131)
Predator Helios Neo 16 PHN16-72 Turbo: Ø125.8 (116-132)
XMG Fusion 15 (Early 24) Overboost: Ø130.2 (125-135)
Legion Pro 5 16IRX9: Ø118.3 (114-125)
...
NVIDIA GeForce RTX 4070 Laptop GPU
...
max:
0 Tooltip XPS 15 9530 RTX 4070: Ø47.7 (32-51)
16X 2024: Ø88.5 (78.5-96.7)
...
NVIDIA GeForce RTX 4070 Laptop GPU
max:
...
NVIDIA GeForce RTX 4070 Laptop GPU
...
max:
» With all tested laptops playable in detail settings ultra.
Additional Benchmarks
Ultra Graphics & Postprocessing (HBAO+) 3840x2160
Medium Graphics & Postprocessing 1920x1080
170.6 [X] Lenovo Yoga Pro 9i RTX4070 Intel Core i9-13905H 1.9GHz
NVIDIA GeForce RTX 4070 Laptop GPU
min:
3.77 fps, P1:
100 fps, max:
378 fps
180 180.6 [X] Acer Nitro 16 AN16-41 AMD Ryzen 7 7735HS 3.2GHz
NVIDIA GeForce RTX 4070 Laptop GPU
min:
2.96 fps, P1:
142.9 fps, max:
337 fps
182.2 182.4 183.1 184 184.8 [X] MSI Pulse 17 B13VGK Intel Core i7-13700H 1.8GHz
NVIDIA GeForce RTX 4070 Laptop GPU
min:
2.16 fps, P1:
125 fps, max:
503 fps
185.1 [X] Aorus 15X ASF Intel Core i7-13700HX 1.5GHz
NVIDIA GeForce RTX 4070 Laptop GPU
min:
1.943 fps, P1:
100 fps, max:
513 fps
185.3 185.4 185.8 186.1 [X] Razer Blade 18 RTX 4070 Intel Core i9-13950HX 1.6GHz
NVIDIA GeForce RTX 4070 Laptop GPU
min:
1.631 fps, P1:
100 fps, max:
485 fps
186.6 186.7 186.8 187 187 187.1 187.3 [X] Medion Erazer Major X20 Intel Core i9-13900HX 1.6GHz
NVIDIA GeForce RTX 4070 Laptop GPU
min:
1.681 fps, P1:
200 fps, max:
528 fps
187.3 [X] Acer Predator Helios Neo 16 PHN16-72 Intel Core i7-14700HX 3.9GHz
NVIDIA GeForce RTX 4070 Laptop GPU
min:
1.615 fps, P1:
200 fps, max:
550 fps
187.5 [X] Aorus 16X 2024 Intel Core i9-14900HX 1.6GHz
NVIDIA GeForce RTX 4070 Laptop GPU
min:
3.21 fps, P1:
200 fps, max:
575 fps
187.8 [X] SCHENKER XMG Fusion 15 (Early 24) Intel Core i9-14900HX 1.6GHz
NVIDIA GeForce RTX 4070 Laptop GPU
min:
5.27 fps, P1:
200 fps, max:
667 fps
~ 185 fps
+ Compare
- Hide Comparison
...
NVIDIA GeForce RTX 4070 Laptop GPU
max:
165.6 [X] Lenovo Yoga Pro 9i RTX4070 Intel Core i9-13905H 1.9GHz
NVIDIA GeForce RTX 4070 Laptop GPU
min:
4.94 fps, P1:
90.9 fps, max:
423 fps
168.1 168.5 170 175.4 [X] Asus ROG Flow Z13 ACRNM Intel Core i9-13900H 1.9GHz
NVIDIA GeForce RTX 4070 Laptop GPU
min:
3.61 fps, P1:
111.1 fps, max:
402 fps
176 176.8 177 [X] Dell XPS 16 9640 Intel Core Ultra 7 155H 3.8GHz
NVIDIA GeForce RTX 4070 Laptop GPU
min:
3.41 fps, P1:
125 fps, max:
377 fps
177.7 [X] HP Omen 16-xf0376ng AMD Ryzen 7 7840HS 3.8GHz
NVIDIA GeForce RTX 4070 Laptop GPU
min:
4 fps, P1:
125 fps, max:
366 fps
179 180.3 180.9 [X] HP Victus 16-r0077ng Intel Core i7-13700H 1.8GHz
NVIDIA GeForce RTX 4070 Laptop GPU
min:
2.28 fps, P1:
142.9 fps, max:
437 fps
181.2 182.2 [X] MSI Pulse 17 B13VGK Intel Core i7-13700H 1.8GHz
NVIDIA GeForce RTX 4070 Laptop GPU
min:
2.29 fps, P1:
125 fps, max:
420 fps
182.5 182.5 183.4 184.1 184.5 184.7 [X] Razer Blade 18 RTX 4070 Intel Core i9-13950HX 1.6GHz
NVIDIA GeForce RTX 4070 Laptop GPU
min:
1.535 fps, P1:
111.1 fps, max:
474 fps
184.7 184.9 185.1 185.9 [X] Aorus 15X ASF Intel Core i7-13700HX 1.5GHz
NVIDIA GeForce RTX 4070 Laptop GPU
min:
2.11 fps, P1:
125 fps, max:
579 fps
185.9 185.9 [X] Acer Predator Helios Neo 16 PHN16-72 Intel Core i7-14700HX 3.9GHz
NVIDIA GeForce RTX 4070 Laptop GPU
min:
1.712 fps, P1:
111.1 fps, max:
523 fps
186.4 186.9 187 [X] Aorus 16X 2024 Intel Core i9-14900HX 1.6GHz
NVIDIA GeForce RTX 4070 Laptop GPU
min:
1.507 fps, P1:
166.7 fps, max:
517 fps
187 [X] SCHENKER XMG Fusion 15 (Early 24) Intel Core i9-14900HX 1.6GHz
NVIDIA GeForce RTX 4070 Laptop GPU
min:
1.662 fps, P1:
166.7 fps, max:
591 fps
187.2 [X] Medion Erazer Major X20 Intel Core i9-13900HX 1.6GHz
NVIDIA GeForce RTX 4070 Laptop GPU
min:
2.11 fps, P1:
166.7 fps, max:
564 fps
~ 181 fps
+ Compare
- Hide Comparison
...
NVIDIA GeForce RTX 4070 Laptop GPU
max:
134.3 150.1 152.8 155.8 [X] Lenovo Yoga Pro 9i RTX4070 Intel Core i9-13905H 1.9GHz
NVIDIA GeForce RTX 4070 Laptop GPU
min:
3.84 fps, P1:
83.3 fps, max:
316 fps
156.9 158.3 158.9 [X] Acer Nitro 16 AN16-41 AMD Ryzen 7 7735HS 3.2GHz
NVIDIA GeForce RTX 4070 Laptop GPU
min:
4.61 fps, P1:
111.1 fps, max:
306 fps
164.9 165.8 166.5 166.8 [X] HP Omen 16-xf0376ng AMD Ryzen 7 7840HS 3.8GHz
NVIDIA GeForce RTX 4070 Laptop GPU
min:
5.35 fps, P1:
111.1 fps, max:
302 fps
167.9 169 169.8 170.7 [X] Dell XPS 16 9640 Intel Core Ultra 7 155H 3.8GHz
NVIDIA GeForce RTX 4070 Laptop GPU
min:
3.7 fps, P1:
125 fps, max:
336 fps
171.4 [X] Lenovo Yoga Pro 9 16IMH9 Intel Core Ultra 9 185H 3.8GHz
NVIDIA GeForce RTX 4070 Laptop GPU
min:
3.71 fps, P1:
111.1 fps, max:
339 fps
172.7 [X] Asus ROG Flow X16 GV601VI Intel Core i9-13900H 1.9GHz
NVIDIA GeForce RTX 4070 Laptop GPU
min:
3.34 fps, P1:
111.1 fps, max:
364 fps
174.1 175 175.3 175.7 [X] HP Victus 16-r0077ng Intel Core i7-13700H 1.8GHz
NVIDIA GeForce RTX 4070 Laptop GPU
min:
4.06 fps, P1:
125 fps, max:
317 fps
176.5 [X] Aorus 16X 2024 Intel Core i9-14900HX 1.6GHz
NVIDIA GeForce RTX 4070 Laptop GPU
min:
2.96 fps, P1:
100 fps, max:
478 fps
176.9 [X] MSI Pulse 17 B13VGK Intel Core i7-13700H 1.8GHz
NVIDIA GeForce RTX 4070 Laptop GPU
min:
4.05 fps, P1:
125 fps, max:
402 fps
178.1 178.3 178.6 179 179.4 180.2 [X] Aorus 15X ASF Intel Core i7-13700HX 1.5GHz
NVIDIA GeForce RTX 4070 Laptop GPU
min:
1.911 fps, P1:
125 fps, max:
454 fps
180.3 180.8 180.9 [X] Acer Predator Helios Neo 16 PHN16-72 Intel Core i7-14700HX 3.9GHz
NVIDIA GeForce RTX 4070 Laptop GPU
min:
2.2 fps, P1:
83.3 fps, max:
470 fps
181.3 181.6 [X] Razer Blade 18 RTX 4070 Intel Core i9-13950HX 1.6GHz
NVIDIA GeForce RTX 4070 Laptop GPU
min:
1.674 fps, P1:
125 fps, max:
408 fps
181.7 182.4 182.9 183.1 183.1 183.8 [X] Medion Erazer Major X20 Intel Core i9-13900HX 1.6GHz
NVIDIA GeForce RTX 4070 Laptop GPU
min:
1.989 fps, P1:
125 fps, max:
437 fps
186.4 [X] SCHENKER XMG Fusion 15 (Early 24) Intel Core i9-14900HX 1.6GHz
NVIDIA GeForce RTX 4070 Laptop GPU
min:
2.13 fps, P1:
166.7 fps, max:
565 fps
~ 172 fps
+ Compare
- Hide Comparison
...
NVIDIA GeForce RTX 4070 Laptop GPU
...
max:
63.5 74.7 90.4 [X] Lenovo Yoga Pro 9i RTX4070 Intel Core i9-13905H 1.9GHz
NVIDIA GeForce RTX 4070 Laptop GPU
min:
6.93 fps, P1:
55.6 fps, max:
185.8 fps
94.4 94.8 [X] Asus ROG Flow Z13 ACRNM Intel Core i9-13900H 1.9GHz
NVIDIA GeForce RTX 4070 Laptop GPU
min:
4.6 fps, P1:
62.5 fps, max:
170.5 fps
95.7 96.5 97.4 [X] Acer Nitro 16 AN16-41 AMD Ryzen 7 7735HS 3.2GHz
NVIDIA GeForce RTX 4070 Laptop GPU
min:
36.1 fps, P1:
71.4 fps, max:
173.4 fps
98.8 100.3 102.7 103.6 [X] Dell XPS 16 9640 Intel Core Ultra 7 155H 3.8GHz
NVIDIA GeForce RTX 4070 Laptop GPU
min:
5.17 fps, P1:
71.4 fps, max:
189.8 fps
105.9 [X] HP Omen 16-xf0376ng AMD Ryzen 7 7840HS 3.8GHz
NVIDIA GeForce RTX 4070 Laptop GPU
min:
19.5 fps, P1:
76.9 fps, max:
193.4 fps
107.2 [X] Aorus 16X 2024 Intel Core i9-14900HX 1.6GHz
NVIDIA GeForce RTX 4070 Laptop GPU
min:
4.31 fps, P1:
71.4 fps, max:
174 fps
108.9 109.9 110.9 [X] Lenovo Yoga Pro 9 16IMH9 Intel Core Ultra 9 185H 3.8GHz
NVIDIA GeForce RTX 4070 Laptop GPU
min:
3.51 fps, P1:
71.4 fps, max:
198.4 fps
112.8 [X] HP Victus 16-r0077ng Intel Core i7-13700H 1.8GHz
NVIDIA GeForce RTX 4070 Laptop GPU
min:
4.13 fps, P1:
66.7 fps, max:
220 fps
114 114.3 [X] Asus ROG Flow X16 GV601VI Intel Core i9-13900H 1.9GHz
NVIDIA GeForce RTX 4070 Laptop GPU
min:
4.23 fps, P1:
76.9 fps, max:
208 fps
115.2 115.8 116.1 116.4 [X] MSI Pulse 17 B13VGK Intel Core i7-13700H 1.8GHz
NVIDIA GeForce RTX 4070 Laptop GPU
min:
8.9 fps, P1:
66.7 fps, max:
216 fps
116.6 [X] MSI Raider GE68 HX 13VG, i7-13700HX Intel Core i7-13700HX 1.5GHz
NVIDIA GeForce RTX 4070 Laptop GPU
min:
4.31 fps, P1:
76.9 fps, max:
237 fps
117.2 117.4 117.7 117.8 [X] Aorus 15X ASF Intel Core i7-13700HX 1.5GHz
NVIDIA GeForce RTX 4070 Laptop GPU
min:
27.4 fps, P1:
83.3 fps, max:
244 fps
119.7 119.9 121.4 [X] Razer Blade 18 RTX 4070 Intel Core i9-13950HX 1.6GHz
NVIDIA GeForce RTX 4070 Laptop GPU
min:
3.6 fps, P1:
76.9 fps, max:
236 fps
123 123.2 124.1 124.8 [X] Uniwill GM6PX7X RTX 4070 Intel Core i7-13700HX 1.5GHz
NVIDIA GeForce RTX 4070 Laptop GPU
min:
0.02013 fps, P1:
83.3 fps, max:
232 fps
125.4 127.2 127.8 [X] Acer Predator Helios Neo 16 PHN16-72 Intel Core i7-14700HX 3.9GHz
NVIDIA GeForce RTX 4070 Laptop GPU
min:
8.14 fps, P1:
90.9 fps, max:
209 fps
128 [X] Medion Erazer Major X20 Intel Core i9-13900HX 1.6GHz
NVIDIA GeForce RTX 4070 Laptop GPU
min:
5.76 fps, P1:
90.9 fps, max:
246 fps
130.5 132.2 [X] Acer Predator Helios Neo 16 PHN16-72 Turbo
Intel Core i7-14700HX 3.9GHz
NVIDIA GeForce RTX 4070 Laptop GPU
min:
9.61 fps, P1:
90.9 fps, max:
211 fps
137.6 [X] SCHENKER XMG Fusion 15 (Early 24) Intel Core i9-14900HX 1.6GHz
NVIDIA GeForce RTX 4070 Laptop GPU
min:
8.45 fps, P1:
90.9 fps, max:
250 fps
140.5 [X] SCHENKER XMG Fusion 15 (Early 24) Overboost
Intel Core i9-14900HX 1.6GHz
NVIDIA GeForce RTX 4070 Laptop GPU
min:
9.33 fps, P1:
90.9 fps, max:
252 fps
~ 113 fps
+ Compare
- Hide Comparison
...
NVIDIA GeForce RTX 4070 Laptop GPU
...
max:
52.9 64.5 72.6 [X] Medion Erazer Major X20 Intel Core i9-13900HX 1.6GHz
NVIDIA GeForce RTX 4070 Laptop GPU
min:
12.8 fps, P1:
45.5 fps, max:
125 fps
75.5 75.9 [X] Asus ROG Flow Z13 ACRNM Intel Core i9-13900H 1.9GHz
NVIDIA GeForce RTX 4070 Laptop GPU
min:
3.4 fps, P1:
43.5 fps, max:
128.1 fps
79.6 80.2 80.6 81.3 [X] Dell XPS 16 9640 Intel Core Ultra 7 155H 3.8GHz
NVIDIA GeForce RTX 4070 Laptop GPU
min:
0.1645 fps, P1:
52.6 fps, max:
163.4 fps
82.3 [X] Lenovo Yoga Pro 9i RTX4070 Intel Core i9-13905H 1.9GHz
NVIDIA GeForce RTX 4070 Laptop GPU
min:
7.43 fps, P1:
47.6 fps, max:
170.5 fps
86.1 [X] Acer Nitro 16 AN16-41 AMD Ryzen 7 7735HS 3.2GHz
NVIDIA GeForce RTX 4070 Laptop GPU
min:
24.8 fps, P1:
58.8 fps, max:
150.6 fps
86.8 87.6 [X] Razer Blade 18 RTX 4070 Intel Core i9-13950HX 1.6GHz
NVIDIA GeForce RTX 4070 Laptop GPU
min:
4.62 fps, P1:
55.6 fps, max:
218 fps
87.6 88.5 88.8 [X] Aorus 15X ASF Intel Core i7-13700HX 1.5GHz
NVIDIA GeForce RTX 4070 Laptop GPU
min:
22.1 fps, P1:
58.8 fps, max:
263 fps
90 [X] Asus ROG Flow X16 GV601VI Intel Core i9-13900H 1.9GHz
NVIDIA GeForce RTX 4070 Laptop GPU
min:
6.55 fps, P1:
55.6 fps, max:
163.6 fps
90.4 [X] Lenovo Yoga Pro 9 16IMH9 Intel Core Ultra 9 185H 3.8GHz
NVIDIA GeForce RTX 4070 Laptop GPU
min:
4.07 fps, P1:
58.8 fps, max:
154.1 fps
90.5 [X] Aorus 16X 2024 Intel Core i9-14900HX 1.6GHz
NVIDIA GeForce RTX 4070 Laptop GPU
min:
3.58 fps, P1:
62.5 fps, max:
157.6 fps
90.6 90.6 92.2 92.3 92.8 93.1 93.2 93.2 94.2 94.3 94.5 95.2 [X] Acer Predator Helios Neo 16 PHN16-72 Intel Core i7-14700HX 3.9GHz
NVIDIA GeForce RTX 4070 Laptop GPU
min:
6.3 fps, P1:
62.5 fps, max:
169.1 fps
98.1 [X] Acer Predator Helios Neo 16 PHN16-72 Turbo
Intel Core i7-14700HX 3.9GHz
NVIDIA GeForce RTX 4070 Laptop GPU
min:
6.9 fps, P1:
62.5 fps, max:
174.7 fps
98.2 [X] SCHENKER XMG Fusion 15 (Early 24) Intel Core i9-14900HX 1.6GHz
NVIDIA GeForce RTX 4070 Laptop GPU
min:
6.19 fps, P1:
62.5 fps, max:
182.4 fps
100.1 102.2 [X] SCHENKER XMG Fusion 15 (Early 24) Overboost
Intel Core i9-14900HX 1.6GHz
NVIDIA GeForce RTX 4070 Laptop GPU
min:
0.1728 fps, P1:
66.7 fps, max:
204 fps
~ 87 fps
+ Compare
- Hide Comparison
...
NVIDIA GeForce RTX 4070 Laptop GPU
...
max:
...
NVIDIA GeForce RTX 4070 Laptop GPU
max:
» With all tested laptops playable in detail settings ultra.
Additional Benchmarks
Highest Settings possible 16xAF 4xMSAA + FXAA 3840x2160
Normal/Off 4xAF 1920x1080
182.7 [X] Aorus 15X ASF Intel Core i7-13700HX 1.5GHz
NVIDIA GeForce RTX 4070 Laptop GPU
min:
2.04 fps, P1:
125 fps, max:
574 fps
68.2 [X] no model min:
16.8 fps, P1:
33.3 fps, max:
140.2 fps
182.1 [X] MSI Pulse 17 B13VGK 1008687
Intel Core i7-13700H 1.8GHz
NVIDIA GeForce RTX 4070 Laptop GPU
min:
2.25 fps, P1:
125 fps, max:
446 fps
167 [X] Lenovo Yoga Pro 9i RTX4070 Intel Core i9-13905H 1.9GHz
NVIDIA GeForce RTX 4070 Laptop GPU
min:
4.37 fps, P1:
90.9 fps, max:
301 fps
186.3 [X] Acer Predator Helios Neo 16 PHN16-72 Intel Core i7-14700HX 3.9GHz
NVIDIA GeForce RTX 4070 Laptop GPU
min:
1.531 fps, P1:
125 fps, max:
531 fps
187.5 [X] SCHENKER XMG Fusion 15 (Early 24) Intel Core i9-14900HX 1.6GHz
NVIDIA GeForce RTX 4070 Laptop GPU
Lowest Settings possible 1920x1080
73.7 [X] no model min:
13.6 fps, P1:
35.7 fps, max:
148 fps
185.9 [X] MSI Pulse 17 B13VGK 1008687
Intel Core i7-13700H 1.8GHz
NVIDIA GeForce RTX 4070 Laptop GPU
min:
1.91 fps, P1:
125 fps, max:
433 fps
173 [X] Lenovo Yoga Pro 9i RTX4070 Intel Core i9-13905H 1.9GHz
NVIDIA GeForce RTX 4070 Laptop GPU
min:
4.33 fps, P1:
100 fps, max:
346 fps
187 [X] Acer Predator Helios Neo 16 PHN16-72 Intel Core i7-14700HX 3.9GHz
NVIDIA GeForce RTX 4070 Laptop GPU
min:
1.581 fps, P1:
142.9 fps, max:
575 fps
187.5 [X] Aorus 16X 2024 Intel Core i9-14900HX 1.6GHz
NVIDIA GeForce RTX 4070 Laptop GPU
min:
2.46 fps, P1:
200 fps, max:
619 fps
187.9 [X] SCHENKER XMG Fusion 15 (Early 24) Intel Core i9-14900HX 1.6GHz
NVIDIA GeForce RTX 4070 Laptop GPU
min:
2.41 fps, P1:
200 fps, max:
729 fps
low med. high ultra QHD 4K Dragon's Dogma 2 76 73 59 32.9 Horizon Forbidden West 103 94 72 67 52 32.3 Alone in the Dark 207 186 175 122 71 17 Last Epoch 169.7 176 167 137 81 37.4 Skull & Bones 107 109 96 78 61 36 Helldivers 2 129.5 117.3 100 98 72 40 Enshrouded 75.2 65 54 41 23.5 Palworld 118.4 107 103 75 42.7 Prince of Persia The Lost Crown 358 358 358 340 186.7 Ready or Not 220 201 148 90 40.6 The Finals 186.6 174 143 89 42.9 Avatar Frontiers of Pandora 88 83 73 54 37 20 Call of Duty Modern Warfare 3 2023 163 149 114 105 74 49 EA Sports WRC 93 87 79 64 37.7 Alan Wake 2 79 73 69 42 19.8 Lords of the Fallen 96.9 85 63 45 29 14.6 Total War Pharaoh 385.9 251 156 121 91 47.1 Assassin's Creed Mirage 147 137 129 98 77 41 EA Sports FC 24 192.7 162.3 150.1 138.4 82.4 Counter-Strike 2 172 161 131 94 55.4 Cyberpunk 2077 2.0 Phantom Liberty 125 109 93 83 51 23 Lies of P 206 185 163 144 98 49 The Crew Motorfest 60 60 60 59 39 Starfield 65 52 47 37.2 24 Armored Core 6 104 103 99 81 45.2 Immortals of Aveum 58 47 34 19.7 Atlas Fallen 129 121 107 85 51 Baldur's Gate 3 158 128 108 105 74 40 Ratchet & Clank Rift Apart 90.4 76 61 56 49 33.2 F1 23 236 237 193 68 42 23 Diablo 4 249 230 208 180 113 60.9 Star Wars Jedi Survivor 87 81 75 71 45 24 Dead Island 2 167.9 193 171 161 112 52.5 The Last of Us 95 81 73 68 45 30.6 Resident Evil 4 Remake 155 121 113 81 60 Company of Heroes 3 220 189 152 149 112 63 Sons of the Forest 98.3 85 82 82 65 Atomic Heart 188 142 93 75 56 Returnal 98 98 90 76 57 29 Hogwarts Legacy 142.7 97 79 52 27.7 Dead Space Remake 100 96 84 83 54 26 The Witcher 3 v4.00 271 215 139 86 54 28 High On Life 228 177 134 109 67 25.7 The Callisto Protocol 147 128 123 83 63 32.96 Need for Speed Unbound 118.1 122 106 93 73 36.2 Spider-Man Miles Morales 115 94 69 42 Call of Duty Modern Warfare 2 2022 111 101 72 43 Uncharted Legacy of Thieves Collection 93 91 85 82 61 A Plague Tale Requiem 71 62 56 40.9 23 FIFA 23 166.2 The Quarry 146 122.1 98 68.2 28.7 F1 22 237 232 189 74 47 24 Vampire Bloodhunt 212 199.9 195.7 148.6 78.5 Ghostwire Tokyo 172.7 171.7 165.9 108.7 52.3 Tiny Tina's Wonderlands 226 188 129 99 69 36 Cyberpunk 2077 1.6 134 120 97 85 53 22 Elex 2 118.7 118.2 112.9 78.9 40 GRID Legends 182.9 164.1 150.1 131.7 112.1 Elden Ring 59.6 59.5 59.5 59.5 45 Dying Light 2 95 64 32 Rainbow Six Extraction 253 240 188 125 64 God of War 143.1 119.5 102 74 62 43 Halo Infinite 172.7 149.1 140.6 102.5 57.5 Farming Simulator 22 203 148.2 138.9 137 94.1 Riders Republic 160 135 121 87 49 Guardians of the Galaxy 148 147 144 108 60 Back 4 Blood 252 221 209 129.4 73.7 Far Cry 6 168.8 143 135 106 83 46 Deathloop 139.9 129.8 106.3 65.4 37.4 F1 2021 379 291 235 136 103 63.4 Days Gone 173.2 154.7 119.2 83.8 45 Resident Evil Village 220 212 189.7 128.6 62.7 Outriders 165.3 145.2 129.4 90 46.3 Hitman 3 294.3 234 208.4 197.4 129.9 68.5 Assassin´s Creed Valhalla 98 73 42 Watch Dogs Legion 130 89 64 33 Flight Simulator 2020 158.8 117.2 82.5 64.8 50.1 Horizon Zero Dawn 143 126 98 52 F1 2020 331 276 235 183 142.6 Borderlands 3 217 173 130 103 72 38 Far Cry New Dawn 165 140 135 120 105 Metro Exodus 215 141 112 88 70 45 Shadow of the Tomb Raider 206 163.4 165 147 107 57 Strange Brigade 448 283 227 198 132 70 Far Cry 5 175 148 138 129 109 61 X-Plane 11.11 156 137 108 93 Final Fantasy XV Benchmark 202 153 112 84 46 Dota 2 Reborn 190 170 161 151 129 The Witcher 3 467 348 226 112 83 67 GTA V 185 181 172 113 87 86 < 30 fps < 60 fps < 120 fps ≥ 120 fps 14 39 1 24 56 3 37 48 8 44 32 1 23 53 11 19 44 16 2
For more games that might be playable and a list of all games and graphics cards visit our Gaming List
v1.26
log 29. 10:05:41
#0 no ids found in url (should be separated by "_") +0s ... 0s
#1 not redirecting to Ajax server +0s ... 0s
#2 did not recreate cache, as it is less than 5 days old! Created at Sun, 28 Apr 2024 05:41:30 +0200 +0.001s ... 0.001s
#3 composed specs +0.074s ... 0.075s
#4 did output specs +0s ... 0.075s
#5 start showIntegratedCPUs +0s ... 0.075s
#6 getting avg benchmarks for device 11453 +0.033s ... 0.108s
#7 got single benchmarks 11453 +0.238s ... 0.346s
#8 got avg benchmarks for devices +0s ... 0.346s
#9 min, max, avg, median took s +1.307s ... 1.653s
#10 before gaming benchmark output +0.001s ... 1.654s
#11 Got 2702 rows for game benchmarks. +1.131s ... 2.785s
#12 composed SQL query for gamebenchmarks +0s ... 2.785s
#13 got data and put it in $dataArray +0.073s ... 2.858s
#14 benchmarks composed for output. +4.999s ... 7.857s
#15 return log +0.054s ... 7.911s
Notebook reviews with NVIDIA GeForce RTX 4070 Laptop GPU graphics card
Lenovo Yoga Pro 9i 16 G9 laptop review: MiniLED with 1200 nits and Core Ultra 9 Lenovo has improved its multimedia Yoga Pro 9i 16 flagship of the G9 generation in several areas. The 3.2K mini LED panel with 1200 nits is optionally matte and...
Intel Core Ultra 9 185H | NVIDIA GeForce RTX 4070 Laptop GPU | 16.00" | 2.1 kg
Lenovo Legion 7 16 G9 laptop review - A gaming machine with a 3.2K display, HX CPU and an overclocked RTX 4070 laptop With the Legion 7 16 G9, Lenovo is offering a comparatively slim and eye-catching gaming laptop which is also interesting for other target groups such as multim...
Intel Core i9-14900HX | NVIDIA GeForce RTX 4070 Laptop GPU | 16.00" | 2.3 kg
Aorus 16X (2024) review: Core i9 and RTX 4070 for US$2,000 A Core i9-14900HX and a GeForce RTX 4070 equip the Aorus 16X (2024) for video editing, gaming and rendering. Adding to this is a bright 16-inch display (16:10, ...
Intel Core i9-14900HX | NVIDIA GeForce RTX 4070 Laptop GPU | 16.00" | 2.3 kg
Dell XPS 16 9640 review - The multimedia laptop with 4K OLED and an annoying touch bar The XPS 16 9640 is Dell's new multimedia flagship, replacing the old XPS 15. Aside from its larger 16-inch display, it also features current Meteor-Lake process...
Intel Core Ultra 7 155H | NVIDIA GeForce RTX 4070 Laptop GPU | 16.30" | 2.3 kg
Lenovo Legion Pro 5 16IRX9 laptop review: Great performance, but a little heavy The Legion Pro 5 16 G9 includes several adjustments over last year's Legion Pro 5 16 G8 both internally and externally. However, there's no escaping the fact th...
Intel Core i9-14900HX | NVIDIA GeForce RTX 4070 Laptop GPU | 16.00" | 2.5 kg
Alienware m16 R2 : Intel Core Ultra 7 155H, 16.00", 2.5 kgReview » Alienware m16 R2 laptop review: Big and risky changes
Razer Blade 14 RZ09-0508 : AMD Ryzen 9 8945HS, 14.00", 1.9 kgReview » Razer Blade 14 2024 laptop review: Futureproofing with Ryzen AI
HP Omen Transcend 16-u1095ng : Intel Core i9-14900HX, 16.00", 2.3 kgReview » HP Omen Transcend 16 (2024) laptop review: An RTX 4070 gaming machine with an OLED display
Asus ROG Zephyrus G14 2024 GA403U : AMD Ryzen 9 8945HS, 14.00", 1.5 kgReview » Asus ROG Zephyrus G14 2024 review - The gaming/multimedia laptop with Ryzen 8000 and G-Sync OLED
Asus ROG Zephyrus G16 2024 GU605M : Intel Core Ultra 7 155H, 16.00", 1.8 kgReview » Asus ROG Zephyrus G16 2024 review - The gaming laptop now with G-Sync OLED and Intel Meteor Lake
Asus TUF Gaming A17 FA707XI-NS94 : AMD Ryzen 9 7940HS, 17.30", 2.5 kgReview » Asus TUF Gaming A17 FA707XI laptop review: 140 W GeForce RTX 4070 for $1400
MSI Stealth 16 Mercedes-AMG Motorsport A13VG : Intel Core i9-13900H, 16.00", 1.9 kgReview » MSI Stealth 16 Mercedes-AMG Motorsport laptop in review: Mobile racing car with OLED display
XMG Pro 16 Studio (Mid 23) : Intel Core i9-13900H, 16.00", 2.6 kgReview » XMG Pro 16 Studio (Mid 23) review: The RTX 4070 laptop for gamers and creators
SCHENKER XMG CORE 16 (L23) : AMD Ryzen 7 7840HS, 16.00", 2.4 kgReview » SCHENKER XMG Core 16 gaming laptop review - A real competitor to the Lenovo Legion Pro 5 16
HP Victus 16-r0077ng : Intel Core i7-13700H, 16.10", 2.4 kgReview » HP Victus 16 laptop review: Full HD gamer with RTX 4070
HP Omen 16-xf0376ng : AMD Ryzen 7 7840HS, 16.10", 2.4 kgReview » HP Omen 16 laptop review: A good choice for gamers even with Zen 4
Acer Nitro 17 AN17-41-R9LN : AMD Ryzen 7 7735HS, 17.30", 3 kgReview » Acer Nitro 17 Ryzen edition review: The QHD gaming laptop with an RTX 4070
Aorus 15 BSF : Intel Core i7-13700H, 15.60", 2.4 kgReview » Aorus 15 BSF review: The QHD gaming laptop with an RTX 4070 and great runtimes
HP Omen Transcend 16 : Intel Core i9-13900HX, 16.00", 2.3 kgReview » HP Omen Transcend 16 laptop review: More than just a small name difference
SCHENKER VISION 16 Pro (M23) : Intel Core i7-13700H, 16.00", 1.6 kgReview » Schenker Vision 16 Pro 2023 review: 1.6 kg light and powerful package with RTX 4070 Laptop
MSI Pulse 17 B13VGK : Intel Core i7-13700H, 17.30", 2.7 kgReview » MSI Pulse 17 B13V gaming laptop review: With quiet wings
MSI Stealth 16 Studio A13VG : Intel Core i7-13700H, 16.00", 2 kgReview » MSI Stealth 16 Studio laptop review: An extremely light, 16-inch, Core i7, RTX 4070 device for gamers and creators
Lenovo Legion Slim 7i 16 Gen 8 : Intel Core i9-13900H, 16.00", 2.1 kgReview » Lenovo Legion Slim 7i 16 Gen 8 laptop review: Slimmer than the Razer Blade 16
Asus ProArt Studiobook 16 OLED H7604 : Intel Core i9-13980HX, 16.00", 2.4 kgReview » Asus ProArt Studiobook 16 OLED review: Multimedia laptop with extreme CPU performance
Razer Blade 14 RTX 4070 : AMD Ryzen 9 7940HS, 14.00", 1.8 kgReview » Razer Blade 14 Zen 4 laptop review: Lots of changes that matter
Acer Nitro 16 AN16-41 : AMD Ryzen 7 7735HS, 16.00", 2.7 kgReview » Acer Nitro 16 AN16-41 review: An RTX 4070 gaming laptop with good battery life
SCHENKER XMG Focus 17 (E23) : Intel Core i9-13900HX, 17.30", 2.9 kgReview » Schenker XMG Focus 17 (E23) in review: Gaming laptop with RTX 4070 doesn't skimp on performance
Asus Zenbook Pro 14 OLED UX6404VI : Intel Core i9-13900H, 14.50", 1.7 kgReview » Asus Zenbook Pro 14 OLED laptop review: MacBook Pro rival with 120 Hz OLED display
Dell XPS 17 9730 RTX 4070 : Intel Core i7-13700H, 17.00", 2.5 kgReview » Dell XPS 17 9730 laptop review: GeForce RTX 4070 multimedia monster
Lenovo Legion Pro 5 16ARX8 : AMD Ryzen 7 7745HX, 16.00", 2.5 kgReview » Ryzen 7 7745HX performance debut: Lenovo Legion Pro 5 16 Gen 8 laptop review
Samsung Galaxy Book3 Ultra 16, i9-13900H RTX 4070 : Intel Core i9-13900H, 16.00", 1.8 kgReview » Samsung Galaxy Book3 Ultra 16 with RTX 4070 in review: High graphics performance in a business-like notebook
Medion Erazer Major X20 : Intel Core i9-13900HX, 16.00", 2.4 kgReview » Medion Erazer Major X20 review: Gaming notebook with RTX 4070 and solid hardware
Dell XPS 15 9530 RTX 4070 : Intel Core i7-13700H, 15.60", 1.9 kgReview » Dell XPS 15 9530 RTX 4070 laptop review: Both impressive and underwhelming
Asus ROG Flow Z13 ACRNM : Intel Core i9-13900H, 13.40", 1.7 kgReview » Asus ROG Flow Z13 ACRNM Review - Gaming Convertible with RTX 4070 Laptop
Aorus 15X ASF : Intel Core i7-13700HX, 15.60", 2.3 kgReview » Aorus 15X ASF review: Gaming laptop with RTX 4070 power and stamina
Asus ROG Strix G17 G713PI : AMD Ryzen 9 7945HX, 17.30", 2.8 kgReview » AMD Ryzen 9 7945HX Analysis - Zen4 Dragon Range is faster and more efficient than Intel Raptor Lake-HX
Uniwill GM6PX7X RTX 4070 : Intel Core i7-13700HX, 16.00", 2.2 kgReview » Core i7-13700HX performance debut: Uniwill GM6PX7X IDX laptop review
Asus ROG Strix G17 G713PI : AMD Ryzen 9 7945HX, 17.30", 2.8 kgReview » Asus ROG Strix G17 G713PI: Gaming laptop impresses in the test with the new Ryzen 9
Gigabyte AERO 16 OLED BSF : Intel Core i9-13900H, 16.00", 2.1 kgReview » Slim Gigabyte AERO 16 OLED laptop review: Efficient RTX 4070 for gamers and creatives
Asus ROG Strix G18 G814JI : Intel Core i7-13650HX, 18.00", 3 kgReview » Asus ROG Strix G18 G814JI laptop review: Light and shade with the 18-inch gaming machine
SCHENKER XMG Neo 17 2023 Engineering Sample : Intel Core i9-13900HXReview » GeForce RTX 4070, 4060, 4050 Laptop Analysis - Nvidia's new Mainstream Laptop GPUs in Review
Razer Blade 18 RTX 4070 : Intel Core i9-13950HX, 18.00", 3 kgReview » Razer Blade 18 laptop review: Smaller than many 17-inch gaming laptops
Asus TUF Gaming A16 FA607PI : AMD Ryzen 9 7845HX, 16.00", 2.3 kgExternal Review » Asus TUF Gaming A16 FA607PI
Dell XPS 16 9640, Ultra 7 165H RTX 4070 : Intel Core Ultra 7 165H, 16.30", 2.1 kgExternal Review » Dell XPS 16 9640, Ultra 7 165H RTX 4070
HP Omen 16-xf0079ng : AMD Ryzen 7 7840HS, 16.10", 2.4 kgExternal Review » HP Omen 16-xf0079ng
HP Omen Transcend 16-u1095ng : Intel Core i9-14900HX, 16.00", 2.3 kgExternal Review » HP Omen Transcend 16-u1095ng
MSI Vector 17 HX A14VGG : Intel Core i9-14900HX, 17.30", 3 kgExternal Review » MSI Vector 17 HX A14VGG
Lenovo Legion Pro 5 16IRX9, i7-14700HX : Intel Core i7-14700HX, 16.00", 2.5 kgExternal Review » Lenovo Legion Pro 5 16IRX9, i7-14700HX
Lenovo Legion Slim 7 16IRH8, i9-13900H RTX 4070 : Intel Core i9-13900H, 16.00", 2 kgExternal Review » Lenovo Legion Slim 7 16IRH8, i9-13900H RTX 4070
Lenovo Yoga Pro 9 16IMH9 : Intel Core Ultra 9 185H, 16.00", 2.1 kgExternal Review » Lenovo Yoga Pro 9 16IMH9
Lenovo Legion 7 16IRX9 : Intel Core i7-14650HX, 16.00", 2.3 kgExternal Review » Lenovo Legion 7 16IRX9
Lenovo ThinkPad P1 G6, i7-13800H RTX 4070 : Intel Core i7-13800H, 16.00", 1.8 kgExternal Review » Lenovo ThinkPad P1 G6, i7-13800H RTX 4070
Acer Nitro 16 AN16-41, R9 7940HS : AMD Ryzen 9 7940HS, 16.00", 2.7 kgExternal Review » Acer Nitro 16 AN16-41, R9 7940HS
HP Omen Transcend 14-fb0000ng : Intel Core Ultra 9 185H, 14.00", 1.6 kgExternal Review » HP Omen Transcend 14-fb0000ng
Aorus 16X 2024 : Intel Core i9-14900HX, 16.00", 2.3 kgExternal Review » Aorus 16X 2024
Lenovo Legion Pro 5 16IRX9 : Intel Core i9-14900HX, 16.00", 2.5 kgExternal Review » Lenovo Legion Pro 5 16IRX9
Razer Blade 14 RZ09-0508 : AMD Ryzen 9 8945HS, 14.00", 1.9 kgExternal Review » Razer Blade 14 RZ09-0508
Acer Predator Helios Neo 18 PHN18-71 : Intel Core i9-14900HX, 18.00", 3.4 kgExternal Review » Acer Predator Helios Neo 18 PHN18-71
Acer Predator Helios Neo 16 PHN16-72 : Intel Core i7-14700HX, 16.00", 2.6 kgExternal Review » Acer Predator Helios Neo 16 PHN16-72
Alienware m16 R2 : Intel Core Ultra 7 155H, 16.00", 2.5 kgExternal Review » Alienware m16 R2
Asus ROG Zephyrus G16 2024 GU605M : Intel Core Ultra 7 155H, 16.00", 1.8 kgExternal Review » Asus ROG Zephyrus G16 2024 GU605M
Asus ROG Zephyrus G14 2024 GA403U : AMD Ryzen 9 8945HS, 14.00", 1.5 kgExternal Review » Asus ROG Zephyrus G14 2024 GA403U
Acer Predator Helios Neo 16 PHN16-71, i5-13700HX RTX 4070 : Intel Core i7-13700HX, 16.00", 2.6 kgExternal Review » Acer Predator Helios Neo 16 PHN16-71, i5-13700HX RTX 4070
Dell XPS 16 9640 : Intel Core Ultra 7 155H, 16.30", 2.3 kgExternal Review » Dell XPS 16 9640
Aorus 16X ASG : Intel Core i7-14650HX, 16.00", 2.3 kgExternal Review » Aorus 16X ASG
MSI Alpha 17 C7VG : AMD Ryzen 9 7945HX, 17.30", 2.8 kgExternal Review » MSI Alpha 17 C7VG
Dell XPS 17 9730, i9-13900H : Intel Core i9-13900H, 17.00", 2.4 kgExternal Review » Dell XPS 17 9730, i9-13900H
Dell G16 7630, i9-13900HX RTX 4070 : Intel Core i9-13900HX, 16.00", 2.9 kgExternal Review » Dell G16 7630, i9-13900HX RTX 4070
Acer Nitro 17 AN17-41 : AMD Ryzen 7 7840HS, 17.30", 3 kgExternal Review » Acer Nitro 17 AN17-41
HP Omen 16-xf0000ng : AMD Ryzen 9 7940HS, 16.10", 2.4 kgExternal Review » HP Omen 16-xf0000ng
SCHENKER XMG CORE 16 (L23) : AMD Ryzen 7 7840HS, 16.00", 2.4 kgExternal Review » SCHENKER XMG CORE 16 (L23)
Asus ROG Zephyrus G14 GA402XI : AMD Ryzen 9 7940HS, 14.00", 1.7 kgExternal Review » Asus ROG Zephyrus G14 GA402XI
MSI Creator Z17 HX Studio A13VGT, i7-13700HX : Intel Core i7-13700HX, 17.00", 2.5 kgExternal Review » MSI Creator Z17 HX Studio A13VGT, i7-13700HX
Acer Predator Helios 16 PH16-71-97H2 : Intel Core i9-13900HX, 16.00", 2.7 kgExternal Review » Acer Predator Helios 16 PH16-71-97H2
HP Victus 16-s0000 : AMD Ryzen 7 7840HS, 16.10", 2.3 kgExternal Review » HP Victus 16-s0000
SCHENKER VISION 16 Pro (M23) : Intel Core i7-13700H, 16.00", 1.6 kgExternal Review » SCHENKER VISION 16 Pro (M23)
Lenovo Yoga Pro 9i RTX4070 : Intel Core i9-13905H, 16.00"External Review » Lenovo Yoga Pro 9i RTX4070
HP Victus 16-r0077ng : Intel Core i7-13700H, 16.10", 2.4 kgExternal Review » HP Victus 16-r0077ng
Asus TUF Gaming A15 FA507XI : AMD Ryzen 9 7940HS, 15.60", 2.2 kgExternal Review » Asus TUF Gaming A15 FA507XI
Lenovo Legion Pro 5 16IRX8, i7-13700HX RTX 4070 : Intel Core i7-13700HX, 16.00", 2.6 kgExternal Review » Lenovo Legion Pro 5 16IRX8, i7-13700HX RTX 4070
Acer Predator Helios 16 PH16-71-76FS : Intel Core i7-13700HX, 16.00", 2.7 kgExternal Review » Acer Predator Helios 16 PH16-71-76FS
Lenovo Yoga Pro 9 16IRP8, RTX 4070 : Intel Core i9-13905H, 16.00", 2.2 kgExternal Review » Lenovo Yoga Pro 9 16IRP8, RTX 4070
MSI Katana 17 B13VGK : Intel Core i7-13620H, 17.30", 2.6 kgExternal Review » MSI Katana 17 B13VGK
Acer Predator Helios 16 PH16-71-74AS : Intel Core i7-13700HX, 16.00", 2.6 kgExternal Review » Acer Predator Helios 16 PH16-71-74AS
Lenovo Legion 5 Pro 16ARX8 : AMD Ryzen 7 7745HX, 16.00", 2.5 kgExternal Review » Lenovo Legion 5 Pro 16ARX8
HP Omen Transcend 16-u0027TX : Intel Core i7-13700HX, 16.00", 2.2 kgExternal Review » HP Omen Transcend 16-u0027TX
Acer Predator Triton 14 PT14-51, i7-13700H RTX 4070 : Intel Core i7-13700H, 14.00", 1.7 kgExternal Review » Acer Predator Triton 14 PT14-51, i7-13700H RTX 4070
HP Omen Transcend 16-u0000 : Intel Core i9-13900HX, 16.00", 2.2 kgExternal Review » HP Omen Transcend 16-u0000
Lenovo Legion Pro 7 16IRX8, i7-13700HX RTX 4070 : Intel Core i7-13700HX, 16.00", 2.8 kgExternal Review » Lenovo Legion Pro 7 16IRX8, i7-13700HX RTX 4070
Acer Nitro 16 AN16-41 : AMD Ryzen 7 7735HS, 16.00", 2.7 kgExternal Review » Acer Nitro 16 AN16-41
Asus TUF Gaming A17 FA707XI : AMD Ryzen 9 7940HS, 17.30", 2.6 kgExternal Review » Asus TUF Gaming A17 FA707XI
Alienware m16 R1 AMD, RTX 4070 : AMD Ryzen 9 7845HX, 16.00", 3.1 kgExternal Review » Alienware m16 R1 AMD, RTX 4070
Acer Nitro 16 AN16-41-R8UR : AMD Ryzen 7 7735HS, 16.00", 2.7 kgExternal Review » Acer Nitro 16 AN16-41-R8UR
HP Victus 16-r0000ns : Intel Core i7-13700H, 16.10", 2.3 kgExternal Review » HP Victus 16-r0000ns
Asus ROG Flow X13 GV302XI : AMD Ryzen 9 7940HS, 13.40", 1.3 kgExternal Review » Asus ROG Flow X13 GV302XI
Asus ProArt StudioBook 16 OLED H7604JI : Intel Core i9-13980HX, 16.00", 2.4 kgExternal Review » Asus ProArt StudioBook 16 OLED H7604JI
Asus VivoBook Pro 16 OLED K6604JI : Intel Core i9-13980HX, 16.00", 2 kgExternal Review » Asus VivoBook Pro 16 OLED K6604JI
Origin PC EON14-S 2023 : Intel Core i9-13900H, 14.00", 1.8 kgExternal Review » Origin PC EON14-S 2023
MSI Katana 15 B12VGK : Intel Core i7-12650H, 15.60", 2.3 kgExternal Review » MSI Katana 15 B12VGK
HP Omen Transcend 16 : Intel Core i9-13900HX, 16.00", 2.3 kgExternal Review » HP Omen Transcend 16
Lenovo Legion Slim 7i 16 Gen 8 : Intel Core i9-13900H, 16.00", 2.1 kgExternal Review » Lenovo Legion Slim 7i 16 Gen 8
HP Omen Transcend 16-u0095ng : Intel Core i9-13900HX, 16.00", 2.2 kgExternal Review » HP Omen Transcend 16-u0095ng
MSI Crosshair 15 C12VG : Intel Core i7-12650H, 15.60", 2.3 kgExternal Review » MSI Crosshair 15 C12VG
Hyperbook SL606, i9-13900H RTX 4070 : Intel Core i9-13900H, 16.00", 2.7 kgExternal Review » Hyperbook SL606, i9-13900H RTX 4070
MSI Alpha 17 C7VF : AMD Ryzen 9 7945HX, 17.30", 2.8 kgExternal Review » MSI Alpha 17 C7VF
Lenovo Legion Pro 5 16ARX8 : AMD Ryzen 7 7745HX, 16.00", 2.5 kgExternal Review » Lenovo Legion Pro 5 16ARX8
MSI Creator Z17 HX Studio A13VGT : Intel Core i9-13950HX, 17.00", 2.5 kgExternal Review » MSI Creator Z17 HX Studio A13VGT
Origin PC EVO16-S 2023 : Intel Core i9-13900H, 16.10", 2.5 kgExternal Review » Origin PC EVO16-S 2023
Acer Nitro 17 AN17-41-R9LN : AMD Ryzen 7 7735HS, 17.30", 3 kgExternal Review » Acer Nitro 17 AN17-41-R9LN
Razer Blade 14 RTX 4070 : AMD Ryzen 9 7940HS, 14.00", 1.8 kgExternal Review » Razer Blade 14 RTX 4070
MSI Stealth 14 Studio A13VG, i7-13620H : Intel Core i7-13620H, 14.00", 1.7 kgExternal Review » MSI Stealth 14 Studio A13VG, i7-13620H
Dell XPS 17 9730 RTX 4070 : Intel Core i7-13700H, 17.00", 2.5 kgExternal Review » Dell XPS 17 9730 RTX 4070
Asus ProArt Studiobook 16 OLED H7604 : Intel Core i9-13980HX, 16.00", 2.4 kgExternal Review » Asus ProArt Studiobook 16 OLED H7604
Lenovo Legion Pro 5 16IRX8, i9-13900HX RTX 4070 : Intel Core i9-13900HX, 16.00", 2.6 kgExternal Review » Lenovo Legion Pro 5 16IRX8, i9-13900HX RTX 4070
Asus ROG Zephyrus M16 GU604VI : Intel Core i9-13900H, 16.00", 2.3 kgExternal Review » Asus ROG Zephyrus M16 GU604VI
Lenovo Legion Pro 7 16IRX8H, i9-13900HX RTX 4070 : Intel Core i9-13900HX, 16.00", 2.5 kgExternal Review » Lenovo Legion Pro 7 16IRX8H, i9-13900HX RTX 4070
Asus Zenbook Pro 14 OLED UX6404VI : Intel Core i9-13900H, 14.50", 1.7 kgExternal Review » Asus Zenbook Pro 14 OLED UX6404VI
Lenovo Yoga Pro 9i 14 2023 : Intel Core i9-13905H, 14.50", 1.7 kgExternal Review » Lenovo Yoga Pro 9i 14 2023
Razer Blade 16 Early 2023 RTX 4070 : Intel Core i9-13950HX, 16.00", 2.5 kgExternal Review » Razer Blade 16 Early 2023 RTX 4070
MSI Stealth 14 Studio A13VG : Intel Core i7-13700H, 14.00", 1.7 kgExternal Review » MSI Stealth 14 Studio A13VG
Acer Predator Helios 16 PH16-71 : Intel Core i9-13900HX, 16.00", 2.7 kgExternal Review » Acer Predator Helios 16 PH16-71
Acer Predator Helios 16 PH16-71-96HK : Intel Core i9-13900HK, 16.00", 2.7 kgExternal Review » Acer Predator Helios 16 PH16-71-96HK
Dell XPS 15 9530 RTX 4070 : Intel Core i7-13700H, 15.60", 1.9 kgExternal Review » Dell XPS 15 9530 RTX 4070
Asus ROG Strix G17 G713PI : AMD Ryzen 9 7945HX, 17.30", 2.8 kgExternal Review » Asus ROG Strix G17 G713PI
Asus ROG Strix G18 G814JI, i9-13980HX : Intel Core i9-13980HX, 18.00", 3 kgExternal Review » Asus ROG Strix G18 G814JI, i9-13980HX
Gigabyte Aorus 15 BSF : Intel Core i7-13700H, 15.60", 2.3 kgExternal Review » Gigabyte Aorus 15 BSF
MSI Raider GE68 HX 13VG : Intel Core i9-13950HX, 15.60", 2.7 kgExternal Review » MSI Raider GE68 HX 13VG
MSI Raider GE68 HX 13VG, i7-13700HX : Intel Core i7-13700HX, 16.00", 2.7 kgExternal Review » MSI Raider GE68 HX 13VG, i7-13700HX
Medion Erazer Major X20 : Intel Core i9-13900HX, 16.00", 2.4 kgExternal Review » Medion Erazer Major X20
MSI Stealth 16 Studio A13VG : Intel Core i7-13700H, 16.00", 2 kgExternal Review » MSI Stealth 16 Studio A13VG
Asus ROG Strix G16 G614JI : Intel Core i9-13980HX, 16.00", 2.5 kgExternal Review » Asus ROG Strix G16 G614JI
Asus ROG Flow X16 GV601VI : Intel Core i9-13900H, 16.00", 2.2 kgExternal Review » Asus ROG Flow X16 GV601VI
MSI Pulse 15 B13VGK : Intel Core i7-13700H, 17.30", 2.7 kgExternal Review » MSI Pulse 15 B13VGK
Gigabyte AERO 16 OLED BSF : Intel Core i9-13900H, 16.00", 2.1 kgExternal Review » Gigabyte AERO 16 OLED BSF
Asus ROG Flow Z13 ACRNM : Intel Core i9-13900H, 13.40", 1.7 kgExternal Review » Asus ROG Flow Z13 ACRNM
MSI Katana 15 B13VGK : Intel Core i7-13620H, 15.60", 2.3 kgExternal Review » MSI Katana 15 2023 B13VGK
MSI Vector GP77 13VG : Intel Core i7-13700H, 17.30", 2.8 kgExternal Review » MSI Vector GP77 13VG
MSI Pulse 17 B13VGK : Intel Core i7-13700H, 17.30", 2.7 kgExternal Review » MSI Pulse 17 B13VGK
Asus ROG Strix G18 G814JI : Intel Core i7-13650HX, 18.00", 3 kgExternal Review » Asus ROG Strix G18 G814JI
Aorus 15X ASF : Intel Core i7-13700HX, 15.60", 2.3 kgExternal Review » Aorus 15X ASF
Razer Blade 18 RTX 4070 : Intel Core i9-13950HX, 18.00", 3 kgExternal Review » Razer Blade 18 RTX 4070
Samsung Galaxy Book3 Ultra 16, i9-13900H RTX 4070 : Intel Core i9-13900H, 16.00", 1.8 kgExternal Review » Samsung Galaxy Book3 Ultra 16, i9-13900H RTX 4070
Lenovo Legion Pro 5 16IRX8, i9-13900HX RTX 4070 : Intel Core i9-13900HX, 16.00", 2.6 kgCore i9-powered Lenovo Legion Pro 5i gaming laptop with RTX 4070 returns to record-low price
Lenovo Yoga Pro 9 16IMH9 : Intel Core Ultra 9 185H, 16.00", 2.1 kgLenovo Yoga Pro 9i 16 G9 still comes with a great mini LED panel at 1200 nits, but also new problems
Lenovo Legion Pro 5 16ARX8 : AMD Ryzen 7 7745HX, 16.00", 2.5 kgLenovo Legion Pro 5 with RTX 4070 and 32 GB RAM receives sizeable $641 discount
Asus ROG Zephyrus G16 2024 GU605M : Intel Core Ultra 7 155H, 16.00", 1.8 kgAsus ROG Zephyrus G16 OLED gaming laptop with RTX 4070 and Core Ultra 9 gets first discount
Aorus 16X 2024 : Intel Core i9-14900HX, 16.00", 2.3 kgAorus 16X (2024): Bright display, long runtimes, RTX 4070
Asus ROG Zephyrus G14 GA402XI : AMD Ryzen 9 7940HS, 14.00", 1.7 kgAsus ROG Zephyrus G14 gaming laptop with RTX 4070 back on sale for record-low price
Dell XPS 17 9730 RTX 4070 : Intel Core i7-13700H, 17.00", 2.5 kgMonstrous Dell XPS 17 laptop with RTX 4080, 4K display, 32GB RAM and Core i9 gets largest discount ever
Dell XPS 15 9530 RTX 4070 : Intel Core i7-13700H, 15.60", 1.9 kgDell XPS 15 laptop with Core i7 and Intel ARC A370M dGPU gets sweet $510 discount
Lenovo Legion Pro 5 16ARX8 : AMD Ryzen 7 7745HX, 16.00", 2.5 kgRTX 4070-powered Legion Pro 5 Gen 8 gets big 32% price cut in Lenovo's new gaming laptop sale
Dell G16 7630, i9-13900HX RTX 4070 : Intel Core i9-13900HX, 16.00", 2.9 kgDell G16 with RTX 4070 and Core i9 drops by $400 in Amazon's limited-time gaming laptop sale
Asus ROG Zephyrus G14 2024 GA403U : AMD Ryzen 9 8945HS, 14.00", 1.5 kgAsus ROG Zephyrus G14 and G16 go on sale with OLED displays starting at €1,899
Asus ROG Zephyrus G16 2024 GU605M : Intel Core Ultra 7 155H, 16.00", 1.8 kgAsus ROG Zephyrus G14 and G16 go on sale with OLED displays starting at €1,899
HP Omen 16-xf0000ng : AMD Ryzen 9 7940HS, 16.10", 2.4 kgHP Omen 16 gaming laptop with RTX 4070 and Ryzen 9 now discounted by $750
HP Omen 16-xf0376ng : AMD Ryzen 7 7840HS, 16.10", 2.4 kgHP OMEN 16 2023 price drops again to 120-day low at Best Buy for Ryzen 9 7940HS and RTX 4070 SKU
HP Omen Transcend 16 : Intel Core i9-13900HX, 16.00", 2.3 kgHP OMEN 16 2023 price drops again to 120-day low at Best Buy for Ryzen 9 7940HS and RTX 4070 SKU
MSI Vector GP77 13VG : Intel Core i7-13700H, 17.30", 2.8 kgMSI Vector GP77 gaming laptop with Core i9, RTX 4070 and 64GB RAM gets massive $650 discount
Asus ROG Zephyrus M16 GU604VI : Intel Core i9-13900H, 16.00", 2.3 kgStealthy Asus ROG Zephyrus M16 gaming laptop with RTX 4070 and Core i9 drops back to record-low price
Asus ROG Strix G17 G713PI : AMD Ryzen 9 7945HX, 17.30", 2.8 kgAsus ROG Strix G17 gaming laptop with RTX 4070, AMD Ryzen 9 7945HX and 240Hz QHD display discounted by 27% in Amazon's Black Friday sale
XMG Pro 16 Studio (Mid 23) : Intel Core i9-13900H, 16.00", 2.6 kgXMG Pro 16 Studio: Lots of power for gamers and creators
HP Victus 16-r0077ng : Intel Core i7-13700H, 16.10", 2.4 kgAffordable HP Victus 15 gaming laptop records massive 33% discount at Best Buy
Aorus 15 BSF : Intel Core i7-13700H, 15.60", 2.4 kgAorus 15 BSF: The RTX 4070 laptop with 10-hour runtimes
Asus ROG Strix G17 G713PI : AMD Ryzen 9 7945HX, 17.30", 2.8 kgAsus ROG Strix G17 with RTX 4060, AMD Ryzen 9 7845HX and 240Hz QHD display gets US$300 discount in new gaming laptop sale
HP Omen Transcend 16 : Intel Core i9-13900HX, 16.00", 2.3 kgHP Omen Transcend 16 is three steps forward and one step back for the series
Asus ROG Zephyrus M16 GU604VI : Intel Core i9-13900H, 16.00", 2.3 kgPowerful Asus ROG Zephyrus M16 QHD gaming laptop with RTX 4070 and Core i9 on sale with its largest discount yet
MSI Pulse 17 B13VGK : Intel Core i7-13700H, 17.30", 2.7 kgMSI Pulse 17 reviewed: Gaming laptop with a questionable price-performance ratio
SCHENKER VISION 16 Pro (M23) : Intel Core i7-13700H, 16.00", 1.6 kgHighest performance per kg: Schenker Vision 16 Pro impresses with RTX 4070 Laptop and magnesium case
Lenovo Legion Slim 7i 16 Gen 8 : Intel Core i9-13900H, 16.00", 2.1 kgSmall attention to detail on the Lenovo Legion Slim Gen 8 solves an annoying issue on the Alienware x16 r1
Asus ProArt Studiobook 16 OLED H7604 : Intel Core i9-13980HX, 16.00", 2.4 kgThe ProArt Studiobook 16 OLED is fast, but too loud
Asus Zenbook Pro 14 OLED UX6404VI : Intel Core i9-13900H, 14.50", 1.7 kgThe Asus Zenbook Pro 14 impresses with a lot of performance and the world's first 120 Hz OLED display
Samsung Galaxy Book3 Ultra 16, i9-13900H RTX 4070 : Intel Core i9-13900H, 16.00", 1.8 kgA quiet and hot creator laptop: Samsung Galaxy Book3 Ultra 16 reviewed
Dell XPS 15 9530 RTX 4070 : Intel Core i7-13700H, 15.60", 1.9 kgDell XPS 15 9530 comes with 40 W to 50 W TGP GeForce RTX 4070 graphics
Medion Erazer Major X20 : Intel Core i9-13900HX, 16.00", 2.4 kgMedion Erazer Major X20: RTX 4070 notebook with mechanical keyboard
Uniwill GM6PX7X RTX 4070 : Intel Core i7-13700HX, 16.00", 2.2 kgFirst in-house Core i7-13700HX benchmarks show a 25 percent performance boost over the popular Core i7-12700H
Asus ROG Strix G17 G713PI : AMD Ryzen 9 7945HX, 17.30", 2.8 kgFocus on gaming performance: Asus ROG Strix G17 with remarkable single purpose
Gigabyte AERO 16 OLED BSF : Intel Core i9-13900H, 16.00", 2.1 kgNew Aero 16 OLED reviewed: OLED and new Intel/Nvidia generations on the rise
Razer Blade 18 RTX 4070 : Intel Core i9-13950HX, 18.00", 3 kgNvidia driver 528.49 is borked on the Blade 18 RTX 4070, Razer says a fix should be coming soon
Please share our article, every link counts!
» Comparison of GPUs
» Benchmark List
» Notebook Gaming List
Class 1
Class 2 Radeon PRO W6600M *
Class 3 UHD Graphics 32EUs
UHD Graphics 750
Class 4
Class 5 * Approximate position of the graphics adapter
Working For Notebookcheck
Are you a techie who knows how to translate? Then join our Team!
Details here
Top 10 Laptops Multimedia , Budget Multimedia , Gaming , Budget Gaming , Lightweight Gaming , Business , Budget Office , Workstation , Subnotebooks , Ultrabooks , Chromebooks
under 300 USD/Euros , under 500 USD/Euros , 1,000 USD/Euros , for University Students , Best Displays
Top 10 Smartphones Smartphones , Phablets , ≤6-inch , Camera Smartphones
Klaus Hinum (Update: 2022-12-19)
 Deutsch
 English
 Español
 Français
 Italiano
 Nederlands
 Polski
 Português
 Русский
 Türkçe
 Svenska
 Chinese
 Magyar