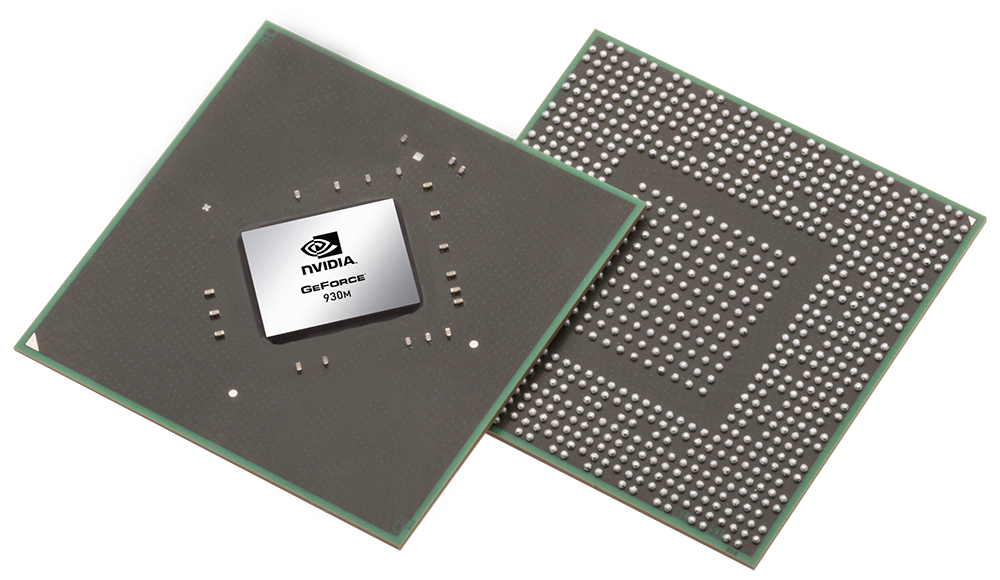
NVIDIA GeForce 930M
The NVIDIA GeForce 930M (sometimes also called Nvidia GeForce GT 930M) is a (lower) mid-range, DirectX 11-compatible graphics card for laptops unveiled in March 2015. It is based on the last years GeForce 840M . In addition to the "normal" 25 Watt 930M, there is also a low power variant with a TDP of 12 Watt and support for DDR3 and GDDR5. The DDR3 variant should be approximately 10% slower than the 25 Watt version. The performance of the GDDR5 version is still unknown. The shader count for these low power 930M are also unknown. As the LP version is clocked only at 457 MHz + Boost it may feature more shaders (or a high Boost).
Update: The N16S-LP variant (5-12 Watt TDP, Low Power version?) will be available with GDDR5 starting in the first quarter of 2016. Later in 2016, the successor named GeForce 930MX was released that was available with GDDR5.
Architecture
Compared to Kepler, Maxwell has been optimized in several details to increase power efficiency. Smaller Streaming Multiprocessors (SMM) with only 128 ALUs (Kepler: 192) and an optimized scheduler should lead to better utilization of the shaders. Nvidia promises that a Maxwell SMM with 128 ALUs can offer 90 percent of the performance of a Kepler SMX with 192 ALUs. The 930M should feature the full GM108 with 3 SMMs (384 shader cores, 24 TMUs, and 8 ROPs due to the 64-bit interface).
Another optimization is the massively enlarged L2 cache. The larger size can process some of the memory traffic to allow for a relatively narrow memory interface without significantly reducing performance.
Similar to GM107, the GM108 supports DirectX 12 with Feature Level 11_0 only.
Performance
The performance should be a bit below an average GeForce 840M due to the slower core clock. This means that demanding games like Evolve are only playable in lowest settings. Less demanding games like F1 2014 or Fifa 15 on the other hand should run in highest settings. See gaming benchmarks below for more details.
Features
GM108 integrates the sixth generation of the PureVideo HD video engine (VP6), offering a better decoding performance for H.264 and MPEG-2 videos. Of course, VP6 supports all features of previous generations (4K support, PIP, video encoding via NVENC API). Unfortunately, HDMI 2.0 is still not supported.
Power Consumption
The power consumption of the GeForce 930M should be about 33 Watts or less. Therefore, the 930M is best suited for laptops 13 inches in size or larger. The 900M series also supports Optimus to automatically switch between an integrated graphics card and the Nvidia GPU.
GeForce 900M Series Codename N16S-GM-B/S, N16S-LP Architecture Maxwell Pipelines 384 - unified Core Speed 928 - 941 (Boost) MHz Memory Speed 1800 MHz Memory Bus Width 64 Bit Memory Type DDR3 Max. Amount of Memory 2048 MB Shared Memory no API DirectX 12 (FL 11_0), Shader 5.0, OpenGL 4.5 Power Consumption 12 / 25 Watt technology 28 nm Features GPU Boost 2.0, Optimus, PhysX, CUDA, GeForce Experience, GameWorks Date of Announcement 12.03.2015 Link to Manufacturer Page www.geforce.com
Benchmarks Performance Rating - 3DMark 11 + Fire Strike + Time Spy
0.7 pt (2%)
...
...
max:
3DMark - 3DMark Cloud Gate Score
min: 5685 avg: 6271 median: 6071 (6%) max: 7808 Points
...
...
max:
3DMark - 3DMark Cloud Gate Graphics
min: 8148 avg: 8373 median: 8309 (2%) max: 8684 Points
...
...
max:
3DMark - 3DMark Fire Strike Standard Score
min: 1267 avg: 1300 median: 1290.5 (2%) max: 1369 Points
...
...
max:
3DMark - 3DMark Fire Strike Standard Graphics
min: 1435 avg: 1470 median: 1460.5 (2%) max: 1527 Points
...
...
max:
3DMark - 3DMark Ice Storm Graphics
min: 40616 avg: 59248 median: 56647 (7%) max: 80544 Points
...
...
max:
3DMark 11 - 3DM11 Performance Score
min: 2131 avg: 2251 median: 2247 (3%) max: 2456 Points
...
...
max:
3DMark 11 - 3DM11 Performance GPU
min: 2057 avg: 2145 median: 2153 (2%) max: 2271 Points
...
...
max:
3DMark Vantage + 3DMark Vantage - 3DM Vant. Perf. total
7274 Points (2%)
...
...
max:
3DM Vant. Perf. GPU no PhysX + 3DMark Vantage - 3DM Vant. Perf. GPU no PhysX
6557 Points (4%)
...
...
max:
3DMark 06 3DMark 06 - Standard 1280x1024 +
11760 Points (15%)
...
...
max:
Unigine Heaven 2.1 - Heaven 2.1 high
27.3 fps (5%)
...
...
SPECviewperf 11 + SPECviewperf 11 - specvp11 snx-01
4.1 fps (2%)
...
...
specvp11 tcvis-02 + SPECviewperf 11 - specvp11 tcvis-02
1.4 fps (1%)
...
...
specvp11 sw-02 + SPECviewperf 11 - specvp11 sw-02
9 fps (7%)
...
...
specvp11 proe-05 + SPECviewperf 11 - specvp11 proe-05
2.2 fps (3%)
...
...
specvp11 maya-03 + SPECviewperf 11 - specvp11 maya-03
11 fps (8%)
...
...
max:
specvp11 lightwave-01 + SPECviewperf 11 - specvp11 lightwave-01
19.9 fps (21%)
...
...
max:
specvp11 ensight-04 + SPECviewperf 11 - specvp11 ensight-04
16.4 fps (8%)
...
...
specvp11 catia-03 + SPECviewperf 11 - specvp11 catia-03
11.8 fps (6%)
...
...
Cinebench R10 Cinebench R10 Shading (32bit) + Cinebench R10 - Cinebench R10 Shading (32bit)
min: 5741 avg: 5875 median: 5853.5 (4%) max: 6050 points
...
...
Cinebench R11.5 Cinebench R11.5 OpenGL 64 Bit + Cinebench R11.5 - Cinebench R11.5 OpenGL 64 Bit
min: 24.59 avg: 36.2 median: 36.8 (13%) max: 46.4 fps
...
...
max:
Cinebench R15 + Cinebench R15 - Cinebench R15 OpenGL 64 Bit
min: 32.69 avg: 46.1 median: 45.4 (3%) max: 56.2 fps
...
...
Cinebench R15 OpenGL Ref. Match 64 Bit + Cinebench R15 - Cinebench R15 OpenGL Ref. Match 64 Bit
99.6 % (100%)
...
...
GFXBench 3.0 - GFXBench 3.0 Manhattan Offscreen
60.5 fps (4%)
...
...
GFXBench (DX / GLBenchmark) 2.7 + GFXBench (DX / GLBenchmark) 2.7 - GFXBench T-Rex HD Offscreen C24Z16
114.2 fps (1%)
...
...
LuxMark v2.0 64Bit - LuxMark v2.0 Room GPU
372 Samples/s (2%)
...
...
max:
LuxMark v2.0 64Bit - LuxMark v2.0 Sala GPU
694 Samples/s (1%)
...
...
max:
ComputeMark v2.1 - ComputeMark v2.1 Result
1454 points (2%)
...
...
max:
- Range of benchmark values for this graphics card
- Average benchmark values for this graphics card
* Smaller numbers mean a higher performance
Game Benchmarks The following benchmarks stem from our benchmarks of review laptops. The performance depends on the used graphics memory, clock rate, processor, system settings, drivers, and operating systems. So the results don't have to be representative for all laptops with this GPU. For detailed information on the benchmark results, click on the fps number.
...
max:
» The benchmarks indicate that the game is not playable in the tested settings.
...
...
» The benchmarks indicate that the game is not playable in the tested settings.
...
» The benchmarks indicate that the game is not playable in the tested settings.
...
max:
» The benchmarks indicate that the game is not playable in the tested settings.
...
...
max:
» The benchmarks indicate that the game is not playable in the tested settings.
...
...
max:
» The benchmarks indicate that the game is not playable in the tested settings.
...
max:
» The benchmarks indicate that the game is not playable in the tested settings.
...
» The benchmarks indicate that the game is not playable in the tested settings.
...
...
» The benchmarks indicate that the game is not playable in the tested settings.
...
...
» With all tested laptops playable in detail settings low.
...
...
max:
» The benchmarks indicate that the game is not playable in the tested settings.
...
...
max:
» The benchmarks indicate that the game is not playable in the tested settings.
...
...
max:
» With all tested laptops playable in detail settings low.
...
...
max:
» With all tested laptops playable in detail settings low.
...
...
max:
Intel Arc A580
» The benchmarks indicate that the game is not playable in the tested settings.
...
...
max:
» The benchmarks indicate that the game is not playable in the tested settings.
...
...
max:
» With all tested laptops playable in detail settings low.
...
...
max:
» The benchmarks indicate that the game is not playable in the tested settings.
...
...
max:
» The benchmarks indicate that the game is not playable in the tested settings.
...
...
max:
» The benchmarks indicate that the game is not playable in the tested settings.
...
...
» With all tested laptops playable in detail settings low.
...
...
max:
» The benchmarks indicate that the game is not playable in the tested settings.
...
...
max:
» With all tested laptops playable in detail settings low.
...
...
max:
» The benchmarks indicate that the game is not playable in the tested settings.
...
...
max:
» With all tested laptops playable in detail settings low.
...
...
max:
» The benchmarks indicate that the game is not playable in the tested settings.
...
...
» The benchmarks indicate that the game is not playable in the tested settings.
...
...
max:
» The benchmarks indicate that the game is not playable in the tested settings.
...
...
max:
» The benchmarks indicate that the game is not playable in the tested settings.
...
...
max:
» The benchmarks indicate that the game is not playable in the tested settings.
...
...
max:
» With all tested laptops playable in detail settings low.
...
...
max:
» The benchmarks indicate that the game is not playable in the tested settings.
...
...
max:
» The benchmarks indicate that the game is not playable in the tested settings.
...
...
max:
» The benchmarks indicate that the game is not playable in the tested settings.
...
...
» The benchmarks indicate that the game is not playable in the tested settings.
...
...
max:
» The benchmarks indicate that the game is not playable in the tested settings.
...
...
...
...
...
max:
» With all tested laptops playable in detail settings low.
...
...
max:
» With all tested laptops playable in detail settings low.
...
...
max:
» The benchmarks indicate that the game is not playable in the tested settings.
...
...
max:
» The benchmarks indicate that the game is not playable in the tested settings.
...
...
max:
» With all tested laptops playable in detail settings low.
...
...
max:
...
...
max:
» With all tested laptops playable in detail settings low.
...
...
max:
» The benchmarks indicate that the game is not playable in the tested settings.
...
...
max:
...
...
max:
» With all tested laptops playable in detail settings low.
...
...
max:
» The benchmarks indicate that the game is not playable in the tested settings.
...
...
max:
» The benchmarks indicate that the game is not playable in the tested settings.
...
...
max:
» The benchmarks indicate that the game is not playable in the tested settings.
...
...
» The benchmarks indicate that the game is not playable in the tested settings.
...
...
max:
» With all tested laptops playable in detail settings low.
Additional Benchmarks
Medium Preset 1366x768
78.3 [X] Asus F555LF-XO029H Intel Core i5-5200U 2.2GHz
GeForce 930M
...
...
» The benchmarks indicate that the game is not playable in the tested settings.
Additional Benchmarks
Medium Preset (100 % Resolution Scale) 1366x768
10.5 [X] Asus F555LF-XO029H Intel Core i5-5200U 2.2GHz
GeForce 930M
...
...
» With all tested laptops playable in detail settings low.
Additional Benchmarks
Medium Preset 4xAF 1366x768
26 [X] Asus F555LF-XO029H Intel Core i5-5200U 2.2GHz
GeForce 930M
...
...
max:
» The benchmarks indicate that the game is not playable in the tested settings.
Additional Benchmarks
Medium Preset 1366x768
21.6 [X] Asus F555LF-XO029H Intel Core i5-5200U 2.2GHz
GeForce 930M
...
...
...
...
...
...
» With all tested laptops playable in detail settings high.
...
...
...
...
max:
» With all tested laptops playable in detail settings low.
...
...
...
...
max:
» With all tested laptops playable in detail settings low.
...
...
» With all tested laptops playable in detail settings low.
Additional Benchmarks
Medium Preset 4xAF FXAA 1366x768
34.3 [X] Asus F555LF-XO029H Intel Core i5-5200U 2.2GHz
GeForce 930M
...
...
max:
» With all tested laptops playable in detail settings low.
Additional Benchmarks
Medium / On (100 % Gameplay Resolution) MediumAA 1366x768
20.7 [X] Asus F555LF-XO029H Intel Core i5-5200U 2.2GHz
GeForce 930M
...
...
max:
» The benchmarks indicate that the game is not playable in the tested settings.
Additional Benchmarks
Medium Preset (Resolution Scale Mode off) FXAA 1366x768
19.1 [X] Asus F555LF-XO029H Intel Core i5-5200U 2.2GHz
GeForce 930M
...
...
max:
» The benchmarks indicate that the game is not playable in the tested settings.
Additional Benchmarks
Medium Preset FXAA 1366x768
14.3 [X] Asus F555LF-XO029H Intel Core i5-5200U 2.2GHz
GeForce 930M
...
...
max:
» With all tested laptops playable in detail settings low.
Additional Benchmarks
Medium Preset 4xAF TAA 1366x768
22.8 [X] Asus F555LF-XO029H Intel Core i5-5200U 2.2GHz
GeForce 930M
...
...
max:
» With all tested laptops playable in detail settings low.
Additional Benchmarks
Medium / Off FXAA 1366x768
22.6 [X] Asus F555LF-XO029H Intel Core i5-5200U 2.2GHz
GeForce 930M
...
...
max:
...
max:
» The benchmarks indicate that the game is not playable in the tested settings.
...
...
max:
...
...
max:
» The benchmarks indicate that the game is not playable in the tested settings.
...
...
max:
...
...
max:
» The benchmarks indicate that the game is not playable in the tested settings.
...
...
max:
...
...
max:
» With all tested laptops playable in detail settings med..
...
...
...
...
...
...
max:
» With all tested laptops playable in detail settings med..
...
...
max:
...
...
max:
» With all tested laptops playable in detail settings low.
...
...
...
...
» With all tested laptops playable in detail settings low.
...
...
» The benchmarks indicate that the game is not playable in the tested settings.
...
...
max:
...
...
max:
...
...
max:
» With all tested laptops playable in detail settings high.
...
...
max:
...
...
max:
» The benchmarks indicate that the game is not playable in the tested settings.
...
...
max:
...
...
max:
» With all tested laptops playable in detail settings low.
...
...
...
...
» With all tested laptops playable in detail settings med..
...
...
...
...
» The benchmarks indicate that the game is not playable in the tested settings.
...
...
» The benchmarks indicate that the game is not playable in the tested settings.
...
...
...
...
max:
» With all tested laptops playable in detail settings low.
...
...
...
...
» The benchmarks indicate that the game is not playable in the tested settings.
...
...
max:
...
...
max:
» The benchmarks indicate that the game is not playable in the tested settings.
...
...
» The benchmarks indicate that the game is not playable in the tested settings.
...
...
...
...
...
...
...
» The benchmarks indicate that the game is not playable in the tested settings.
...
...
max:
...
...
max:
...
...
max:
...
...
max:
» The benchmarks indicate that the game is not playable in the tested settings.
...
...
max:
...
...
max:
...
...
max:
...
...
max:
» With all tested laptops playable in detail settings med..
...
...
max:
...
...
max:
...
...
max:
...
...
max:
» The benchmarks indicate that the game is not playable in the tested settings.
...
...
...
...
max:
...
...
...
...
» With all tested laptops playable in detail settings low.
...
...
max:
...
...
max:
...
...
max:
...
» The benchmarks indicate that the game is not playable in the tested settings.
...
...
...
...
...
...
...
max:
» The benchmarks indicate that the game is not playable in the tested settings.
...
...
max:
...
...
max:
...
...
...
» With all tested laptops playable in detail settings low.
...
...
...
...
...
...
max:
...
...
max:
» With all tested laptops playable in detail settings low.
...
...
max:
...
...
max:
...
...
» With all tested laptops playable in detail settings ultra.
...
...
max:
...
...
max:
...
...
max:
...
...
max:
» With all tested laptops playable in detail settings med..
...
...
...
...
...
...
...
...
» With all tested laptops playable in detail settings med..
...
...
max:
...
...
...
...
» The benchmarks indicate that the game is not playable in the tested settings.
...
...
max:
...
...
max:
» With all tested laptops playable in detail settings med..
...
...
...
...
...
...
...
» The benchmarks indicate that the game is not playable in the tested settings.
...
...
max:
...
...
max:
...
...
max:
...
...
max:
» The benchmarks indicate that the game is not playable in the tested settings.
...
...
...
...
max:
...
...
» With all tested laptops playable in detail settings med..
...
...
max:
...
...
max:
...
...
max:
...
...
max:
» With all tested laptops playable in detail settings med..
...
...
...
...
...
...
» With all tested laptops playable in detail settings med..
...
...
...
...
» The benchmarks indicate that the game is not playable in the tested settings.
...
...
...
...
...
...
...
» The benchmarks indicate that the game is not playable in the tested settings.
...
...
max:
...
...
max:
...
...
» With all tested laptops playable in detail settings low.
...
...
...
...
» With all tested laptops playable in detail settings low.
...
...
» The benchmarks indicate that the game is not playable in the tested settings.
...
...
...
...
» With all tested laptops playable in detail settings low.
...
...
max:
...
...
...
...
» With most tested laptops playable in detail settings med..
...
...
max:
...
...
...
...
...
...
» With all tested laptops playable in detail settings high.
...
...
...
...
...
...
» With all tested laptops playable in detail settings low.
...
...
...
...
» The benchmarks indicate that the game is not playable in the tested settings.
...
...
max:
...
...
max:
...
...
max:
...
...
» With most tested laptops playable in detail settings med..
...
...
...
...
» With all tested laptops playable in detail settings low.
...
...
max:
...
...
max:
» With all tested laptops playable in detail settings ultra.
...
...
max:
...
...
max:
...
...
...
...
max:
» With all tested laptops playable in detail settings high.
...
...
...
...
max:
...
...
max:
...
» With all tested laptops playable in detail settings low.
...
...
...
...
...
...
max:
...
...
max:
» With all tested laptops playable in detail settings med..
...
...
max:
...
...
max:
...
...
max:
...
» With all tested laptops playable in detail settings low.
...
...
...
...
...
...
» With all tested laptops playable in detail settings low.
...
...
...
...
...
...
» With all tested laptops playable in detail settings low.
...
...
max:
...
...
max:
...
...
max:
» With all tested laptops playable in detail settings med..
...
...
max:
...
...
» With all tested laptops playable in detail settings med..
...
...
...
...
...
...
» With all tested laptops playable in detail settings low.
...
...
...
...
...
...
...
...
max:
» With all tested laptops playable in detail settings high.
...
...
...
...
...
...
...
...
» With all tested laptops playable in detail settings med..
...
...
max:
...
...
max:
» With all tested laptops playable in detail settings low.
...
...
...
...
...
...
...
...
max:
» With all tested laptops playable in detail settings ultra.
...
...
...
...
...
...
» With all tested laptops playable in detail settings high.
For more games that might be playable and a list of all games and graphics cards visit our Gaming List
v1.26
log 17. 14:54:01
#0 no ids found in url (should be separated by "_") +0s ... 0s
#1 not redirecting to Ajax server +0s ... 0s
#2 did not recreate cache, as it is less than 5 days old! Created at Tue, 16 Apr 2024 05:39:00 +0200 +0.001s ... 0.001s
#3 composed specs +0.044s ... 0.045s
#4 did output specs +0s ... 0.045s
#5 start showIntegratedCPUs +0s ... 0.045s
#6 getting avg benchmarks for device 6222 +0.028s ... 0.073s
#7 got single benchmarks 6222 +0.029s ... 0.102s
#8 got avg benchmarks for devices +0s ... 0.102s
#9 min, max, avg, median took s +0.542s ... 0.644s
#10 before gaming benchmark output +0s ... 0.644s
#11 Got 341 rows for game benchmarks. +0.019s ... 0.663s
#12 composed SQL query for gamebenchmarks +0s ... 0.663s
#13 got data and put it in $dataArray +0.087s ... 0.75s
#14 benchmarks composed for output. +2.264s ... 3.014s
#15 return log +0.084s ... 3.099s
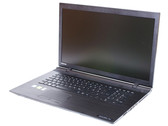
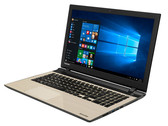
Notebook reviews with NVIDIA GeForce 930M graphics card
Toshiba Satellite C70-C-1FT Notebook Review Mixed feelings. Toshiba adds another model to the already pretty diverse segment of the 17-inch notebook category. The C70 uses standard hardware and lacks any ...
Intel Core i5-6200U | NVIDIA GeForce 930M | 17.30" | 3.6 kg
Toshiba Satellite L50-C-275 Notebook Review Well-equipped. Toshiba’s multimedia all-rounder Satellite L50-C-275 is priced at just under 750 Euros (~$826). Considering its good features and properties (inc...
Intel Core i5-6200U | NVIDIA GeForce 930M | 15.60" | 2.1 kg
HP Envy 15 x360 Convertible (Core i5-6200U) Review A big step forward.Hewlett Packard has eliminated some weaknesses that we had found in a previously tested Envy model. Thanks to a Skylake processor, IPS screen...
Intel Core i5-6200U | NVIDIA GeForce 930M | 15.60" | 2.2 kg
HP Envy 15-w000ng x360 Notebook Review Slowed down. Anyone thinking about buying HP's new, unusual 15-inch convertible will need patience. The sluggish hard drive slows down the system unnecessarily....
Intel Core i5-5200U | NVIDIA GeForce 930M | 15.60" | 2.3 kg
Toshiba Satellite P50-C-10G Notebook Review Ups and downs. Toshiba's Satellite P50 might convince with its good screen and decent system performance. However, inconsistencies are noticed in the build and ...
Intel Core i7-5500U | NVIDIA GeForce 930M | 15.60" | 2.2 kg
Asus Asuspro Essential P751JF-T2007G : Intel Core i5-4210M, 17.30", 3 kgReview » Asus AsusPro Essential P751JF Notebook Review
Toshiba Satellite L50-C-18U : Intel Core i5-5200U, 15.60", 2 kgExternal Review » Toshiba Satellite L50-C-18U
Toshiba Satellite Pro A50-C-1MT : Intel Core i5-6200U, 15.60", 2.2 kgExternal Review » Toshiba Satellite Pro A50-C-1MT
Medion Akoya P7641-MD99855 : Intel Core i5-6200U, 17.30", 2.7 kgExternal Review » Medion Akoya P7641-MD99855
Toshiba Tecra Z40-C-103 : Intel Core i7-6600U, 14.00", 1.5 kgExternal Review » Toshiba Tecra Z40-C-103
Toshiba Satellite L50-C-275 : Intel Core i5-6200U, 15.60", 2.1 kgExternal Review » Toshiba Satellite L50-C-275
Asus K555LF-XO017D : Intel Core i7-5500U, 15.60", 2.3 kgExternal Review » Asus K555LF-XO017D
Dell Vostro 5459 : Intel Core i5-6200U, 14.00", 1.7 kgExternal Review » Dell Vostro 5459
Toshiba Tecra Z50-C1550 : Intel Core i7-6600U, 15.60", 2.2 kgExternal Review » Toshiba Tecra Z50-C1550
Toshiba Satellite P50-C186 : Intel Core i7-6500U, 15.60", 2.2 kgExternal Review » Toshiba Satellite P50-C186
Toshiba Satellite P50-C-129 : Intel Core i7-5500U, 15.60", 2 kgExternal Review » Toshiba Satellite P50-C-129
Asus A555LF : Intel Core i5-5200U, 15.60", 2.3 kgExternal Review » Asus A555LF
Toshiba Satellite P50-C-10e : Intel Core i7-5500U, 15.60", 2.2 kgExternal Review » Toshiba Satellite P50-C-10e
Toshiba Satellite P50-C-10G : Intel Core i7-5500U, 15.60", 2.2 kgExternal Review » Toshiba Satellite P50-C-10G
Toshiba Satellite L50-C-15C : Intel Core i7-5500U, 15.60", 2.2 kgExternal Review » Toshiba Satellite L50-C-15C
Toshiba Satellite L50-C-111 : Intel Core i5-5200U, 15.60", 2.2 kgExternal Review » Toshiba Satellite L50-C-111
Please share our article, every link counts!
» Comparison of GPUs
» Benchmark List
» Notebook Gaming List
Class 1
Class 2 Radeon PRO W6600M *
Class 3 UHD Graphics 32EUs
UHD Graphics 750
Class 4
Class 5 * Approximate position of the graphics adapter
Working For Notebookcheck
Are you a techie who knows how to translate? Then join our Team!
Details here
Top 10 Laptops Multimedia , Budget Multimedia , Gaming , Budget Gaming , Lightweight Gaming , Business , Budget Office , Workstation , Subnotebooks , Ultrabooks , Chromebooks
under 300 USD/Euros , under 500 USD/Euros , 1,000 USD/Euros , for University Students , Best Displays
Top 10 Smartphones Smartphones , Phablets , ≤6-inch , Camera Smartphones
Klaus Hinum (Update: 2016-01-26)
 Deutsch
 English
 Español
 Français
 Italiano
 Nederlands
 Polski
 Português
 Русский
 Türkçe
 Svenska
 Chinese
 Magyar