Notebook reviews with NVIDIA GeForce GTX 1650 Ti Mobile graphics card
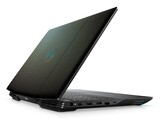
Dell G5 15 5500 Laptop Review: Aspirational mid-ranger let down by a sub-par display
Dell's new G5 15 5500 variant aims to appeal to the mid-range gamer. With a Core i5-10300H, a GTX 1650 Ti, and a 120 Hz display, the G5 15 5500 gets the basics ...
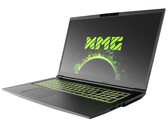
Intel Core i5-10300H | NVIDIA GeForce GTX 1650 Ti Mobile | 15.60" | 2.3 kgSchenker XMG Core 17 (Tongfang GK7MRFR) in review: Mid-range gaming laptop without hot flashes
The hardware of the Schenker XMG Core 17 brings all modern computer games smoothly onto the 17.3-inch screen (Full HD, IPS, 144 Hz). The laptop also scores poin...
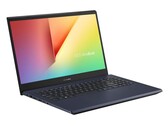
Intel Core i7-10750H | NVIDIA GeForce GTX 1650 Ti Mobile | 17.30" | 2.5 kgAsus VivoBook 15 K571LI Laptop Review: Gaming Multimedia Hybrid
It's the most powerful version of the VivoBook 15 you can get at the moment, but that doesn't necessarily mean it's the best. This GeForce GTX-powered laptop is...
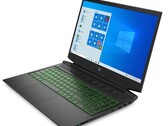
Intel Core i7-10750H | NVIDIA GeForce GTX 1650 Ti Mobile | 15.60" | 2.1 kgHP Pavilion Gaming 16 Laptop Review: Low-priced 16-inch laptop with a GeForce GPU
Even though HP already has many good gaming laptops in its Omen series, the manufacturer also offers low-priced gaming notebooks in its Pavilion series. The sys...
Intel Core i5-10300H | NVIDIA GeForce GTX 1650 Ti Mobile | 16.10" | 2.2 kgAsus ROG Strix G15 G512LI Laptop Review: $1000 USD for GeForce GTX 1650 Ti Graphics is Too Much
Laptops running on GeForce RTX 2060 graphics these days are beginning to retail for about $1000 to $1200 USD, but Asus' ROG Strix G15 G512LI comes with the slow...
Intel Core i7-10750H | NVIDIA GeForce GTX 1650 Ti Mobile | 15.60" | 2.3 kgAcer Nitro 5 AN515-44-R5FT: AMD Ryzen 5 4600H, 15.60", 2.2 kg
Review » Acer Nitro 5 AN515-44 Laptop Review: AMD dating Nvidia
Dell XPS 15 9500 Core i7 4K UHD: Intel Core i7-10875H, 15.60", 2 kg
Review » Dell XPS 15 9500 Core i7 GeForce GTX 1650 Ti Laptop Review: No Core i9 Nonsense
HP Pavilion 16-a0002ns: Intel Core i7-10750H, 16.10", 2.4 kg
External Review » HP Pavilion 16-a0002ns
Asus TUF Gaming F17 FX706LI-ES53: Intel Core i5-10300H, 17.30", 2.6 kg
External Review » Asus TUF Gaming F17 FX706LI-ES53
HP Pavilion Gaming 16-a0040ns: Intel Core i7-10870H, 16.10", 2.4 kg
External Review » HP Pavilion Gaming 16-a0040ns
HP Pavilion Gaming 16-a0024ns: Intel Core i7-10750H, 16.10", 2.4 kg
External Review » HP Pavilion Gaming 16-a0024ns
LG UltraPC 15U70P-P.AAS8U1: Intel Core i7-1165G7, 15.60", 1.9 kg
External Review » LG UltraPC 15U70P-P.AAS8U1
Acer Aspire 7 A715-75G-76NG: Intel Core i7-10750H, 15.60", 2.2 kg
External Review » Acer Aspire 7 A715-75G-76NG
HP Pavilion Gaming 15-ec1028ns: AMD Ryzen 7 4800H, 15.60", 2 kg
External Review » HP Pavilion Gaming 15-ec1028ns
MSI Summit E14 A11SCST-069NE: Intel Core i7-1185G7, 14.00", 1.3 kg
External Review » MSI Summit E14 A11SCST-069NE
HP Pavilion Gaming 16-a0046ns: Intel Core i5-10300H, 16.10", 2.4 kg
External Review » HP Pavilion Gaming 16-a0046ns
HP Pavilion Gaming 16-a0010ns: Intel Core i7-10750H, 16.10", 2.4 kg
External Review » HP Pavilion Gaming 16-a0010ns
Asus ROG Zephyrus G14 GA401II-HE092T: AMD Ryzen 7 4800HS, 14.00", 1.7 kg
External Review » Asus ROG Zephyrus G14 GA401II-HE092T
HP Pavilion Gaming 15-ec1013ns: AMD Ryzen 7 4800H, 15.60", 2 kg
External Review » HP Pavilion Gaming 15-ec1013ns
Haier GG1500A, i5-10200H GTX 1650 Ti: Intel Core i5-10200H, 15.60", 1.9 kg
External Review » Haier GG1500A, i5-10200H GTX 1650 Ti
Acer Aspire 7 A715-75G-57H8: Intel Core i5-9300H, 15.60", 2.2 kg
External Review » Acer Aspire 7 A715-75G-57H8
Hyperbook NV4, i7-1165G7 GTX 1650 Ti: Intel Core i7-1165G7, 14.00", 1.4 kg
External Review » Hyperbook NV4, i7-1165G7 GTX 1650 Ti
Asus ROG Zephyrus G14 GA401II-HE004: AMD Ryzen 7 4800HS, 14.00", 1.6 kg
External Review » Asus ROG Zephyrus G14 GA401II-HE004
HP Pavilion 16-a0003ns: Intel Core i7-10750H, 16.10", 2.4 kg
External Review » HP Pavilion 16-a0003ns
Lenovo IdeaPad Gaming 3 15ARH05-82EY003NGE: AMD Ryzen 5 4600H, 15.60", 2.2 kg
External Review » Lenovo IdeaPad Gaming 3 15ARH05-82EY003NGE
Asus TUF Gaming F17 FX706LI-HX177T: Intel Core i7-10870H, 17.30", 2.6 kg
External Review » Asus TUF Gaming F17 FX706LI-HX177T
Dell XPS 15 9500-NCFMG: Intel Core i7-10750H, 15.60", 2.1 kg
External Review » Dell XPS 15 9500-NCFMG
Acer Nitro 5 AN515-55-59KS: Intel Core i5-10300H, 15.60", 2.3 kg
External Review » Acer Nitro 5 AN515-55-59KS
HP Pavilion Gaming 16-a0044ns: Intel Core i5-10300H, 16.10", 2.5 kg
External Review » HP Pavilion Gaming 16-a0044ns
Dell Vostro 15 7500, i7-10750H GTX 1650 Ti: Intel Core i7-10750H, 15.60", 1.9 kg
External Review » Dell Vostro 15 7500, i7-10750H GTX 1650 Ti
Acer Nitro 5 AN515-44-R7LD: AMD Ryzen 5 4600H, 15.60", 2.4 kg
External Review » Acer Nitro 5 AN515-44-R7LD
Dell G3 15 3500-H5JDG: Intel Core i5-10300H, 15.60", 2.6 kg
External Review » Dell G3 15 3500-H5JDG
Asus TUF Gaming F15 FX506LI-HN109: Intel Core i7-10870H, 15.60", 2.3 kg
External Review » Asus TUF Gaming A15 FX506LI-HN109
Dell XPS 17 9700, i7-10750H GTX 1650Ti: Intel Core i7-10750H, 17.30", 2.5 kg
External Review » Dell XPS 17 9700, i7-10750H GTX 1650Ti
Acer Nitro 5 AN515-44-R3N9: AMD Ryzen 5 4600H, 15.60", 2.4 kg
External Review » Acer Nitro 5 AN515-44-R3N9
Asus TUF Gaming F15 FX506LI-HN109T: Intel Core i7-10750H, 15.60", 2.3 kg
External Review » Asus TUF Gaming A15 FX506LI-HN109T
Dell XPS 15 9500-XHR6F: Intel Core i9-10885H, 15.60", 2.1 kg
External Review » Dell XPS 15 9500-XHR6F
Acer ConceptD 3 Ezel CC314-72G-79WQ: Intel Core i7-10750H, 14.00", 1.9 kg
External Review » Acer ConceptD 3 Ezel CC314-72G-79WQ
HP Pavilion Gaming 16-a0021ns: Intel Core i7-10750H, 16.10", 2.4 kg
External Review » HP Pavilion Gaming 16-a0021ns
Lenovo Legion Slim 7i-82BC002FGE: Intel Core i5-10300H, 15.60", 1.9 kg
External Review » Lenovo Legion Slim 7i-82BC002FGE
Acer ConceptD 3 Ezel CC315-72G-73DF: Intel Core i7-10750H, 15.60", 2.2 kg
External Review » Acer ConceptD 3 Ezel CC315-72G-73DF
Lenovo Yoga 9 15IMH5-82DE000WGE: Intel Core i7-10750H, 15.60", 2 kg
External Review » Lenovo Yoga 9 15IMH5-82DE000WGE
Acer Nitro 5 AN515-44-R6TE: AMD Ryzen 5 4600H, 15.60", 2.4 kg
External Review » Acer Nitro 5 AN515-44-R6TE
Asus TUF Gaming A15 FA506II-BQ029: AMD Ryzen 7 4800H, 15.60", 2.3 kg
External Review » Asus TUF A15 FA506II-BQ029
Asus TUF A17 FA706II-AU741: AMD Ryzen 7 4800H, 17.30", 2.6 kg
External Review » Asus TUF A17 FA706II-AU741
Acer Nitro 5 AN515-44-R5FT: AMD Ryzen 5 4600H, 15.60", 2.2 kg
External Review » Acer Nitro 5 AN515-44-R5FT
Xiaomi Redmi G, i5-10300H 1650Ti: Intel Core i5-10300H, 16.10", 2.5 kg
External Review » Xiaomi Redmi G, i5-10300H 1650Ti
HP Pavilion Gaming 15-ec1158ng: AMD Ryzen 5 4600H, 15.60", 2.3 kg
External Review » HP Pavilion Gaming 15-ec1158ng
Acer Predator Helios 300 PH315-53-5507: Intel Core i5-10300H, 15.60", 2.3 kg
External Review » Acer Predator Helios 300 PH315-53-5507
HP Pavilion Gaming 16-a0007ns: Intel Core i7-10750H, 15.60", 2.4 kg
External Review » HP Pavilion Gaming 16-a0007ns
HP Pavilion Gaming 16-a0027ns: Intel Core i7-10750H, 16.10", 2.4 kg
External Review » HP Pavilion Gaming 16-a0027ns
Lenovo IdeaPad Creator 5 15IMH05-82D4003GGE: Intel Core i7-10750H, 15.60", 2.2 kg
External Review » Lenovo IdeaPad Creator 5 15IMH05-82D4003GGE
Dell XPS 15 9500-XXFY5: Intel Core i7-10750H, 15.60", 2.1 kg
External Review » Dell XPS 15 9500-XXFY5
HP Omen 15-en0261ng: AMD Ryzen 7 4800H, 15.60", 2.4 kg
External Review » HP Omen 15-en0261ng
Dell G5 15 5500 i7-10750H, 1650 Ti: Intel Core i7-10750H, 15.60", 2.4 kg
External Review » Dell G5 15 5500 i7-10750H, 1650 Ti
HP Omen 15-en0001ns: AMD Ryzen 7 4800H, 15.60", 2.4 kg
External Review » HP Omen 15-en0001ns
HP Envy 15-ep0003ns: Intel Core i5-10300H, 15.60", 2.1 kg
External Review » HP Envy 15-ep0003ns
Lenovo Ideapad Creator 5 15IMH05, i5-10300H GTX 1650 Ti: Intel Core i5-10300H, 15.60", 2.2 kg
External Review » Lenovo Ideapad Creator 5 15IMH05, i5-10300H GTX 1650 Ti
Xiaomi Redmi G Gaming i7-10750H GTX 1650Ti: Intel Core i7-10750H, 16.10", 2.5 kg
External Review » Xiaomi Redmi G Gaming i7-10750H GTX 1650Ti
Schenker XMG Core 15-M20hdw: AMD Ryzen 7 4800H, 15.60", 1.9 kg
External Review » Schenker XMG Core 15-M20hdw
Asus TUF Gaming A15 FA506II-BQ150: AMD Ryzen 7 4800H, 15.60", 2.3 kg
External Review » Asus TUF Gaming A15 FA506II-BQ150
MSI GF75 Thin 10SCSR-015NE: Intel Core i7-10750H, 17.30", 2.2 kg
External Review » MSI GF75 Thin 10SCSR-015NE
Acer Nitro 5 AN515-55-52HQ: Intel Core i5-10300H, 15.60", 2.3 kg
External Review » Acer Nitro 5 AN515-55-52HQ
HP Pavilion Gaming 15-ec1012ns: AMD Ryzen 7 4800H, 15.60", 2 kg
External Review » HP Pavilion Gaming 15-ec1012ns
Dell G5 15 5500-9T6CF: Intel Core i5-10300H, 15.60", 2.4 kg
External Review » Dell G5 15 5500-9T6CF
Acer Predator Triton 300 PT315-52, i5-10300H GTX 1650 Ti: Intel Core i5-10300H, 15.60", 2.3 kg
External Review » Acer Predator Triton 300 PT315-52, i5-10300H GTX 1650 Ti
HP Omen 15t-ek000: Intel Core i5-10300H, 15.60", 2.4 kg
External Review » HP Omen 15t-ek000
Acer Aspire 7 A715-75G: Intel Core i7-9750H, 15.60", 2.2 kg
External Review » Acer Aspire 7 A715-75G
Asus ROG Strix G15 G512LI: Intel Core i7-10750H, 15.60", 2.3 kg
External Review » Asus ROG Strix G15 G512LI
Acer Nitro 5 AN515-55-751H: Intel Core i7-10750H, 15.60", 2.3 kg
External Review » Acer Nitro 5 AN515-55-751H
Lenovo Legion 5 15ARH05-82B5007CMH: AMD Ryzen 7 4800H, 15.60", 2.3 kg
External Review » Lenovo Legion 5 15ARH05-82B5007CMH
Lenovo Legion 5 15ARH05-82B500C5GE: AMD Ryzen 5 4600H, 15.60", 2.3 kg
External Review » Lenovo Legion 5 15ARH05-82B500C5GE
Lenovo Legion 5i: Intel Core i7-10750H, 15.60", 2.3 kg
External Review » Lenovo Legion 5i
Dell XPS 15 9500-BNX9508: unknown, 15.60", 2 kg
External Review » Dell XPS 15 9500-BNX9508
Acer Aspire Nitro 5 AN515-44: AMD Ryzen 7 4800H, 15.60", 2.4 kg
External Review » Acer Aspire Nitro 5 AN515-44
Asus Zephyrus G14 GA401II-HE046T: AMD Ryzen 7 4800HS, 14.00", 1.6 kg
External Review » Asus Zephyrus G14 GA401II-HE046T
Lenovo IdeaPad Gaming 3i 15IMH05-81Y400F6GE: Intel Core i7-10750H, 15.60", 2.2 kg
External Review » Lenovo IdeaPad Gaming 3i 15IMH05-81Y400F6GE
MSI GL75 10SCSR-003XPL: Intel Core i5-10300H, 17.30", 2.5 kg
External Review » MSI GL75 10SCSR-003XPL
Asus TUF Gaming A15 FA506II-BQ018: AMD Ryzen 5 4600H, 15.60", 2.3 kg
External Review » Asus TUF Gaming A15 FA506II-BQ018
Asus TUF Gaming F15 FX506II-R75TB6B: AMD Ryzen 7 4800H, 15.60", 2.3 kg
External Review » Asus TUF Gaming A15 FX506II-R75TB6B
Asus TUF Gaming A15 FA506II-BQ027T: AMD Ryzen 7 4800H, 15.60", 2.3 kg
External Review » Asus TUF Gaming A15 FA506II-BQ027T
Asus TUF Gaming A15 FA506II-HN188: AMD Ryzen 5 4600H, 15.60", 2.3 kg
External Review » Asus TUF A15 FA506II-HN188
Acer Nitro 5 AN515-55-52DV: Intel Core i5-10300H, 15.60", 2.3 kg
External Review » Acer Nitro 5 AN515-55-52DV
Dell XPS 15 9500 Core i7 4K UHD: Intel Core i7-10875H, 15.60", 2 kg
External Review » Dell XPS 15 9500 Core i7 4K UHD
Asus TUF Gaming A17 FA706II-H7356: AMD Ryzen 7 4800H, 17.30", 2.6 kg
External Review » Asus TUF Gaming A17 FA706II-H7356
Asus Zephyrus G14 GA401II-025T: AMD Ryzen 5 4600HS, 14.00", 1.6 kg
External Review » Asus Zephyrus G14 GA401II-025T
Asus TUF Gaming A17 FA706II-AU077T: AMD Ryzen 7 4800H, 17.30", 2.6 kg
External Review » Asus TUF Gaming A17 FA706II-AU077T
Dell Inspiron 15 7590-92P5C: Intel Core i7-9750H, 15.60", 1.8 kg
External Review » Dell Inspiron 15 7590-92P5C
Schenker XMG Core 17 Comet Lake: Intel Core i7-10750H, 17.30", 2.5 kg
» The Schenker XMG Core 17 (2020) offers three video outputs and space for two SSDs
Asus VivoBook 15 K571LI-PB71: Intel Core i7-10750H, 15.60", 2.1 kg
» Avoid these subpar Panda LM156LF IPS displays when buying your next gaming laptop
HP Pavilion Gaming 16-a0242ng: Intel Core i5-10300H, 16.10", 2.2 kg
» Low-priced HP Pavilion Gaming 16 laptop with a 16.1-inch display and GeForce graphics
Asus ROG Strix G15 G512LI: Intel Core i7-10750H, 15.60", 2.3 kg
» Nvidia GeForce mobile options are ballooning out of control. Skip the GeForce GTX 1650 Ti and go for the superior GTX 1660 Ti instead
Acer Nitro 5 AN515-44-R5FT: AMD Ryzen 5 4600H, 15.60", 2.2 kg
» Long Battery Life and Exciting Hardware: Acer Nitro 5 AN515-44
Dell XPS 15 9500 Core i7 4K UHD: Intel Core i7-10875H, 15.60", 2 kg
» $1300 Dell XPS 15 9500 vs. $2300 XPS 15 9500: Here is everything the higher-end option will get you