Notebook reviews with NVIDIA GeForce RTX 4080 Laptop GPU graphics card
Acer Predator Helios 16 (PH16-72) gaming laptop review: A predator with sharp teeth and quiet paws
High-end hardware, a brilliant mini LED display and efficient cooling make the Acer Predator Helios 16 a real gaming dream. In reality, the predator among gaming laptops is actually quiet. Nevertheless, our review reveals that the laptop's many advantages go hand in hand with some compromises.
Intel Core i9-14900HX, NVIDIA GeForce RTX 4080 Laptop GPU, 16", 2.7 kgXMG Neo 17 E24 review - Fast gaming laptop with optional water cooling
With the XMG Neo 17, you get a thoroughbred gamer that can be equipped with the fastest components on the market. A mechanical Cherry keyboard and an external water cooling system are also available as options, which not only reduces the temperatures but also the background noise.
Intel Core i9-14900HX, NVIDIA GeForce RTX 4080 Laptop GPU, 17", 2.9 kgMSI Raider 18 HX A14V review: Titan performance without the Titan price
The new Raider 18 drops many of the "unnecessary" features of the Titan 18 while keeping the same high-end CPU, GPU, and display options available. It therefore offers the same gaming and visual experience but for much cheaper prices to be an easier recommendation even for enthusiasts.
Intel Core i9-14900HX, NVIDIA GeForce RTX 4080 Laptop GPU, 18", 3.6 kgAlienware x16 R2 laptop review: A step sideways from the x16 R1
The latest Alienware x16 R2 gets a new integrated NPU for Windows AI acceleration, but it unfortunately comes at the cost of gaming performance. Users may still want to consider the 2023 Alienware x16 R1 for this reason.
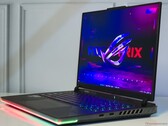
Intel Core Ultra 9 185H, NVIDIA GeForce RTX 4080 Laptop GPU, 16", 2.7 kgAsus ROG Strix Scar 16 (2024) Laptop Review: Fiery performance and mini LED brilliance with a price to match
The Asus ROG Strix Scar 16 (2024) is an iterative upgrade over last year's model, now featuring the Core i9-14900HX and a 175 W RTX 4080 Laptop GPU. The Scar 16 continues to uphold Asus's peak gaming performance tradition. However, it comes with a few caveats and faces an equally performant competition that vie for your hard-earned cash.
Intel Core i9-14900HX, NVIDIA GeForce RTX 4080 Laptop GPU, 16", 2.7 kgLenovo Legion Pro 7 16IRX9H: Intel Core i9-14900HX, 16.00", 2.7 kg
Review » Lenovo Legion Pro 7 16 (2024) review: Cream of the crop amongst RTX 4080 laptops
HP Omen 16 (2024): Intel Core i9-14900HX, 16.10", 2.4 kg
Review » HP Omen 16 (2024) review: QHD gaming notebook with Core i9 and RTX 4080 for €3,200
MSI Vector 16 HX A14V: Intel Core i9-14900HX, 16.00", 2.7 kg
Review » MSI Vector 16 HX laptop review: Titan performance without the Titan price
Lenovo ThinkPad P1 G6 21FV001KUS: Intel Core i7-13800H, 16.00", 1.9 kg
Review » Lenovo ThinkPad P1 G6 review: 80 W GeForce RTX 4080 for ultrathin workstation
Asus Zenbook Pro 16X UX7602BZ-MY005W: Intel Core i9-13905H, 16.00", 2.4 kg
Review » Zenbook Pro 16X (2023) review: Maximum power from the Asus flagship at last
Acer Predator Helios 18 N23Q2: Intel Core i9-13900HX, 18.00", 3.2 kg
Review » Acer Predator Helios 18 laptop review: RTX 4080 gamer with MiniLED display at over 1,000 nits
Alienware m16 R1 AMD: AMD Ryzen 9 7845HX, 16.00", 3.1 kg
Review » AMD Ryzen 9 7845HX performance debut: Alienware m16 R1 laptop review
HP Omen 16-wf000: Intel Core i7-13700HX, 16.10", 2.4 kg
Review » HP Omen 16 2023 laptop review: 145 W GeForce RTX 4080 performance
Alienware x16 R1: Intel Core i9-13900HK, 16.00", 2.6 kg
Review » Intel Core i9-13900HK performance debut: Alienware x16 R1 laptop review
MSI Stealth 17 Studio A13VH-014: Intel Core i9-13900H, 17.30", 3 kg
Review » MSI Stealth 17 Studio review: A laptop with a quiet RTX 4080 for almost every occasion
HP Omen 17-ck2097ng: Intel Core i9-13900HX, 17.30", 2.8 kg
Review » HP Omen 17 (2023) review: Gaming laptop uses RTX 4080
MSI GE78HX 13VH-070US: Intel Core i9-13950HX, 17.00", 3 kg
Review » MSI Raider GE78 HX 13VH laptop review: 13th gen Core i9-13950HX and GeForce RTX 4080 upgrades
Asus ROG Strix G16 G614JZ: Intel Core i9-13980HX, 16.00", 2.4 kg
Review » Asus ROG Strix G16 G614JZ laptop review: Clear the stage for the RTX 4080
Lenovo Legion Pro 7 16IRX8H: Intel Core i9-13900HX, 16.00", 2.7 kg
Review » Lenovo Legion Pro 7 16IRX8H Review: High-end RTX 4080 performance powerhouse
Razer Blade 16 Early 2023: Intel Core i9-13950HX, 16.00", 2.4 kg
Review » Nvidia Ada RTX 40 Laptop GPU analysis: 175 W RTX 4090 Laptop GPU surpasses a 350 W RTX 3090 in performance and power efficiency
Review » Mobile GeForce RTX 4080 debut: Razer Blade 16 Early 2023 laptop review
MSI Stealth 18 AI Studio A1VHG: Intel Core Ultra 9 185H, 18.00", 2.9 kg
External Review » MSI Stealth 18 AI Studio A1VHG
Asus ROG Strix G18 G814JZR: Intel Core i9-14900HX, 18.00", 3 kg
External Review » Asus ROG Strix G18 G814JZR
Aorus 17X AXG: Intel Core i9-14900HX, 17.30", 2.8 kg
External Review » Aorus 17X AXG
MSI Vector 17 HX A13VHG: Intel Core i9-13980HX, 17.00", 3 kg
External Review » MSI Vector 17 HX A13VHG
MSI Raider 18 HX A14V: Intel Core i9-14900HX, 18.00", 3.6 kg
External Review » MSI Raider 18 HX A14V
Acer Predator Helios 18 PH18-72: Intel Core i9-14900HX, 18.00", 3.3 kg
External Review » Acer Predator Helios 18 PH18-72
MSI Vector 16 HX A14V: Intel Core i9-14900HX, 16.00", 2.7 kg
External Review » MSI Vector 16 HX A14V
MSI Stealth 18 A1VHG: Intel Core Ultra 9 185H, 18.40", 2.8 kg
External Review » MSI Stealth 18 A1VHG
Acer Predator Helios 16 PH16-72: Intel Core i9-14900HX, 16.00", 2.7 kg
External Review » Acer Predator Helios 16 PH16-72
Alienware x16 R2 P120F: Intel Core Ultra 9 185H, 16.00", 2.7 kg
External Review » Alienware x16 R2 P120F
MSI Raider GE78 HX 14VHG: Intel Core i9-14900HX, 17.30", 3.1 kg
External Review » MSI Raider GE78 HX 14VHG
MSI Raider GE68 HX 14VHG: Intel Core i9-14900HX, 17.30", 3.1 kg
External Review » MSI Raider GE68 HX 14VHG
Alienware x16 R2: Intel Core Ultra 9 185H, 16.00", 2.7 kg
External Review » Alienware x16 R2
MSI Stealth 16 AI Studio A1VHG: Intel Core Ultra 9 185H, 16.00", 2 kg
External Review » MSI Stealth 16 AI Studio A1VHG
MSI Vector 16 HX A13VHG: Intel Core i9-13980HX, 15.60", 2.7 kg
External Review » MSI Vector 16 HX A13VHG
Asus ROG Strix Scar 16 G634JYR, RTX 4080: Intel Core i9-14900HX, 16.00", 2.7 kg
External Review » Asus ROG Strix Scar 16 G634JYR, RTX 4080
HP Omen 16 (2024): Intel Core i9-14900HX, 16.10", 2.4 kg
External Review » HP Omen 16 (2024)
Asus ROG Zephyrus G16 GU605MZ: Intel Core Ultra 9 185H, 16.00", 2 kg
External Review » Asus ROG Zephyrus G16 GU605MZ
Lenovo Legion Pro 7 16IRX9H: Intel Core i9-14900HX, 16.00", 2.7 kg
External Review » Lenovo Legion Pro 7 16IRX9H
MSI Vector GP68 HX 13VH: Intel Core i9-13950HX, 16.00", 2.7 kg
External Review » MSI Vector GP68 HX 13VH
Lenovo Legion 9 16IRX8, RTX 4080: Intel Core i9-13980HX, 16.00", 2.6 kg
External Review » Lenovo Legion 9 16IRX8, RTX 4080
MSI Vector GP68 HX 12VH: Intel Core i9-12900HX, 16.00", 2.7 kg
External Review » MSI Vector GP68 HX 12VH
Asus ROG Zephyrus Duo 16 GX650PZ: AMD Ryzen 9 7945HX, 16.00", 2.7 kg
External Review » Asus ROG Zephyrus Duo 16 GX650PZ
Asus ZenBook Pro 16X OLED UX7602: Intel Core i9-13905H, 16.00", 2.2 kg
External Review » Asus ZenBook Pro 16X OLED UX7602
Acer Predator Helios 3D 15 SpatialLabs Edition: Intel Core i9-13900HX, 15.60", 3 kg
External Review » Acer Predator Helios 3D 15 SpatialLabs Edition
Lenovo ThinkPad P1 G6, i7-13800H RTX 4080: Intel Core i7-13800H, 16.00", 1.8 kg
External Review » Lenovo ThinkPad P1 G6, i7-13800H RTX 4080
MSI Vector GP78 HX 13VH: Intel Core i9-13980HX, 17.00", 3 kg
External Review » MSI Vector GP78 HX 13VH
Asus ZenBook Pro 16X OLED UX7602BZ: Intel Core i9-13900H, 16.00", 2.2 kg
External Review » Asus ZenBook Pro 16X OLED UX7602BZ
Alienware m16 R1 AMD: AMD Ryzen 9 7845HX, 16.00", 3.1 kg
External Review » Alienware m16 R1 AMD
Asus ROG Zephyrus G14 GA402XZ: AMD Ryzen 9 7940HS, 14.00", 1.7 kg
External Review » Asus ROG Zephyrus G14 GA402XZ
HP Omen 16-wf000: Intel Core i7-13700HX, 16.10", 2.4 kg
External Review » HP Omen 16-wf000
Asus ROG Strix Scar 18 G834JZ: Intel Core i9-13980HX, 18.00", 3.1 kg
External Review » Asus ROG Strix Scar 18 G834JZ
Asus ROG Strix G16 G614JZ: Intel Core i9-13980HX, 16.00", 2.4 kg
External Review » Asus ROG Strix G16 G614JZ
Acer Predator Triton 14 PT14-51, i7-13700H RTX 4080: Intel Core i7-13700H, 14.00", 1.7 kg
External Review » Acer Predator Triton 14 PT14-51, i7-13700H RTX 4080
HP Omen 17-ck2940nz: Intel Core i9-13900HX, 17.30", 2.8 kg
External Review » HP Omen 17-ck2940nz
Lenovo Legion Pro 7 16IRX8H, i7-13700HX RTX 4080: Intel Core i7-13700HX, 16.00", 2.8 kg
External Review » Lenovo Legion Pro 7 16IRX8H, i7-13700H RTX 4080
HP Omen 17-ck2000: Intel Core i7-13700HX, 17.30", 2.8 kg
External Review » HP Omen 17-ck2000
Asus ROG Zephyrus M16 GU604VZ: Intel Core i9-13900H, 16.00", 2.3 kg
External Review » Asus ROG Zephyrus M16 GU604VZ
HP Omen 17-ck2004TX: Intel Core i9-13900HX, 17.30", 2.8 kg
External Review » HP Omen 17-ck2004TX
Alienware x16 R1: Intel Core i9-13900HK, 16.00", 2.6 kg
External Review » Alienware x16 R1
MSI GE78 HX 13VH: Intel Core i7-13700HX, 17.30", 3.1 kg
External Review » MSI GE78 HX 13VH
Asus ROG Strix Scar 17 G733PZ: AMD Ryzen 9 7945HX, 17.30", 3 kg
External Review » Asus ROG Strix Scar 17 G733PZ
HP Omen 17-ck2097ng: Intel Core i9-13900HX, 17.30", 2.8 kg
External Review » HP Omen 17-ck2097ng
Alienware m16 R1: Intel Core i9-13900HX, 16.00", 3.3 kg
External Review » Alienware m16 R1
Asus ROG Strix Scar 16 G634JZ: Intel Core i9-13980HX, 16.00", 2.5 kg
External Review » Asus ROG Strix Scar 16 G634JZ
MSI Stealth 17 Studio A13VH-053US: Intel Core i9-13900H, 17.30", 2.8 kg
External Review » MSI Stealth 17 Studio A13VH-053US
Alienware x16 R1, i9-13900HK RTX 4080: Intel Core i9-13900HK, 16.00", 2.7 kg
External Review » Alienware x16 R1, i9-13900HK RTX 4080
MSI GE78HX 13VH-070US: Intel Core i9-13950HX, 17.00", 3 kg
External Review » MSI GE78HX 13VH-070US
Lenovo Legion Pro 7 16IRX8H: Intel Core i9-13900HX, 16.00", 2.7 kg
External Review » Lenovo Legion Pro 7 16IRX8H
Razer Blade 18 2023, RTX 4080: Intel Core i9-13950HX, 18.00", 3.2 kg
External Review » Razer Blade 18 2023, RTX 4080
Acer Predator Helios 16 2023 PH16-71-9705: Intel Core i9-13900HX, 16.00", 2.7 kg
External Review » Acer Predator Helios 16 2023 PH16-71-9705
Acer Predator Helios 18 2023 PH18-71-91U5: Intel Core i9-13900HX, 18.00", 3.3 kg
External Review » Acer Predator Helios 18 2023 PH18-71-91U5
Aorus 17H BXF: Intel Core i7-13700H, 17.30", 2.7 kg
External Review » Aorus 17H BXF
Razer Blade 16 Early 2023: Intel Core i9-13950HX, 16.00", 2.4 kg
External Review » Razer Blade 16 Early 2023
Lenovo ThinkPad P1 G6 21FV001KUS: Intel Core i7-13800H, 16.00", 1.9 kg
» RTX 4080-powered Lenovo ThinkPad P1 Gen 6 with 4K OLED and 64GB DDR5 gets another price cut
» 4K OLED, up to 64GB RAM and RTX 4080: Lenovo ThinkPad P1 and P16s get steep discounts
Lenovo Legion Pro 7 16IRX8H: Intel Core i9-13900HX, 16.00", 2.7 kg
» "Certified-Refurbished" Lenovo Legion Pro 7 laptop with RTX 4080 and two-year warranty enjoys 39% discount vs list price
Lenovo Legion Pro 7 16IRX9H: Intel Core i9-14900HX, 16.00", 2.7 kg
» "Certified-Refurbished" Lenovo Legion Pro 7 laptop with RTX 4080 and two-year warranty enjoys 39% discount vs list price
Alienware m16 R1 AMD: AMD Ryzen 9 7845HX, 16.00", 3.1 kg
» Outstanding Alienware m16 R2 RTX 4070 gaming laptop is now up to 32% cheaper than list price
Lenovo Legion Pro 7 16IRX9H: Intel Core i9-14900HX, 16.00", 2.7 kg
» Lenovo Legion Pro 7i Gen 9 with RTX 4080 and Core i9-14900HX gets biggest discount yet
Asus ROG Zephyrus M16 GU604VZ: Intel Core i9-13900H, 16.00", 2.3 kg
» RTX 4080-equipped Asus ROG Zephyrus M16 with 240Hz Mini-LED display hits lowest price ever
Asus ROG Zephyrus G16 GU605MZ: Intel Core Ultra 9 185H, 16.00", 2 kg
» RTX 4080-powered Asus ROG Zephyrus G16 with excellent OLED display hits cheapest price point yet
Lenovo Legion Pro 7 16IRX9H: Intel Core i9-14900HX, 16.00", 2.7 kg
» Lenovo Legion Pro 7i Gen 9 with RTX 4080 receives notable discount
MSI Raider GE78 HX 14VHG: Intel Core i9-14900HX, 17.30", 3.1 kg
» Powerful RTX 4080 gaming laptop with Core i9 and 32GB DDR5 now discounted by $500
Lenovo Legion Pro 7 16IRX9H: Intel Core i9-14900HX, 16.00", 2.7 kg
» RTX 4090-powered Lenovo Legion Pro 7 Gen 9 receives big 24% price cut
Asus ROG Zephyrus G16 GU605MZ: Intel Core Ultra 9 185H, 16.00", 2 kg
» Asus ROG Zephyrus G16 gaming notebook with 240Hz OLED and RTX 4080 gets biggest price cut thus far
Lenovo Legion Pro 7 16IRX9H: Intel Core i9-14900HX, 16.00", 2.7 kg
» RTX 4080-powered Lenovo Legion Pro 7i gaming laptop with Core i9 is 35% off right now
Alienware x16 R2 P120F: Intel Core Ultra 9 185H, 16.00", 2.7 kg
» Alienware x16 R2 gaming laptop with RTX 4090, Core Ultra 9, 32GB RAM and 2TB SSD gets stunning 37% price cut
Alienware m16 R1 AMD: AMD Ryzen 9 7845HX, 16.00", 3.1 kg
» RTX 4080-equipped Alienware m16 gaming laptop with 32GB RAM and Ryzen 9 is 30% off today
Alienware m16 R1: Intel Core i9-13900HX, 16.00", 3.3 kg
» Alienware m16 R1 with RTX 4080 and Core i9 now discounted by $700
Alienware m16 R1 AMD: AMD Ryzen 9 7845HX, 16.00", 3.1 kg
» RTX 4080-powered Alienware m16 gaming laptop with Ryzen 9 and 32GB DDR5 drops back to lowest price ever
Lenovo Legion Pro 7 16IRX9H: Intel Core i9-14900HX, 16.00", 2.7 kg
» Lenovo Legion Pro 7i gaming laptop with RTX 4090, Core i9-14900HX, 32GB RAM and 2TB SSD gets $972 discount
Alienware x16 R1: Intel Core i9-13900HK, 16.00", 2.6 kg
» Alienware x16 gaming laptop with Core i9, RTX 4080, 32GB RAM and 2TB SSD gets 43% discount
Alienware m16 R1 AMD: AMD Ryzen 9 7845HX, 16.00", 3.1 kg
» Tempting Alienware m16 gaming laptop with RTX 4080, Ryzen 9 and 32GB RAM is $1,000 off today
Lenovo Legion Pro 7 16IRX9H: Intel Core i9-14900HX, 16.00", 2.7 kg
» Lenovo makes the most of the RTX 4080 in the Legion Pro 7 16
HP Omen 16 (2024): Intel Core i9-14900HX, 16.10", 2.4 kg
» HP Omen 16 (2024): Core i9, RTX 4080, Thunderbolt 4
Lenovo Legion Pro 7 16IRX8H: Intel Core i9-13900HX, 16.00", 2.7 kg
» Lenovo Legion Pro 7 with RTX 4080 and Core i9 marked down by $730 in enticing gaming laptop sale
HP Omen 17-ck2097ng: Intel Core i9-13900HX, 17.30", 2.8 kg
» Maxed-out HP Omen 17 with RTX 4090, Core i9, 32GB RAM and 2TB SSD gets $720 discount
Alienware x16 R1: Intel Core i9-13900HK, 16.00", 2.6 kg
» Brutally fast Alienware x16 gaming laptop with RTX 4080, 32GB RAM and Core i9 hits record-low price
HP Omen 16-wf000: Intel Core i7-13700HX, 16.10", 2.4 kg
» HP OMEN 16 2023 price drops again to 120-day low at Best Buy for Ryzen 9 7940HS and RTX 4070 SKU
HP Omen 17-ck2097ng: Intel Core i9-13900HX, 17.30", 2.8 kg
» HP OMEN 16 2023 price drops again to 120-day low at Best Buy for Ryzen 9 7940HS and RTX 4070 SKU
HP Omen 17-ck2000: Intel Core i7-13700HX, 17.30", 2.8 kg
» HP Omen 17 gaming laptop with RTX 4080, Core i7-13700HX and 240Hz QHD display now 34% off
Alienware m16 R1 AMD: AMD Ryzen 9 7845HX, 16.00", 3.1 kg
» Beastly Alienware m16 gaming laptop with RTX 4080, AMD Ryzen 9 7845HX and 240Hz QHD display discounted by 28%
Asus Zenbook Pro 16X UX7602BZ-MY005W: Intel Core i9-13905H, 16.00", 2.4 kg
» Significantly stronger than its predecessor: New Asus Zenbook Pro 16X is at gaming laptop performance level
Acer Predator Helios 18 N23Q2: Intel Core i9-13900HX, 18.00", 3.2 kg
» Acer Predator Helios 18 reviewed: Desktop replacement with 1,000 nits display and RTX 4080
Alienware x16 R1: Intel Core i9-13900HK, 16.00", 2.6 kg
» Alienware x16 offers 175 W TGP graphics while being thinner than even the Razer Blade 16, but there are some caveats
Lenovo Legion Pro 7 16IRX8H: Intel Core i9-13900HX, 16.00", 2.7 kg
» Maxed-out 2023 Lenovo Legion Pro 7 gaming laptop with RTX 4090 and Core i9-13900HX gets 13% discount
Asus ROG Strix G16 G614JZ: Intel Core i9-13980HX, 16.00", 2.4 kg
» RTX 4060-powered Asus ROG Strix G16 (2023) gets first discount in Amazon's gaming laptop sale
HP Omen 17-ck2097ng: Intel Core i9-13900HX, 17.30", 2.8 kg
» 2023 HP Omen 17 gaming laptop with RTX 4080 and Core i7-13700HX gets notable discount in Easter sale
» HP Omen 17 (2023): QHD gaming laptop with RTX 4080 allows CPU undervolting
MSI GE78HX 13VH-070US: Intel Core i9-13950HX, 17.00", 3 kg
» MSI Raider GE78 HX now available to be one of the first laptops with PCIe5 SSD support for read rates of over 15 GB/s
Asus ROG Strix G16 G614JZ: Intel Core i9-13980HX, 16.00", 2.4 kg
» Finally, quiet gaming with the Asus ROG Strix G16
Razer Blade 16 Early 2023: Intel Core i9-13950HX, 16.00", 2.4 kg
» The mobile GeForce RTX 4080 is 35 percent slower than the desktop RTX 4080 and that can be problematic for consumers