AMD Radeon 680M
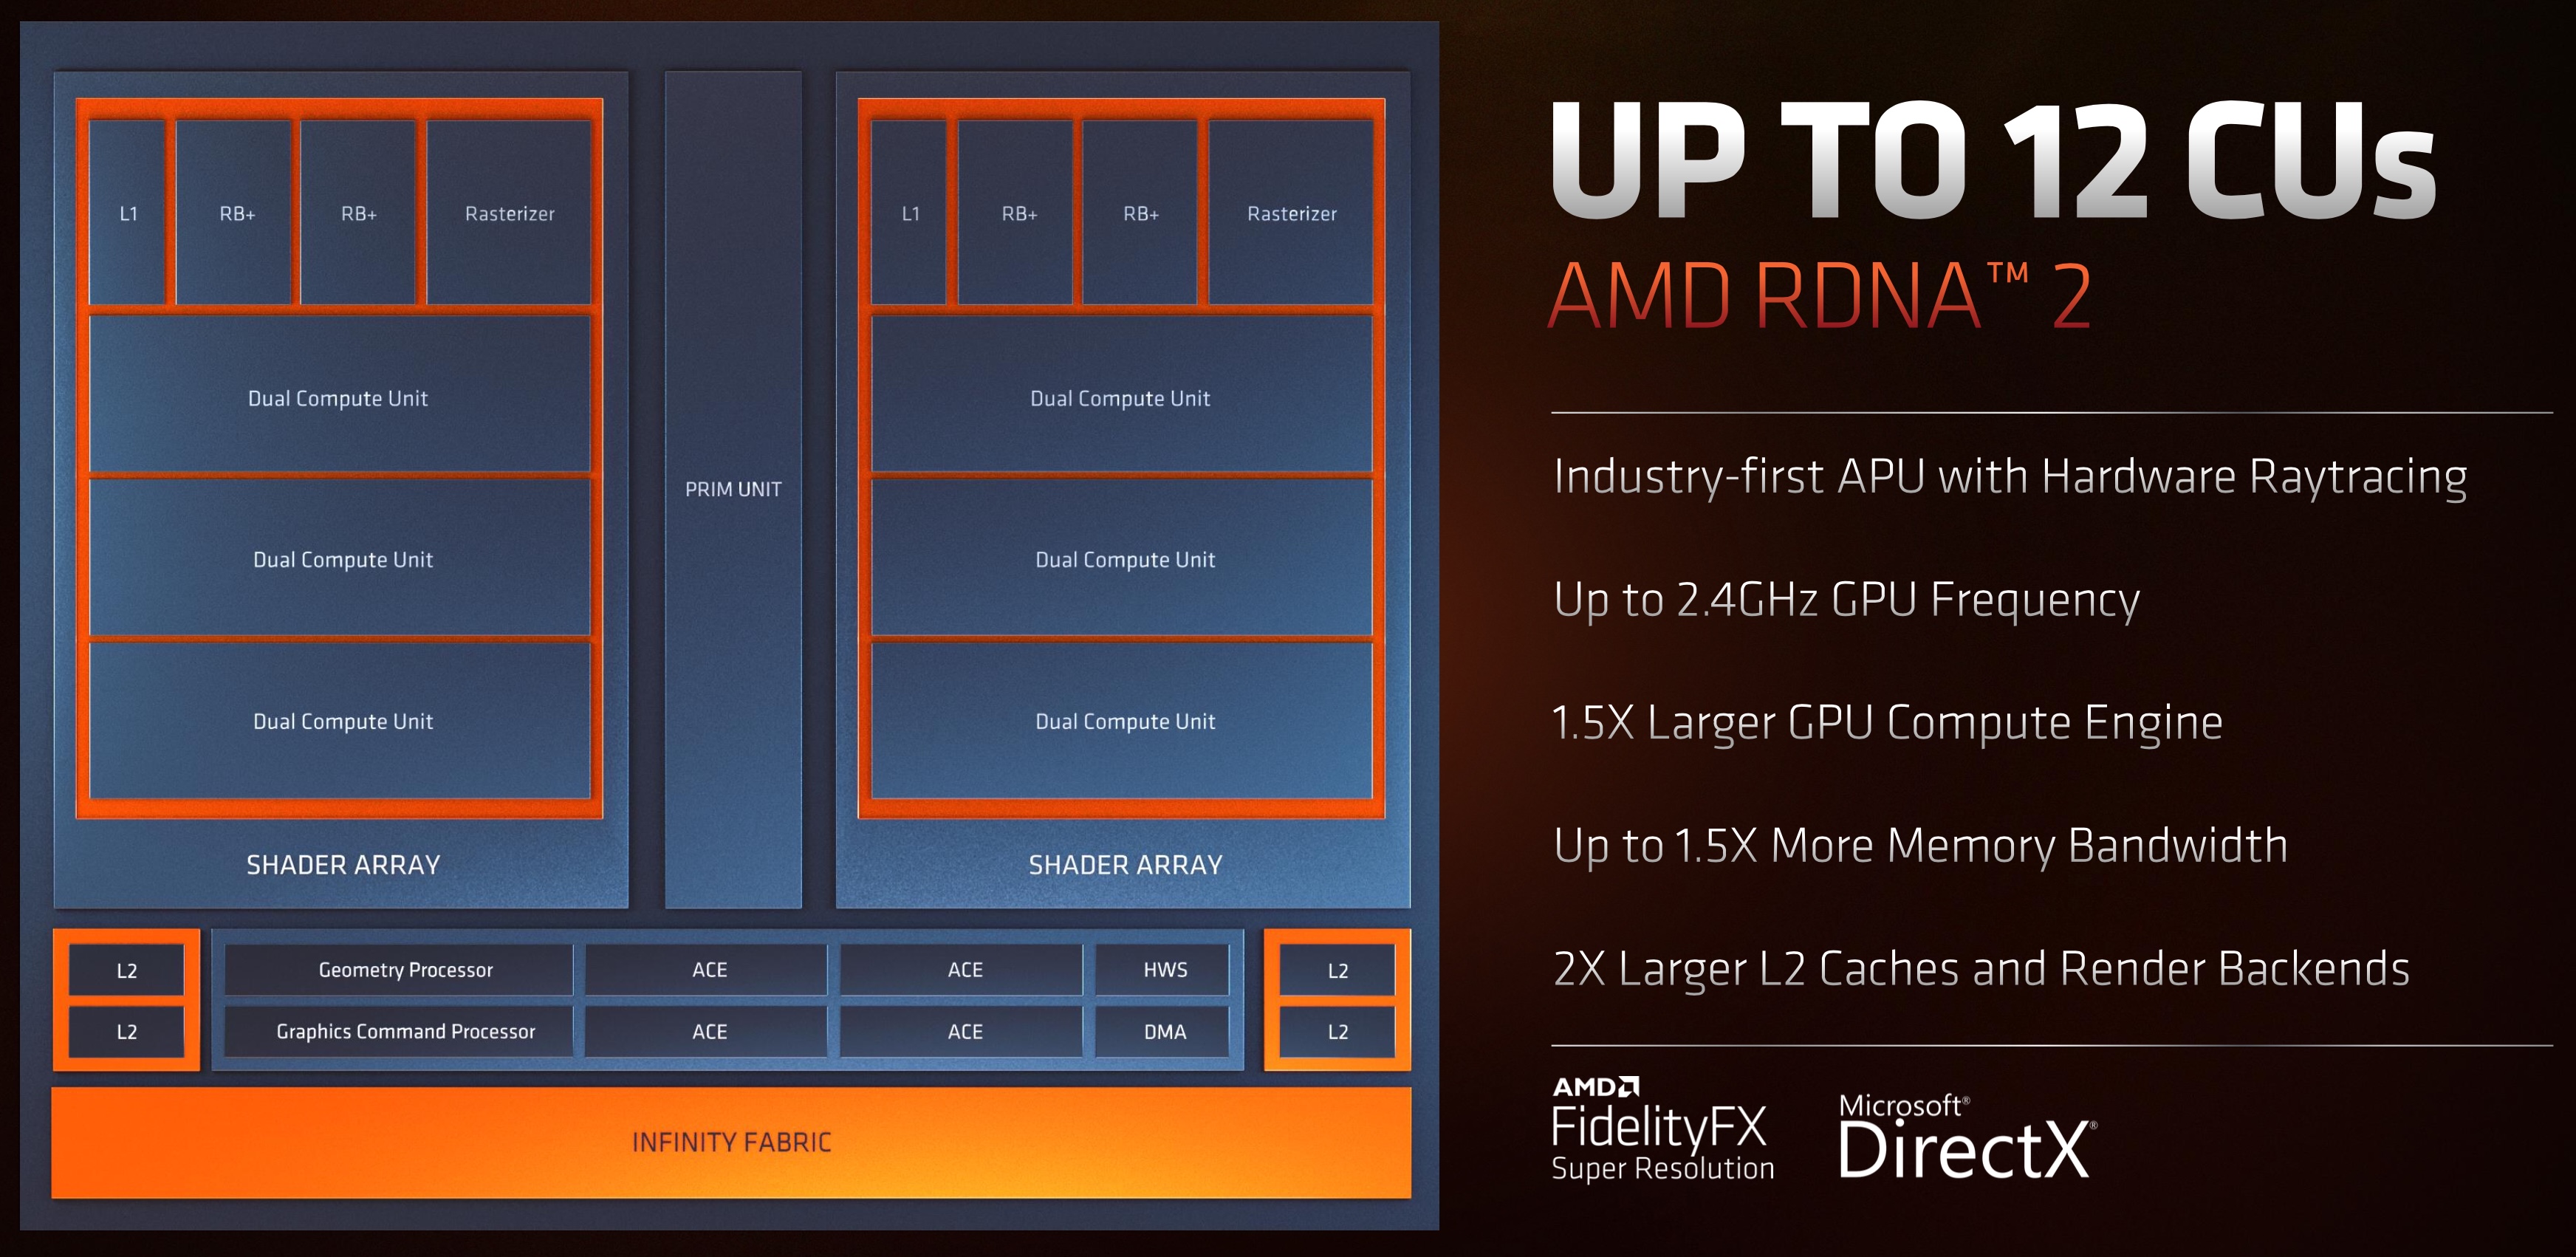
The AMD Radeon 680M is an integrated GPU in the Ryzen 6000 series for laptops (Rembrandt, e.g. Ryzen 9 6980HX ). The iGPU is based on the RDNA2 architecture and has 12 CUs (= 768 shaders) clocked at up to 2,400 MHz (depending on the CPU model). The 680M and 660M iGPUs are the first integrated graphics card with hardware raytracing support, although the performance is too slow to use it in current games.
Thanks to the new architecture, high core count and the increased maximum core clock, the Radeon 680M should be clearly faster then the old Radeon Vega 8 iGPUs . Therefore, the 680M should be the fastest integrated graphics card in early 2022. Compared to the dedicated Radeon 5300M (also RDNA), the 680M should still be significantly slower. According to AMD, the Radeon 680M (in the 6800U) is faster than a dedicated Nvidia GeForce MX450 and best suited for 1080p gaming and low details (for AAA games).
Thanks to the modern 6nm process and clever power-saving features, the power consumption is comparatively low (according to AMD), so the graphics card can also be used for slim and light notebooks (depending on the CPU model). The whole Ryzen 6000 chip can be configured down to 15W.
AMD Radeon 600M Series Codename RDNA 2 Rembrandt Architecture RDNA 2 Pipelines 768 - unified Core Speed 2400 (Boost) MHz Shared Memory no API DirectX 12_1 Power Consumption 45 Watt technology 6 nm Features Tiled Rasterization, Shared Memory (up to Dual-Channel DDR4-3200) Date of Announcement 04.01.2022
CPU in Radeon 680M GPU Base Speed GPU Boost / Turbo AMD Ryzen 9 6980HX 8 x 3300 MHz, 45 W ? MHz 2400 MHz AMD Ryzen 9 PRO 6950H 8 x 3300 MHz, 45 W ? MHz 2400 MHz AMD Ryzen 9 6900HX 8 x 3300 MHz, 45 W ? MHz 2400 MHz » show 14 more AMD Ryzen 9 6980HS 8 x 3300 MHz, 35 W ? MHz 2400 MHz AMD Ryzen 9 6900HS 8 x 3300 MHz, 35 W ? MHz 2400 MHz AMD Ryzen 9 PRO 6950HS 8 x 3300 MHz, 35 W ? MHz 2400 MHz AMD Ryzen 7 6800H 8 x 3200 MHz, 45 W ? MHz 2200 MHz AMD Ryzen 7 PRO 6850H 8 x 3200 MHz, 45 W ? MHz 2200 MHz AMD Ryzen 7 7735HS 8 x 3200 MHz, 35 W ? MHz 2200 MHz AMD Ryzen 7 7735H 8 x 3200 MHz, 35 W ? MHz 2200 MHz AMD Ryzen 7 PRO 6850HS 8 x 3200 MHz, 35 W ? MHz 2200 MHz AMD Ryzen 7 6800HS 8 x 3200 MHz, 35 W ? MHz 2200 MHz AMD Ryzen 7 7735U 8 x 2700 MHz, 28 W ? MHz 2200 MHz AMD Ryzen 7 PRO 6860Z 8 x 2700 MHz, 28 W ? MHz 2200 MHz AMD Ryzen 7 7736U 8 x 2700 MHz, 28 W ? MHz 2200 MHz AMD Ryzen 7 PRO 6850U 8 x 2700 MHz, 28 W ? MHz 2200 MHz AMD Ryzen 7 6800U 8 x 2700 MHz, 28 W ? MHz 2200 MHz min. - max. ? MHz 2200 - 2400 MHz
Benchmarks Performance Rating - 3DMark 11 + Fire Strike + Time Spy
3.1 pt (9%)
...
...
max:
3DMark - 3DMark Time Spy Score
min: 1546 avg: 2487 median: 2580 (7%) max: 2914 Points
...
...
max:
3DMark - 3DMark Time Spy Graphics
min: 1359 avg: 2221 median: 2303 (6%) max: 2607 Points
...
...
max:
3DMark - 3DMark Ice Storm Unlimited Graphics
min: 111130 avg: 329446 median: 353317 (40%) max: 419088 Points
...
...
max:
3DMark - 3DMark Ice Storm Extreme Graphics
min: 64259 avg: 149526 median: 141638 (18%) max: 199788 Points
...
...
max:
3DMark - 3DMark Cloud Gate Score
min: 21960 avg: 29814 median: 30929 (33%) max: 35309 Points
...
...
max:
3DMark - 3DMark Cloud Gate Graphics
min: 24634 avg: 40724 median: 43225 (11%) max: 50120 Points
...
...
max:
3DMark - 3DMark Fire Strike Standard Score
min: 3531 avg: 6087 median: 6287 (11%) max: 6993 Points
...
...
max:
3DMark - 3DMark Fire Strike Standard Graphics
min: 3791 avg: 6660 median: 6865 (8%) max: 7593 Points
...
...
max:
3DMark - 3DMark Ice Storm Graphics
min: 68280 avg: 204371 median: 201899 (24%) max: 310414 Points
...
...
max:
3DMark - 3DMark Wild Life Unlimited
min: 14403 avg: 15238 median: 15237.5 (8%) max: 16072 Points
...
...
max:
3DMark - 3DMark Wild Life Extreme Unlimited
min: 2476 avg: 3812 median: 3955 (5%) max: 4497 Points
...
...
max:
3DMark 11 - 3DM11 Performance Score
min: 6723 avg: 9922 median: 10326 (14%) max: 11523 Points
...
...
max:
3DMark 11 - 3DM11 Performance GPU
min: 6858 avg: 9979 median: 10371 (9%) max: 11605 Points
...
...
max:
3DMark Vantage + 3DMark Vantage - 3DM Vant. Perf. total
min: 17643 avg: 30993 median: 33169.5 (10%) max: 38288 Points
...
...
max:
3DM Vant. Perf. GPU no PhysX + 3DMark Vantage - 3DM Vant. Perf. GPU no PhysX
min: 14306 avg: 26762 median: 28741.5 (16%) max: 33030 Points
...
...
max:
3DMark 05 - 3DMark 05 - Standard
min: 11711 avg: 43450 median: 47928 (52%) max: 54628 Points
...
...
max:
3DMark 06 3DMark 06 - Standard 1366x768 +
25274 Points (33%)
...
max:
3DMark 06 - Standard 1280x1024 +
min: 13533 avg: 30360 median: 33479 (44%) max: 37587 Points
...
...
max:
Unigine Valley 1.0 - Unigine Valley 1.0 DX
min: 11.6 avg: 17.2 median: 18.8 (6%) max: 23.6 fps
...
...
max:
Blender - Blender 3.3 Classroom HIP *
min: 270 avg: 348.8 median: 333 (27%) max: 555 Seconds
...
SPECviewperf 12 + SPECviewperf 12 - specvp12 sw-03
min: 58.6 avg: 88.4 median: 88.8 (22%) max: 112 fps
...
...
max:
specvp12 snx-02 + SPECviewperf 12 - specvp12 snx-02
min: 37.5 avg: 53.7 median: 57.5 (8%) max: 65.6 fps
...
...
max:
specvp12 showcase-01 + SPECviewperf 12 - specvp12 showcase-01
min: 17.5 avg: 30.1 median: 30.7 (7%) max: 36.2 fps
...
...
max:
specvp12 mediacal-01 + SPECviewperf 12 - specvp12 mediacal-01
min: 15 avg: 31.8 median: 28 (7%) max: 51.3 fps
...
...
max:
specvp12 maya-04 + SPECviewperf 12 - specvp12 maya-04
min: 37.9 avg: 59.1 median: 61.6 (17%) max: 73.2 fps
...
...
max:
specvp12 energy-01 + SPECviewperf 12 - specvp12 energy-01
min: 3.14 avg: 32.6 median: 29.1 (26%) max: 80.4 fps
...
max:
specvp12 creo-01 + SPECviewperf 12 - specvp12 creo-01
min: 30.9 avg: 42.3 median: 43.8 (18%) max: 52.5 fps
...
...
max:
specvp12 catia-04 + SPECviewperf 12 - specvp12 catia-04
min: 48.7 avg: 65.8 median: 70.3 (12%) max: 83.3 fps
...
...
max:
specvp12 3dsmax-05 + SPECviewperf 12 - specvp12 3dsmax-05
min: 46.9 avg: 75.2 median: 77.7 (14%) max: 90.4 fps
...
...
max:
SPECviewperf 13 specvp13 sw-04 + SPECviewperf 13 - specvp13 sw-04
min: 63.1 avg: 91.1 median: 95 (25%) max: 107 fps
...
...
max:
specvp13 snx-03 + SPECviewperf 13 - specvp13 snx-03
min: 40.2 avg: 93.5 median: 107 (12%) max: 124 fps
...
...
max:
specvp13 showcase-02 + SPECviewperf 13 - specvp13 showcase-02
min: 17.4 avg: 29.7 median: 30.4 (7%) max: 37.5 fps
...
...
max:
specvp13 medical-02 + SPECviewperf 13 - specvp13 medical-02
min: 20.5 avg: 41.5 median: 41.2 (9%) max: 63.1 fps
...
...
max:
specvp13 maya-05 + SPECviewperf 13 - specvp13 maya-05
min: 58.3 avg: 90 median: 98.3 (11%) max: 112 fps
...
...
max:
specvp13 energy-02 + SPECviewperf 13 - specvp13 energy-02
min: 1.04 avg: 10.5 median: 11.4 (4%) max: 14.6 fps
...
...
specvp13 creo-02 + SPECviewperf 13 - specvp13 creo-02
min: 44.9 avg: 70.2 median: 76.8 (11%) max: 87.1 fps
...
...
max:
specvp13 catia-05 + SPECviewperf 13 - specvp13 catia-05
min: 73.9 avg: 97.4 median: 100 (11%) max: 118 fps
...
...
max:
specvp13 3dsmax-06 + SPECviewperf 13 - specvp13 3dsmax-06
min: 48.3 avg: 76.6 median: 81.7 (14%) max: 90.3 fps
...
...
max:
SPECviewperf 2020 specvp2020 solidworks-05 1080p + SPECviewperf 2020 - specvp2020 solidworks-05 1080p
min: 39.7 avg: 45.2 median: 45.2 (9%) max: 50.6 fps
...
specvp2020 snx-04 1080p + SPECviewperf 2020 - specvp2020 snx-04 1080p
min: 40.4 avg: 82.2 median: 82.2 (13%) max: 124 fps
...
...
max:
specvp2020 medical-03 1080p + SPECviewperf 2020 - specvp2020 medical-03 1080p
min: 15.4 avg: 15.5 median: 15.5 (16%) max: 15.6 fps
...
max:
specvp2020 maya-06 1080p + SPECviewperf 2020 - specvp2020 maya-06 1080p
min: 88.1 avg: 95.1 median: 95.1 (14%) max: 102 fps
...
...
max:
specvp2020 energy-03 1080p + SPECviewperf 2020 - specvp2020 energy-03 1080p
min: 0.85 avg: 3.8 median: 3.8 (3%) max: 6.72 fps
...
max:
specvp2020 creo-03 1080p + SPECviewperf 2020 - specvp2020 creo-03 1080p
min: 35.3 avg: 40.6 median: 40.6 (20%) max: 45.9 fps
...
max:
specvp2020 catia-06 1080p + SPECviewperf 2020 - specvp2020 catia-06 1080p
min: 18.9 avg: 20 median: 20 (13%) max: 21 fps
...
max:
specvp2020 3dsmax-07 1080p + SPECviewperf 2020 - specvp2020 3dsmax-07 1080p
min: 28.5 avg: 31.8 median: 31.8 (14%) max: 35 fps
...
max:
specvp2020 solidworks-05 4k + SPECviewperf 2020 - specvp2020 solidworks-05 4k
min: 11.6 avg: 16.9 median: 17.4 (5%) max: 21.2 fps
...
max:
specvp2020 snx-04 4k + SPECviewperf 2020 - specvp2020 snx-04 4k
min: 33 avg: 52 median: 54.7 (6%) max: 62.2 fps
...
...
max:
specvp2020 medical-03 4k + SPECviewperf 2020 - specvp2020 medical-03 4k
min: 3.73 avg: 7.7 median: 8.2 (8%) max: 12.1 fps
...
max:
specvp2020 maya-06 4k + SPECviewperf 2020 - specvp2020 maya-06 4k
min: 29.5 avg: 41.9 median: 41.5 (7%) max: 50.1 fps
...
max:
specvp2020 energy-03 4k + SPECviewperf 2020 - specvp2020 energy-03 4k
min: 4.77 avg: 10.1 median: 7.4 (2%) max: 19.4 fps
...
max:
specvp2020 creo-03 4k + SPECviewperf 2020 - specvp2020 creo-03 4k
min: 17.5 avg: 25.5 median: 28.9 (14%) max: 31.5 fps
...
max:
specvp2020 catia-06 4k + SPECviewperf 2020 - specvp2020 catia-06 4k
min: 13.1 avg: 18.4 median: 19 (12%) max: 21.6 fps
...
...
max:
specvp2020 3dsmax-07 4k + SPECviewperf 2020 - specvp2020 3dsmax-07 4k
min: 9.26 avg: 16.2 median: 17.5 (7%) max: 20.1 fps
...
max:
Cinebench R10 Cinebench R10 Shading (32bit) + Cinebench R10 - Cinebench R10 Shading (32bit)
min: 6573 avg: 14791 median: 15429 (11%) max: 17565 points
...
...
Cinebench R11.5 Cinebench R11.5 OpenGL 64 Bit + Cinebench R11.5 - Cinebench R11.5 OpenGL 64 Bit
min: 59.85 avg: 98.1 median: 109.4 (38%) max: 113.68 fps
...
...
max:
Cinebench R15 + Cinebench R15 - Cinebench R15 OpenGL 64 Bit
min: 72.39 avg: 137.1 median: 144.6 (8%) max: 186.07 fps
...
...
Cinebench R15 OpenGL Ref. Match 64 Bit + Cinebench R15 - Cinebench R15 OpenGL Ref. Match 64 Bit
min: 97.9 avg: 97.9 median: 97.9 (98%) max: 98 %
...
...
GFXBench - GFXBench 5.0 4K Aztec Ruins High Tier Offscreen
23.2 fps (9%)
...
GFXBench - GFXBench 5.0 Aztec Ruins High Tier Offscreen
min: 47.8 avg: 49.2 median: 49.2 (9%) max: 50.6 fps
...
...
GFXBench - GFXBench 5.0 Aztec Ruins Normal Tier Offscreen
min: 120 avg: 120.6 median: 120.6 (9%) max: 121.1 fps
...
...
GFXBench - GFXBench Car Chase Offscreen
min: 105.6 avg: 107.5 median: 107.5 (12%) max: 109.3 fps
...
...
Basemark GPU 1.2 - Basemark GPU 1.2 Vulkan Official Medium Offscreen 1080
min: 104.6 avg: 195.4 median: 227 (1%) max: 289 fps
...
...
max:
Basemark GPU 1.2 - Basemark GPU 1.2 Vulkan Official High Offscreen 2160
min: 3.64 avg: 9.7 median: 3.6 (1%) max: 24.1 fps
...
Geekbench 6.2 - Geekbench 6.2 GPU OpenCL
min: 14210 avg: 25456 median: 27408 (8%) max: 29288 points
...
...
max:
Geekbench 6.2 - Geekbench 6.2 GPU Vulkan
min: 18321 avg: 25717 median: 27145.5 (9%) max: 29819 points
...
...
max:
LuxMark v2.0 64Bit - LuxMark v2.0 Room GPU
min: 353 avg: 707 median: 602 (3%) max: 1958 Samples/s
...
...
max:
LuxMark v2.0 64Bit - LuxMark v2.0 Sala GPU
min: 766 avg: 1148 median: 1293 (2%) max: 1406 Samples/s
...
...
max:
ComputeMark v2.1 - ComputeMark v2.1 Result
min: 3439 avg: 5631 median: 5813 (6%) max: 7111 points
...
...
max:
Power Consumption - Furmark Stress Test Power Consumption - external Monitor *
min: 35 avg: 57 median: 57.3 (8%) max: 80.2 Watt
...
...
max:
0 5 10 15 20 25 30 35 40 45 50 55 60 65 70 75 80 85 90 95 Tooltip Minisforum Mercury Series EM680: Ø35 (31.3-38.7)
HP EliteBook 865 G9: Ø38.8 (37.9-42.6)
HP EliteBook 835 G9: Ø39.5 (38.6-40.9)
Asus Zenbook S 13 OLED: Ø41.5 (37.6-48)
Acer Swift Edge SFE16-42-R1GM: Ø42 (39.9-52.5)
Lenovo ThinkPad T14s G3 21CQ002LGE: Ø42.3 (38.4-48.8)
GPD Win 4: Ø45 (39.1-52.9)
Lenovo ThinkPad T14 G3-21CF004NGE: Ø45.4 (43.7-47.9)
ACEMagician Ace Magician AM08 Pro: Ø46.5 (39.7-57.5)
Lenovo Yoga 7-14ARB G7: Ø52.2 (45.4-59.5)
Lenovo ThinkPad P14s G3 AMD 21J6S05000: Ø52.9 (50.1-60.7)
Lenovo ThinkPad Z13 G1-21D20016GE: Ø53.5 (41.9-61.3)
Acemagic AM20: Ø55 (53.8-64.9)
Aokzoe A1: Ø56.8 (53.6-62.2)
Maxtang MTN-FP750: Ø57.3 (55.4-61)
Geekom AS 6, R9 6900HX: Ø59.2 (54.7-63.2)
Lenovo Yoga Pro 7 14ARP G8: Ø61.9 (59.7-65.7)
Beelink SER6 Pro: Ø62.6 (61.3-68.3)
GMK NucBox K2: Ø63.2 (61.9-71)
HP EliteBook 845 G9 6F6H6EA: Ø63.3 (47.4-66.5)
HP Dragonfly Pro 2023: Ø63.5 (60-65.7)
ACEMagician Ace Magician AM08 Pro: Ø63.7 (60-70)
Beelink SER6 Pro Ryzen 7 7735HS: Ø63.9 (62.7-67.8)
Asus VivoBook S15 M3502RA-L1029W: Ø70.2 (65.7-85.5)
Beelink GTR6: Ø70.7 (68-76.7)
Minisforum Venus Series UM690: Ø72.4 (64.2-86.5)
ACEMagician Ace Magician AM08 Pro: Ø74.6 (64.4-86.4)
Aoostar GOD77: Ø79.4 (65.5-90.1)
Morefine M600, 6900HX: Ø80.2 (74-97.8)
Power Consumption - The Witcher 3 Power Consumption - external Monitor *
min: 28.2 avg: 53.4 median: 53.5 (7%) max: 76.8 Watt
...
...
max:
0 5 10 15 20 25 30 35 40 45 50 55 60 65 70 75 80 85 Tooltip Minisforum Mercury Series EM680: Ø28.2 (27-30.2)
HP EliteBook 835 G9: Ø39 (36.8-41.9)
GPD Win 4: Ø39.1 (36.9-43.8)
Asus Zenbook S 13 OLED: Ø40 (38.6-44.9)
HP EliteBook 865 G9: Ø40.2 (36.2-41.4)
Lenovo ThinkPad T14s G3 21CQ002LGE: Ø40.6 (39.3-42.4)
ACEMagician Ace Magician AM08 Pro: Ø42.1 (38.1-47.3)
Acer Swift Edge SFE16-42-R1GM: Ø42.8 (41.2-45.6)
Lenovo ThinkPad T14 G3-21CF004NGE: Ø42.9 (41.8-46.2)
Lenovo Yoga 7-14ARB G7: Ø47.8 (42.6-53.4)
Lenovo ThinkPad Z13 G1-21D20016GE: Ø50.1 (41.3-57.3)
Lenovo ThinkPad P14s G3 AMD 21J6S05000: Ø50.1 (41.5-56.3)
Geekom AS 6, R9 6900HX: Ø51.7 (50-53.8)
Acemagic AM20: Ø53.5 (51.4-55.5)
Aokzoe A1: Ø54.7 (53.2-56.1)
ACEMagician Ace Magician AM08 Pro: Ø55.9 (52.6-64.3)
HP Dragonfly Pro 2023: Ø57.5 (56-59.4)
Lenovo Yoga Pro 7 14ARP G8: Ø58.4 (56.9-60.2)
HP EliteBook 845 G9 6F6H6EA: Ø59.2 (56.2-61.6)
Beelink SER6 Pro: Ø61.4 (59.7-62.8)
GMK NucBox K2: Ø62.2 (60.2-65.2)
Beelink SER6 Pro Ryzen 7 7735HS: Ø62.6 (60.9-64.9)
Asus VivoBook S15 M3502RA-L1029W: Ø64.4 (62.7-75.4)
Beelink GTR6: Ø69 (65.6-72.5)
Morefine M600, 6900HX: Ø74.7 (71.8-85.8)
Aoostar GOD77: Ø75.7 (70.8-77.8)
ACEMagician Ace Magician AM08 Pro: Ø76.8 (66.9-82.1)
Power Consumption - Witcher 3 Power Consumption *
min: 40.1 avg: 53.5 median: 50.1 (11%) max: 69 Watt
...
...
0 5 10 15 20 25 30 35 40 45 50 55 60 65 70 Tooltip Lenovo ThinkPad T14s G3 21CQ002LGE: Ø40.1 (38.1-41.2)
Asus Zenbook S 13 OLED: Ø42.4 (40.2-44.5)
Lenovo ThinkPad T14 G3-21CF004NGE: Ø42.8 (40.7-45.7)
HP EliteBook 835 G9: Ø45.2 (42.4-48.9)
GPD Win 4: Ø45.2 (44-52.8)
Lenovo Yoga 7-14ARB G7: Ø46.3 (43.5-50.9)
Acer Swift Edge SFE16-42-R1GM: Ø46.3 (44.6-53.4)
Lenovo ThinkPad Z13 G1-21D20016GE: Ø48.1 (43.3-53.5)
HP EliteBook 865 G9: Ø48.7 (47.2-51.8)
One Netbook XPlayer 2: Ø49.6 (48-51.7)
Lenovo ThinkPad P14s G3 AMD 21J6S05000: Ø50.6 (49.4-52.7)
Aokzoe A1: Ø58.3 (55.2-66.3)
HP Dragonfly Pro 2023: Ø60 (56.6-62.6)
Beelink SER6 Pro: Ø61.4 (59.7-62.8)
Lenovo Yoga Pro 7 14ARP G8: Ø61.5 (60.5-62.7)
GMK NucBox K2: Ø62.2 (60.2-65.2)
Beelink SER6 Pro Ryzen 7 7735HS: Ø62.6 (60.9-64.9)
HP EliteBook 845 G9 6F6H6EA: Ø63.6 (61-67.9)
Asus VivoBook S15 M3502RA-L1029W: Ø66.4 (62.7-70.4)
Beelink GTR6: Ø69 (65.6-72.5)
Power Consumption - Witcher 3 ultra Power Efficiency
min: 0.2296 avg: 0.4 median: 0.4 (41%) max: 0.558 fps per Watt
...
...
Power Consumption - Witcher 3 ultra Power Efficiency - external Monitor
min: 0.2466 avg: 0.4 median: 0.4 (36%) max: 0.713 fps per Watt
...
...
Emissions Witcher 3 Fan Noise + Emissions - Witcher 3 Fan Noise
min: 27.5 avg: 38.9 median: 40.4 (65%) max: 48.6 dB(A)
...
...
Clock Speed - GPU Clock Witcher 3 ultra
1724 MHz (68%)
...
...
- Range of benchmark values for this graphics card
- Average benchmark values for this graphics card
* Smaller numbers mean a higher performance
Game Benchmarks The following benchmarks stem from our benchmarks of review laptops. The performance depends on the used graphics memory, clock rate, processor, system settings, drivers, and operating systems. So the results don't have to be representative for all laptops with this GPU. For detailed information on the benchmark results, click on the fps number.
0 100 Tooltip MTN-FP750: Ø92.9 (73.69-104.3)
...
max:
0 100 Tooltip MTN-FP750: Ø65.2 (49.59-149.2)
...
max:
0 100 Tooltip MTN-FP750: Ø66.4 (51.43-157.6)
...
max:
» With all tested laptops playable in detail settings ultra.
...
max:
...
max:
...
max:
» The benchmarks indicate that the game is not playable in the tested settings.
Additional Benchmarks
Low Preset 1280x720
22.3 [X] Asus ROG Zephyrus G14 AMD Ryzen 9 6900HS 3.3GHz
Radeon 680M
min:
6.04 fps, P0.1:
7.22 fps, P1:
13 fps, max:
56.2 fps
High Preset + High Ray Tracing 1920x1080
3.3 [X] Asus ROG Zephyrus G14 AMD Ryzen 9 6900HS 3.3GHz
Radeon 680M
min:
1.78 fps, P0.1:
1.781 fps, P1:
1.907 fps, max:
37.9 fps
...
max:
0 100 200 300 400 500 600 700 800 900 1000 1100 Tooltip
...
max:
...
max:
...
max:
» The benchmarks indicate that the game is not playable in the tested settings.
Additional Benchmarks
Low Preset 1280x720
26.5 [X] Asus ROG Zephyrus G14 AMD Ryzen 9 6900HS 3.3GHz
Radeon 680M
min:
3.56 fps, P0.1:
4.04 fps, P1:
7.26 fps, max:
123.6 fps
...
...
max:
...
...
max:
...
...
max:
...
...
max:
» With most tested laptops playable in detail settings ultra.
Additional Benchmarks
Low Preset 1280x720
128 [X] Asus ROG Zephyrus G14 AMD Ryzen 9 6900HS 3.3GHz
Radeon 680M
min:
90 fps
...
max:
...
max:
...
max:
...
max:
» The benchmarks indicate that the game is not playable in the tested settings.
Additional Benchmarks
Low Preset (Adaptive Quality Off) 1280x720
60 [X] Asus ROG Zephyrus G14 AMD Ryzen 9 6900HS 3.3GHz
Radeon 680M
min:
21 fps
...
max:
...
max:
...
max:
...
max:
» With all tested laptops playable in detail settings ultra.
Additional Benchmarks
Low Preset 1280x720
100.8 [X] Asus ROG Zephyrus G14 AMD Ryzen 9 6900HS 3.3GHz
Radeon 680M
min:
2.15 fps, P0.1:
19.4 fps, P1:
33.6 fps, max:
225 fps
...
...
max:
...
...
max:
...
...
max:
...
...
max:
...
max:
...
max:
» The benchmarks indicate that the game is not playable in the tested settings.
Additional Benchmarks
Low Preset (FSR off) 1280x720
43 [X] Asus ROG Zephyrus G14 AMD Ryzen 9 6900HS 3.3GHz
Radeon 680M
min:
14 fps
Ray Tracing Ultra Preset (DLSS off) 1920x1080
...
...
max:
...
max:
...
max:
...
max:
» With all tested laptops playable in detail settings med..
Additional Benchmarks
Low Preset 1280x720
70.4 [X] Asus ROG Zephyrus G14 AMD Ryzen 9 6900HS 3.3GHz
Radeon 680M
min:
17.1 fps, P0.1:
27.2 fps, P1:
38.4 fps, max:
192.4 fps
...
...
max:
...
max:
...
max:
» The benchmarks indicate that the game is not playable in the tested settings.
Additional Benchmarks
Low Preset 1280x720
46 [X] Asus ROG Zephyrus G14 AMD Ryzen 9 6900HS 3.3GHz
Radeon 680M
min:
39 fps
...
max:
...
max:
...
max:
...
max:
» The benchmarks indicate that the game is not playable in the tested settings.
Additional Benchmarks
Low Preset 1280x720
32.2 [X] Asus ROG Zephyrus G14 AMD Ryzen 9 6900HS 3.3GHz
Radeon 680M
min:
18 fps, P0.1:
19.6 fps, P1:
22.6 fps, max:
46.8 fps
...
...
max:
...
max:
...
max:
...
max:
» The benchmarks indicate that the game is not playable in the tested settings.
Additional Benchmarks
Low Preset 1280x720
45.9 [X] Asus ROG Zephyrus G14 AMD Ryzen 9 6900HS 3.3GHz
Radeon 680M
min:
5.75 fps, P0.1:
6.76 fps, P1:
25.9 fps, max:
91.6 fps
...
max:
...
max:
...
max:
» The benchmarks indicate that the game is not playable in the tested settings.
Additional Benchmarks
Low 1280x720
32.2 [X] Asus ROG Zephyrus G14 AMD Ryzen 9 6900HS 3.3GHz
Radeon 680M
min:
11.1 fps, P0.1:
13 fps, P1:
18.1 fps, max:
63.9 fps
...
...
max:
...
...
max:
...
max:
...
max:
» With all tested laptops playable in detail settings low.
Additional Benchmarks
Low Preset 1280x720
59.5 [X] Asus ROG Zephyrus G14 AMD Ryzen 9 6900HS 3.3GHz
Radeon 680M
min:
48.1 fps, P0.1:
48.3 fps, P1:
50.9 fps, max:
80.8 fps
...
...
max:
...
...
max:
...
max:
...
max:
» The benchmarks indicate that the game is not playable in the tested settings.
Additional Benchmarks
Low Preset 1280x720
46.8 [X] Asus ROG Zephyrus G14 AMD Ryzen 9 6900HS 3.3GHz
Radeon 680M
min:
20.6 fps, P0.1:
23.4 fps, P1:
31.1 fps, max:
131 fps
...
...
max:
...
...
max:
...
max:
...
max:
» The benchmarks indicate that the game is not playable in the tested settings.
Additional Benchmarks
Very Low Preset 1280x720
37.1 [X] Asus ROG Zephyrus G14 AMD Ryzen 9 6900HS 3.3GHz
Radeon 680M
min:
20.5 fps, P0.1:
21.3 fps, P1:
26.4 fps, max:
56.2 fps
...
...
max:
...
...
max:
...
...
max:
...
max:
» With most tested laptops playable in detail settings high.
Additional Benchmarks
Ultra Low Preset TAA 1280x720
106 [X] Asus ROG Zephyrus G14 AMD Ryzen 9 6900HS 3.3GHz
Radeon 680M
min:
86 fps
...
...
max:
...
...
max:
...
...
max:
...
max:
» With all tested laptops playable in detail settings high.
Additional Benchmarks
Low Preset 1280x720
83.9 [X] Asus ROG Zephyrus G14 AMD Ryzen 9 6900HS 3.3GHz
Radeon 680M
min:
6.69 fps, P0.1:
11.5 fps, P1:
33 fps, max:
303 fps
...
...
max:
...
...
max:
...
max:
...
max:
» With all tested laptops playable in detail settings low.
Additional Benchmarks
Low Preset 1280x720
46 [X] Asus ROG Zephyrus G14 AMD Ryzen 9 6900HS 3.3GHz
Radeon 680M
min:
4.74 fps, P0.1:
14.6 fps, P1:
33.4 fps, max:
69.6 fps
...
...
max:
...
...
max:
...
...
max:
...
...
max:
» With all tested laptops playable in detail settings high.
Additional Benchmarks
Low Preset Low TAA 1280x720
95.2 [X] Asus ROG Zephyrus G14 AMD Ryzen 9 6900HS 3.3GHz
Radeon 680M
min:
13.8 fps, P0.1:
53.4 fps, P1:
65.3 fps, max:
158.9 fps
...
...
max:
...
max:
0 100 200 300 400 500 600 700 800 900 1000 1100 1200 1300 1400 Tooltip
...
max:
...
max:
» The benchmarks indicate that the game is not playable in the tested settings.
Additional Benchmarks
Low Preset 1280x720
32.8 [X] Asus ROG Zephyrus G14 AMD Ryzen 9 6900HS 3.3GHz
Radeon 680M
min:
14 fps, P0.1:
15.5 fps, P1:
20.3 fps, max:
55.5 fps
...
...
max:
...
...
max:
...
max:
...
max:
» The benchmarks indicate that the game is not playable in the tested settings.
Additional Benchmarks
Prioritize Performance Preset 1280x720
43.9 [X] Asus ROG Zephyrus G14 AMD Ryzen 9 6900HS 3.3GHz
Radeon 680M
min:
11.5 fps, P0.1:
20.5 fps, P1:
30.2 fps, max:
71.7 fps
...
...
max:
...
...
max:
» With all tested laptops playable in detail settings med..
Additional Benchmarks
Minimum Settings 1280x720
96 [X] Asus ROG Zephyrus G14 AMD Ryzen 9 6900HS 3.3GHz
Radeon 680M
min:
20 fps
...
...
max:
...
...
max:
...
...
max:
...
max:
» The benchmarks indicate that the game is not playable in the tested settings.
Additional Benchmarks
Ultra Low Preset 1280x720
42.5 [X] Asus ROG Zephyrus G14 AMD Ryzen 9 6900HS 3.3GHz
Radeon 680M
min:
22.6 fps, P0.1:
23.4 fps, P1:
31.9 fps, max:
59.1 fps
...
...
max:
...
...
max:
...
...
max:
...
max:
» With all tested laptops playable in detail settings med..
Additional Benchmarks
Low Preset 1280x720
82.1 [X] Asus ROG Zephyrus G14 AMD Ryzen 9 6900HS 3.3GHz
Radeon 680M
min:
30.3 fps, P0.1:
40.7 fps, P1:
66.7 fps, max:
139.9 fps
...
...
max:
...
max:
...
max:
...
max:
» The benchmarks indicate that the game is not playable in the tested settings.
Additional Benchmarks
Low Preset 1280x720
34 [X] Asus ROG Zephyrus G14 AMD Ryzen 9 6900HS 3.3GHz
Radeon 680M
min:
18 fps
...
...
max:
...
...
max:
...
max:
0 100 200 300 400 500 600 700 800 900 1000 1100 1200 1300 1400 1500 1600 1700 1800 1900 2000 2100 2200 2300 2400 2500 2600 2700 2800 2900 3000 3100 3200 3300 3400 3500 3600 3700 3800 3900 4000 4100 4200 4300 4400 4500 4600 4700 4800 4900 5000 5100 5200 5300 5400 5500 Tooltip
...
max:
» The benchmarks indicate that the game is not playable in the tested settings.
Additional Benchmarks
Low Preset Low TAA 1280x720
54.8 [X] Asus ROG Zephyrus G14 AMD Ryzen 9 6900HS 3.3GHz
Radeon 680M
min:
24.3 fps, P0.1:
29.2 fps, P1:
36 fps, max:
105.5 fps
0 100 Tooltip AS 6, R9 6900HX: Ø46.9 (39.175-93.2)
Venus Series UM690: Ø48.8 (37.309-110.8)
: Ø47.7 (36.359-108.7)
...
...
max:
0 100 Tooltip AS 6, R9 6900HX: Ø36.3 (31.067-98.4)
: Ø38.4 (32.106-58.3)
Venus Series UM690: Ø43.2 (35.039-110)
...
...
max:
0 100 Tooltip AS 6, R9 6900HX: Ø33.8 (27.034-118.6)
: Ø34.1 (27.198-120.9)
Venus Series UM690: Ø38.3 (30.095-123.5)
...
...
max:
0 100 200 300 Tooltip : Ø27.6 (17.398-54.9)
AS 6, R9 6900HX: Ø35.1 (23.036-328)
Venus Series UM690: Ø33.3 (26.141-119.9)
...
max:
0 Tooltip AS 6, R9 6900HX: Ø18.4 (15.278-32.3)
...
max:
0 100 200 Tooltip AS 6, R9 6900HX: Ø17.4 (7.031-209)
...
max:
» With most tested laptops playable in detail settings med..
Additional Benchmarks
Low Preset / Off 1280x720
72.8 [X] Asus ROG Zephyrus G14 AMD Ryzen 9 6900HS 3.3GHz
Radeon 680M
min:
38 fps, P0.1:
42.6 fps, P1:
50.7 fps, max:
205 fps
RT Ultra Preset / On FXAA 1920x1080
...
...
max:
...
...
max:
...
...
max:
...
...
max:
» With all tested laptops playable in detail settings med..
Additional Benchmarks
Low Preset 1280x720
100.8 [X] Asus ROG Zephyrus G14 AMD Ryzen 9 6900HS 3.3GHz
Radeon 680M
min:
40.3 fps, P0.1:
45.2 fps, P1:
62 fps, max:
168 fps
...
...
max:
...
...
max:
...
max:
...
max:
» The benchmarks indicate that the game is not playable in the tested settings.
Additional Benchmarks
Low Preset (without FSR Upscaling) 1280x720
63.7 [X] Asus ROG Zephyrus G14 AMD Ryzen 9 6900HS 3.3GHz
Radeon 680M
...
...
max:
...
...
max:
...
...
max:
...
max:
» With all tested laptops playable in detail settings med..
Additional Benchmarks
Low Preset 1280x720
68.8 [X] Asus ROG Zephyrus G14 AMD Ryzen 9 6900HS 3.3GHz
Radeon 680M
min:
30.7 fps, P0.1:
41.3 fps, P1:
49.1 fps, max:
104.3 fps
0 100 200 300 400 500 600 700 800 900 1000 1100 Tooltip EliteBook 835 G9: Ø81.4 (30.288-1130)
: Ø47.8 (39.1-96.2)
...
...
max:
0 Tooltip EliteBook 835 G9: Ø30.4 (26.317-40.5)
: Ø42.3 (34.608-71.8)
...
...
max:
0 Tooltip EliteBook 835 G9: Ø26.2 (21.25-40)
: Ø36.3 (31.336-52.6)
...
...
max:
0 Tooltip EliteBook 835 G9: Ø24.6 (17.2-64.6)
: Ø34 (29.186-65.5)
...
max:
» With most tested laptops playable in detail settings low.
Additional Benchmarks
Very Low Preset 1280x720
56.6 [X] Asus ROG Zephyrus G14 AMD Ryzen 9 6900HS 3.3GHz
Radeon 680M
min:
39.2 fps, P0.1:
40.8 fps, P1:
43.9 fps, max:
79 fps
...
...
max:
...
...
max:
...
...
max:
...
...
max:
» With all tested laptops playable in detail settings high.
Additional Benchmarks
Basic Quality Preset T2X SMAA 1280x720
103 [X] Asus ROG Zephyrus G14 AMD Ryzen 9 6900HS 3.3GHz
Radeon 680M
min:
67 fps
...
...
max:
...
max:
...
...
max:
...
max:
» The benchmarks indicate that the game is not playable in the tested settings.
Additional Benchmarks
Low Preset 1280x720
42.3 [X] Asus ROG Zephyrus G14 AMD Ryzen 9 6900HS 3.3GHz
Radeon 680M
min:
31.8 fps, P0.1:
33.7 fps, P1:
36.2 fps, max:
50.7 fps
0 100 Tooltip : Ø29.5 (18.009-136.6)
EliteBook 835 G9: Ø26.3 (18.07-43)
...
...
max:
0 Tooltip : Ø20.5 (17.083-38)
EliteBook 835 G9: Ø21.3 (17.143-31.89)
...
...
max:
0 100 Tooltip EliteBook 835 G9: Ø17 (13.012-68.6)
: Ø22.9 (15.124-129.9)
...
...
max:
0 100 200 300 400 500 600 700 800 900 1000 1100 1200 1300 1400 1500 1600 1700 1800 1900 2000 2100 2200 2300 2400 2500 2600 2700 2800 2900 3000 3100 3200 3300 3400 3500 3600 3700 3800 3900 4000 4100 4200 4300 4400 4500 4600 4700 4800 4900 5000 5100 5200 5300 5400 5500 5600 5700 5800 Tooltip EliteBook 835 G9: Ø19.4 (12.031-119)
: Ø164.4 (13.074-5880)
...
max:
» The benchmarks indicate that the game is not playable in the tested settings.
Additional Benchmarks
Low Preset 1280x720
35.3 [X] Asus ROG Zephyrus G14 AMD Ryzen 9 6900HS 3.3GHz
Radeon 680M
min:
19.2 fps, P0.1:
20.2 fps, P1:
27.4 fps, max:
65 fps
...
max:
max:
max:
...
max:
» With all tested laptops playable in detail settings ultra.
Additional Benchmarks
Low Rendering Quality 1280x720
111 [X] Asus ROG Zephyrus G14 AMD Ryzen 9 6900HS 3.3GHz
Radeon 680M
min:
2.46 fps, P0.1:
29.5 fps, P1:
68.5 fps, max:
172.8 fps
0 Tooltip EliteBook 835 G9: Ø34.2 (29.101-57)
...
...
max:
0 Tooltip EliteBook 835 G9: Ø26.3 (20.083-56.5)
...
...
max:
0 100 200 300 400 500 600 700 800 900 1000 1100 1200 1300 1400 Tooltip EliteBook 835 G9: Ø57.1 (12.827-1488)
...
...
max:
0 100 200 Tooltip EliteBook 835 G9: Ø22.3 (9.252-261)
...
max:
» The benchmarks indicate that the game is not playable in the tested settings.
Additional Benchmarks
Low Preset 1280x720
44.1 45.6 [X] Maxtang MTN-FP750 959964
AMD Ryzen 7 7735HS 3.2GHz
Radeon 680M
min:
37 fps, P1:
29 fps, max:
54 fps
49.7 53.1 66.5 66.7 71.4 72.1 [X] ACEMagician Ace Magician AM08 Pro 959964
AMD Ryzen 9 6900HX 3.3GHz
Radeon 680M
min:
57 fps, P1:
54 fps, max:
83 fps
74.3 77.1 [X] Aoostar GOD77 959964
AMD Ryzen 7 7735HS 3.2GHz
Radeon 680M
min:
64 fps, P1:
61 fps, max:
89 fps
77.3 78.1 [X] GPD Win 4 959964
AMD Ryzen 7 6800U 2.7GHz
Radeon 680M
min:
58 fps, P1:
57 fps, max:
96 fps
78.4 [X] Aokzoe A1 959964
AMD Ryzen 7 6800U 2.7GHz
Radeon 680M
min:
63 fps, P1:
44 fps, max:
94 fps
79.8 [X] ACEMagician Ace Magician AM08 Pro 959964
AMD Ryzen 9 6900HX 3.3GHz
Radeon 680M
min:
65 fps, P1:
54 fps, max:
92 fps
80 [X] Asus ROG Zephyrus G14 AMD Ryzen 9 6900HS 3.3GHz
Radeon 680M
min:
69 fps
80.1 80.2 80.2 [X] Acemagic AM20 959964
AMD Ryzen 7 7735H 3.2GHz
Radeon 680M
min:
68 fps, P1:
59 fps, max:
95 fps
80.8 82 82.6 [X] GMK NucBox K2 959964
AMD Ryzen 7 7735HS 3.2GHz
Radeon 680M
min:
71 fps, P1:
57 fps, max:
96 fps
83.1 85.4 ~ 73 fps
+ Compare
- Hide Comparison
...
...
max:
38 40.6 [X] Maxtang MTN-FP750 959964
AMD Ryzen 7 7735HS 3.2GHz
Radeon 680M
min:
33 fps, P1:
29 fps, max:
48 fps
46.1 49.1 55.4 60.3 61.1 62.8 [X] ACEMagician Ace Magician AM08 Pro 959964
AMD Ryzen 9 6900HX 3.3GHz
Radeon 680M
min:
55 fps, P1:
46 fps, max:
70 fps
65.4 65.4 66.9 [X] Aoostar GOD77 959964
AMD Ryzen 7 7735HS 3.2GHz
Radeon 680M
min:
56 fps, P1:
51 fps, max:
78 fps
69 [X] Aokzoe A1 959964
AMD Ryzen 7 6800U 2.7GHz
Radeon 680M
min:
55 fps, P1:
40 fps, max:
80 fps
69.5 69.9 [X] Acemagic AM20 959964
AMD Ryzen 7 7735H 3.2GHz
Radeon 680M
min:
60 fps, P1:
45 fps, max:
82 fps
70.1 70.4 [X] GPD Win 4 959964
AMD Ryzen 7 6800U 2.7GHz
Radeon 680M
min:
57 fps, P1:
56 fps, max:
83 fps
70.4 70.5 71.6 [X] ACEMagician Ace Magician AM08 Pro 959964
AMD Ryzen 9 6900HX 3.3GHz
Radeon 680M
min:
50 fps, P1:
46 fps, max:
84 fps
72 [X] Asus ROG Zephyrus G14 AMD Ryzen 9 6900HS 3.3GHz
Radeon 680M
min:
63 fps
72.9 74.1 [X] GMK NucBox K2 959964
AMD Ryzen 7 7735HS 3.2GHz
Radeon 680M
min:
61 fps, P1:
47 fps, max:
88 fps
74.6 ~ 64 fps
+ Compare
- Hide Comparison
...
...
max:
30 32.1 [X] Maxtang MTN-FP750 959964
AMD Ryzen 7 7735HS 3.2GHz
Radeon 680M
min:
25 fps, P1:
22 fps, max:
37 fps
34.8 35.4 36.9 42.3 44.5 45.6 [X] ACEMagician Ace Magician AM08 Pro 959964
AMD Ryzen 9 6900HX 3.3GHz
Radeon 680M
min:
39 fps, P1:
34 fps, max:
53 fps
48.4 50.1 [X] Aoostar GOD77 959964
AMD Ryzen 7 7735HS 3.2GHz
Radeon 680M
min:
40 fps, P1:
39 fps, max:
59 fps
50.5 [X] Aokzoe A1 959964
AMD Ryzen 7 6800U 2.7GHz
Radeon 680M
min:
40 fps, P1:
28 fps, max:
59 fps
50.5 [X] Acemagic AM20 959964
AMD Ryzen 7 7735H 3.2GHz
Radeon 680M
min:
44 fps, P1:
37 fps, max:
58 fps
51.5 [X] GPD Win 4 959964
AMD Ryzen 7 6800U 2.7GHz
Radeon 680M
min:
44 fps, P1:
44 fps, max:
58 fps
51.7 52 [X] Asus ROG Zephyrus G14 AMD Ryzen 9 6900HS 3.3GHz
Radeon 680M
min:
44 fps
52.2 52.3 [X] ACEMagician Ace Magician AM08 Pro 959964
AMD Ryzen 9 6900HX 3.3GHz
Radeon 680M
min:
41 fps, P1:
40 fps, max:
61 fps
52.5 52.9 53.8 54.7 [X] GMK NucBox K2 959964
AMD Ryzen 7 7735HS 3.2GHz
Radeon 680M
min:
47 fps, P1:
37 fps, max:
65 fps
54.9 55 ~ 47 fps
+ Compare
- Hide Comparison
...
...
max:
0 (!) 7.9 7.9 8.3 8.9 9.2 9.3 9.4 11.2 [X] ACEMagician Ace Magician AM08 Pro 959964
AMD Ryzen 9 6900HX 3.3GHz
Radeon 680M
min:
8 fps, P1:
8 fps, max:
13 fps
11.3 [X] ACEMagician Ace Magician AM08 Pro 959964
AMD Ryzen 9 6900HX 3.3GHz
Radeon 680M
min:
8 fps, P1:
8 fps, max:
15 fps
11.9 12.2 12.3 12.3 [X] Acemagic AM20 959964
AMD Ryzen 7 7735H 3.2GHz
Radeon 680M
min:
9 fps, P1:
9 fps, max:
15 fps
12.6 [X] GPD Win 4 959964
AMD Ryzen 7 6800U 2.7GHz
Radeon 680M
min:
9 fps, P1:
9 fps, max:
16 fps
13.1 13.2 13.2 [X] Aokzoe A1 959964
AMD Ryzen 7 6800U 2.7GHz
Radeon 680M
min:
10 fps, P1:
7 fps, max:
16 fps
13.9 13.9 [X] GMK NucBox K2 959964
AMD Ryzen 7 7735HS 3.2GHz
Radeon 680M
min:
9 fps, P1:
9 fps, max:
17 fps
14.1 ~ 11 fps
+ Compare
- Hide Comparison
...
max:
» With most tested laptops playable in detail settings high.
Additional Benchmarks
Ultra Low Preset 16xAF TAA 1280x720
136.1 [X] GPD Win 4 959964
AMD Ryzen 7 6800U 2.7GHz
Radeon 680M
min:
110 fps, P1:
91 fps, max:
150 fps
125 [X] ACEMagician Ace Magician AM08 Pro 959964
AMD Ryzen 9 6900HX 3.3GHz
Radeon 680M
min:
100 fps, P1:
79 fps, max:
153 fps
139.9 [X] ACEMagician Ace Magician AM08 Pro 959964
AMD Ryzen 9 6900HX 3.3GHz
Radeon 680M
min:
117 fps, P1:
92 fps, max:
169 fps
147.3 [X] GMK NucBox K2 959964
AMD Ryzen 7 7735HS 3.2GHz
Radeon 680M
min:
118 fps, P1:
96 fps, max:
175 fps
136.6 [X] Aokzoe A1 959964
AMD Ryzen 7 6800U 2.7GHz
Radeon 680M
min:
107 fps, P1:
91 fps, max:
160 fps
136.4 [X] Acemagic AM20 1026791
AMD Ryzen 7 7735H 3.2GHz
Radeon 680M
min:
113 fps, P1:
90 fps, max:
156 fps
...
...
max:
...
...
max:
...
...
max:
» With all tested laptops playable in detail settings high.
0 100 Tooltip ROG Zephyrus Duo 16 GX650RX: Ø47.4 (38.312-111.8)
...
...
max:
0 100 Tooltip ROG Zephyrus Duo 16 GX650RX: Ø45.1 (38.223-142.6)
...
...
max:
0 Tooltip ROG Zephyrus Duo 16 GX650RX: Ø42.5 (38.155-58)
...
...
max:
0 100 Tooltip ROG Zephyrus Duo 16 GX650RX: Ø44.5 (34.845-120.9)
...
max:
0 100 200 300 400 500 600 700 800 900 1000 1100 1200 1300 1400 1500 1600 1700 1800 1900 2000 2100 2200 2300 2400 2500 2600 2700 2800 2900 3000 3100 3200 3300 3400 3500 3600 3700 3800 3900 4000 4100 4200 4300 4400 4500 4600 4700 4800 4900 5000 5100 5200 5300 5400 5500 5600 5700 5800 5900 6000 6100 6200 6300 6400 6500 6600 6700 6800 6900 7000 7100 7200 7300 7400 7500 7600 7700 7800 7900 8000 8100 8200 8300 8400 8500 8600 Tooltip ROG Zephyrus Duo 16 GX650RX: Ø224 (22.034-8626)
...
max:
0 100 200 300 400 500 600 700 800 900 1000 Tooltip ROG Zephyrus Duo 16 GX650RX: Ø53.7 (9.14-1080)
...
max:
» With all tested laptops playable in detail settings low.
Additional Benchmarks
Lowest Settings 1280x720
79.8 [X] Asus ROG Zephyrus Duo 16 GX650RX AMD Ryzen 9 6900HX 3.3GHz
Radeon 680M
min:
21 fps, P0.1:
40.2 fps, P1:
51.7 fps, max:
137.9 fps
...
...
max:
...
...
max:
...
...
max:
...
...
max:
...
max:
...
max:
» With most tested laptops playable in detail settings med..
Additional Benchmarks
Lowest Preset (DX12) 1280x720
126.2 [X] Asus ROG Zephyrus Duo 16 GX650RX AMD Ryzen 9 6900HX 3.3GHz
Radeon 680M
83.7 [X] ACEMagician Ace Magician AM08 Pro 959964
AMD Ryzen 9 6900HX 3.3GHz
Radeon 680M
90.6 [X] ACEMagician Ace Magician AM08 Pro 959964
AMD Ryzen 9 6900HX 3.3GHz
Radeon 680M
...
...
max:
...
...
max:
...
...
max:
...
...
max:
...
max:
...
max:
» With most tested laptops playable in detail settings low.
Additional Benchmarks
Low Preset 1280x720
75.7 [X] Asus ROG Zephyrus G14 AMD Ryzen 9 6900HS 3.3GHz
Radeon 680M
min:
26 fps
74.5 [X] Asus ROG Zephyrus Duo 16 GX650RX AMD Ryzen 9 6900HX 3.3GHz
Radeon 680M
min:
28 fps, max:
124.7 fps
62.6 [X] GPD Win 4 959964
AMD Ryzen 7 6800U 2.7GHz
Radeon 680M
min:
30.3 fps, max:
102.9 fps
54.8 [X] Aokzoe A1 959964
AMD Ryzen 7 6800U 2.7GHz
Radeon 680M
min:
7.9 fps, max:
129.9 fps
Ray Tracing Ultra Preset (DLSS off) 1920x1080
Ray Tracing Ultra Preset (DLSS off) 3840x2160
...
...
...
...
...
0 100 200 300 400 500 600 Tooltip
...
» With all tested laptops playable in detail settings low.
Additional Benchmarks
Low / Off 1280x720
45.4 [X] Asus ROG Zephyrus G14 AMD Ryzen 9 6900HS 3.3GHz
Radeon 680M
min:
31.9 fps, P0.1:
32.2 fps, P1:
36.1 fps, max:
61.7 fps
24.4 35.5 58.2 61.2 [X] ACEMagician Ace Magician AM08 Pro 712825
AMD Ryzen 9 6900HX 3.3GHz
Radeon 680M
min:
5.05 fps, max:
113.2 fps
62.1 66.5 [X] ACEMagician Ace Magician AM08 Pro 712825
AMD Ryzen 9 6900HX 3.3GHz
Radeon 680M
min:
29.9 fps, max:
144.1 fps
76.9 [X] Acemagic AM20 800660
AMD Ryzen 7 7735H 3.2GHz
Radeon 680M
min:
26.8 fps, max:
157.3 fps
81.1 84.5 91 [X] Aoostar GOD77 800660
AMD Ryzen 7 7735HS 3.2GHz
Radeon 680M
min:
26.3 fps, max:
201 fps
93.5 114 [X] Asus ROG Zephyrus G14 AMD Ryzen 9 6900HS 3.3GHz
Radeon 680M
min:
93 fps
~ 71 fps
+ Compare
- Hide Comparison
...
...
max:
29.5 45 47.4 [X] ACEMagician Ace Magician AM08 Pro 712825
AMD Ryzen 9 6900HX 3.3GHz
Radeon 680M
min:
3.63 fps, max:
129.9 fps
47.4 50 [X] ACEMagician Ace Magician AM08 Pro 712825
AMD Ryzen 9 6900HX 3.3GHz
Radeon 680M
min:
4.32 fps, max:
114.9 fps
60.6 [X] Acemagic AM20 800660
AMD Ryzen 7 7735H 3.2GHz
Radeon 680M
min:
24.3 fps, max:
134.4 fps
62.9 63.4 66.7 69.6 [X] Aoostar GOD77 800660
AMD Ryzen 7 7735HS 3.2GHz
Radeon 680M
min:
34.9 fps, max:
137.1 fps
82.2 [X] Asus ROG Zephyrus G14 AMD Ryzen 9 6900HS 3.3GHz
Radeon 680M
min:
62 fps
~ 57 fps
+ Compare
- Hide Comparison
...
...
max:
24.4 34.2 36.7 37.3 [X] ACEMagician Ace Magician AM08 Pro 712825
AMD Ryzen 9 6900HX 3.3GHz
Radeon 680M
min:
18.3 fps, max:
83.2 fps
44.1 [X] ACEMagician Ace Magician AM08 Pro 712825
AMD Ryzen 9 6900HX 3.3GHz
Radeon 680M
min:
19.4 fps, max:
103.9 fps
47 [X] Acemagic AM20 800660
AMD Ryzen 7 7735H 3.2GHz
Radeon 680M
min:
19.8 fps, max:
85.9 fps
48 48.2 51.9 51.9 [X] Aoostar GOD77 800660
AMD Ryzen 7 7735HS 3.2GHz
Radeon 680M
min:
24.8 fps, max:
103.7 fps
64.9 [X] Asus ROG Zephyrus G14 AMD Ryzen 9 6900HS 3.3GHz
Radeon 680M
min:
51 fps
~ 44 fps
+ Compare
- Hide Comparison
...
...
max:
21.2 26.6 26.9 29.8 [X] ACEMagician Ace Magician AM08 Pro 712825
AMD Ryzen 9 6900HX 3.3GHz
Radeon 680M
min:
14.4 fps, max:
67 fps
30.5 [X] ACEMagician Ace Magician AM08 Pro 712825
AMD Ryzen 9 6900HX 3.3GHz
Radeon 680M
min:
14.9 fps, max:
64.7 fps
37.9 38 38.4 [X] Acemagic AM20 800660
AMD Ryzen 7 7735H 3.2GHz
Radeon 680M
min:
18 fps, max:
78.7 fps
38.4 [X] Aoostar GOD77 800660
AMD Ryzen 7 7735HS 3.2GHz
Radeon 680M
min:
10.8 fps, max:
213 fps
40.6 46.3 [X] Asus ROG Zephyrus G14 AMD Ryzen 9 6900HS 3.3GHz
Radeon 680M
min:
33 fps
~ 34 fps
+ Compare
- Hide Comparison
...
...
max:
» With most tested laptops playable in detail settings high.
Additional Benchmarks
Low Preset 1280x720
170 [X] Asus ROG Zephyrus G14 AMD Ryzen 9 6900HS 3.3GHz
Radeon 680M
min:
129 fps
101.9 [X] ACEMagician Ace Magician AM08 Pro 959964
AMD Ryzen 9 6900HX 3.3GHz
Radeon 680M
min:
30.7 fps, max:
192.2 fps
115.9 [X] ACEMagician Ace Magician AM08 Pro 959964
AMD Ryzen 9 6900HX 3.3GHz
Radeon 680M
min:
44.3 fps, max:
219 fps
0 100 200 300 400 500 600 700 800 900 1000 1100 1200 1300 Tooltip
...
max:
...
...
max:
...
...
max:
...
...
max:
» With all tested laptops playable in detail settings high.
Additional Benchmarks
Low Preset 1280x720
58.1 [X] Asus ROG Zephyrus G14 AMD Ryzen 9 6900HS 3.3GHz
Radeon 680M
min:
28.8 fps, P0.1:
29.9 fps, P1:
36.7 fps, max:
84.8 fps
...
...
max:
...
...
max:
...
...
max:
» The benchmarks indicate that the game is not playable in the tested settings.
Additional Benchmarks
Low Quality 1280x720
51.3 [X] Asus ROG Zephyrus G14 AMD Ryzen 9 6900HS 3.3GHz
Radeon 680M
min:
37.1 fps, P0.1:
37.8 fps, P1:
41.1 fps, max:
108 fps
...
...
max:
...
...
max:
...
...
max:
...
...
max:
» With most tested laptops playable in detail settings ultra.
Additional Benchmarks
Ultra Low Preset (with Fixed Resolution Quality) 1280x720
183 [X] Asus ROG Zephyrus G14 AMD Ryzen 9 6900HS 3.3GHz
Radeon 680M
min:
138 fps
19.5 [X] Maxtang MTN-FP750 AMD Ryzen 7 7735HS 3.2GHz
Radeon 680M
min:
15.1 fps, P0.1:
15.5 fps, P1:
16.2 fps, max:
23.3 fps
20.2 [X] ACEMagician Ace Magician AM08 Pro AMD Ryzen 9 6900HX 3.3GHz
Radeon 680M
min:
17.2 fps, P0.1:
17.4 fps, P1:
18.1 fps, max:
24.9 fps
20.4 24.9 25.2 33.4 [X] Aoostar GOD77 AMD Ryzen 7 7735HS 3.2GHz
Radeon 680M
min:
27.6 fps, P0.1:
27.8 fps, P1:
29.1 fps, max:
41.5 fps
34 35.9 [X] ACEMagician Ace Magician AM08 Pro AMD Ryzen 9 6900HX 3.3GHz
Radeon 680M
min:
21.1 fps, P0.1:
24.2 fps, P1:
30.7 fps, max:
45.7 fps
37.6 [X] Acemagic AM20 AMD Ryzen 7 7735H 3.2GHz
Radeon 680M
min:
28.5 fps, P0.1:
28.7 fps, P1:
32 fps, max:
105.2 fps
37.9 [X] Asus ROG Zephyrus G14 AMD Ryzen 9 6900HS 3.3GHz
Radeon 680M
min:
28.1 fps, P0.1:
30.8 fps, P1:
32.7 fps, max:
48.1 fps
48.6 ~ 31 fps
+ Compare
- Hide Comparison
+ 📈 Graph
- 📈 Hide Graph
0 100 200 300 400 500 Tooltip MTN-FP750: Ø21.8 (18.23-39.1)
Ace Magician AM08 Pro: Ø23.3 (19.114-49.9)
Ace Magician AM08 Pro: Ø23.5 (19.194-51.7)
Mercury Series EM680: Ø26.1 (22.077-31.75)
Swift Edge SFE16-42-R1GM: Ø30.1 (23.308-94.5)
GOD77: Ø45.3 (30.093-281)
Ace Magician AM08 Pro: Ø59.1 (33.027-578)
AM20: Ø45 (35.969-125.8)
: Ø42 (35.658-58.2)
AS 6, R9 6900HX: Ø56.1 (44.085-176.8)
...
...
max:
15.9 [X] Maxtang MTN-FP750 AMD Ryzen 7 7735HS 3.2GHz
Radeon 680M
min:
12.1 fps, P0.1:
12.2 fps, P1:
13.1 fps, max:
23.6 fps
16.1 [X] ACEMagician Ace Magician AM08 Pro AMD Ryzen 9 6900HX 3.3GHz
Radeon 680M
min:
14 fps, P0.1:
14.1 fps, P1:
14.3 fps, max:
18.6 fps
16.5 18.6 [X] ACEMagician Ace Magician AM08 Pro AMD Ryzen 9 6900HX 3.3GHz
Radeon 680M
min:
14.7 fps, P0.1:
14.8 fps, P1:
15.2 fps, max:
36.1 fps
20.3 22 23.6 [X] Aoostar GOD77 AMD Ryzen 7 7735HS 3.2GHz
Radeon 680M
min:
14.2 fps, P0.1:
14.4 fps, P1:
15.1 fps, max:
30.5 fps
27.6 27.9 30.5 [X] Acemagic AM20 AMD Ryzen 7 7735H 3.2GHz
Radeon 680M
min:
14.1 fps, P0.1:
16.1 fps, P1:
25.2 fps, max:
76.6 fps
30.6 [X] Asus ROG Zephyrus G14 AMD Ryzen 9 6900HS 3.3GHz
Radeon 680M
min:
25.5 fps, P0.1:
25.7 fps, P1:
26.9 fps, max:
35.8 fps
~ 23 fps
+ Compare
- Hide Comparison
+ 📈 Graph
- 📈 Hide Graph
0 100 200 300 400 500 600 700 800 900 1000 1100 Tooltip MTN-FP750: Ø23.8 (14.152-169.5)
Ace Magician AM08 Pro: Ø21.5 (15.021-95.7)
Ace Magician AM08 Pro: Ø55.8 (12.38-1101)
Ace Magician AM08 Pro: Ø21 (15.057-37.9)
Swift Edge SFE16-42-R1GM: Ø24 (17.058-54.1)
Mercury Series EM680: Ø24.5 (19.271-47.3)
GOD77: Ø29.8 (21.134-87.5)
AS 6, R9 6900HX: Ø30.5 (26.272-64.5)
AM20: Ø38 (27.022-166.6)
: Ø32.8 (28.223-46.5)
...
...
max:
11.7 [X] Maxtang MTN-FP750 AMD Ryzen 7 7735HS 3.2GHz
Radeon 680M
min:
5.92 fps, P0.1:
7.12 fps, P1:
10.2 fps, max:
14.9 fps
11.9 [X] ACEMagician Ace Magician AM08 Pro AMD Ryzen 9 6900HX 3.3GHz
Radeon 680M
min:
4.04 fps, P0.1:
5.29 fps, P1:
10 fps, max:
83.1 fps
12.2 12.5 [X] ACEMagician Ace Magician AM08 Pro AMD Ryzen 9 6900HX 3.3GHz
Radeon 680M
min:
4.17 fps, P0.1:
5.46 fps, P1:
9.55 fps, max:
71.2 fps
16.2 18.2 18.4 [X] Aoostar GOD77 AMD Ryzen 7 7735HS 3.2GHz
Radeon 680M
min:
11.5 fps, P0.1:
11.5 fps, P1:
11.7 fps, max:
24.9 fps
21.8 22.9 24.2 [X] Acemagic AM20 AMD Ryzen 7 7735H 3.2GHz
Radeon 680M
min:
7.68 fps, P0.1:
8.43 fps, P1:
14.9 fps, max:
107.1 fps
25 [X] Asus ROG Zephyrus G14 AMD Ryzen 9 6900HS 3.3GHz
Radeon 680M
min:
15.5 fps, P0.1:
19 fps, P1:
21.9 fps, max:
29.1 fps
~ 18 fps
+ Compare
- Hide Comparison
+ 📈 Graph
- 📈 Hide Graph
0 100 200 300 Tooltip MTN-FP750: Ø15.8 (11.016-50.3)
Ace Magician AM08 Pro: Ø14.9 (11.067-47.2)
Ace Magician AM08 Pro: Ø20 (11.017-72.6)
Ace Magician AM08 Pro: Ø18.5 (10.524-118.4)
Swift Edge SFE16-42-R1GM: Ø37 (13.325-393)
Mercury Series EM680: Ø21.7 (16.039-58.8)
GOD77: Ø28.4 (16.006-268)
AS 6, R9 6900HX: Ø24.6 (20.075-45.1)
AM20: Ø36.7 (22.179-232)
: Ø32.2 (23.244-100.6)
...
...
max:
8.9 [X] ACEMagician Ace Magician AM08 Pro AMD Ryzen 9 6900HX 3.3GHz
Radeon 680M
min:
7.42 fps, P0.1:
7.47 fps, P1:
7.71 fps, max:
11.8 fps
8.9 [X] ACEMagician Ace Magician AM08 Pro AMD Ryzen 9 6900HX 3.3GHz
Radeon 680M
min:
2.87 fps, P0.1:
3.86 fps, P1:
7.82 fps, max:
49.6 fps
9 11.5 12.2 13.4 [X] Aoostar GOD77 AMD Ryzen 7 7735HS 3.2GHz
Radeon 680M
min:
8.15 fps, P0.1:
8.26 fps, P1:
8.6 fps, max:
17.4 fps
15.1 15.2 17.5 [X] Asus ROG Zephyrus G14 AMD Ryzen 9 6900HS 3.3GHz
Radeon 680M
min:
13.8 fps, P0.1:
14.1 fps, P1:
14.8 fps, max:
20.6 fps
18.1 [X] Acemagic AM20 AMD Ryzen 7 7735H 3.2GHz
Radeon 680M
min:
10.7 fps, P0.1:
11.3 fps, P1:
15.2 fps, max:
60.4 fps
~ 13 fps
+ Compare
- Hide Comparison
+ 📈 Graph
- 📈 Hide Graph
0 100 200 300 400 Tooltip Ace Magician AM08 Pro: Ø11 (8.008-25.1)
Ace Magician AM08 Pro: Ø21.1 (8.013-452)
Ace Magician AM08 Pro: Ø19 (8.032-178)
Swift Edge SFE16-42-R1GM: Ø20.9 (9.15-188.1)
Mercury Series EM680: Ø19.9 (9.882-208.4)
GOD77: Ø17.3 (12.09-59.7)
AS 6, R9 6900HX: Ø18.5 (11.006-34.8)
: Ø21.9 (15.282-57.7)
AM20: Ø20.8 (15.164-33.4)
...
...
max:
» The benchmarks indicate that the game is not playable in the tested settings.
Additional Benchmarks
Low Preset 1280x720
53 [X] Asus ROG Zephyrus G14 AMD Ryzen 9 6900HS 3.3GHz
Radeon 680M
min:
36.7 fps, P0.1:
41.3 fps, P1:
43 fps, max:
77 fps
33.1 [X] ACEMagician Ace Magician AM08 Pro 959964
AMD Ryzen 9 6900HX 3.3GHz
Radeon 680M
min:
13.1 fps, P0.1:
19.7 fps, P1:
22.2 fps, max:
68.5 fps
50.4 [X] ACEMagician Ace Magician AM08 Pro 959964
AMD Ryzen 9 6900HX 3.3GHz
Radeon 680M
min:
26.7 fps, P0.1:
32.2 fps, P1:
39.3 fps, max:
82 fps
49.4 [X] Acemagic AM20 1026791
AMD Ryzen 7 7735H 3.2GHz
Radeon 680M
min:
10 fps, P0.1:
15 fps, P1:
24.6 fps, max:
153.3 fps
26.5 [X] Maxtang MTN-FP750 AMD Ryzen 7 7735HS 3.2GHz
Radeon 680M
min:
16.1 fps, P0.1:
16.2 fps, P1:
18.7 fps, max:
39.5 fps
51.3 [X] Aoostar GOD77 AMD Ryzen 7 7735HS 3.2GHz
Radeon 680M
min:
34.6 fps, P0.1:
35.5 fps, P1:
38 fps, max:
72.6 fps
...
...
0 100 200 300 400 500 600 700 800 900 1000 1100 1200 1300 1400 1500 1600 1700 1800 1900 2000 Tooltip
...
» With all tested laptops playable in detail settings med..
Additional Benchmarks
Low Preset 1920x1080
41.1 [X] Asus ROG Zephyrus G14 AMD Ryzen 9 6900HS 3.3GHz
Radeon 680M
min:
7.48 fps, P0.1:
11.2 fps, P1:
19.8 fps, max:
160 fps
...
...
max:
0 100 200 300 400 500 600 700 800 900 1000 1100 1200 1300 1400 1500 1600 1700 1800 1900 2000 2100 2200 2300 2400 2500 2600 2700 2800 2900 3000 3100 3200 3300 3400 3500 3600 3700 3800 3900 4000 4100 4200 4300 4400 4500 4600 4700 4800 4900 5000 5100 5200 5300 5400 5500 5600 5700 5800 5900 6000 6100 6200 6300 6400 6500 6600 6700 6800 6900 7000 7100 7200 7300 7400 7500 7600 7700 7800 7900 8000 8100 8200 8300 8400 8500 8600 8700 8800 8900 9000 9100 9200 9300 9400 9500 9600 9700 9800 9900 Tooltip
...
...
max:
...
...
max:
...
...
max:
» With most tested laptops playable in detail settings ultra.
Additional Benchmarks
Low Preset 1920x1080
114 [X] Asus ROG Zephyrus G14 AMD Ryzen 9 6900HS 3.3GHz
Radeon 680M
min:
0.4624 fps, P0.1:
21.4 fps, P1:
35.6 fps, max:
181 fps
max:
...
max:
...
max:
...
» With all tested laptops playable in detail settings med..
Additional Benchmarks
Low Preset 1920x1080
46.4 [X] Asus ROG Zephyrus G14 AMD Ryzen 9 6900HS 3.3GHz
Radeon 680M
min:
2.02 fps, P0.1:
3.73 fps, P1:
24.8 fps, max:
80.3 fps
...
...
max:
...
...
max:
...
...
max:
...
...
max:
» With all tested laptops playable in detail settings high.
Additional Benchmarks
Low Preset 1920x1080
81 [X] Asus ROG Zephyrus G14 AMD Ryzen 9 6900HS 3.3GHz
Radeon 680M
min:
72 fps
...
...
max:
...
...
max:
...
...
max:
...
...
max:
» With most tested laptops playable in detail settings med..
Additional Benchmarks
Low Preset 1920x1080
55 [X] Asus ROG Zephyrus G14 AMD Ryzen 9 6900HS 3.3GHz
Radeon 680M
min:
44 fps
...
max:
...
max:
...
max:
...
max:
Additional Benchmarks
Low Preset 1920x1080
0 (!) [X] Asus ROG Zephyrus G14 AMD Ryzen 9 6900HS 3.3GHz
Radeon 680M
...
0 100 200 300 400 500 600 700 800 900 1000 1100 1200 1300 1400 1500 1600 1700 1800 1900 2000 2100 2200 2300 2400 2500 2600 2700 2800 2900 3000 3100 3200 3300 3400 3500 3600 3700 3800 3900 4000 4100 4200 4300 4400 4500 4600 4700 4800 4900 5000 5100 5200 5300 5400 5500 5600 5700 5800 5900 6000 6100 6200 6300 6400 6500 6600 6700 6800 6900 7000 7100 7200 7300 7400 7500 7600 7700 7800 7900 8000 8100 8200 8300 8400 8500 8600 8700 8800 8900 9000 9100 9200 9300 9400 9500 9600 9700 9800 9900 Tooltip
...
...
...
...
...
...
» With all tested laptops playable in detail settings ultra.
Additional Benchmarks
Low Preset (DX12) 1920x1080
99 [X] Asus ROG Zephyrus G14 AMD Ryzen 9 6900HS 3.3GHz
Radeon 680M
min:
40.7 fps, P0.1:
40.7 fps, P1:
43 fps, max:
357 fps
0 Tooltip Mercury Series EM680: Ø29.6 (24-35)
Ace Magician AM08 Pro: Ø55.1 (41-86)
Swift Edge SFE16-42-R1GM: Ø60.6 (43-70)
Ace Magician AM08 Pro: Ø67.2 (55-81)
AS 6, R9 6900HX: Ø69.7 (60-81)
AM20: Ø71.8 (61-83)
GOD77: Ø75.4 (65-88)
Ace Magician AM08 Pro: Ø77.9 (67-92)
M600, 6900HX: Ø78.4 (68-91)
ROG Zephyrus Duo 16 GX650RX: Ø80.5 (69-95)
...
...
max:
0 Tooltip Mercury Series EM680: Ø18.8 (16-21)
Ace Magician AM08 Pro: Ø32.2 (23-45)
Swift Edge SFE16-42-R1GM: Ø34.7 (27-40)
Ace Magician AM08 Pro: Ø35.8 (31-41)
M600, 6900HX: Ø38.7 (34-45)
GOD77: Ø39 (31-43)
AM20: Ø40.6 (32-45)
AS 6, R9 6900HX: Ø41.8 (29-47)
Ace Magician AM08 Pro: Ø45.2 (40-52)
ROG Zephyrus Duo 16 GX650RX: Ø46 (41-52)
...
...
max:
0 Tooltip Mercury Series EM680: Ø16.1 (13-19)
Swift Edge SFE16-42-R1GM: Ø27.8 (21-32)
Ace Magician AM08 Pro: Ø30.2 (26-35)
M600, 6900HX: Ø33.1 (27-37)
GOD77: Ø34.1 (27-38)
AM20: Ø34.5 (31-38)
Ace Magician AM08 Pro: Ø34.8 (24-41)
AS 6, R9 6900HX: Ø35.3 (29-39)
ROG Zephyrus Duo 16 GX650RX: Ø38 (31-42)
Ace Magician AM08 Pro: Ø38.4 (34-43)
...
...
max:
13.3 26.3 [X] ACEMagician Ace Magician AM08 Pro AMD Ryzen 9 6900HX 3.3GHz
Radeon 680M
min:
22 fps, max:
30 fps
27.2 [X] ACEMagician Ace Magician AM08 Pro AMD Ryzen 9 6900HX 3.3GHz
Radeon 680M
min:
18 fps, max:
33 fps
28.6 29.7 29.7 31 [X] Asus ROG Zephyrus G14 AMD Ryzen 9 6900HS 3.3GHz
Radeon 680M
min:
25 fps
32 33.2 [X] Asus ROG Zephyrus Duo 16 GX650RX AMD Ryzen 9 6900HX 3.3GHz
Radeon 680M
min:
28 fps, max:
37 fps
~ 28 fps
+ Compare
- Hide Comparison
+ 📈 Graph
- 📈 Hide Graph
0 Tooltip Mercury Series EM680: Ø13.3 (7-16)
Ace Magician AM08 Pro: Ø26.3 (22-30)
Ace Magician AM08 Pro: Ø27.2 (18-33)
M600, 6900HX: Ø28.6 (24-33)
AS 6, R9 6900HX: Ø29.7 (23-34)
AM20: Ø29.7 (23-33)
Ace Magician AM08 Pro: Ø32 (23-35)
ROG Zephyrus Duo 16 GX650RX: Ø33.2 (28-37)
...
...
max:
0 Tooltip ROG Zephyrus Duo 16 GX650RX: Ø21.5 (20-24)
...
max:
0 Tooltip ROG Zephyrus Duo 16 GX650RX: Ø9.58 (8-11)
...
...
max:
» With most tested laptops playable in detail settings med..
Additional Benchmarks
Low Graphics Quality 1920x1080
51 [X] Asus ROG Zephyrus G14 AMD Ryzen 9 6900HS 3.3GHz
Radeon 680M
min:
46 fps
53.6 [X] Asus ROG Zephyrus Duo 16 GX650RX AMD Ryzen 9 6900HX 3.3GHz
Radeon 680M
min:
48 fps, max:
60 fps
41.6 [X] ACEMagician Ace Magician AM08 Pro 959964
AMD Ryzen 9 6900HX 3.3GHz
Radeon 680M
min:
33 fps, max:
51 fps
49.6 [X] ACEMagician Ace Magician AM08 Pro 959964
AMD Ryzen 9 6900HX 3.3GHz
Radeon 680M
min:
39 fps, max:
56 fps
...
...
...
...
...
max:
» With all tested laptops playable in detail settings med..
Additional Benchmarks
Low Preset 1920x1080
56.8 [X] Asus ROG Zephyrus G14 AMD Ryzen 9 6900HS 3.3GHz
Radeon 680M
min:
24 fps, P0.1:
31 fps, P1:
45.1 fps, max:
98.5 fps
...
...
max:
...
...
max:
...
max:
...
...
max:
» With all tested laptops playable in detail settings low.
Additional Benchmarks
Low Video Quality 1920x1080
38.7 [X] Asus ROG Zephyrus G14 AMD Ryzen 9 6900HS 3.3GHz
Radeon 680M
min:
18.1 fps, P0.1:
22.7 fps, P1:
30.4 fps, max:
128 fps
...
max:
...
...
...
» With all tested laptops playable in detail settings med..
Additional Benchmarks
Low Preset 1920x1080
43.5 [X] Asus ROG Zephyrus G14 AMD Ryzen 9 6900HS 3.3GHz
Radeon 680M
min:
11.6 fps, P0.1:
16.4 fps, P1:
22.9 fps, max:
96.3 fps
97 [X] Maxtang MTN-FP750 874931
AMD Ryzen 7 7735HS 3.2GHz
Radeon 680M
min:
74 fps, P1:
73 fps, max:
112 fps
99.6 103.2 133.1 133.3 140.5 152.9 155.3 155.7 156.3 [X] Aoostar GOD77 874931
AMD Ryzen 7 7735HS 3.2GHz
Radeon 680M
min:
124 fps, P1:
121 fps, max:
181 fps
156.5 163.8 [X] ACEMagician Ace Magician AM08 Pro 874931
AMD Ryzen 9 6900HX 3.3GHz
Radeon 680M
min:
131 fps, P1:
129 fps, max:
191 fps
168.1 [X] Acemagic AM20 874931
AMD Ryzen 7 7735H 3.2GHz
Radeon 680M
min:
139 fps, P1:
133 fps, max:
195 fps
175.3 184.4 184.5 [X] ACEMagician Ace Magician AM08 Pro 874931
AMD Ryzen 9 6900HX 3.3GHz
Radeon 680M
min:
148 fps, P1:
141 fps, max:
214 fps
186.3 191.6 193 [X] Asus ROG Zephyrus G14 AMD Ryzen 9 6900HS 3.3GHz
Radeon 680M
min:
157 fps
~ 154 fps
+ Compare
- Hide Comparison
...
...
max:
49.7 49.8 [X] Maxtang MTN-FP750 874931
AMD Ryzen 7 7735HS 3.2GHz
Radeon 680M
min:
41 fps, P1:
37 fps, max:
58 fps
57.8 67.7 70.8 73.4 [X] ACEMagician Ace Magician AM08 Pro 874931
AMD Ryzen 9 6900HX 3.3GHz
Radeon 680M
min:
50 fps, P1:
45 fps, max:
98 fps
75.1 76.7 77.8 [X] ACEMagician Ace Magician AM08 Pro 874931
AMD Ryzen 9 6900HX 3.3GHz
Radeon 680M
min:
62 fps, P1:
47 fps, max:
93 fps
79.3 [X] Aoostar GOD77 874931
AMD Ryzen 7 7735HS 3.2GHz
Radeon 680M
min:
63 fps, P1:
59 fps, max:
95 fps
82.1 82.1 82.9 85 [X] Acemagic AM20 874931
AMD Ryzen 7 7735H 3.2GHz
Radeon 680M
min:
70 fps, P1:
57 fps, max:
99 fps
86 88.4 90.5 92 [X] Asus ROG Zephyrus G14 AMD Ryzen 9 6900HS 3.3GHz
Radeon 680M
min:
65 fps
92.3 ~ 77 fps
+ Compare
- Hide Comparison
...
...
max:
26.8 [X] Acemagic AM20 874931
AMD Ryzen 7 7735H 3.2GHz
Radeon 680M
min:
18 fps, P1:
17 fps, max:
31 fps
36.4 [X] Maxtang MTN-FP750 874931
AMD Ryzen 7 7735HS 3.2GHz
Radeon 680M
min:
31 fps, P1:
27 fps, max:
41 fps
37 45.5 51.6 54.9 55.1 57.7 58.6 [X] Aoostar GOD77 874931
AMD Ryzen 7 7735HS 3.2GHz
Radeon 680M
min:
48 fps, P1:
46 fps, max:
65 fps
58.9 [X] ACEMagician Ace Magician AM08 Pro 874931
AMD Ryzen 9 6900HX 3.3GHz
Radeon 680M
min:
45 fps, P1:
41 fps, max:
65 fps
59.8 [X] ACEMagician Ace Magician AM08 Pro 874931
AMD Ryzen 9 6900HX 3.3GHz
Radeon 680M
min:
38 fps, P1:
37 fps, max:
74 fps
60.3 63.5 63.9 [X] Acemagic AM20 874931
AMD Ryzen 7 7735H 3.2GHz
Radeon 680M
min:
49 fps, P1:
40 fps, max:
72 fps
64.2 64.4 67 67.5 67.5 69 [X] Asus ROG Zephyrus G14 AMD Ryzen 9 6900HS 3.3GHz
Radeon 680M
min:
54 fps
~ 56 fps
+ Compare
- Hide Comparison
...
...
max:
...
...
max:
...
max:
» With most tested laptops playable in detail settings high.
Additional Benchmarks
Ultra Low Preset 1920x1080
124 [X] Asus ROG Zephyrus G14 AMD Ryzen 9 6900HS 3.3GHz
Radeon 680M
min:
99 fps
0 100 200 300 400 500 600 700 800 900 1000 1100 1200 1300 1400 1500 1600 1700 1800 1900 Tooltip
...
max:
...
...
...
...
...
...
max:
» With all tested laptops playable in detail settings med..
Additional Benchmarks
Low Preset 1920x1080
44 [X] Asus ROG Zephyrus G14 AMD Ryzen 9 6900HS 3.3GHz
Radeon 680M
min:
15.6 fps, P0.1:
19.4 fps, P1:
30.4 fps, max:
135 fps
...
...
...
...
» With all tested laptops playable in detail settings ultra.
...
max:
...
...
max:
...
...
max:
...
» With all tested laptops playable in detail settings ultra.
Additional Benchmarks
Prioritize Performance Preset 1920x1080
61.9 [X] Asus ROG Zephyrus G14 AMD Ryzen 9 6900HS 3.3GHz
Radeon 680M
min:
45.6 fps, P0.1:
48.2 fps, P1:
49.5 fps, max:
74.9 fps
...
max:
...
...
max:
...
...
max:
...
...
max:
» With all tested laptops playable in detail settings med..
Additional Benchmarks
Low Preset 1920x1080
51.9 [X] Asus ROG Zephyrus G14 AMD Ryzen 9 6900HS 3.3GHz
Radeon 680M
min:
28.6 fps, P0.1:
28.9 fps, P1:
31.2 fps, max:
174 fps
...
...
max:
...
...
max:
...
...
max:
...
...
max:
...
max:
...
max:
» With all tested laptops playable in detail settings ultra.
Additional Benchmarks
Minimum Settings 1920x1080
77.7 [X] Asus ROG Zephyrus G14 AMD Ryzen 9 6900HS 3.3GHz
Radeon 680M
80.8 [X] Asus ROG Zephyrus Duo 16 GX650RX AMD Ryzen 9 6900HX 3.3GHz
Radeon 680M
...
...
...
...
...
...
0 100 200 300 400 500 600 700 Tooltip
...
» With all tested laptops playable in detail settings low.
...
...
max:
...
...
max:
...
...
max:
...
...
max:
» With all tested laptops playable in detail settings med..
...
...
max:
...
...
max:
...
...
max:
...
...
max:
» With all tested laptops playable in detail settings med..
...
...
max:
...
...
max:
...
...
max:
...
max:
» With all tested laptops playable in detail settings med..
...
...
max:
...
...
max:
...
...
max:
...
...
max:
» With all tested laptops playable in detail settings ultra.
...
...
max:
...
...
max:
...
...
max:
» With all tested laptops playable in detail settings low.
...
...
max:
» With all tested laptops playable in detail settings low.
0 100 Tooltip : Ø109.9 (89.027-134.869)
...
max:
...
...
max:
...
...
max:
...
max:
» With all tested laptops playable in detail settings med..
...
...
max:
...
...
max:
...
...
max:
...
max:
» With all tested laptops playable in detail settings med..
...
...
max:
...
...
max:
...
...
max:
...
...
max:
» With all tested laptops playable in detail settings ultra.
...
...
max:
...
...
max:
...
...
max:
...
...
max:
» With most tested laptops playable in detail settings ultra.
...
...
max:
...
...
max:
...
...
max:
...
...
max:
» With most tested laptops playable in detail settings high.
...
max:
0 100 Tooltip : Ø162.5 (141.028-179.76)
...
...
max:
...
...
max:
0 100 200 300 400 500 600 Tooltip
...
...
max:
» With all tested laptops playable in detail settings ultra.
...
...
...
...
...
...
» With all tested laptops playable in detail settings med..
...
...
max:
...
...
max:
...
...
max:
...
...
max:
...
max:
...
...
max:
» With all tested laptops playable in detail settings low.
Additional Benchmarks
Very Low Overall Quality (DX11) 1920x1080
68.9 [X] Asus ROG Zephyrus Duo 16 GX650RX AMD Ryzen 9 6900HX 3.3GHz
Radeon 680M
50.3 [X] ACEMagician Ace Magician AM08 Pro 959964
AMD Ryzen 9 6900HX 3.3GHz
Radeon 680M
50.5 [X] ACEMagician Ace Magician AM08 Pro 959964
AMD Ryzen 9 6900HX 3.3GHz
Radeon 680M
0 100 Tooltip AS 6, R9 6900HX: Ø82.5 (64.154-107.1)
...
...
max:
0 Tooltip AS 6, R9 6900HX: Ø29.8 (25.169-50.7)
...
...
max:
0 100 200 300 Tooltip AS 6, R9 6900HX: Ø33 (18.214-344)
...
...
max:
0 100 200 300 400 Tooltip AS 6, R9 6900HX: Ø27.4 (12.004-487)
...
max:
0 100 Tooltip AS 6, R9 6900HX: Ø14.1 (5.002-136.6)
...
max:
» With all tested laptops playable in detail settings low.
...
...
max:
...
...
max:
...
...
max:
...
...
max:
» With all tested laptops playable in detail settings low.
0 Tooltip Mercury Series EM680: Ø36.1 (27-50)
MTN-FP750: Ø40.3 (23-51)
Swift Edge SFE16-42-R1GM: Ø52.1 (41-68)
Ace Magician AM08 Pro: Ø58.2 (45-76)
AS 6, R9 6900HX: Ø57.9 (46-75)
GOD77: Ø60 (48-78)
AM20: Ø60.8 (48-80)
Ace Magician AM08 Pro: Ø63.3 (50-81)
Ace Magician AM08 Pro: Ø64.2 (49-83)
Venus Series UM690: Ø65.3 (50-87)
M600, 6900HX: Ø66.1 (50-88)
...
...
max:
0 Tooltip MTN-FP750: Ø23 (19-27)
Mercury Series EM680: Ø24.6 (21-32)
Swift Edge SFE16-42-R1GM: Ø30.2 (20-37)
Ace Magician AM08 Pro: Ø31.4 (19-48)
Ace Magician AM08 Pro: Ø33.9 (28-42)
GOD77: Ø37.9 (31-46)
Venus Series UM690: Ø39.1 (31-49)
M600, 6900HX: Ø39 (32-47)
AS 6, R9 6900HX: Ø38.5 (32-49)
AM20: Ø38.6 (31-50)
Ace Magician AM08 Pro: Ø40.9 (32-51)
...
...
max:
0 Tooltip MTN-FP750: Ø21.1 (8-26)
Mercury Series EM680: Ø23.3 (19-31)
Swift Edge SFE16-42-R1GM: Ø28.7 (23-36)
Ace Magician AM08 Pro: Ø31.6 (19-40)
GOD77: Ø35.5 (29-43)
AS 6, R9 6900HX: Ø36.3 (29-47)
Venus Series UM690: Ø36.6 (17-46)
M600, 6900HX: Ø36.5 (29-45)
Ace Magician AM08 Pro: Ø36.6 (22-48)
AM20: Ø36.6 (30-48)
Ace Magician AM08 Pro: Ø38.7 (31-49)
...
...
max:
0 Tooltip MTN-FP750: Ø20.2 (15-25)
Mercury Series EM680: Ø21.4 (17-29)
Ace Magician AM08 Pro: Ø26.1 (15-37)
Swift Edge SFE16-42-R1GM: Ø26.1 (19-33)
Ace Magician AM08 Pro: Ø32.4 (17-46)
GOD77: Ø33.2 (25-41)
Venus Series UM690: Ø34.1 (24-45)
M600, 6900HX: Ø34.4 (26-42)
AS 6, R9 6900HX: Ø33.5 (25-45)
AM20: Ø33.6 (26-46)
Ace Magician AM08 Pro: Ø35.6 (28-47)
...
...
max:
» With all tested laptops playable in detail settings low.
...
...
max:
...
...
max:
...
...
max:
...
...
max:
» With all tested laptops playable in detail settings low.
...
...
max:
...
...
max:
...
...
max:
...
...
max:
» With all tested laptops playable in detail settings low.
Additional Benchmarks
Lowest Preset 1920x1080
35.5 [X] ACEMagician Ace Magician AM08 Pro 959964
AMD Ryzen 9 6900HX 3.3GHz
Radeon 680M
max:
63.4 fps
40.7 [X] ACEMagician Ace Magician AM08 Pro 959964
AMD Ryzen 9 6900HX 3.3GHz
Radeon 680M
max:
79.1 fps
72.9 [X] HP EliteBook 865 G9 1.47.22.14 D3D12
AMD Ryzen 7 PRO 6850U 2.7GHz
Radeon 680M
min:
53.9 fps, P1:
63.8 fps, max:
99.5 fps
78.2 78.4 [X] Maxtang MTN-FP750 1.47.22.14 D3D12
AMD Ryzen 7 7735HS 3.2GHz
Radeon 680M
min:
57.8 fps, P1:
65.5 fps, max:
104.8 fps
84.5 106.8 115.6 [X] HP EliteBook 835 G9 1.47.22.14 D3D12
AMD Ryzen 7 PRO 6850U 2.7GHz
Radeon 680M
min:
19.1 fps, P1:
97.6 fps, max:
317 fps
125.1 128.9 131.3 132.2 133.5 133.7 135.7 [X] ACEMagician Ace Magician AM08 Pro 1.47.22.14 D3D12
AMD Ryzen 9 6900HX 3.3GHz
Radeon 680M
min:
74.4 fps, P1:
113.8 fps, max:
199.2 fps
137.5 [X] Aoostar GOD77 1.47.22.14 D3D12
AMD Ryzen 7 7735HS 3.2GHz
Radeon 680M
min:
81.3 fps, P1:
118.1 fps, max:
222 fps
137.8 139 140.4 [X] Morefine M600, 6900HX 1.47.22.14 D3D12
AMD Ryzen 9 6900HX 3.3GHz
Radeon 680M
min:
67.6 fps, P1:
120.3 fps, max:
183.8 fps
140.5 140.6 140.9 [X] ACEMagician Ace Magician AM08 Pro 1.47.22.14 D3D12
AMD Ryzen 9 6900HX 3.3GHz
Radeon 680M
min:
83.6 fps, P1:
113.1 fps, max:
195.1 fps
141.9 [X] Beelink SER6 Pro 1.47.22.14 D3D12
AMD Ryzen 7 6800H 3.2GHz
Radeon 680M
min:
78.6 fps, P1:
116.6 fps, max:
209 fps
142.4 [X] Beelink GTR6 1.47.22.14 D3D12
AMD Ryzen 9 6900HX 3.3GHz
Radeon 680M
min:
86.5 fps, P1:
118 fps, max:
207 fps
143 [X] Asus ROG Zephyrus G14 AMD Ryzen 9 6900HS 3.3GHz
Radeon 680M
143.5 [X] One Netbook XPlayer 2 1.47.22.14 D3D12
AMD Ryzen 7 6800U 2.7GHz
Radeon 680M
min:
84.4 fps, P1:
110.5 fps, max:
225 fps
145.7 [X] GPD Win 4 1.47.22.14 D3D12
AMD Ryzen 7 6800U 2.7GHz
Radeon 680M
min:
66.5 fps, P1:
114.1 fps, max:
227 fps
146.2 [X] Aokzoe A1 1.47.22.14 D3D12
AMD Ryzen 7 6800U 2.7GHz
Radeon 680M
min:
90.2 fps, P1:
115 fps, max:
217 fps
147.3 [X] GMK NucBox K2 1.47.22.14 D3D12
AMD Ryzen 7 7735HS 3.2GHz
Radeon 680M
min:
85.9 fps, P1:
124 fps, max:
206 fps
148.9 [X] Acemagic AM20 1.47.22.14 D3D12
AMD Ryzen 7 7735H 3.2GHz
Radeon 680M
min:
66.1 fps, P1:
117.4 fps, max:
232 fps
149.9 155.8 [X] HP Dragonfly Pro 2023 1.47.22.14 D3D12
AMD Ryzen 7 7736U 2.7GHz
Radeon 680M
min:
57.1 fps, P1:
120.1 fps, max:
231 fps
167.5 ~ 131 fps
+ Compare
- Hide Comparison
...
...
max:
30 [X] HP EliteBook 865 G9 1.47.22.14 D3D12
AMD Ryzen 7 PRO 6850U 2.7GHz
Radeon 680M
min:
25 fps, P1:
26.2 fps, max:
40.8 fps
31.1 31.4 [X] Maxtang MTN-FP750 1.47.22.14 D3D12
AMD Ryzen 7 7735HS 3.2GHz
Radeon 680M
min:
26.4 fps, P1:
27.4 fps, max:
41.4 fps
46.2 49 [X] HP EliteBook 835 G9 1.47.22.14 D3D12
AMD Ryzen 7 PRO 6850U 2.7GHz
Radeon 680M
min:
11.8 fps, P1:
43.7 fps, max:
229 fps
49.1 54.2 [X] ACEMagician Ace Magician AM08 Pro 1.47.22.14 D3D12
AMD Ryzen 9 6900HX 3.3GHz
Radeon 680M
min:
43.1 fps, P1:
48.2 fps, max:
72 fps
54.2 [X] Aoostar GOD77 1.47.22.14 D3D12
AMD Ryzen 7 7735HS 3.2GHz
Radeon 680M
min:
43.3 fps, P1:
47.6 fps, max:
83.8 fps
54.3 54.4 54.7 54.7 55.2 55.3 55.8 56 [X] GMK NucBox K2 1.47.22.14 D3D12
AMD Ryzen 7 7735HS 3.2GHz
Radeon 680M
min:
46.4 fps, P1:
49.2 fps, max:
71.6 fps
56.4 56.4 [X] ACEMagician Ace Magician AM08 Pro 1.47.22.14 D3D12
AMD Ryzen 9 6900HX 3.3GHz
Radeon 680M
min:
27.7 fps, P1:
30 fps, max:
75.1 fps
56.7 [X] One Netbook XPlayer 2 1.47.22.14 D3D12
AMD Ryzen 7 6800U 2.7GHz
Radeon 680M
min:
45.2 fps, P1:
47.9 fps, max:
78.2 fps
57 [X] Asus ROG Zephyrus G14 AMD Ryzen 9 6900HS 3.3GHz
Radeon 680M
57.4 [X] Beelink GTR6 1.47.22.14 D3D12
AMD Ryzen 9 6900HX 3.3GHz
Radeon 680M
min:
43.4 fps, P1:
51 fps, max:
83.4 fps
57.5 [X] GPD Win 4 1.47.22.14 D3D12
AMD Ryzen 7 6800U 2.7GHz
Radeon 680M
min:
44.8 fps, P1:
50.9 fps, max:
79.2 fps
57.7 [X] HP Dragonfly Pro 2023 1.47.22.14 D3D12
AMD Ryzen 7 7736U 2.7GHz
Radeon 680M
min:
33.3 fps, P1:
50.4 fps, max:
159.7 fps
57.8 [X] Beelink SER6 Pro 1.47.22.14 D3D12
AMD Ryzen 7 6800H 3.2GHz
Radeon 680M
min:
43.1 fps, P1:
50.8 fps, max:
82.9 fps
57.8 58 58.4 59 60.5 [X] Acemagic AM20 1.47.22.14 D3D12
AMD Ryzen 7 7735H 3.2GHz
Radeon 680M
min:
41.9 fps, P1:
54.2 fps, max:
86.2 fps
61.7 [X] Aokzoe A1 1.47.22.14 D3D12
AMD Ryzen 7 6800U 2.7GHz
Radeon 680M
min:
40.8 fps, P1:
54.1 fps, max:
95.7 fps
63 ~ 54 fps
+ Compare
- Hide Comparison
...
...
max:
25.3 [X] HP EliteBook 865 G9 1.47.22.14 D3D12
AMD Ryzen 7 PRO 6850U 2.7GHz
Radeon 680M
min:
15.7 fps, P1:
19.4 fps, max:
80.5 fps
26.4 26.7 [X] Maxtang MTN-FP750 1.47.22.14 D3D12
AMD Ryzen 7 7735HS 3.2GHz
Radeon 680M
min:
16.9 fps, P1:
20.7 fps, max:
76.6 fps
39.4 39.9 40.9 [X] HP EliteBook 835 G9 1.47.22.14 D3D12
AMD Ryzen 7 PRO 6850U 2.7GHz
Radeon 680M
min:
7.7 fps, P1:
28.8 fps, max:
290 fps
41.8 [X] ACEMagician Ace Magician AM08 Pro 1.47.22.14 D3D12
AMD Ryzen 9 6900HX 3.3GHz
Radeon 680M
min:
21.5 fps, P1:
22.2 fps, max:
64.4 fps
43.2 [X] ACEMagician Ace Magician AM08 Pro 1.47.22.14 D3D12
AMD Ryzen 9 6900HX 3.3GHz
Radeon 680M
min:
21 fps, P1:
23.2 fps, max:
69.6 fps
44.8 44.9 45 [X] Aoostar GOD77 1.47.22.14 D3D12
AMD Ryzen 7 7735HS 3.2GHz
Radeon 680M
min:
34.5 fps, P1:
35.8 fps, max:
86.5 fps
45.1 45.4 45.9 [X] GMK NucBox K2 1.47.22.14 D3D12
AMD Ryzen 7 7735HS 3.2GHz
Radeon 680M
min:
25.6 fps, P1:
35.7 fps, max:
140.8 fps
46 46.5 46.6 46.8 47 [X] One Netbook XPlayer 2 1.47.22.14 D3D12
AMD Ryzen 7 6800U 2.7GHz
Radeon 680M
min:
35.1 fps, P1:
37.5 fps, max:
71.5 fps
47.1 47.8 [X] GPD Win 4 1.47.22.14 D3D12
AMD Ryzen 7 6800U 2.7GHz
Radeon 680M
min:
34.2 fps, P1:
37.7 fps, max:
65.9 fps
47.9 48 [X] Asus ROG Zephyrus G14 AMD Ryzen 9 6900HS 3.3GHz
Radeon 680M
48 48.1 48.5 [X] Beelink GTR6 1.47.22.14 D3D12
AMD Ryzen 9 6900HX 3.3GHz
Radeon 680M
min:
35.1 fps, P1:
38.2 fps, max:
66 fps
48.6 [X] Beelink SER6 Pro 1.47.22.14 D3D12
AMD Ryzen 7 6800H 3.2GHz
Radeon 680M
min:
34.2 fps, P1:
38.3 fps, max:
86.4 fps
49.1 49.5 [X] Acemagic AM20 1.47.22.14 D3D12
AMD Ryzen 7 7735H 3.2GHz
Radeon 680M
min:
29.9 fps, P1:
38 fps, max:
105.8 fps
50.6 [X] Aokzoe A1 1.47.22.14 D3D12
AMD Ryzen 7 6800U 2.7GHz
Radeon 680M
min:
31 fps, P1:
39.2 fps, max:
80.4 fps
53.1 ~ 44 fps
+ Compare
- Hide Comparison
...
...
max:
22 [X] HP EliteBook 865 G9 1.47.22.14 D3D12
AMD Ryzen 7 PRO 6850U 2.7GHz
Radeon 680M
min:
14 fps, P1:
15.9 fps, max:
43.9 fps
22.6 23.1 [X] Maxtang MTN-FP750 1.47.22.14 D3D12
AMD Ryzen 7 7735HS 3.2GHz
Radeon 680M
min:
5.3 fps, P1:
7.5 fps, max:
262 fps
33.2 [X] ACEMagician Ace Magician AM08 Pro 1.47.22.14 D3D12
AMD Ryzen 9 6900HX 3.3GHz
Radeon 680M
min:
18.2 fps, P1:
19.5 fps, max:
84 fps
34.1 34.1 [X] ACEMagician Ace Magician AM08 Pro 1.47.22.14 D3D12
AMD Ryzen 9 6900HX 3.3GHz
Radeon 680M
min:
17.7 fps, P1:
19.4 fps, max:
59.3 fps
34.2 34.3 [X] HP EliteBook 835 G9 1.47.22.14 D3D12
AMD Ryzen 7 PRO 6850U 2.7GHz
Radeon 680M
min:
6.5 fps, P1:
8.29 fps, max:
298 fps
36.4 38.3 38.9 39.1 [X] Aoostar GOD77 1.47.22.14 D3D12
AMD Ryzen 7 7735HS 3.2GHz
Radeon 680M
min:
19 fps, P1:
24.6 fps, max:
169.6 fps
39.2 39.9 40.1 40.2 40.4 40.7 40.9 [X] One Netbook XPlayer 2 1.47.22.14 D3D12
AMD Ryzen 7 6800U 2.7GHz
Radeon 680M
min:
31.9 fps, P1:
32.9 fps, max:
56.5 fps
41 [X] Asus ROG Zephyrus G14 AMD Ryzen 9 6900HS 3.3GHz
Radeon 680M
41 41.3 41.5 [X] GPD Win 4 1.47.22.14 D3D12
AMD Ryzen 7 6800U 2.7GHz
Radeon 680M
min:
29 fps, P1:
31.8 fps, max:
63.3 fps
41.6 [X] Beelink GTR6 1.47.22.14 D3D12
AMD Ryzen 9 6900HX 3.3GHz
Radeon 680M
min:
26.5 fps, P1:
33 fps, max:
91.3 fps
41.8 41.9 [X] Beelink SER6 Pro 1.47.22.14 D3D12
AMD Ryzen 7 6800H 3.2GHz
Radeon 680M
min:
32.6 fps, P1:
33.4 fps, max:
69.2 fps
42.5 [X] GMK NucBox K2 1.47.22.14 D3D12
AMD Ryzen 7 7735HS 3.2GHz
Radeon 680M
min:
15.8 fps, P1:
22.3 fps, max:
206 fps
42.5 [X] Acemagic AM20 1.47.22.14 D3D12
AMD Ryzen 7 7735H 3.2GHz
Radeon 680M
min:
28.1 fps, P1:
30.2 fps, max:
102.4 fps
42.7 43.4 [X] Aokzoe A1 1.47.22.14 D3D12
AMD Ryzen 7 6800U 2.7GHz
Radeon 680M
min:
18.1 fps, P1:
25.6 fps, max:
83.5 fps
44.2 ~ 38 fps
+ Compare
- Hide Comparison
...
...
max:
...
max:
...
...
max:
» With most tested laptops playable in detail settings ultra.
0 Tooltip Mercury Series EM680: Ø41.2 (35-52)
MTN-FP750: Ø46.4 (37-54)
Ace Magician AM08 Pro: Ø53.5 (45-61)
EliteBook 835 G9: Ø56.1 (46-64)
Swift Edge SFE16-42-R1GM: Ø59.2 (42-73)
ThinkPad P14s G3 AMD 21J6S05000: Ø59.6 (51-70)
A1: Ø62.2 (51-72)
AM20: Ø67.5 (61-76)
GOD77: Ø67.2 (57-83)
AS 6, R9 6900HX: Ø67.9 (58-84)
NucBox K2: Ø68.7 (62-78)
Venus Series UM690: Ø71.3 (39-85)
Ace Magician AM08 Pro: Ø71.8 (65-82)
Ace Magician AM08 Pro: Ø72.7 (65-88)
M600, 6900HX: Ø75 (60-93)
VivoBook S15 M3502RA-L1029W: Ø77.4 (66-93)
...
...
max:
0 Tooltip Ace Magician AM08 Pro: Ø25.2 (17-41)
MTN-FP750: Ø24.8 (22-30)
Mercury Series EM680: Ø26.4 (23-32)
EliteBook 835 G9: Ø32.9 (13-39)
Swift Edge SFE16-42-R1GM: Ø33 (6-41)
ThinkPad P14s G3 AMD 21J6S05000: Ø37.6 (33-44)
A1: Ø38.1 (17-47)
GOD77: Ø39.1 (35-48)
VivoBook S15 M3502RA-L1029W: Ø40.8 (37-48)
M600, 6900HX: Ø41.5 (37-51)
AS 6, R9 6900HX: Ø41.3 (35-48)
NucBox K2: Ø41.4 (36-49)
AM20: Ø41.2 (37-47)
Venus Series UM690: Ø42.5 (36-52)
Ace Magician AM08 Pro: Ø43.3 (37-54)
Ace Magician AM08 Pro: Ø42.6 (36-49)
...
...
max:
0 Tooltip MTN-FP750: Ø21.8 (19-26)
Mercury Series EM680: Ø24.3 (21-30)
Ace Magician AM08 Pro: Ø25.7 (22-35)
EliteBook 835 G9: Ø30.6 (12-37)
Swift Edge SFE16-42-R1GM: Ø30.7 (10-38)
M600, 6900HX: Ø34.2 (30-42)
ThinkPad P14s G3 AMD 21J6S05000: Ø35 (30-42)
A1: Ø35 (21-43)
GOD77: Ø35.3 (31-43)
Ace Magician AM08 Pro: Ø36.7 (27-47)
VivoBook S15 M3502RA-L1029W: Ø38.1 (34-46)
AS 6, R9 6900HX: Ø38.5 (32-44)
NucBox K2: Ø38.3 (33-45)
AM20: Ø38.1 (35-43)
Venus Series UM690: Ø38.7 (34-45)
Ace Magician AM08 Pro: Ø40.2 (35-49)
...
...
max:
0 Tooltip MTN-FP750: Ø20.7 (17-25)
Mercury Series EM680: Ø22.9 (20-28)
Ace Magician AM08 Pro: Ø24.3 (18-32)
Swift Edge SFE16-42-R1GM: Ø28.3 (17-36)
EliteBook 835 G9: Ø29.1 (25-34)
Ace Magician AM08 Pro: Ø31.3 (22-43)
ThinkPad P14s G3 AMD 21J6S05000: Ø33 (28-40)
A1: Ø33.5 (28-41)
GOD77: Ø33.7 (30-41)
VivoBook S15 M3502RA-L1029W: Ø35.5 (30-43)
M600, 6900HX: Ø35.7 (32-44)
AS 6, R9 6900HX: Ø36.2 (29-42)
NucBox K2: Ø36.1 (31-43)
AM20: Ø36 (30-41)
Venus Series UM690: Ø37.4 (32-46)
Ace Magician AM08 Pro: Ø37.9 (33-45)
...
...
max:
...
max:
» With most tested laptops playable in detail settings med..
Additional Benchmarks
Low Preset TAA 1920x1080
51 [X] Asus ROG Zephyrus G14 AMD Ryzen 9 6900HS 3.3GHz
Radeon 680M
min:
45 fps
31 [X] ACEMagician Ace Magician AM08 Pro 959964
AMD Ryzen 9 6900HX 3.3GHz
Radeon 680M
min:
22 fps, max:
40 fps
48 [X] ACEMagician Ace Magician AM08 Pro 959964
AMD Ryzen 9 6900HX 3.3GHz
Radeon 680M
min:
40 fps, max:
58 fps
...
...
max:
...
...
max:
...
...
max:
...
...
max:
» With most tested laptops playable in detail settings high.
...
...
max:
...
...
max:
...
...
max:
...
...
max:
» With most tested laptops playable in detail settings low.
34.4 [X] Lenovo ThinkPad T16 G1 21CHCTO1WW AMD Ryzen 7 PRO 6850U 2.7GHz
Radeon 680M
min:
33 fps, max:
-1 fps
37.2 62.4 90.2 93.7 107.7 108.3 [X] Aokzoe A1 AMD Ryzen 7 6800U 2.7GHz
Radeon 680M
min:
95.6 fps, max:
-1 fps
108.9 109.1 110.2 110.3 [X] Asus ZenBook 13 OLED UM5302T AMD Ryzen 7 6800U 2.7GHz
Radeon 680M
min:
94.8 fps, max:
-1 fps
110.5 111.2 111.4 112.9 113.1 [X] Geekom AS 6, R7 6800H AMD Ryzen 7 6800H 3.2GHz
Radeon 680M
min:
94 fps, max:
-1 fps
114.6 115.8 116.5 118.8 119.9 120.2 [X] GPD Win 4 AMD Ryzen 7 6800U 2.7GHz
Radeon 680M
min:
104.3 fps, max:
-1 fps
125.7 [X] Acemagic AM20 AMD Ryzen 7 7735H 3.2GHz
Radeon 680M
min:
106.9 fps, max:
-1 fps
132.9 [X] ACEMagician Ace Magician AM08 Pro AMD Ryzen 9 6900HX 3.3GHz
Radeon 680M
min:
110 fps, max:
-1 fps
133.4 136.8 137.9 [X] ACEMagician Ace Magician AM08 Pro AMD Ryzen 9 6900HX 3.3GHz
Radeon 680M
min:
122.9 fps, max:
-1 fps
140.9 [X] Aoostar GOD77 AMD Ryzen 7 7735HS 3.2GHz
Radeon 680M
min:
120.9 fps, max:
-1 fps
141.2 [X] GMK NucBox K2 AMD Ryzen 7 7735HS 3.2GHz
Radeon 680M
min:
122.4 fps, max:
-1 fps
141.9 [X] Beelink GTR6 AMD Ryzen 9 6900HX 3.3GHz
Radeon 680M
min:
121.4 fps, max:
-1 fps
142.2 143 143.3 ~ 114 fps
+ Compare
- Hide Comparison
...
...
max:
33.3 [X] Lenovo ThinkPad T16 G1 21CHCTO1WW AMD Ryzen 7 PRO 6850U 2.7GHz
Radeon 680M
min:
31.8 fps, max:
-1 fps
36.7 57.3 82.5 83.5 84.7 86.7 87.4 89.6 [X] Geekom AS 6, R7 6800H AMD Ryzen 7 6800H 3.2GHz
Radeon 680M
min:
75.6 fps, max:
-1 fps
90.4 91.4 91.8 93.6 [X] Asus ZenBook 13 OLED UM5302T AMD Ryzen 7 6800U 2.7GHz
Radeon 680M
min:
77.6 fps, max:
-1 fps
96 96.3 [X] Aokzoe A1 AMD Ryzen 7 6800U 2.7GHz
Radeon 680M
min:
83.8 fps, max:
-1 fps
96.9 97.2 97.6 98 100.1 [X] GPD Win 4 AMD Ryzen 7 6800U 2.7GHz
Radeon 680M
min:
86.2 fps, max:
-1 fps
101.7 102.8 104.5 104.7 [X] ACEMagician Ace Magician AM08 Pro AMD Ryzen 9 6900HX 3.3GHz
Radeon 680M
min:
88.3 fps, max:
-1 fps
110.4 111.3 [X] ACEMagician Ace Magician AM08 Pro AMD Ryzen 9 6900HX 3.3GHz
Radeon 680M
min:
96.8 fps, max:
-1 fps
112.7 [X] Beelink GTR6 AMD Ryzen 9 6900HX 3.3GHz
Radeon 680M
min:
95 fps, max:
-1 fps
113.4 113.5 113.5 [X] GMK NucBox K2 AMD Ryzen 7 7735HS 3.2GHz
Radeon 680M
min:
96.1 fps, max:
-1 fps
114.6 115.1 [X] Aoostar GOD77 AMD Ryzen 7 7735HS 3.2GHz
Radeon 680M
min:
100.7 fps, max:
-1 fps
121.4 ~ 95 fps
+ Compare
- Hide Comparison
...
...
max:
33.2 [X] Lenovo ThinkPad T16 G1 21CHCTO1WW AMD Ryzen 7 PRO 6850U 2.7GHz
Radeon 680M
min:
31.8 fps, max:
-1 fps
36.2 44.8 54.9 55 60.5 66.3 66.8 [X] Geekom AS 6, R7 6800H AMD Ryzen 7 6800H 3.2GHz
Radeon 680M
min:
56.9 fps, max:
-1 fps
67.4 69.2 69.6 69.7 69.8 [X] Asus ZenBook 13 OLED UM5302T AMD Ryzen 7 6800U 2.7GHz
Radeon 680M
min:
59.9 fps, max:
-1 fps
71.7 72.2 72.3 72.8 73 [X] Aokzoe A1 AMD Ryzen 7 6800U 2.7GHz
Radeon 680M
min:
67.5 fps, max:
-1 fps
73.3 [X] ACEMagician Ace Magician AM08 Pro AMD Ryzen 9 6900HX 3.3GHz
Radeon 680M
min:
63.4 fps, max:
-1 fps
74 76.4 [X] GPD Win 4 AMD Ryzen 7 6800U 2.7GHz
Radeon 680M
min:
67.4 fps, max:
-1 fps
76.6 78.6 [X] ACEMagician Ace Magician AM08 Pro AMD Ryzen 9 6900HX 3.3GHz
Radeon 680M
min:
69 fps, max:
-1 fps
79.5 80.9 [X] Beelink GTR6 AMD Ryzen 9 6900HX 3.3GHz
Radeon 680M
min:
71.6 fps, max:
-1 fps
81.3 82.2 83.9 84.2 [X] GMK NucBox K2 AMD Ryzen 7 7735HS 3.2GHz
Radeon 680M
min:
74.4 fps, max:
-1 fps
84.3 85.3 89.1 89.1 [X] Aoostar GOD77 AMD Ryzen 7 7735HS 3.2GHz
Radeon 680M
min:
81.8 fps, max:
-1 fps
~ 71 fps
+ Compare
- Hide Comparison
...
...
max:
33.2 [X] Lenovo ThinkPad T16 G1 21CHCTO1WW AMD Ryzen 7 PRO 6850U 2.7GHz
Radeon 680M
min:
31.8 fps, max:
-1 fps
36 42 47.4 48 53.1 56.6 57.7 [X] Asus ZenBook 13 OLED UM5302T AMD Ryzen 7 6800U 2.7GHz
Radeon 680M
min:
50 fps, max:
-1 fps
57.8 60.2 [X] Geekom AS 6, R7 6800H AMD Ryzen 7 6800H 3.2GHz
Radeon 680M
min:
51.5 fps, max:
-1 fps
60.5 60.6 61 62.2 62.7 63.1 63.1 64.2 65 [X] ACEMagician Ace Magician AM08 Pro AMD Ryzen 9 6900HX 3.3GHz
Radeon 680M
min:
57.1 fps, max:
-1 fps
65.7 67.2 [X] GPD Win 4 AMD Ryzen 7 6800U 2.7GHz
Radeon 680M
min:
58.9 fps, max:
-1 fps
69.2 69.7 [X] Aokzoe A1 AMD Ryzen 7 6800U 2.7GHz
Radeon 680M
min:
64 fps, max:
-1 fps
70.2 [X] ACEMagician Ace Magician AM08 Pro AMD Ryzen 9 6900HX 3.3GHz
Radeon 680M
min:
62 fps, max:
-1 fps
70.9 71.4 [X] Beelink GTR6 AMD Ryzen 9 6900HX 3.3GHz
Radeon 680M
min:
62.3 fps, max:
-1 fps
71.8 72.8 73.1 73.6 73.7 [X] GMK NucBox K2 AMD Ryzen 7 7735HS 3.2GHz
Radeon 680M
min:
65.4 fps, max:
-1 fps
75.2 84.9 [X] Aoostar GOD77 AMD Ryzen 7 7735HS 3.2GHz
Radeon 680M
min:
77.4 fps, max:
-1 fps
~ 63 fps
+ Compare
- Hide Comparison
...
...
max:
9.8 9.8 [X] Geekom AS 6, R7 6800H AMD Ryzen 7 6800H 3.2GHz
Radeon 680M
min:
6.6 fps, max:
-1 fps
26.5 [X] Lenovo ThinkPad T16 G1 21CHCTO1WW AMD Ryzen 7 PRO 6850U 2.7GHz
Radeon 680M
min:
25.1 fps, max:
-1 fps
~ 15 fps
+ Compare
- Hide Comparison
...
...
max:
» With most tested laptops playable in detail settings ultra.
67.4 73 [X] Maxtang MTN-FP750 AMD Ryzen 7 7735HS 3.2GHz
Radeon 680M
min:
13.3 fps, P0.1:
24.8 fps, P1:
40.9 fps, max:
306 fps
74 94.2 [X] ACEMagician Ace Magician AM08 Pro AMD Ryzen 9 6900HX 3.3GHz
Radeon 680M
94.3 [X] GPD Win 4 AMD Ryzen 7 6800U 2.7GHz
Radeon 680M
min:
68 fps, max:
104 fps
97.3 [X] ACEMagician Ace Magician AM08 Pro AMD Ryzen 9 6900HX 3.3GHz
Radeon 680M
104.3 107.7 108 [X] HP EliteBook 835 G9 AMD Ryzen 7 PRO 6850U 2.7GHz
Radeon 680M
min:
10.3 fps, P0.1:
32.8 fps, P1:
68.8 fps, max:
195.9 fps
108.2 [X] Aokzoe A1 AMD Ryzen 7 6800U 2.7GHz
Radeon 680M
min:
66 fps, max:
133 fps
111.1 113.9 115.6 116.4 [X] Acemagic AM20 AMD Ryzen 7 7735H 3.2GHz
Radeon 680M
min:
10.1 fps, P0.1:
21.9 fps, P1:
75.6 fps, max:
321 fps
117 119.3 [X] Aoostar GOD77 AMD Ryzen 7 7735HS 3.2GHz
Radeon 680M
min:
5.54 fps, P0.1:
30 fps, P1:
77.7 fps, max:
421 fps
119.7 121.6 123 125 126 130.7 131 131.8 132.8 133 [X] Asus ROG Zephyrus G14 AMD Ryzen 9 6900HS 3.3GHz
Radeon 680M
min:
114 fps
138.1 139.2 [X] Beelink GTR6 AMD Ryzen 9 6900HX 3.3GHz
Radeon 680M
min:
119 fps, max:
149 fps
150 ~ 115 fps
+ Compare
- Hide Comparison
+ 📈 Graph
- 📈 Hide Graph
0 100 200 300 400 500 600 700 Tooltip MTN-FP750: Ø92.6 (66.032-564)
EliteBook 835 G9: Ø135.5 (93.307-761)
SER6 Pro Ryzen 7 7735HS: Ø109.5 (15-126)
AM20: Ø123.6 (96.401-272.2)
GOD77: Ø125.5 (86.012-226.3)
...
...
max:
44.5 46.7 [X] Maxtang MTN-FP750 AMD Ryzen 7 7735HS 3.2GHz
Radeon 680M
min:
8.69 fps, P0.1:
18.5 fps, P1:
37 fps, max:
106.1 fps
47.2 [X] ACEMagician Ace Magician AM08 Pro AMD Ryzen 9 6900HX 3.3GHz
Radeon 680M
47.7 51.4 [X] Acemagic AM20 AMD Ryzen 7 7735H 3.2GHz
Radeon 680M
min:
16.6 fps, P0.1:
27.5 fps, P1:
43.3 fps, max:
149.4 fps
58.5 [X] ACEMagician Ace Magician AM08 Pro AMD Ryzen 9 6900HX 3.3GHz
Radeon 680M
63.8 [X] GPD Win 4 AMD Ryzen 7 6800U 2.7GHz
Radeon 680M
min:
51 fps, max:
71 fps
65.8 66 [X] HP EliteBook 835 G9 AMD Ryzen 7 PRO 6850U 2.7GHz
Radeon 680M
min:
20.2 fps, P0.1:
26.3 fps, P1:
44.8 fps, max:
162.7 fps
72.7 75.9 76 76.6 [X] Aoostar GOD77 AMD Ryzen 7 7735HS 3.2GHz
Radeon 680M
min:
20.1 fps, P0.1:
52.2 fps, P1:
62.8 fps, max:
181.9 fps
77 78 79 79.8 81.4 82.9 84 [X] Beelink GTR6 AMD Ryzen 9 6900HX 3.3GHz
Radeon 680M
min:
77 fps, max:
90 fps
85 [X] Asus ROG Zephyrus G14 AMD Ryzen 9 6900HS 3.3GHz
Radeon 680M
min:
76 fps
85.1 ~ 69 fps
+ Compare
- Hide Comparison
+ 📈 Graph
- 📈 Hide Graph
0 100 Tooltip MTN-FP750: Ø52.7 (44.094-120.6)
AM20: Ø57 (48.014-136)
Win 4: Ø67 (8-82)
EliteBook 835 G9: Ø70 (54.024-100.9)
GOD77: Ø82.3 (72.013-184.9)
SER6 Pro: Ø77.6 (18-84)
...
...
max:
22.3 23 23.7 [X] Maxtang MTN-FP750 AMD Ryzen 7 7735HS 3.2GHz
Radeon 680M
min:
12.8 fps, P0.1:
13.7 fps, P1:
19 fps, max:
78.4 fps
24.2 [X] ACEMagician Ace Magician AM08 Pro AMD Ryzen 9 6900HX 3.3GHz
Radeon 680M
29.3 [X] ACEMagician Ace Magician AM08 Pro AMD Ryzen 9 6900HX 3.3GHz
Radeon 680M
32.1 32.7 33 35.1 [X] HP EliteBook 835 G9 AMD Ryzen 7 PRO 6850U 2.7GHz
Radeon 680M
min:
12.8 fps, P0.1:
15.6 fps, P1:
25.4 fps, max:
117.8 fps
36 36.3 [X] Aoostar GOD77 AMD Ryzen 7 7735HS 3.2GHz
Radeon 680M
min:
14.7 fps, P0.1:
17.9 fps, P1:
30.9 fps, max:
146.6 fps
37.5 [X] GPD Win 4 AMD Ryzen 7 6800U 2.7GHz
Radeon 680M
min:
30 fps, max:
42 fps
37.9 39.3 39.4 40 40 40.1 [X] Aokzoe A1 AMD Ryzen 7 6800U 2.7GHz
Radeon 680M
min:
21 fps, max:
45 fps
40.2 [X] Acemagic AM20 AMD Ryzen 7 7735H 3.2GHz
Radeon 680M
min:
12.2 fps, P0.1:
17.8 fps, P1:
30.7 fps, max:
143.9 fps
40.5 41 41 41.2 [X] Asus ROG Zephyrus G14 AMD Ryzen 9 6900HS 3.3GHz
Radeon 680M
min:
34 fps
41.3 42.4 42.6 42.6 43 43.3 46 [X] Beelink GTR6 AMD Ryzen 9 6900HX 3.3GHz
Radeon 680M
min:
41 fps, max:
51 fps
48 ~ 37 fps
+ Compare
- Hide Comparison
+ 📈 Graph
- 📈 Hide Graph
0 100 Tooltip MTN-FP750: Ø29.7 (21.247-113.2)
EliteBook 835 G9: Ø36.3 (30.079-44.07)
GOD77: Ø39.1 (34.301-72.7)
NucBox K2: Ø38 (33-45)
A1: Ø38.5 (36-41)
AM20: Ø44.6 (33.319-110.3)
Dragonfly Pro 2023: Ø40.8 (35-49)
GTR6: Ø41 (35-45)
...
...
max:
14.3 14.6 14.9 [X] Maxtang MTN-FP750 AMD Ryzen 7 7735HS 3.2GHz
Radeon 680M
min:
9.2 fps, P0.1:
9.5 fps, P1:
12.3 fps, max:
28.8 fps
15.6 [X] ACEMagician Ace Magician AM08 Pro AMD Ryzen 9 6900HX 3.3GHz
Radeon 680M
18.3 19.9 [X] ACEMagician Ace Magician AM08 Pro AMD Ryzen 9 6900HX 3.3GHz
Radeon 680M
20.1 20.3 22 [X] HP EliteBook 835 G9 AMD Ryzen 7 PRO 6850U 2.7GHz
Radeon 680M
min:
11 fps, P0.1:
12.3 fps, P1:
16 fps, max:
62.9 fps
22.7 22.7 [X] Aoostar GOD77 AMD Ryzen 7 7735HS 3.2GHz
Radeon 680M
min:
14.2 fps, P0.1:
14.3 fps, P1:
14.6 fps, max:
45.2 fps
22.8 [X] GPD Win 4 AMD Ryzen 7 6800U 2.7GHz
Radeon 680M
min:
21 fps, max:
25 fps
23 23.1 23.5 23.9 24 24.5 24.5 [X] Aokzoe A1 AMD Ryzen 7 6800U 2.7GHz
Radeon 680M
min:
23 fps, max:
27 fps
24.8 25 25.2 25.4 25.5 [X] Asus ROG Zephyrus G14 AMD Ryzen 9 6900HS 3.3GHz
Radeon 680M
min:
21 fps
25.8 26.3 [X] Acemagic AM20 AMD Ryzen 7 7735H 3.2GHz
Radeon 680M
min:
13.4 fps, P0.1:
14.2 fps, P1:
16.7 fps, max:
70.2 fps
26.8 27 27 27.1 [X] Beelink GTR6 AMD Ryzen 9 6900HX 3.3GHz
Radeon 680M
min:
24 fps, max:
30 fps
27.1 ~ 23 fps
+ Compare
- Hide Comparison
+ 📈 Graph
- 📈 Hide Graph
0 Tooltip EliteBook 865 G9: Ø14.3 (12-16)
EliteBook 845 G9 6F6H6EA: Ø13.4 (11-14)
MTN-FP750: Ø15 (12-17)
ThinkPad Z13 G1-21D20016GE: Ø18.3 (15-24)
Mercury Series EM680: Ø18.9 (11-21)
Swift Edge SFE16-42-R1GM: Ø20.7 (18-23)
EliteBook 835 G9: Ø23.5 (17-25)
GOD77: Ø24.7 (23-27)
Zenbook S 13 OLED: Ø23 (21-25)
XPlayer 2: Ø23.1 (18-25)
ThinkPad T14 G3-21CF004NGE: Ø23.9 (21-26)
VivoBook S15 M3502RA-L1029W: Ø23.9 (19-25)
ThinkPad T14s G3 21CQ002LGE: Ø26 (25-27)
Yoga 7-14ARB G7: Ø25.4 (19-29)
AM20: Ø26.3 (23-28)
ThinkPad P14s G3 AMD 21J6S05000: Ø25.4 (24-29)
Yoga Pro 7 14ARP G8: Ø27.1 (22-30)
...
...
max:
0 Tooltip AS 6, R9 6900HX: Ø20.5 (15.014-58)
...
max:
0 100 200 300 400 500 600 700 800 900 1000 1100 1200 1300 1400 Tooltip AS 6, R9 6900HX: Ø58.6 (11.245-1425)
...
...
max:
» With most tested laptops playable in detail settings high.
Additional Benchmarks
Ultra Graphics & Postprocessing (HBAO+) 3840x2160
Medium Graphics & Postprocessing 1920x1080
36.8 [X] ACEMagician Ace Magician AM08 Pro 959964
AMD Ryzen 9 6900HX 3.3GHz
Radeon 680M
28.6 [X] ACEMagician Ace Magician AM08 Pro 959964
AMD Ryzen 9 6900HX 3.3GHz
Radeon 680M
78.5 [X] Acemagic AM20 1026791
AMD Ryzen 7 7735H 3.2GHz
Radeon 680M
min:
8.17 fps, P0.1:
30.3 fps, P1:
58.8 fps, max:
203 fps
42.9 [X] Aoostar GOD77 AMD Ryzen 7 7735HS 3.2GHz
Radeon 680M
min:
7.68 fps, P0.1:
29.9 fps, P1:
34.8 fps, max:
187 fps
67.7 87.7 95.5 106.6 122.2 123.2 125.5 131.1 131.3 133.6 136.1 136.6 [X] Aokzoe A1 AMD Ryzen 7 6800U 2.7GHz
Radeon 680M
min:
16.8 fps, P1:
90.9 fps, max:
256 fps
136.9 138.5 138.6 140.3 [X] GPD Win 4 AMD Ryzen 7 6800U 2.7GHz
Radeon 680M
min:
7.08 fps, P1:
83.3 fps, max:
273 fps
142.8 [X] ACEMagician Ace Magician AM08 Pro AMD Ryzen 9 6900HX 3.3GHz
Radeon 680M
min:
1.614 fps, P1:
83.3 fps, max:
324 fps
144.2 [X] Acemagic AM20 AMD Ryzen 7 7735H 3.2GHz
Radeon 680M
min:
9.88 fps, P1:
90.9 fps, max:
272 fps
145.8 147.3 [X] Aoostar GOD77 AMD Ryzen 7 7735HS 3.2GHz
Radeon 680M
min:
5.71 fps, P1:
100 fps, max:
281 fps
147.5 149.3 151.6 [X] ACEMagician Ace Magician AM08 Pro AMD Ryzen 9 6900HX 3.3GHz
Radeon 680M
min:
5.47 fps, P1:
100 fps, max:
305 fps
152.1 152.3 [X] Beelink SER6 Pro AMD Ryzen 7 6800H 3.2GHz
Radeon 680M
min:
4.42 fps, P1:
100 fps, max:
264 fps
152.3 [X] GMK NucBox K2 AMD Ryzen 7 7735HS 3.2GHz
Radeon 680M
min:
5.63 fps, P1:
100 fps, max:
317 fps
152.6 [X] Beelink GTR6 AMD Ryzen 9 6900HX 3.3GHz
Radeon 680M
min:
4.69 fps, P1:
100 fps, max:
362 fps
155.4 ~ 134 fps
+ Compare
- Hide Comparison
...
...
max:
60.7 61.7 78.3 85.7 108.3 110.2 115.4 116.4 119.6 119.7 120.1 120.4 122.7 127.6 [X] GPD Win 4 AMD Ryzen 7 6800U 2.7GHz
Radeon 680M
min:
6.6 fps, P1:
76.9 fps, max:
231 fps
130.4 [X] ACEMagician Ace Magician AM08 Pro AMD Ryzen 9 6900HX 3.3GHz
Radeon 680M
min:
6.94 fps, P1:
76.9 fps, max:
233 fps
130.5 [X] Acemagic AM20 AMD Ryzen 7 7735H 3.2GHz
Radeon 680M
min:
10.5 fps, P1:
83.3 fps, max:
232 fps
134.5 [X] Aoostar GOD77 AMD Ryzen 7 7735HS 3.2GHz
Radeon 680M
min:
8.19 fps, P1:
90.9 fps, max:
264 fps
136.8 138 [X] Beelink GTR6 AMD Ryzen 9 6900HX 3.3GHz
Radeon 680M
min:
28 fps, P1:
90.9 fps, max:
262 fps
138.1 139.1 [X] ACEMagician Ace Magician AM08 Pro AMD Ryzen 9 6900HX 3.3GHz
Radeon 680M
min:
4.42 fps, P1:
90.9 fps, max:
277 fps
139.1 [X] GMK NucBox K2 AMD Ryzen 7 7735HS 3.2GHz
Radeon 680M
min:
7.31 fps, P1:
90.9 fps, max:
260 fps
139.7 [X] Beelink SER6 Pro AMD Ryzen 7 6800H 3.2GHz
Radeon 680M
min:
5.95 fps, P1:
90.9 fps, max:
270 fps
140.4 143.9 ~ 119 fps
+ Compare
- Hide Comparison
...
...
max:
25.9 28.2 [X] Maxtang MTN-FP750 AMD Ryzen 7 7735HS 3.2GHz
Radeon 680M
min:
4.09 fps, P1:
18.5 fps, max:
77.9 fps
34 44.1 44.2 46.4 [X] ACEMagician Ace Magician AM08 Pro AMD Ryzen 9 6900HX 3.3GHz
Radeon 680M
min:
1.402 fps, P1:
22.7 fps, max:
219 fps
46.8 47 47.5 [X] ACEMagician Ace Magician AM08 Pro AMD Ryzen 9 6900HX 3.3GHz
Radeon 680M
min:
12.1 fps, P1:
23.8 fps, max:
186.6 fps
47.6 47.6 48.7 48.7 [X] Aoostar GOD77 AMD Ryzen 7 7735HS 3.2GHz
Radeon 680M
min:
9.22 fps, P1:
34.5 fps, max:
205 fps
49.2 49.3 49.5 49.6 50.5 [X] Aokzoe A1 AMD Ryzen 7 6800U 2.7GHz
Radeon 680M
min:
8.33 fps, P1:
32.3 fps, max:
101 fps
51.4 [X] GPD Win 4 AMD Ryzen 7 6800U 2.7GHz
Radeon 680M
min:
1.467 fps, P1:
27 fps, max:
107.1 fps
51.8 [X] Beelink GTR6 AMD Ryzen 9 6900HX 3.3GHz
Radeon 680M
min:
9.91 fps, P1:
35.7 fps, max:
90.4 fps
51.9 [X] Beelink SER6 Pro AMD Ryzen 7 6800H 3.2GHz
Radeon 680M
min:
14.3 fps, P1:
37 fps, max:
143.3 fps
51.9 [X] GMK NucBox K2 AMD Ryzen 7 7735HS 3.2GHz
Radeon 680M
min:
5.75 fps, P1:
35.7 fps, max:
128.5 fps
52.2 52.9 [X] Acemagic AM20 AMD Ryzen 7 7735H 3.2GHz
Radeon 680M
min:
4 fps, P1:
35.7 fps, max:
173.6 fps
53 53.4 53.5 99.1 ~ 49 fps
+ Compare
- Hide Comparison
...
...
max:
11.3 12.7 18.8 19 [X] ACEMagician Ace Magician AM08 Pro AMD Ryzen 9 6900HX 3.3GHz
Radeon 680M
min:
7.53 fps, P1:
12 fps, max:
60.6 fps
19.4 19.6 20 20.4 [X] Aoostar GOD77 AMD Ryzen 7 7735HS 3.2GHz
Radeon 680M
min:
4.1 fps, P1:
14.7 fps, max:
46.8 fps
20.5 [X] ACEMagician Ace Magician AM08 Pro AMD Ryzen 9 6900HX 3.3GHz
Radeon 680M
min:
2.3 fps, P1:
11.9 fps, max:
81.9 fps
20.6 20.9 21.3 21.7 22.2 22.3 22.7 22.8 23.2 [X] Acemagic AM20 AMD Ryzen 7 7735H 3.2GHz
Radeon 680M
min:
3.58 fps, P1:
16.4 fps, max:
69.3 fps
23.5 23.5 [X] Aokzoe A1 AMD Ryzen 7 6800U 2.7GHz
Radeon 680M
min:
3.24 fps, P1:
15.2 fps, max:
47.3 fps
23.7 [X] Beelink GTR6 AMD Ryzen 9 6900HX 3.3GHz
Radeon 680M
min:
7.88 fps, P1:
16.4 fps, max:
114.6 fps
23.7 [X] Beelink SER6 Pro AMD Ryzen 7 6800H 3.2GHz
Radeon 680M
min:
9.52 fps, P1:
16.4 fps, max:
95.2 fps
23.8 24 [X] GMK NucBox K2 AMD Ryzen 7 7735HS 3.2GHz
Radeon 680M
min:
5.07 fps, P1:
15.9 fps, max:
83.4 fps
24.1 24.2 24.5 24.8 [X] GPD Win 4 AMD Ryzen 7 6800U 2.7GHz
Radeon 680M
min:
3 fps, P1:
15.4 fps, max:
56.5 fps
~ 21 fps
+ Compare
- Hide Comparison
...
...
max:
...
max:
» With most tested laptops playable in detail settings high.
Additional Benchmarks
Highest Settings possible 16xAF 4xMSAA + FXAA 3840x2160
Normal/Off 4xAF 1920x1080
109.6 [X] Beelink GTR6 AMD Ryzen 9 6900HX 3.3GHz
Radeon 680M
min:
8.03 fps, P1:
71.4 fps, max:
235 fps
107.2 [X] GPD Win 4 959964
AMD Ryzen 7 6800U 2.7GHz
Radeon 680M
min:
13.4 fps, P1:
71.4 fps, max:
185.4 fps
104.7 [X] ACEMagician Ace Magician AM08 Pro 959964
AMD Ryzen 9 6900HX 3.3GHz
Radeon 680M
min:
8.81 fps, P1:
62.5 fps, max:
217 fps
111.6 [X] ACEMagician Ace Magician AM08 Pro 959964
AMD Ryzen 9 6900HX 3.3GHz
Radeon 680M
min:
15.9 fps, P1:
55.6 fps, max:
198.8 fps
113.3 [X] GMK NucBox K2 959964
AMD Ryzen 7 7735HS 3.2GHz
Radeon 680M
min:
11.4 fps, P1:
71.4 fps, max:
231 fps
101.7 [X] Aokzoe A1 959964
AMD Ryzen 7 6800U 2.7GHz
Radeon 680M
min:
8.55 fps, P1:
66.7 fps, max:
188.8 fps
111.3 [X] Acemagic AM20 1026791
AMD Ryzen 7 7735H 3.2GHz
Radeon 680M
min:
10.5 fps, P1:
71.4 fps, max:
216 fps
Lowest Settings possible 1920x1080
112 [X] Beelink GTR6 AMD Ryzen 9 6900HX 3.3GHz
Radeon 680M
min:
30.2 fps, P1:
71.4 fps, max:
233 fps
111.7 [X] GPD Win 4 959964
AMD Ryzen 7 6800U 2.7GHz
Radeon 680M
min:
19.5 fps, P1:
76.9 fps, max:
167.2 fps
100.7 [X] ACEMagician Ace Magician AM08 Pro 959964
AMD Ryzen 9 6900HX 3.3GHz
Radeon 680M
min:
8.01 fps, P1:
66.7 fps, max:
238 fps
111.6 [X] ACEMagician Ace Magician AM08 Pro 959964
AMD Ryzen 9 6900HX 3.3GHz
Radeon 680M
min:
19.9 fps, P1:
71.4 fps, max:
219 fps
112.4 [X] GMK NucBox K2 959964
AMD Ryzen 7 7735HS 3.2GHz
Radeon 680M
min:
25 fps, P1:
76.9 fps, max:
202 fps
104.2 [X] Aokzoe A1 959964
AMD Ryzen 7 6800U 2.7GHz
Radeon 680M
min:
19.4 fps, P1:
71.4 fps, max:
166.4 fps
112.4 [X] Acemagic AM20 1026791
AMD Ryzen 7 7735H 3.2GHz
Radeon 680M
min:
11.6 fps, P1:
76.9 fps, max:
203 fps
For more games that might be playable and a list of all games and graphics cards visit our Gaming List
v1.26
log 27. 12:05:40
#0 no ids found in url (should be separated by "_") +0s ... 0s
#1 not redirecting to Ajax server +0s ... 0s
#2 did not recreate cache, as it is less than 5 days old! Created at Thu, 25 Apr 2024 05:40:10 +0200 +0.001s ... 0.001s
#3 composed specs +0.076s ... 0.077s
#4 did output specs +0s ... 0.077s
#5 start showIntegratedCPUs +0s ... 0.077s
#6 getting avg benchmarks for device 11124 +0.042s ... 0.119s
#7 got single benchmarks 11124 +0.109s ... 0.229s
#8 got avg benchmarks for devices +0s ... 0.229s
#9 min, max, avg, median took s +1.237s ... 1.466s
#10 before gaming benchmark output +0.001s ... 1.467s
#11 Got 1860 rows for game benchmarks. +0.24s ... 1.707s
#12 composed SQL query for gamebenchmarks +0s ... 1.707s
#13 got data and put it in $dataArray +0.074s ... 1.782s
#14 benchmarks composed for output. +3.625s ... 5.407s
#15 return log +0.05s ... 5.456s
Notebook reviews with AMD Radeon 680M graphics card
Aoostar GOD77 review - Mini-PC with lighting effects and AMD Ryzen 7 7735HS in an eye-catching cyberpunk case The Aoostar GOD77 is based on the AMD Ryzen 7 7735HS and has a very powerful AMD Radeon 680M iGPU. Visually, the mini PC also impresses with its somewhat extrav...
AMD Ryzen 7 7735HS | AMD Radeon 680M | | 603 g
Maxtang MTN-FP750 mini PC review: AMD Ryzen 7 7735HS slowed down by a poorly conceived configuration The Maxtang MTN-FP750 is a relatively unspectacular mini PC and, in its more powerful variant, it comes with an AMD Ryzen 7 7735HS. We put the compact office PC...
AMD Ryzen 7 7735HS | AMD Radeon 680M | | 601 g
The Acemagic AM20 mini PC with an AMD Ryzen 7 7735H and 32 GB of RAM can charge smartphones wirelessly With the AM20, Acemagic has released a mini PC with an AMD Ryzen 7 7735H and an AMD Radeon 680M. Despite its compact form factor, three mass storage drives can ...
AMD Ryzen 7 7735H | AMD Radeon 680M | | 339 g
Aokzoe A1 gaming handheld review: Ambitious with room for improvement For around US$1000, the Aokzoe A1 costs as much as many full-fledged laptops. It certainly performs like one, but the fan noise and integrated buttons leave a l...
AMD Ryzen 7 6800U | AMD Radeon 680M | 8.00" | 735 g
GMK NucBox K2 Ryzen 7 7735HS mini PC review: Optimized for high performance-per-dollar The NucBox K2 skips being flashy and "innovative" for cheaper starting prices while maintaining as much performance as possible. The accessible NucBox K2 should...
AMD Ryzen 7 7735HS | AMD Radeon 680M | | 440 g
Geekom AS 6, R9 6900HX : AMD Ryzen 9 6900HX, 0.8 kgReview » Geekom AS 6 review: The ultimate mini PC for pros and gamers with a Ryzen 9 6900HX and a Radeon 680M
One Netbook XPlayer 2 : AMD Ryzen 7 6800U, 8.40", 0.9 kgReview » OneXPlayer 2 review - Gaming handheld with AMD Zen3+ and detachable controllers
Minisforum Mercury Series EM680 : AMD Ryzen 7 6800U, 0.2 kgReview » Minisforum Mercury Series EM680 review: An astoundingly small mini PC with a Ryzen 7 6800U and USB4
Acer Swift Edge SFE16-42-R1GM : AMD Ryzen 7 7735U, 16.00", 1.2 kgReview » Acer Swift Edge SFE16 review - A lightweight 16-inch laptop with AMD power and an OLED display
ACEMagician Ace Magician AM08 Pro : AMD Ryzen 9 6900HX, 0.9 kgReview » Ace Magician AM08 Pro gaming mini PC with Radeon 680M and Ryzen 9 6900HX in our extensive test!
Lenovo Yoga Pro 7 14ARP G8 : AMD Ryzen 7 7735HS, 14.50", 1.5 kgReview » Lenovo Yoga Pro 7 14 review - The almost perfect ultrabook with AMD Zen 3+
Beelink SER6 Pro Ryzen 7 7735HS : AMD Ryzen 7 7735HS, 0.5 kgReview » Beelink SER6 Pro Ryzen 7 7735HS mini PC review: Now with integrated DisplayPort
Lenovo ThinkPad P14s G3 AMD 21J6S05000 : AMD Ryzen 7 PRO 6850U, 14.00", 1.5 kgReview » Lenovo ThinkPad P14s G3 AMD laptop review: Lightweight workstation without dGPU
Morefine M600, 6900HX : AMD Ryzen 9 6900HX, 0.8 kgReview » Morefine M600 desktop PC review: Modern mini PC with AMD Ryzen 9 6900HX, 32 GB DDR5 and USB4
HP Dragonfly Pro 2023 : AMD Ryzen 7 7736U, 14.00", 1.5 kgReview » HP Dragonfly Pro laptop review: AMD Ryzen 7 7736U makes a splash
GPD Win 4 : AMD Ryzen 7 6800U, 6.00", 0.6 kgReview » GPD Win 4 handheld PC review: 1080p Ryzen 7 gaming in the palm of your hand
Asus VivoBook S15 M3502RA-L1029W : AMD Ryzen 7 6800H, 15.60", 1.9 kgReview » Asus VivoBook S15 laptop review: iGPU provides performance boost
Minisforum Venus Series UM690 : AMD Ryzen 9 6900HX, 0.6 kgReview » Minisforum Venus Series UM690 desktop review: small office PC with Ryzen 9 6900HX and USB4
Beelink SER6 Pro : AMD Ryzen 7 6800H, 0.5 kgReview » Beelink SER6 Pro review: The AMD Radeon 680M is stunning on a mini PC
Lenovo ThinkPad T14s G3 21CQ002LGE : AMD Ryzen 7 PRO 6850U, 14.00", 1.3 kgReview » Lenovo ThinkPad T14s G3 AMD laptop review: Quiet and efficient workhorse with Ryzen power
HP EliteBook 835 G9 : AMD Ryzen 7 PRO 6850U, 13.30", 1.3 kgReview » HP EliteBook 835 G9 review: Powerful business notebook with bright screen and great keyboard
HP EliteBook 865 G9 : AMD Ryzen 7 PRO 6850U, 16.00", 1.9 kgReview » HP EliteBook 865 G9 Laptop review - 1000-nits Sure View display not quite up to par
Beelink GTR6 : AMD Ryzen 9 6900HX, 0.8 kgReview » Beelink GTR6 Ryzen 9 6900HX mini PC review: Faster than most Intel NUCs
Lenovo ThinkPad Z13 G1-21D20016GE : AMD Ryzen 7 PRO 6860Z, 13.30", 1.3 kgReview » Lenovo ThinkPad Z13 G1 OLED Review - Business-Laptop with an AMD Ryzen 7 Pro 6860Z
Lenovo ThinkPad T14 G3-21CF004NGE : AMD Ryzen 7 PRO 6850U, 14.00", 1.4 kgReview » Lenovo ThinkPad T14 G3 review: Business laptop is better with AMD Ryzen Pro
Lenovo Yoga 7-14ARB G7 : AMD Ryzen 7 6800U, 14.00", 1.4 kgReview » Lenovo Yoga 7 14 G7 review: Multimedia convertible shines with AMD Ryzen 7 6800U
HP EliteBook 845 G9 6F6H6EA : AMD Ryzen 9 PRO 6950HS, 14.00", 1.5 kgReview » HP EliteBook 845 G9 in review: 35-watt AMD outclasses Lenovo & Dell
Asus Zenbook S 13 OLED : AMD Ryzen 7 6800U, 13.30", 1.1 kgReview » Asus Zenbook S 13 OLED laptop review: Subnotebook impresses with fast AMD Ryzen 7 6800U
Review »
AMD Ryzen 7 6800U Efficiency Review - Zen3+ beats Intel Alder Lake
Lenovo IdeaPad 5 Pro 16ARP8 : AMD Ryzen 7 7735HS, 16.00", 1.9 kgExternal Review » Lenovo IdeaPad 5 Pro 16ARP8
Lenovo Yoga Pro 7 14ARP G8 : AMD Ryzen 7 7735HS, 14.50", 1.5 kgExternal Review » Lenovo Yoga Pro 7 14ARP G8
Acer Swift Edge SFE16-42-R1GM : AMD Ryzen 7 7735U, 16.00", 1.2 kgExternal Review » Acer Swift Edge SFE16-42-R1GM
Asus Zenbook 15 OLED UM3504DA : AMD Ryzen 7 7735U, 15.60", 1.4 kgExternal Review » Asus Zenbook 15 OLED UM3504DA
HP EliteBook 835 G9 : AMD Ryzen 7 PRO 6850U, 13.30", 1.3 kgExternal Review » HP EliteBook 835 G9
HP Pavilion Aero 13-be2047AU : AMD Ryzen 7 7735U, 13.30", 1 kgExternal Review » HP Pavilion Aero 13-be2047AU
Asus VivoBook S14 OLED M3402RA : AMD Ryzen 7 6800H, 14.00", 1.4 kgExternal Review » Asus VivoBook S14 OLED M3402RA
Acer TravelMate P4 TMP414-41-R923 : AMD Ryzen 7 PRO 6850U, 14.00", 1.4 kgExternal Review » Acer TravelMate P4 TMP414-41-R923
HP Dragonfly Pro 2023 : AMD Ryzen 7 7736U, 14.00", 1.5 kgExternal Review » HP Dragonfly Pro 2023
HP EliteBook 845 G9 6F6H6EA : AMD Ryzen 9 PRO 6950HS, 14.00", 1.5 kgExternal Review » HP EliteBook 845 G9 6F6H6EA
Asus Vivobook S 16X M5602, R7 6800H : AMD Ryzen 7 6800H, 16.00", 1.9 kgExternal Review » Asus Vivobook S 16X M5602, R7 6800H
Asus ZenBook S 13 UM5302TA, R7 6800U : AMD Ryzen 7 6800U, 13.30", 1.1 kgExternal Review » Asus ZenBook S 13 UM5302TA, R7 6800U
Lenovo ThinkPad T14 G3-21CF004NGE : AMD Ryzen 7 PRO 6850U, 14.00", 1.4 kgExternal Review » Lenovo ThinkPad T14 G3-21CF004NGE
Lenovo ThinkPad T14s G3 21CQ002LGE : AMD Ryzen 7 PRO 6850U, 14.00", 1.3 kgExternal Review » Lenovo ThinkPad T14s G3 21CQ002LGE
Acer Swift Edge SFA16-41, Ryzen7 6850U : AMD Ryzen 7 PRO 6850U, 16.00", 1.2 kgExternal Review » Acer Swift Edge SFA16-41, Ryzen7 6850U
Lenovo Yoga 7 14ARB7-82QF000GGE : AMD Ryzen 7 6800U, 14.00", 1.5 kgExternal Review » Lenovo Yoga 7 14ARB7-82QF000GGE
HP EliteBook 865 G9 : AMD Ryzen 7 PRO 6850U, 16.00", 1.9 kgExternal Review » HP EliteBook 865 G9
Lenovo ThinkPad Z13 G1-21D20016GE : AMD Ryzen 7 PRO 6860Z, 13.30", 1.3 kgExternal Review » Lenovo ThinkPad Z13 G1-21D20016GE
HP Elitebook 865 G9, Ryzen 9 Pro 6950 : AMD Ryzen 9 PRO 6950HS, 16.00", 1.7 kgExternal Review » HP Elitebook 865 G9, Ryzen 9 Pro 6950
Acer Swift Edge SFA16-41-R8GY : AMD Ryzen 7 6800U, 16.00", 1.2 kgExternal Review » Acer Swift Edge SFA16-41-R8GY
HP EliteBook 845 G9 6F6F5EA : AMD Ryzen 7 6800U, 14.00", 1.4 kgExternal Review » HP EliteBook 845 G9 6F6F5EA
Xiaomi RedmiBook Pro 15 2022, R7 6800H : AMD Ryzen 7 6800H, 15.60", 1.8 kgExternal Review » Xiaomi RedmiBook Pro 15 2022, R7 6800H
Lenovo ThinkPad Z13 21D20029GE : AMD Ryzen 7 PRO 6850U, 13.30", 1.3 kgExternal Review » Lenovo ThinkPad Z13 21D20029GE
Asus ZenBook 13 OLED UM5302T : AMD Ryzen 7 6800U, 13.30"External Review » Asus ZenBook 13 OLED UM5302T
Asus Zenbook S 13 OLED : AMD Ryzen 7 6800U, 13.30", 1.1 kgExternal Review » Asus Zenbook S 13 OLED
Asus ROG Flow X13 GV301RA-LJ011W : AMD Ryzen 7 6800HS, 13.40", 1.3 kgExternal Review » Asus ROG Flow X13 GV301RA-LJ011W
GPD Win 4 : AMD Ryzen 7 6800U, 6.00", 0.6 kgGPD Win 4 2023 refresh announced with AMD Ryzen 7040U APUs and OcuLink port
ACEMagician Ace Magician AM08 Pro : AMD Ryzen 9 6900HX, 0.9 kgChatreey AM08: Mini-PC refreshed with AMD Ryzen 9 6900HX and Ryzen 7 7735HS options
Lenovo Yoga Pro 7 14ARP G8 : AMD Ryzen 7 7735HS, 14.50", 1.5 kgLenovo's new Yoga Pro 7 14 AMD offers an almost unbeatable value for money
Lenovo ThinkPad P14s G3 AMD 21J6S05000 : AMD Ryzen 7 PRO 6850U, 14.00", 1.5 kgA question of sense: The Lenovo ThinkPad P14s G3 AMD is pretty redundant
Minisforum Venus Series UM690 : AMD Ryzen 9 6900HX, 0.6 kgMINISFORUM Venus UM690: AMD Ryzen 9 6900HX mini-PC drops below US$700 with RAM and storage in new money off deal
GPD Win 4 : AMD Ryzen 7 6800U, 6.00", 0.6 kgGPD Win 4 is fast, but it's as loud as many gaming laptops
HP Dragonfly Pro 2023 : AMD Ryzen 7 7736U, 14.00", 1.5 kgAMD Ryzen 7 7736U integrated Radeon 680M achieves Playstation 4 level graphics, runs God of War, Horizon Zero Dawn, and Final Fantasy XV at 1080p30
Beelink GTR6 : AMD Ryzen 9 6900HX, 0.8 kgBeelink GTR6: AMD Ryzen 9 6900HX mini-PC reduced by over US$200 in new deal
Asus VivoBook S15 M3502RA-L1029W : AMD Ryzen 7 6800H, 15.60", 1.9 kgMultimedia without dedicated GPU: Asus VivoBook S15 delivers great graphics performance
Lenovo ThinkPad T14s G3 21CQ002LGE : AMD Ryzen 7 PRO 6850U, 14.00", 1.3 kgLenovo ThinkPad T14s G3 AMD: Currently probably the best ThinkPad laptop
HP EliteBook 835 G9 : AMD Ryzen 7 PRO 6850U, 13.30", 1.3 kgHP EliteBook 835 G9: Powerful and durable thanks to Ryzen
HP EliteBook 865 G9 : AMD Ryzen 7 PRO 6850U, 16.00", 1.9 kgHP's 1000-nits Sure View panel is bright, but the picture quality is compromised
Lenovo Yoga 7-14ARB G7 : AMD Ryzen 7 6800U, 14.00", 1.4 kgThe Lenovo Yoga 7 14 confirms AMD's advantage in the mobile segment
Asus Zenbook S 13 OLED : AMD Ryzen 7 6800U, 13.30", 1.1 kgThe Asus Zenbook S 13 OLED cleary shows that AMD is the superior choice for compact laptops right now
Asus Zenbook S 13 OLED AMD Reference Values : AMD Ryzen 7 6800U, 0.00"First AMD Ryzen 7 6800U benchmarks: Closer to Core i7-1260P in multi-core, Radeon 680M impresses in synthetics but lags in gaming
Asus ZenBook 13 OLED UM5302T : AMD Ryzen 7 6800U, 13.30"First AMD Ryzen 7 6800U benchmarks: Closer to Core i7-1260P in multi-core, Radeon 680M impresses in synthetics but lags in gaming
Please share our article, every link counts!
» Comparison of GPUs
» Benchmark List
» Notebook Gaming List
Class 1
Class 2 Radeon PRO W6600M *
Class 3 UHD Graphics 32EUs
UHD Graphics 750
Class 4
Class 5 * Approximate position of the graphics adapter
Working For Notebookcheck
Are you a techie who knows how to translate? Then join our Team!
Details here
Top 10 Laptops Multimedia , Budget Multimedia , Gaming , Budget Gaming , Lightweight Gaming , Business , Budget Office , Workstation , Subnotebooks , Ultrabooks , Chromebooks
under 300 USD/Euros , under 500 USD/Euros , 1,000 USD/Euros , for University Students , Best Displays
Top 10 Smartphones Smartphones , Phablets , ≤6-inch , Camera Smartphones
Klaus Hinum (Update: 2022-01- 4)
 Deutsch
 English
 Español
 Français
 Italiano
 Nederlands
 Polski
 Português
 Русский
 Türkçe
 Svenska
 Chinese
 Magyar