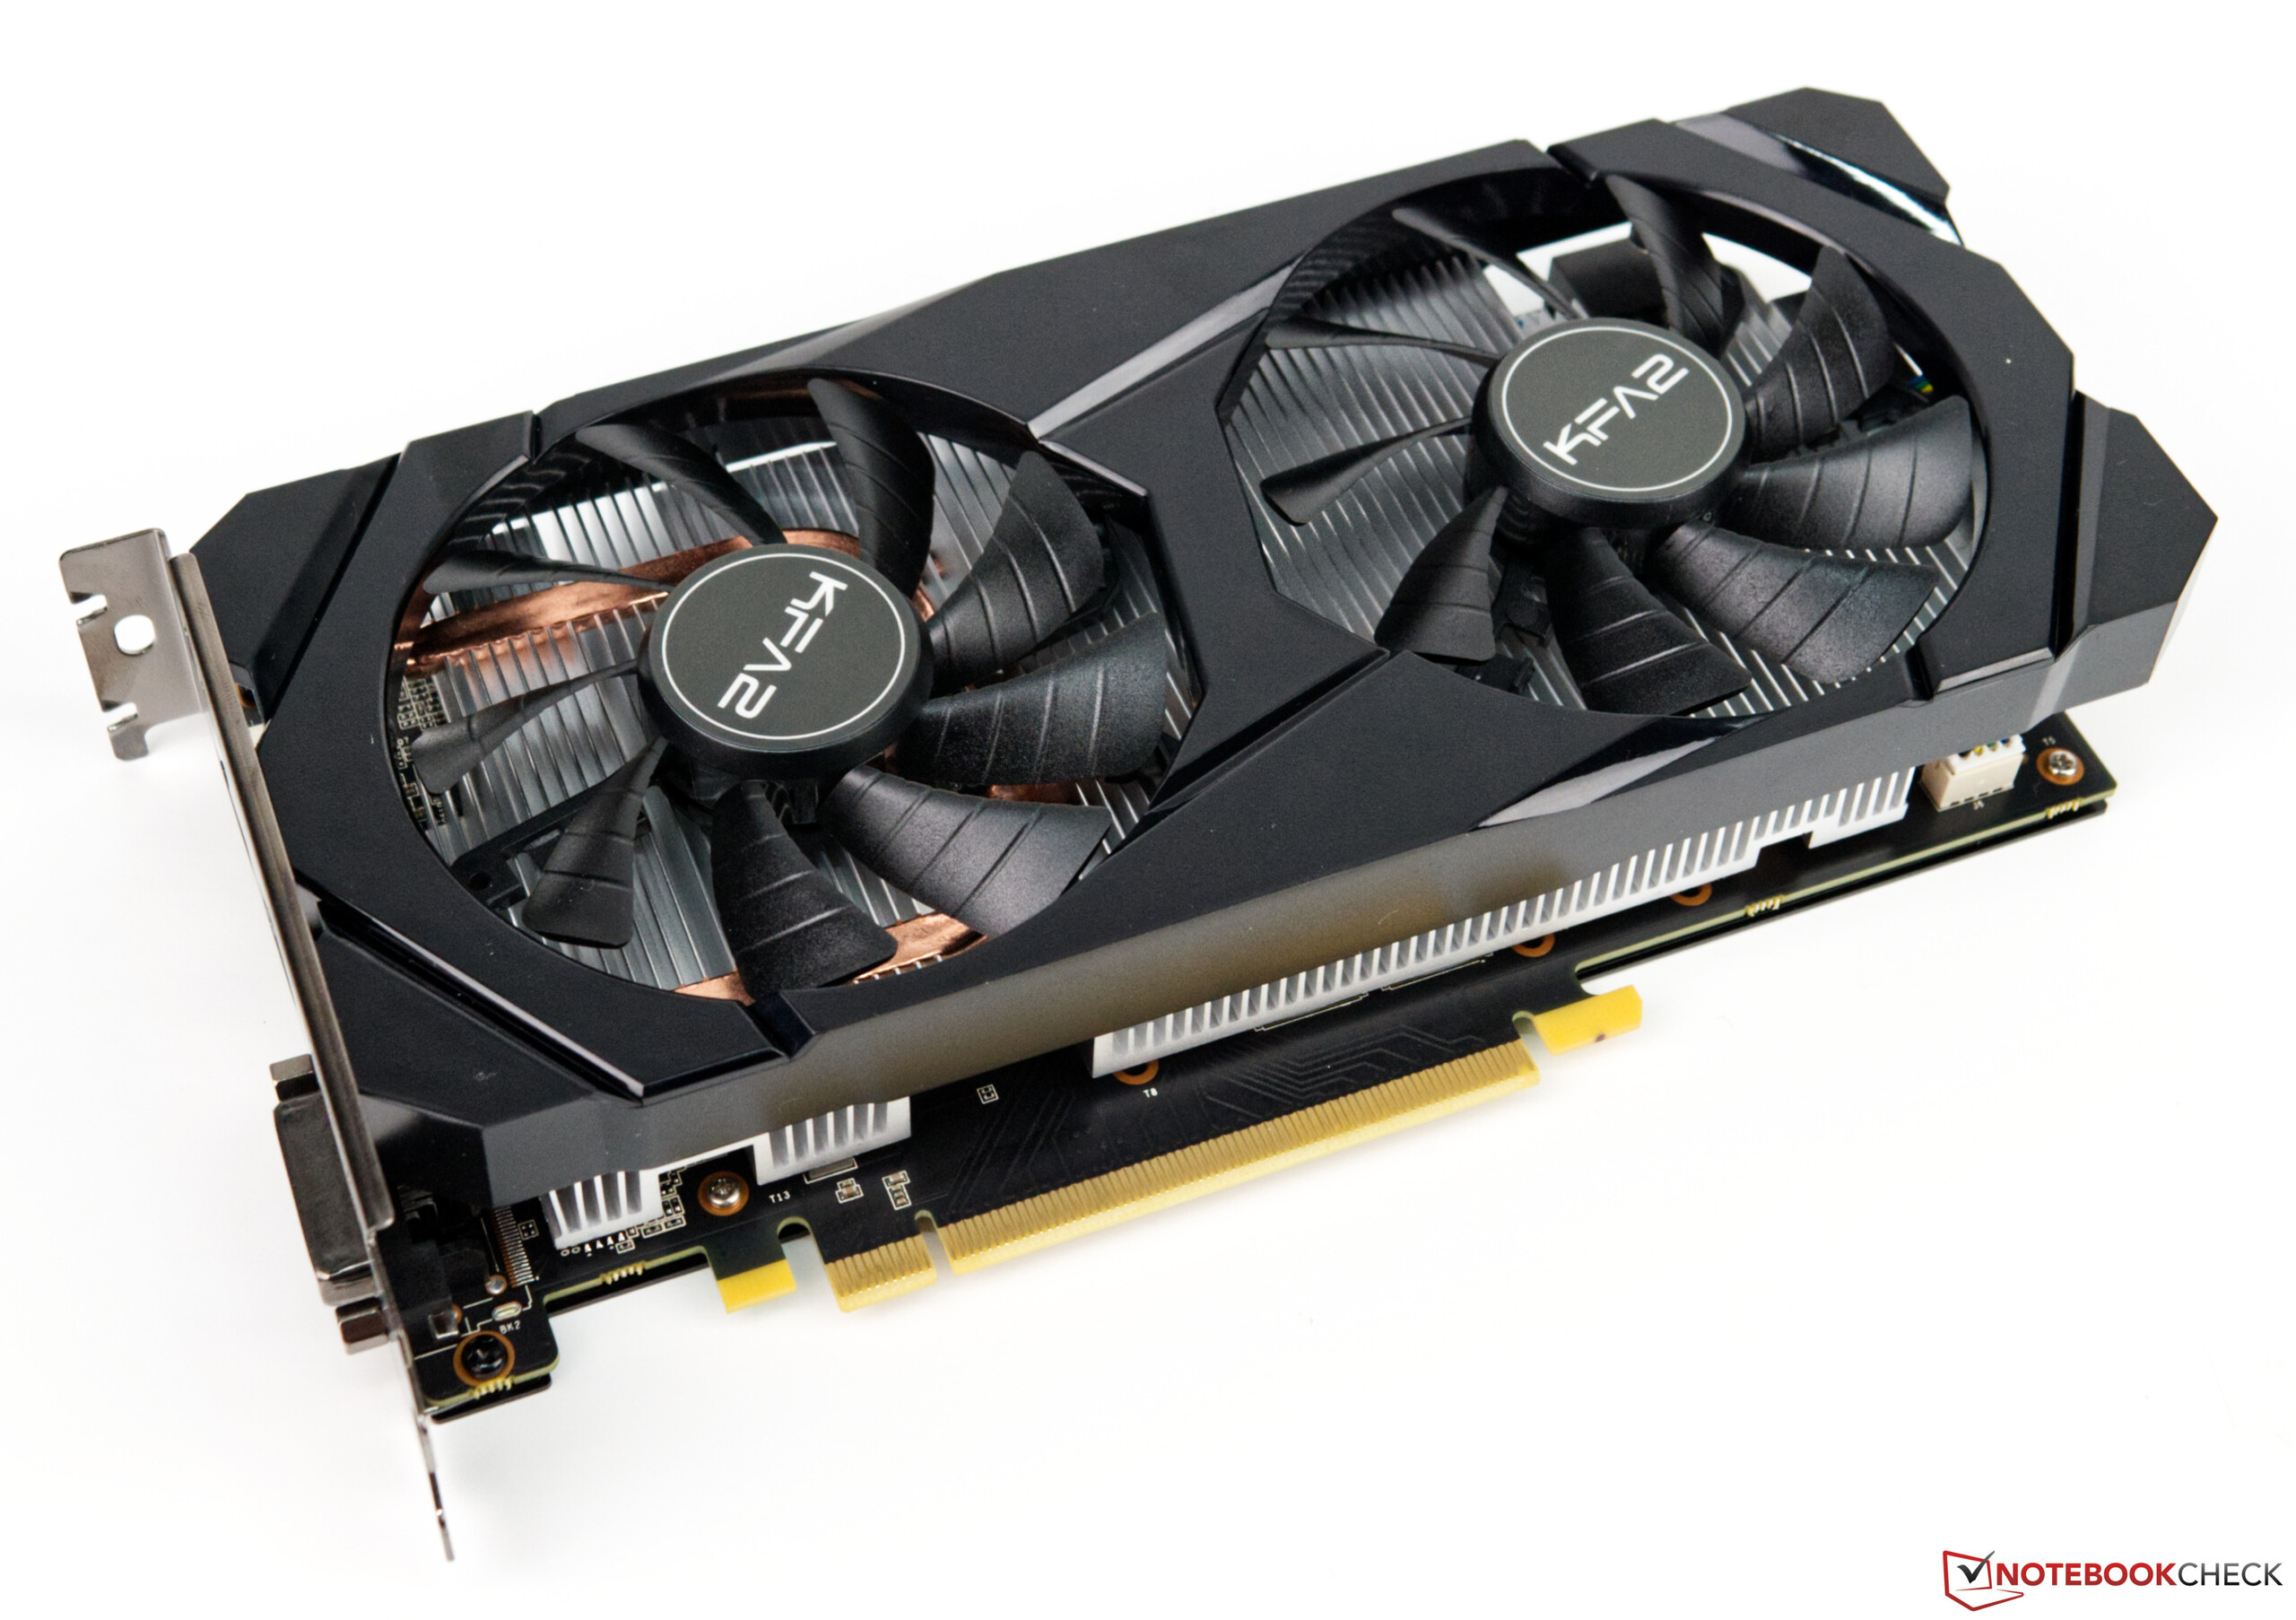
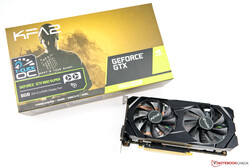
KFA2 GeForce GTX 1660 SUPER Desktop GPU Review: The GTX 16 series also receives a SUPER upgrade Is everything SUPER? NVIDIA has now expanded its mid-generation SUPER upgrades to the GTX 16 series, having initially reserved them for its RTX 20 series. The green team is not producing reference versions of its GTX 16 SUPER series, so we have put a KFA2 unit through its paces instead. Read on to find out what is so SUPER about NVIDIA's latest mid-range desktop GPU.
GPU-Z Unsurprisingly, the NVIDIA GeForce GTX 1660 SUPER is faster than the regular GeForce GTX 1660 . However, it is also just minimally slower than the GeForce GTX 1660 Ti GeForce GTX 1660 Ti and just under 200 Euros (~US$220) for the regular GeForce GTX 1660 .
NVIDIA bases the GTX 1660 Super on the TU116, a 12 nm chip that it uses across the whole GTX 1660 range. Little separates the three GPUs on paper, but there are some peculiarities. The GTX 1660 SUPER makes the step up to GDDR6 VRAM, putting it on par with the GeForce GTX 1660 Ti and ahead of the regular GeForce GTX 1660 GeForce GTX 1660 Ti GeForce GTX 1660 Ti
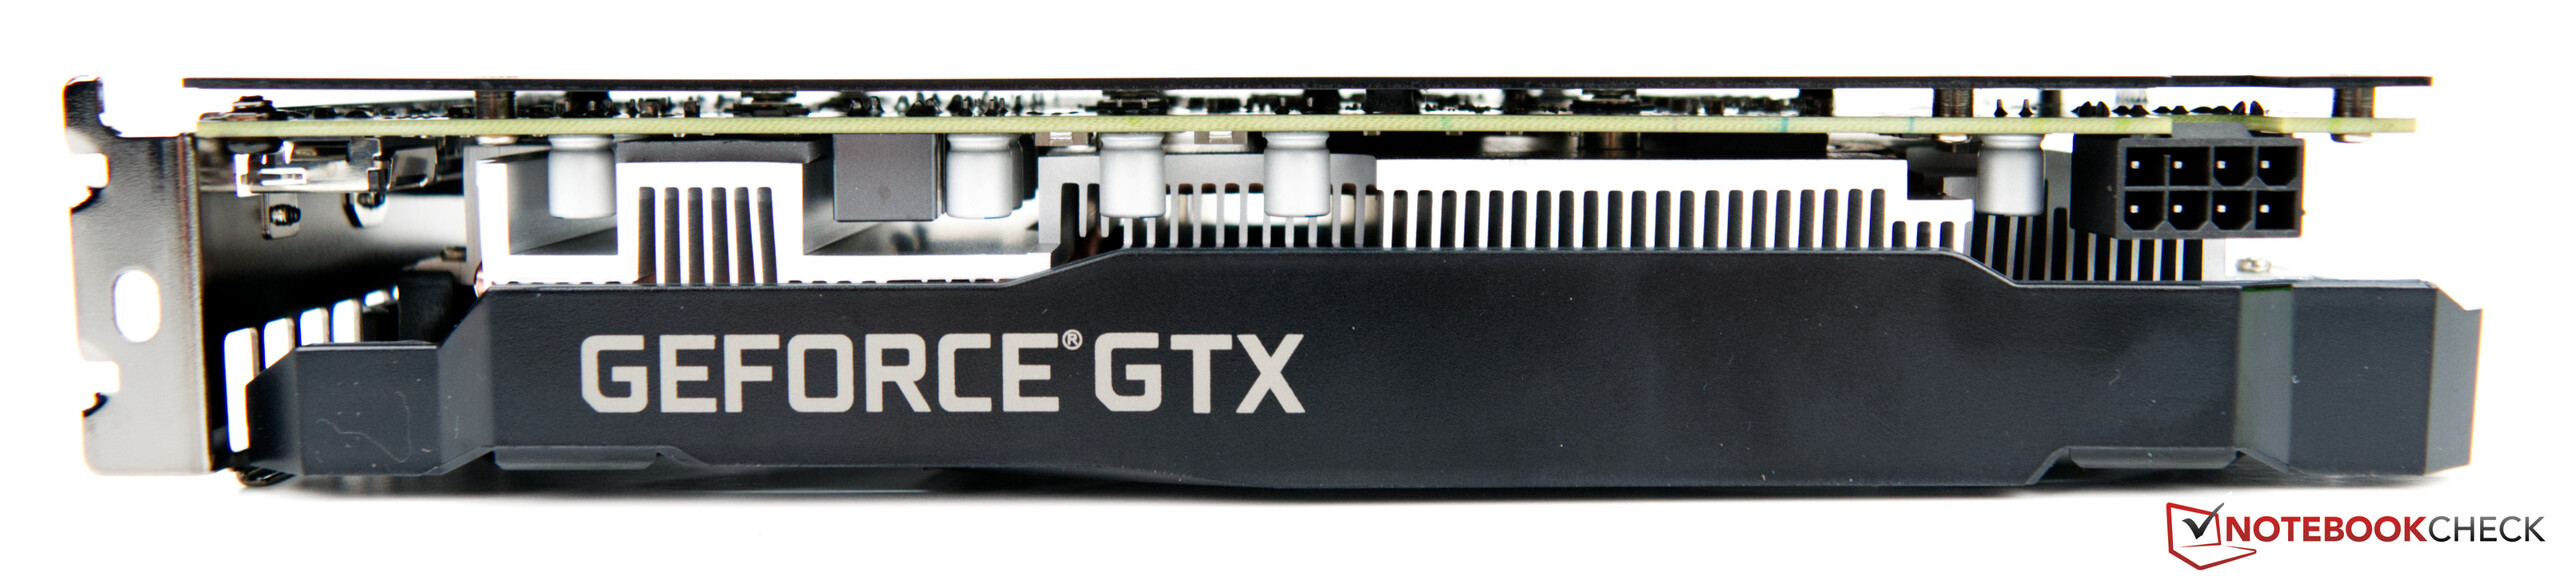
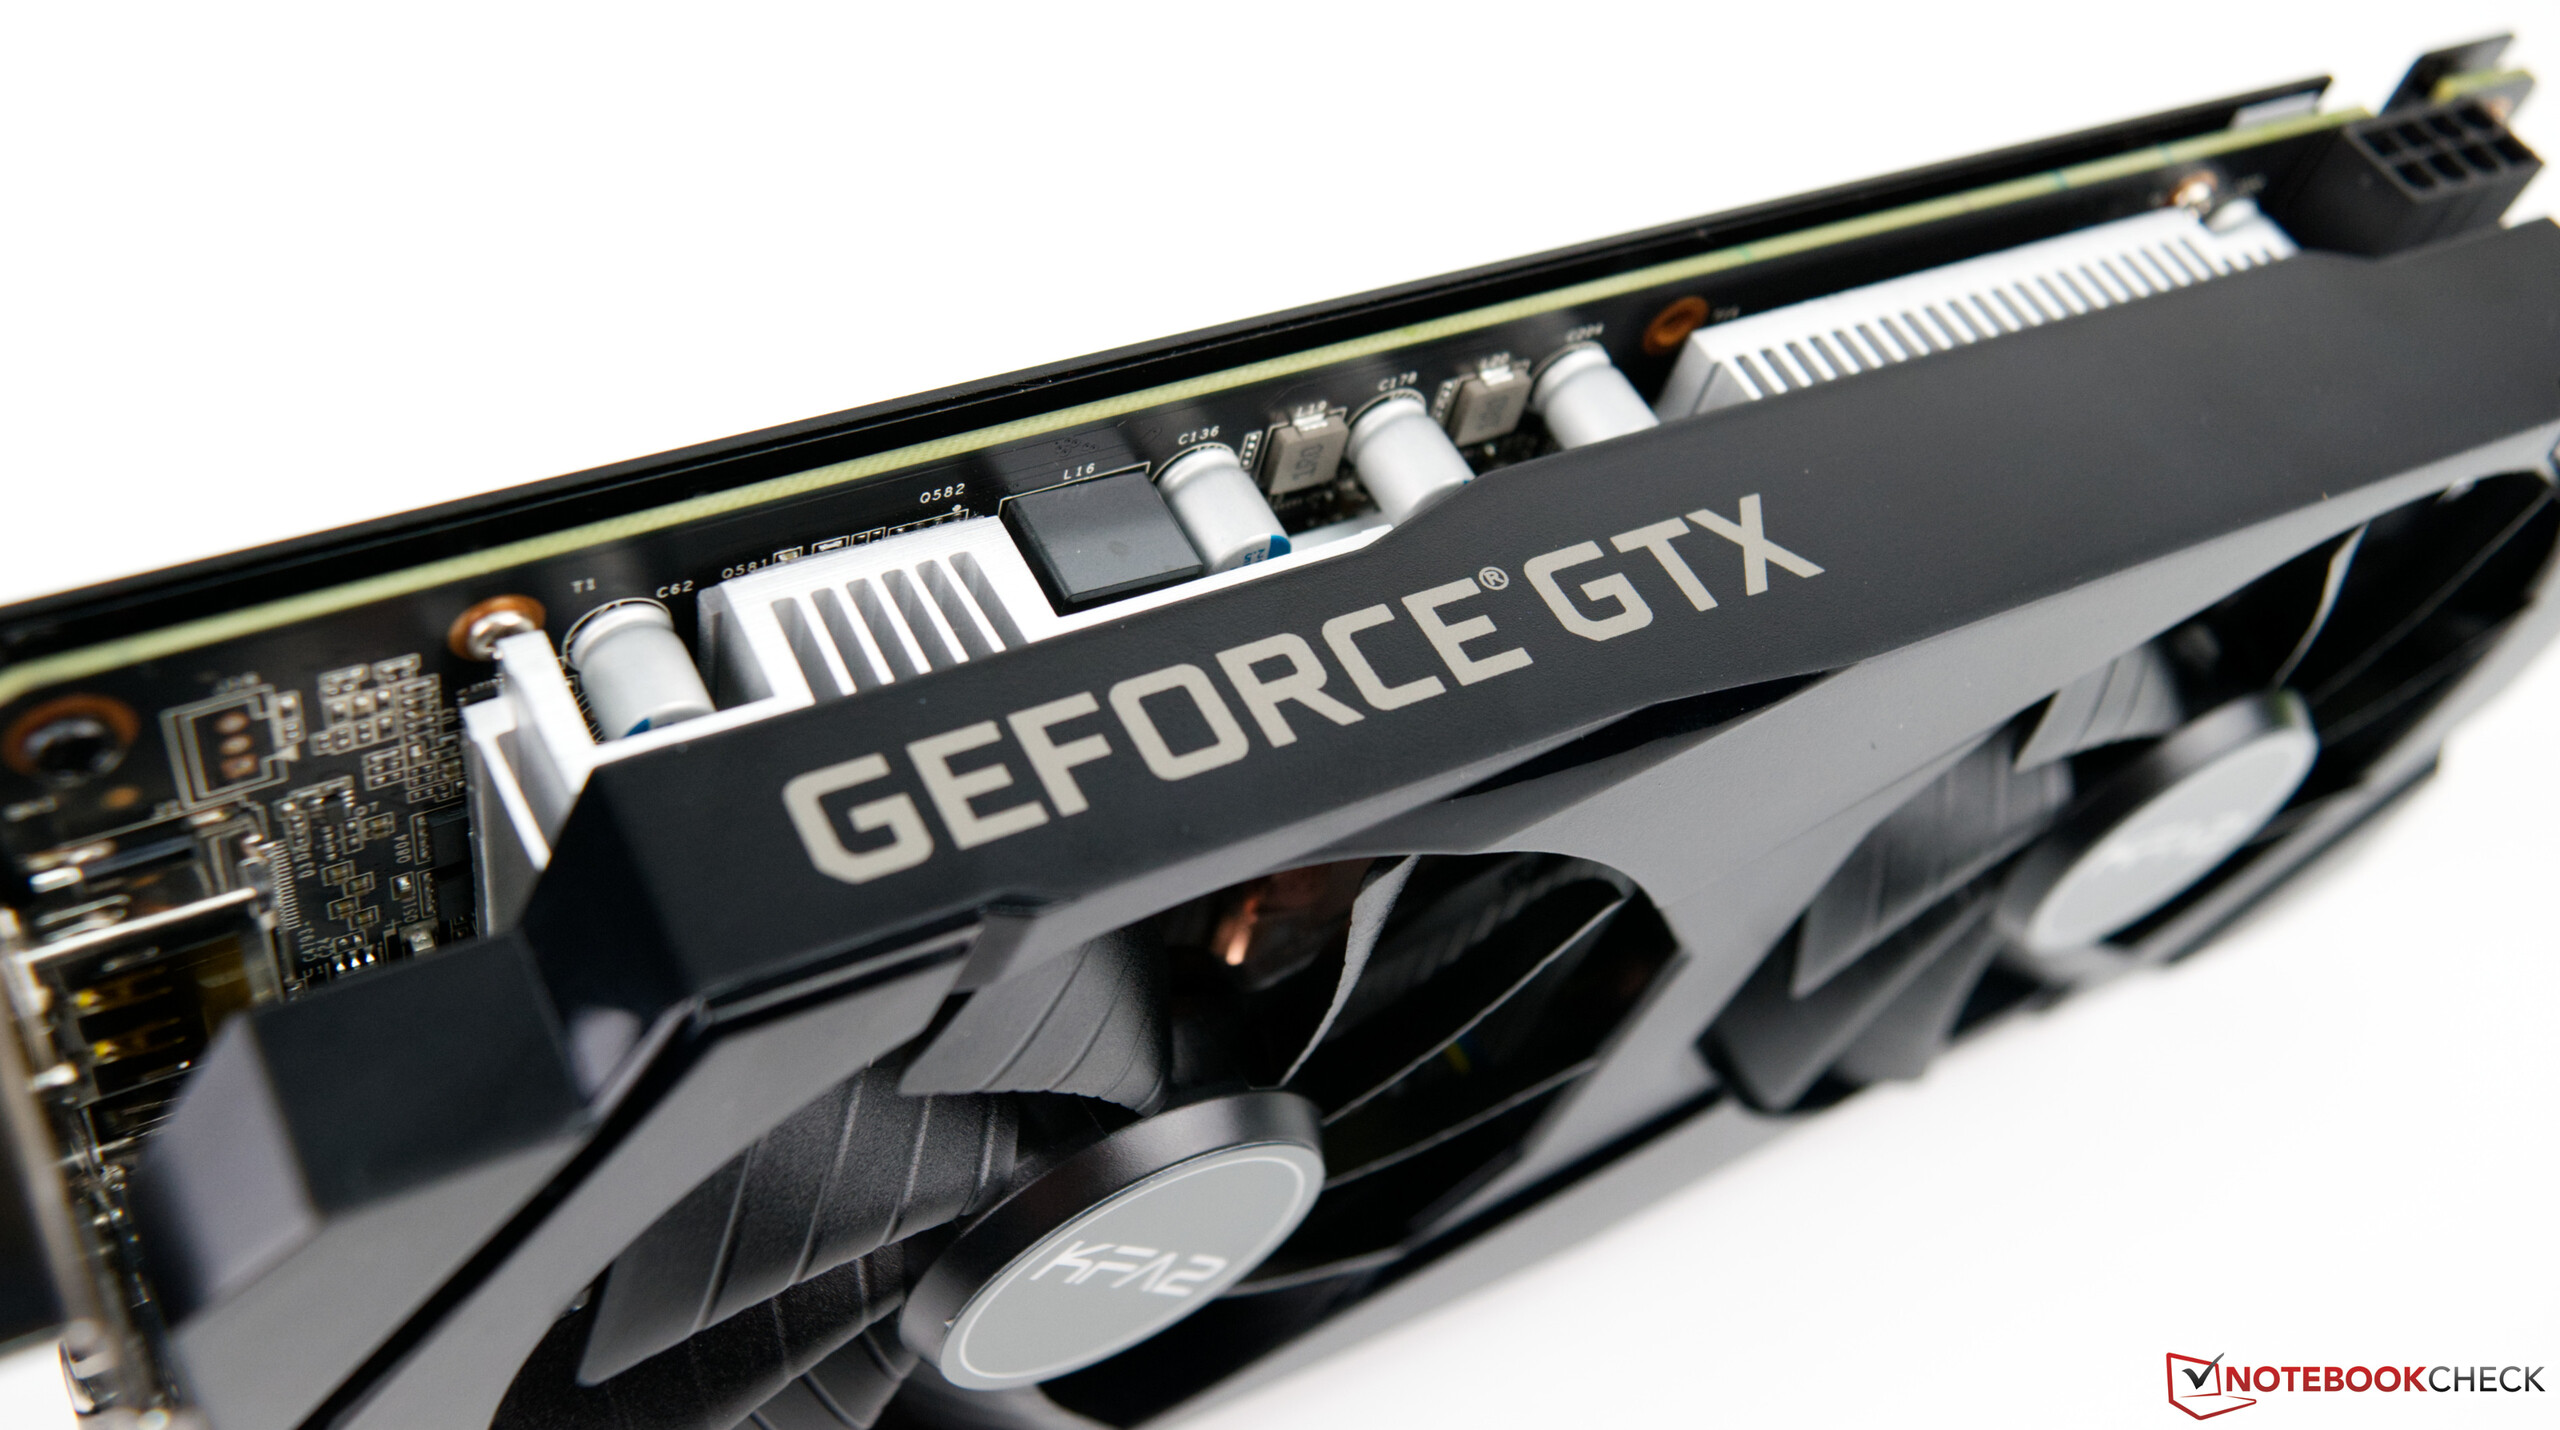
The GTX 1660 SUPER requires a dedicated power connector, as the PCIe connector can only supply up to 75 W. Hence, KFA2 has included an 8-pin power connector, as PNY did with the GeForce GTX 1660
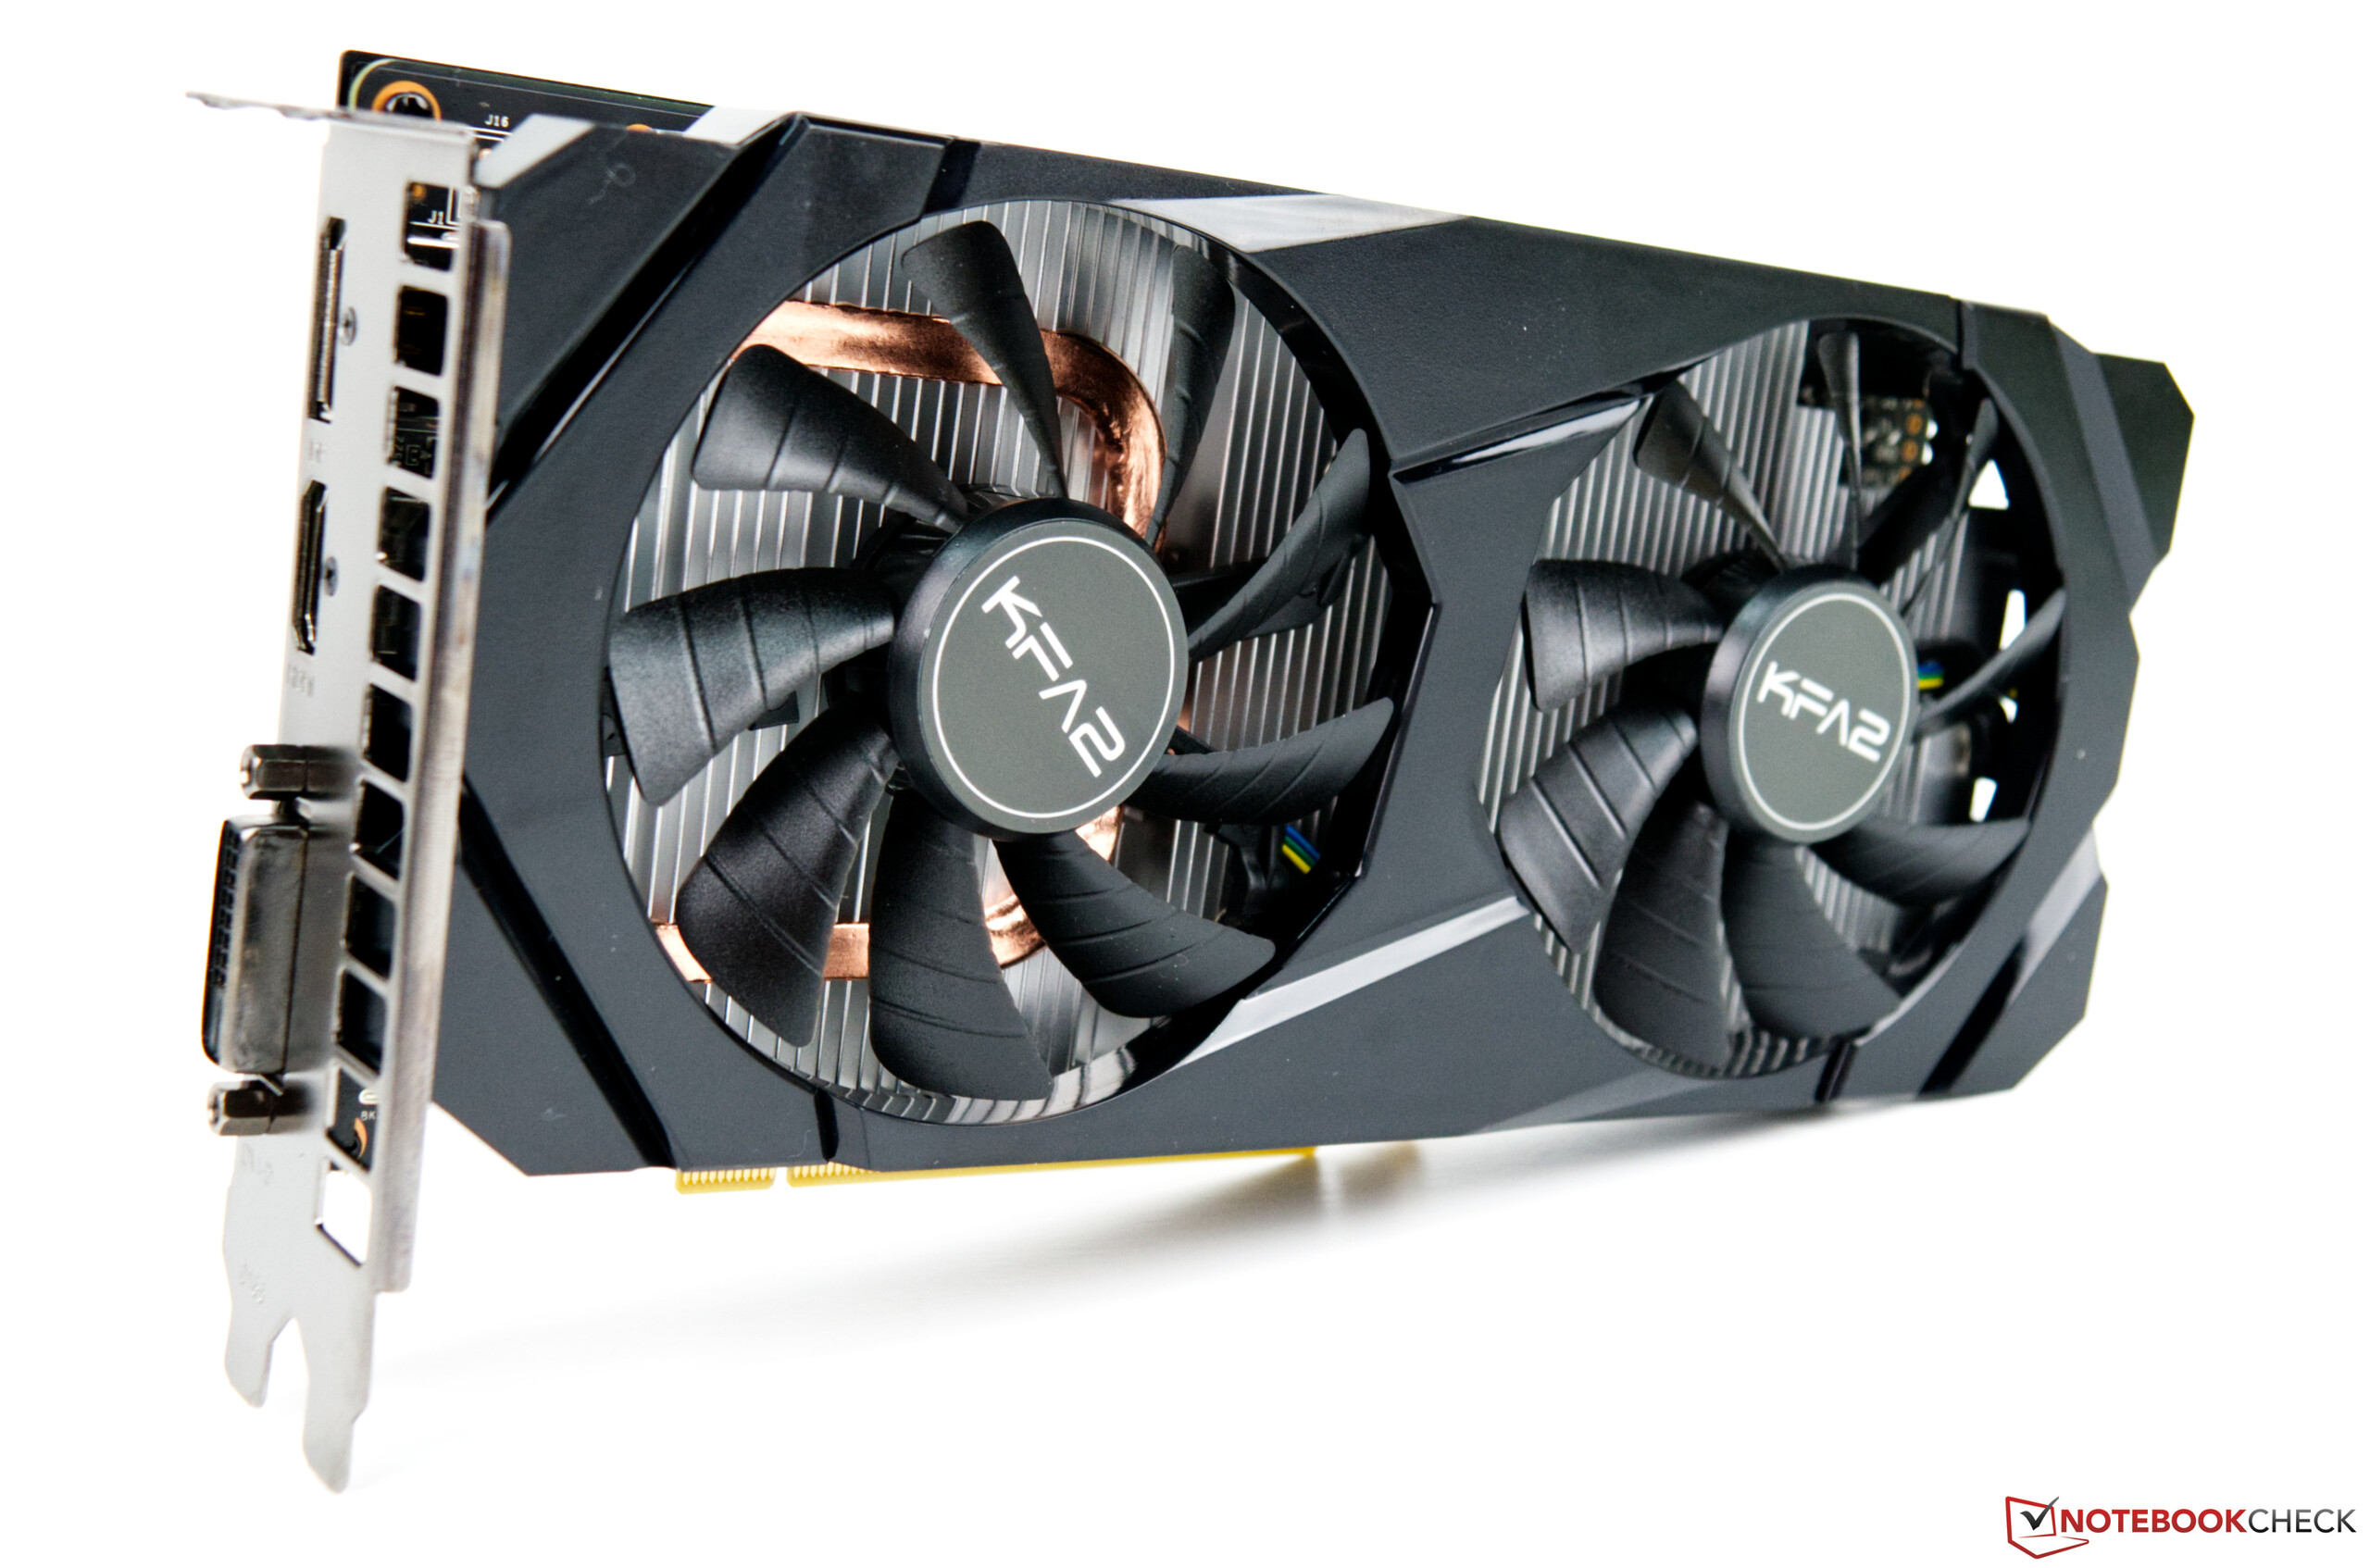
The KFA2 GeForce GTX 1660 SUPER has one HDMI 2.0b port, along with single DVI and DisplayPort connections. The company includes 24 months' warranty on each unit too. Please see our Guarantees, Return Policies & Warranties FAQ for more information.
Specifications
GTX 1650
GTX 1660
GTX 1660 Super GTX 1660 Ti
RTX 2060
RTX 2070
RTX 2080
RTX 2080 Ti
Chip
TU117
TU116
TU116 TU116
TU106
TU106
TU104
TU102
FinFET process
12 nm
12 nm
12 nm 12 nm
12 nm
12 nm
12 nm
12 nm
CUDA cores
896
1,408
1,408 1,536
1,920
2,304
2,944
4,352
Texture units
56
88
88 96
120
144
184
272
Tensor cores
-
-
- -
240
288
368
544
RT Cores
-
-
- -
30
36
46
68
GPU base clock
1,485 MHz
1,530 MHz
1,530 MHz 1,500 MHz
1,365 MHz
1,410 MHz
1,515 MHz
1,350 MHz
GPU boost clock
1,665 MHz
1,785 MHz
1,785 MHz 1,770 MHz
1,680 MHz
1,620 MHz
1,710 MHz
1,545 MHz
Memory bus
128-Bit
192-Bit
192-Bit 192-Bit
192-Bit
256-Bit
256-Bit
352-Bit
Memory bandwidth
128 GB/s
192.1 GB/s
336 GB/s 288 GB/s
336 GB/s
448 GB/s
448 GB/s
616 GB/s
VRAM
4 GB GDDR5
6 GB GDDR5
6 GB GDDR6 6 GB GDDR6
6 GB GDDR6
8 GB GDDR6
8 GB GDDR6
11 GB GDDR6
TDP
75 W
120 W
125 W 120 W
160 W
175 W
215 W
250 W
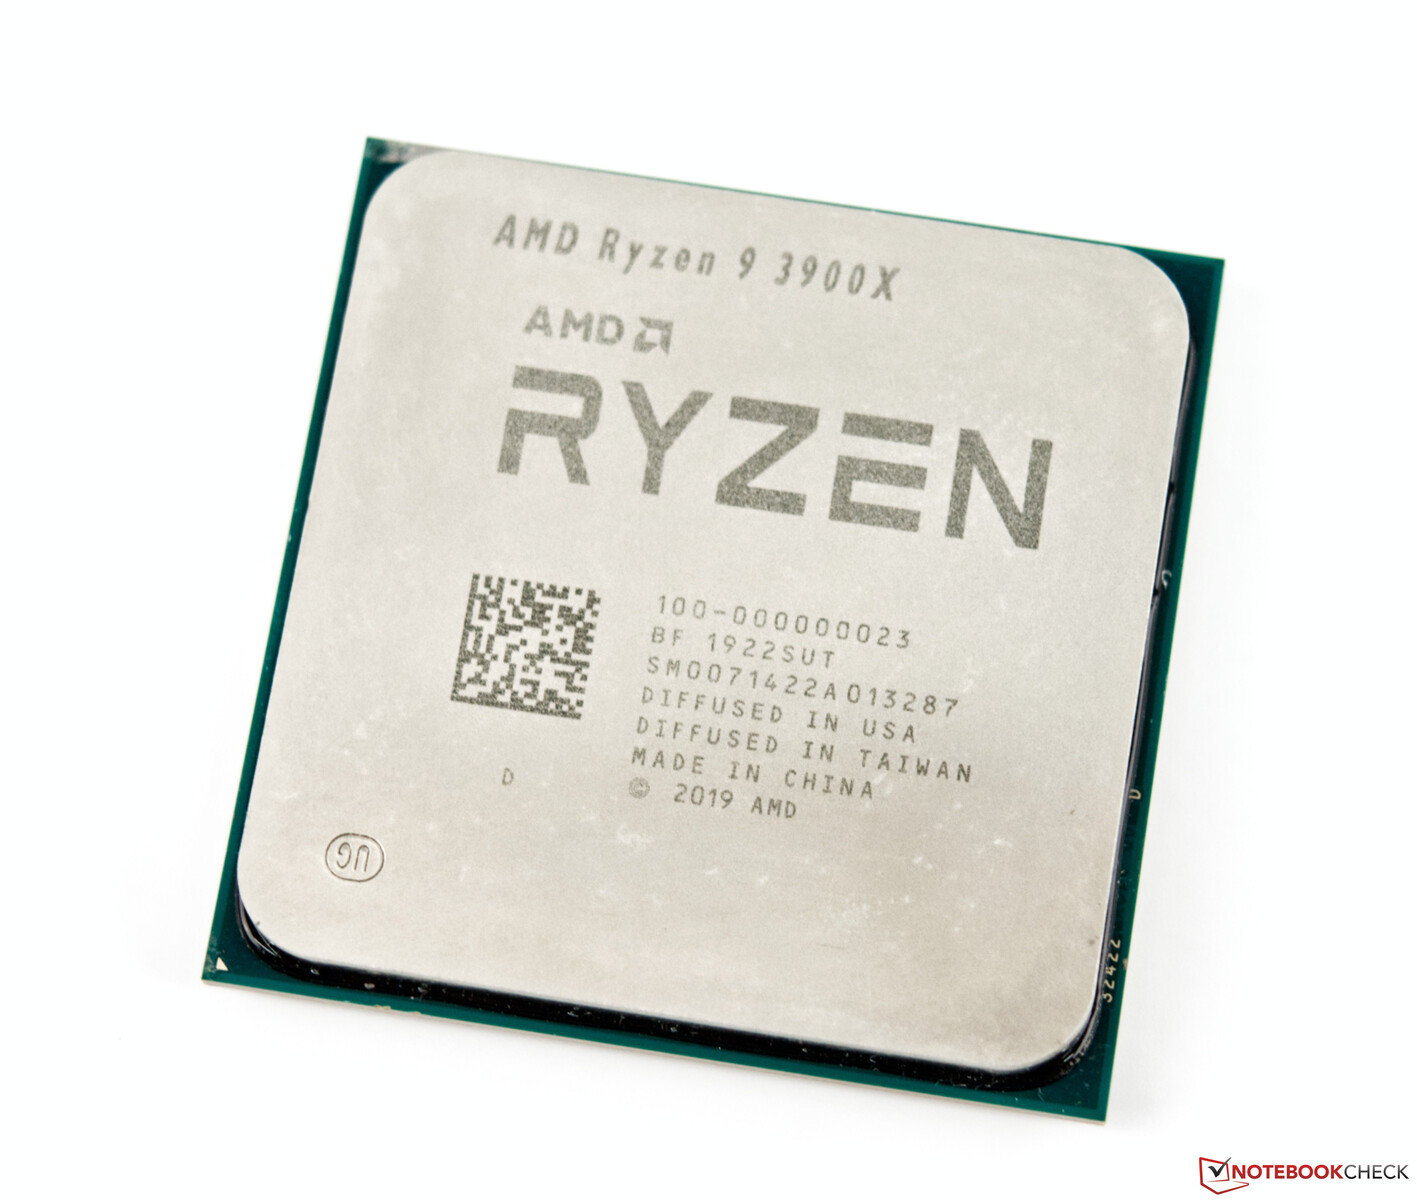
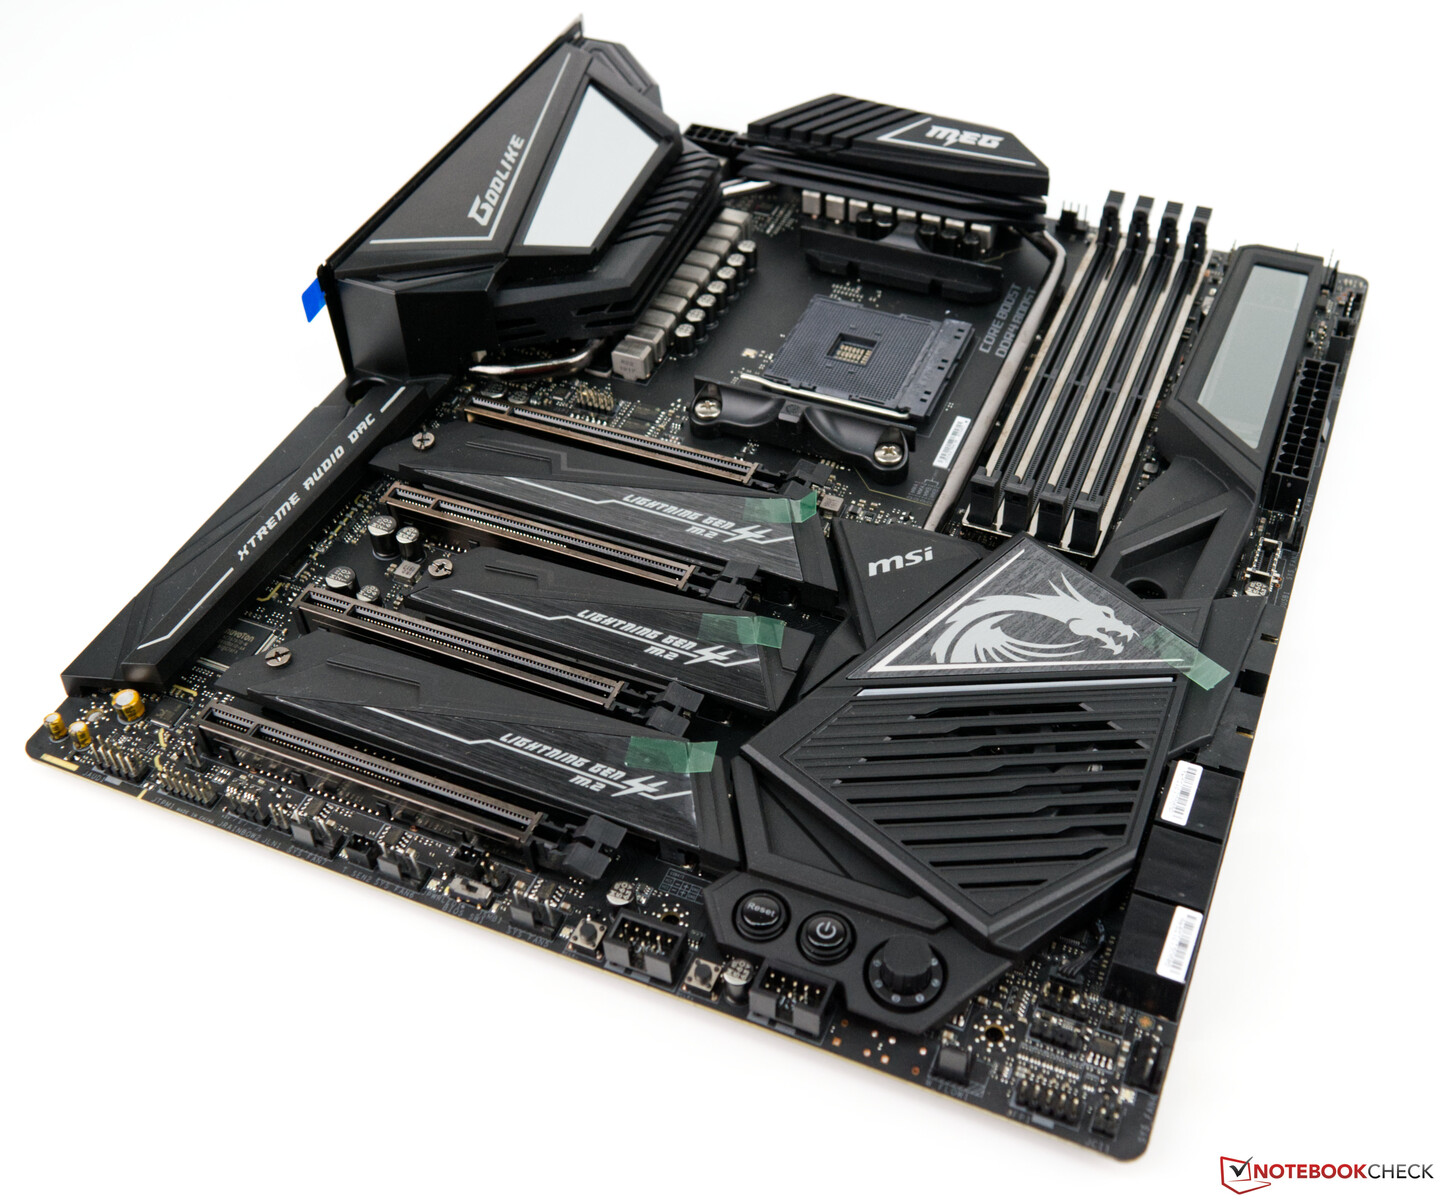
We paired the GTX 1660 SUPER with an MSI MEG X570 Godlike motherboard and an AMD Ryzen 9 3900X processor for our tests. The Ryzen 9 3900X offers excellent performance as we discovered in our review earlier this year, and we used a Be Quiet Silent Loop 280 mm AIO to keep it cool. We also used 16 GB of G-Skill Trident Z Royal Gold RAM that we left clocked at 3,600 MHz on CL16-16-16-36. Finally, we ran all our benchmarks and tests on an Acer Predator XB321HK, a 4K monitor that we have used in many of our gaming reviews.
A big thank you to AMD for kindly providing us with this test platform.
AMD Ryzen 9 3900X MSI MEG X570 Godlike G-Skill Trident Z Royal Gold DDR4-3600
We used the following hardware for our tests and benchmarks:
Case
Corsair Carbide Air 540 ATX Cube
CPU
AMD Ryzen 9 3900X
GPU
KFA2 GeForce GTX 1660 SUPER (1-Click OC)
CPU cooler
Be Quiet Silent Loop 280 mm
RAM
G-Skill Trident Z Royal Gold DDR4-3600 2 x 8 GB (DDR4-3600 CL16-16-16-36)
Motherboard
MSI MEG X570 Godlike (BIOS 1.20, Default Settings, XMP 1 for DDR4-3600 CL16)
Monitor
Acer Predator XB321HK 4K
Power supply
Corsair RM 1000X
SSD
Corsair MP600 2 TB M.2 PCIe 4.0 SSD
SDD
Western Digital SN720 512 GB - for games
SSD
Crucial MX500 2 TB - for games
OS
Microsoft Windows 10 Professional 64-Bit (Version 1903)
Drivers
NVIDIA 441.20
The synthetic benchmarks give you a taste of what to expect from the KFA2 GeForce GTX 1660 SUPER. The graphics card sits just behind the GeForce GTX 1660 Ti AMD Radeon RX 590 has the edge over NVIDIA's latest mid-range card, albeit by about 2%. You will need to step up to a GeForce RTX 2060 or Radeon RX 5700 if you consistently want more performance than the GTX 1660 SUPER offers, but these two cards are also considerably more expensive than our review unit.
3DMark 05 Standard
53106 points 3DMark 06 Standard Score
44443 points 3DMark Vantage P Result
60318 points 3DMark 11 Performance
20610 points 3DMark Ice Storm Standard Score
195904 points 3DMark Cloud Gate Standard Score
48162 points 3DMark Fire Strike Score
14656 points 3DMark Fire Strike Extreme Score
6980 points 3DMark Time Spy Score
6508 points
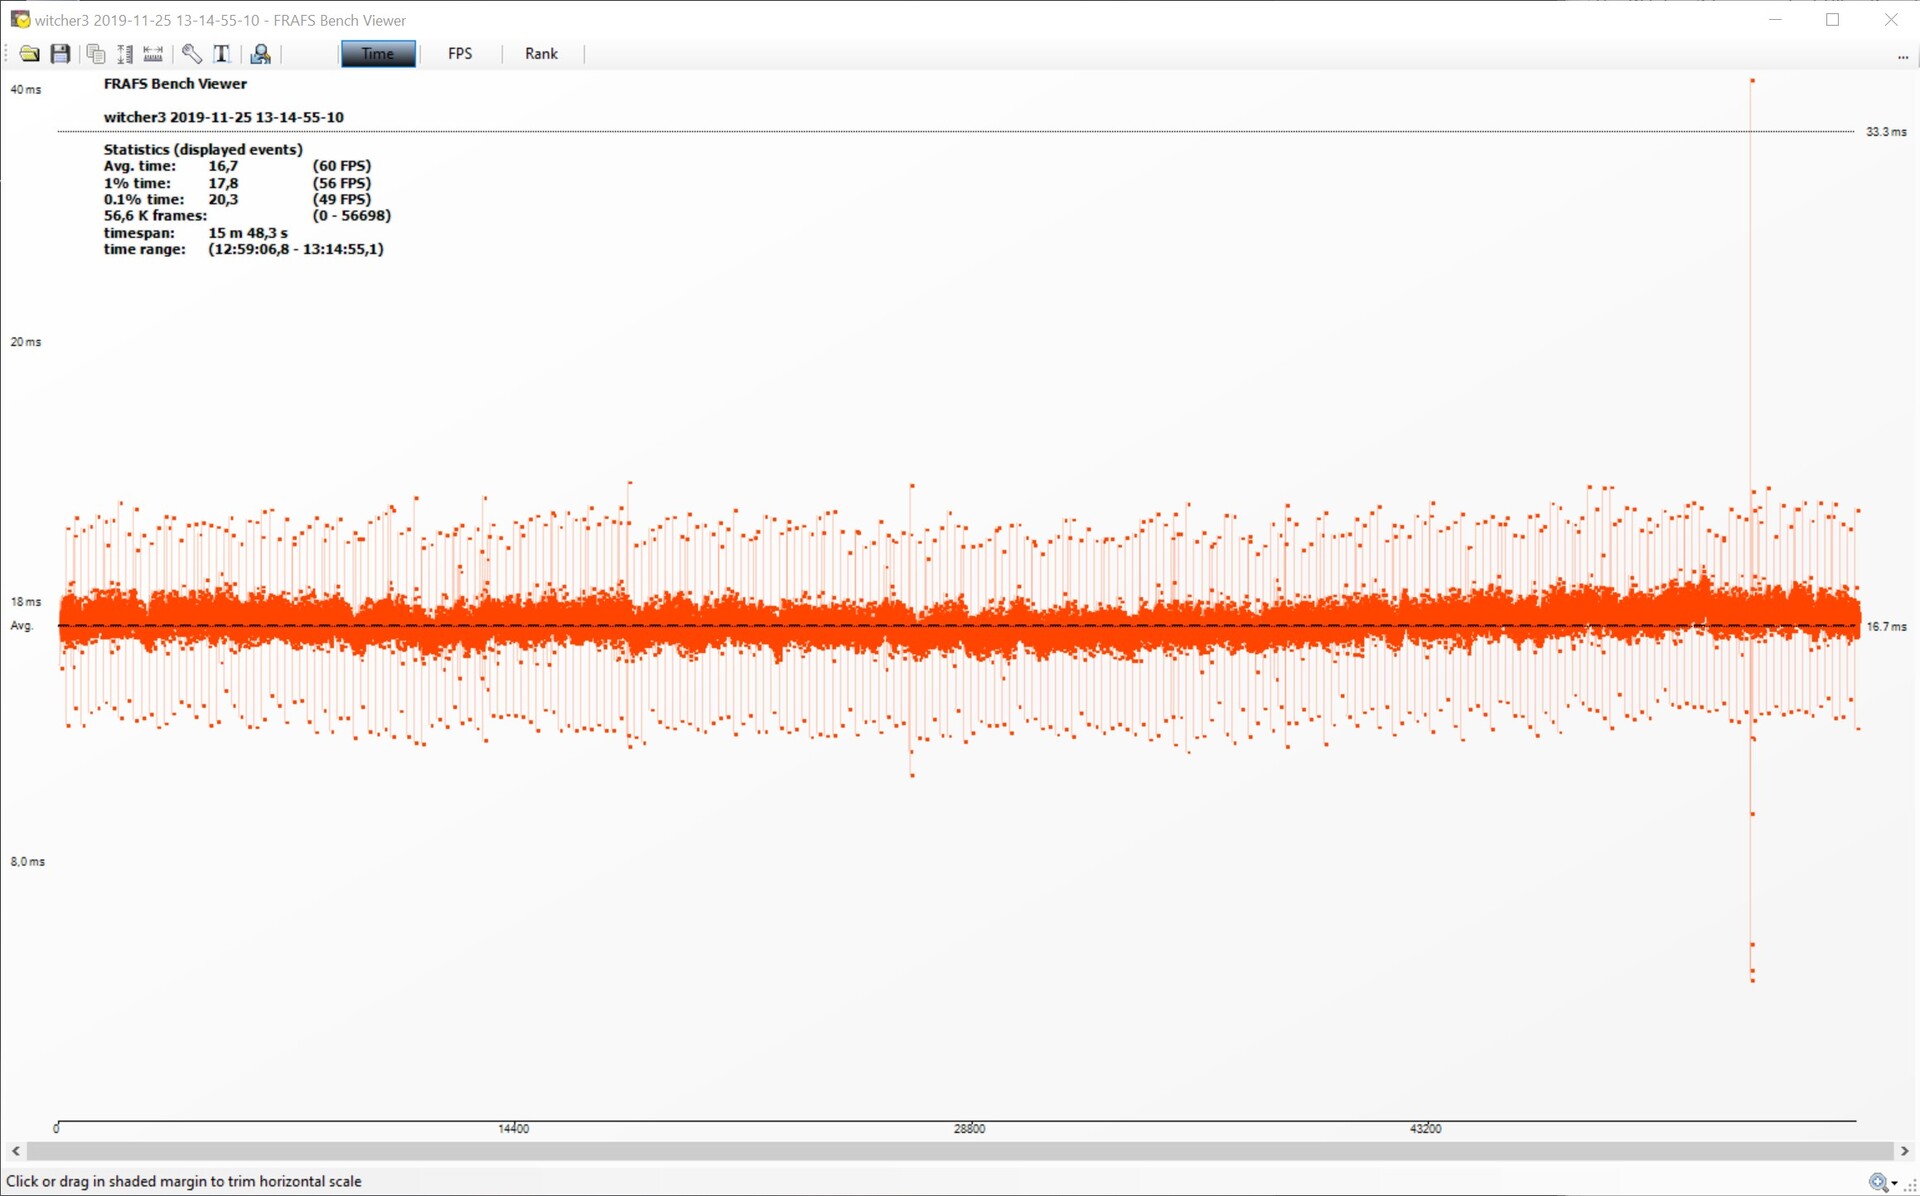
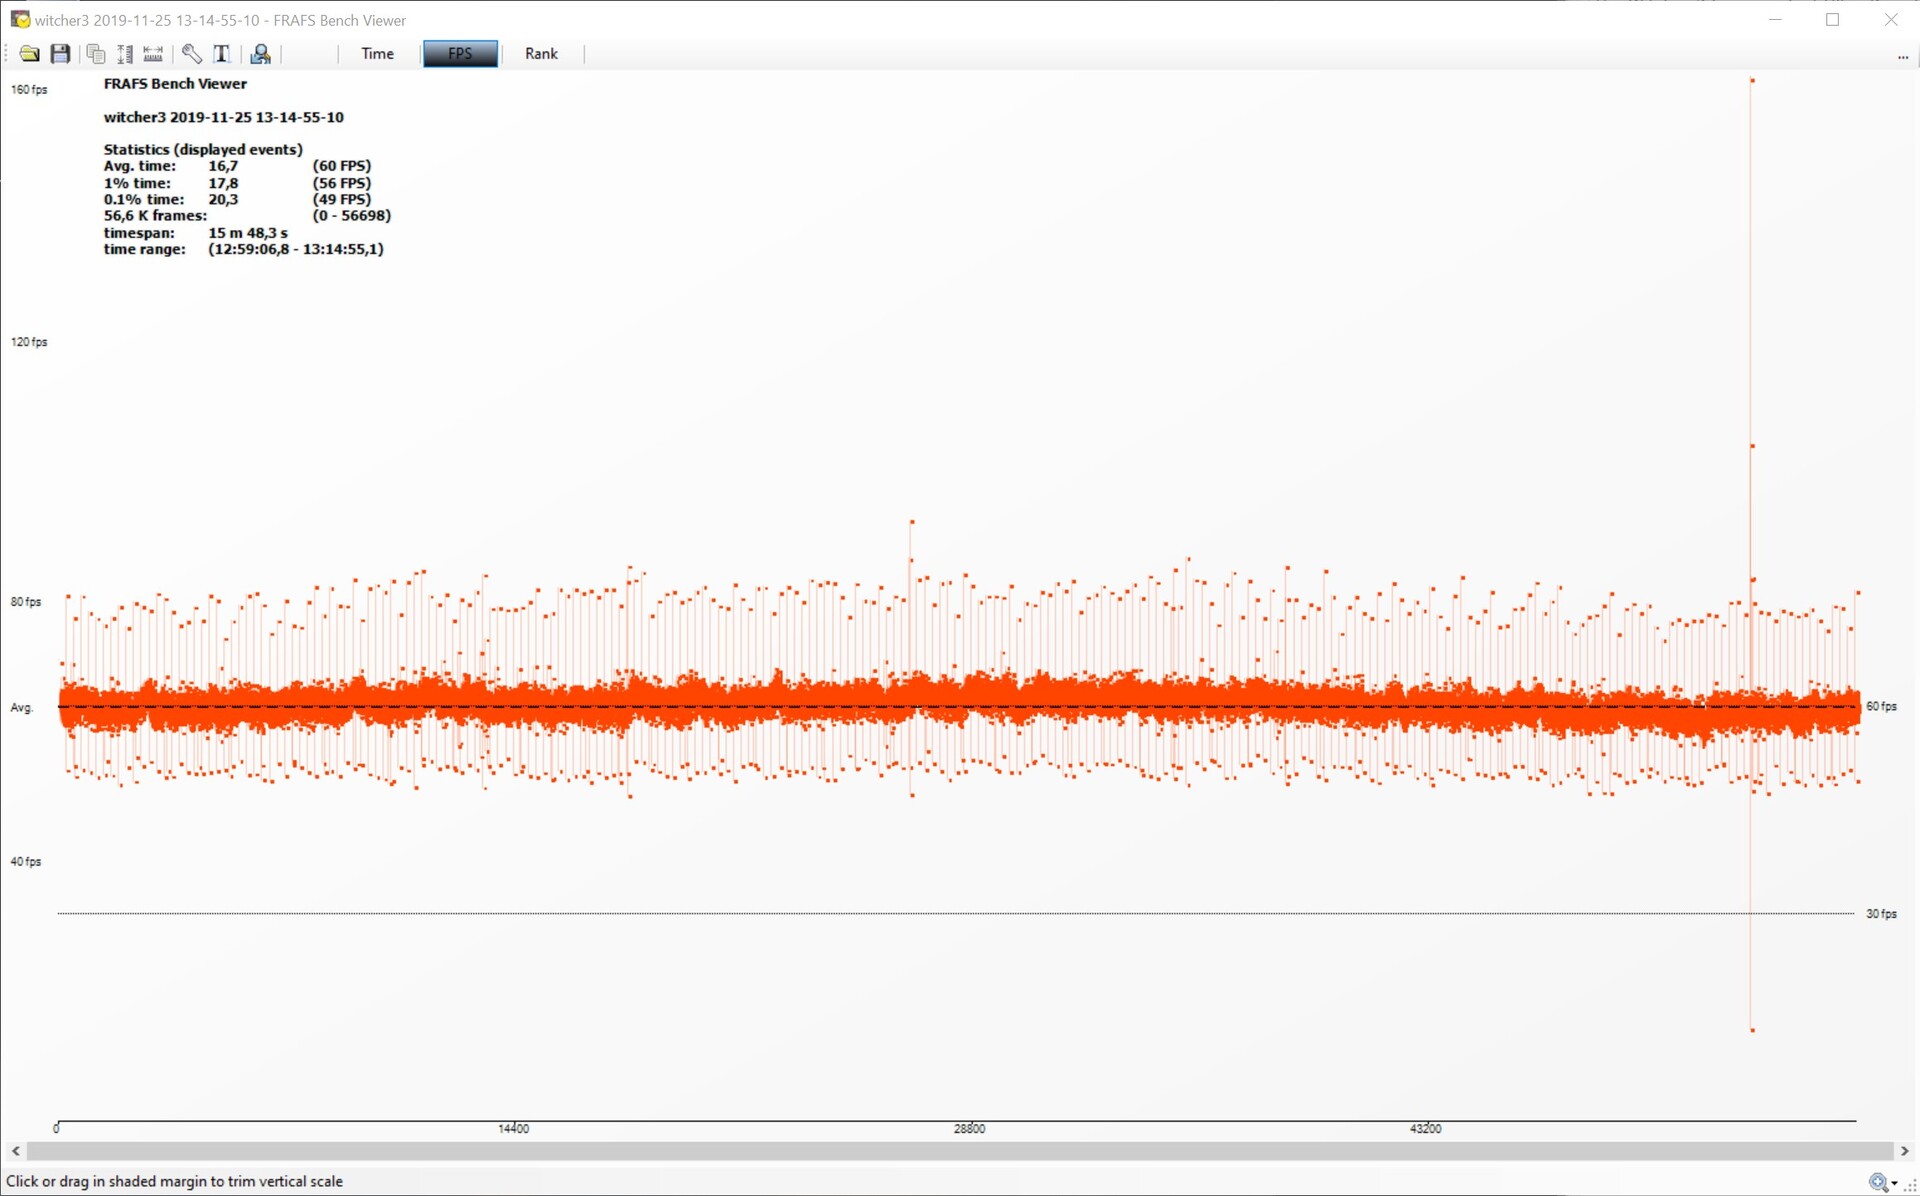
The Witcher 3: Response times – ultra preset The Witcher 3: Frame rates – ultra preset The KFA2 GeForce GTX 1660 SUPER convinced us of its credentials in our gaming tests too. Our review unit generally offered between 10 and 20% more frame rates than the regular GeForce GTX 1660 did, making it more suitable for 1080p gaming at high or ultra graphics settings than its lesser-powered sibling. In fact, some titles like Dota 2 Reborn FIFA 20 Rocket League
In terms of relative performance, the GTX 1660 SUPER again generally falls behind the GeForce GTX 1660 Ti GeForce GTX 1660 Ti Radeon RX 590 also had the measure of the GTX 1660 SUPER.
In summary, the KFA2 GeForce GTX 1660 Super is powerful enough to play all but the most complex triple-A titles at maximum graphics in 1080p. Only a few titles like Anno 1800 and Metro Exodus average below 60 FPS, but dropping the graphics preset to high generally boosts average frame rates above that 60 FPS threshold.
We also left The Witcher 3
0 5 10 15 20 25 30 35 40 45 50 55 60 Tooltip
AMD Radeon RX 5700 XTRadeon RX 5700 XT (Desktop), R9 3900X AMD Radeon RX 5700 XT Radeon RX 5700 XT (Desktop), R7 2700X AMD Radeon RX 5700 Radeon RX 5700 (Desktop), R7 2700X Nvidia GeForce RTX 2060 Super GeForce RTX 2060 Super (Desktop), R7 2700X KFA 2 GeForce GTX 1660 Super GeForce GTX 1660 Super (Desktop), R9 3900X PNY GeForce GTX 1660 GeForce GTX 1660 (Desktop), R9 3900X Zotac GeForce GTX 1660 Ti 6 GB GeForce GTX 1660 Ti (Desktop), R7 2700X XFX AMD Radeon RX 590 OC+ 8 GB Radeon RX 590, R7 2700X Sapphire NITRO+ RX 570 8 GBRadeon RX 570, R7 2700X Gainward GeForce GTX 1650 4 GBGeForce GTX 1650 (Desktop), R7 2700X
AMD Radeon RX 5700 XTRadeon RX 5700 XT (Desktop), R9 3900X
110 (85min - 145max ) fps+20%
Nvidia GeForce RTX 2060 Super GeForce RTX 2060 Super (Desktop), R7 2700X
99 (75min - 131max ) fps+8%
AMD Radeon RX 5700 XT Radeon RX 5700 XT (Desktop), R7 2700X
96 (75min - 127max ) fps+4%
KFA 2 GeForce GTX 1660 Super GeForce GTX 1660 Super (Desktop), R9 3900X Zotac GeForce GTX 1660 Ti 6 GB GeForce GTX 1660 Ti (Desktop), R7 2700X
91 (78min - 105max ) fps-1%
AMD Radeon RX 5700 Radeon RX 5700 (Desktop), R7 2700X
84 (59min - 114max ) fps-9%
PNY GeForce GTX 1660 GeForce GTX 1660 (Desktop), R9 3900X
82 (73min - 93max ) fps-11%
XFX AMD Radeon RX 590 OC+ 8 GB Radeon RX 590, R7 2700X
74 (67min - 88max ) fps-20%
Sapphire NITRO+ RX 570 8 GBRadeon RX 570, R7 2700X
65 (58min - 79max ) fps-29%
Gainward GeForce GTX 1650 4 GBGeForce GTX 1650 (Desktop), R7 2700X
56 (50min - 66max ) fps-39%
AMD Radeon RX 5700 XTRadeon RX 5700 XT (Desktop), R9 3900X
94 (86min - 103max ) fps+58%
AMD Radeon RX 5700 XT Radeon RX 5700 XT (Desktop), R7 2700X
92 (79min - 99max ) fps+55%
AMD Radeon RX 5700 Radeon RX 5700 (Desktop), R7 2700X
80 (70min - 87max ) fps+34%
Nvidia GeForce RTX 2060 Super GeForce RTX 2060 Super (Desktop), R7 2700X
79 (67min - 89max ) fps+33%
Zotac GeForce GTX 1660 Ti 6 GB GeForce GTX 1660 Ti (Desktop), R7 2700X
62 (43min - 74max ) fps+4%
KFA 2 GeForce GTX 1660 Super GeForce GTX 1660 Super (Desktop), R9 3900X PNY GeForce GTX 1660 GeForce GTX 1660 (Desktop), R9 3900X
55.5 (50min - 63max ) fps-7%
XFX AMD Radeon RX 590 OC+ 8 GB Radeon RX 590, R7 2700X
50.8 (42min - 57max ) fps-15%
Gainward GeForce GTX 1650 4 GBGeForce GTX 1650 (Desktop), R7 2700X
43 (37min - 47max ) fps-28%
Sapphire NITRO+ RX 570 8 GBRadeon RX 570, R7 2700X
43 (37min - 47max ) fps-28%
AMD Radeon RX 5700 XTRadeon RX 5700 XT (Desktop), R9 3900X
97 (69min - 147max ) fps+11%
KFA 2 GeForce GTX 1660 Super GeForce GTX 1660 Super (Desktop), R9 3900X Nvidia GeForce RTX 2060 Super GeForce RTX 2060 Super (Desktop), R7 2700X
85 (63min - 134max ) fps-2%
Zotac GeForce GTX 1660 Ti 6 GB GeForce GTX 1660 Ti (Desktop), R7 2700X
84 (65min - 110max ) fps-3%
AMD Radeon RX 5700 Radeon RX 5700 (Desktop), R7 2700X
83 (60min - 132max ) fps-5%
PNY GeForce GTX 1660 GeForce GTX 1660 (Desktop), R9 3900X
80 (64min - 96max ) fps-8%
AMD Radeon RX 5700 XT Radeon RX 5700 XT (Desktop), R7 2700X
79 (58min - 120max ) fps-9%
XFX AMD Radeon RX 590 OC+ 8 GB Radeon RX 590, R7 2700X
76 (58min - 102max ) fps-13%
Sapphire NITRO+ RX 570 8 GBRadeon RX 570, R7 2700X
66 (49min - 86max ) fps-24%
Gainward GeForce GTX 1650 4 GBGeForce GTX 1650 (Desktop), R7 2700X
55 (44min - 67max ) fps-37%
AMD Radeon RX 5700 XT Radeon RX 5700 XT (Desktop), R7 2700X
88 (30.2min , 50P1 ) fps+40%
Nvidia GeForce RTX 2060 Super GeForce RTX 2060 Super (Desktop), R7 2700X AMD Radeon RX 5700 Radeon RX 5700 (Desktop), R7 2700X
78 (14.6min , 42.2P1 ) fps+24%
Zotac GeForce GTX 1660 Ti 6 GB GeForce GTX 1660 Ti (Desktop), R7 2700X KFA 2 GeForce GTX 1660 Super GeForce GTX 1660 Super (Desktop), R9 3900X XFX AMD Radeon RX 590 OC+ 8 GB Radeon RX 590, R7 2700X PNY GeForce GTX 1660 GeForce GTX 1660 (Desktop), R9 3900X Sapphire NITRO+ RX 570 8 GBRadeon RX 570, R7 2700X Gainward GeForce GTX 1650 4 GBGeForce GTX 1650 (Desktop), R7 2700X
AMD Radeon RX 5700 XTRadeon RX 5700 XT (Desktop), R9 3900X
45 (37min - 58max ) fps+11%
AMD Radeon RX 5700 XT Radeon RX 5700 XT (Desktop), R7 2700X
40.9 (35min - 53max ) fps+1%
KFA 2 GeForce GTX 1660 Super GeForce GTX 1660 Super (Desktop), R9 3900X Nvidia GeForce RTX 2060 Super GeForce RTX 2060 Super (Desktop), R7 2700X
40.3 (30min - 55max ) fps-1%
AMD Radeon RX 5700 Radeon RX 5700 (Desktop), R7 2700X
38.9 (33min - 48max ) fps-4%
Zotac GeForce GTX 1660 Ti 6 GB GeForce GTX 1660 Ti (Desktop), R7 2700X
35.9 (32min - 41max ) fps-12%
PNY GeForce GTX 1660 GeForce GTX 1660 (Desktop), R9 3900X
34.9 (32min - 40max ) fps-14%
Gainward GeForce GTX 1650 4 GBGeForce GTX 1650 (Desktop), R7 2700X
26.3 (23min - 29max ) fps-35%
Sapphire NITRO+ RX 570 8 GBRadeon RX 570, R7 2700X
25.1 (23min - 27max ) fps-38%
XFX AMD Radeon RX 590 OC+ 8 GB Radeon RX 590, R7 2700X
23.3 (21min - 25max ) fps-43%
AMD Radeon RX 5700 XTRadeon RX 5700 XT (Desktop), R9 3900X
152 (129min - 171max ) fps+75%
AMD Radeon RX 5700 XT Radeon RX 5700 XT (Desktop), R7 2700X
140 (120min - 156max ) fps+61%
AMD Radeon RX 5700 Radeon RX 5700 (Desktop), R7 2700X
124 (107min - 140max ) fps+43%
Nvidia GeForce RTX 2060 Super GeForce RTX 2060 Super (Desktop), R7 2700X
121 (108min - 136max ) fps+39%
KFA 2 GeForce GTX 1660 Super GeForce GTX 1660 Super (Desktop), R9 3900X XFX AMD Radeon RX 590 OC+ 8 GB Radeon RX 590, R7 2700X
86 (77min - 98max ) fps-1%
PNY GeForce GTX 1660 GeForce GTX 1660 (Desktop), R9 3900X
82 (71min - 92max ) fps-6%
Sapphire NITRO+ RX 570 8 GBRadeon RX 570, R7 2700X
72 (65min - 80max ) fps-17%
Gainward GeForce GTX 1650 4 GBGeForce GTX 1650 (Desktop), R7 2700X
52 (42min - 64max ) fps-40%
AMD Radeon RX 5700 XTRadeon RX 5700 XT (Desktop), R9 3900X AMD Radeon RX 5700 XT Radeon RX 5700 XT (Desktop), R7 2700X Nvidia GeForce RTX 2060 Super GeForce RTX 2060 Super (Desktop), R7 2700X AMD Radeon RX 5700 Radeon RX 5700 (Desktop), R7 2700X KFA 2 GeForce GTX 1660 Super GeForce GTX 1660 Super (Desktop), R9 3900X Zotac GeForce GTX 1660 Ti 6 GB GeForce GTX 1660 Ti (Desktop), R7 2700X PNY GeForce GTX 1660 GeForce GTX 1660 (Desktop), R9 3900X XFX AMD Radeon RX 590 OC+ 8 GB Radeon RX 590, R7 2700X Sapphire NITRO+ RX 570 8 GBRadeon RX 570, R7 2700X Gainward GeForce GTX 1650 4 GBGeForce GTX 1650 (Desktop), R7 2700X
AMD Radeon RX 5700Radeon RX 5700 (Desktop), R9 3900X AMD Radeon RX 5700 XTRadeon RX 5700 XT (Desktop), R9 3900X XFX AMD Radeon RX 590 OC+ 8 GBRadeon RX 590, R9 3900X Nvidia GeForce RTX 2060 SuperGeForce RTX 2060 Super (Desktop), R9 3900X PNY GeForce GTX 1660 GeForce GTX 1660 (Desktop), R9 3900X KFA 2 GeForce GTX 1660 Super GeForce GTX 1660 Super (Desktop), R9 3900X Sapphire NITRO+ RX 570 8 GBRadeon RX 570, R9 3900X Gainward GeForce GTX 1650 4 GBGeForce GTX 1650 (Desktop), R9 3900X
AMD Radeon RX 5700 XTRadeon RX 5700 XT (Desktop), R9 3900X
83 (72min - 95max ) fps+47%
Nvidia GeForce RTX 2060 SuperGeForce RTX 2060 Super (Desktop), R9 3900X
80 (70min - 91max ) fps+42%
AMD Radeon RX 5700Radeon RX 5700 (Desktop), R9 3900X
73 (63min - 83max ) fps+30%
KFA 2 GeForce GTX 1660 Super GeForce GTX 1660 Super (Desktop), R9 3900X PNY GeForce GTX 1660 GeForce GTX 1660 (Desktop), R9 3900X
52.5 (45min - 60max ) fps-7%
XFX AMD Radeon RX 590 OC+ 8 GBRadeon RX 590, R9 3900X
48.3 (42min - 56max ) fps-14%
Sapphire NITRO+ RX 570 8 GBRadeon RX 570, R9 3900X
40.2 (34min - 46max ) fps-29%
Gainward GeForce GTX 1650 4 GBGeForce GTX 1650 (Desktop), R9 3900X
33.3 (28min - 39max ) fps-41%
AMD Radeon RX 5700 XTRadeon RX 5700 XT (Desktop), R9 3900X Nvidia GeForce RTX 2060 SuperGeForce RTX 2060 Super (Desktop), R9 3900X AMD Radeon RX 5700Radeon RX 5700 (Desktop), R9 3900X KFA 2 GeForce GTX 1660 Super GeForce GTX 1660 Super (Desktop), R9 3900X PNY GeForce GTX 1660 GeForce GTX 1660 (Desktop), R9 3900X XFX AMD Radeon RX 590 OC+ 8 GBRadeon RX 590, R9 3900X Sapphire NITRO+ RX 570 8 GBRadeon RX 570, R9 3900X Gainward GeForce GTX 1650 4 GBGeForce GTX 1650 (Desktop), R9 3900X
AMD Radeon RX 5700 XTRadeon RX 5700 XT (Desktop), R9 3900X
80 (35min - 125max ) fps+45%
Nvidia GeForce RTX 2060 SuperGeForce RTX 2060 Super (Desktop), R9 3900X
71 (24min - 106max ) fps+29%
AMD Radeon RX 5700Radeon RX 5700 (Desktop), R9 3900X
68 (36min - 104max ) fps+24%
KFA 2 GeForce GTX 1660 Super GeForce GTX 1660 Super (Desktop), R9 3900X PNY GeForce GTX 1660 GeForce GTX 1660 (Desktop), R9 3900X
49 (30min - 69max ) fps-11%
XFX AMD Radeon RX 590 OC+ 8 GBRadeon RX 590, R9 3900X
46 (34min - 67max ) fps-16%
Sapphire NITRO+ RX 570 8 GBRadeon RX 570, R9 3900X
45 (35min - 75max ) fps-18%
Gainward GeForce GTX 1650 4 GBGeForce GTX 1650 (Desktop), R9 3900X
8 (4min - 34max ) fps-85%
AMD Radeon RX 5700 XTRadeon RX 5700 XT (Desktop), R9 3900X AMD Radeon RX 5700Radeon RX 5700 (Desktop), R9 3900X Nvidia GeForce RTX 2060 SuperGeForce RTX 2060 Super (Desktop), R9 3900X KFA 2 GeForce GTX 1660 Super GeForce GTX 1660 Super (Desktop), R9 3900X PNY GeForce GTX 1660 GeForce GTX 1660 (Desktop), R9 3900X XFX AMD Radeon RX 590 OC+ 8 GBRadeon RX 590, R9 3900X Sapphire NITRO+ RX 570 8 GBRadeon RX 570, R9 3900X Gainward GeForce GTX 1650 4 GBGeForce GTX 1650 (Desktop), R9 3900X
AMD Radeon RX 5700 XTRadeon RX 5700 XT (Desktop), R9 3900X Nvidia GeForce RTX 2060 SuperGeForce RTX 2060 Super (Desktop), R9 3900X AMD Radeon RX 5700Radeon RX 5700 (Desktop), R9 3900X KFA 2 GeForce GTX 1660 Super GeForce GTX 1660 Super (Desktop), R9 3900X PNY GeForce GTX 1660 GeForce GTX 1660 (Desktop), R9 3900X XFX AMD Radeon RX 590 OC+ 8 GBRadeon RX 590, R9 3900X Sapphire NITRO+ RX 570 8 GBRadeon RX 570, R9 3900X Gainward GeForce GTX 1650 4 GBGeForce GTX 1650 (Desktop), R9 3900X
Nvidia GeForce RTX 2060 SuperGeForce RTX 2060 Super (Desktop), R9 3900X
92 (76min - 107max ) fps+19%
AMD Radeon RX 5700 XTRadeon RX 5700 XT (Desktop), R9 3900X
88 (74min - 99max ) fps+14%
AMD Radeon RX 5700Radeon RX 5700 (Desktop), R9 3900X
88 (74min - 103max ) fps+14%
KFA 2 GeForce GTX 1660 Super GeForce GTX 1660 Super (Desktop), R9 3900X PNY GeForce GTX 1660 GeForce GTX 1660 (Desktop), R9 3900X
70 (57min - 78max ) fps-9%
XFX AMD Radeon RX 590 OC+ 8 GBRadeon RX 590, R9 3900X
60 (55min - 67max ) fps-22%
Gainward GeForce GTX 1650 4 GBGeForce GTX 1650 (Desktop), R9 3900X
48.4 (38min - 56max ) fps-37%
Nvidia GeForce RTX 2060 SuperGeForce RTX 2060 Super (Desktop), R9 3900X
114 (72min - 140max ) fps+100%
AMD Radeon RX 5700 XTRadeon RX 5700 XT (Desktop), R9 3900X
108 (65min - 138max ) fps+90%
AMD Radeon RX 5700Radeon RX 5700 (Desktop), R9 3900X
102 (64min - 125max ) fps+79%
PNY GeForce GTX 1660 GeForce GTX 1660 (Desktop), R9 3900X
81 (67min - 96max ) fps+42%
XFX AMD Radeon RX 590 OC+ 8 GBRadeon RX 590, R9 3900X
64 (53min - 75max ) fps+12%
KFA 2 GeForce GTX 1660 Super GeForce GTX 1660 Super (Desktop), R9 3900X Gainward GeForce GTX 1650 4 GBGeForce GTX 1650 (Desktop), R9 3900X
52.8 (46min - 61max ) fps-7%
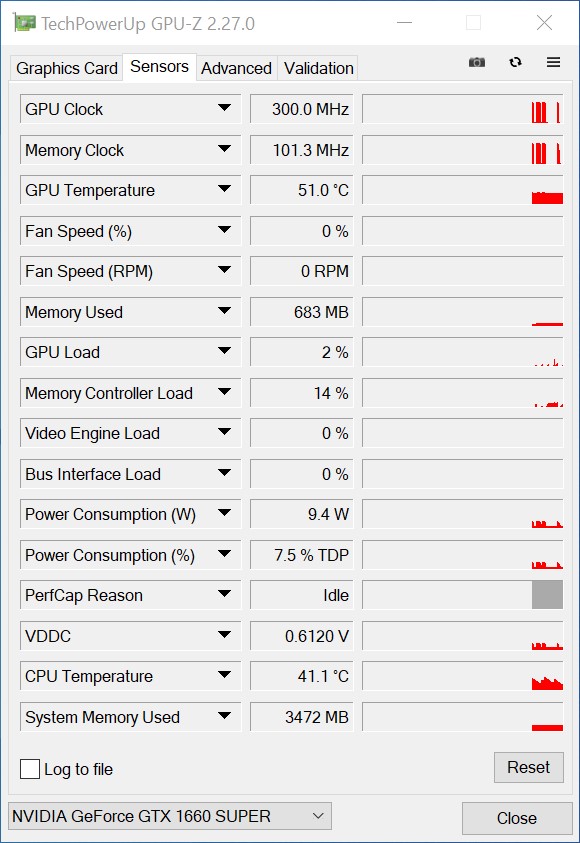
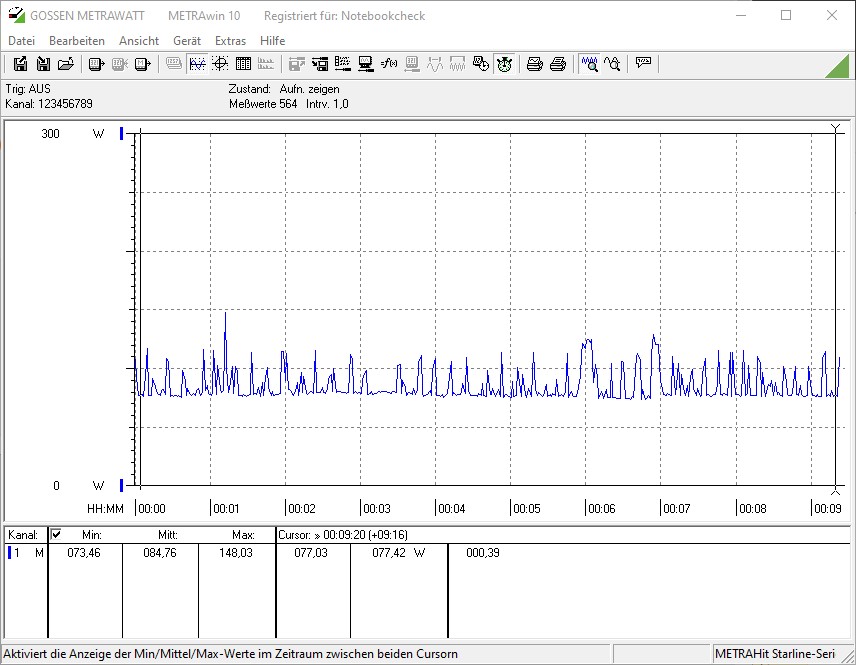
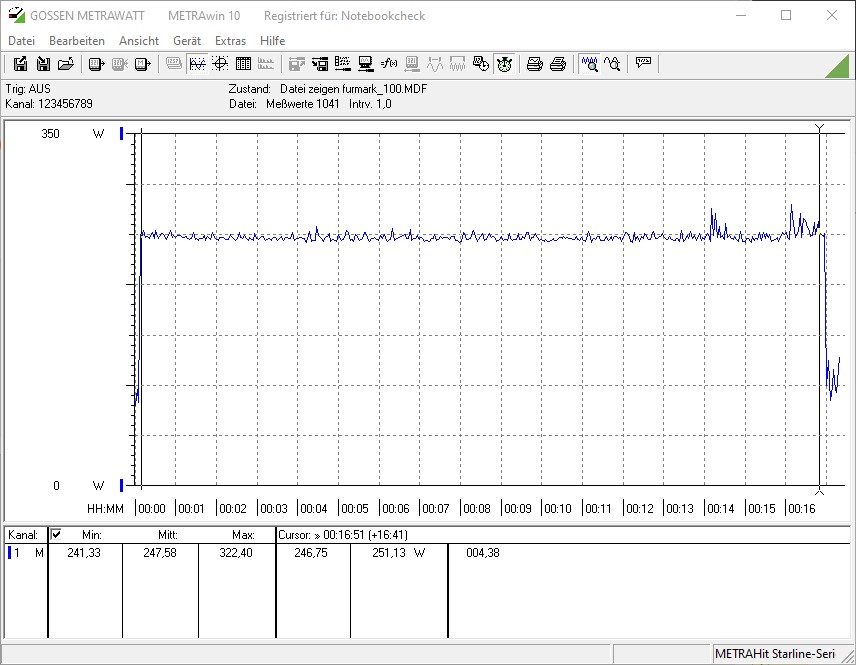
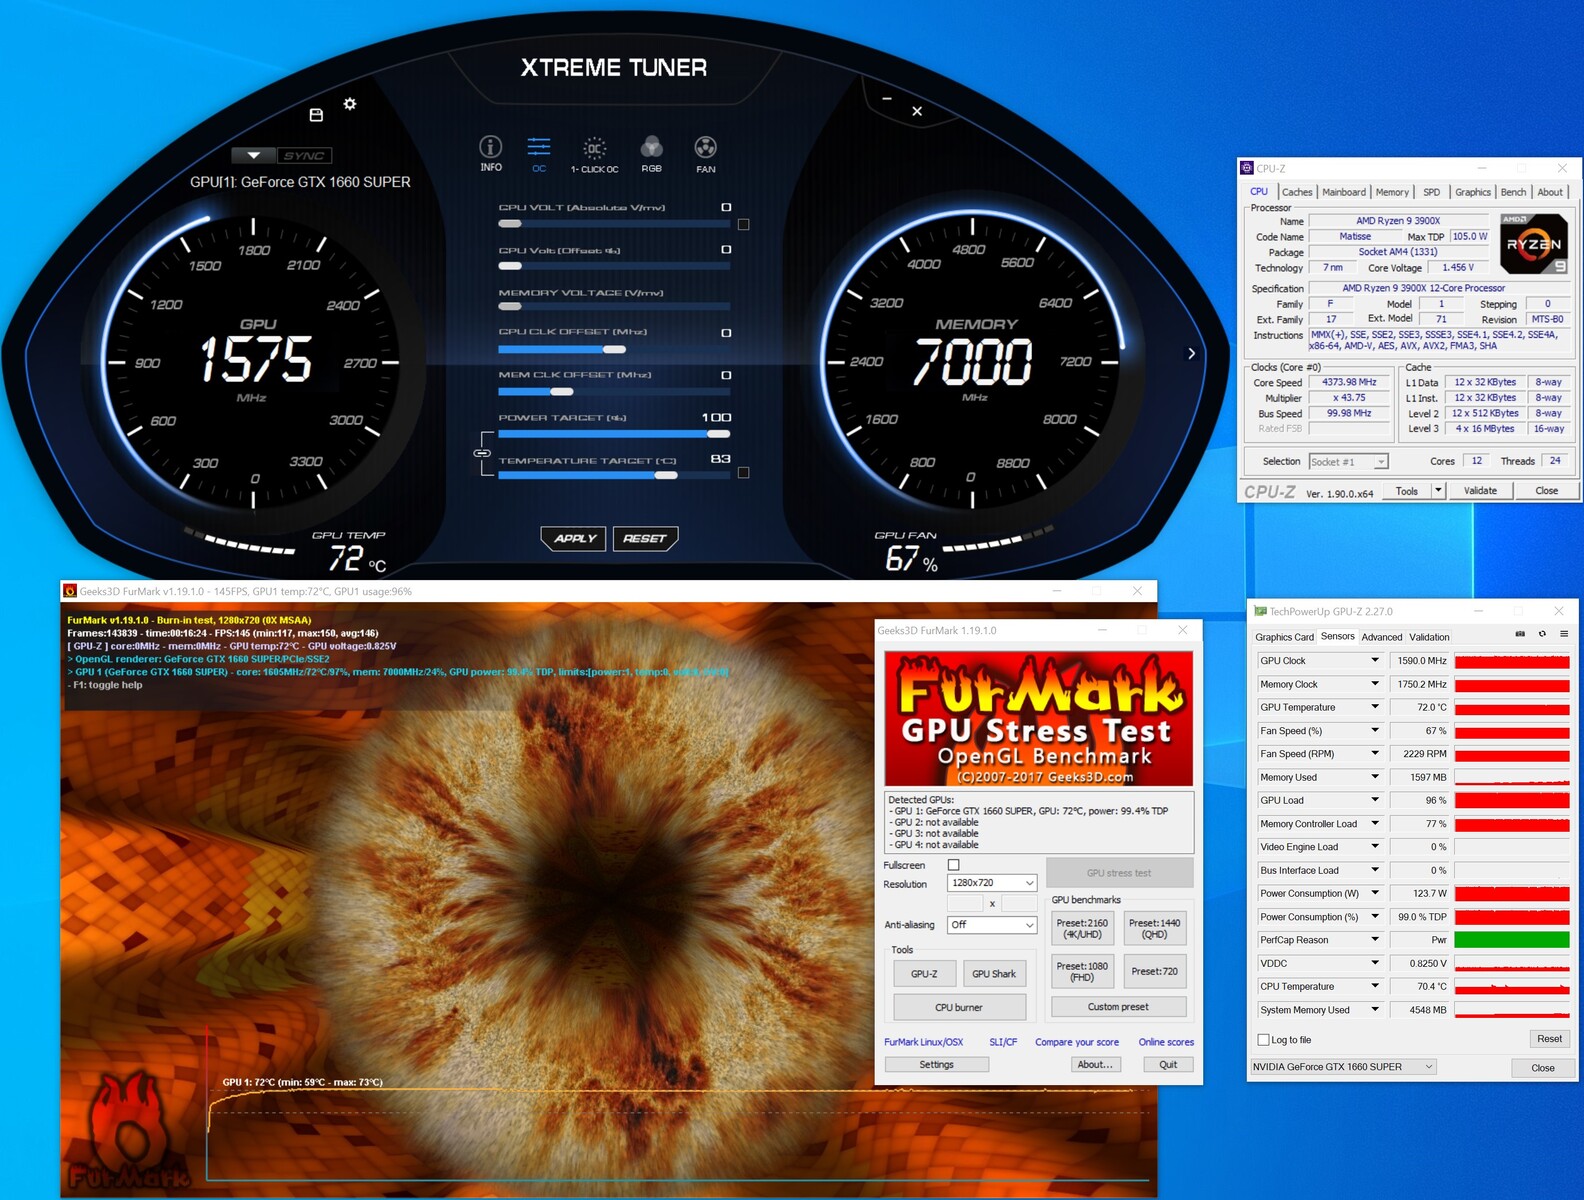
The GTX 1660 SUPER has a 125 W TDP, as we mentioned earlier. While the card has a 5 W higher TDP than its GTX 1660 siblings, our tests demonstrated that the KFA2 did not require any more power than the PNY GeForce GTX 1660 did. Our KFA2 GeForce GTX 1660 SUPER test system consumes just under 85 W, for reference, while it averaged about 248 W during a FurMark stress test. Our review unit does not support increasing its power target (PT), so you are stuck at 125 W. We recorded the system averaging 260 W during our The Witcher 3
While the GTX 1660 SUPER is about as efficient as the regular GeForce GTX 1660 , it cannot match the GeForce GTX 1660 Ti
The KFA2 GeForce GTX 1660 SUPER also peaked at 72 °C during our stress test, which is far from a critical temperature. Meanwhile, the back of the card reached 55 °C. It should be noted though that the backplate does not directly cool the PCB, as there are no thermal pads between the two components. Instead, we suspect that the dual fans draw excess heat away from the PCB, allowing the backplate to remain cooler than the front of the card.
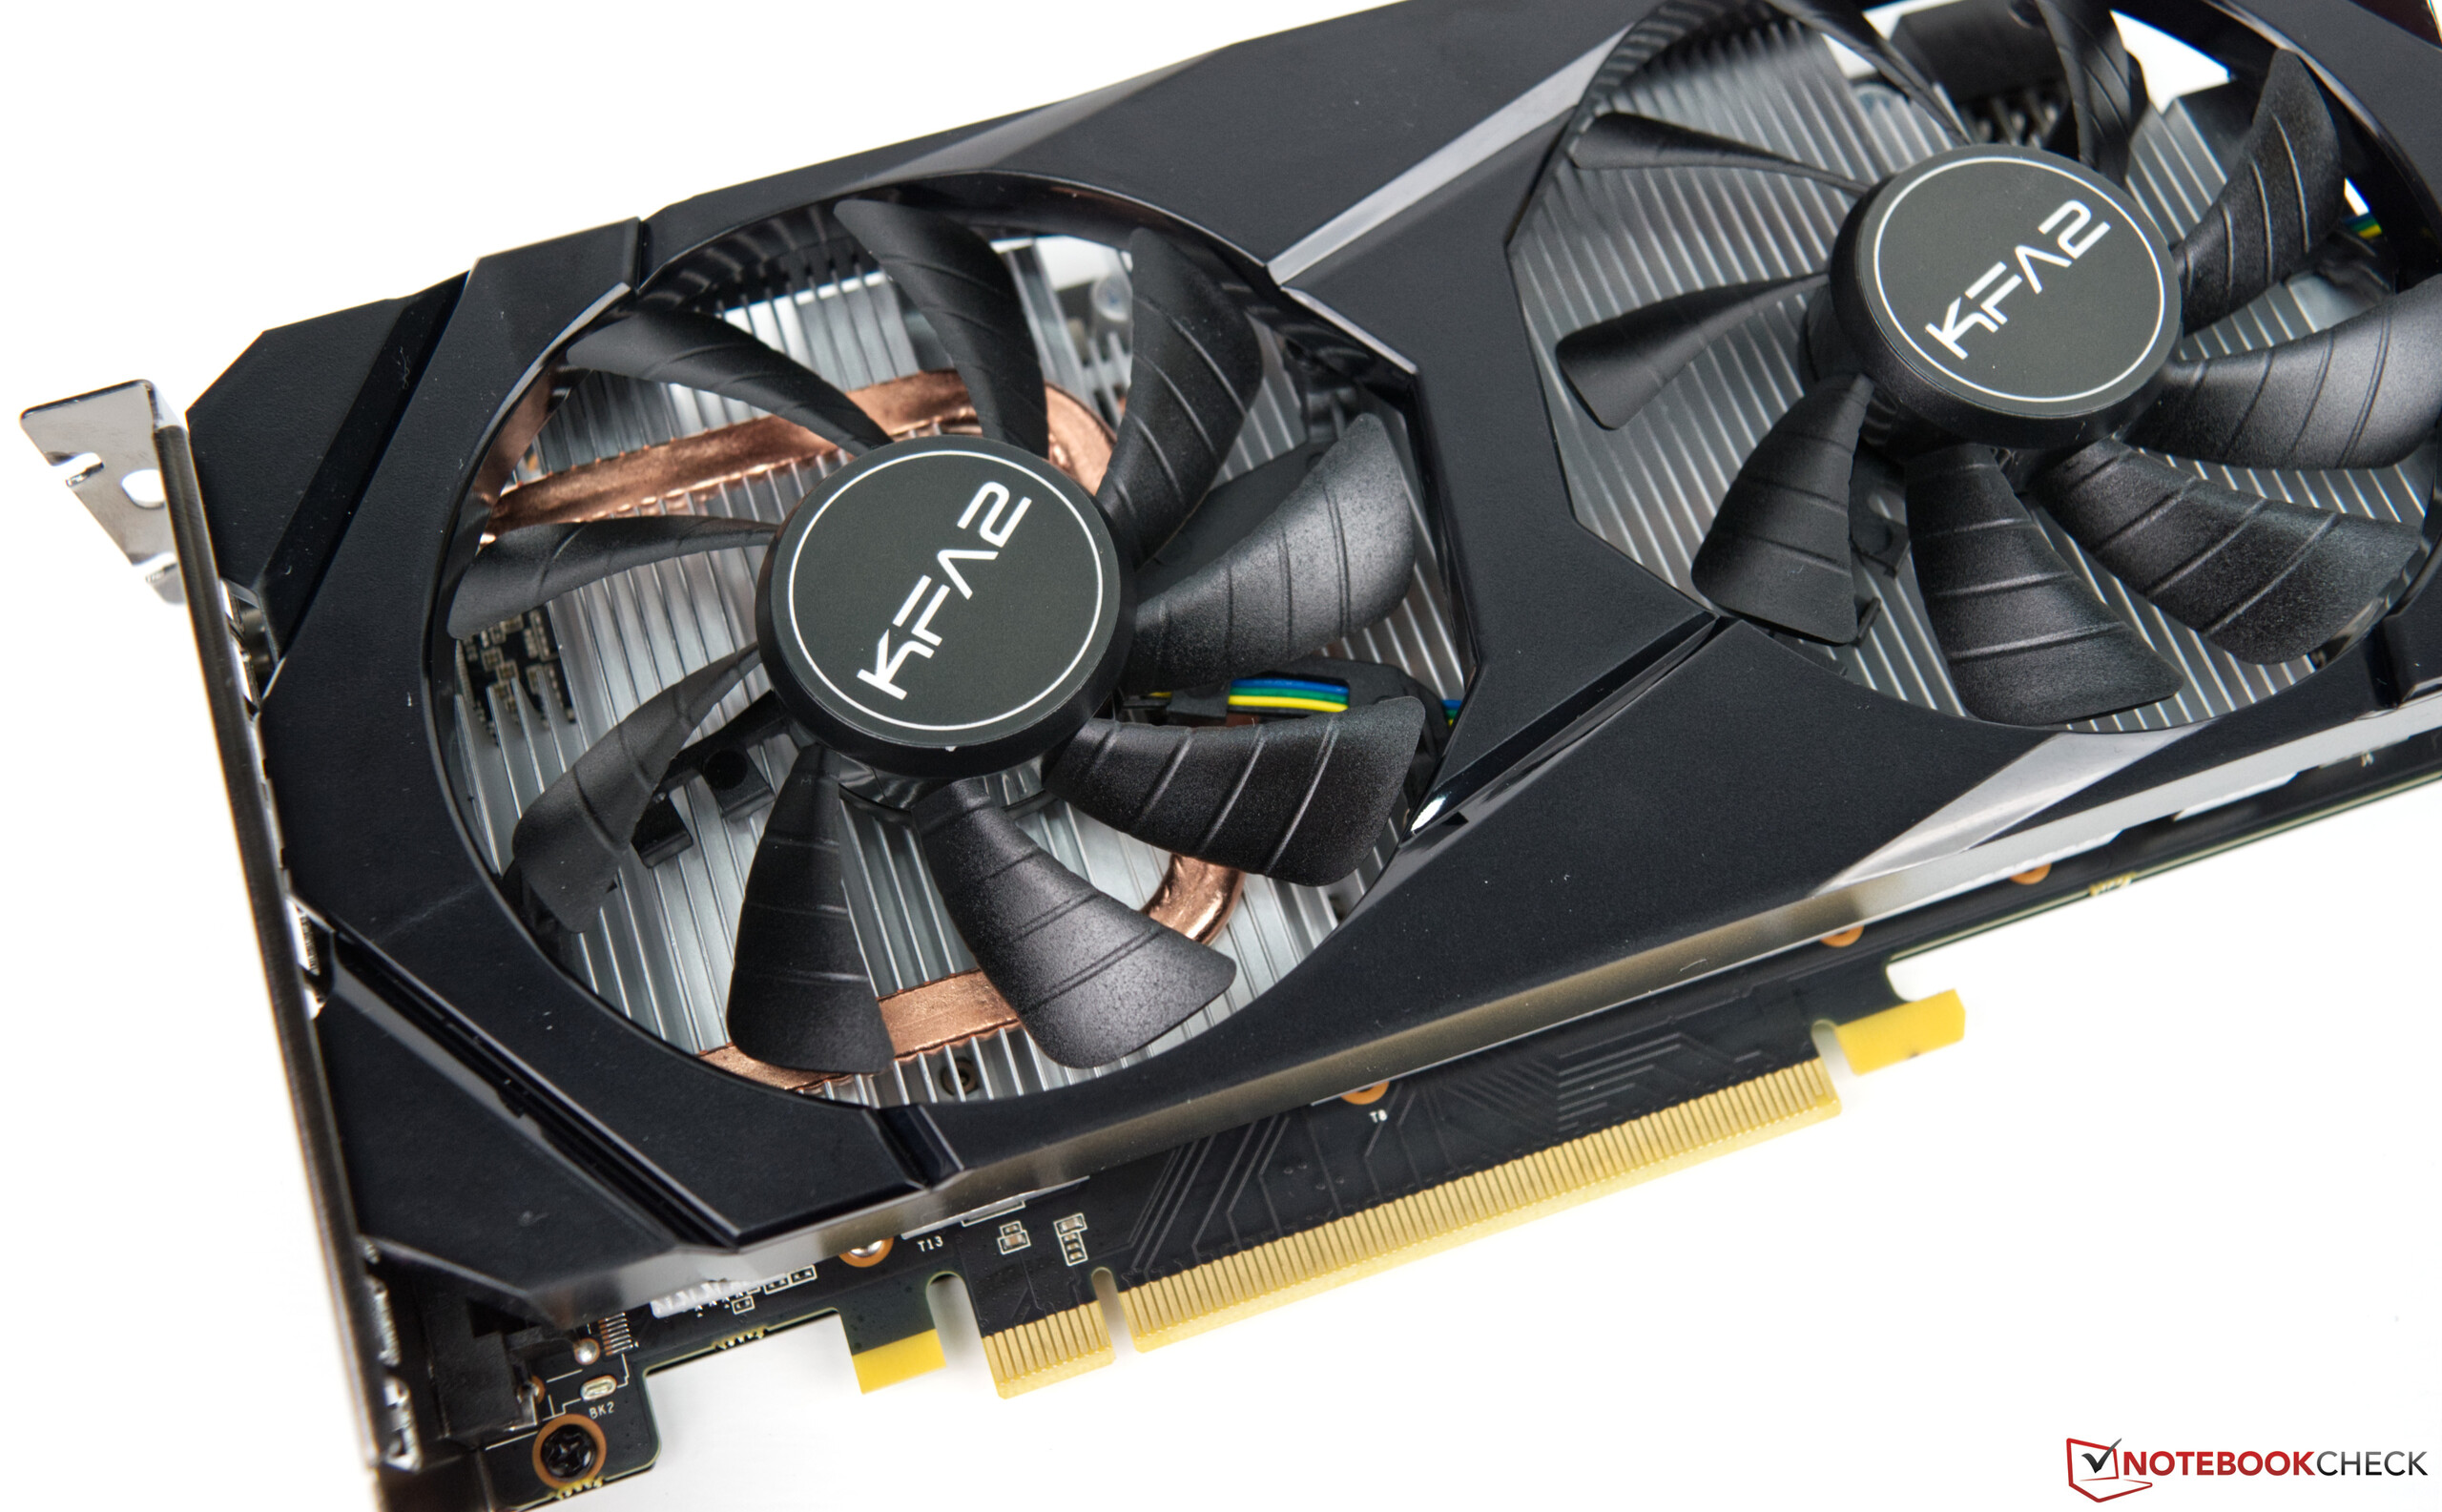
The two axial fans are audible when gaming, but they typically spin at around 2,200 RPM. The card's thermal headroom should allow you to reduce its fan speed slightly though, which you can do by setting a manual fan curve.
Heat map of the KFA2 GTX 1660 XLR8 (1-Click OC) during a stress test (PT 100%) Heat map of the KFA2 GTX 1660 XLR8 (1-Click OC) during a stress test (PT 100%) Heat map of the KFA2 GTX 1660 XLR8 (1-Click OC) during a stress test (PT 100%) Power consumption of our test system at idle Power consumption of our test system during a FurMark PT 100% stress test Power consumption of our test system while playing The Witcher 3 on the ultra preset System information during a FurMark PT 100% stress test
AMD Radeon RX 5700 XTRadeon RX 5700 XT (Desktop), R9 3900X (Idle: 83.2 W)
376.4 (373min - 382max ) Watt * -45%
XFX AMD Radeon RX 590 OC+ 8 GBRadeon RX 590, R9 3900X (Idle: 85.9 W)
358.9 (351min - 370max ) Watt * -38%
AMD Radeon RX 5700 XT Radeon RX 5700 XT (Desktop), R7 2700X (Idle: 69.8 W)
348.7 (341min - 359max ) Watt * -34%
XFX AMD Radeon RX 590 OC+ 8 GB Radeon RX 590, R7 2700X
346.9 (326min - 364max ) Watt * -33%
Nvidia GeForce RTX 2060 SuperGeForce RTX 2060 Super (Desktop), R9 3900X (Idle: 86.7 W)
331 (322min - 344max ) Watt * -27%
AMD Radeon RX 5700Radeon RX 5700 (Desktop), R9 3900X (Idle: 77.9 W)
317.5 (313min , 216P1 - 326max ) Watt * -22%
Sapphire NITRO+ RX 570 8 GBRadeon RX 570, R9 3900X (Idle: 85.5 W)
300.2 (284min - 311max ) Watt * -15%
Nvidia GeForce RTX 2060 Super GeForce RTX 2060 Super (Desktop), R7 2700X (82.7 fps, Idle: 77.12 W)
298.2 (293min - 322max ) Watt * -15%
AMD Radeon RX 5700 Radeon RX 5700 (Desktop), R7 2700X (84.2 fps, Idle: 64.5 W)
295.9 (284min - 304max ) Watt * -14%
MSI RTX 2060 Gaming Z 6G GeForce RTX 2060 (Desktop), R7 2700X (Idle: 74.66 W)
288.8 (284min - 299max ) Watt * -11%
Sapphire NITRO+ RX 570 8 GBRadeon RX 570, R7 2700X (Idle: 72.61 W)
274 (268min - 300max ) Watt * -5%
KFA 2 GeForce GTX 1660 Super GeForce GTX 1660 Super (Desktop), R9 3900X (Idle: 84.76 W)
260.4 (255min - 277max ) Watt *
PNY GeForce GTX 1660 GeForce GTX 1660 (Desktop), R9 3900X (Idle: 79.88 W)
248.6 (240min - 259max ) Watt * +5%
Zotac GeForce GTX 1660 Ti 6 GB GeForce GTX 1660 Ti (Desktop), R7 2700X (Idle: 68.3 W)
235.5 (232min - 269max ) Watt * +10%
Gainward GeForce GTX 1650 4 GBGeForce GTX 1650 (Desktop), R9 3900X (Idle: 82.4 W)
203.9 (199min - 215max ) Watt * +22%
Gainward GeForce GTX 1650 4 GBGeForce GTX 1650 (Desktop), R7 2700X (Idle: 64.63 W)
178.9 (176min - 192max ) Watt * +31%
XFX AMD Radeon RX 590 OC+ 8 GBRadeon RX 590, R9 3900X (Idle: 85.9 W)
371.7 (360min - 388max ) Watt * -50%
XFX AMD Radeon RX 590 OC+ 8 GB Radeon RX 590, R7 2700X
357.5 (347min - 383max ) Watt * -44%
AMD Radeon RX 5700 XTRadeon RX 5700 XT (Desktop), R9 3900X (Idle: 83.2 W)
352.1 (346min - 377max ) Watt * -42%
AMD Radeon RX 5700 XT Radeon RX 5700 XT (Desktop), R7 2700X (239 fps, Idle: 69.8 W)
326.6 (313min - 351max ) Watt * -32%
Sapphire NITRO+ RX 570 8 GBRadeon RX 570, R9 3900X (Idle: 85.5 W)
322.8 (309min - 347max ) Watt * -30%
Nvidia GeForce RTX 2060 SuperGeForce RTX 2060 Super (Desktop), R9 3900X (Idle: 86.7 W)
312 (306min - 328max ) Watt * -26%
Sapphire NITRO+ RX 570 8 GBRadeon RX 570, R7 2700X (Idle: 72.61 W)
308.9 (301min - 338max ) Watt * -25%
AMD Radeon RX 5700Radeon RX 5700 (Desktop), R9 3900X (Idle: 77.9 W)
297.3 (292min - 316max ) Watt * -20%
MSI RTX 2060 Gaming Z 6G GeForce RTX 2060 (Desktop), R7 2700X (Idle: 74.66 W)
295.2 (148min - 331max ) Watt * -19%
Nvidia GeForce RTX 2060 Super GeForce RTX 2060 Super (Desktop), R7 2700X (237 fps, Idle: 77.12 W)
281.4 (275min - 321max ) Watt * -14%
AMD Radeon RX 5700 Radeon RX 5700 (Desktop), R7 2700X (207 fps, Idle: 64.5 W)
280.5 (271min - 312max ) Watt * -13%
PNY GeForce GTX 1660 GeForce GTX 1660 (Desktop), R9 3900X (Idle: 79.88 W)
247.8 (242min - 282max ) Watt * -0%
KFA 2 GeForce GTX 1660 Super GeForce GTX 1660 Super (Desktop), R9 3900X (Idle: 84.76 W)
247.6 (241min - 322max ) Watt *
Zotac GeForce GTX 1660 Ti 6 GB GeForce GTX 1660 Ti (Desktop), R7 2700X (Idle: 68.3 W)
233.2 (226min - 250max ) Watt * +6%
Gainward GeForce GTX 1650 4 GBGeForce GTX 1650 (Desktop), R9 3900X (Idle: 82.4 W)
202.5 (200min - 213max ) Watt * +18%
Gainward GeForce GTX 1650 4 GBGeForce GTX 1650 (Desktop), R7 2700X (Idle: 64.63 W, Idle: 64.63 W)
183 (178min - 187max ) Watt * +26%
* ... smaller is better
While it is not possible to increase the PT of the KFA2 GeForce GTX 1660 SUPER, its 1-Click-OC option allows the GPU boost clock to be raised by 15 MHz. However, its effect is hardly noticeable when gaming, as the GPU rarely operates at its base clock.
We had some success with manually overclocking our review unit, though. We successfully achieved a 150 MHz GPU boost and an effective 800 MHz VRAM overclock during our tests. These overclocks attained between 5 to 10% higher frame rates than with the KFA2 set to stock levels. Realistically, this shall not improve stuttering frame rates to smooth ones. However, a 5-10% improvement does put the GTX 1660 SUPER closer to the performance that the GeForce GTX 1660 Ti
3DMark 11 (GPU + 150 MHz, VRAM + 800 MHz) 3DMark Fire Strike (GPU + 150 MHz, VRAM + 800 MHz)
Pros + powerful enough for 1080p gaming
+ 6 GB of GDDR6 VRAM
+ good cooling unit
+ the fan stops at idle
+ moderate power consumption
+ good value for money
+ decent OC potential despite PT limitation
Cons - loud under load
- 1-click OC option only delivers 15 MHz more
- a single DisplayPort
The KFA2 GeForce GTX 1660 Super 1-Click OC Desktop GPU review. Test device courtesy of KFA2. The KFA2 GeForce GTX 1660 SUPER closes the gap between 200 Euros (~US$220) and 250 Euros (~US$275) , with the company pricing its card at 235 Euros (~US$259) . The GTX 1660 SUPER is a good graphics card that is powerful enough to handle all modern triple-A games in at least 1080p. Some simpler titles are even capable of being played in 4K.
Before you buy, it is best to weigh up which games you play, and whether you need something more powerful. The GTX 1660 SUPER, for instance, lacks the horsepower of the GeForce GTX 1660 Ti despite having a 5 W higher TDP. Ultimately, if you want to game at higher resolutions, then you will need to step up to the RTX 20 or RX 5700 series.
The KFA2 GeForce GTX 1660 SUPER impresses as a solid mid-range desktop GPU. If you can do without frivolities, then the GTX 1660 SUPER will serve you well.
By and large, the KFA2 GeForce GTX 1660 SUPER convinced us as a decent mid-range desktop GPU. We also like that the fans switch off when idling, which not only reduces power consumption but also allows the card to operate silently. The two fans remain relatively quiet under load too, which is equally impressive. The card has the potential to run even more quietly as well, as it has the thermal headroom to do so. Overall, the KFA2 GeForce GTX 1660 SUPER is an excellent mid-range GPU and is worthy of our Editors Choice Award.
Benchmarks Performance Rating - 3DMark 11 + Fire Strike + Time Spy
7.2 pt (22%)
...
NVIDIA GeForce GTX 1660 Super (Desktop)
...
3DMark - 3DMark Time Spy Score
min: 6421 avg: 6535 median: 6545.5 (19%) max: 6627 Points
...
NVIDIA GeForce GTX 1660 Super (Desktop)
...
3DMark - 3DMark Time Spy Graphics
min: 5958 avg: 5982 median: 5975 (16%) max: 6021 Points
...
NVIDIA GeForce GTX 1660 Super (Desktop)
...
3DMark - 3DMark Ice Storm Unlimited Graphics
min: 471219 avg: 544860 median: 477037 (54%) max: 686323 Points
...
NVIDIA GeForce GTX 1660 Super (Desktop)
Intel Arc A580
...
3DMark - 3DMark Ice Storm Extreme Graphics
min: 281104 avg: 303481 median: 303022 (39%) max: 326774 Points
...
NVIDIA GeForce GTX 1660 Super (Desktop)
...
3DMark - 3DMark Cloud Gate Score
min: 48162 avg: 55703 median: 56556 (60%) max: 61536 Points
...
NVIDIA GeForce GTX 1660 Super (Desktop)
...
3DMark - 3DMark Cloud Gate Graphics
min: 88797 avg: 93092 median: 93241 (25%) max: 97089 Points
...
NVIDIA GeForce GTX 1660 Super (Desktop)
...
3DMark - 3DMark Fire Strike Standard Score
min: 14656 avg: 15135 median: 15164 (27%) max: 15557 Points
...
NVIDIA GeForce GTX 1660 Super (Desktop)
...
3DMark - 3DMark Fire Strike Standard Graphics
min: 15498 avg: 15820 median: 15828.5 (18%) max: 16123 Points
...
NVIDIA GeForce GTX 1660 Super (Desktop)
...
3DMark - 3DMark Ice Storm Graphics
min: 337164 avg: 379111 median: 381188 (46%) max: 416905 Points
...
NVIDIA GeForce GTX 1660 Super (Desktop)
...
3DMark - 3DMark Wild Life Unlimited
39692 Points (20%)
...
NVIDIA GeForce GTX 1660 Super (Desktop)
...
3DMark - 3DMark Night Raid
min: 44634 avg: 45691 median: 45691 (43%) max: 46748 Points
...
Intel Arc A380
NVIDIA GeForce GTX 1660 Super (Desktop)
...
3DMark - 3DMark Night Raid Graphics Score
min: 71384 avg: 72579 median: 72578.5 (28%) max: 73773 Points
...
NVIDIA GeForce GTX 1660 Super (Desktop)
...
3DMark 11 - 3DM11 Performance Score
min: 20610 avg: 22136 median: 22583 (31%) max: 23216 Points
...
NVIDIA GeForce GTX 1660 Super (Desktop)
...
3DMark 11 - 3DM11 Performance GPU
min: 21347 avg: 21782 median: 21982 (19%) max: 22017 Points
...
NVIDIA GeForce GTX 1660 Super (Desktop)
...
3DMark Vantage + 3DMark Vantage - 3DM Vant. Perf. total
min: 60318 avg: 71283 median: 76654 (22%) max: 76878 Points
...
NVIDIA GeForce GTX 1660 Super (Desktop)
...
3DM Vant. Perf. GPU no PhysX + 3DMark Vantage - 3DM Vant. Perf. GPU no PhysX
min: 58063 avg: 66360 median: 70321 (40%) max: 70697 Points
...
NVIDIA GeForce GTX 1660 Super (Desktop)
...
3DMark 05 - 3DMark 05 - Standard
min: 53106 avg: 76840 median: 87771 (96%) max: 89643 Points
...
Intel Arc A580
NVIDIA GeForce GTX 1660 Super (Desktop)
...
3DMark 06 3DMark 06 - Standard 1280x1024 +
min: 44443 avg: 60480 median: 68377 (89%) max: 68619 Points
...
Intel Arc A380
NVIDIA GeForce GTX 1660 Super (Desktop)
Intel Arc A580
...
Unigine Valley 1.0 - Unigine Valley 1.0 DX
min: 77.6 avg: 78.2 median: 77.7 (25%) max: 79.3 fps
...
Intel Arc A580
NVIDIA GeForce GTX 1660 Super (Desktop)
...
SPECviewperf 12 + SPECviewperf 12 - specvp12 sw-03
min: 53 avg: 60.1 median: 56.5 (14%) max: 70.7 fps
...
NVIDIA GeForce GTX 1660 Super (Desktop)
...
specvp12 snx-02 + SPECviewperf 12 - specvp12 snx-02
min: 8.21 avg: 8.7 median: 8.6 (1%) max: 9.38 fps
...
NVIDIA GeForce GTX 1660 Super (Desktop)
...
specvp12 showcase-01 + SPECviewperf 12 - specvp12 showcase-01
min: 80.2 avg: 82.7 median: 82.8 (18%) max: 85.2 fps
...
NVIDIA GeForce GTX 1660 Super (Desktop)
...
specvp12 mediacal-01 + SPECviewperf 12 - specvp12 mediacal-01
min: 28.22 avg: 32.5 median: 31.2 (8%) max: 38.2 fps
...
NVIDIA GeForce GTX 1660 Super (Desktop)
...
specvp12 maya-04 + SPECviewperf 12 - specvp12 maya-04
min: 127.8 avg: 136.9 median: 134 (37%) max: 149 fps
...
NVIDIA GeForce GTX 1660 Super (Desktop)
...
specvp12 energy-01 + SPECviewperf 12 - specvp12 energy-01
min: 7.75 avg: 8.1 median: 8.2 (7%) max: 8.38 fps
...
NVIDIA GeForce GTX 1660 Super (Desktop)
...
specvp12 creo-01 + SPECviewperf 12 - specvp12 creo-01
min: 35.51 avg: 40.5 median: 40.5 (16%) max: 45.5 fps
...
Intel Arc A380
NVIDIA GeForce GTX 1660 Super (Desktop)
...
specvp12 catia-04 + SPECviewperf 12 - specvp12 catia-04
min: 62.6 avg: 64.5 median: 63 (10%) max: 68 fps
...
NVIDIA GeForce GTX 1660 Super (Desktop)
...
specvp12 3dsmax-05 + SPECviewperf 12 - specvp12 3dsmax-05
min: 144 avg: 154.8 median: 153.5 (27%) max: 167 fps
...
Intel Arc A580
NVIDIA GeForce GTX 1660 Super (Desktop)
...
SPECviewperf 13 specvp13 sw-04 + SPECviewperf 13 - specvp13 sw-04
min: 71.7 avg: 84.8 median: 78.8 (21%) max: 104 fps
...
NVIDIA GeForce GTX 1660 Super (Desktop)
...
specvp13 snx-03 + SPECviewperf 13 - specvp13 snx-03
min: 14.76 avg: 15.7 median: 15.4 (2%) max: 16.9 fps
...
NVIDIA GeForce GTX 1660 Super (Desktop)
...
specvp13 showcase-02 + SPECviewperf 13 - specvp13 showcase-02
min: 78.6 avg: 82 median: 82.1 (18%) max: 85.3 fps
...
NVIDIA GeForce GTX 1660 Super (Desktop)
...
specvp13 medical-02 + SPECviewperf 13 - specvp13 medical-02
min: 39.5 avg: 40.3 median: 40.6 (8%) max: 40.7 fps
...
Intel Arc A380
NVIDIA GeForce GTX 1660 Super (Desktop)
...
specvp13 maya-05 + SPECviewperf 13 - specvp13 maya-05
min: 20.7 avg: 145.9 median: 203 (23%) max: 214 fps
...
Intel Arc A380
NVIDIA GeForce GTX 1660 Super (Desktop)
...
specvp13 energy-02 + SPECviewperf 13 - specvp13 energy-02
min: 11.25 avg: 11.3 median: 11.3 (4%) max: 11.31 fps
...
NVIDIA GeForce GTX 1660 Super (Desktop)
...
specvp13 creo-02 + SPECviewperf 13 - specvp13 creo-02
min: 130.3 avg: 135.1 median: 134 (20%) max: 141 fps
...
NVIDIA GeForce GTX 1660 Super (Desktop)
...
specvp13 catia-05 + SPECviewperf 13 - specvp13 catia-05
min: 89.8 avg: 91.9 median: 91 (10%) max: 94.9 fps
...
NVIDIA GeForce GTX 1660 Super (Desktop)
...
specvp13 3dsmax-06 + SPECviewperf 13 - specvp13 3dsmax-06
min: 143 avg: 153.7 median: 152.1 (26%) max: 166 fps
...
Intel Arc A580
NVIDIA GeForce GTX 1660 Super (Desktop)
...
SPECviewperf 2020 specvp2020 solidworks-05 4k + SPECviewperf 2020 - specvp2020 solidworks-05 4k
64.1 fps (19%)
...
NVIDIA GeForce GTX 1660 Super (Desktop)
...
specvp2020 snx-04 4k + SPECviewperf 2020 - specvp2020 snx-04 4k
min: 11.7 avg: 12.2 median: 12.2 (1%) max: 12.7 fps
...
NVIDIA GeForce GTX 1660 Super (Desktop)
...
specvp2020 medical-03 4k + SPECviewperf 2020 - specvp2020 medical-03 4k
min: 6.11 avg: 6.8 median: 6.8 (6%) max: 7.41 fps
...
Intel Arc A380
NVIDIA GeForce GTX 1660 Super (Desktop)
...
specvp2020 maya-06 4k + SPECviewperf 2020 - specvp2020 maya-06 4k
min: 113 avg: 115.5 median: 115.5 (19%) max: 118 fps
...
NVIDIA GeForce GTX 1660 Super (Desktop)
...
specvp2020 energy-03 4k + SPECviewperf 2020 - specvp2020 energy-03 4k
min: 13.7 avg: 13.7 median: 13.7 (3%) max: 13.76 fps
...
NVIDIA GeForce GTX 1660 Super (Desktop)
Intel Arc A580
...
specvp2020 creo-03 4k + SPECviewperf 2020 - specvp2020 creo-03 4k
min: 52.9 avg: 55.3 median: 55.3 (26%) max: 57.7 fps
...
Intel Arc A580
NVIDIA GeForce GTX 1660 Super (Desktop)
...
specvp2020 catia-06 4k + SPECviewperf 2020 - specvp2020 catia-06 4k
min: 20.53 avg: 20.8 median: 20.8 (14%) max: 21 fps
...
Intel Arc A380
NVIDIA GeForce GTX 1660 Super (Desktop)
...
specvp2020 3dsmax-07 4k + SPECviewperf 2020 - specvp2020 3dsmax-07 4k
min: 42.19 avg: 45.3 median: 45.2 (19%) max: 48.3 fps
...
Intel Arc A580
NVIDIA GeForce GTX 1660 Super (Desktop)
...
LuxMark v2.0 64Bit - LuxMark v2.0 Room GPU
2286 Samples/s (10%)
...
NVIDIA GeForce GTX 1660 Super (Desktop)
...
LuxMark v2.0 64Bit - LuxMark v2.0 Sala GPU
4490 Samples/s (8%)
...
NVIDIA GeForce GTX 1660 Super (Desktop)
...
ComputeMark v2.1 - ComputeMark v2.1 Result
11098 points (12%)
...
NVIDIA GeForce GTX 1660 Super (Desktop)
...
Power Consumption - Furmark Stress Test Power Consumption - external Monitor *
min: 247.6 avg: 249.5 median: 248 (35%) max: 253 Watt
GPU TDP ? TDP 120 W TDP 125 W 101% 100% 101%
...
NVIDIA GeForce GTX 1660 Super (Desktop)
...
0 20 40 60 80 100 120 140 160 180 200 220 240 260 280 300 320 Tooltip KFA2 GeForce GTX 1660 Super (1-Click OC): Ø248 (243-328)
PNY GeForce GTX 1660 XLR8 Gaming OC: Ø253 (248-294)
Power Consumption - The Witcher 3 Power Consumption - external Monitor *
min: 244 avg: 250.1 median: 246 (34%) max: 260.4 Watt
GPU TDP ? TDP 120 W TDP 125 W 100% 104% 103%
...
NVIDIA GeForce GTX 1660 Super (Desktop)
...
0 20 40 60 80 100 120 140 160 180 200 220 240 260 280 300 320 Tooltip PNY GeForce GTX 1660 XLR8 Gaming OC: Ø244 (242-255)
KFA2 GeForce GTX 1660 Super (1-Click OC): Ø246 (241-330)
Power Consumption - Witcher 3 ultra Power Efficiency - external Monitor
0.2 fps per Watt (19%)
...
Intel Arc A580
NVIDIA GeForce GTX 1660 Super (Desktop)
Intel Arc A380
...
Clock Speed - GPU Clock Speed Furmark
1590 MHz (63%)
...
NVIDIA GeForce GTX 1660 Super (Desktop)
...
- Range of benchmark values for this graphics card
- Average benchmark values for this graphics card
* Smaller numbers mean a higher performance
v1.26
log 09. 00:57:12
#0 no ids found in url (should be separated by "_") +0s ... 0s
#1 not redirecting to Ajax server +0s ... 0s
#2 did not recreate cache, as it is less than 5 days old! Created at Tue, 07 May 2024 05:40:33 +0200 +0.001s ... 0.001s
#3 getting avg benchmarks for device 9970 +0.018s ... 0.02s
#4 got single benchmarks 9970 +0.019s ... 0.038s
#5 got avg benchmarks for devices +0s ... 0.038s
#6 min, max, avg, median took s +0.915s ... 0.953s
#7 return log +0s ... 0.953s
Game Benchmarks The following benchmarks stem from our benchmarks of review laptops. The performance depends on the used graphics memory, clock rate, processor, system settings, drivers, and operating systems. So the results don't have to be representative for all laptops with this GPU. For detailed information on the benchmark results, click on the fps number.
40.3 [X] PNY GeForce GTX 1660 XLR8 Gaming OC Intel Core i9-14900K 3.2GHz
GeForce GTX 1660 Super (Desktop)
min:
30.7 fps, P0.1:
31.3 fps, P1:
32.1 fps, max:
53.7 fps
45.5 [X] KFA2 GeForce GTX 1660 Super (1-Click OC) Intel Core i9-14900K 3.2GHz
GeForce GTX 1660 Super (Desktop)
min:
31.8 fps, P0.1:
34.8 fps, P1:
36.1 fps, max:
60.7 fps
~ 43 fps
+ Compare
- Hide Comparison
+ 📈 Graph
- 📈 Hide Graph
0 Tooltip : Ø40.3 (32.6-50.5)
: Ø45.4 (36.7-56.2)
Intel Arc A380
NVIDIA GeForce GTX 1660 Super (Desktop)
Intel Arc A580
...
35.4 [X] PNY GeForce GTX 1660 XLR8 Gaming OC Intel Core i9-14900K 3.2GHz
GeForce GTX 1660 Super (Desktop)
min:
27.1 fps, P0.1:
28 fps, P1:
29.2 fps, max:
43.7 fps
41.1 [X] KFA2 GeForce GTX 1660 Super (1-Click OC) Intel Core i9-14900K 3.2GHz
GeForce GTX 1660 Super (Desktop)
min:
21.1 fps, P0.1:
30 fps, P1:
32.7 fps, max:
54.2 fps
~ 38 fps
+ Compare
- Hide Comparison
+ 📈 Graph
- 📈 Hide Graph
0 Tooltip : Ø35.3 (29.9-39.8)
: Ø41 (33.9-50.7)
Intel Arc A380
NVIDIA GeForce GTX 1660 Super (Desktop)
Intel Arc A580
...
26.7 [X] PNY GeForce GTX 1660 XLR8 Gaming OC Intel Core i9-14900K 3.2GHz
GeForce GTX 1660 Super (Desktop)
min:
13.6 fps, P0.1:
13.9 fps, P1:
22.2 fps, max:
33.9 fps
29.9 [X] KFA2 GeForce GTX 1660 Super (1-Click OC) Intel Core i9-14900K 3.2GHz
GeForce GTX 1660 Super (Desktop)
min:
8.67 fps, P0.1:
9.93 fps, P1:
23.8 fps, max:
41.3 fps
~ 28 fps
+ Compare
- Hide Comparison
+ 📈 Graph
- 📈 Hide Graph
0 Tooltip : Ø26.7 (23-32.7)
: Ø29.9 (24.3-36.9)
NVIDIA GeForce GTX 1660 Super (Desktop)
Intel Arc A580
...
14.6 [X] PNY GeForce GTX 1660 XLR8 Gaming OC Intel Core i9-14900K 3.2GHz
GeForce GTX 1660 Super (Desktop)
min:
6.4 fps, P0.1:
6.74 fps, P1:
12.5 fps, max:
18.4 fps
15.9 [X] KFA2 GeForce GTX 1660 Super (1-Click OC) Intel Core i9-14900K 3.2GHz
GeForce GTX 1660 Super (Desktop)
min:
6.47 fps, P0.1:
7.5 fps, P1:
11.9 fps, max:
21.7 fps
~ 15 fps
+ Compare
- Hide Comparison
+ 📈 Graph
- 📈 Hide Graph
0 Tooltip : Ø14.6 (11.8-17.6)
: Ø15.9 (12.3-20)
NVIDIA GeForce GTX 1660 Super (Desktop)
Intel Arc A580
...
» With all tested laptops playable in detail settings high.
Additional Benchmarks
Low Preset 1280x720
60.3 [X] KFA2 GeForce GTX 1660 Super (1-Click OC) Intel Core i9-14900K 3.2GHz
GeForce GTX 1660 Super (Desktop)
min:
28.7 fps, P0.1:
41.2 fps, P1:
49 fps, max:
76.8 fps
55.7 [X] PNY GeForce GTX 1660 XLR8 Gaming OC Intel Core i9-14900K 3.2GHz
GeForce GTX 1660 Super (Desktop)
min:
41.6 fps, P0.1:
42.3 fps, P1:
46.5 fps, max:
67.7 fps
63.9 [X] PNY GeForce GTX 1660 XLR8 Gaming OC Intel Core i9-14900K 3.2GHz
GeForce GTX 1660 Super (Desktop)
min:
50.6 fps, P0.1:
51 fps, P1:
53.5 fps, max:
94 fps
70 [X] KFA2 GeForce GTX 1660 Super (1-Click OC) Intel Core i9-14900K 3.2GHz
GeForce GTX 1660 Super (Desktop)
min:
56.4 fps, P0.1:
57.7 fps, P1:
60 fps, max:
102.6 fps
~ 67 fps
+ Compare
- Hide Comparison
+ 📈 Graph
- 📈 Hide Graph
0 Tooltip : Ø63.4 (57-82.4)
: Ø69.6 (62.4-88.5)
Intel Arc A380
NVIDIA GeForce GTX 1660 Super (Desktop)
Intel Arc A580
...
55 [X] PNY GeForce GTX 1660 XLR8 Gaming OC Intel Core i9-14900K 3.2GHz
GeForce GTX 1660 Super (Desktop)
min:
44.4 fps, P0.1:
45.2 fps, P1:
47.7 fps, max:
75.3 fps
62.2 [X] KFA2 GeForce GTX 1660 Super (1-Click OC) Intel Core i9-14900K 3.2GHz
GeForce GTX 1660 Super (Desktop)
min:
49.9 fps, P0.1:
50.8 fps, P1:
53.6 fps, max:
88.6 fps
~ 59 fps
+ Compare
- Hide Comparison
+ 📈 Graph
- 📈 Hide Graph
0 Tooltip : Ø54.8 (50.6-65.8)
: Ø61.5 (56-74.5)
Intel Arc A380
NVIDIA GeForce GTX 1660 Super (Desktop)
Intel Arc A580
...
38.8 [X] PNY GeForce GTX 1660 XLR8 Gaming OC Intel Core i9-14900K 3.2GHz
GeForce GTX 1660 Super (Desktop)
min:
31.1 fps, P0.1:
31.3 fps, P1:
33.4 fps, max:
53.8 fps
41.7 [X] KFA2 GeForce GTX 1660 Super (1-Click OC) Intel Core i9-14900K 3.2GHz
GeForce GTX 1660 Super (Desktop)
min:
35.3 fps, P0.1:
35.5 fps, P1:
36.2 fps, max:
57.5 fps
~ 40 fps
+ Compare
- Hide Comparison
+ 📈 Graph
- 📈 Hide Graph
0 Tooltip : Ø38.5 (35.7-43.6)
: Ø41.6 (38.1-49.3)
Intel Arc A380
NVIDIA GeForce GTX 1660 Super (Desktop)
Intel Arc A580
...
35 [X] PNY GeForce GTX 1660 XLR8 Gaming OC Intel Core i9-14900K 3.2GHz
GeForce GTX 1660 Super (Desktop)
min:
14.1 fps, P0.1:
15.6 fps, P1:
20.2 fps, max:
48.4 fps
38.5 [X] KFA2 GeForce GTX 1660 Super (1-Click OC) Intel Core i9-14900K 3.2GHz
GeForce GTX 1660 Super (Desktop)
min:
30.9 fps, P0.1:
31.7 fps, P1:
33.7 fps, max:
52.3 fps
~ 37 fps
+ Compare
- Hide Comparison
+ 📈 Graph
- 📈 Hide Graph
0 Tooltip : Ø35 (25.8-43.4)
: Ø38.3 (35.5-45.4)
Intel Arc A380
NVIDIA GeForce GTX 1660 Super (Desktop)
Intel Arc A580
...
24.5 [X] PNY GeForce GTX 1660 XLR8 Gaming OC Intel Core i9-14900K 3.2GHz
GeForce GTX 1660 Super (Desktop)
min:
10.2 fps, P0.1:
10.4 fps, P1:
12.6 fps, max:
35.2 fps
26.7 [X] KFA2 GeForce GTX 1660 Super (1-Click OC) Intel Core i9-14900K 3.2GHz
GeForce GTX 1660 Super (Desktop)
min:
10.4 fps, P0.1:
11.2 fps, P1:
14.1 fps, max:
35.5 fps
~ 26 fps
+ Compare
- Hide Comparison
+ 📈 Graph
- 📈 Hide Graph
0 Tooltip : Ø24.3 (15-29.8)
: Ø26.5 (17.3-32.1)
NVIDIA GeForce GTX 1660 Super (Desktop)
Intel Arc A580
...
11.8 [X] KFA2 GeForce GTX 1660 Super (1-Click OC) Intel Core i9-14900K 3.2GHz
GeForce GTX 1660 Super (Desktop)
min:
6.76 fps, P0.1:
6.81 fps, P1:
7.35 fps, max:
18.5 fps
12 [X] PNY GeForce GTX 1660 XLR8 Gaming OC Intel Core i9-14900K 3.2GHz
GeForce GTX 1660 Super (Desktop)
min:
8.71 fps, P0.1:
8.85 fps, P1:
9.92 fps, max:
16.7 fps
~ 12 fps
+ Compare
- Hide Comparison
+ 📈 Graph
- 📈 Hide Graph
0 Tooltip : Ø11.7 (8.88-15.2)
: Ø11.8 (10.3-14.3)
NVIDIA GeForce GTX 1660 Super (Desktop)
Intel Arc A580
...
11 [X] PNY GeForce GTX 1660 XLR8 Gaming OC Intel Core i9-14900K 3.2GHz
GeForce GTX 1660 Super (Desktop)
min:
7.39 fps, P0.1:
7.64 fps, P1:
8.52 fps, max:
15 fps
11.3 [X] KFA2 GeForce GTX 1660 Super (1-Click OC) Intel Core i9-14900K 3.2GHz
GeForce GTX 1660 Super (Desktop)
min:
7.21 fps, P0.1:
7.52 fps, P1:
8.81 fps, max:
17.2 fps
~ 11 fps
+ Compare
- Hide Comparison
+ 📈 Graph
- 📈 Hide Graph
0 Tooltip : Ø11 (8.91-13.3)
: Ø11.3 (9.38-15.3)
NVIDIA GeForce GTX 1660 Super (Desktop)
Intel Arc A580
...
» With most tested laptops playable in detail settings ultra.
Additional Benchmarks
Very Low Preset 1280x720
110.6 [X] KFA2 GeForce GTX 1660 Super (1-Click OC) Intel Core i9-14900K 3.2GHz
GeForce GTX 1660 Super (Desktop)
min:
68.1 fps, P0.1:
82.3 fps, P1:
87 fps, max:
188.9 fps
102.5 [X] PNY GeForce GTX 1660 XLR8 Gaming OC Intel Core i9-14900K 3.2GHz
GeForce GTX 1660 Super (Desktop)
min:
73.5 fps, P0.1:
75.6 fps, P1:
83.8 fps, max:
162.3 fps
149.9 [X] PNY GeForce GTX 1660 XLR8 Gaming OC Intel Core i9-14900K 3.2GHz
GeForce GTX 1660 Super (Desktop)
min:
57.3 fps, P0.1:
100.9 fps, P1:
123.3 fps, max:
408 fps
168.4 [X] KFA2 GeForce GTX 1660 Super (1-Click OC) Intel Core i9-14900K 3.2GHz
GeForce GTX 1660 Super (Desktop)
min:
57.3 fps, P0.1:
103.4 fps, P1:
137.7 fps, max:
423 fps
~ 159 fps
+ Compare
- Hide Comparison
+ 📈 Graph
- 📈 Hide Graph
0 100 200 Tooltip : Ø149.3 (130.7-188.4)
: Ø168.2 (146.9-213)
Intel Arc A380
NVIDIA GeForce GTX 1660 Super (Desktop)
Intel Arc A580
...
116.5 [X] PNY GeForce GTX 1660 XLR8 Gaming OC Intel Core i9-14900K 3.2GHz
GeForce GTX 1660 Super (Desktop)
min:
54.1 fps, P0.1:
82.4 fps, P1:
98 fps, max:
369 fps
132.4 [X] KFA2 GeForce GTX 1660 Super (1-Click OC) Intel Core i9-14900K 3.2GHz
GeForce GTX 1660 Super (Desktop)
min:
17.2 fps, P0.1:
85.3 fps, P1:
109.8 fps, max:
319 fps
~ 124 fps
+ Compare
- Hide Comparison
+ 📈 Graph
- 📈 Hide Graph
0 100 Tooltip : Ø116.1 (102.4-137.2)
: Ø132 (118-157.5)
Intel Arc A380
NVIDIA GeForce GTX 1660 Super (Desktop)
Intel Arc A580
...
96.3 [X] PNY GeForce GTX 1660 XLR8 Gaming OC Intel Core i9-14900K 3.2GHz
GeForce GTX 1660 Super (Desktop)
min:
54.3 fps, P0.1:
66.7 fps, P1:
81.9 fps, max:
286 fps
109.4 [X] KFA2 GeForce GTX 1660 Super (1-Click OC) Intel Core i9-14900K 3.2GHz
GeForce GTX 1660 Super (Desktop)
min:
19.3 fps, P0.1:
55.6 fps, P1:
91.6 fps, max:
362 fps
~ 103 fps
+ Compare
- Hide Comparison
+ 📈 Graph
- 📈 Hide Graph
0 100 Tooltip : Ø96 (86.3-113.6)
: Ø108.7 (98.6-126)
Intel Arc A380
NVIDIA GeForce GTX 1660 Super (Desktop)
Intel Arc A580
...
30.3 [X] PNY GeForce GTX 1660 XLR8 Gaming OC Intel Core i9-14900K 3.2GHz
GeForce GTX 1660 Super (Desktop)
min:
24.1 fps, P0.1:
25.1 fps, P1:
26.5 fps, max:
40.9 fps
38 [X] KFA2 GeForce GTX 1660 Super (1-Click OC) Intel Core i9-14900K 3.2GHz
GeForce GTX 1660 Super (Desktop)
min:
19.4 fps, P0.1:
24.4 fps, P1:
32.1 fps, max:
130.2 fps
~ 34 fps
+ Compare
- Hide Comparison
+ 📈 Graph
- 📈 Hide Graph
0 Tooltip : Ø30.3 (28.3-32.1)
: Ø38 (35.4-40.8)
Intel Arc A380
NVIDIA GeForce GTX 1660 Super (Desktop)
Intel Arc A580
...
12.3 [X] PNY GeForce GTX 1660 XLR8 Gaming OC Intel Core i9-14900K 3.2GHz
GeForce GTX 1660 Super (Desktop)
min:
9.21 fps, P0.1:
9.4 fps, P1:
10.4 fps, max:
15.7 fps
15.9 [X] KFA2 GeForce GTX 1660 Super (1-Click OC) Intel Core i9-14900K 3.2GHz
GeForce GTX 1660 Super (Desktop)
min:
13.3 fps, P0.1:
13.4 fps, P1:
13.8 fps, max:
18.3 fps
~ 14 fps
+ Compare
- Hide Comparison
+ 📈 Graph
- 📈 Hide Graph
0 Tooltip : Ø12.3 (11.4-12.8)
: Ø15.9 (14.6-16.4)
NVIDIA GeForce GTX 1660 Super (Desktop)
...
» With all tested laptops playable in detail settings high.
Additional Benchmarks
Low Preset 1280x720
296 [X] KFA2 GeForce GTX 1660 Super (1-Click OC) Intel Core i9-14900K 3.2GHz
GeForce GTX 1660 Super (Desktop)
min:
12.2 fps, P0.1:
28.4 fps, P1:
198.1 fps, max:
590 fps
266 [X] PNY GeForce GTX 1660 XLR8 Gaming OC Intel Core i9-14900K 3.2GHz
GeForce GTX 1660 Super (Desktop)
min:
86.7 fps, P0.1:
154 fps, P1:
190.7 fps, max:
518 fps
135.6 [X] PNY GeForce GTX 1660 XLR8 Gaming OC Intel Core i9-14900K 3.2GHz
GeForce GTX 1660 Super (Desktop)
min:
32 fps, P0.1:
98.6 fps, P1:
105.9 fps, max:
314 fps
175.5 [X] KFA2 GeForce GTX 1660 Super (1-Click OC) Intel Core i9-14900K 3.2GHz
GeForce GTX 1660 Super (Desktop)
min:
32.6 fps, P0.1:
121.4 fps, P1:
133.3 fps, max:
322 fps
~ 156 fps
+ Compare
- Hide Comparison
+ 📈 Graph
- 📈 Hide Graph
0 100 Tooltip : Ø135.8 (124.6-148)
: Ø175.6 (157.2-194.3)
...
Intel Arc A380
NVIDIA GeForce GTX 1660 Super (Desktop)
Intel Arc A580
...
106 [X] PNY GeForce GTX 1660 XLR8 Gaming OC Intel Core i9-14900K 3.2GHz
GeForce GTX 1660 Super (Desktop)
min:
29 fps, P0.1:
78.3 fps, P1:
86.1 fps, max:
379 fps
135.5 [X] KFA2 GeForce GTX 1660 Super (1-Click OC) Intel Core i9-14900K 3.2GHz
GeForce GTX 1660 Super (Desktop)
min:
27.7 fps, P0.1:
99.3 fps, P1:
106.9 fps, max:
476 fps
~ 121 fps
+ Compare
- Hide Comparison
+ 📈 Graph
- 📈 Hide Graph
0 100 Tooltip : Ø106.1 (98.6-114.5)
: Ø135.7 (125.8-149)
...
Intel Arc A380
NVIDIA GeForce GTX 1660 Super (Desktop)
Intel Arc A580
...
88.9 [X] PNY GeForce GTX 1660 XLR8 Gaming OC Intel Core i9-14900K 3.2GHz
GeForce GTX 1660 Super (Desktop)
min:
31.7 fps, P0.1:
60.4 fps, P1:
71.7 fps, max:
279 fps
115.7 [X] KFA2 GeForce GTX 1660 Super (1-Click OC) Intel Core i9-14900K 3.2GHz
GeForce GTX 1660 Super (Desktop)
min:
28.9 fps, P0.1:
85.1 fps, P1:
92.1 fps, max:
454 fps
~ 102 fps
+ Compare
- Hide Comparison
+ 📈 Graph
- 📈 Hide Graph
0 100 Tooltip : Ø88.9 (81.8-95.3)
: Ø115.7 (107.5-125.2)
...
Intel Arc A380
NVIDIA GeForce GTX 1660 Super (Desktop)
Intel Arc A580
...
67.3 [X] PNY GeForce GTX 1660 XLR8 Gaming OC Intel Core i9-14900K 3.2GHz
GeForce GTX 1660 Super (Desktop)
min:
29 fps, P0.1:
60.1 fps, P1:
63.1 fps, max:
245 fps
84.6 [X] KFA2 GeForce GTX 1660 Super (1-Click OC) Intel Core i9-14900K 3.2GHz
GeForce GTX 1660 Super (Desktop)
min:
30.3 fps, P0.1:
71.9 fps, P1:
76 fps, max:
299 fps
~ 76 fps
+ Compare
- Hide Comparison
+ 📈 Graph
- 📈 Hide Graph
0 100 Tooltip : Ø75.1 (69.2-80.3)
: Ø93.6 (83.9-101.3)
...
Intel Arc A380
NVIDIA GeForce GTX 1660 Super (Desktop)
...
42.4 [X] PNY GeForce GTX 1660 XLR8 Gaming OC Intel Core i9-14900K 3.2GHz
GeForce GTX 1660 Super (Desktop)
min:
24.8 fps, P0.1:
26.4 fps, P1:
37.2 fps, max:
455 fps
53.4 [X] KFA2 GeForce GTX 1660 Super (1-Click OC) Intel Core i9-14900K 3.2GHz
GeForce GTX 1660 Super (Desktop)
min:
32 fps, P0.1:
42.6 fps, P1:
48.2 fps, max:
246 fps
~ 48 fps
+ Compare
- Hide Comparison
+ 📈 Graph
- 📈 Hide Graph
0 Tooltip : Ø47.4 (44.2-50.8)
: Ø60.4 (54.5-65.1)
NVIDIA GeForce GTX 1660 Super (Desktop)
...
18.6 [X] PNY GeForce GTX 1660 XLR8 Gaming OC Intel Core i9-14900K 3.2GHz
GeForce GTX 1660 Super (Desktop)
min:
18 fps, P0.1:
18.1 fps, P1:
18.4 fps, max:
29.7 fps
23.1 [X] KFA2 GeForce GTX 1660 Super (1-Click OC) Intel Core i9-14900K 3.2GHz
GeForce GTX 1660 Super (Desktop)
min:
18.7 fps, P0.1:
20.4 fps, P1:
23.1 fps, max:
55.1 fps
~ 21 fps
+ Compare
- Hide Comparison
+ 📈 Graph
- 📈 Hide Graph
0 Tooltip : Ø22.6 (20.6-23.9)
: Ø29.1 (26.7-30.9)
NVIDIA GeForce GTX 1660 Super (Desktop)
...
» With all tested laptops playable in detail settings ultra.
Additional Benchmarks
Very Low Preset 1280x720
298 [X] KFA2 GeForce GTX 1660 Super (1-Click OC) Intel Core i9-14900K 3.2GHz
GeForce GTX 1660 Super (Desktop)
min:
29.4 fps, P0.1:
175.4 fps, P1:
243 fps, max:
482 fps
298 [X] PNY GeForce GTX 1660 XLR8 Gaming OC Intel Core i9-14900K 3.2GHz
GeForce GTX 1660 Super (Desktop)
min:
28.5 fps, P0.1:
157.8 fps, P1:
245 fps, max:
410 fps
72 [X] PNY GeForce GTX 1660 XLR8 Gaming OC Intel Core i9-14900K 3.2GHz
GeForce GTX 1660 Super (Desktop)
79 [X] KFA2 GeForce GTX 1660 Super (1-Click OC) Intel Core i9-14900K 3.2GHz
GeForce GTX 1660 Super (Desktop)
~ 76 fps
+ Compare
- Hide Comparison
...
Intel Arc A380
Intel Arc A580
NVIDIA GeForce GTX 1660 Super (Desktop)
...
64 [X] PNY GeForce GTX 1660 XLR8 Gaming OC Intel Core i9-14900K 3.2GHz
GeForce GTX 1660 Super (Desktop)
72 [X] KFA2 GeForce GTX 1660 Super (1-Click OC) Intel Core i9-14900K 3.2GHz
GeForce GTX 1660 Super (Desktop)
~ 68 fps
+ Compare
- Hide Comparison
...
Intel Arc A580
NVIDIA GeForce GTX 1660 Super (Desktop)
...
51 [X] PNY GeForce GTX 1660 XLR8 Gaming OC Intel Core i9-14900K 3.2GHz
GeForce GTX 1660 Super (Desktop)
57 [X] KFA2 GeForce GTX 1660 Super (1-Click OC) Intel Core i9-14900K 3.2GHz
GeForce GTX 1660 Super (Desktop)
~ 54 fps
+ Compare
- Hide Comparison
...
Intel Arc A380
NVIDIA GeForce GTX 1660 Super (Desktop)
...
44 [X] PNY GeForce GTX 1660 XLR8 Gaming OC Intel Core i9-14900K 3.2GHz
GeForce GTX 1660 Super (Desktop)
48 [X] KFA2 GeForce GTX 1660 Super (1-Click OC) Intel Core i9-14900K 3.2GHz
GeForce GTX 1660 Super (Desktop)
~ 46 fps
+ Compare
- Hide Comparison
...
Intel Arc A380
Intel Arc A580
NVIDIA GeForce GTX 1660 Super (Desktop)
...
32 [X] PNY GeForce GTX 1660 XLR8 Gaming OC Intel Core i9-14900K 3.2GHz
GeForce GTX 1660 Super (Desktop)
35 [X] KFA2 GeForce GTX 1660 Super (1-Click OC) Intel Core i9-14900K 3.2GHz
GeForce GTX 1660 Super (Desktop)
~ 34 fps
+ Compare
- Hide Comparison
NVIDIA GeForce GTX 1660 Super (Desktop)
Intel Arc A580
...
19 [X] KFA2 GeForce GTX 1660 Super (1-Click OC) Intel Core i9-14900K 3.2GHz
GeForce GTX 1660 Super (Desktop)
21 [X] PNY GeForce GTX 1660 XLR8 Gaming OC Intel Core i9-14900K 3.2GHz
GeForce GTX 1660 Super (Desktop)
~ 20 fps
+ Compare
- Hide Comparison
NVIDIA GeForce GTX 1660 Super (Desktop)
Intel Arc A580
...
26 [X] PNY GeForce GTX 1660 XLR8 Gaming OC Intel Core i9-14900K 3.2GHz
GeForce GTX 1660 Super (Desktop)
28 [X] KFA2 GeForce GTX 1660 Super (1-Click OC) Intel Core i9-14900K 3.2GHz
GeForce GTX 1660 Super (Desktop)
~ 27 fps
+ Compare
- Hide Comparison
NVIDIA GeForce GTX 1660 Super (Desktop)
Intel Arc A580
...
» With all tested laptops playable in detail settings ultra.
Additional Benchmarks
Low Preset TAA 1280x720
108 [X] KFA2 GeForce GTX 1660 Super (1-Click OC) Intel Core i9-14900K 3.2GHz
GeForce GTX 1660 Super (Desktop)
96 [X] PNY GeForce GTX 1660 XLR8 Gaming OC Intel Core i9-14900K 3.2GHz
GeForce GTX 1660 Super (Desktop)
82.7 [X] PNY GeForce GTX 1660 XLR8 Gaming OC Intel Core i9-14900K 3.2GHz
GeForce GTX 1660 Super (Desktop)
min:
54.3 fps, P0.1:
71.2 fps, P1:
74.7 fps, max:
212 fps
93.1 [X] KFA2 GeForce GTX 1660 Super (1-Click OC) Intel Core i9-14900K 3.2GHz
GeForce GTX 1660 Super (Desktop)
min:
58.8 fps, P0.1:
80.4 fps, P1:
83.2 fps, max:
178.6 fps
~ 88 fps
+ Compare
- Hide Comparison
+ 📈 Graph
- 📈 Hide Graph
0 100 Tooltip : Ø82.4 (75.9-95.3)
: Ø93 (85-107.7)
...
Intel Arc A380
NVIDIA GeForce GTX 1660 Super (Desktop)
Intel Arc A580
...
61.6 [X] PNY GeForce GTX 1660 XLR8 Gaming OC Intel Core i9-14900K 3.2GHz
GeForce GTX 1660 Super (Desktop)
min:
52.5 fps, P0.1:
55.7 fps, P1:
56.7 fps, max:
74 fps
68.8 [X] KFA2 GeForce GTX 1660 Super (1-Click OC) Intel Core i9-14900K 3.2GHz
GeForce GTX 1660 Super (Desktop)
min:
59.9 fps, P0.1:
61.8 fps, P1:
62.5 fps, max:
82.3 fps
~ 65 fps
+ Compare
- Hide Comparison
+ 📈 Graph
- 📈 Hide Graph
0 Tooltip : Ø61.4 (57.8-70.9)
: Ø68.7 (63.5-78.8)
...
Intel Arc A380
NVIDIA GeForce GTX 1660 Super (Desktop)
Intel Arc A580
...
52.6 [X] PNY GeForce GTX 1660 XLR8 Gaming OC Intel Core i9-14900K 3.2GHz
GeForce GTX 1660 Super (Desktop)
min:
45.3 fps, P0.1:
46.8 fps, P1:
47.7 fps, max:
64.3 fps
58.7 [X] KFA2 GeForce GTX 1660 Super (1-Click OC) Intel Core i9-14900K 3.2GHz
GeForce GTX 1660 Super (Desktop)
min:
45.8 fps, P0.1:
51.2 fps, P1:
52.3 fps, max:
73.5 fps
~ 56 fps
+ Compare
- Hide Comparison
+ 📈 Graph
- 📈 Hide Graph
0 Tooltip : Ø52.4 (48.4-61.8)
: Ø58.4 (53.3-68.5)
...
Intel Arc A380
NVIDIA GeForce GTX 1660 Super (Desktop)
Intel Arc A580
...
51.6 [X] PNY GeForce GTX 1660 XLR8 Gaming OC Intel Core i9-14900K 3.2GHz
GeForce GTX 1660 Super (Desktop)
min:
46.1 fps, P0.1:
46.2 fps, P1:
46.6 fps, max:
63.4 fps
57.3 [X] KFA2 GeForce GTX 1660 Super (1-Click OC) Intel Core i9-14900K 3.2GHz
GeForce GTX 1660 Super (Desktop)
min:
50.6 fps, P0.1:
50.7 fps, P1:
51.8 fps, max:
71.2 fps
~ 54 fps
+ Compare
- Hide Comparison
+ 📈 Graph
- 📈 Hide Graph
0 Tooltip : Ø51.5 (47.6-60.4)
: Ø57 (52.5-67.3)
...
Intel Arc A380
NVIDIA GeForce GTX 1660 Super (Desktop)
Intel Arc A580
...
35.3 [X] PNY GeForce GTX 1660 XLR8 Gaming OC Intel Core i9-14900K 3.2GHz
GeForce GTX 1660 Super (Desktop)
min:
31.4 fps, P0.1:
31.4 fps, P1:
31.8 fps, max:
42.8 fps
39.3 [X] KFA2 GeForce GTX 1660 Super (1-Click OC) Intel Core i9-14900K 3.2GHz
GeForce GTX 1660 Super (Desktop)
min:
31.5 fps, P0.1:
34.3 fps, P1:
35.2 fps, max:
47.9 fps
~ 37 fps
+ Compare
- Hide Comparison
+ 📈 Graph
- 📈 Hide Graph
0 Tooltip : Ø35.2 (32.2-41.2)
: Ø39.1 (35.8-45.6)
NVIDIA GeForce GTX 1660 Super (Desktop)
Intel Arc A580
...
18.1 [X] PNY GeForce GTX 1660 XLR8 Gaming OC Intel Core i9-14900K 3.2GHz
GeForce GTX 1660 Super (Desktop)
min:
15.9 fps, P0.1:
15.9 fps, P1:
16.1 fps, max:
21.7 fps
19.3 [X] KFA2 GeForce GTX 1660 Super (1-Click OC) Intel Core i9-14900K 3.2GHz
GeForce GTX 1660 Super (Desktop)
min:
16.5 fps, P0.1:
16.7 fps, P1:
17.2 fps, max:
24.1 fps
~ 19 fps
+ Compare
- Hide Comparison
+ 📈 Graph
- 📈 Hide Graph
0 Tooltip : Ø18 (16.3-21.2)
: Ø19.2 (17.7-22.6)
NVIDIA GeForce GTX 1660 Super (Desktop)
Intel Arc A580
...
» With all tested laptops playable in detail settings ultra.
Additional Benchmarks
Low Preset 1280x720
138.3 [X] KFA2 GeForce GTX 1660 Super (1-Click OC) Intel Core i9-14900K 3.2GHz
GeForce GTX 1660 Super (Desktop)
min:
59.4 fps, P0.1:
113.1 fps, P1:
124.1 fps, max:
240 fps
121.1 [X] PNY GeForce GTX 1660 XLR8 Gaming OC Intel Core i9-14900K 3.2GHz
GeForce GTX 1660 Super (Desktop)
min:
60.8 fps, P0.1:
76.8 fps, P1:
108.1 fps, max:
228 fps
43.6 [X] PNY GeForce GTX 1660 XLR8 Gaming OC Intel Core i9-14900K 3.2GHz
GeForce GTX 1660 Super (Desktop)
min:
32 fps, P0.1:
32 fps, P1:
32.8 fps, max:
73.5 fps
48.1 [X] KFA2 GeForce GTX 1660 Super (1-Click OC) Intel Core i9-14900K 3.2GHz
GeForce GTX 1660 Super (Desktop)
min:
34.8 fps, P0.1:
35.2 fps, P1:
36.3 fps, max:
74.6 fps
~ 46 fps
+ Compare
- Hide Comparison
+ 📈 Graph
- 📈 Hide Graph
0 Tooltip : Ø43.6 (34.3-57.8)
: Ø48.3 (38.4-63.4)
...
Intel Arc A380
NVIDIA GeForce GTX 1660 Super (Desktop)
Intel Arc A580
...
37.3 [X] PNY GeForce GTX 1660 XLR8 Gaming OC Intel Core i9-14900K 3.2GHz
GeForce GTX 1660 Super (Desktop)
min:
28.7 fps, P0.1:
28.9 fps, P1:
29.6 fps, max:
54.9 fps
42.7 [X] KFA2 GeForce GTX 1660 Super (1-Click OC) Intel Core i9-14900K 3.2GHz
GeForce GTX 1660 Super (Desktop)
min:
31.2 fps, P0.1:
32.1 fps, P1:
33.1 fps, max:
69 fps
~ 40 fps
+ Compare
- Hide Comparison
+ 📈 Graph
- 📈 Hide Graph
0 Tooltip : Ø37.4 (30.6-48.9)
: Ø42.9 (34.5-55.2)
...
Intel Arc A380
NVIDIA GeForce GTX 1660 Super (Desktop)
Intel Arc A580
...
29.9 [X] PNY GeForce GTX 1660 XLR8 Gaming OC Intel Core i9-14900K 3.2GHz
GeForce GTX 1660 Super (Desktop)
min:
19 fps, P0.1:
19.2 fps, P1:
19.7 fps, max:
45 fps
32.9 [X] KFA2 GeForce GTX 1660 Super (1-Click OC) Intel Core i9-14900K 3.2GHz
GeForce GTX 1660 Super (Desktop)
min:
22.3 fps, P0.1:
22.3 fps, P1:
22.9 fps, max:
46.3 fps
~ 31 fps
+ Compare
- Hide Comparison
+ 📈 Graph
- 📈 Hide Graph
0 Tooltip : Ø30.1 (20.4-41.2)
: Ø33.1 (24.7-42.2)
...
Intel Arc A380
NVIDIA GeForce GTX 1660 Super (Desktop)
...
20.6 [X] PNY GeForce GTX 1660 XLR8 Gaming OC Intel Core i9-14900K 3.2GHz
GeForce GTX 1660 Super (Desktop)
min:
13.6 fps, P0.1:
13.6 fps, P1:
13.8 fps, max:
31.8 fps
24.1 [X] KFA2 GeForce GTX 1660 Super (1-Click OC) Intel Core i9-14900K 3.2GHz
GeForce GTX 1660 Super (Desktop)
min:
16.3 fps, P0.1:
16.5 fps, P1:
17 fps, max:
36.5 fps
~ 22 fps
+ Compare
- Hide Comparison
+ 📈 Graph
- 📈 Hide Graph
0 Tooltip : Ø20.8 (14.4-28.9)
: Ø24.1 (18.6-33.3)
Intel Arc A380
NVIDIA GeForce GTX 1660 Super (Desktop)
...
17.2 [X] PNY GeForce GTX 1660 XLR8 Gaming OC Intel Core i9-14900K 3.2GHz
GeForce GTX 1660 Super (Desktop)
min:
11.2 fps, P0.1:
11.3 fps, P1:
11.5 fps, max:
25.2 fps
17.8 [X] KFA2 GeForce GTX 1660 Super (1-Click OC) Intel Core i9-14900K 3.2GHz
GeForce GTX 1660 Super (Desktop)
min:
12.2 fps, P0.1:
12.2 fps, P1:
12.5 fps, max:
26 fps
~ 18 fps
+ Compare
- Hide Comparison
+ 📈 Graph
- 📈 Hide Graph
0 Tooltip : Ø17.2 (11.7-24.1)
: Ø17.8 (13.1-23.3)
NVIDIA GeForce GTX 1660 Super (Desktop)
...
8.2 [X] KFA2 GeForce GTX 1660 Super (1-Click OC) Intel Core i9-14900K 3.2GHz
GeForce GTX 1660 Super (Desktop)
min:
5.62 fps, P0.1:
5.62 fps, P1:
5.68 fps, max:
11.6 fps
8.5 [X] PNY GeForce GTX 1660 XLR8 Gaming OC Intel Core i9-14900K 3.2GHz
GeForce GTX 1660 Super (Desktop)
min:
5.61 fps, P0.1:
5.62 fps, P1:
5.65 fps, max:
12.3 fps
~ 8 fps
+ Compare
- Hide Comparison
+ 📈 Graph
- 📈 Hide Graph
0 Tooltip : Ø8.22 (5.78-11)
: Ø8.5 (5.74-11.6)
NVIDIA GeForce GTX 1660 Super (Desktop)
...
13.9 [X] PNY GeForce GTX 1660 XLR8 Gaming OC Intel Core i9-14900K 3.2GHz
GeForce GTX 1660 Super (Desktop)
min:
8.22 fps, P0.1:
8.7 fps, P1:
9.66 fps, max:
20.1 fps
14 [X] KFA2 GeForce GTX 1660 Super (1-Click OC) Intel Core i9-14900K 3.2GHz
GeForce GTX 1660 Super (Desktop)
min:
4.77 fps, P0.1:
5.64 fps, P1:
8.52 fps, max:
221 fps
~ 14 fps
+ Compare
- Hide Comparison
+ 📈 Graph
- 📈 Hide Graph
0 Tooltip : Ø13.9 (9.89-19)
: Ø14.1 (8.65-20.5)
NVIDIA GeForce GTX 1660 Super (Desktop)
...
» With all tested laptops playable in detail settings med..
Additional Benchmarks
Max. Performance 1280x720
81.1 [X] KFA2 GeForce GTX 1660 Super (1-Click OC) Intel Core i9-14900K 3.2GHz
GeForce GTX 1660 Super (Desktop)
min:
52.8 fps, P0.1:
53.6 fps, P1:
55.9 fps, max:
170.2 fps
72.6 [X] PNY GeForce GTX 1660 XLR8 Gaming OC Intel Core i9-14900K 3.2GHz
GeForce GTX 1660 Super (Desktop)
min:
43.1 fps, P0.1:
43.4 fps, P1:
45.8 fps, max:
160.7 fps
81.7 [X] PNY GeForce GTX 1660 XLR8 Gaming OC Intel Core i9-14900K 3.2GHz
GeForce GTX 1660 Super (Desktop)
min:
35.8 fps, P0.1:
65.3 fps, P1:
71.4 fps, max:
235 fps
90.3 [X] KFA2 GeForce GTX 1660 Super (1-Click OC) Intel Core i9-14900K 3.2GHz
GeForce GTX 1660 Super (Desktop)
min:
39 fps, P0.1:
63.6 fps, P1:
77 fps, max:
271 fps
~ 86 fps
+ Compare
- Hide Comparison
+ 📈 Graph
- 📈 Hide Graph
0 100 Tooltip : Ø81.5 (73.2-93.3)
: Ø90.1 (79.2-102.4)
...
Intel Arc A380
NVIDIA GeForce GTX 1660 Super (Desktop)
Intel Arc A580
...
67.9 [X] PNY GeForce GTX 1660 XLR8 Gaming OC Intel Core i9-14900K 3.2GHz
GeForce GTX 1660 Super (Desktop)
min:
31.1 fps, P0.1:
54.9 fps, P1:
60.4 fps, max:
167 fps
73.6 [X] KFA2 GeForce GTX 1660 Super (1-Click OC) Intel Core i9-14900K 3.2GHz
GeForce GTX 1660 Super (Desktop)
min:
31.8 fps, P0.1:
54 fps, P1:
63 fps, max:
151.1 fps
~ 71 fps
+ Compare
- Hide Comparison
+ 📈 Graph
- 📈 Hide Graph
0 Tooltip : Ø67.8 (62-79.7)
: Ø73.3 (64.3-87.8)
...
Intel Arc A380
NVIDIA GeForce GTX 1660 Super (Desktop)
Intel Arc A580
...
51.4 [X] PNY GeForce GTX 1660 XLR8 Gaming OC Intel Core i9-14900K 3.2GHz
GeForce GTX 1660 Super (Desktop)
min:
27.4 fps, P0.1:
28.3 fps, P1:
43.7 fps, max:
213 fps
56.9 [X] KFA2 GeForce GTX 1660 Super (1-Click OC) Intel Core i9-14900K 3.2GHz
GeForce GTX 1660 Super (Desktop)
min:
26.6 fps, P0.1:
33.3 fps, P1:
48.9 fps, max:
187.2 fps
~ 54 fps
+ Compare
- Hide Comparison
+ 📈 Graph
- 📈 Hide Graph
0 Tooltip : Ø51.3 (46.2-58.2)
: Ø56.8 (50.5-66.2)
...
Intel Arc A380
NVIDIA GeForce GTX 1660 Super (Desktop)
Intel Arc A580
...
46.7 [X] PNY GeForce GTX 1660 XLR8 Gaming OC Intel Core i9-14900K 3.2GHz
GeForce GTX 1660 Super (Desktop)
min:
11.4 fps, P0.1:
22.2 fps, P1:
39.1 fps, max:
190.5 fps
52.6 [X] KFA2 GeForce GTX 1660 Super (1-Click OC) Intel Core i9-14900K 3.2GHz
GeForce GTX 1660 Super (Desktop)
min:
24.3 fps, P0.1:
29.3 fps, P1:
45.8 fps, max:
169.8 fps
~ 50 fps
+ Compare
- Hide Comparison
+ 📈 Graph
- 📈 Hide Graph
0 Tooltip : Ø46.4 (41.7-54)
: Ø52.6 (47.6-60.8)
...
Intel Arc A380
NVIDIA GeForce GTX 1660 Super (Desktop)
Intel Arc A580
...
33.6 [X] PNY GeForce GTX 1660 XLR8 Gaming OC Intel Core i9-14900K 3.2GHz
GeForce GTX 1660 Super (Desktop)
min:
14.6 fps, P0.1:
16.6 fps, P1:
21.4 fps, max:
264 fps
34.4 [X] KFA2 GeForce GTX 1660 Super (1-Click OC) Intel Core i9-14900K 3.2GHz
GeForce GTX 1660 Super (Desktop)
min:
15.6 fps, P0.1:
17.9 fps, P1:
20.4 fps, max:
213 fps
~ 34 fps
+ Compare
- Hide Comparison
+ 📈 Graph
- 📈 Hide Graph
0 Tooltip : Ø33.5 (29.7-39.7)
: Ø34.4 (31.3-38.6)
NVIDIA GeForce GTX 1660 Super (Desktop)
Intel Arc A580
...
17.2 [X] PNY GeForce GTX 1660 XLR8 Gaming OC Intel Core i9-14900K 3.2GHz
GeForce GTX 1660 Super (Desktop)
min:
8.47 fps, P0.1:
8.54 fps, P1:
8.84 fps, max:
219 fps
17.5 [X] KFA2 GeForce GTX 1660 Super (1-Click OC) Intel Core i9-14900K 3.2GHz
GeForce GTX 1660 Super (Desktop)
min:
8.46 fps, P0.1:
8.5 fps, P1:
9.26 fps, max:
204 fps
~ 17 fps
+ Compare
- Hide Comparison
+ 📈 Graph
- 📈 Hide Graph
0 Tooltip : Ø17.1 (15.6-19.3)
: Ø17.5 (14.8-19.5)
NVIDIA GeForce GTX 1660 Super (Desktop)
...
» With all tested laptops playable in detail settings ultra.
Additional Benchmarks
Very Low Preset 1280x720
201 [X] KFA2 GeForce GTX 1660 Super (1-Click OC) Intel Core i9-14900K 3.2GHz
GeForce GTX 1660 Super (Desktop)
min:
15.4 fps, P0.1:
104.3 fps, P1:
116.5 fps, max:
439 fps
185.8 [X] PNY GeForce GTX 1660 XLR8 Gaming OC Intel Core i9-14900K 3.2GHz
GeForce GTX 1660 Super (Desktop)
min:
53.7 fps, P0.1:
110.7 fps, P1:
115.3 fps, max:
380 fps
358 [X] KFA2 GeForce GTX 1660 Super (1-Click OC) Intel Core i9-14900K 3.2GHz
GeForce GTX 1660 Super (Desktop)
min:
28.8 fps, P0.1:
140.8 fps, P1:
329 fps, max:
1106 fps
359 [X] PNY GeForce GTX 1660 XLR8 Gaming OC Intel Core i9-14900K 3.2GHz
GeForce GTX 1660 Super (Desktop)
min:
27.1 fps, P0.1:
268 fps, P1:
328 fps, max:
777 fps
~ 359 fps
+ Compare
- Hide Comparison
+ 📈 Graph
- 📈 Hide Graph
0 100 200 300 Tooltip : Ø358 (345-360)
: Ø359 (345-360)
Intel UHD Graphics 32EUs (Alder Lake)
...
Intel Arc A580
NVIDIA GeForce GTX 1660 Super (Desktop)
...
302 [X] PNY GeForce GTX 1660 XLR8 Gaming OC Intel Core i9-14900K 3.2GHz
GeForce GTX 1660 Super (Desktop)
min:
24 fps, P0.1:
223 fps, P1:
241 fps, max:
702 fps
318 [X] PNY GeForce GTX 1660 XLR8 Gaming OC Intel Core i9-14900K 3.2GHz
GeForce GTX 1660 Super (Desktop)
min:
26.9 fps, P0.1:
236 fps, P1:
256 fps, max:
1127 fps
356 [X] KFA2 GeForce GTX 1660 Super (1-Click OC) Intel Core i9-14900K 3.2GHz
GeForce GTX 1660 Super (Desktop)
min:
26.8 fps, P0.1:
270 fps, P1:
309 fps, max:
1148 fps
~ 325 fps
+ Compare
- Hide Comparison
+ 📈 Graph
- 📈 Hide Graph
0 100 200 300 Tooltip : Ø301 (258-330)
: Ø316 (277-360)
: Ø356 (328-360)
...
Intel Arc A380
NVIDIA GeForce GTX 1660 Super (Desktop)
...
...
NVIDIA GeForce GTX 1660 Super (Desktop)
Intel Arc A580
...
182.7 [X] PNY GeForce GTX 1660 XLR8 Gaming OC Intel Core i9-14900K 3.2GHz
GeForce GTX 1660 Super (Desktop)
min:
23.7 fps, P0.1:
142.2 fps, P1:
152.7 fps, max:
590 fps
216 [X] KFA2 GeForce GTX 1660 Super (1-Click OC) Intel Core i9-14900K 3.2GHz
GeForce GTX 1660 Super (Desktop)
min:
24.8 fps, P0.1:
157.9 fps, P1:
179.7 fps, max:
692 fps
~ 199 fps
+ Compare
- Hide Comparison
+ 📈 Graph
- 📈 Hide Graph
0 100 200 Tooltip : Ø182 (161.1-201)
: Ø216 (188.5-238)
NVIDIA GeForce GTX 1660 Super (Desktop)
Intel Arc A580
...
90.8 [X] PNY GeForce GTX 1660 XLR8 Gaming OC Intel Core i9-14900K 3.2GHz
GeForce GTX 1660 Super (Desktop)
min:
20.3 fps, P0.1:
69.7 fps, P1:
73.5 fps, max:
318 fps
106.2 [X] KFA2 GeForce GTX 1660 Super (1-Click OC) Intel Core i9-14900K 3.2GHz
GeForce GTX 1660 Super (Desktop)
min:
21.1 fps, P0.1:
72.8 fps, P1:
86.3 fps, max:
275 fps
~ 99 fps
+ Compare
- Hide Comparison
+ 📈 Graph
- 📈 Hide Graph
0 100 Tooltip : Ø90.8 (76.3-98.2)
: Ø105.7 (90.1-118.1)
NVIDIA GeForce GTX 1660 Super (Desktop)
Intel Arc A580
...
» With all tested laptops playable in detail settings ultra.
...
NVIDIA GeForce GTX 1660 Super (Desktop)
Intel Arc A580
...
...
NVIDIA GeForce GTX 1660 Super (Desktop)
...
...
Intel Arc A380
NVIDIA GeForce GTX 1660 Super (Desktop)
...
...
Intel Arc A380
NVIDIA GeForce GTX 1660 Super (Desktop)
...
NVIDIA GeForce GTX 1660 Super (Desktop)
...
NVIDIA GeForce GTX 1660 Super (Desktop)
...
» With all tested laptops playable in detail settings ultra.
0 100 Tooltip : Ø166.8 (134.14-194.089)
...
NVIDIA GeForce GTX 1660 Super (Desktop)
Intel Arc A580
...
Intel UHD Graphics 32EUs (Alder Lake)
...
NVIDIA GeForce GTX 1660 Super (Desktop)
Intel Arc A580
...
Intel UHD Graphics 32EUs (Alder Lake)
...
NVIDIA GeForce GTX 1660 Super (Desktop)
Intel Arc A580
...
Intel UHD Graphics 32EUs (Alder Lake)
...
NVIDIA GeForce GTX 1660 Super (Desktop)
...
NVIDIA GeForce GTX 1660 Super (Desktop)
...
NVIDIA GeForce GTX 1660 Super (Desktop)
...
» With all tested laptops playable in detail settings ultra.
Additional Benchmarks
Low Preset 1280x720
269 [X] KFA2 GeForce GTX 1660 Super AMD Ryzen 9 7950X 4.5GHz
GeForce GTX 1660 Super (Desktop)
min:
72.5 fps, P0.1:
150.3 fps, P1:
186 fps, max:
440 fps
...
Intel Arc A580
NVIDIA GeForce GTX 1660 Super (Desktop)
...
...
NVIDIA GeForce GTX 1660 Super (Desktop)
...
...
Intel Arc A380
NVIDIA GeForce GTX 1660 Super (Desktop)
Intel Arc A580
...
...
Intel Arc A380
NVIDIA GeForce GTX 1660 Super (Desktop)
Intel Arc A580
...
NVIDIA GeForce GTX 1660 Super (Desktop)
Intel Arc A580
...
...
Intel Arc A580
NVIDIA GeForce GTX 1660 Super (Desktop)
...
» With all tested laptops playable in detail settings high.
Additional Benchmarks
Low Preset TAA 1280x720
73 [X] KFA2 GeForce GTX 1660 Super AMD Ryzen 9 7950X 4.5GHz
GeForce GTX 1660 Super (Desktop)
min:
52 fps, max:
94 fps
NVIDIA GeForce GTX 1660 Super (Desktop)
Intel Arc A580
...
NVIDIA GeForce GTX 1660 Super (Desktop)
Intel Arc A580
...
NVIDIA GeForce GTX 1660 Super (Desktop)
...
NVIDIA GeForce GTX 1660 Super (Desktop)
Intel Arc A580
...
NVIDIA GeForce GTX 1660 Super (Desktop)
Intel Arc A580
...
NVIDIA GeForce GTX 1660 Super (Desktop)
...
» With all tested laptops playable in detail settings ultra.
Additional Benchmarks
Minimum Preset 1280x720
125 [X] KFA2 GeForce GTX 1660 Super AMD Ryzen 9 7950X 4.5GHz
GeForce GTX 1660 Super (Desktop)
...
NVIDIA GeForce GTX 1660 Super (Desktop)
Intel Arc A580
...
...
NVIDIA GeForce GTX 1660 Super (Desktop)
Intel Arc A580
...
...
Intel Arc A380
NVIDIA GeForce GTX 1660 Super (Desktop)
Intel Arc A580
...
...
Intel Arc A380
NVIDIA GeForce GTX 1660 Super (Desktop)
Intel Arc A580
...
NVIDIA GeForce GTX 1660 Super (Desktop)
Intel Arc A580
...
NVIDIA GeForce GTX 1660 Super (Desktop)
Intel Arc A580
...
» With all tested laptops playable in detail settings ultra.
Additional Benchmarks
Ultra Low Preset LowAA 1280x720
182.1 [X] KFA2 GeForce GTX 1660 Super AMD Ryzen 9 7950X 4.5GHz
GeForce GTX 1660 Super (Desktop)
min:
7.92 fps, P0.1:
21.7 fps, P1:
115.2 fps, max:
351 fps
...
NVIDIA GeForce GTX 1660 Super (Desktop)
Intel Arc A580
...
...
NVIDIA GeForce GTX 1660 Super (Desktop)
Intel Arc A580
...
...
NVIDIA GeForce GTX 1660 Super (Desktop)
Intel Arc A580
...
NVIDIA GeForce GTX 1660 Super (Desktop)
...
NVIDIA GeForce GTX 1660 Super (Desktop)
...
» With all tested laptops playable in detail settings low.
Additional Benchmarks
Low Preset 1280x720
65.3 [X] KFA2 GeForce GTX 1660 Super AMD Ryzen 9 7950X 4.5GHz
GeForce GTX 1660 Super (Desktop)
min:
46.9 fps, P0.1:
47.8 fps, P1:
52.2 fps, max:
104.8 fps
...
NVIDIA GeForce GTX 1660 Super (Desktop)
Intel Arc A580
...
...
NVIDIA GeForce GTX 1660 Super (Desktop)
Intel Arc A580
...
...
Intel Arc A380
NVIDIA GeForce GTX 1660 Super (Desktop)
...
...
NVIDIA GeForce GTX 1660 Super (Desktop)
...
NVIDIA GeForce GTX 1660 Super (Desktop)
...
» With all tested laptops playable in detail settings med..
Additional Benchmarks
Low Preset 1280x720
32.2 [X] KFA2 GeForce GTX 1660 Super AMD Ryzen 9 7950X 4.5GHz
GeForce GTX 1660 Super (Desktop)
min:
24.3 fps, P0.1:
25.4 fps, P1:
27.2 fps, max:
42.8 fps
...
NVIDIA GeForce GTX 1660 Super (Desktop)
Intel Arc A580
...
...
NVIDIA GeForce GTX 1660 Super (Desktop)
...
...
NVIDIA GeForce GTX 1660 Super (Desktop)
Intel Arc A580
...
...
NVIDIA GeForce GTX 1660 Super (Desktop)
...
NVIDIA GeForce GTX 1660 Super (Desktop)
...
NVIDIA GeForce GTX 1660 Super (Desktop)
...
» With all tested laptops playable in detail settings ultra.
Additional Benchmarks
Low Preset 1280x720
430.5 [X] KFA2 GeForce GTX 1660 Super AMD Ryzen 9 7950X 4.5GHz
GeForce GTX 1660 Super (Desktop)
82 [X] KFA2 GeForce GTX 1660 Super AMD Ryzen 9 7950X 4.5GHz
GeForce GTX 1660 Super (Desktop)
min:
50 fps, P0.1:
55 fps, P1:
67 fps, max:
100 fps
fps
+ Compare
- Hide Comparison
...
NVIDIA GeForce GTX 1660 Super (Desktop)
Intel Arc A580
...
75 [X] KFA2 GeForce GTX 1660 Super AMD Ryzen 9 7950X 4.5GHz
GeForce GTX 1660 Super (Desktop)
min:
48 fps, P0.1:
52 fps, P1:
59 fps, max:
105 fps
fps
+ Compare
- Hide Comparison
...
Intel Arc A580
NVIDIA GeForce GTX 1660 Super (Desktop)
...
70 [X] KFA2 GeForce GTX 1660 Super AMD Ryzen 9 7950X 4.5GHz
GeForce GTX 1660 Super (Desktop)
min:
26 fps, P0.1:
45 fps, P1:
54 fps, max:
106 fps
fps
+ Compare
- Hide Comparison
...
NVIDIA GeForce GTX 1660 Super (Desktop)
Intel Arc A580
...
52 [X] KFA2 GeForce GTX 1660 Super AMD Ryzen 9 7950X 4.5GHz
GeForce GTX 1660 Super (Desktop)
min:
21 fps, P0.1:
24 fps, P1:
37 fps, max:
64 fps
fps
+ Compare
- Hide Comparison
...
NVIDIA GeForce GTX 1660 Super (Desktop)
Intel Arc A580
...
39 [X] KFA2 GeForce GTX 1660 Super AMD Ryzen 9 7950X 4.5GHz
GeForce GTX 1660 Super (Desktop)
min:
21 fps, P0.1:
27 fps, P1:
32 fps, max:
47 fps
fps
+ Compare
- Hide Comparison
NVIDIA GeForce GTX 1660 Super (Desktop)
Intel Arc A580
...
22 [X] KFA2 GeForce GTX 1660 Super AMD Ryzen 9 7950X 4.5GHz
GeForce GTX 1660 Super (Desktop)
min:
16 fps, P0.1:
16 fps, P1:
17 fps, max:
26 fps
fps
+ Compare
- Hide Comparison
NVIDIA GeForce GTX 1660 Super (Desktop)
Intel Arc A580
...
» With all tested laptops playable in detail settings ultra.
Additional Benchmarks
Low Preset (Adaptive Quality Off) 1280x720
121 [X] KFA2 GeForce GTX 1660 Super AMD Ryzen 9 7950X 4.5GHz
GeForce GTX 1660 Super (Desktop)
min:
67 fps, P0.1:
74 fps, P1:
99 fps, max:
208 fps
0 100 200 300 400 500 600 Tooltip
...
NVIDIA GeForce GTX 1660 Super (Desktop)
...
...
NVIDIA GeForce GTX 1660 Super (Desktop)
...
...
NVIDIA GeForce GTX 1660 Super (Desktop)
...
...
NVIDIA GeForce GTX 1660 Super (Desktop)
...
NVIDIA GeForce GTX 1660 Super (Desktop)
...
NVIDIA GeForce GTX 1660 Super (Desktop)
...
» With all tested laptops playable in detail settings ultra.
Additional Benchmarks
Low Preset 1280x720
284 [X] KFA2 GeForce GTX 1660 Super AMD Ryzen 9 7950X 4.5GHz
GeForce GTX 1660 Super (Desktop)
min:
4.42 fps, P0.1:
204 fps, P1:
222 fps, max:
404 fps
Intel UHD Graphics 32EUs (Alder Lake)
...
Intel Arc A380
NVIDIA GeForce GTX 1660 Super (Desktop)
Intel Arc A580
...
Intel UHD Graphics 32EUs (Alder Lake)
...
NVIDIA GeForce GTX 1660 Super (Desktop)
Intel Arc A580
...
Intel UHD Graphics 32EUs (Alder Lake)
...
NVIDIA GeForce GTX 1660 Super (Desktop)
Intel Arc A580
...
...
NVIDIA GeForce GTX 1660 Super (Desktop)
Intel Arc A580
...
NVIDIA GeForce GTX 1660 Super (Desktop)
Intel Arc A580
...
NVIDIA GeForce GTX 1660 Super (Desktop)
Intel Arc A580
...
» With all tested laptops playable in detail settings ultra.
Additional Benchmarks
Low Preset 1280x720
326 [X] KFA2 GeForce GTX 1660 Super AMD Ryzen 9 7950X 4.5GHz
GeForce GTX 1660 Super (Desktop)
min:
35.4 fps, P0.1:
123.4 fps, P1:
145.9 fps, max:
1097 fps
79.5 [X] KFA2 GeForce GTX 1660 Super 2.0
AMD Ryzen 9 7950X 4.5GHz
GeForce GTX 1660 Super (Desktop)
min:
56.2 fps, max:
120.6 fps
100 [X] KFA2 GeForce GTX 1660 Super 2.0
AMD Ryzen 9 7950X 4.5GHz
GeForce GTX 1660 Super (Desktop)
min:
52.2 fps, max:
182.5 fps
~ 90 fps
+ Compare
- Hide Comparison
...
NVIDIA GeForce GTX 1660 Super (Desktop)
Intel Arc A580
...
...
NVIDIA GeForce GTX 1660 Super (Desktop)
...
...
NVIDIA GeForce GTX 1660 Super (Desktop)
...
...
NVIDIA GeForce GTX 1660 Super (Desktop)
...
...
NVIDIA GeForce GTX 1660 Super (Desktop)
...
NVIDIA GeForce GTX 1660 Super (Desktop)
...
» With all tested laptops playable in detail settings ultra.
Additional Benchmarks
Low Preset (FSR off) 1280x720
126.2 [X] KFA2 GeForce GTX 1660 Super AMD Ryzen 9 7950X 4.5GHz
GeForce GTX 1660 Super (Desktop)
min:
50.8 fps, max:
222 fps
Steam Deck 1280x720
139.2 [X] KFA2 GeForce GTX 1660 Super AMD Ryzen 9 7950X 4.5GHz
GeForce GTX 1660 Super (Desktop)
min:
57.6 fps, max:
223 fps
...
NVIDIA GeForce GTX 1660 Super (Desktop)
Intel Arc A580
...
...
NVIDIA GeForce GTX 1660 Super (Desktop)
Intel Arc A580
...
...
NVIDIA GeForce GTX 1660 Super (Desktop)
Intel Arc A580
...
...
NVIDIA GeForce GTX 1660 Super (Desktop)
Intel Arc A580
...
NVIDIA GeForce GTX 1660 Super (Desktop)
Intel Arc A580
...
NVIDIA GeForce GTX 1660 Super (Desktop)
...
» With all tested laptops playable in detail settings ultra.
Additional Benchmarks
Low Preset 1280x720
189.5 [X] KFA2 GeForce GTX 1660 Super AMD Ryzen 9 7950X 4.5GHz
GeForce GTX 1660 Super (Desktop)
min:
33.9 fps, P0.1:
83.2 fps, P1:
119.6 fps, max:
409 fps
...
NVIDIA GeForce GTX 1660 Super (Desktop)
Intel Arc A580
...
...
NVIDIA GeForce GTX 1660 Super (Desktop)
Intel Arc A580
...
...
NVIDIA GeForce GTX 1660 Super (Desktop)
Intel Arc A580
...
...
NVIDIA GeForce GTX 1660 Super (Desktop)
Intel Arc A580
...
Intel Arc A580
NVIDIA GeForce GTX 1660 Super (Desktop)
...
Intel Arc A580
NVIDIA GeForce GTX 1660 Super (Desktop)
...
» With all tested laptops playable in detail settings med..
Additional Benchmarks
Low Preset 1280x720
53.7 [X] KFA2 GeForce GTX 1660 Super AMD Ryzen 9 7950X 4.5GHz
GeForce GTX 1660 Super (Desktop)
min:
38.5 fps, P0.1:
39.5 fps, P1:
42.5 fps, max:
82.4 fps
...
Intel Arc A580
NVIDIA GeForce GTX 1660 Super (Desktop)
...
...
NVIDIA GeForce GTX 1660 Super (Desktop)
Intel Arc A580
...
...
NVIDIA GeForce GTX 1660 Super (Desktop)
Intel Arc A580
...
...
NVIDIA GeForce GTX 1660 Super (Desktop)
Intel Arc A580
...
NVIDIA GeForce GTX 1660 Super (Desktop)
Intel Arc A580
...
NVIDIA GeForce GTX 1660 Super (Desktop)
...
» With all tested laptops playable in detail settings ultra.
Additional Benchmarks
Low Preset 1280x720
119.7 [X] KFA2 GeForce GTX 1660 Super AMD Ryzen 9 7950X 4.5GHz
GeForce GTX 1660 Super (Desktop)
min:
36.1 fps, P0.1:
88.3 fps, P1:
95.8 fps, max:
176.5 fps
...
Intel Arc A380
NVIDIA GeForce GTX 1660 Super (Desktop)
Intel Arc A580
...
...
Intel Arc A380
NVIDIA GeForce GTX 1660 Super (Desktop)
Intel Arc A580
...
Intel Arc A380
NVIDIA GeForce GTX 1660 Super (Desktop)
...
NVIDIA GeForce GTX 1660 Super (Desktop)
...
NVIDIA GeForce GTX 1660 Super (Desktop)
...
» With all tested laptops playable in detail settings low.
Additional Benchmarks
Low 1280x720
61.5 [X] KFA2 GeForce GTX 1660 Super AMD Ryzen 9 7950X 4.5GHz
GeForce GTX 1660 Super (Desktop)
min:
14.2 fps, P0.1:
29.4 fps, P1:
41.3 fps, max:
132.9 fps
...
NVIDIA GeForce GTX 1660 Super (Desktop)
Intel Arc A580
...
...
NVIDIA GeForce GTX 1660 Super (Desktop)
Intel Arc A580
...
...
NVIDIA GeForce GTX 1660 Super (Desktop)
Intel Arc A580
...
...
NVIDIA GeForce GTX 1660 Super (Desktop)
Intel Arc A580
...
NVIDIA GeForce GTX 1660 Super (Desktop)
Intel Arc A580
...
NVIDIA GeForce GTX 1660 Super (Desktop)
Intel Arc A580
...
» With all tested laptops playable in detail settings ultra.
Additional Benchmarks
Low Preset 1280x720
151.5 [X] KFA2 GeForce GTX 1660 Super AMD Ryzen 9 7950X 4.5GHz
GeForce GTX 1660 Super (Desktop)
min:
81.3 fps, P0.1:
97.8 fps, P1:
116 fps, max:
231 fps
...
NVIDIA GeForce GTX 1660 Super (Desktop)
...
...
NVIDIA GeForce GTX 1660 Super (Desktop)
...
...
NVIDIA GeForce GTX 1660 Super (Desktop)
...
...
NVIDIA GeForce GTX 1660 Super (Desktop)
...
NVIDIA GeForce GTX 1660 Super (Desktop)
...
NVIDIA GeForce GTX 1660 Super (Desktop)
...
» With all tested laptops playable in detail settings ultra.
Additional Benchmarks
Low Preset 1280x720
113.3 [X] KFA2 GeForce GTX 1660 Super AMD Ryzen 9 7950X 4.5GHz
GeForce GTX 1660 Super (Desktop)
min:
62.7 fps, P0.1:
74.3 fps, P1:
97.6 fps, max:
310 fps
...
Intel Arc A380
NVIDIA GeForce GTX 1660 Super (Desktop)
...
...
NVIDIA GeForce GTX 1660 Super (Desktop)
...
...
NVIDIA GeForce GTX 1660 Super (Desktop)
...
...
Intel Arc A380
NVIDIA GeForce GTX 1660 Super (Desktop)
...
NVIDIA GeForce GTX 1660 Super (Desktop)
Intel Arc A580
...
NVIDIA GeForce GTX 1660 Super (Desktop)
...
» With all tested laptops playable in detail settings high.
Additional Benchmarks
Very Low Preset 1280x720
88.3 [X] KFA2 GeForce GTX 1660 Super AMD Ryzen 9 7950X 4.5GHz
GeForce GTX 1660 Super (Desktop)
min:
68.2 fps, P0.1:
70.7 fps, P1:
78.9 fps, max:
110.3 fps
196.8 [X] KFA2 GeForce GTX 1660 Super 1016022
AMD Ryzen 9 7950X 4.5GHz
GeForce GTX 1660 Super (Desktop)
min:
170 fps, P1:
163 fps, max:
227 fps
fps
+ Compare
- Hide Comparison
...
NVIDIA GeForce GTX 1660 Super (Desktop)
Intel Arc A580
...
171 [X] KFA2 GeForce GTX 1660 Super 1016022
AMD Ryzen 9 7950X 4.5GHz
GeForce GTX 1660 Super (Desktop)
min:
150 fps, P1:
144 fps, max:
197 fps
fps
+ Compare
- Hide Comparison
...
NVIDIA GeForce GTX 1660 Super (Desktop)
Intel Arc A580
...
116.6 [X] KFA2 GeForce GTX 1660 Super 1016022
AMD Ryzen 9 7950X 4.5GHz
GeForce GTX 1660 Super (Desktop)
min:
102 fps, P1:
100 fps, max:
129 fps
fps
+ Compare
- Hide Comparison
...
NVIDIA GeForce GTX 1660 Super (Desktop)
Intel Arc A580
...
82.9 [X] KFA2 GeForce GTX 1660 Super 1016022
AMD Ryzen 9 7950X 4.5GHz
GeForce GTX 1660 Super (Desktop)
min:
69 fps, P1:
70 fps, max:
94 fps
fps
+ Compare
- Hide Comparison
...
NVIDIA GeForce GTX 1660 Super (Desktop)
...
59.9 [X] KFA2 GeForce GTX 1660 Super 1016022
AMD Ryzen 9 7950X 4.5GHz
GeForce GTX 1660 Super (Desktop)
min:
52 fps, P1:
51 fps, max:
69 fps
fps
+ Compare
- Hide Comparison
...
NVIDIA GeForce GTX 1660 Super (Desktop)
...
30.7 [X] KFA2 GeForce GTX 1660 Super 1016022
AMD Ryzen 9 7950X 4.5GHz
GeForce GTX 1660 Super (Desktop)
min:
25 fps, P1:
25 fps, max:
35 fps
fps
+ Compare
- Hide Comparison
...
NVIDIA GeForce GTX 1660 Super (Desktop)
...
» With all tested laptops playable in detail settings ultra.
Additional Benchmarks
Ultra Low Preset TAA 1280x720
340 [X] KFA2 GeForce GTX 1660 Super AMD Ryzen 9 7950X 4.5GHz
GeForce GTX 1660 Super (Desktop)
min:
267 fps, P1:
248 fps, max:
390 fps
...
NVIDIA GeForce GTX 1660 Super (Desktop)
Intel Arc A580
...
...
NVIDIA GeForce GTX 1660 Super (Desktop)
Intel Arc A580
...
Intel UHD Graphics 32EUs (Alder Lake)
...
NVIDIA GeForce GTX 1660 Super (Desktop)
Intel Arc A580
...
Intel UHD Graphics 32EUs (Alder Lake)
...
NVIDIA GeForce GTX 1660 Super (Desktop)
Intel Arc A580
...
NVIDIA GeForce GTX 1660 Super (Desktop)
Intel Arc A580
...
NVIDIA GeForce GTX 1660 Super (Desktop)
...
» With all tested laptops playable in detail settings ultra.
Additional Benchmarks
Low Preset 1280x720
298 [X] KFA2 GeForce GTX 1660 Super AMD Ryzen 9 7950X 4.5GHz
GeForce GTX 1660 Super (Desktop)
min:
79.6 fps, P0.1:
159 fps, P1:
220 fps, max:
581 fps
...
NVIDIA GeForce GTX 1660 Super (Desktop)
Intel Arc A580
...
...
NVIDIA GeForce GTX 1660 Super (Desktop)
Intel Arc A580
...
...
NVIDIA GeForce GTX 1660 Super (Desktop)
Intel Arc A580
...
...
NVIDIA GeForce GTX 1660 Super (Desktop)
Intel Arc A580
...
...
NVIDIA GeForce GTX 1660 Super (Desktop)
Intel Arc A580
...
NVIDIA GeForce GTX 1660 Super (Desktop)
Intel Arc A580
...
» With all tested laptops playable in detail settings ultra.
Additional Benchmarks
Low Preset 1280x720
93.8 [X] KFA2 GeForce GTX 1660 Super AMD Ryzen 9 7950X 4.5GHz
GeForce GTX 1660 Super (Desktop)
min:
32.7 fps, P0.1:
46.1 fps, P1:
67.5 fps, max:
183.4 fps
...
NVIDIA GeForce GTX 1660 Super (Desktop)
Intel Arc A580
...
...
NVIDIA GeForce GTX 1660 Super (Desktop)
Intel Arc A580
...
...
NVIDIA GeForce GTX 1660 Super (Desktop)
Intel Arc A580
...
...
NVIDIA GeForce GTX 1660 Super (Desktop)
Intel Arc A580
...
NVIDIA GeForce GTX 1660 Super (Desktop)
Intel Arc A580
...
NVIDIA GeForce GTX 1660 Super (Desktop)
Intel Arc A580
...
» With all tested laptops playable in detail settings ultra.
Additional Benchmarks
Low Preset Low TAA 1280x720
291 [X] KFA2 GeForce GTX 1660 Super AMD Ryzen 9 7950X 4.5GHz
GeForce GTX 1660 Super (Desktop)
min:
39.1 fps, P0.1:
103.3 fps, P1:
164.8 fps, max:
479 fps
...
Intel Arc A580
NVIDIA GeForce GTX 1660 Super (Desktop)
...
...
Intel Arc A580
NVIDIA GeForce GTX 1660 Super (Desktop)
...
0 100 200 300 400 500 600 700 800 900 1000 1100 1200 1300 1400 1500 1600 1700 1800 1900 2000 2100 2200 2300 2400 Tooltip
...
NVIDIA GeForce GTX 1660 Super (Desktop)
Intel Arc A580
...
...
Intel Arc A380
NVIDIA GeForce GTX 1660 Super (Desktop)
Intel Arc A580
...
NVIDIA GeForce GTX 1660 Super (Desktop)
Intel Arc A580
...
NVIDIA GeForce GTX 1660 Super (Desktop)
...
» With all tested laptops playable in detail settings high.
Additional Benchmarks
Low Preset 1280x720
101.3 [X] KFA2 GeForce GTX 1660 Super AMD Ryzen 9 7950X 4.5GHz
GeForce GTX 1660 Super (Desktop)
min:
59.9 fps, P0.1:
76.6 fps, P1:
85.2 fps, max:
146.7 fps
...
Intel Arc A380
NVIDIA GeForce GTX 1660 Super (Desktop)
...
...
Intel Arc A380
NVIDIA GeForce GTX 1660 Super (Desktop)
...
...
Intel Arc A380
NVIDIA GeForce GTX 1660 Super (Desktop)
...
...
Intel Arc A380
NVIDIA GeForce GTX 1660 Super (Desktop)
Intel Arc A580
...
NVIDIA GeForce GTX 1660 Super (Desktop)
Intel Arc A580
...
NVIDIA GeForce GTX 1660 Super (Desktop)
Intel Arc A580
...
» With all tested laptops playable in detail settings ultra.
Additional Benchmarks
Prioritize Performance Preset 1280x720
131.4 [X] KFA2 GeForce GTX 1660 Super AMD Ryzen 9 7950X 4.5GHz
GeForce GTX 1660 Super (Desktop)
min:
34.4 fps, P0.1:
77.6 fps, P1:
103.5 fps, max:
234 fps
...
Intel Arc A380
NVIDIA GeForce GTX 1660 Super (Desktop)
Intel Arc A580
...
...
Intel Arc A380
NVIDIA GeForce GTX 1660 Super (Desktop)
...
...
NVIDIA GeForce GTX 1660 Super (Desktop)
...
...
NVIDIA GeForce GTX 1660 Super (Desktop)
...
NVIDIA GeForce GTX 1660 Super (Desktop)
...
NVIDIA GeForce GTX 1660 Super (Desktop)
...
» With all tested laptops playable in detail settings ultra.
Additional Benchmarks
Minimum Settings 1280x720
207.2 [X] KFA2 GeForce GTX 1660 Super AMD Ryzen 9 7950X 4.5GHz
GeForce GTX 1660 Super (Desktop)
...
NVIDIA GeForce GTX 1660 Super (Desktop)
Intel Arc A580
...
...
NVIDIA GeForce GTX 1660 Super (Desktop)
Intel Arc A580
...
...
NVIDIA GeForce GTX 1660 Super (Desktop)
Intel Arc A580
...
...
NVIDIA GeForce GTX 1660 Super (Desktop)
Intel Arc A580
...
NVIDIA GeForce GTX 1660 Super (Desktop)
Intel Arc A580
...
NVIDIA GeForce GTX 1660 Super (Desktop)
Intel Arc A580
...
» With all tested laptops playable in detail settings ultra.
Additional Benchmarks
Ultra Low Preset 1280x720
105.2 [X] KFA2 GeForce GTX 1660 Super AMD Ryzen 9 7950X 4.5GHz
GeForce GTX 1660 Super (Desktop)
min:
19 fps, P0.1:
52.8 fps, P1:
71.9 fps, max:
217 fps
0 100 200 300 400 500 600 700 800 900 1000 1100 1200 1300 1400 1500 1600 1700 1800 1900 2000 2100 2200 2300 2400 2500 2600 2700 2800 2900 3000 3100 3200 3300 3400 3500 3600 3700 3800 3900 4000 4100 4200 4300 4400 4500 4600 4700 4800 Tooltip
...
NVIDIA GeForce GTX 1660 Super (Desktop)
Intel Arc A580
...
...
NVIDIA GeForce GTX 1660 Super (Desktop)
Intel Arc A580
...
...
NVIDIA GeForce GTX 1660 Super (Desktop)
...
...
NVIDIA GeForce GTX 1660 Super (Desktop)
Intel Arc A580
...
NVIDIA GeForce GTX 1660 Super (Desktop)
Intel Arc A580
...
NVIDIA GeForce GTX 1660 Super (Desktop)
Intel Arc A580
...
» With all tested laptops playable in detail settings ultra.
Additional Benchmarks
Low Preset 1280x720
195 [X] KFA2 GeForce GTX 1660 Super AMD Ryzen 9 7950X 4.5GHz
GeForce GTX 1660 Super (Desktop)
min:
101.2 fps, P0.1:
136.8 fps, P1:
166.1 fps, max:
358 fps
...
NVIDIA GeForce GTX 1660 Super (Desktop)
Intel Arc A580
...
...
NVIDIA GeForce GTX 1660 Super (Desktop)
Intel Arc A580
...
...
NVIDIA GeForce GTX 1660 Super (Desktop)
...
...
NVIDIA GeForce GTX 1660 Super (Desktop)
...
NVIDIA GeForce GTX 1660 Super (Desktop)
...
NVIDIA GeForce GTX 1660 Super (Desktop)
...
» With all tested laptops playable in detail settings ultra.
Additional Benchmarks
Low Preset 1280x720
88 [X] KFA2 GeForce GTX 1660 Super AMD Ryzen 9 7950X 4.5GHz
GeForce GTX 1660 Super (Desktop)
...
NVIDIA GeForce GTX 1660 Super (Desktop)
Intel Arc A580
...
...
NVIDIA GeForce GTX 1660 Super (Desktop)
Intel Arc A580
...
...
NVIDIA GeForce GTX 1660 Super (Desktop)
Intel Arc A580
...
...
NVIDIA GeForce GTX 1660 Super (Desktop)
...
...
Intel Arc A580
NVIDIA GeForce GTX 1660 Super (Desktop)
...
NVIDIA GeForce GTX 1660 Super (Desktop)
...
» With all tested laptops playable in detail settings high.
Additional Benchmarks
Low Preset Low TAA 1280x720
139.6 [X] KFA2 GeForce GTX 1660 Super AMD Ryzen 9 7950X 4.5GHz
GeForce GTX 1660 Super (Desktop)
min:
29.6 fps, P0.1:
64.8 fps, P1:
101.9 fps, max:
192.6 fps
...
NVIDIA GeForce GTX 1660 Super (Desktop)
Intel Arc A580
...
...
Intel Arc A380
NVIDIA GeForce GTX 1660 Super (Desktop)
Intel Arc A580
...
...
Intel Arc A380
NVIDIA GeForce GTX 1660 Super (Desktop)
Intel Arc A580
...
...
Intel Arc A380
NVIDIA GeForce GTX 1660 Super (Desktop)
Intel Arc A580
...
NVIDIA GeForce GTX 1660 Super (Desktop)
Intel Arc A580
...
0 100 200 300 400 500 600 700 800 900 1000 1100 1200 Tooltip
NVIDIA GeForce GTX 1660 Super (Desktop)
Intel Arc A580
...
» With all tested laptops playable in detail settings ultra.
Additional Benchmarks
Low Preset TAA 1280x720
91 [X] KFA2 GeForce GTX 1660 Super AMD Ryzen 9 7950X 4.5GHz
GeForce GTX 1660 Super (Desktop)
min:
43 fps, P0.1:
46.2 fps, P1:
60.9 fps, max:
377 fps
...
NVIDIA GeForce GTX 1660 Super (Desktop)
...
Intel UHD Graphics 32EUs (Alder Lake)
...
NVIDIA GeForce GTX 1660 Super (Desktop)
...
...
NVIDIA GeForce GTX 1660 Super (Desktop)
...
...
NVIDIA GeForce GTX 1660 Super (Desktop)
...
...
NVIDIA GeForce GTX 1660 Super (Desktop)
...
NVIDIA GeForce GTX 1660 Super (Desktop)
...
» With all tested laptops playable in detail settings ultra.
Additional Benchmarks
Low Preset / Off 1280x720
225 [X] KFA2 GeForce GTX 1660 Super AMD Ryzen 9 7950X 4.5GHz
GeForce GTX 1660 Super (Desktop)
min:
112.5 fps, P0.1:
136.4 fps, P1:
152.2 fps, max:
388 fps
0 100 200 Tooltip : Ø174.4 (115.081-224.433)
...
NVIDIA GeForce GTX 1660 Super (Desktop)
...
...
NVIDIA GeForce GTX 1660 Super (Desktop)
...
...
Intel Arc A380
NVIDIA GeForce GTX 1660 Super (Desktop)
...
...
NVIDIA GeForce GTX 1660 Super (Desktop)
...
NVIDIA GeForce GTX 1660 Super (Desktop)
...
NVIDIA GeForce GTX 1660 Super (Desktop)
...
» With all tested laptops playable in detail settings ultra.
Additional Benchmarks
Low Preset 1280x720
268 [X] KFA2 GeForce GTX 1660 Super AMD Ryzen 9 7950X 4.5GHz
GeForce GTX 1660 Super (Desktop)
min:
91.7 fps, P0.1:
139.2 fps, P1:
162.5 fps, max:
457 fps
...
NVIDIA GeForce GTX 1660 Super (Desktop)
...
...
NVIDIA GeForce GTX 1660 Super (Desktop)
...
...
Intel Arc A380
NVIDIA GeForce GTX 1660 Super (Desktop)
...
...
Intel Arc A380
NVIDIA GeForce GTX 1660 Super (Desktop)
...
NVIDIA GeForce GTX 1660 Super (Desktop)
...
NVIDIA GeForce GTX 1660 Super (Desktop)
...
» With all tested laptops playable in detail settings ultra.
Additional Benchmarks
Low Preset (without FSR Upscaling) 1280x720
160.7 [X] KFA2 GeForce GTX 1660 Super AMD Ryzen 9 7950X 4.5GHz
GeForce GTX 1660 Super (Desktop)
Ultra Preset (without FSR Upscaling) + Full Ray-Tracing 1920x1080
7.8 [X] KFA2 GeForce GTX 1660 Super AMD Ryzen 9 7950X 4.5GHz
GeForce GTX 1660 Super (Desktop)
...
Intel Arc A580
NVIDIA GeForce GTX 1660 Super (Desktop)
...
...
Intel Arc A580
NVIDIA GeForce GTX 1660 Super (Desktop)
...
...
NVIDIA GeForce GTX 1660 Super (Desktop)
Intel Arc A580
...
...
NVIDIA GeForce GTX 1660 Super (Desktop)
Intel Arc A580
...
NVIDIA GeForce GTX 1660 Super (Desktop)
...
NVIDIA GeForce GTX 1660 Super (Desktop)
Intel Arc A580
...
» With all tested laptops playable in detail settings ultra.
Additional Benchmarks
Low Preset 1280x720
159.4 [X] KFA2 GeForce GTX 1660 Super AMD Ryzen 9 7950X 4.5GHz
GeForce GTX 1660 Super (Desktop)
min:
40.7 fps, P0.1:
78.5 fps, P1:
111.5 fps, max:
229 fps
...
NVIDIA GeForce GTX 1660 Super (Desktop)
...
...
Intel Arc A380
NVIDIA GeForce GTX 1660 Super (Desktop)
...
...
NVIDIA GeForce GTX 1660 Super (Desktop)
...
0 100 200 300 400 500 600 700 800 900 Tooltip
...
NVIDIA GeForce GTX 1660 Super (Desktop)
...
NVIDIA GeForce GTX 1660 Super (Desktop)
...
NVIDIA GeForce GTX 1660 Super (Desktop)
...
» With all tested laptops playable in detail settings ultra.
Additional Benchmarks
Very Low Preset 1280x720
134.3 [X] KFA2 GeForce GTX 1660 Super AMD Ryzen 9 7950X 4.5GHz
GeForce GTX 1660 Super (Desktop)
min:
65.4 fps, P0.1:
85.6 fps, P1:
95.4 fps, max:
256 fps
...
NVIDIA GeForce GTX 1660 Super (Desktop)
...
...
NVIDIA GeForce GTX 1660 Super (Desktop)
...
...
NVIDIA GeForce GTX 1660 Super (Desktop)
...
...
NVIDIA GeForce GTX 1660 Super (Desktop)
...
NVIDIA GeForce GTX 1660 Super (Desktop)
...
NVIDIA GeForce GTX 1660 Super (Desktop)
...
» With all tested laptops playable in detail settings ultra.
Additional Benchmarks
Basic Quality Preset T2X SMAA 1280x720
136 [X] KFA2 GeForce GTX 1660 Super AMD Ryzen 9 7950X 4.5GHz
GeForce GTX 1660 Super (Desktop)
...
NVIDIA GeForce GTX 1660 Super (Desktop)
...
...
Intel Arc A580
NVIDIA GeForce GTX 1660 Super (Desktop)
...
...
Intel Arc A580
NVIDIA GeForce GTX 1660 Super (Desktop)
...
...
Intel Arc A580
NVIDIA GeForce GTX 1660 Super (Desktop)
...
NVIDIA GeForce GTX 1660 Super (Desktop)
Intel Arc A580
...
NVIDIA GeForce GTX 1660 Super (Desktop)
Intel Arc A580
...
» With all tested laptops playable in detail settings ultra.
Additional Benchmarks
Low Preset 1280x720
86.2 [X] KFA2 GeForce GTX 1660 Super AMD Ryzen 9 7950X 4.5GHz
GeForce GTX 1660 Super (Desktop)
min:
33.6 fps, P0.1:
46.9 fps, P1:
75 fps, max:
176.8 fps
...
NVIDIA GeForce GTX 1660 Super (Desktop)
Intel Arc A580
...
...
NVIDIA GeForce GTX 1660 Super (Desktop)
Intel Arc A580
...
...
NVIDIA GeForce GTX 1660 Super (Desktop)
...
...
NVIDIA GeForce GTX 1660 Super (Desktop)
...
NVIDIA GeForce GTX 1660 Super (Desktop)
...
NVIDIA GeForce GTX 1660 Super (Desktop)
...
» With all tested laptops playable in detail settings high.
Additional Benchmarks
Low Preset 1280x720
101.8 [X] KFA2 GeForce GTX 1660 Super AMD Ryzen 9 7950X 4.5GHz
GeForce GTX 1660 Super (Desktop)
min:
58.9 fps, P0.1:
65.9 fps, P1:
81.2 fps, max:
175.5 fps
0 100 200 300 400 500 600 700 800 900 1000 1100 1200 1300 1400 1500 1600 1700 1800 1900 2000 2100 Tooltip
...
NVIDIA GeForce GTX 1660 Super (Desktop)
...
...
NVIDIA GeForce GTX 1660 Super (Desktop)
...
...
NVIDIA GeForce GTX 1660 Super (Desktop)
...
0 100 Tooltip : Ø120.8 (114.224-134.39)
...
NVIDIA GeForce GTX 1660 Super (Desktop)
...
...
NVIDIA GeForce GTX 1660 Super (Desktop)
...
NVIDIA GeForce GTX 1660 Super (Desktop)
...
» With all tested laptops playable in detail settings ultra.
Additional Benchmarks
Low Rendering Quality 1280x720
306 [X] KFA2 GeForce GTX 1660 Super AMD Ryzen 9 7950X 4.5GHz
GeForce GTX 1660 Super (Desktop)
min:
119.7 fps, P0.1:
205 fps, P1:
227 fps, max:
418 fps
95.7 [X] KFA2 GeForce GTX 1660 Super AMD Ryzen 9 7900X 4.7GHz
GeForce GTX 1660 Super (Desktop)
min:
34.7 fps, P0.1:
69.2 fps, P1:
84.5 fps, max:
265 fps
98 [X] KFA2 GeForce GTX 1660 Super AMD Ryzen 9 7950X 4.5GHz
GeForce GTX 1660 Super (Desktop)
min:
33.8 fps, P0.1:
60 fps, P1:
84.6 fps, max:
254 fps
~ 97 fps
+ Compare
- Hide Comparison
+ 📈 Graph
- 📈 Hide Graph
0 100 Tooltip : Ø99 (87.104-135.8)
: Ø102 (87.033-139)
...
NVIDIA GeForce GTX 1660 Super (Desktop)
Intel Arc A580
...
71 [X] KFA2 GeForce GTX 1660 Super AMD Ryzen 9 7900X 4.7GHz
GeForce GTX 1660 Super (Desktop)
min:
25.8 fps, P0.1:
37.9 fps, P1:
59.7 fps, max:
186.6 fps
74 [X] KFA2 GeForce GTX 1660 Super AMD Ryzen 9 7950X 4.5GHz
GeForce GTX 1660 Super (Desktop)
min:
30.8 fps, P0.1:
48 fps, P1:
60.3 fps, max:
196.5 fps
~ 73 fps
+ Compare
- Hide Comparison
+ 📈 Graph
- 📈 Hide Graph
0 100 Tooltip : Ø76.5 (60.418-178.2)
: Ø77 (62.92-117.6)
...
NVIDIA GeForce GTX 1660 Super (Desktop)
Intel Arc A580
...
59.2 [X] KFA2 GeForce GTX 1660 Super AMD Ryzen 9 7900X 4.7GHz
GeForce GTX 1660 Super (Desktop)
min:
27 fps, P0.1:
36 fps, P1:
48.4 fps, max:
234 fps
60.2 [X] KFA2 GeForce GTX 1660 Super AMD Ryzen 9 7950X 4.5GHz
GeForce GTX 1660 Super (Desktop)
min:
23.5 fps, P0.1:
27.7 fps, P1:
49.2 fps, max:
259 fps
~ 60 fps
+ Compare
- Hide Comparison
+ 📈 Graph
- 📈 Hide Graph
0 100 200 300 400 500 Tooltip : Ø60.8 (52.248-72.9)
: Ø74.5 (50.979-561)
...
NVIDIA GeForce GTX 1660 Super (Desktop)
Intel Arc A580
...
44.7 [X] KFA2 GeForce GTX 1660 Super AMD Ryzen 9 7900X 4.7GHz
GeForce GTX 1660 Super (Desktop)
min:
22 fps, P0.1:
22.7 fps, P1:
36 fps, max:
70.5 fps
45.6 [X] KFA2 GeForce GTX 1660 Super AMD Ryzen 9 7950X 4.5GHz
GeForce GTX 1660 Super (Desktop)
min:
11.5 fps, P0.1:
20.7 fps, P1:
38.4 fps, max:
173.7 fps
~ 45 fps
+ Compare
- Hide Comparison
+ 📈 Graph
- 📈 Hide Graph
0 100 Tooltip : Ø51.1 (41.048-193.9)
: Ø50 (41.739-130.5)
...
NVIDIA GeForce GTX 1660 Super (Desktop)
Intel Arc A580
...
26 [X] KFA2 GeForce GTX 1660 Super AMD Ryzen 9 7900X 4.7GHz
GeForce GTX 1660 Super (Desktop)
min:
9.81 fps, P0.1:
11.4 fps, P1:
18.2 fps, max:
48.2 fps
26.5 [X] KFA2 GeForce GTX 1660 Super AMD Ryzen 9 7950X 4.5GHz
GeForce GTX 1660 Super (Desktop)
min:
9.63 fps, P0.1:
11.3 fps, P1:
18.5 fps, max:
47.9 fps
~ 26 fps
+ Compare
- Hide Comparison
+ 📈 Graph
- 📈 Hide Graph
0 100 Tooltip : Ø31.5 (24.014-129.5)
: Ø32.3 (24.036-91.9)
NVIDIA GeForce GTX 1660 Super (Desktop)
Intel Arc A580
...
8.1 [X] KFA2 GeForce GTX 1660 Super AMD Ryzen 9 7950X 4.5GHz
GeForce GTX 1660 Super (Desktop)
min:
3.75 fps, P0.1:
4.13 fps, P1:
4.79 fps, max:
14.8 fps
8.3 [X] KFA2 GeForce GTX 1660 Super AMD Ryzen 9 7900X 4.7GHz
GeForce GTX 1660 Super (Desktop)
min:
3.41 fps, P0.1:
3.83 fps, P1:
5.06 fps, max:
17.4 fps
~ 8 fps
+ Compare
- Hide Comparison
+ 📈 Graph
- 📈 Hide Graph
0 Tooltip : Ø12.3 (5.314-75.8)
: Ø12.9 (6.032-72.8)
NVIDIA GeForce GTX 1660 Super (Desktop)
...
» With all tested laptops playable in detail settings ultra.
Additional Benchmarks
Low Preset 1280x720
145.6 [X] KFA2 GeForce GTX 1660 Super AMD Ryzen 9 7950X 4.5GHz
GeForce GTX 1660 Super (Desktop)
min:
22.9 fps, P0.1:
62.4 fps, P1:
120.7 fps, max:
327 fps
191.2 [X] KFA2 GeForce GTX 1660 Super 918016
AMD Ryzen 9 7900X 4.7GHz
GeForce GTX 1660 Super (Desktop)
min:
164 fps, P1:
146 fps, max:
217 fps
205 [X] KFA2 GeForce GTX 1660 Super 928484
AMD Ryzen 9 7950X 4.5GHz
GeForce GTX 1660 Super (Desktop)
min:
177 fps, P1:
154 fps, max:
244 fps
~ 198 fps
+ Compare
- Hide Comparison
...
NVIDIA GeForce GTX 1660 Super (Desktop)
...
170 [X] KFA2 GeForce GTX 1660 Super 918016
AMD Ryzen 9 7900X 4.7GHz
GeForce GTX 1660 Super (Desktop)
min:
149 fps, P1:
133 fps, max:
193 fps
184 [X] KFA2 GeForce GTX 1660 Super 928484
AMD Ryzen 9 7950X 4.5GHz
GeForce GTX 1660 Super (Desktop)
min:
161 fps, P1:
141 fps, max:
217 fps
~ 177 fps
+ Compare
- Hide Comparison
...
NVIDIA GeForce GTX 1660 Super (Desktop)
...
120.2 [X] KFA2 GeForce GTX 1660 Super 918016
AMD Ryzen 9 7900X 4.7GHz
GeForce GTX 1660 Super (Desktop)
min:
105 fps, P1:
98 fps, max:
134 fps
131.7 [X] KFA2 GeForce GTX 1660 Super 928484
AMD Ryzen 9 7950X 4.5GHz
GeForce GTX 1660 Super (Desktop)
min:
110 fps, P1:
105 fps, max:
155 fps
~ 126 fps
+ Compare
- Hide Comparison
...
NVIDIA GeForce GTX 1660 Super (Desktop)
...
85.9 [X] KFA2 GeForce GTX 1660 Super 918016
AMD Ryzen 9 7900X 4.7GHz
GeForce GTX 1660 Super (Desktop)
min:
74 fps, P1:
73 fps, max:
100 fps
96.9 [X] KFA2 GeForce GTX 1660 Super 928484
AMD Ryzen 9 7950X 4.5GHz
GeForce GTX 1660 Super (Desktop)
min:
83 fps, P1:
80 fps, max:
114 fps
~ 91 fps
+ Compare
- Hide Comparison
...
NVIDIA GeForce GTX 1660 Super (Desktop)
...
62.7 [X] KFA2 GeForce GTX 1660 Super 918016
AMD Ryzen 9 7900X 4.7GHz
GeForce GTX 1660 Super (Desktop)
min:
54 fps, P1:
53 fps, max:
72 fps
70 [X] KFA2 GeForce GTX 1660 Super 928484
AMD Ryzen 9 7950X 4.5GHz
GeForce GTX 1660 Super (Desktop)
min:
61 fps, P1:
60 fps, max:
82 fps
~ 66 fps
+ Compare
- Hide Comparison
...
NVIDIA GeForce GTX 1660 Super (Desktop)
...
34.1 [X] KFA2 GeForce GTX 1660 Super 918016
AMD Ryzen 9 7900X 4.7GHz
GeForce GTX 1660 Super (Desktop)
min:
29 fps, P1:
29 fps, max:
38 fps
37.8 [X] KFA2 GeForce GTX 1660 Super 928484
AMD Ryzen 9 7950X 4.5GHz
GeForce GTX 1660 Super (Desktop)
min:
32 fps, P1:
32 fps, max:
44 fps
~ 36 fps
+ Compare
- Hide Comparison
...
NVIDIA GeForce GTX 1660 Super (Desktop)
...
» With all tested laptops playable in detail settings ultra.
Additional Benchmarks
Ultra Low Preset 16xAF TAA 1280x720
334 [X] KFA2 GeForce GTX 1660 Super AMD Ryzen 9 7900X 4.7GHz
GeForce GTX 1660 Super (Desktop)
min:
286 fps, P1:
229 fps, max:
398 fps
348 [X] KFA2 GeForce GTX 1660 Super AMD Ryzen 9 7950X 4.5GHz
GeForce GTX 1660 Super (Desktop)
min:
289 fps, P1:
244 fps, max:
404 fps
...
NVIDIA GeForce GTX 1660 Super (Desktop)
...
...
NVIDIA GeForce GTX 1660 Super (Desktop)
...
0 100 200 300 400 500 600 700 800 900 1000 Tooltip
...
NVIDIA GeForce GTX 1660 Super (Desktop)
...
...
NVIDIA GeForce GTX 1660 Super (Desktop)
...
0 100 200 300 400 500 600 700 800 900 1000 1100 1200 1300 1400 1500 1600 1700 1800 1900 2000 2100 2200 2300 2400 2500 2600 2700 2800 2900 3000 3100 3200 3300 3400 3500 3600 3700 3800 3900 4000 4100 4200 4300 4400 4500 4600 4700 4800 4900 5000 5100 5200 5300 5400 5500 5600 5700 5800 5900 6000 6100 6200 6300 6400 6500 6600 6700 6800 6900 7000 7100 7200 7300 7400 7500 7600 7700 7800 7900 8000 8100 8200 Tooltip
NVIDIA GeForce GTX 1660 Super (Desktop)
...
NVIDIA GeForce GTX 1660 Super (Desktop)
...
» With all tested laptops playable in detail settings ultra.
Additional Benchmarks
Low Preset 1280x720
377 [X] KFA 2 GeForce GTX 1660 Super AMD Ryzen 9 5900X 3.7GHz
GeForce GTX 1660 Super (Desktop)
min:
117 fps, P0.1:
244 fps, P1:
276 fps, max:
582 fps
...
NVIDIA GeForce GTX 1660 Super (Desktop)
Intel Arc A580
...
...
NVIDIA GeForce GTX 1660 Super (Desktop)
Intel Arc A580
...
...
NVIDIA GeForce GTX 1660 Super (Desktop)
Intel Arc A580
...
...
NVIDIA GeForce GTX 1660 Super (Desktop)
Intel Arc A580
...
...
NVIDIA GeForce GTX 1660 Super (Desktop)
Intel Arc A580
...
NVIDIA GeForce GTX 1660 Super (Desktop)
Intel Arc A580
...
» With all tested laptops playable in detail settings ultra.
Additional Benchmarks
Lowest Settings 1280x720
164.8 [X] KFA 2 GeForce GTX 1660 Super AMD Ryzen 9 5900X 3.7GHz
GeForce GTX 1660 Super (Desktop)
min:
47.8 fps, P0.1:
79.8 fps, P1:
114.7 fps, max:
277 fps
Highest Settings + Maximum Ray Tracing 1920x1080
15 [X] KFA 2 GeForce GTX 1660 Super AMD Ryzen 9 5900X 3.7GHz
GeForce GTX 1660 Super (Desktop)
min:
6.25 fps, P0.1:
6.28 fps, P1:
6.56 fps, max:
143.8 fps
115.6 [X] KFA 2 GeForce GTX 1660 Super AMD Ryzen 9 5900X 3.7GHz
GeForce GTX 1660 Super (Desktop)
125.5 [X] KFA2 GeForce GTX 1660 Super AMD Ryzen 9 7900X 4.7GHz
GeForce GTX 1660 Super (Desktop)
128.9 [X] KFA2 GeForce GTX 1660 Super AMD Ryzen 9 7950X 4.5GHz
GeForce GTX 1660 Super (Desktop)
~ 123 fps
+ Compare
- Hide Comparison
...
NVIDIA GeForce GTX 1660 Super (Desktop)
...
95 [X] KFA 2 GeForce GTX 1660 Super AMD Ryzen 9 5900X 3.7GHz
GeForce GTX 1660 Super (Desktop)
100.1 [X] KFA2 GeForce GTX 1660 Super AMD Ryzen 9 7900X 4.7GHz
GeForce GTX 1660 Super (Desktop)
102.3 [X] KFA2 GeForce GTX 1660 Super AMD Ryzen 9 7950X 4.5GHz
GeForce GTX 1660 Super (Desktop)
~ 99 fps
+ Compare
- Hide Comparison
...
NVIDIA GeForce GTX 1660 Super (Desktop)
...
66.1 [X] KFA 2 GeForce GTX 1660 Super AMD Ryzen 9 5900X 3.7GHz
GeForce GTX 1660 Super (Desktop)
66.4 [X] KFA2 GeForce GTX 1660 Super AMD Ryzen 9 7900X 4.7GHz
GeForce GTX 1660 Super (Desktop)
68.3 [X] KFA2 GeForce GTX 1660 Super AMD Ryzen 9 7950X 4.5GHz
GeForce GTX 1660 Super (Desktop)
~ 67 fps
+ Compare
- Hide Comparison
...
NVIDIA GeForce GTX 1660 Super (Desktop)
...
51.4 [X] KFA2 GeForce GTX 1660 Super AMD Ryzen 9 7900X 4.7GHz
GeForce GTX 1660 Super (Desktop)
51.5 [X] KFA 2 GeForce GTX 1660 Super AMD Ryzen 9 5900X 3.7GHz
GeForce GTX 1660 Super (Desktop)
52.7 [X] KFA2 GeForce GTX 1660 Super AMD Ryzen 9 7950X 4.5GHz
GeForce GTX 1660 Super (Desktop)
~ 52 fps
+ Compare
- Hide Comparison
...
NVIDIA GeForce GTX 1660 Super (Desktop)
...
34.9 [X] KFA2 GeForce GTX 1660 Super AMD Ryzen 9 7900X 4.7GHz
GeForce GTX 1660 Super (Desktop)
35.7 [X] KFA2 GeForce GTX 1660 Super AMD Ryzen 9 7950X 4.5GHz
GeForce GTX 1660 Super (Desktop)
35.8 [X] KFA 2 GeForce GTX 1660 Super AMD Ryzen 9 5900X 3.7GHz
GeForce GTX 1660 Super (Desktop)
~ 35 fps
+ Compare
- Hide Comparison
NVIDIA GeForce GTX 1660 Super (Desktop)
...
12.9 [X] KFA2 GeForce GTX 1660 Super AMD Ryzen 9 7900X 4.7GHz
GeForce GTX 1660 Super (Desktop)
13.2 [X] KFA 2 GeForce GTX 1660 Super AMD Ryzen 9 5900X 3.7GHz
GeForce GTX 1660 Super (Desktop)
13.2 [X] KFA2 GeForce GTX 1660 Super AMD Ryzen 9 7950X 4.5GHz
GeForce GTX 1660 Super (Desktop)
~ 13 fps
+ Compare
- Hide Comparison
NVIDIA GeForce GTX 1660 Super (Desktop)
...
» With all tested laptops playable in detail settings ultra.
Additional Benchmarks
Lowest Preset (DX12) 1280x720
210 [X] KFA 2 GeForce GTX 1660 Super AMD Ryzen 9 5900X 3.7GHz
GeForce GTX 1660 Super (Desktop)
249 [X] KFA2 GeForce GTX 1660 Super AMD Ryzen 9 7950X 4.5GHz
GeForce GTX 1660 Super (Desktop)
74.4 [X] KFA2 GeForce GTX 1660 Super 1.6
AMD Ryzen 9 7950X 4.5GHz
GeForce GTX 1660 Super (Desktop)
min:
56.3 fps, max:
104.1 fps
76.6 [X] KFA 2 GeForce GTX 1660 Super AMD Ryzen 9 5900X 3.7GHz
GeForce GTX 1660 Super (Desktop)
~ 76 fps
+ Compare
- Hide Comparison
...
Intel Arc A580
NVIDIA GeForce GTX 1660 Super (Desktop)
...
58.4 [X] KFA2 GeForce GTX 1660 Super 1.6
AMD Ryzen 9 7950X 4.5GHz
GeForce GTX 1660 Super (Desktop)
min:
45.8 fps, max:
74 fps
67.3 [X] KFA 2 GeForce GTX 1660 Super AMD Ryzen 9 5900X 3.7GHz
GeForce GTX 1660 Super (Desktop)
~ 63 fps
+ Compare
- Hide Comparison
...
NVIDIA GeForce GTX 1660 Super (Desktop)
Intel Arc A580
...
50.2 [X] KFA2 GeForce GTX 1660 Super 1.6
AMD Ryzen 9 7950X 4.5GHz
GeForce GTX 1660 Super (Desktop)
min:
37.4 fps, max:
64.4 fps
53.1 [X] KFA 2 GeForce GTX 1660 Super AMD Ryzen 9 5900X 3.7GHz
GeForce GTX 1660 Super (Desktop)
~ 52 fps
+ Compare
- Hide Comparison
...
NVIDIA GeForce GTX 1660 Super (Desktop)
Intel Arc A580
...
44.5 [X] KFA2 GeForce GTX 1660 Super 1.6
AMD Ryzen 9 7950X 4.5GHz
GeForce GTX 1660 Super (Desktop)
min:
29.4 fps, max:
61.6 fps
53 [X] KFA 2 GeForce GTX 1660 Super AMD Ryzen 9 5900X 3.7GHz
GeForce GTX 1660 Super (Desktop)
~ 49 fps
+ Compare
- Hide Comparison
...
NVIDIA GeForce GTX 1660 Super (Desktop)
Intel Arc A580
...
25.8 [X] KFA 2 GeForce GTX 1660 Super AMD Ryzen 9 5900X 3.7GHz
GeForce GTX 1660 Super (Desktop)
26.9 [X] KFA2 GeForce GTX 1660 Super 1.6
AMD Ryzen 9 7950X 4.5GHz
GeForce GTX 1660 Super (Desktop)
min:
17.7 fps, max:
36.2 fps
~ 26 fps
+ Compare
- Hide Comparison
...
NVIDIA GeForce GTX 1660 Super (Desktop)
...
11 [X] KFA 2 GeForce GTX 1660 Super AMD Ryzen 9 5900X 3.7GHz
GeForce GTX 1660 Super (Desktop)
11.1 [X] KFA2 GeForce GTX 1660 Super 1.6
AMD Ryzen 9 7950X 4.5GHz
GeForce GTX 1660 Super (Desktop)
min:
7.83 fps, max:
15.4 fps
~ 11 fps
+ Compare
- Hide Comparison
...
NVIDIA GeForce GTX 1660 Super (Desktop)
...
» With all tested laptops playable in detail settings ultra.
Additional Benchmarks
Low Preset 1280x720
80.6 [X] KFA 2 GeForce GTX 1660 Super AMD Ryzen 9 5900X 3.7GHz
GeForce GTX 1660 Super (Desktop)
117.5 [X] KFA2 GeForce GTX 1660 Super AMD Ryzen 9 7950X 4.5GHz
GeForce GTX 1660 Super (Desktop)
min:
59.9 fps, max:
196.3 fps
...
NVIDIA GeForce GTX 1660 Super (Desktop)
...
...
NVIDIA GeForce GTX 1660 Super (Desktop)
...
...
NVIDIA GeForce GTX 1660 Super (Desktop)
...
...
NVIDIA GeForce GTX 1660 Super (Desktop)
...
NVIDIA GeForce GTX 1660 Super (Desktop)
...
NVIDIA GeForce GTX 1660 Super (Desktop)
...
» With all tested laptops playable in detail settings ultra.
Additional Benchmarks
Low / Off 1280x720
93.9 [X] KFA 2 GeForce GTX 1660 Super AMD Ryzen 9 5900X 3.7GHz
GeForce GTX 1660 Super (Desktop)
min:
47.5 fps, P0.1:
52.9 fps, P1:
66.7 fps, max:
160 fps
186 [X] KFA 2 GeForce GTX 1660 Super AMD Ryzen 9 5900X 3.7GHz
GeForce GTX 1660 Super (Desktop)
196.8 [X] KFA2 GeForce GTX 1660 Super AMD Ryzen 9 7900X 4.7GHz
GeForce GTX 1660 Super (Desktop)
230 [X] KFA2 GeForce GTX 1660 Super 623651
AMD Ryzen 9 7950X 4.5GHz
GeForce GTX 1660 Super (Desktop)
min:
76 fps, max:
380 fps
~ 204 fps
+ Compare
- Hide Comparison
...
NVIDIA GeForce GTX 1660 Super (Desktop)
...
130 [X] KFA 2 GeForce GTX 1660 Super AMD Ryzen 9 5900X 3.7GHz
GeForce GTX 1660 Super (Desktop)
145 [X] KFA2 GeForce GTX 1660 Super AMD Ryzen 9 7900X 4.7GHz
GeForce GTX 1660 Super (Desktop)
169.8 [X] KFA2 GeForce GTX 1660 Super 623651
AMD Ryzen 9 7950X 4.5GHz
GeForce GTX 1660 Super (Desktop)
min:
76.9 fps, max:
311 fps
~ 148 fps
+ Compare
- Hide Comparison
...
Intel Arc A580
NVIDIA GeForce GTX 1660 Super (Desktop)
...
89 [X] KFA 2 GeForce GTX 1660 Super AMD Ryzen 9 5900X 3.7GHz
GeForce GTX 1660 Super (Desktop)
113.5 [X] KFA2 GeForce GTX 1660 Super AMD Ryzen 9 7900X 4.7GHz
GeForce GTX 1660 Super (Desktop)
132.5 [X] KFA2 GeForce GTX 1660 Super 623651
AMD Ryzen 9 7950X 4.5GHz
GeForce GTX 1660 Super (Desktop)
min:
62.6 fps, max:
266 fps
~ 112 fps
+ Compare
- Hide Comparison
...
Intel Arc A580
NVIDIA GeForce GTX 1660 Super (Desktop)
...
60 [X] KFA 2 GeForce GTX 1660 Super AMD Ryzen 9 5900X 3.7GHz
GeForce GTX 1660 Super (Desktop)
84.3 [X] KFA2 GeForce GTX 1660 Super AMD Ryzen 9 7900X 4.7GHz
GeForce GTX 1660 Super (Desktop)
94.6 [X] KFA2 GeForce GTX 1660 Super 623651
AMD Ryzen 9 7950X 4.5GHz
GeForce GTX 1660 Super (Desktop)
min:
65 fps, max:
165.7 fps
~ 80 fps
+ Compare
- Hide Comparison
...
NVIDIA GeForce GTX 1660 Super (Desktop)
Intel Arc A580
...
49 [X] KFA 2 GeForce GTX 1660 Super AMD Ryzen 9 5900X 3.7GHz
GeForce GTX 1660 Super (Desktop)
65.1 [X] KFA2 GeForce GTX 1660 Super AMD Ryzen 9 7900X 4.7GHz
GeForce GTX 1660 Super (Desktop)
70.9 [X] KFA2 GeForce GTX 1660 Super 623651
AMD Ryzen 9 7950X 4.5GHz
GeForce GTX 1660 Super (Desktop)
min:
54.4 fps, max:
105.9 fps
~ 62 fps
+ Compare
- Hide Comparison
...
NVIDIA GeForce GTX 1660 Super (Desktop)
Intel Arc A580
...
37 [X] KFA 2 GeForce GTX 1660 Super AMD Ryzen 9 5900X 3.7GHz
GeForce GTX 1660 Super (Desktop)
38.7 [X] KFA2 GeForce GTX 1660 Super AMD Ryzen 9 7900X 4.7GHz
GeForce GTX 1660 Super (Desktop)
39.5 [X] KFA2 GeForce GTX 1660 Super 623651
AMD Ryzen 9 7950X 4.5GHz
GeForce GTX 1660 Super (Desktop)
min:
16 fps, max:
56.2 fps
~ 38 fps
+ Compare
- Hide Comparison
...
NVIDIA GeForce GTX 1660 Super (Desktop)
...
» With all tested laptops playable in detail settings ultra.
Additional Benchmarks
Low Preset 1280x720
234 [X] KFA 2 GeForce GTX 1660 Super AMD Ryzen 9 5900X 3.7GHz
GeForce GTX 1660 Super (Desktop)
311 [X] KFA2 GeForce GTX 1660 Super AMD Ryzen 9 7950X 4.5GHz
GeForce GTX 1660 Super (Desktop)
min:
71.5 fps, max:
412 fps
...
NVIDIA GeForce GTX 1660 Super (Desktop)
...
...
NVIDIA GeForce GTX 1660 Super (Desktop)
...
...
NVIDIA GeForce GTX 1660 Super (Desktop)
...
...
NVIDIA GeForce GTX 1660 Super (Desktop)
...
...
NVIDIA GeForce GTX 1660 Super (Desktop)
...
NVIDIA GeForce GTX 1660 Super (Desktop)
...
» With all tested laptops playable in detail settings ultra.
...
NVIDIA GeForce GTX 1660 Super (Desktop)
...
...
NVIDIA GeForce GTX 1660 Super (Desktop)
...
...
NVIDIA GeForce GTX 1660 Super (Desktop)
...
NVIDIA GeForce GTX 1660 Super (Desktop)
...
NVIDIA GeForce GTX 1660 Super (Desktop)
...
» With all tested laptops playable in detail settings high.
Additional Benchmarks
Low Quality 1280x720
117 [X] KFA 2 GeForce GTX 1660 Super AMD Ryzen 9 5900X 3.7GHz
GeForce GTX 1660 Super (Desktop)
min:
46.5 fps, P0.1:
82.9 fps, P1:
101 fps, max:
139 fps
...
NVIDIA GeForce GTX 1660 Super (Desktop)
...
...
NVIDIA GeForce GTX 1660 Super (Desktop)
...
...
NVIDIA GeForce GTX 1660 Super (Desktop)
...
...
NVIDIA GeForce GTX 1660 Super (Desktop)
...
...
NVIDIA GeForce GTX 1660 Super (Desktop)
...
...
NVIDIA GeForce GTX 1660 Super (Desktop)
...
» With all tested laptops playable in detail settings ultra.
Additional Benchmarks
Ultra Low Preset (with Fixed Resolution Quality) 1280x720
248 [X] KFA 2 GeForce GTX 1660 Super AMD Ryzen 9 5900X 3.7GHz
GeForce GTX 1660 Super (Desktop)
82.1 [X] KFA 2 GeForce GTX 1660 Super AMD Ryzen 9 5900X 3.7GHz
GeForce GTX 1660 Super (Desktop)
min:
56 fps, P0.1:
62.9 fps, P1:
72.9 fps, max:
141 fps
92.9 [X] KFA2 GeForce GTX 1660 Super AMD Ryzen 9 7900X 4.7GHz
GeForce GTX 1660 Super (Desktop)
min:
38 fps, P0.1:
77 fps, P1:
82.9 fps, max:
136.3 fps
95.5 [X] KFA2 GeForce GTX 1660 Super AMD Ryzen 9 7950X 4.5GHz
GeForce GTX 1660 Super (Desktop)
min:
59.5 fps, P0.1:
75.9 fps, P1:
84.8 fps, max:
215 fps
~ 90 fps
+ Compare
- Hide Comparison
+ 📈 Graph
- 📈 Hide Graph
0 100 Tooltip : Ø86.7 (77.375-159.9)
: Ø94.5 (87.191-109.07)
: Ø97.3 (89.585-116.9)
...
Intel Arc A580
NVIDIA GeForce GTX 1660 Super (Desktop)
...
66.9 [X] KFA 2 GeForce GTX 1660 Super AMD Ryzen 9 5900X 3.7GHz
GeForce GTX 1660 Super (Desktop)
min:
47.7 fps, P0.1:
55.7 fps, P1:
61.5 fps, max:
95.7 fps
75 [X] KFA2 GeForce GTX 1660 Super AMD Ryzen 9 7950X 4.5GHz
GeForce GTX 1660 Super (Desktop)
min:
51.2 fps, P0.1:
57.8 fps, P1:
68.1 fps, max:
154.5 fps
78.9 [X] KFA2 GeForce GTX 1660 Super AMD Ryzen 9 7900X 4.7GHz
GeForce GTX 1660 Super (Desktop)
min:
48 fps, P0.1:
62.3 fps, P1:
69.7 fps, max:
194.3 fps
~ 74 fps
+ Compare
- Hide Comparison
+ 📈 Graph
- 📈 Hide Graph
0 100 Tooltip : Ø73.1 (63.133-108.9)
: Ø78 (70.063-109.4)
: Ø85.8 (72.381-137.7)
...
Intel Arc A580
NVIDIA GeForce GTX 1660 Super (Desktop)
...
53.4 [X] KFA 2 GeForce GTX 1660 Super AMD Ryzen 9 5900X 3.7GHz
GeForce GTX 1660 Super (Desktop)
min:
39.2 fps, P0.1:
41.2 fps, P1:
48.8 fps, max:
84.5 fps
57.5 [X] KFA2 GeForce GTX 1660 Super AMD Ryzen 9 7900X 4.7GHz
GeForce GTX 1660 Super (Desktop)
min:
47.2 fps, P0.1:
48.5 fps, P1:
52 fps, max:
69.1 fps
62 [X] KFA2 GeForce GTX 1660 Super AMD Ryzen 9 7950X 4.5GHz
GeForce GTX 1660 Super (Desktop)
min:
40.1 fps, P0.1:
49.4 fps, P1:
54.9 fps, max:
132.9 fps
~ 58 fps
+ Compare
- Hide Comparison
+ 📈 Graph
- 📈 Hide Graph
0 Tooltip : Ø55.1 (51.021-65.6)
: Ø60.1 (54.467-70.73)
: Ø64.3 (59.11-71.5)
...
NVIDIA GeForce GTX 1660 Super (Desktop)
Intel Arc A580
...
35.8 [X] KFA 2 GeForce GTX 1660 Super AMD Ryzen 9 5900X 3.7GHz
GeForce GTX 1660 Super (Desktop)
min:
29.2 fps, P0.1:
29.7 fps, P1:
30.5 fps, max:
47.1 fps
39.5 [X] KFA2 GeForce GTX 1660 Super AMD Ryzen 9 7900X 4.7GHz
GeForce GTX 1660 Super (Desktop)
min:
31.6 fps, P0.1:
31.8 fps, P1:
34.1 fps, max:
51.7 fps
41 [X] KFA2 GeForce GTX 1660 Super AMD Ryzen 9 7950X 4.5GHz
GeForce GTX 1660 Super (Desktop)
min:
32.3 fps, P0.1:
33.8 fps, P1:
34.8 fps, max:
53.7 fps
~ 39 fps
+ Compare
- Hide Comparison
+ 📈 Graph
- 📈 Hide Graph
0 Tooltip : Ø37.7 (31.55-57.2)
: Ø42.5 (35.471-61.3)
: Ø44.2 (36.333-57.7)
...
NVIDIA GeForce GTX 1660 Super (Desktop)
Intel Arc A580
...
29.2 [X] KFA 2 GeForce GTX 1660 Super AMD Ryzen 9 5900X 3.7GHz
GeForce GTX 1660 Super (Desktop)
min:
24.5 fps, P0.1:
24.8 fps, P1:
26.5 fps, max:
34.8 fps
32.2 [X] KFA2 GeForce GTX 1660 Super AMD Ryzen 9 7900X 4.7GHz
GeForce GTX 1660 Super (Desktop)
min:
26.6 fps, P0.1:
28.2 fps, P1:
29 fps, max:
49 fps
32.6 [X] KFA2 GeForce GTX 1660 Super AMD Ryzen 9 7950X 4.5GHz
GeForce GTX 1660 Super (Desktop)
min:
27.2 fps, P0.1:
27.4 fps, P1:
28 fps, max:
39.6 fps
~ 31 fps
+ Compare
- Hide Comparison
+ 📈 Graph
- 📈 Hide Graph
0 Tooltip : Ø35.6 (27.515-85.2)
: Ø35 (30.064-65.3)
: Ø36 (30.346-50.3)
...
NVIDIA GeForce GTX 1660 Super (Desktop)
Intel Arc A580
...
20.9 [X] KFA 2 GeForce GTX 1660 Super AMD Ryzen 9 5900X 3.7GHz
GeForce GTX 1660 Super (Desktop)
min:
17.7 fps, P0.1:
18.2 fps, P1:
19 fps, max:
24.3 fps
20.9 [X] KFA2 GeForce GTX 1660 Super AMD Ryzen 9 7950X 4.5GHz
GeForce GTX 1660 Super (Desktop)
min:
16.7 fps, P0.1:
17.5 fps, P1:
18.3 fps, max:
25.4 fps
21 [X] KFA2 GeForce GTX 1660 Super AMD Ryzen 9 7900X 4.7GHz
GeForce GTX 1660 Super (Desktop)
min:
19 fps, P0.1:
19.1 fps, P1:
19.3 fps, max:
23.7 fps
~ 21 fps
+ Compare
- Hide Comparison
+ 📈 Graph
- 📈 Hide Graph
0 Tooltip : Ø23.1 (19.114-32.9)
: Ø24.1 (19.248-75)
: Ø23.2 (19.072-39.3)
NVIDIA GeForce GTX 1660 Super (Desktop)
Intel Arc A580
...
» With all tested laptops playable in detail settings ultra.
Additional Benchmarks
Low Preset 1280x720
122 [X] KFA 2 GeForce GTX 1660 Super AMD Ryzen 9 5900X 3.7GHz
GeForce GTX 1660 Super (Desktop)
min:
49.3 fps, P0.1:
59 fps, P1:
98.5 fps, max:
341 fps
132.5 [X] KFA2 GeForce GTX 1660 Super AMD Ryzen 9 7950X 4.5GHz
GeForce GTX 1660 Super (Desktop)
min:
58.6 fps, P0.1:
74.6 fps, P1:
112.7 fps, max:
304 fps
...
NVIDIA GeForce GTX 1660 Super (Desktop)
...
0 100 200 300 400 500 600 Tooltip
...
NVIDIA GeForce GTX 1660 Super (Desktop)
...
...
NVIDIA GeForce GTX 1660 Super (Desktop)
...
...
NVIDIA GeForce GTX 1660 Super (Desktop)
...
...
NVIDIA GeForce GTX 1660 Super (Desktop)
...
» With all tested laptops playable in detail settings ultra.
Additional Benchmarks
Low Preset 1920x1080
94.8 [X] KFA 2 GeForce GTX 1660 Super AMD Ryzen 9 5900X 3.7GHz
GeForce GTX 1660 Super (Desktop)
min:
39.5 fps, P0.1:
53.1 fps, P1:
70.6 fps, max:
268 fps
0 100 200 300 400 500 600 700 800 900 1000 Tooltip
...
NVIDIA GeForce GTX 1660 Super (Desktop)
Intel Arc A580
0 100 200 300 400 500 600 700 800 900 1000 1100 1200 1300 1400 1500 1600 1700 1800 1900 2000 2100 2200 2300 2400 2500 2600 2700 2800 2900 3000 3100 3200 3300 Tooltip
...
NVIDIA GeForce GTX 1660 Super (Desktop)
...
...
NVIDIA GeForce GTX 1660 Super (Desktop)
...
...
NVIDIA GeForce GTX 1660 Super (Desktop)
...
...
NVIDIA GeForce GTX 1660 Super (Desktop)
...
...
NVIDIA GeForce GTX 1660 Super (Desktop)
...
» With all tested laptops playable in detail settings ultra.
Additional Benchmarks
Low Preset 1920x1080
273 [X] KFA 2 GeForce GTX 1660 Super AMD Ryzen 9 5900X 3.7GHz
GeForce GTX 1660 Super (Desktop)
min:
66.6 fps, P0.1:
132 fps, P1:
167 fps, max:
344 fps
0 100 200 300 400 500 600 700 800 900 1000 1100 1200 1300 1400 1500 1600 1700 1800 1900 2000 2100 2200 2300 2400 2500 2600 2700 2800 2900 3000 3100 3200 3300 3400 3500 3600 3700 3800 3900 4000 4100 4200 4300 4400 4500 4600 4700 4800 4900 5000 5100 5200 5300 5400 5500 5600 5700 5800 5900 6000 Tooltip
...
NVIDIA GeForce GTX 1660 Super (Desktop)
...
NVIDIA GeForce GTX 1660 Super (Desktop)
...
...
NVIDIA GeForce GTX 1660 Super (Desktop)
...
...
NVIDIA GeForce GTX 1660 Super (Desktop)
...
NVIDIA GeForce GTX 1660 Super (Desktop)
...
NVIDIA GeForce GTX 1660 Super (Desktop)
...
» With all tested laptops playable in detail settings ultra.
Additional Benchmarks
Low Preset 1920x1080
105 [X] KFA 2 GeForce GTX 1660 Super AMD Ryzen 9 5900X 3.7GHz
GeForce GTX 1660 Super (Desktop)
min:
7.26 fps, P0.1:
20.7 fps, P1:
79 fps, max:
179 fps
190 [X] KFA 2 GeForce GTX 1660 Super AMD Ryzen 9 5900X 3.7GHz
GeForce GTX 1660 Super (Desktop)
216 [X] KFA2 GeForce GTX 1660 Super AMD Ryzen 9 7900X 4.7GHz
GeForce GTX 1660 Super (Desktop)
223 [X] KFA2 GeForce GTX 1660 Super AMD Ryzen 9 7950X 4.5GHz
GeForce GTX 1660 Super (Desktop)
~ 210 fps
+ Compare
- Hide Comparison
...
NVIDIA GeForce GTX 1660 Super (Desktop)
Intel Arc A580
...
100 [X] KFA 2 GeForce GTX 1660 Super AMD Ryzen 9 5900X 3.7GHz
GeForce GTX 1660 Super (Desktop)
108 [X] KFA2 GeForce GTX 1660 Super AMD Ryzen 9 7900X 4.7GHz
GeForce GTX 1660 Super (Desktop)
113 [X] KFA2 GeForce GTX 1660 Super AMD Ryzen 9 7950X 4.5GHz
GeForce GTX 1660 Super (Desktop)
~ 107 fps
+ Compare
- Hide Comparison
...
NVIDIA GeForce GTX 1660 Super (Desktop)
Intel Arc A580
...
88 [X] KFA 2 GeForce GTX 1660 Super AMD Ryzen 9 5900X 3.7GHz
GeForce GTX 1660 Super (Desktop)
94 [X] KFA2 GeForce GTX 1660 Super AMD Ryzen 9 7900X 4.7GHz
GeForce GTX 1660 Super (Desktop)
98 [X] KFA2 GeForce GTX 1660 Super AMD Ryzen 9 7950X 4.5GHz
GeForce GTX 1660 Super (Desktop)
~ 93 fps
+ Compare
- Hide Comparison
...
NVIDIA GeForce GTX 1660 Super (Desktop)
Intel Arc A580
...
32 [X] KFA 2 GeForce GTX 1660 Super AMD Ryzen 9 5900X 3.7GHz
GeForce GTX 1660 Super (Desktop)
38 [X] KFA2 GeForce GTX 1660 Super AMD Ryzen 9 7900X 4.7GHz
GeForce GTX 1660 Super (Desktop)
42 [X] KFA2 GeForce GTX 1660 Super AMD Ryzen 9 7950X 4.5GHz
GeForce GTX 1660 Super (Desktop)
~ 37 fps
+ Compare
- Hide Comparison
...
Intel Arc A380
NVIDIA GeForce GTX 1660 Super (Desktop)
...
32 [X] KFA 2 GeForce GTX 1660 Super AMD Ryzen 9 5900X 3.7GHz
GeForce GTX 1660 Super (Desktop)
35 [X] KFA2 GeForce GTX 1660 Super AMD Ryzen 9 7950X 4.5GHz
GeForce GTX 1660 Super (Desktop)
36 [X] KFA2 GeForce GTX 1660 Super AMD Ryzen 9 7900X 4.7GHz
GeForce GTX 1660 Super (Desktop)
~ 34 fps
+ Compare
- Hide Comparison
NVIDIA GeForce GTX 1660 Super (Desktop)
...
22 [X] KFA 2 GeForce GTX 1660 Super AMD Ryzen 9 5900X 3.7GHz
GeForce GTX 1660 Super (Desktop)
24 [X] KFA2 GeForce GTX 1660 Super AMD Ryzen 9 7950X 4.5GHz
GeForce GTX 1660 Super (Desktop)
26 [X] KFA2 GeForce GTX 1660 Super AMD Ryzen 9 7900X 4.7GHz
GeForce GTX 1660 Super (Desktop)
~ 24 fps
+ Compare
- Hide Comparison
...
NVIDIA GeForce GTX 1660 Super (Desktop)
...
» With most tested laptops playable in detail settings ultra.
Additional Benchmarks
Low Preset 1920x1080
126 [X] KFA 2 GeForce GTX 1660 Super AMD Ryzen 9 5900X 3.7GHz
GeForce GTX 1660 Super (Desktop)
142 [X] KFA2 GeForce GTX 1660 Super AMD Ryzen 9 7950X 4.5GHz
GeForce GTX 1660 Super (Desktop)
...
NVIDIA GeForce GTX 1660 Super (Desktop)
...
...
NVIDIA GeForce GTX 1660 Super (Desktop)
...
...
NVIDIA GeForce GTX 1660 Super (Desktop)
...
NVIDIA GeForce GTX 1660 Super (Desktop)
...
NVIDIA GeForce GTX 1660 Super (Desktop)
...
NVIDIA GeForce GTX 1660 Super (Desktop)
...
» With all tested laptops playable in detail settings ultra.
Additional Benchmarks
Low Preset 1920x1080
87.2 [X] KFA 2 GeForce GTX 1660 Super AMD Ryzen 9 5900X 3.7GHz
GeForce GTX 1660 Super (Desktop)
min:
62.2 fps, P0.1:
74.9 fps, P1:
78.2 fps, max:
108 fps
...
NVIDIA GeForce GTX 1660 Super (Desktop)
...
...
NVIDIA GeForce GTX 1660 Super (Desktop)
...
...
NVIDIA GeForce GTX 1660 Super (Desktop)
...
...
NVIDIA GeForce GTX 1660 Super (Desktop)
...
...
NVIDIA GeForce GTX 1660 Super (Desktop)
...
...
NVIDIA GeForce GTX 1660 Super (Desktop)
...
» With all tested laptops playable in detail settings ultra.
Additional Benchmarks
Low Preset 1920x1080
118 [X] KFA 2 GeForce GTX 1660 Super AMD Ryzen 9 5900X 3.7GHz
GeForce GTX 1660 Super (Desktop)
min:
102 fps, max:
145 fps
...
NVIDIA GeForce GTX 1660 Super (Desktop)
...
...
NVIDIA GeForce GTX 1660 Super (Desktop)
...
...
NVIDIA GeForce GTX 1660 Super (Desktop)
...
...
NVIDIA GeForce GTX 1660 Super (Desktop)
Intel Arc A580
...
...
NVIDIA GeForce GTX 1660 Super (Desktop)
Intel Arc A580
...
...
NVIDIA GeForce GTX 1660 Super (Desktop)
Intel Arc A580
...
» With all tested laptops playable in detail settings ultra.
Additional Benchmarks
Low Preset 1920x1080
97 [X] KFA 2 GeForce GTX 1660 Super AMD Ryzen 9 5900X 3.7GHz
GeForce GTX 1660 Super (Desktop)
min:
73 fps, max:
113 fps
...
NVIDIA GeForce GTX 1660 Super (Desktop)
...
...
NVIDIA GeForce GTX 1660 Super (Desktop)
...
...
NVIDIA GeForce GTX 1660 Super (Desktop)
...
...
NVIDIA GeForce GTX 1660 Super (Desktop)
...
...
NVIDIA GeForce GTX 1660 Super (Desktop)
...
» With all tested laptops playable in detail settings ultra.
Additional Benchmarks
Low Preset (DX12) 1920x1080
217 [X] KFA 2 GeForce GTX 1660 Super AMD Ryzen 9 5900X 3.7GHz
GeForce GTX 1660 Super (Desktop)
min:
62 fps, P0.1:
104 fps, P1:
135 fps, max:
476 fps
155 [X] KFA 2 GeForce GTX 1660 Super AMD Ryzen 9 5900X 3.7GHz
GeForce GTX 1660 Super (Desktop)
min:
139 fps, max:
181 fps
171.1 [X] KFA2 GeForce GTX 1660 Super AMD Ryzen 9 7900X 4.7GHz
GeForce GTX 1660 Super (Desktop)
min:
156 fps, max:
199 fps
173.9 [X] KFA2 GeForce GTX 1660 Super AMD Ryzen 9 7950X 4.5GHz
GeForce GTX 1660 Super (Desktop)
min:
159 fps, max:
207 fps
~ 167 fps
+ Compare
- Hide Comparison
+ 📈 Graph
- 📈 Hide Graph
0 100 200 Tooltip : Ø171.1 (156-199)
: Ø173.9 (159-207)
...
NVIDIA GeForce GTX 1660 Super (Desktop)
...
95 [X] KFA 2 GeForce GTX 1660 Super AMD Ryzen 9 5900X 3.7GHz
GeForce GTX 1660 Super (Desktop)
min:
68 fps, max:
106 fps
98.1 [X] KFA2 GeForce GTX 1660 Super AMD Ryzen 9 7900X 4.7GHz
GeForce GTX 1660 Super (Desktop)
min:
91 fps, max:
110 fps
98.5 [X] KFA2 GeForce GTX 1660 Super AMD Ryzen 9 7950X 4.5GHz
GeForce GTX 1660 Super (Desktop)
min:
91 fps, max:
110 fps
~ 97 fps
+ Compare
- Hide Comparison
+ 📈 Graph
- 📈 Hide Graph
0 100 Tooltip : Ø98.1 (91-110)
: Ø98.5 (91-110)
...
NVIDIA GeForce GTX 1660 Super (Desktop)
...
83.2 [X] KFA2 GeForce GTX 1660 Super AMD Ryzen 9 7900X 4.7GHz
GeForce GTX 1660 Super (Desktop)
min:
76 fps, max:
94 fps
83.9 [X] KFA2 GeForce GTX 1660 Super AMD Ryzen 9 7950X 4.5GHz
GeForce GTX 1660 Super (Desktop)
min:
77 fps, max:
94 fps
86 [X] KFA 2 GeForce GTX 1660 Super AMD Ryzen 9 5900X 3.7GHz
GeForce GTX 1660 Super (Desktop)
min:
58 fps, max:
94 fps
~ 84 fps
+ Compare
- Hide Comparison
+ 📈 Graph
- 📈 Hide Graph
0 Tooltip : Ø83.2 (76-94)
: Ø83.9 (77-94)
...
NVIDIA GeForce GTX 1660 Super (Desktop)
...
68.7 [X] KFA2 GeForce GTX 1660 Super AMD Ryzen 9 7900X 4.7GHz
GeForce GTX 1660 Super (Desktop)
min:
59 fps, max:
77 fps
72 [X] KFA 2 GeForce GTX 1660 Super AMD Ryzen 9 5900X 3.7GHz
GeForce GTX 1660 Super (Desktop)
min:
48 fps, max:
83 fps
72.1 [X] KFA2 GeForce GTX 1660 Super AMD Ryzen 9 7950X 4.5GHz
GeForce GTX 1660 Super (Desktop)
min:
65 fps, max:
82 fps
~ 71 fps
+ Compare
- Hide Comparison
+ 📈 Graph
- 📈 Hide Graph
0 Tooltip : Ø68.7 (59-77)
: Ø72.1 (65-82)
...
NVIDIA GeForce GTX 1660 Super (Desktop)
...
38.2 [X] KFA2 GeForce GTX 1660 Super AMD Ryzen 9 7900X 4.7GHz
GeForce GTX 1660 Super (Desktop)
min:
34 fps, max:
43 fps
45.6 [X] KFA2 GeForce GTX 1660 Super AMD Ryzen 9 7950X 4.5GHz
GeForce GTX 1660 Super (Desktop)
min:
41 fps, max:
50 fps
50 [X] KFA 2 GeForce GTX 1660 Super AMD Ryzen 9 5900X 3.7GHz
GeForce GTX 1660 Super (Desktop)
min:
31 fps, max:
57 fps
~ 45 fps
+ Compare
- Hide Comparison
+ 📈 Graph
- 📈 Hide Graph
0 Tooltip : Ø38.2 (34-43)
: Ø45.6 (41-50)
...
NVIDIA GeForce GTX 1660 Super (Desktop)
...
1.6 [X] KFA2 GeForce GTX 1660 Super AMD Ryzen 9 7950X 4.5GHz
GeForce GTX 1660 Super (Desktop)
max:
2 fps
1.7 [X] KFA2 GeForce GTX 1660 Super AMD Ryzen 9 7900X 4.7GHz
GeForce GTX 1660 Super (Desktop)
max:
2 fps
16 [X] KFA 2 GeForce GTX 1660 Super AMD Ryzen 9 5900X 3.7GHz
GeForce GTX 1660 Super (Desktop)
min:
2 fps, max:
17 fps
~ 6 fps
+ Compare
- Hide Comparison
+ 📈 Graph
- 📈 Hide Graph
0 Tooltip : Ø1.62 (0-2)
: Ø1.7 (0-2)
NVIDIA GeForce GTX 1660 Super (Desktop)
...
» With all tested laptops playable in detail settings ultra.
Additional Benchmarks
Low Graphics Quality 1920x1080
109 [X] KFA 2 GeForce GTX 1660 Super AMD Ryzen 9 5900X 3.7GHz
GeForce GTX 1660 Super (Desktop)
min:
79 fps, max:
126 fps
118.1 [X] KFA2 GeForce GTX 1660 Super AMD Ryzen 9 7950X 4.5GHz
GeForce GTX 1660 Super (Desktop)
min:
110 fps, max:
135 fps
...
NVIDIA GeForce GTX 1660 Super (Desktop)
...
...
NVIDIA GeForce GTX 1660 Super (Desktop)
...
...
NVIDIA GeForce GTX 1660 Super (Desktop)
...
...
NVIDIA GeForce GTX 1660 Super (Desktop)
...
» With all tested laptops playable in detail settings high.
Additional Benchmarks
Low Preset 1920x1080
100 [X] KFA 2 GeForce GTX 1660 Super AMD Ryzen 9 5900X 3.7GHz
GeForce GTX 1660 Super (Desktop)
min:
27.8 fps, P0.1:
44.6 fps, P1:
81.3 fps, max:
218 fps
...
NVIDIA GeForce GTX 1660 Super (Desktop)
...
...
NVIDIA GeForce GTX 1660 Super (Desktop)
...
...
NVIDIA GeForce GTX 1660 Super (Desktop)
...
27.8 [X] KFA 2 GeForce GTX 1660 Super AMD Ryzen 9 5900X 3.7GHz
GeForce GTX 1660 Super (Desktop)
min:
19.1 fps, P0.1:
19.3 fps, P1:
21.3 fps, max:
38.7 fps
64.3 [X] KFA 2 GeForce GTX 1660 Super AMD Ryzen 9 5900X 3.7GHz
GeForce GTX 1660 Super (Desktop)
min:
35.2 fps, P0.1:
39.7 fps, P1:
47.6 fps, max:
121 fps
~ 46 fps
+ Compare
- Hide Comparison
+ 📈 Graph
- 📈 Hide Graph
0 100 Tooltip : Ø31.9 (23.61-105.8)
: Ø71.5 (52.852-190)
...
NVIDIA GeForce GTX 1660 Super (Desktop)
...
...
NVIDIA GeForce GTX 1660 Super (Desktop)
...
» With most tested laptops playable in detail settings ultra.
Additional Benchmarks
Low Video Quality 1920x1080
102 [X] KFA 2 GeForce GTX 1660 Super AMD Ryzen 9 5900X 3.7GHz
GeForce GTX 1660 Super (Desktop)
min:
46.2 fps, P0.1:
58.6 fps, P1:
77.1 fps, max:
227 fps
0 100 200 300 400 500 600 Tooltip
...
NVIDIA GeForce GTX 1660 Super (Desktop)
...
NVIDIA GeForce GTX 1660 Super (Desktop)
...
...
NVIDIA GeForce GTX 1660 Super (Desktop)
...
...
NVIDIA GeForce GTX 1660 Super (Desktop)
...
NVIDIA GeForce GTX 1660 Super (Desktop)
...
NVIDIA GeForce GTX 1660 Super (Desktop)
...
» With all tested laptops playable in detail settings ultra.
Additional Benchmarks
Low Preset 1920x1080
92.5 [X] KFA 2 GeForce GTX 1660 Super AMD Ryzen 9 5900X 3.7GHz
GeForce GTX 1660 Super (Desktop)
min:
31.7 fps, P0.1:
70.3 fps, P1:
76.4 fps, max:
126 fps
363 [X] KFA 2 GeForce GTX 1660 Super 815237
AMD Ryzen 9 5900X 3.7GHz
GeForce GTX 1660 Super (Desktop)
min:
311 fps, P1:
247 fps, max:
434 fps
413 [X] KFA2 GeForce GTX 1660 Super 874931
AMD Ryzen 9 7900X 4.7GHz
GeForce GTX 1660 Super (Desktop)
min:
348 fps, P1:
284 fps, max:
472 fps
429 [X] KFA2 GeForce GTX 1660 Super 874931
AMD Ryzen 9 7950X 4.5GHz
GeForce GTX 1660 Super (Desktop)
min:
367 fps, P1:
301 fps, max:
521 fps
~ 402 fps
+ Compare
- Hide Comparison
...
NVIDIA GeForce GTX 1660 Super (Desktop)
Intel Arc A580
...
185 [X] KFA 2 GeForce GTX 1660 Super 815237
AMD Ryzen 9 5900X 3.7GHz
GeForce GTX 1660 Super (Desktop)
min:
161 fps, P1:
158 fps, max:
211 fps
200 [X] KFA2 GeForce GTX 1660 Super 874931
AMD Ryzen 9 7900X 4.7GHz
GeForce GTX 1660 Super (Desktop)
min:
174 fps, P1:
170 fps, max:
231 fps
205 [X] KFA2 GeForce GTX 1660 Super 874931
AMD Ryzen 9 7950X 4.5GHz
GeForce GTX 1660 Super (Desktop)
min:
176 fps, P1:
175 fps, max:
231 fps
~ 197 fps
+ Compare
- Hide Comparison
...
NVIDIA GeForce GTX 1660 Super (Desktop)
...
153 [X] KFA 2 GeForce GTX 1660 Super 815237
AMD Ryzen 9 5900X 3.7GHz
GeForce GTX 1660 Super (Desktop)
min:
134 fps, P1:
131 fps, max:
173 fps
162.4 [X] KFA2 GeForce GTX 1660 Super 874931
AMD Ryzen 9 7900X 4.7GHz
GeForce GTX 1660 Super (Desktop)
min:
142 fps, P1:
139 fps, max:
183 fps
164.6 [X] KFA2 GeForce GTX 1660 Super 874931
AMD Ryzen 9 7950X 4.5GHz
GeForce GTX 1660 Super (Desktop)
min:
143 fps, P1:
142 fps, max:
187 fps
~ 160 fps
+ Compare
- Hide Comparison
...
NVIDIA GeForce GTX 1660 Super (Desktop)
...
104 [X] KFA 2 GeForce GTX 1660 Super 815237
AMD Ryzen 9 5900X 3.7GHz
GeForce GTX 1660 Super (Desktop)
min:
87 fps, P1:
86 fps, max:
120 fps
109 [X] KFA2 GeForce GTX 1660 Super 874931
AMD Ryzen 9 7900X 4.7GHz
GeForce GTX 1660 Super (Desktop)
min:
91 fps, P1:
90 fps, max:
124 fps
111.5 [X] KFA2 GeForce GTX 1660 Super 874931
AMD Ryzen 9 7950X 4.5GHz
GeForce GTX 1660 Super (Desktop)
min:
93 fps, P1:
93 fps, max:
126 fps
~ 108 fps
+ Compare
- Hide Comparison
...
Intel Arc A580
NVIDIA GeForce GTX 1660 Super (Desktop)
...
78.1 [X] KFA 2 GeForce GTX 1660 Super 815237
AMD Ryzen 9 5900X 3.7GHz
GeForce GTX 1660 Super (Desktop)
min:
66 fps, P1:
65 fps, max:
88 fps
80.8 [X] KFA2 GeForce GTX 1660 Super 874931
AMD Ryzen 9 7900X 4.7GHz
GeForce GTX 1660 Super (Desktop)
min:
68 fps, P1:
68 fps, max:
90 fps
81.9 [X] KFA2 GeForce GTX 1660 Super 874931
AMD Ryzen 9 7950X 4.5GHz
GeForce GTX 1660 Super (Desktop)
min:
69 fps, P1:
69 fps, max:
91 fps
~ 80 fps
+ Compare
- Hide Comparison
...
Intel Arc A580
NVIDIA GeForce GTX 1660 Super (Desktop)
...
44.8 [X] KFA2 GeForce GTX 1660 Super 874931
AMD Ryzen 9 7950X 4.5GHz
GeForce GTX 1660 Super (Desktop)
min:
36 fps, P1:
36 fps, max:
51 fps
45.3 [X] KFA 2 GeForce GTX 1660 Super 815237
AMD Ryzen 9 5900X 3.7GHz
GeForce GTX 1660 Super (Desktop)
min:
38 fps, P1:
38 fps, max:
52 fps
45.9 [X] KFA2 GeForce GTX 1660 Super 874931
AMD Ryzen 9 7900X 4.7GHz
GeForce GTX 1660 Super (Desktop)
min:
36 fps, P1:
37 fps, max:
52 fps
~ 45 fps
+ Compare
- Hide Comparison
...
NVIDIA GeForce GTX 1660 Super (Desktop)
...
» With all tested laptops playable in detail settings ultra.
...
NVIDIA GeForce GTX 1660 Super (Desktop)
...
...
NVIDIA GeForce GTX 1660 Super (Desktop)
...
...
NVIDIA GeForce GTX 1660 Super (Desktop)
...
...
NVIDIA GeForce GTX 1660 Super (Desktop)
...
...
NVIDIA GeForce GTX 1660 Super (Desktop)
...
» With all tested laptops playable in detail settings high.
Additional Benchmarks
Low Preset 1920x1080
144 [X] KFA 2 GeForce GTX 1660 Super AMD Ryzen 9 5900X 3.7GHz
GeForce GTX 1660 Super (Desktop)
min:
39.2 fps, P0.1:
106 fps, P1:
113 fps, max:
226 fps
0 100 200 Tooltip : Ø170.3 (124.043-209.81)
...
NVIDIA GeForce GTX 1660 Super (Desktop)
...
...
NVIDIA GeForce GTX 1660 Super (Desktop)
...
...
NVIDIA GeForce GTX 1660 Super (Desktop)
...
...
NVIDIA GeForce GTX 1660 Super (Desktop)
...
...
NVIDIA GeForce GTX 1660 Super (Desktop)
...
...
NVIDIA GeForce GTX 1660 Super (Desktop)
...
» With all tested laptops playable in detail settings ultra.
Additional Benchmarks
Low Preset 1920x1080
122 [X] KFA 2 GeForce GTX 1660 Super AMD Ryzen 9 5900X 3.7GHz
GeForce GTX 1660 Super (Desktop)
min:
34.2 fps, P0.1:
53.6 fps, P1:
72.9 fps, max:
290 fps
...
NVIDIA GeForce GTX 1660 Super (Desktop)
...
...
NVIDIA GeForce GTX 1660 Super (Desktop)
...
...
NVIDIA GeForce GTX 1660 Super (Desktop)
...
...
NVIDIA GeForce GTX 1660 Super (Desktop)
...
» With all tested laptops playable in detail settings ultra.
...
NVIDIA GeForce GTX 1660 Super (Desktop)
...
...
NVIDIA GeForce GTX 1660 Super (Desktop)
...
...
NVIDIA GeForce GTX 1660 Super (Desktop)
...
...
NVIDIA GeForce GTX 1660 Super (Desktop)
...
...
NVIDIA GeForce GTX 1660 Super (Desktop)
...
...
NVIDIA GeForce GTX 1660 Super (Desktop)
...
» With all tested laptops playable in detail settings ultra.
Additional Benchmarks
Prioritize Performance Preset 1920x1080
179 [X] KFA 2 GeForce GTX 1660 Super AMD Ryzen 9 5900X 3.7GHz
GeForce GTX 1660 Super (Desktop)
min:
131 fps, P0.1:
135 fps, P1:
140 fps, max:
226 fps
...
NVIDIA GeForce GTX 1660 Super (Desktop)
0 100 Tooltip : Ø115.5 (83.361-147.555)
...
NVIDIA GeForce GTX 1660 Super (Desktop)
...
...
NVIDIA GeForce GTX 1660 Super (Desktop)
...
...
NVIDIA GeForce GTX 1660 Super (Desktop)
...
...
NVIDIA GeForce GTX 1660 Super (Desktop)
...
...
NVIDIA GeForce GTX 1660 Super (Desktop)
...
» With all tested laptops playable in detail settings ultra.
Additional Benchmarks
Low Preset 1920x1080
134 [X] KFA 2 GeForce GTX 1660 Super AMD Ryzen 9 5900X 3.7GHz
GeForce GTX 1660 Super (Desktop)
min:
61.6 fps, P0.1:
67.6 fps, P1:
78.5 fps, max:
282 fps
...
NVIDIA GeForce GTX 1660 Super (Desktop)
...
...
NVIDIA GeForce GTX 1660 Super (Desktop)
...
...
NVIDIA GeForce GTX 1660 Super (Desktop)
...
...
NVIDIA GeForce GTX 1660 Super (Desktop)
...
...
NVIDIA GeForce GTX 1660 Super (Desktop)
...
...
NVIDIA GeForce GTX 1660 Super (Desktop)
...
» With all tested laptops playable in detail settings ultra.
...
NVIDIA GeForce GTX 1660 Super (Desktop)
...
...
NVIDIA GeForce GTX 1660 Super (Desktop)
...
...
NVIDIA GeForce GTX 1660 Super (Desktop)
...
...
NVIDIA GeForce GTX 1660 Super (Desktop)
...
...
NVIDIA GeForce GTX 1660 Super (Desktop)
...
0 100 200 300 400 500 600 Tooltip
...
NVIDIA GeForce GTX 1660 Super (Desktop)
...
» With all tested laptops playable in detail settings ultra.
Additional Benchmarks
Low Preset 1920x1080
67.1 [X] KFA 2 GeForce GTX 1660 Super AMD Ryzen 9 5900X 3.7GHz
GeForce GTX 1660 Super (Desktop)
min:
21 fps, P0.1:
50.2 fps, P1:
54.9 fps, max:
150 fps
...
NVIDIA GeForce GTX 1660 Super (Desktop)
...
...
NVIDIA GeForce GTX 1660 Super (Desktop)
...
...
NVIDIA GeForce GTX 1660 Super (Desktop)
...
...
NVIDIA GeForce GTX 1660 Super (Desktop)
...
...
NVIDIA GeForce GTX 1660 Super (Desktop)
...
...
NVIDIA GeForce GTX 1660 Super (Desktop)
...
» With all tested laptops playable in detail settings ultra.
...
NVIDIA GeForce GTX 1660 Super (Desktop)
...
0 100 200 300 400 500 600 700 Tooltip
...
NVIDIA GeForce GTX 1660 Super (Desktop)
...
...
NVIDIA GeForce GTX 1660 Super (Desktop)
...
...
NVIDIA GeForce GTX 1660 Super (Desktop)
...
...
NVIDIA GeForce GTX 1660 Super (Desktop)
...
...
NVIDIA GeForce GTX 1660 Super (Desktop)
...
» With all tested laptops playable in detail settings ultra.
...
NVIDIA GeForce GTX 1660 Super (Desktop)
...
...
NVIDIA GeForce GTX 1660 Super (Desktop)
...
...
NVIDIA GeForce GTX 1660 Super (Desktop)
...
0 100 200 300 400 500 600 700 800 900 1000 1100 Tooltip
...
NVIDIA GeForce GTX 1660 Super (Desktop)
...
...
NVIDIA GeForce GTX 1660 Super (Desktop)
...
NVIDIA GeForce GTX 1660 Super (Desktop)
...
» With all tested laptops playable in detail settings ultra.
Additional Benchmarks
Highest Settings + Ultra Ray Tracing 1920x1080
20.5 [X] KFA 2 GeForce GTX 1660 Super AMD Ryzen 9 5900X 3.7GHz
GeForce GTX 1660 Super (Desktop)
min:
14 fps, P0.1:
15 fps, P1:
16.2 fps, max:
138 fps
...
Intel Arc A380
NVIDIA GeForce GTX 1660 Super (Desktop)
...
...
NVIDIA GeForce GTX 1660 Super (Desktop)
...
...
Intel Arc A380
NVIDIA GeForce GTX 1660 Super (Desktop)
...
...
Intel Arc A380
NVIDIA GeForce GTX 1660 Super (Desktop)
...
...
NVIDIA GeForce GTX 1660 Super (Desktop)
...
...
NVIDIA GeForce GTX 1660 Super (Desktop)
...
» With all tested laptops playable in detail settings ultra.
...
NVIDIA GeForce GTX 1660 Super (Desktop)
...
...
NVIDIA GeForce GTX 1660 Super (Desktop)
Intel Arc A580
...
...
NVIDIA GeForce GTX 1660 Super (Desktop)
...
...
Intel Arc A380
NVIDIA GeForce GTX 1660 Super (Desktop)
...
...
NVIDIA GeForce GTX 1660 Super (Desktop)
...
NVIDIA GeForce GTX 1660 Super (Desktop)
...
» With all tested laptops playable in detail settings high.
Additional Benchmarks
Ultra Preset + Ultra Ray Tracing (DX12) 1920x1080
11.7 [X] AMD Ryzen 9 3900X 3.8GHz
GeForce GTX 1660 Super (Desktop)
min:
7.26 fps, P1:
8.31 fps, max:
16.29 fps
0 100 200 300 400 500 600 700 800 900 Tooltip
...
NVIDIA GeForce GTX 1660 Super (Desktop)
...
...
NVIDIA GeForce GTX 1660 Super (Desktop)
...
...
NVIDIA GeForce GTX 1660 Super (Desktop)
...
...
NVIDIA GeForce GTX 1660 Super (Desktop)
...
...
NVIDIA GeForce GTX 1660 Super (Desktop)
...
0 100 200 300 400 500 600 700 800 900 1000 1100 1200 1300 1400 1500 1600 1700 1800 1900 2000 2100 2200 2300 2400 2500 2600 2700 2800 2900 3000 3100 3200 3300 3400 3500 3600 3700 3800 3900 4000 4100 4200 4300 4400 4500 4600 4700 4800 4900 5000 5100 5200 5300 5400 5500 5600 5700 5800 5900 6000 6100 6200 6300 6400 6500 6600 6700 6800 6900 7000 7100 7200 7300 7400 7500 7600 7700 7800 7900 8000 8100 8200 8300 8400 8500 8600 8700 8800 8900 9000 9100 9200 9300 9400 9500 9600 9700 9800 9900 Tooltip : Ø456430991790 (129.082-27385859498928)
...
NVIDIA GeForce GTX 1660 Super (Desktop)
...
» With all tested laptops playable in detail settings ultra.
0 100 200 300 400 500 600 Tooltip
...
NVIDIA GeForce GTX 1660 Super (Desktop)
...
...
NVIDIA GeForce GTX 1660 Super (Desktop)
...
...
NVIDIA GeForce GTX 1660 Super (Desktop)
...
...
NVIDIA GeForce GTX 1660 Super (Desktop)
...
...
NVIDIA GeForce GTX 1660 Super (Desktop)
...
...
NVIDIA GeForce GTX 1660 Super (Desktop)
...
» With all tested laptops playable in detail settings ultra.
...
NVIDIA GeForce GTX 1660 Super (Desktop)
...
...
NVIDIA GeForce GTX 1660 Super (Desktop)
...
...
NVIDIA GeForce GTX 1660 Super (Desktop)
...
...
NVIDIA GeForce GTX 1660 Super (Desktop)
...
...
NVIDIA GeForce GTX 1660 Super (Desktop)
...
» With all tested laptops playable in detail settings high.
...
NVIDIA GeForce GTX 1660 Super (Desktop)
...
...
NVIDIA GeForce GTX 1660 Super (Desktop)
...
...
NVIDIA GeForce GTX 1660 Super (Desktop)
...
...
NVIDIA GeForce GTX 1660 Super (Desktop)
...
...
NVIDIA GeForce GTX 1660 Super (Desktop)
...
NVIDIA GeForce GTX 1660 Super (Desktop)
...
» With all tested laptops playable in detail settings ultra.
...
NVIDIA GeForce GTX 1660 Super (Desktop)
...
0 100 Tooltip : Ø111.4 (98.983-124.891)
...
NVIDIA GeForce GTX 1660 Super (Desktop)
...
0 100 200 300 400 500 600 700 800 900 1000 1100 1200 1300 1400 1500 Tooltip
...
NVIDIA GeForce GTX 1660 Super (Desktop)
...
0 100 200 300 400 500 600 700 800 900 1000 1100 1200 Tooltip
...
NVIDIA GeForce GTX 1660 Super (Desktop)
...
...
NVIDIA GeForce GTX 1660 Super (Desktop)
...
...
NVIDIA GeForce GTX 1660 Super (Desktop)
...
» With all tested laptops playable in detail settings ultra.
...
NVIDIA GeForce GTX 1660 Super (Desktop)
...
...
NVIDIA GeForce GTX 1660 Super (Desktop)
...
...
NVIDIA GeForce GTX 1660 Super (Desktop)
...
...
NVIDIA GeForce GTX 1660 Super (Desktop)
...
...
NVIDIA GeForce GTX 1660 Super (Desktop)
...
NVIDIA GeForce GTX 1660 Super (Desktop)
...
» With all tested laptops playable in detail settings high.
...
NVIDIA GeForce GTX 1660 Super (Desktop)
...
...
NVIDIA GeForce GTX 1660 Super (Desktop)
Intel Arc A580
...
...
NVIDIA GeForce GTX 1660 Super (Desktop)
...
...
NVIDIA GeForce GTX 1660 Super (Desktop)
...
...
NVIDIA GeForce GTX 1660 Super (Desktop)
...
...
NVIDIA GeForce GTX 1660 Super (Desktop)
...
» With all tested laptops playable in detail settings ultra.
...
NVIDIA GeForce GTX 1660 Super (Desktop)
...
...
NVIDIA GeForce GTX 1660 Super (Desktop)
...
...
NVIDIA GeForce GTX 1660 Super (Desktop)
...
...
NVIDIA GeForce GTX 1660 Super (Desktop)
...
...
NVIDIA GeForce GTX 1660 Super (Desktop)
...
...
NVIDIA GeForce GTX 1660 Super (Desktop)
...
» With all tested laptops playable in detail settings ultra.
298 [X] 675864
AMD Ryzen 9 3900X 3.8GHz
GeForce GTX 1660 Super (Desktop)
min:
241 fps, max:
324 fps
360 [X] KFA2 GeForce GTX 1660 Super 759689
AMD Ryzen 9 7900X 4.7GHz
GeForce GTX 1660 Super (Desktop)
min:
328 fps, max:
400 fps
379 [X] KFA2 GeForce GTX 1660 Super 759689
AMD Ryzen 9 7950X 4.5GHz
GeForce GTX 1660 Super (Desktop)
min:
351 fps, max:
422 fps
~ 346 fps
+ Compare
- Hide Comparison
...
NVIDIA GeForce GTX 1660 Super (Desktop)
...
171 [X] 675864
AMD Ryzen 9 3900X 3.8GHz
GeForce GTX 1660 Super (Desktop)
min:
152 fps, max:
187 fps
185.6 [X] KFA2 GeForce GTX 1660 Super 759689
AMD Ryzen 9 7900X 4.7GHz
GeForce GTX 1660 Super (Desktop)
min:
161 fps, max:
209 fps
194.4 [X] KFA2 GeForce GTX 1660 Super 759689
AMD Ryzen 9 7950X 4.5GHz
GeForce GTX 1660 Super (Desktop)
min:
164 fps, max:
222 fps
~ 184 fps
+ Compare
- Hide Comparison
...
NVIDIA GeForce GTX 1660 Super (Desktop)
Intel Arc A580
...
137 [X] 675864
AMD Ryzen 9 3900X 3.8GHz
GeForce GTX 1660 Super (Desktop)
min:
118 fps, max:
154 fps
144.1 [X] KFA2 GeForce GTX 1660 Super 759689
AMD Ryzen 9 7900X 4.7GHz
GeForce GTX 1660 Super (Desktop)
min:
121 fps, max:
163 fps
149.7 [X] KFA2 GeForce GTX 1660 Super 759689
AMD Ryzen 9 7950X 4.5GHz
GeForce GTX 1660 Super (Desktop)
min:
126 fps, max:
172 fps
~ 144 fps
+ Compare
- Hide Comparison
...
NVIDIA GeForce GTX 1660 Super (Desktop)
...
94.3 [X] 675864
AMD Ryzen 9 3900X 3.8GHz
GeForce GTX 1660 Super (Desktop)
min:
78 fps, max:
111 fps
98.5 [X] KFA2 GeForce GTX 1660 Super 759689
AMD Ryzen 9 7900X 4.7GHz
GeForce GTX 1660 Super (Desktop)
min:
80 fps, max:
117 fps
101.9 [X] KFA2 GeForce GTX 1660 Super 759689
AMD Ryzen 9 7950X 4.5GHz
GeForce GTX 1660 Super (Desktop)
min:
82 fps, max:
121 fps
~ 98 fps
+ Compare
- Hide Comparison
...
NVIDIA GeForce GTX 1660 Super (Desktop)
...
69.3 [X] 675864
AMD Ryzen 9 3900X 3.8GHz
GeForce GTX 1660 Super (Desktop)
min:
58 fps, max:
80 fps
71.4 [X] KFA2 GeForce GTX 1660 Super 759689
AMD Ryzen 9 7900X 4.7GHz
GeForce GTX 1660 Super (Desktop)
min:
60 fps, max:
84 fps
73.7 [X] KFA2 GeForce GTX 1660 Super 759689
AMD Ryzen 9 7950X 4.5GHz
GeForce GTX 1660 Super (Desktop)
min:
61 fps, max:
87 fps
~ 71 fps
+ Compare
- Hide Comparison
...
NVIDIA GeForce GTX 1660 Super (Desktop)
...
39 [X] 675864
AMD Ryzen 9 3900X 3.8GHz
GeForce GTX 1660 Super (Desktop)
min:
32 fps, max:
45 fps
39.5 [X] KFA2 GeForce GTX 1660 Super 759689
AMD Ryzen 9 7900X 4.7GHz
GeForce GTX 1660 Super (Desktop)
min:
33 fps, max:
46 fps
40.3 [X] KFA2 GeForce GTX 1660 Super 759689
AMD Ryzen 9 7950X 4.5GHz
GeForce GTX 1660 Super (Desktop)
min:
34 fps, max:
48 fps
~ 40 fps
+ Compare
- Hide Comparison
...
NVIDIA GeForce GTX 1660 Super (Desktop)
...
» With all tested laptops playable in detail settings ultra.
...
NVIDIA GeForce GTX 1660 Super (Desktop)
...
NVIDIA GeForce GTX 1660 Super (Desktop)
...
NVIDIA GeForce GTX 1660 Super (Desktop)
...
NVIDIA GeForce GTX 1660 Super (Desktop)
...
NVIDIA GeForce GTX 1660 Super (Desktop)
...
» With all tested laptops playable in detail settings high.
...
NVIDIA GeForce GTX 1660 Super (Desktop)
...
...
NVIDIA GeForce GTX 1660 Super (Desktop)
...
...
NVIDIA GeForce GTX 1660 Super (Desktop)
...
...
NVIDIA GeForce GTX 1660 Super (Desktop)
...
...
NVIDIA GeForce GTX 1660 Super (Desktop)
...
...
NVIDIA GeForce GTX 1660 Super (Desktop)
...
» With all tested laptops playable in detail settings ultra.
...
NVIDIA GeForce GTX 1660 Super (Desktop)
...
...
NVIDIA GeForce GTX 1660 Super (Desktop)
...
...
NVIDIA GeForce GTX 1660 Super (Desktop)
...
...
NVIDIA GeForce GTX 1660 Super (Desktop)
...
...
NVIDIA GeForce GTX 1660 Super (Desktop)
...
NVIDIA GeForce GTX 1660 Super (Desktop)
...
» With all tested laptops playable in detail settings ultra.
...
NVIDIA GeForce GTX 1660 Super (Desktop)
...
...
NVIDIA GeForce GTX 1660 Super (Desktop)
...
...
NVIDIA GeForce GTX 1660 Super (Desktop)
...
...
NVIDIA GeForce GTX 1660 Super (Desktop)
...
...
NVIDIA GeForce GTX 1660 Super (Desktop)
...
» With all tested laptops playable in detail settings high.
...
NVIDIA GeForce GTX 1660 Super (Desktop)
...
NVIDIA GeForce GTX 1660 Super (Desktop)
...
...
NVIDIA GeForce GTX 1660 Super (Desktop)
...
...
NVIDIA GeForce GTX 1660 Super (Desktop)
...
...
NVIDIA GeForce GTX 1660 Super (Desktop)
...
...
NVIDIA GeForce GTX 1660 Super (Desktop)
...
» With all tested laptops playable in detail settings ultra.
...
NVIDIA GeForce GTX 1660 Super (Desktop)
...
...
NVIDIA GeForce GTX 1660 Super (Desktop)
...
...
NVIDIA GeForce GTX 1660 Super (Desktop)
...
...
NVIDIA GeForce GTX 1660 Super (Desktop)
...
...
NVIDIA GeForce GTX 1660 Super (Desktop)
...
» With all tested laptops playable in detail settings high.
...
NVIDIA GeForce GTX 1660 Super (Desktop)
...
...
NVIDIA GeForce GTX 1660 Super (Desktop)
...
...
NVIDIA GeForce GTX 1660 Super (Desktop)
...
...
NVIDIA GeForce GTX 1660 Super (Desktop)
...
...
NVIDIA GeForce GTX 1660 Super (Desktop)
...
» With all tested laptops playable in detail settings ultra.
...
NVIDIA GeForce GTX 1660 Super (Desktop)
...
NVIDIA GeForce GTX 1660 Super (Desktop)
...
...
NVIDIA GeForce GTX 1660 Super (Desktop)
...
...
NVIDIA GeForce GTX 1660 Super (Desktop)
...
...
NVIDIA GeForce GTX 1660 Super (Desktop)
...
...
NVIDIA GeForce GTX 1660 Super (Desktop)
...
» With all tested laptops playable in detail settings ultra.
...
NVIDIA GeForce GTX 1660 Super (Desktop)
...
...
NVIDIA GeForce GTX 1660 Super (Desktop)
...
...
NVIDIA GeForce GTX 1660 Super (Desktop)
...
...
NVIDIA GeForce GTX 1660 Super (Desktop)
...
...
NVIDIA GeForce GTX 1660 Super (Desktop)
...
...
NVIDIA GeForce GTX 1660 Super (Desktop)
...
» With all tested laptops playable in detail settings ultra.
Additional Benchmarks
Maximum Settings with Raytracing T2X Filmic SMAA 1920x1080
57.9 [X] AMD Ryzen 9 3900X 3.8GHz
GeForce GTX 1660 Super (Desktop)
P1:
44.6 fps
Maximum Settings with Raytracing T2X Filmic SMAA 3840x2160
12.5 [X] AMD Ryzen 9 3900X 3.8GHz
GeForce GTX 1660 Super (Desktop)
P1:
6.9 fps
...
NVIDIA GeForce GTX 1660 Super (Desktop)
...
...
NVIDIA GeForce GTX 1660 Super (Desktop)
...
...
NVIDIA GeForce GTX 1660 Super (Desktop)
...
...
NVIDIA GeForce GTX 1660 Super (Desktop)
...
...
NVIDIA GeForce GTX 1660 Super (Desktop)
...
...
NVIDIA GeForce GTX 1660 Super (Desktop)
...
» With all tested laptops playable in detail settings ultra.
...
NVIDIA GeForce GTX 1660 Super (Desktop)
...
...
NVIDIA GeForce GTX 1660 Super (Desktop)
...
...
NVIDIA GeForce GTX 1660 Super (Desktop)
...
...
NVIDIA GeForce GTX 1660 Super (Desktop)
...
...
NVIDIA GeForce GTX 1660 Super (Desktop)
...
NVIDIA GeForce GTX 1660 Super (Desktop)
...
» With all tested laptops playable in detail settings ultra.
...
NVIDIA GeForce GTX 1660 Super (Desktop)
...
...
NVIDIA GeForce GTX 1660 Super (Desktop)
...
...
NVIDIA GeForce GTX 1660 Super (Desktop)
...
...
NVIDIA GeForce GTX 1660 Super (Desktop)
...
...
NVIDIA GeForce GTX 1660 Super (Desktop)
...
...
NVIDIA GeForce GTX 1660 Super (Desktop)
...
» With all tested laptops playable in detail settings ultra.
149 [X] AMD Ryzen 9 3900X 3.8GHz
GeForce GTX 1660 Super (Desktop)
225 [X] KFA2 GeForce GTX 1660 Super AMD Ryzen 9 7900X 4.7GHz
GeForce GTX 1660 Super (Desktop)
230 [X] KFA2 GeForce GTX 1660 Super AMD Ryzen 9 7950X 4.5GHz
GeForce GTX 1660 Super (Desktop)
~ 201 fps
+ Compare
- Hide Comparison
...
NVIDIA GeForce GTX 1660 Super (Desktop)
...
99 [X] AMD Ryzen 9 3900X 3.8GHz
GeForce GTX 1660 Super (Desktop)
108.4 [X] KFA2 GeForce GTX 1660 Super AMD Ryzen 9 7900X 4.7GHz
GeForce GTX 1660 Super (Desktop)
109.6 [X] KFA2 GeForce GTX 1660 Super AMD Ryzen 9 7950X 4.5GHz
GeForce GTX 1660 Super (Desktop)
~ 106 fps
+ Compare
- Hide Comparison
...
NVIDIA GeForce GTX 1660 Super (Desktop)
...
66 [X] AMD Ryzen 9 3900X 3.8GHz
GeForce GTX 1660 Super (Desktop)
69.6 [X] KFA2 GeForce GTX 1660 Super AMD Ryzen 9 7900X 4.7GHz
GeForce GTX 1660 Super (Desktop)
70.5 [X] KFA2 GeForce GTX 1660 Super AMD Ryzen 9 7950X 4.5GHz
GeForce GTX 1660 Super (Desktop)
~ 69 fps
+ Compare
- Hide Comparison
...
NVIDIA GeForce GTX 1660 Super (Desktop)
...
50 [X] AMD Ryzen 9 3900X 3.8GHz
GeForce GTX 1660 Super (Desktop)
52.3 [X] KFA2 GeForce GTX 1660 Super AMD Ryzen 9 7900X 4.7GHz
GeForce GTX 1660 Super (Desktop)
53 [X] KFA2 GeForce GTX 1660 Super AMD Ryzen 9 7950X 4.5GHz
GeForce GTX 1660 Super (Desktop)
~ 52 fps
+ Compare
- Hide Comparison
...
NVIDIA GeForce GTX 1660 Super (Desktop)
...
33 [X] AMD Ryzen 9 3900X 3.8GHz
GeForce GTX 1660 Super (Desktop)
36.1 [X] KFA2 GeForce GTX 1660 Super AMD Ryzen 9 7900X 4.7GHz
GeForce GTX 1660 Super (Desktop)
36.5 [X] KFA2 GeForce GTX 1660 Super AMD Ryzen 9 7950X 4.5GHz
GeForce GTX 1660 Super (Desktop)
~ 35 fps
+ Compare
- Hide Comparison
...
NVIDIA GeForce GTX 1660 Super (Desktop)
...
12 [X] AMD Ryzen 9 3900X 3.8GHz
GeForce GTX 1660 Super (Desktop)
16.8 [X] KFA2 GeForce GTX 1660 Super AMD Ryzen 9 7900X 4.7GHz
GeForce GTX 1660 Super (Desktop)
16.9 [X] KFA2 GeForce GTX 1660 Super AMD Ryzen 9 7950X 4.5GHz
GeForce GTX 1660 Super (Desktop)
~ 15 fps
+ Compare
- Hide Comparison
...
NVIDIA GeForce GTX 1660 Super (Desktop)
...
» With all tested laptops playable in detail settings ultra.
Additional Benchmarks
Very Low Overall Quality (DX11) 1920x1080
162.2 [X] KFA2 GeForce GTX 1660 Super AMD Ryzen 9 7950X 4.5GHz
GeForce GTX 1660 Super (Desktop)
...
NVIDIA GeForce GTX 1660 Super (Desktop)
Intel Arc A580
...
...
NVIDIA GeForce GTX 1660 Super (Desktop)
...
...
NVIDIA GeForce GTX 1660 Super (Desktop)
...
...
NVIDIA GeForce GTX 1660 Super (Desktop)
...
...
NVIDIA GeForce GTX 1660 Super (Desktop)
...
» With all tested laptops playable in detail settings high.
Additional Benchmarks
High Quality Preset & High Ray Tracing Preset (DX12) 1920x1080
15.1 [X] AMD Ryzen 9 3900X 3.8GHz
GeForce GTX 1660 Super (Desktop)
min:
13 fps, max:
17 fps
...
NVIDIA GeForce GTX 1660 Super (Desktop)
...
...
NVIDIA GeForce GTX 1660 Super (Desktop)
...
...
NVIDIA GeForce GTX 1660 Super (Desktop)
...
...
NVIDIA GeForce GTX 1660 Super (Desktop)
...
...
NVIDIA GeForce GTX 1660 Super (Desktop)
...
...
NVIDIA GeForce GTX 1660 Super (Desktop)
...
» With all tested laptops playable in detail settings ultra.
...
NVIDIA GeForce GTX 1660 Super (Desktop)
...
...
NVIDIA GeForce GTX 1660 Super (Desktop)
...
...
NVIDIA GeForce GTX 1660 Super (Desktop)
...
...
NVIDIA GeForce GTX 1660 Super (Desktop)
...
...
NVIDIA GeForce GTX 1660 Super (Desktop)
...
...
NVIDIA GeForce GTX 1660 Super (Desktop)
...
» With all tested laptops playable in detail settings ultra.
...
NVIDIA GeForce GTX 1660 Super (Desktop)
...
Intel Arc A580
...
NVIDIA GeForce GTX 1660 Super (Desktop)
...
...
NVIDIA GeForce GTX 1660 Super (Desktop)
...
...
NVIDIA GeForce GTX 1660 Super (Desktop)
...
...
NVIDIA GeForce GTX 1660 Super (Desktop)
...
...
NVIDIA GeForce GTX 1660 Super (Desktop)
...
» With all tested laptops playable in detail settings ultra.
...
NVIDIA GeForce GTX 1660 Super (Desktop)
...
...
NVIDIA GeForce GTX 1660 Super (Desktop)
Intel Arc A580
...
...
NVIDIA GeForce GTX 1660 Super (Desktop)
...
...
NVIDIA GeForce GTX 1660 Super (Desktop)
...
...
NVIDIA GeForce GTX 1660 Super (Desktop)
...
...
NVIDIA GeForce GTX 1660 Super (Desktop)
...
» With all tested laptops playable in detail settings ultra.
...
NVIDIA GeForce GTX 1660 Super (Desktop)
...
NVIDIA GeForce GTX 1660 Super (Desktop)
...
...
NVIDIA GeForce GTX 1660 Super (Desktop)
...
...
NVIDIA GeForce GTX 1660 Super (Desktop)
...
...
NVIDIA GeForce GTX 1660 Super (Desktop)
...
...
NVIDIA GeForce GTX 1660 Super (Desktop)
...
» With all tested laptops playable in detail settings ultra.
135 [X] AMD Ryzen 9 3900X 3.8GHz
GeForce GTX 1660 Super (Desktop)
min:
103 fps, max:
193 fps
179 [X] KFA2 GeForce GTX 1660 Super AMD Ryzen 9 7900X 4.7GHz
GeForce GTX 1660 Super (Desktop)
min:
137 fps, max:
234 fps
181 [X] KFA2 GeForce GTX 1660 Super AMD Ryzen 9 7950X 4.5GHz
GeForce GTX 1660 Super (Desktop)
min:
138 fps, max:
240 fps
~ 165 fps
+ Compare
- Hide Comparison
+ 📈 Graph
- 📈 Hide Graph
0 100 200 Tooltip : Ø134.6 (103-193)
: Ø179.3 (137-234)
: Ø181.4 (138-240)
...
NVIDIA GeForce GTX 1660 Super (Desktop)
...
102 [X] AMD Ryzen 9 3900X 3.8GHz
GeForce GTX 1660 Super (Desktop)
min:
86 fps, max:
122 fps
108 [X] KFA2 GeForce GTX 1660 Super AMD Ryzen 9 7900X 4.7GHz
GeForce GTX 1660 Super (Desktop)
min:
91 fps, max:
128 fps
110 [X] KFA2 GeForce GTX 1660 Super AMD Ryzen 9 7950X 4.5GHz
GeForce GTX 1660 Super (Desktop)
min:
93 fps, max:
130 fps
~ 107 fps
+ Compare
- Hide Comparison
+ 📈 Graph
- 📈 Hide Graph
0 100 Tooltip : Ø102 (86-122)
: Ø108.3 (91-128)
: Ø110.3 (93-130)
...
NVIDIA GeForce GTX 1660 Super (Desktop)
...
96 [X] AMD Ryzen 9 3900X 3.8GHz
GeForce GTX 1660 Super (Desktop)
min:
81 fps, max:
113 fps
101 [X] KFA2 GeForce GTX 1660 Super AMD Ryzen 9 7900X 4.7GHz
GeForce GTX 1660 Super (Desktop)
min:
84 fps, max:
118 fps
103 [X] KFA2 GeForce GTX 1660 Super AMD Ryzen 9 7950X 4.5GHz
GeForce GTX 1660 Super (Desktop)
min:
85 fps, max:
120 fps
~ 100 fps
+ Compare
- Hide Comparison
+ 📈 Graph
- 📈 Hide Graph
0 100 Tooltip : Ø95.8 (81-113)
: Ø101.2 (84-118)
: Ø102.7 (85-120)
...
NVIDIA GeForce GTX 1660 Super (Desktop)
...
87 [X] AMD Ryzen 9 3900X 3.8GHz
GeForce GTX 1660 Super (Desktop)
min:
69 fps, max:
108 fps
93 [X] KFA2 GeForce GTX 1660 Super AMD Ryzen 9 7900X 4.7GHz
GeForce GTX 1660 Super (Desktop)
min:
74 fps, max:
112 fps
95 [X] KFA2 GeForce GTX 1660 Super AMD Ryzen 9 7950X 4.5GHz
GeForce GTX 1660 Super (Desktop)
min:
76 fps, max:
114 fps
~ 92 fps
+ Compare
- Hide Comparison
+ 📈 Graph
- 📈 Hide Graph
0 100 Tooltip : Ø87.1 (69-108)
: Ø93 (74-112)
: Ø94.8 (76-114)
...
NVIDIA GeForce GTX 1660 Super (Desktop)
...
65 [X] AMD Ryzen 9 3900X 3.8GHz
GeForce GTX 1660 Super (Desktop)
min:
54 fps, max:
79 fps
67 [X] KFA2 GeForce GTX 1660 Super AMD Ryzen 9 7900X 4.7GHz
GeForce GTX 1660 Super (Desktop)
min:
55 fps, max:
81 fps
68 [X] KFA2 GeForce GTX 1660 Super AMD Ryzen 9 7950X 4.5GHz
GeForce GTX 1660 Super (Desktop)
min:
56 fps, max:
82 fps
~ 67 fps
+ Compare
- Hide Comparison
+ 📈 Graph
- 📈 Hide Graph
0 Tooltip : Ø65.1 (54-79)
: Ø67 (55-81)
: Ø67.6 (56-82)
...
NVIDIA GeForce GTX 1660 Super (Desktop)
...
35 [X] AMD Ryzen 9 3900X 3.8GHz
GeForce GTX 1660 Super (Desktop)
min:
29 fps, max:
42 fps
35 [X] KFA2 GeForce GTX 1660 Super AMD Ryzen 9 7900X 4.7GHz
GeForce GTX 1660 Super (Desktop)
min:
30 fps, max:
42 fps
35 [X] KFA2 GeForce GTX 1660 Super AMD Ryzen 9 7950X 4.5GHz
GeForce GTX 1660 Super (Desktop)
min:
29 fps, max:
43 fps
~ 35 fps
+ Compare
- Hide Comparison
+ 📈 Graph
- 📈 Hide Graph
0 Tooltip : Ø34.5 (29-42)
: Ø35.2 (30-42)
: Ø35.4 (29-43)
...
NVIDIA GeForce GTX 1660 Super (Desktop)
...
» With all tested laptops playable in detail settings ultra.
128 [X] AMD Ryzen 9 3900X 3.8GHz
GeForce GTX 1660 Super (Desktop)
min:
66 fps, max:
223 fps
171.6 [X] KFA2 GeForce GTX 1660 Super AMD Ryzen 9 7900X 4.7GHz
GeForce GTX 1660 Super (Desktop)
min:
82.54 fps, max:
278.24 fps
182 [X] KFA2 GeForce GTX 1660 Super AMD Ryzen 9 7950X 4.5GHz
GeForce GTX 1660 Super (Desktop)
min:
89.81 fps, max:
309.41 fps
~ 161 fps
+ Compare
- Hide Comparison
...
NVIDIA GeForce GTX 1660 Super (Desktop)
...
56.7 [X] KFA2 GeForce GTX 1660 Super AMD Ryzen 9 7900X 4.7GHz
GeForce GTX 1660 Super (Desktop)
min:
35.03 fps, max:
64.2 fps
68 [X] AMD Ryzen 9 3900X 3.8GHz
GeForce GTX 1660 Super (Desktop)
min:
33 fps, max:
110 fps
84.3 [X] KFA2 GeForce GTX 1660 Super AMD Ryzen 9 7950X 4.5GHz
GeForce GTX 1660 Super (Desktop)
min:
40.46 fps, max:
155.91 fps
~ 70 fps
+ Compare
- Hide Comparison
...
NVIDIA GeForce GTX 1660 Super (Desktop)
...
50 [X] AMD Ryzen 9 3900X 3.8GHz
GeForce GTX 1660 Super (Desktop)
min:
27 fps, max:
79 fps
53.4 [X] KFA2 GeForce GTX 1660 Super AMD Ryzen 9 7900X 4.7GHz
GeForce GTX 1660 Super (Desktop)
min:
29.63 fps, max:
79.81 fps
60.8 [X] KFA2 GeForce GTX 1660 Super AMD Ryzen 9 7950X 4.5GHz
GeForce GTX 1660 Super (Desktop)
min:
30.92 fps, max:
104.79 fps
~ 55 fps
+ Compare
- Hide Comparison
...
NVIDIA GeForce GTX 1660 Super (Desktop)
...
41 [X] AMD Ryzen 9 3900X 3.8GHz
GeForce GTX 1660 Super (Desktop)
min:
23 fps, max:
61 fps
45.7 [X] KFA2 GeForce GTX 1660 Super AMD Ryzen 9 7900X 4.7GHz
GeForce GTX 1660 Super (Desktop)
min:
25.42 fps, max:
72.52 fps
47.5 [X] KFA2 GeForce GTX 1660 Super AMD Ryzen 9 7950X 4.5GHz
GeForce GTX 1660 Super (Desktop)
min:
26.37 fps, max:
81.72 fps
~ 45 fps
+ Compare
- Hide Comparison
...
NVIDIA GeForce GTX 1660 Super (Desktop)
...
32 [X] AMD Ryzen 9 3900X 3.8GHz
GeForce GTX 1660 Super (Desktop)
min:
19 fps, max:
47 fps
35.9 [X] KFA2 GeForce GTX 1660 Super AMD Ryzen 9 7900X 4.7GHz
GeForce GTX 1660 Super (Desktop)
min:
21.22 fps, max:
57.09 fps
36.8 [X] KFA2 GeForce GTX 1660 Super AMD Ryzen 9 7950X 4.5GHz
GeForce GTX 1660 Super (Desktop)
min:
21.82 fps, max:
56.14 fps
~ 35 fps
+ Compare
- Hide Comparison
...
NVIDIA GeForce GTX 1660 Super (Desktop)
...
21 [X] AMD Ryzen 9 3900X 3.8GHz
GeForce GTX 1660 Super (Desktop)
min:
13 fps, max:
29 fps
22 [X] KFA2 GeForce GTX 1660 Super AMD Ryzen 9 7900X 4.7GHz
GeForce GTX 1660 Super (Desktop)
min:
13.87 fps, max:
31.26 fps
22.2 [X] KFA2 GeForce GTX 1660 Super AMD Ryzen 9 7950X 4.5GHz
GeForce GTX 1660 Super (Desktop)
min:
13.97 fps, max:
31.27 fps
~ 22 fps
+ Compare
- Hide Comparison
...
NVIDIA GeForce GTX 1660 Super (Desktop)
...
» With all tested laptops playable in detail settings ultra.
...
NVIDIA GeForce GTX 1660 Super (Desktop)
...
NVIDIA GeForce GTX 1660 Super (Desktop)
...
NVIDIA GeForce GTX 1660 Super (Desktop)
...
...
NVIDIA GeForce GTX 1660 Super (Desktop)
...
...
NVIDIA GeForce GTX 1660 Super (Desktop)
...
...
NVIDIA GeForce GTX 1660 Super (Desktop)
...
» With all tested laptops playable in detail settings ultra.
...
NVIDIA GeForce GTX 1660 Super (Desktop)
...
...
NVIDIA GeForce GTX 1660 Super (Desktop)
...
...
NVIDIA GeForce GTX 1660 Super (Desktop)
...
...
NVIDIA GeForce GTX 1660 Super (Desktop)
...
...
NVIDIA GeForce GTX 1660 Super (Desktop)
...
...
NVIDIA GeForce GTX 1660 Super (Desktop)
...
» With all tested laptops playable in detail settings ultra.
...
NVIDIA GeForce GTX 1660 Super (Desktop)
...
NVIDIA GeForce GTX 1660 Super (Desktop)
...
...
NVIDIA GeForce GTX 1660 Super (Desktop)
...
...
NVIDIA GeForce GTX 1660 Super (Desktop)
...
...
NVIDIA GeForce GTX 1660 Super (Desktop)
...
...
NVIDIA GeForce GTX 1660 Super (Desktop)
...
» With all tested laptops playable in detail settings ultra.
...
NVIDIA GeForce GTX 1660 Super (Desktop)
...
...
NVIDIA GeForce GTX 1660 Super (Desktop)
...
...
NVIDIA GeForce GTX 1660 Super (Desktop)
...
...
NVIDIA GeForce GTX 1660 Super (Desktop)
...
...
NVIDIA GeForce GTX 1660 Super (Desktop)
...
...
NVIDIA GeForce GTX 1660 Super (Desktop)
...
» With all tested laptops playable in detail settings ultra.
...
NVIDIA GeForce GTX 1660 Super (Desktop)
...
NVIDIA GeForce GTX 1660 Super (Desktop)
...
...
NVIDIA GeForce GTX 1660 Super (Desktop)
...
NVIDIA GeForce GTX 1660 Super (Desktop)
...
...
NVIDIA GeForce GTX 1660 Super (Desktop)
...
...
NVIDIA GeForce GTX 1660 Super (Desktop)
...
» With all tested laptops playable in detail settings ultra.
...
NVIDIA GeForce GTX 1660 Super (Desktop)
...
NVIDIA GeForce GTX 1660 Super (Desktop)
...
NVIDIA GeForce GTX 1660 Super (Desktop)
...
NVIDIA GeForce GTX 1660 Super (Desktop)
...
...
NVIDIA GeForce GTX 1660 Super (Desktop)
...
...
NVIDIA GeForce GTX 1660 Super (Desktop)
...
» With all tested laptops playable in detail settings ultra.
...
NVIDIA GeForce GTX 1660 Super (Desktop)
Intel Arc A580
...
...
NVIDIA GeForce GTX 1660 Super (Desktop)
...
...
NVIDIA GeForce GTX 1660 Super (Desktop)
...
...
NVIDIA GeForce GTX 1660 Super (Desktop)
...
...
NVIDIA GeForce GTX 1660 Super (Desktop)
...
...
NVIDIA GeForce GTX 1660 Super (Desktop)
...
» With all tested laptops playable in detail settings ultra.
...
NVIDIA GeForce GTX 1660 Super (Desktop)
...
...
NVIDIA GeForce GTX 1660 Super (Desktop)
...
...
NVIDIA GeForce GTX 1660 Super (Desktop)
...
...
NVIDIA GeForce GTX 1660 Super (Desktop)
...
...
Intel Arc A580
NVIDIA GeForce GTX 1660 Super (Desktop)
...
...
NVIDIA GeForce GTX 1660 Super (Desktop)
Intel Arc A580
...
» With all tested laptops playable in detail settings ultra.
149 [X] AMD Ryzen 9 3900X 3.8GHz
GeForce GTX 1660 Super (Desktop)
254 [X] KFA2 GeForce GTX 1660 Super AMD Ryzen 9 7950X 4.5GHz
GeForce GTX 1660 Super (Desktop)
max:
443.1 fps
258 [X] KFA2 GeForce GTX 1660 Super AMD Ryzen 9 7900X 4.7GHz
GeForce GTX 1660 Super (Desktop)
max:
437.1 fps
~ 220 fps
+ Compare
- Hide Comparison
...
NVIDIA GeForce GTX 1660 Super (Desktop)
...
100 [X] AMD Ryzen 9 3900X 3.8GHz
GeForce GTX 1660 Super (Desktop)
101.6 [X] KFA2 GeForce GTX 1660 Super AMD Ryzen 9 7950X 4.5GHz
GeForce GTX 1660 Super (Desktop)
max:
182 fps
104.4 [X] KFA2 GeForce GTX 1660 Super AMD Ryzen 9 7900X 4.7GHz
GeForce GTX 1660 Super (Desktop)
max:
173.7 fps
~ 102 fps
+ Compare
- Hide Comparison
...
NVIDIA GeForce GTX 1660 Super (Desktop)
...
89 [X] AMD Ryzen 9 3900X 3.8GHz
GeForce GTX 1660 Super (Desktop)
89.4 [X] KFA2 GeForce GTX 1660 Super AMD Ryzen 9 7950X 4.5GHz
GeForce GTX 1660 Super (Desktop)
max:
156.7 fps
92.2 [X] KFA2 GeForce GTX 1660 Super AMD Ryzen 9 7900X 4.7GHz
GeForce GTX 1660 Super (Desktop)
max:
145.2 fps
~ 90 fps
+ Compare
- Hide Comparison
...
NVIDIA GeForce GTX 1660 Super (Desktop)
...
80 [X] AMD Ryzen 9 3900X 3.8GHz
GeForce GTX 1660 Super (Desktop)
82.3 [X] KFA2 GeForce GTX 1660 Super AMD Ryzen 9 7950X 4.5GHz
GeForce GTX 1660 Super (Desktop)
max:
133.7 fps
83 [X] KFA2 GeForce GTX 1660 Super AMD Ryzen 9 7900X 4.7GHz
GeForce GTX 1660 Super (Desktop)
max:
134.9 fps
~ 82 fps
+ Compare
- Hide Comparison
...
NVIDIA GeForce GTX 1660 Super (Desktop)
...
53 [X] AMD Ryzen 9 3900X 3.8GHz
GeForce GTX 1660 Super (Desktop)
53.1 [X] KFA2 GeForce GTX 1660 Super AMD Ryzen 9 7950X 4.5GHz
GeForce GTX 1660 Super (Desktop)
max:
86.9 fps
54.9 [X] KFA2 GeForce GTX 1660 Super AMD Ryzen 9 7900X 4.7GHz
GeForce GTX 1660 Super (Desktop)
max:
84.7 fps
~ 54 fps
+ Compare
- Hide Comparison
...
NVIDIA GeForce GTX 1660 Super (Desktop)
...
26 [X] AMD Ryzen 9 3900X 3.8GHz
GeForce GTX 1660 Super (Desktop)
26.9 [X] KFA2 GeForce GTX 1660 Super AMD Ryzen 9 7950X 4.5GHz
GeForce GTX 1660 Super (Desktop)
max:
39.4 fps
27.6 [X] KFA2 GeForce GTX 1660 Super AMD Ryzen 9 7900X 4.7GHz
GeForce GTX 1660 Super (Desktop)
max:
67.9 fps
~ 27 fps
+ Compare
- Hide Comparison
...
NVIDIA GeForce GTX 1660 Super (Desktop)
...
» With all tested laptops playable in detail settings ultra.
Additional Benchmarks
Lowest Preset 1920x1080
173 [X] KFA2 GeForce GTX 1660 Super AMD Ryzen 9 7950X 4.5GHz
GeForce GTX 1660 Super (Desktop)
max:
276.5 fps
375 [X] 1.47.22.14 D3D12
AMD Ryzen 9 3900X 3.8GHz
GeForce GTX 1660 Super (Desktop)
min:
240 fps, P1:
309 fps, max:
497 fps
395 [X] KFA2 GeForce GTX 1660 Super 1.47.22.14 D3D12
AMD Ryzen 9 7900X 4.7GHz
GeForce GTX 1660 Super (Desktop)
min:
55 fps, P1:
340 fps, max:
797 fps
417 [X] KFA2 GeForce GTX 1660 Super 1.47.22.14 D3D12
AMD Ryzen 9 7950X 4.5GHz
GeForce GTX 1660 Super (Desktop)
min:
60.4 fps, P1:
358 fps, max:
714 fps
~ 396 fps
+ Compare
- Hide Comparison
...
NVIDIA GeForce GTX 1660 Super (Desktop)
...
157 [X] 1.47.22.14 D3D12
AMD Ryzen 9 3900X 3.8GHz
GeForce GTX 1660 Super (Desktop)
min:
134 fps, P1:
137 fps, max:
195 fps
162.6 [X] KFA2 GeForce GTX 1660 Super 1.47.22.14 D3D12
AMD Ryzen 9 7900X 4.7GHz
GeForce GTX 1660 Super (Desktop)
min:
59.3 fps, P1:
143.2 fps, max:
521 fps
165.8 [X] KFA2 GeForce GTX 1660 Super 1.47.22.14 D3D12
AMD Ryzen 9 7950X 4.5GHz
GeForce GTX 1660 Super (Desktop)
min:
51.6 fps, P1:
145.4 fps, max:
550 fps
~ 162 fps
+ Compare
- Hide Comparison
...
NVIDIA GeForce GTX 1660 Super (Desktop)
...
123 [X] 1.47.22.14 D3D12
AMD Ryzen 9 3900X 3.8GHz
GeForce GTX 1660 Super (Desktop)
min:
86.1 fps, P1:
94.2 fps, max:
225 fps
129.2 [X] KFA2 GeForce GTX 1660 Super 1.47.22.14 D3D12
AMD Ryzen 9 7900X 4.7GHz
GeForce GTX 1660 Super (Desktop)
min:
45.2 fps, P1:
99.7 fps, max:
494 fps
131.9 [X] KFA2 GeForce GTX 1660 Super 1.47.22.14 D3D12
AMD Ryzen 9 7950X 4.5GHz
GeForce GTX 1660 Super (Desktop)
min:
49.2 fps, P1:
102 fps, max:
568 fps
~ 128 fps
+ Compare
- Hide Comparison
...
NVIDIA GeForce GTX 1660 Super (Desktop)
...
104 [X] 1.47.22.14 D3D12
AMD Ryzen 9 3900X 3.8GHz
GeForce GTX 1660 Super (Desktop)
min:
80.5 fps, P1:
82 fps, max:
138 fps
111.8 [X] KFA2 GeForce GTX 1660 Super 1.47.22.14 D3D12
AMD Ryzen 9 7900X 4.7GHz
GeForce GTX 1660 Super (Desktop)
min:
56.1 fps, P1:
87 fps, max:
593 fps
114.3 [X] KFA2 GeForce GTX 1660 Super 1.47.22.14 D3D12
AMD Ryzen 9 7950X 4.5GHz
GeForce GTX 1660 Super (Desktop)
min:
50.7 fps, P1:
89.2 fps, max:
482 fps
~ 110 fps
+ Compare
- Hide Comparison
...
NVIDIA GeForce GTX 1660 Super (Desktop)
...
75.7 [X] 1.47.22.14 D3D12
AMD Ryzen 9 3900X 3.8GHz
GeForce GTX 1660 Super (Desktop)
min:
62.3 fps, P1:
63.5 fps, max:
99.6 fps
80.2 [X] KFA2 GeForce GTX 1660 Super 1.47.22.14 D3D12
AMD Ryzen 9 7900X 4.7GHz
GeForce GTX 1660 Super (Desktop)
min:
37.5 fps, P1:
66.4 fps, max:
534 fps
81.1 [X] KFA2 GeForce GTX 1660 Super 1.47.22.14 D3D12
AMD Ryzen 9 7950X 4.5GHz
GeForce GTX 1660 Super (Desktop)
min:
25.6 fps, P1:
67.6 fps, max:
550 fps
~ 79 fps
+ Compare
- Hide Comparison
...
NVIDIA GeForce GTX 1660 Super (Desktop)
...
43.1 [X] 1.47.22.14 D3D12
AMD Ryzen 9 3900X 3.8GHz
GeForce GTX 1660 Super (Desktop)
min:
36.9 fps, P1:
37.5 fps, max:
55.3 fps
44.3 [X] KFA2 GeForce GTX 1660 Super 1.47.22.14 D3D12
AMD Ryzen 9 7900X 4.7GHz
GeForce GTX 1660 Super (Desktop)
min:
26.2 fps, P1:
38.5 fps, max:
448 fps
44.7 [X] KFA2 GeForce GTX 1660 Super 1.47.22.14 D3D12
AMD Ryzen 9 7950X 4.5GHz
GeForce GTX 1660 Super (Desktop)
min:
36.1 fps, P1:
39.2 fps, max:
101.8 fps
~ 44 fps
+ Compare
- Hide Comparison
...
NVIDIA GeForce GTX 1660 Super (Desktop)
...
» With all tested laptops playable in detail settings ultra.
...
NVIDIA GeForce GTX 1660 Super (Desktop)
...
NVIDIA GeForce GTX 1660 Super (Desktop)
...
...
NVIDIA GeForce GTX 1660 Super (Desktop)
...
...
NVIDIA GeForce GTX 1660 Super (Desktop)
...
...
NVIDIA GeForce GTX 1660 Super (Desktop)
...
...
NVIDIA GeForce GTX 1660 Super (Desktop)
...
» With all tested laptops playable in detail settings ultra.
149 [X] AMD Ryzen 9 3900X 3.8GHz
GeForce GTX 1660 Super (Desktop)
min:
110 fps, max:
191 fps
206 [X] KFA2 GeForce GTX 1660 Super AMD Ryzen 9 7900X 4.7GHz
GeForce GTX 1660 Super (Desktop)
min:
175 fps, max:
235 fps
212 [X] KFA2 GeForce GTX 1660 Super AMD Ryzen 9 7950X 4.5GHz
GeForce GTX 1660 Super (Desktop)
min:
177 fps, max:
239 fps
~ 189 fps
+ Compare
- Hide Comparison
+ 📈 Graph
- 📈 Hide Graph
0 100 200 Tooltip : Ø148.7 (110-191)
: Ø206 (175-235)
: Ø212 (177-239)
...
NVIDIA GeForce GTX 1660 Super (Desktop)
Intel Arc A580
...
105 [X] AMD Ryzen 9 3900X 3.8GHz
GeForce GTX 1660 Super (Desktop)
min:
88 fps, max:
117 fps
112 [X] KFA2 GeForce GTX 1660 Super AMD Ryzen 9 7900X 4.7GHz
GeForce GTX 1660 Super (Desktop)
min:
97 fps, max:
132 fps
114 [X] KFA2 GeForce GTX 1660 Super AMD Ryzen 9 7950X 4.5GHz
GeForce GTX 1660 Super (Desktop)
min:
98 fps, max:
132 fps
~ 110 fps
+ Compare
- Hide Comparison
+ 📈 Graph
- 📈 Hide Graph
0 100 Tooltip : Ø104.5 (88-117)
: Ø112.4 (97-132)
: Ø114 (98-132)
...
NVIDIA GeForce GTX 1660 Super (Desktop)
...
98 [X] AMD Ryzen 9 3900X 3.8GHz
GeForce GTX 1660 Super (Desktop)
min:
85 fps, max:
115 fps
103 [X] KFA2 GeForce GTX 1660 Super AMD Ryzen 9 7900X 4.7GHz
GeForce GTX 1660 Super (Desktop)
min:
90 fps, max:
122 fps
104 [X] KFA2 GeForce GTX 1660 Super AMD Ryzen 9 7950X 4.5GHz
GeForce GTX 1660 Super (Desktop)
min:
91 fps, max:
124 fps
~ 102 fps
+ Compare
- Hide Comparison
+ 📈 Graph
- 📈 Hide Graph
0 100 Tooltip : Ø98.4 (85-115)
: Ø102.8 (90-122)
: Ø104.4 (91-124)
...
NVIDIA GeForce GTX 1660 Super (Desktop)
...
92 [X] AMD Ryzen 9 3900X 3.8GHz
GeForce GTX 1660 Super (Desktop)
min:
83 fps, max:
104 fps
95 [X] KFA2 GeForce GTX 1660 Super AMD Ryzen 9 7900X 4.7GHz
GeForce GTX 1660 Super (Desktop)
min:
81 fps, max:
109 fps
97 [X] KFA2 GeForce GTX 1660 Super AMD Ryzen 9 7950X 4.5GHz
GeForce GTX 1660 Super (Desktop)
min:
86 fps, max:
112 fps
~ 95 fps
+ Compare
- Hide Comparison
+ 📈 Graph
- 📈 Hide Graph
0 100 Tooltip : Ø92.4 (83-104)
: Ø94.7 (81-109)
: Ø97 (86-112)
...
NVIDIA GeForce GTX 1660 Super (Desktop)
...
64 [X] AMD Ryzen 9 3900X 3.8GHz
GeForce GTX 1660 Super (Desktop)
min:
57 fps, max:
75 fps
65 [X] KFA2 GeForce GTX 1660 Super AMD Ryzen 9 7900X 4.7GHz
GeForce GTX 1660 Super (Desktop)
min:
57 fps, max:
77 fps
66 [X] KFA2 GeForce GTX 1660 Super AMD Ryzen 9 7950X 4.5GHz
GeForce GTX 1660 Super (Desktop)
min:
57 fps, max:
79 fps
~ 65 fps
+ Compare
- Hide Comparison
+ 📈 Graph
- 📈 Hide Graph
0 Tooltip : Ø63.8 (57-75)
: Ø65 (57-77)
: Ø65.9 (57-79)
...
NVIDIA GeForce GTX 1660 Super (Desktop)
...
33 [X] AMD Ryzen 9 3900X 3.8GHz
GeForce GTX 1660 Super (Desktop)
min:
29 fps, max:
40 fps
33 [X] KFA2 GeForce GTX 1660 Super AMD Ryzen 9 7900X 4.7GHz
GeForce GTX 1660 Super (Desktop)
min:
29 fps, max:
41 fps
33 [X] KFA2 GeForce GTX 1660 Super AMD Ryzen 9 7950X 4.5GHz
GeForce GTX 1660 Super (Desktop)
min:
28 fps, max:
41 fps
~ 33 fps
+ Compare
- Hide Comparison
+ 📈 Graph
- 📈 Hide Graph
0 Tooltip : Ø32.9 (29-40)
: Ø33.2 (29-41)
: Ø33.3 (28-41)
...
NVIDIA GeForce GTX 1660 Super (Desktop)
...
» With all tested laptops playable in detail settings ultra.
Additional Benchmarks
Low Preset TAA 1920x1080
130 [X] KFA2 GeForce GTX 1660 Super AMD Ryzen 9 7950X 4.5GHz
GeForce GTX 1660 Super (Desktop)
min:
107 fps, max:
149 fps
130 [X] AMD Ryzen 9 3900X 3.8GHz
GeForce GTX 1660 Super (Desktop)
225 [X] KFA2 GeForce GTX 1660 Super AMD Ryzen 9 7950X 4.5GHz
GeForce GTX 1660 Super (Desktop)
229 [X] KFA2 GeForce GTX 1660 Super AMD Ryzen 9 7900X 4.7GHz
GeForce GTX 1660 Super (Desktop)
~ 195 fps
+ Compare
- Hide Comparison
...
NVIDIA GeForce GTX 1660 Super (Desktop)
...
116 [X] AMD Ryzen 9 3900X 3.8GHz
GeForce GTX 1660 Super (Desktop)
197.3 [X] KFA2 GeForce GTX 1660 Super AMD Ryzen 9 7950X 4.5GHz
GeForce GTX 1660 Super (Desktop)
203 [X] KFA2 GeForce GTX 1660 Super AMD Ryzen 9 7900X 4.7GHz
GeForce GTX 1660 Super (Desktop)
~ 172 fps
+ Compare
- Hide Comparison
...
NVIDIA GeForce GTX 1660 Super (Desktop)
...
94 [X] AMD Ryzen 9 3900X 3.8GHz
GeForce GTX 1660 Super (Desktop)
147.4 [X] KFA2 GeForce GTX 1660 Super AMD Ryzen 9 7950X 4.5GHz
GeForce GTX 1660 Super (Desktop)
154.4 [X] KFA2 GeForce GTX 1660 Super AMD Ryzen 9 7900X 4.7GHz
GeForce GTX 1660 Super (Desktop)
~ 132 fps
+ Compare
- Hide Comparison
...
NVIDIA GeForce GTX 1660 Super (Desktop)
...
80 [X] AMD Ryzen 9 3900X 3.8GHz
GeForce GTX 1660 Super (Desktop)
108.9 [X] KFA2 GeForce GTX 1660 Super AMD Ryzen 9 7900X 4.7GHz
GeForce GTX 1660 Super (Desktop)
109.3 [X] KFA2 GeForce GTX 1660 Super AMD Ryzen 9 7950X 4.5GHz
GeForce GTX 1660 Super (Desktop)
~ 99 fps
+ Compare
- Hide Comparison
...
NVIDIA GeForce GTX 1660 Super (Desktop)
...
» With all tested laptops playable in detail settings high.
23.4 [X] KFA2 GeForce GTX 1660 Super 1.3
AMD Ryzen 9 7900X 4.7GHz
GeForce GTX 1660 Super (Desktop)
179 [X] KFA2 GeForce GTX 1660 Super 1.3
AMD Ryzen 9 7950X 4.5GHz
GeForce GTX 1660 Super (Desktop)
~ 101 fps
+ Compare
- Hide Comparison
...
NVIDIA GeForce GTX 1660 Super (Desktop)
...
90.4 [X] KFA2 GeForce GTX 1660 Super 1.3
AMD Ryzen 9 7900X 4.7GHz
GeForce GTX 1660 Super (Desktop)
90.4 [X] KFA2 GeForce GTX 1660 Super 1.3
AMD Ryzen 9 7950X 4.5GHz
GeForce GTX 1660 Super (Desktop)
~ 90 fps
+ Compare
- Hide Comparison
...
NVIDIA GeForce GTX 1660 Super (Desktop)
...
64.4 [X] KFA2 GeForce GTX 1660 Super 1.3
AMD Ryzen 9 7950X 4.5GHz
GeForce GTX 1660 Super (Desktop)
90.4 [X] KFA2 GeForce GTX 1660 Super 1.3
AMD Ryzen 9 7900X 4.7GHz
GeForce GTX 1660 Super (Desktop)
~ 77 fps
+ Compare
- Hide Comparison
...
NVIDIA GeForce GTX 1660 Super (Desktop)
...
47.2 [X] KFA2 GeForce GTX 1660 Super 1.3
AMD Ryzen 9 7950X 4.5GHz
GeForce GTX 1660 Super (Desktop)
90.4 [X] KFA2 GeForce GTX 1660 Super 1.3
AMD Ryzen 9 7900X 4.7GHz
GeForce GTX 1660 Super (Desktop)
~ 69 fps
+ Compare
- Hide Comparison
...
NVIDIA GeForce GTX 1660 Super (Desktop)
...
26.3 [X] KFA2 GeForce GTX 1660 Super 1.3
AMD Ryzen 9 7950X 4.5GHz
GeForce GTX 1660 Super (Desktop)
90.4 [X] KFA2 GeForce GTX 1660 Super 1.3
AMD Ryzen 9 7900X 4.7GHz
GeForce GTX 1660 Super (Desktop)
~ 58 fps
+ Compare
- Hide Comparison
...
NVIDIA GeForce GTX 1660 Super (Desktop)
...
» With all tested laptops playable in detail settings high.
...
NVIDIA GeForce GTX 1660 Super (Desktop)
...
...
Intel Arc A580
NVIDIA GeForce GTX 1660 Super (Desktop)
...
...
Intel Arc A580
NVIDIA GeForce GTX 1660 Super (Desktop)
...
...
Intel Arc A580
NVIDIA GeForce GTX 1660 Super (Desktop)
...
...
NVIDIA GeForce GTX 1660 Super (Desktop)
Intel Arc A580
...
...
NVIDIA GeForce GTX 1660 Super (Desktop)
...
» With all tested laptops playable in detail settings ultra.
...
NVIDIA GeForce GTX 1660 Super (Desktop)
...
NVIDIA GeForce GTX 1660 Super (Desktop)
...
...
NVIDIA GeForce GTX 1660 Super (Desktop)
...
...
NVIDIA GeForce GTX 1660 Super (Desktop)
...
» With all tested laptops playable in detail settings ultra.
Additional Benchmarks
Medium Preset 1366x768
151 [X] AMD Ryzen 9 3900X 3.8GHz
GeForce GTX 1660 Super (Desktop)
min:
131 fps, max:
173 fps
...
NVIDIA GeForce GTX 1660 Super (Desktop)
...
...
NVIDIA GeForce GTX 1660 Super (Desktop)
...
...
NVIDIA GeForce GTX 1660 Super (Desktop)
...
NVIDIA GeForce GTX 1660 Super (Desktop)
...
NVIDIA GeForce GTX 1660 Super (Desktop)
...
» With all tested laptops playable in detail settings high.
Additional Benchmarks
Performance 1920x1080
250 [X] AMD Ryzen 9 3900X 3.8GHz
GeForce GTX 1660 Super (Desktop)
min:
225 fps, max:
252 fps
...
NVIDIA GeForce GTX 1660 Super (Desktop)
...
NVIDIA GeForce GTX 1660 Super (Desktop)
...
...
NVIDIA GeForce GTX 1660 Super (Desktop)
...
...
NVIDIA GeForce GTX 1660 Super (Desktop)
...
...
NVIDIA GeForce GTX 1660 Super (Desktop)
...
» With all tested laptops playable in detail settings ultra.
Additional Benchmarks
Medium Preset FXAA 1366x768
117 [X] AMD Ryzen 9 3900X 3.8GHz
GeForce GTX 1660 Super (Desktop)
min:
105 fps, max:
129 fps
Ultra Preset 16xAF TAA 3840x2160
22 [X] AMD Ryzen 9 3900X 3.8GHz
GeForce GTX 1660 Super (Desktop)
min:
18 fps, max:
26 fps
...
NVIDIA GeForce GTX 1660 Super (Desktop)
...
NVIDIA GeForce GTX 1660 Super (Desktop)
...
...
NVIDIA GeForce GTX 1660 Super (Desktop)
...
...
NVIDIA GeForce GTX 1660 Super (Desktop)
...
...
NVIDIA GeForce GTX 1660 Super (Desktop)
...
» With all tested laptops playable in detail settings ultra.
Additional Benchmarks
Medium Preset 4xAF TAA 1366x768
218 [X] AMD Ryzen 9 3900X 3.8GHz
GeForce GTX 1660 Super (Desktop)
min:
153 fps, max:
278 fps
Extreme Preset 16xAF TAA 3840x2160
34 [X] AMD Ryzen 9 3900X 3.8GHz
GeForce GTX 1660 Super (Desktop)
min:
27 fps, max:
42 fps
...
NVIDIA GeForce GTX 1660 Super (Desktop)
...
...
NVIDIA GeForce GTX 1660 Super (Desktop)
...
NVIDIA GeForce GTX 1660 Super (Desktop)
...
NVIDIA GeForce GTX 1660 Super (Desktop)
...
...
NVIDIA GeForce GTX 1660 Super (Desktop)
...
» With all tested laptops playable in detail settings ultra.
Additional Benchmarks
Low Preset 1920x1080
124 [X] AMD Ryzen 9 3900X 3.8GHz
GeForce GTX 1660 Super (Desktop)
min:
101 fps, max:
142 fps
Ultra Preset + HD Textures SMAA 3840x2160
34 [X] AMD Ryzen 9 3900X 3.8GHz
GeForce GTX 1660 Super (Desktop)
min:
30 fps, max:
39 fps
...
NVIDIA GeForce GTX 1660 Super (Desktop)
...
...
NVIDIA GeForce GTX 1660 Super (Desktop)
...
...
NVIDIA GeForce GTX 1660 Super (Desktop)
...
...
NVIDIA GeForce GTX 1660 Super (Desktop)
...
...
NVIDIA GeForce GTX 1660 Super (Desktop)
...
» With all tested laptops playable in detail settings ultra.
161.3 [X] AMD Ryzen 9 3900X 3.8GHz
GeForce GTX 1660 Super (Desktop)
min:
142.1 fps
287.4 [X] KFA2 GeForce GTX 1660 Super AMD Ryzen 9 7950X 4.5GHz
GeForce GTX 1660 Super (Desktop)
min:
246 fps, max:
-1 fps
290 [X] KFA2 GeForce GTX 1660 Super AMD Ryzen 9 7900X 4.7GHz
GeForce GTX 1660 Super (Desktop)
min:
244.4 fps, max:
-1 fps
~ 246 fps
+ Compare
- Hide Comparison
...
NVIDIA GeForce GTX 1660 Super (Desktop)
...
147 [X] AMD Ryzen 9 3900X 3.8GHz
GeForce GTX 1660 Super (Desktop)
min:
126.4 fps
252 [X] KFA2 GeForce GTX 1660 Super AMD Ryzen 9 7900X 4.7GHz
GeForce GTX 1660 Super (Desktop)
min:
214.2 fps, max:
-1 fps
255.3 [X] KFA2 GeForce GTX 1660 Super AMD Ryzen 9 7950X 4.5GHz
GeForce GTX 1660 Super (Desktop)
min:
223.5 fps, max:
-1 fps
~ 218 fps
+ Compare
- Hide Comparison
...
NVIDIA GeForce GTX 1660 Super (Desktop)
...
146.6 [X] AMD Ryzen 9 3900X 3.8GHz
GeForce GTX 1660 Super (Desktop)
min:
126.4 fps
231 [X] KFA2 GeForce GTX 1660 Super AMD Ryzen 9 7900X 4.7GHz
GeForce GTX 1660 Super (Desktop)
min:
194.2 fps, max:
-1 fps
236.6 [X] KFA2 GeForce GTX 1660 Super AMD Ryzen 9 7950X 4.5GHz
GeForce GTX 1660 Super (Desktop)
min:
202.8 fps, max:
-1 fps
~ 205 fps
+ Compare
- Hide Comparison
...
NVIDIA GeForce GTX 1660 Super (Desktop)
...
140 [X] AMD Ryzen 9 3900X 3.8GHz
GeForce GTX 1660 Super (Desktop)
min:
118.2 fps
210.9 [X] KFA2 GeForce GTX 1660 Super AMD Ryzen 9 7950X 4.5GHz
GeForce GTX 1660 Super (Desktop)
min:
173.2 fps, max:
-1 fps
212.7 [X] KFA2 GeForce GTX 1660 Super AMD Ryzen 9 7900X 4.7GHz
GeForce GTX 1660 Super (Desktop)
min:
176.9 fps, max:
-1 fps
~ 188 fps
+ Compare
- Hide Comparison
...
NVIDIA GeForce GTX 1660 Super (Desktop)
...
91.7 [X] AMD Ryzen 9 3900X 3.8GHz
GeForce GTX 1660 Super (Desktop)
min:
82.9 fps
94.9 [X] KFA2 GeForce GTX 1660 Super AMD Ryzen 9 7900X 4.7GHz
GeForce GTX 1660 Super (Desktop)
min:
86.7 fps, max:
-1 fps
95.2 [X] KFA2 GeForce GTX 1660 Super AMD Ryzen 9 7950X 4.5GHz
GeForce GTX 1660 Super (Desktop)
min:
87.4 fps, max:
-1 fps
~ 94 fps
+ Compare
- Hide Comparison
...
Intel Arc A580
NVIDIA GeForce GTX 1660 Super (Desktop)
...
» With all tested laptops playable in detail settings ultra.
294 [X] AMD Ryzen 9 3900X 3.8GHz
GeForce GTX 1660 Super (Desktop)
min:
266 fps, max:
319 fps
326 [X] KFA2 GeForce GTX 1660 Super AMD Ryzen 9 7900X 4.7GHz
GeForce GTX 1660 Super (Desktop)
min:
23.4 fps, P0.1:
169 fps, P1:
266 fps, max:
843 fps
338 [X] KFA2 GeForce GTX 1660 Super AMD Ryzen 9 7950X 4.5GHz
GeForce GTX 1660 Super (Desktop)
min:
24.4 fps, P0.1:
126.1 fps, P1:
277 fps, max:
940 fps
~ 319 fps
+ Compare
- Hide Comparison
+ 📈 Graph
- 📈 Hide Graph
0 100 200 300 Tooltip : Ø328 (310.262-355.08)
: Ø345 (320.135-394.1)
...
NVIDIA GeForce GTX 1660 Super (Desktop)
...
193 [X] AMD Ryzen 9 3900X 3.8GHz
GeForce GTX 1660 Super (Desktop)
min:
177 fps, max:
213 fps
207 [X] KFA2 GeForce GTX 1660 Super AMD Ryzen 9 7900X 4.7GHz
GeForce GTX 1660 Super (Desktop)
min:
67.5 fps, P0.1:
130 fps, P1:
177.7 fps, max:
711 fps
215 [X] KFA2 GeForce GTX 1660 Super AMD Ryzen 9 7950X 4.5GHz
GeForce GTX 1660 Super (Desktop)
min:
14.6 fps, P0.1:
122.9 fps, P1:
182.2 fps, max:
727 fps
~ 205 fps
+ Compare
- Hide Comparison
+ 📈 Graph
- 📈 Hide Graph
0 100 200 300 400 Tooltip : Ø211 (195.11-243.1)
: Ø223 (195.014-467)
...
NVIDIA GeForce GTX 1660 Super (Desktop)
...
109 [X] AMD Ryzen 9 3900X 3.8GHz
GeForce GTX 1660 Super (Desktop)
min:
98 fps, max:
121 fps
113.3 [X] KFA2 GeForce GTX 1660 Super AMD Ryzen 9 7900X 4.7GHz
GeForce GTX 1660 Super (Desktop)
min:
76.4 fps, P0.1:
83.3 fps, P1:
97.6 fps, max:
252 fps
116.1 [X] KFA2 GeForce GTX 1660 Super AMD Ryzen 9 7950X 4.5GHz
GeForce GTX 1660 Super (Desktop)
min:
14.9 fps, P0.1:
77.1 fps, P1:
98.8 fps, max:
551 fps
~ 113 fps
+ Compare
- Hide Comparison
+ 📈 Graph
- 📈 Hide Graph
0 100 200 Tooltip : Ø117.8 (103.251-233.8)
: Ø119.3 (103.041-139.5)
...
NVIDIA GeForce GTX 1660 Super (Desktop)
...
59.5 [X] AMD Ryzen 9 3900X 3.8GHz
GeForce GTX 1660 Super (Desktop)
min:
53 fps, max:
68 fps
61.3 [X] KFA2 GeForce GTX 1660 Super AMD Ryzen 9 7900X 4.7GHz
GeForce GTX 1660 Super (Desktop)
min:
30 fps, P0.1:
46.7 fps, P1:
52.5 fps, max:
360 fps
63.3 [X] KFA2 GeForce GTX 1660 Super AMD Ryzen 9 7950X 4.5GHz
GeForce GTX 1660 Super (Desktop)
min:
35.8 fps, P0.1:
48.6 fps, P1:
54.4 fps, max:
139.1 fps
~ 61 fps
+ Compare
- Hide Comparison
+ 📈 Graph
- 📈 Hide Graph
0 100 200 300 400 500 600 Tooltip : Ø59.8 (57-62)
: Ø74.8 (54.688-617)
: Ø72.3 (56.308-431)
...
NVIDIA GeForce GTX 1660 Super (Desktop)
...
40 [X] AMD Ryzen 9 3900X 3.8GHz
GeForce GTX 1660 Super (Desktop)
min:
36 fps, max:
44 fps
40.1 [X] KFA2 GeForce GTX 1660 Super AMD Ryzen 9 7900X 4.7GHz
GeForce GTX 1660 Super (Desktop)
min:
28.8 fps, P0.1:
33.6 fps, P1:
36.2 fps, max:
68.4 fps
40.9 [X] KFA2 GeForce GTX 1660 Super AMD Ryzen 9 7950X 4.5GHz
GeForce GTX 1660 Super (Desktop)
min:
32.9 fps, P0.1:
34.5 fps, P1:
36.6 fps, max:
52.7 fps
~ 40 fps
+ Compare
- Hide Comparison
+ 📈 Graph
- 📈 Hide Graph
0 100 200 300 400 500 600 700 800 900 1000 1100 1200 1300 1400 1500 1600 1700 1800 1900 2000 2100 2200 2300 2400 2500 2600 2700 2800 2900 3000 3100 3200 3300 3400 3500 3600 3700 3800 3900 4000 4100 4200 4300 4400 4500 4600 4700 4800 4900 5000 5100 5200 5300 5400 5500 5600 5700 5800 5900 6000 6100 6200 6300 6400 Tooltip : Ø42.5 (37.425-75.7)
: Ø163 (38.046-6407)
...
NVIDIA GeForce GTX 1660 Super (Desktop)
...
» With all tested laptops playable in detail settings ultra.
Additional Benchmarks
Ultra Graphics & Postprocessing (HBAO+) 3840x2160
27 [X] AMD Ryzen 9 3900X 3.8GHz
GeForce GTX 1660 Super (Desktop)
min:
24 fps, max:
31 fps
28.1 [X] KFA2 GeForce GTX 1660 Super AMD Ryzen 9 7950X 4.5GHz
GeForce GTX 1660 Super (Desktop)
min:
14.3 fps, P0.1:
15.5 fps, P1:
25.2 fps, max:
343 fps
Medium Graphics & Postprocessing 1920x1080
143.1 [X] KFA2 GeForce GTX 1660 Super AMD Ryzen 9 7950X 4.5GHz
GeForce GTX 1660 Super (Desktop)
min:
30.8 fps, P0.1:
98.3 fps, P1:
122.4 fps, max:
690 fps
183 [X] AMD Ryzen 9 3900X 3.8GHz
GeForce GTX 1660 Super (Desktop)
min:
2.64 fps, P1:
143 fps, max:
376 fps
187.5 [X] KFA2 GeForce GTX 1660 Super AMD Ryzen 9 7900X 4.7GHz
GeForce GTX 1660 Super (Desktop)
min:
22.2 fps, P1:
200 fps, max:
640 fps
188.3 [X] KFA2 GeForce GTX 1660 Super AMD Ryzen 9 7950X 4.5GHz
GeForce GTX 1660 Super (Desktop)
min:
7.56 fps, P1:
200 fps, max:
782 fps
~ 186 fps
+ Compare
- Hide Comparison
...
NVIDIA GeForce GTX 1660 Super (Desktop)
...
176 [X] AMD Ryzen 9 3900X 3.8GHz
GeForce GTX 1660 Super (Desktop)
min:
3.25 fps, P1:
143 fps, max:
272 fps
187.5 [X] KFA2 GeForce GTX 1660 Super AMD Ryzen 9 7900X 4.7GHz
GeForce GTX 1660 Super (Desktop)
min:
20.3 fps, P1:
200 fps, max:
271 fps
188 [X] KFA2 GeForce GTX 1660 Super AMD Ryzen 9 7950X 4.5GHz
GeForce GTX 1660 Super (Desktop)
min:
7.77 fps, P1:
200 fps, max:
668 fps
~ 184 fps
+ Compare
- Hide Comparison
...
NVIDIA GeForce GTX 1660 Super (Desktop)
...
156 [X] AMD Ryzen 9 3900X 3.8GHz
GeForce GTX 1660 Super (Desktop)
min:
4.95 fps, P1:
111 fps, max:
292 fps
177.7 [X] KFA2 GeForce GTX 1660 Super AMD Ryzen 9 7900X 4.7GHz
GeForce GTX 1660 Super (Desktop)
min:
7.68 fps, P1:
125 fps, max:
395 fps
180.3 [X] KFA2 GeForce GTX 1660 Super AMD Ryzen 9 7950X 4.5GHz
GeForce GTX 1660 Super (Desktop)
min:
2.43 fps, P1:
125 fps, max:
602 fps
~ 171 fps
+ Compare
- Hide Comparison
...
NVIDIA GeForce GTX 1660 Super (Desktop)
...
80 [X] AMD Ryzen 9 3900X 3.8GHz
GeForce GTX 1660 Super (Desktop)
min:
3.89 fps, P1:
50 fps, max:
148 fps
88.3 [X] KFA2 GeForce GTX 1660 Super AMD Ryzen 9 7900X 4.7GHz
GeForce GTX 1660 Super (Desktop)
min:
4.54 fps, P1:
62.5 fps, max:
172.7 fps
88.3 [X] KFA2 GeForce GTX 1660 Super AMD Ryzen 9 7950X 4.5GHz
GeForce GTX 1660 Super (Desktop)
min:
2.06 fps, P1:
58.8 fps, max:
185.9 fps
~ 86 fps
+ Compare
- Hide Comparison
...
NVIDIA GeForce GTX 1660 Super (Desktop)
...
61.5 [X] KFA2 GeForce GTX 1660 Super AMD Ryzen 9 7900X 4.7GHz
GeForce GTX 1660 Super (Desktop)
min:
4.54 fps, P1:
43.5 fps, max:
129.9 fps
62.1 [X] KFA2 GeForce GTX 1660 Super AMD Ryzen 9 7950X 4.5GHz
GeForce GTX 1660 Super (Desktop)
min:
2.1 fps, P1:
43.5 fps, max:
392 fps
~ 62 fps
+ Compare
- Hide Comparison
...
NVIDIA GeForce GTX 1660 Super (Desktop)
...
59 [X] KFA2 GeForce GTX 1660 Super AMD Ryzen 9 7900X 4.7GHz
GeForce GTX 1660 Super (Desktop)
min:
4.66 fps, P1:
43.5 fps, max:
183.1 fps
59.5 [X] KFA2 GeForce GTX 1660 Super AMD Ryzen 9 7950X 4.5GHz
GeForce GTX 1660 Super (Desktop)
min:
7.97 fps, P1:
45.5 fps, max:
333 fps
63 [X] AMD Ryzen 9 3900X 3.8GHz
GeForce GTX 1660 Super (Desktop)
min:
10.3 fps, P1:
47.6 fps, max:
173 fps
~ 61 fps
+ Compare
- Hide Comparison
...
NVIDIA GeForce GTX 1660 Super (Desktop)
...
» With all tested laptops playable in detail settings ultra.
Additional Benchmarks
Highest Settings possible 16xAF 4xMSAA + FXAA 3840x2160
29.4 [X] KFA2 GeForce GTX 1660 Super AMD Ryzen 9 7900X 4.7GHz
GeForce GTX 1660 Super (Desktop)
min:
6.54 fps, P1:
21.3 fps, max:
187.5 fps
29.5 [X] KFA2 GeForce GTX 1660 Super AMD Ryzen 9 7950X 4.5GHz
GeForce GTX 1660 Super (Desktop)
min:
5.78 fps, P1:
21.3 fps, max:
222 fps
Normal/Off 4xAF 1920x1080
187.1 [X] KFA2 GeForce GTX 1660 Super AMD Ryzen 9 7900X 4.7GHz
GeForce GTX 1660 Super (Desktop)
min:
6.01 fps, P1:
200 fps, max:
326 fps
188.4 [X] KFA2 GeForce GTX 1660 Super AMD Ryzen 9 7950X 4.5GHz
GeForce GTX 1660 Super (Desktop)
min:
6.12 fps, P1:
200 fps, max:
757 fps
Lowest Settings possible 1920x1080
187.5 [X] KFA2 GeForce GTX 1660 Super AMD Ryzen 9 7900X 4.7GHz
GeForce GTX 1660 Super (Desktop)
min:
13 fps, P1:
200 fps, max:
270 fps
188.2 [X] KFA2 GeForce GTX 1660 Super AMD Ryzen 9 7950X 4.5GHz
GeForce GTX 1660 Super (Desktop)
min:
3.53 fps, P1:
200 fps, max:
839 fps
...
NVIDIA GeForce GTX 1660 Super (Desktop)
...
NVIDIA GeForce GTX 1660 Super (Desktop)
...
NVIDIA GeForce GTX 1660 Super (Desktop)
...
NVIDIA GeForce GTX 1660 Super (Desktop)
...
» With all tested laptops playable in detail settings ultra.
low med. high ultra QHD 4K Dragon's Dogma 2 43 38 28 15 Horizon Forbidden West 67 59 40 37 26 12 Alone in the Dark 159 124 103 34 14 Last Epoch 156 121 102 76 48 21 Skull & Bones 76 68 54 46 34 20 Helldivers 2 88 65 56 54 37 19 Enshrouded 46 40 31 22 18 8 Palworld 86 71 54 50 34 17 Prince of Persia The Lost Crown 359 325 350 199 99 Ready or Not 144.2 128.2 112.5 69.6 39.2 9.5 The Finals 165.4 116.3 101.7 75.3 44.1 18.1 Avatar Frontiers of Pandora 53 47 38 28 21 17 Call of Duty Modern Warfare 3 2023 75 68 47 40 28 16 EA Sports WRC 82 59.6 55.4 50.6 35.7 11.1 Alan Wake 2 38.8 32.2 29.9 19.6 9.2 Lords of the Fallen 55.4 44.8 21.3 13.1 5.3 Total War Pharaoh 252.3 165 92.6 72.7 48 23.5 Assassin's Creed Mirage 82 75 70 52 39 22 EA Sports FC 24 180.8 164 141.7 120.8 89.2 18.8 Counter-Strike 2 285 243 136.1 102.5 67.2 32.8 Cyberpunk 2077 2.0 Phantom Liberty 90 61.9 52.4 47.5 28.8 12.5 Lies of P 112.6 97.9 84.3 74.1 48 21.7 Starfield 42.2 35.5 26 25.8 20.3 12.6 Armored Core 6 115.3 97.2 85.5 68.5 49.5 20.4 Immortals of Aveum 36.4 30.5 22.1 14.1 6.83 Atlas Fallen 89.3 84.1 78.7 65.5 46.8 22 Baldur's Gate 3 76 60.5 50.7 50.3 33 16.9 Ratchet & Clank Rift Apart 63.4 52.4 44.7 33.4 26.6 14.3 F1 23 196.8 171 116.6 82.9 59.9 30.7 Diablo 4 167.1 142.4 124.8 101.7 65.4 33.1 Star Wars Jedi Survivor 51.9 43.7 41.4 38.8 23.6 10.5 Dead Island 2 168.1 143.2 98.8 74.6 43.7 21.4 The Last of Us 66.8 52.3 43.2 32.8 19.9 3.72 Resident Evil 4 Remake 85.8 58 53.5 43.2 32.2 15.1 Company of Heroes 3 121.9 103.8 78.5 78.1 56.2 31 Sons of the Forest 71.6 55 52.9 51.4 37.2 20.4 Atomic Heart 124.2 90.7 52 41.5 30.7 17 Returnal 66 63 57 48 35 18 Hogwarts Legacy 88.2 65.3 51.1 27.4 39.2 14.6 Dead Space Remake 57.5 53.7 46.9 46.3 30.3 14.3 The Witcher 3 v4.00 141 105.8 87.6 71.4 49.8 27.5 High On Life 172.8 99 79.4 63.6 37.1 15.8 The Callisto Protocol 99.7 69.8 45.3 45.1 30.3 12.4 Need for Speed Unbound 105.8 92.7 72.7 57.7 34.2 20.3 Spider-Man Miles Morales 92.8 82.9 81.7 69 37.9 17.9 Call of Duty Modern Warfare 2 2022 89 80 56 54 38 22 Uncharted Legacy of Thieves Collection 62.8 60 43.6 40.8 26.2 10.7 A Plague Tale Requiem 73.3 54.1 39.8 29.8 20.8 11.1 FIFA 23 201 186.6 124.4 119.8 88.4 50.9 The Quarry 97 73 60 45 26 8 F1 22 198 177 126 91 66 36 Vampire Bloodhunt 238 123.9 120.3 116.9 74.6 36.7 Ghostwire Tokyo 93.6 92.2 89.7 91.3 57.3 26.7 Tiny Tina's Wonderlands 123 99 67 52 35 13 Cyberpunk 2077 1.6 76 63 52 49 26 11 Elex 2 71.8 65 57.5 53.1 35.2 18.4 GRID Legends 204 148 112 80 62 38 Elden Ring 59.9 59.9 59.8 57.1 47 27.7 Dying Light 2 87.5 44.6 36.3 24.7 12.6 Rainbow Six Extraction 131 109 105 74 56 27 God of War 90 74 58 39 31 21 Halo Infinite 80.3 71.7 68.3 68.6 54.5 Farming Simulator 22 296 164 123 101 75.7 44.9 Battlefield 2042 147 88.6 74.5 64 46.3 25.4 Forza Horizon 5 210 107 93 37 34 24 Call of Duty Vanguard 92.2 85.7 67.4 53.5 38.7 21.9 Riders Republic 163 96 77 67 45 23 Guardians of the Galaxy 137 95 84 84 60 32 Back 4 Blood 154 140 126 80.3 39 Far Cry 6 167 97 84 71 45 6 Alan Wake Remastered 97.4 93.3 89.7 69.9 New World 157 82.6 75.1 46 41.8 Deathloop 131 81.5 66.5 50.9 35 18.1 F1 2021 402 197 160 108 80 45 Monster Hunter Stories 2 144 143 144 138 84.6 Days Gone 168 101 88.6 64.3 46.2 25.7 Mass Effect Legendary Edition 116 112 105 58.5 Resident Evil Village 273 119 108 93.7 59.4 29.8 Outriders 189 112 86.8 76.4 49.1 31.3 Hitman 3 248 117 102 92 61 32 Cyberpunk 2077 1.0 104 56.1 46.2 39.2 24.5 10.9 Immortals Fenyx Rising 99 67 54 51 41 25 Yakuza Like a Dragon 111 77.2 74.9 64.7 43.1 21.5 Call of Duty Black Ops Cold War 162 93.7 75.3 57.2 39.5 18.2 Assassin´s Creed Valhalla 99 66 48 44 34 18 Watch Dogs Legion 115 82.5 70.8 31.4 23.5 12.3 FIFA 21 220 217 208 206 196 139 Star Wars Squadrons 400 220 193 176 116 64 Mafia Definitive Edition 142.2 78.8 72.5 48.2 24.5 Serious Sam 4 144.1 88.1 71.3 53.6 41.9 25.6 Crysis Remastered 237 108 58 45.6 32.6 19.1 Flight Simulator 2020 85.5 55.1 40.2 27.3 19.7 11.9 Horizon Zero Dawn 138 88 73 57 44 24 Death Stranding 147 93.8 86 84.3 58.5 31.5 F1 2020 346 184 144 98 71 40 Valorant 327.3 320.7 289.8 262.4 131.9 Gears Tactics 324.4 162.1 104.8 72.2 46 24.1 Doom Eternal 265 143 126 122 73.4 34.4 Hunt Showdown 224 95.6 77 48.9 21.6 Escape from Tarkov 121 114 121 92.7 54.6 27.7 Red Dead Redemption 2 136 77 53.6 33.2 26.7 Star Wars Jedi Fallen Order 80 64 56.9 55.5 27.7 Need for Speed Heat 116 98 89 77 55.6 26.6 Call of Duty Modern Warfare 2019 163 117 96 84 59.3 32.4 GRID 2019 202 124 100 69 52.5 35 Ghost Recon Breakpoint 118 80 72 55 38 19 FIFA 20 257 251 235 236 220 145 Borderlands 3 201 106 69 52 35 15 Control 213 77 56.3 35.3 17 F1 2019 263 152 132 87 68 41 Total War: Three Kingdoms 236 108.5 68.1 47.2 29.3 13.5 Rage 2 212 103 86 83 50.1 23.9 Anno 1800 103 106 78 40.6 28.6 16.9 The Division 2 193 113 88 63 43 23 Dirt Rally 2.0 311 158 132 73 54.5 31.4 Anthem 131 97 84 79 55.5 27 Far Cry New Dawn 165 107 100 92 67 35 Metro Exodus 161 70 55 45 35 22 Apex Legends 144 144 116 120 82 43.5 Just Cause 4 164 121 88 84 57 30.6 Darksiders III 232 128 104 93 60 21.8 Battlefield V 154 97 83 77 60 36.4 Farming Simulator 19 237 176 154 123 88 47.5 Hitman 2 99 92 84 79 56.4 28.8 Assassin´s Creed Odyssey 120 88 73 51 40 24 Forza Horizon 4 211 144 135 107 84 54 Shadow of the Tomb Raider 220 102 90 82 54 27 Strange Brigade 396 162 128 110 79 44 Monster Hunter World 172 99 90 66 41.4 20.1 Far Cry 5 189 110 102 95 65 33 X-Plane 11.11 195 172 132 99 Final Fantasy XV Benchmark 101 90 77 69 58 Assassin´s Creed Origins 136 90 83 69 54 33 Playerunknown's Battlegrounds (PUBG) 244 139 104 35.8 Rocket League 250 249 217 162 101 Ghost Recon Wildlands 170 91 85 49 32 For Honor 317 139 133 102 42 Far Cry Primal 129 115 106 86 40 Rise of the Tomb Raider 295 199 111 86 37 Dota 2 Reborn 246 218 205 188 94 The Witcher 3 319 205 113 61 40 GTA V 186 184 171 86 62 61 BioShock Infinite 440 362 329 151 < 30 fps < 60 fps < 120 fps ≥ 120 fps 10 43 85 18 79 42 2 38 71 30 8 49 63 11 25 74 29 6 89 39 8 3
For more games that might be playable and a list of all games and graphics cards visit our Gaming List
v1.26
log 09. 00:57:19
#0 no ids found in url (should be separated by "_") +0s ... 0s
#1 not redirecting to Ajax server +0s ... 0s
#2 did not recreate cache, as it is less than 5 days old! Created at Tue, 07 May 2024 05:40:33 +0200 +0.001s ... 0.001s
#3 before gaming benchmark output +0.001s ... 0.003s
#4 Got 1098 rows for game benchmarks. +0.08s ... 0.083s
#5 composed SQL query for gamebenchmarks +0s ... 0.083s
#6 got data and put it in $dataArray +0.093s ... 0.176s
#7 benchmarks composed for output. +7.082s ... 7.258s
#8 return log +0.009s ... 7.268s
I was already interested in technology from an early age, and I was able to study for my dream job as an IT Systems Electronics Engineer. Subsequently, I started 12 years of military service, during which I learned a lot about technology and constantly kept my knowledge up to date with the latest developments. As I like to share my knowledge, I found Notebookcheck was a very good opportunity for this. In addition, I also work a lot with water cooling and network security.
Translator: Alex Alderson - Senior Tech Writer
- 10011 articles published on Notebookcheck since 2018
Prior to writing and translating for Notebookcheck, I worked for various companies including Apple and Neowin. I have a BA in International History and Politics from the University of Leeds, which I have since converted to a Law Degree. Happy to chat on Twitter or Notebookchat.
Please share our article, every link counts!
Sebastian Bade, 2019-12- 1 (Update: 2019-12- 2)
 Deutsch
 English
 Español
 Français
 Italiano
 Nederlands
 Polski
 Português
 Русский
 Türkçe
 Svenska
 Chinese
 Magyar