AMD Radeon RX 5700 XT Review: Known issues of the reference design
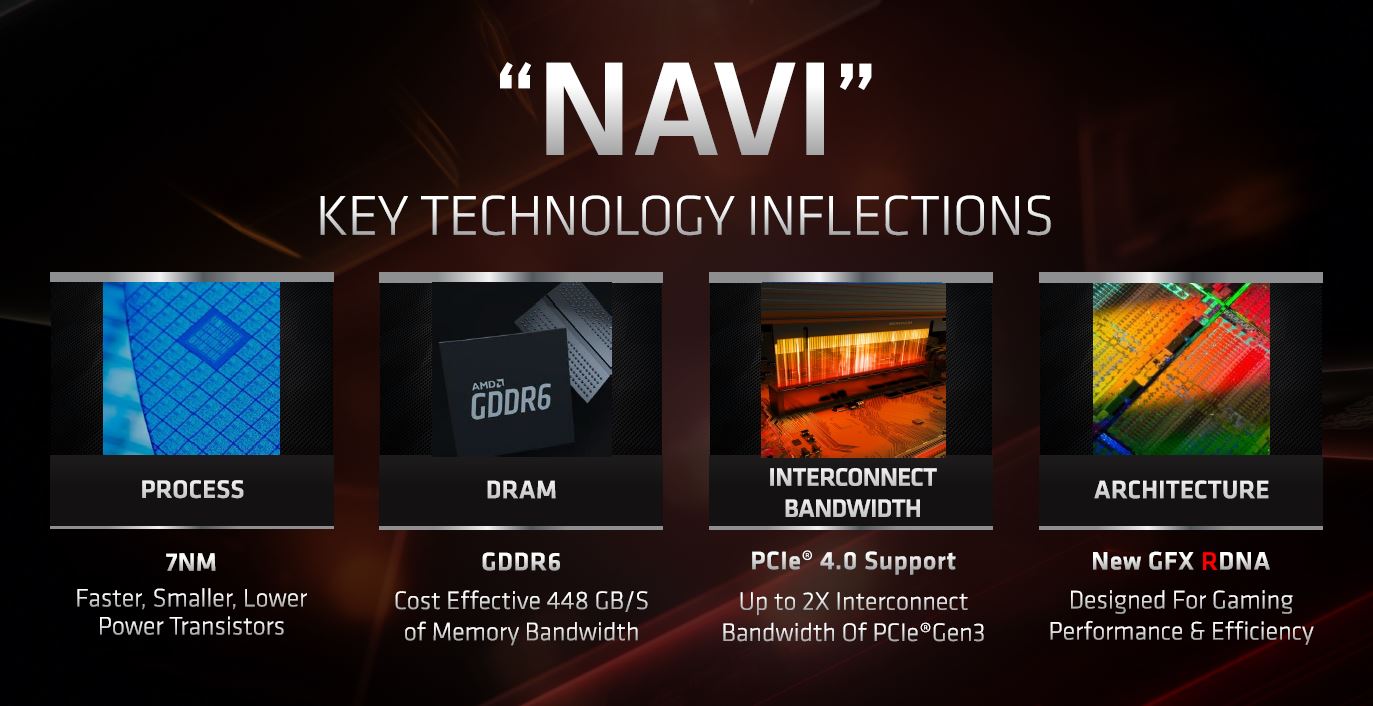
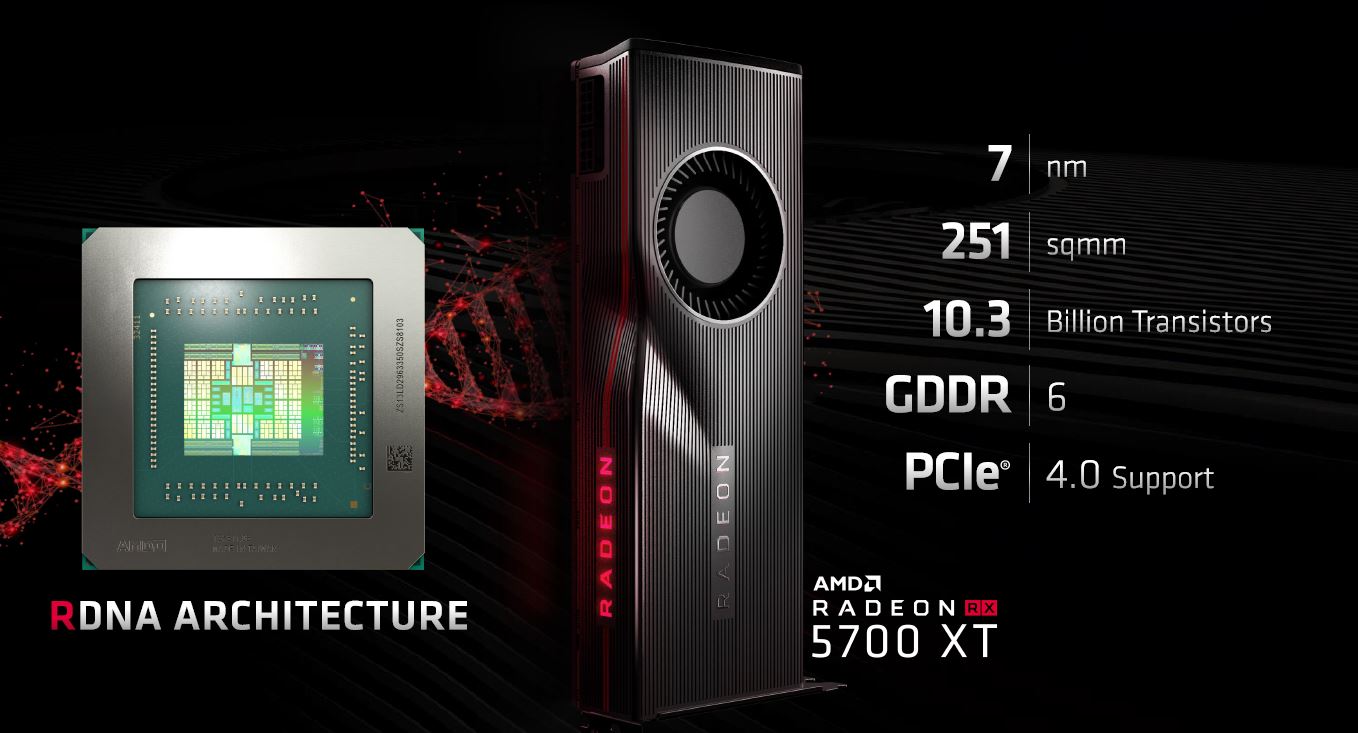
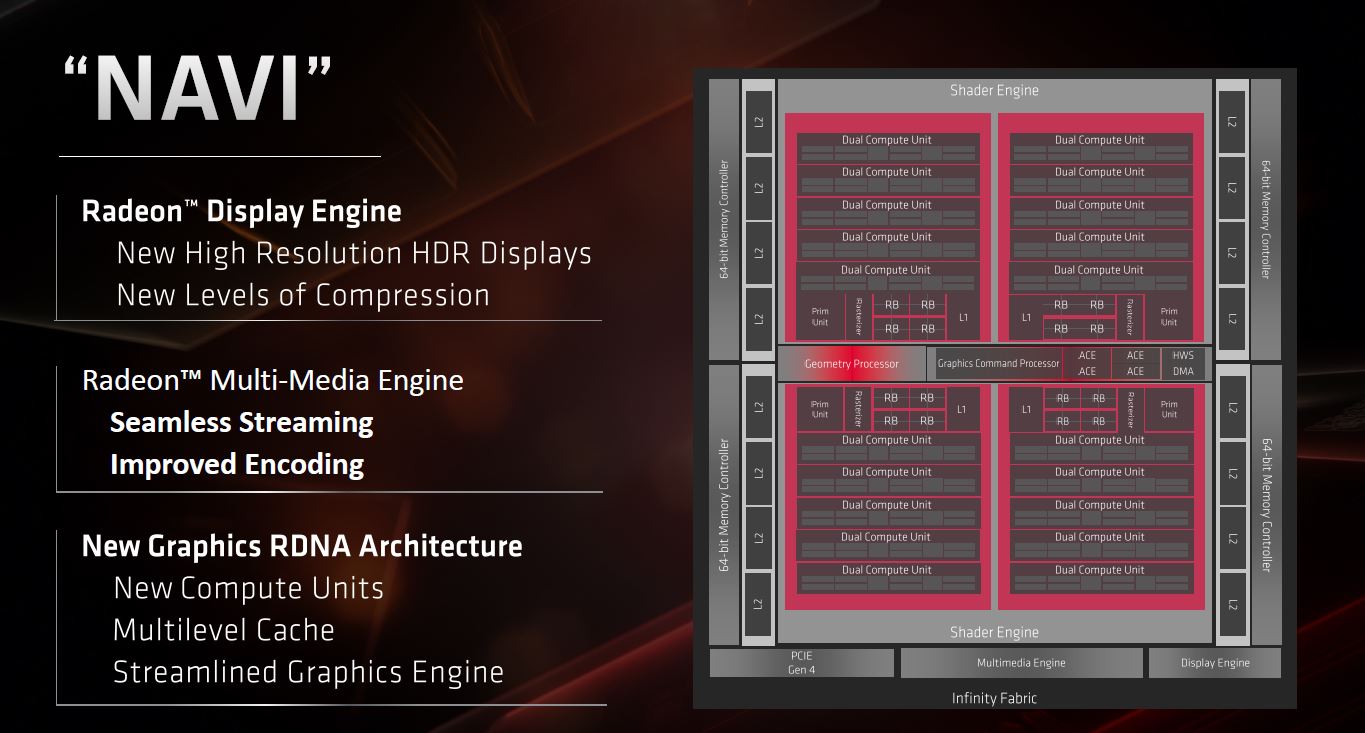
RDNA is the new architecture that Navi-based GPUs utilize. The Radeon RX 5700 XT is produced using the 7-nm manufacturing process and has 2560 shading units. AMD first used the 7-nm lithography with the Radeon VII. Therefore, AMD is still ahead of the curve when it comes to the implementation of new features. This also applies to the PCI Express 4.0 interface, which offers double the bandwidth of the PCI Express 3.0 interface. However, if you want to be able to take advantage of the PCI Express 4.0 standard, then you will need a motherboard with an X570 chipset, which was released alongside AMD’s processors based on the Zen 2 architecture.
The AMD Radeon RX 5700 XT comes with the highest-specced Navi 10 chip. This means that AMD does not offer any other GPUs that are more powerful than the RX 5700 XT. However, there is a cut-down version with fewer shading units known as the AMD Radeon RX 5700. The highest-specced version of the Navi 10-based GPU comes with as many shading units as the GeForce RTX 2070S FE. Nvidia introduced this GPU shortly before the launch of the RX 5700 XT in order to maintain its performance lead. We will talk about whether or not Nvidia succeeded in this later.
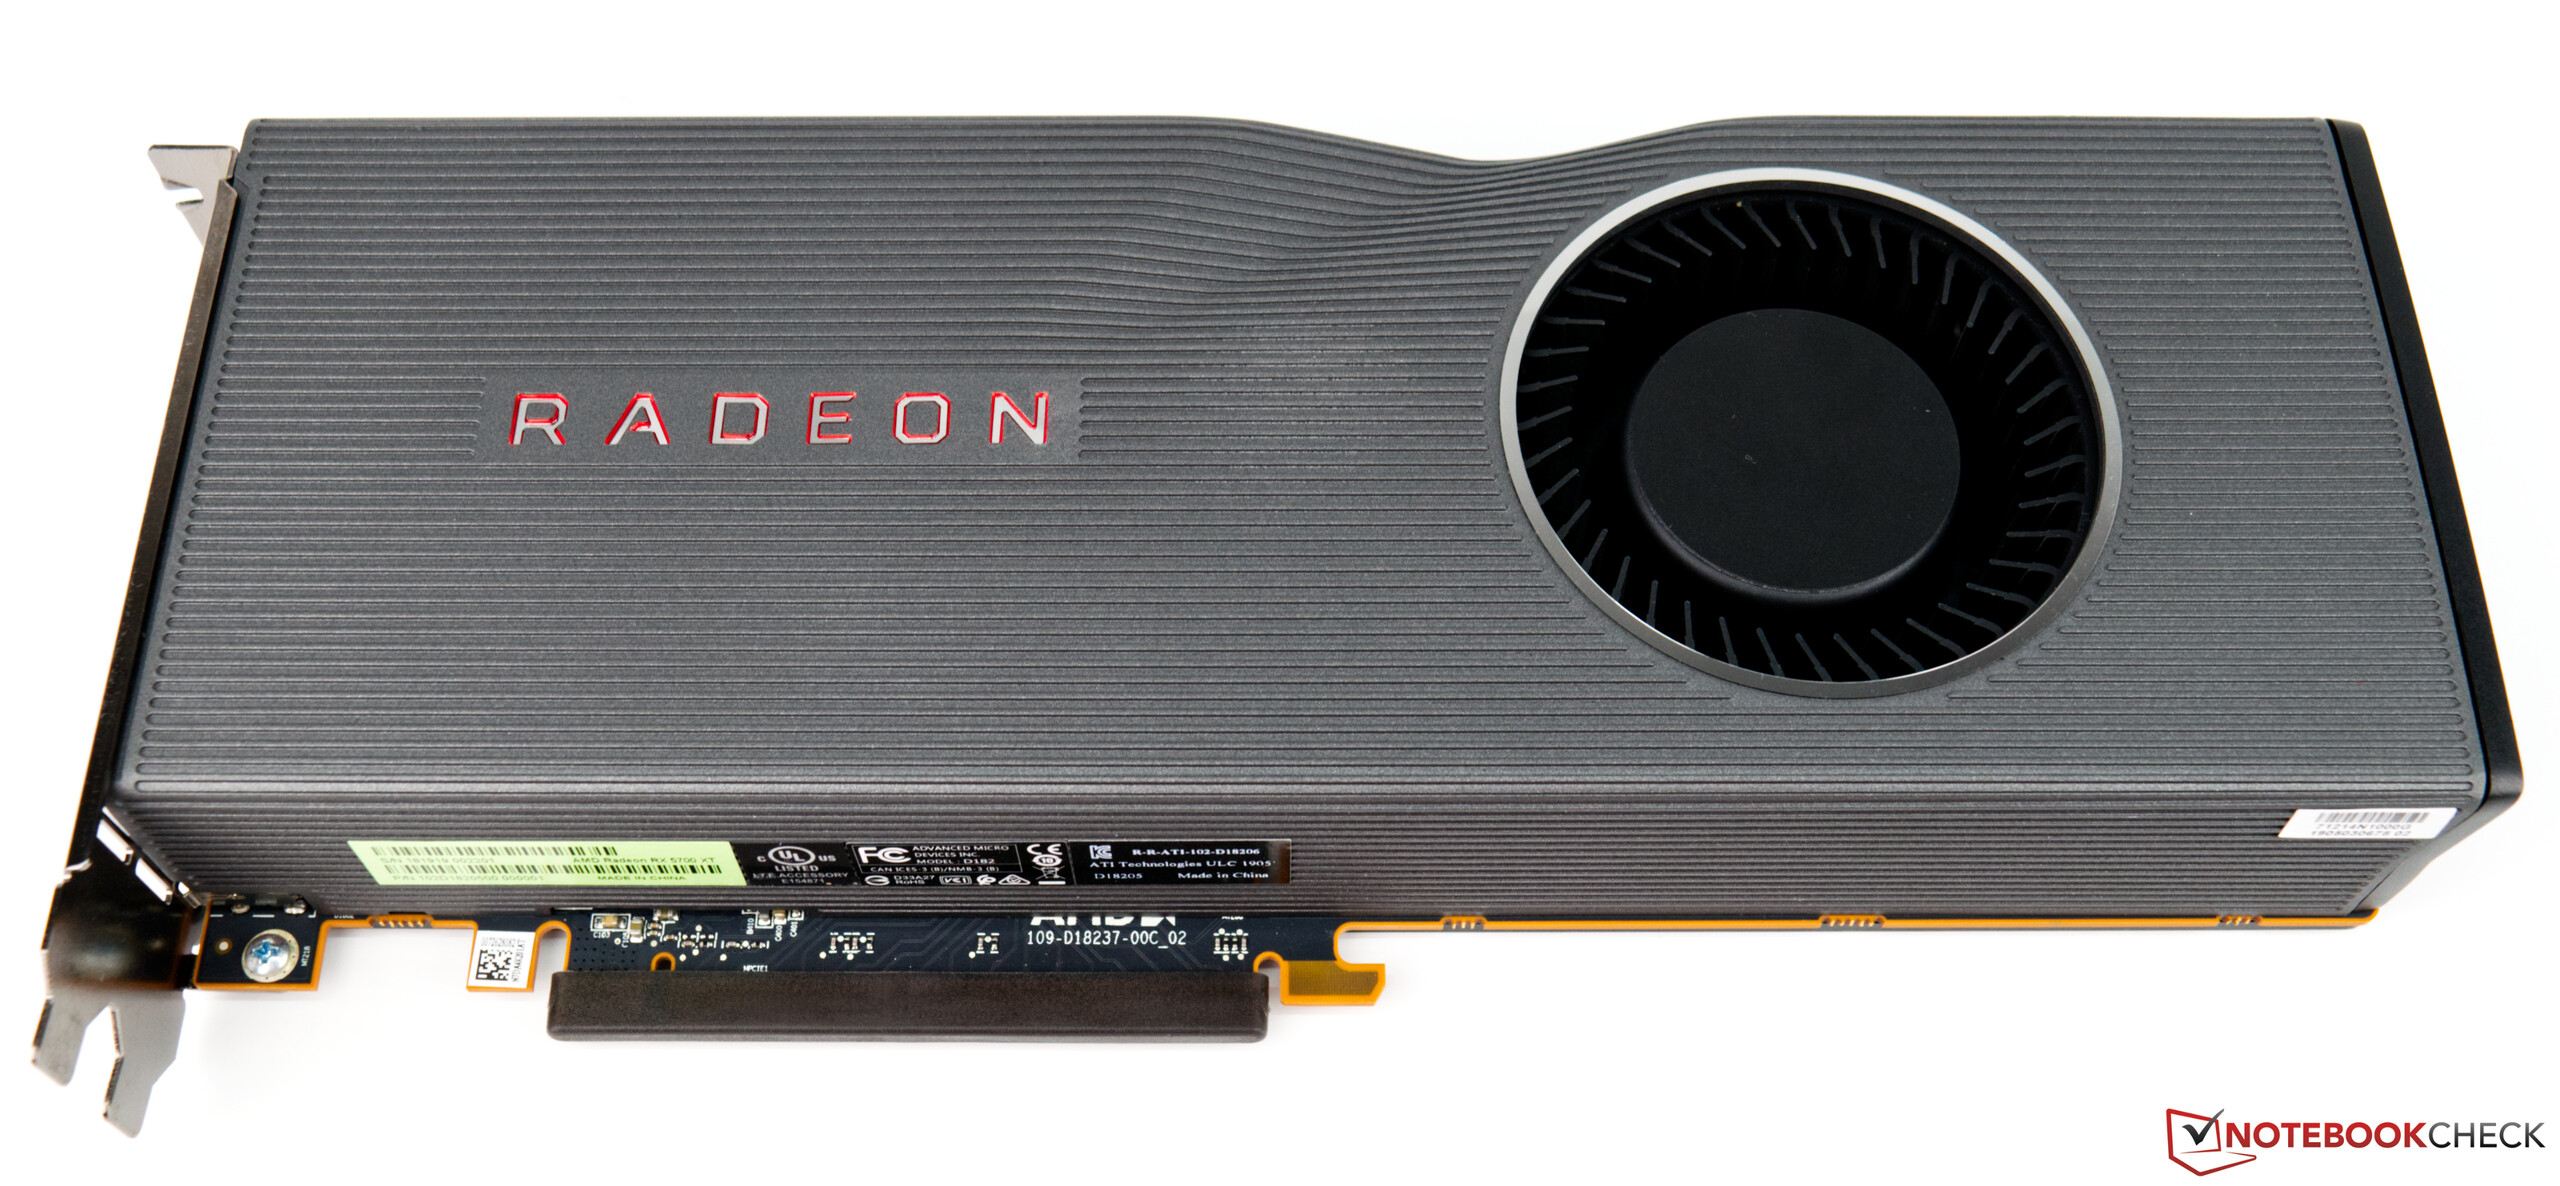
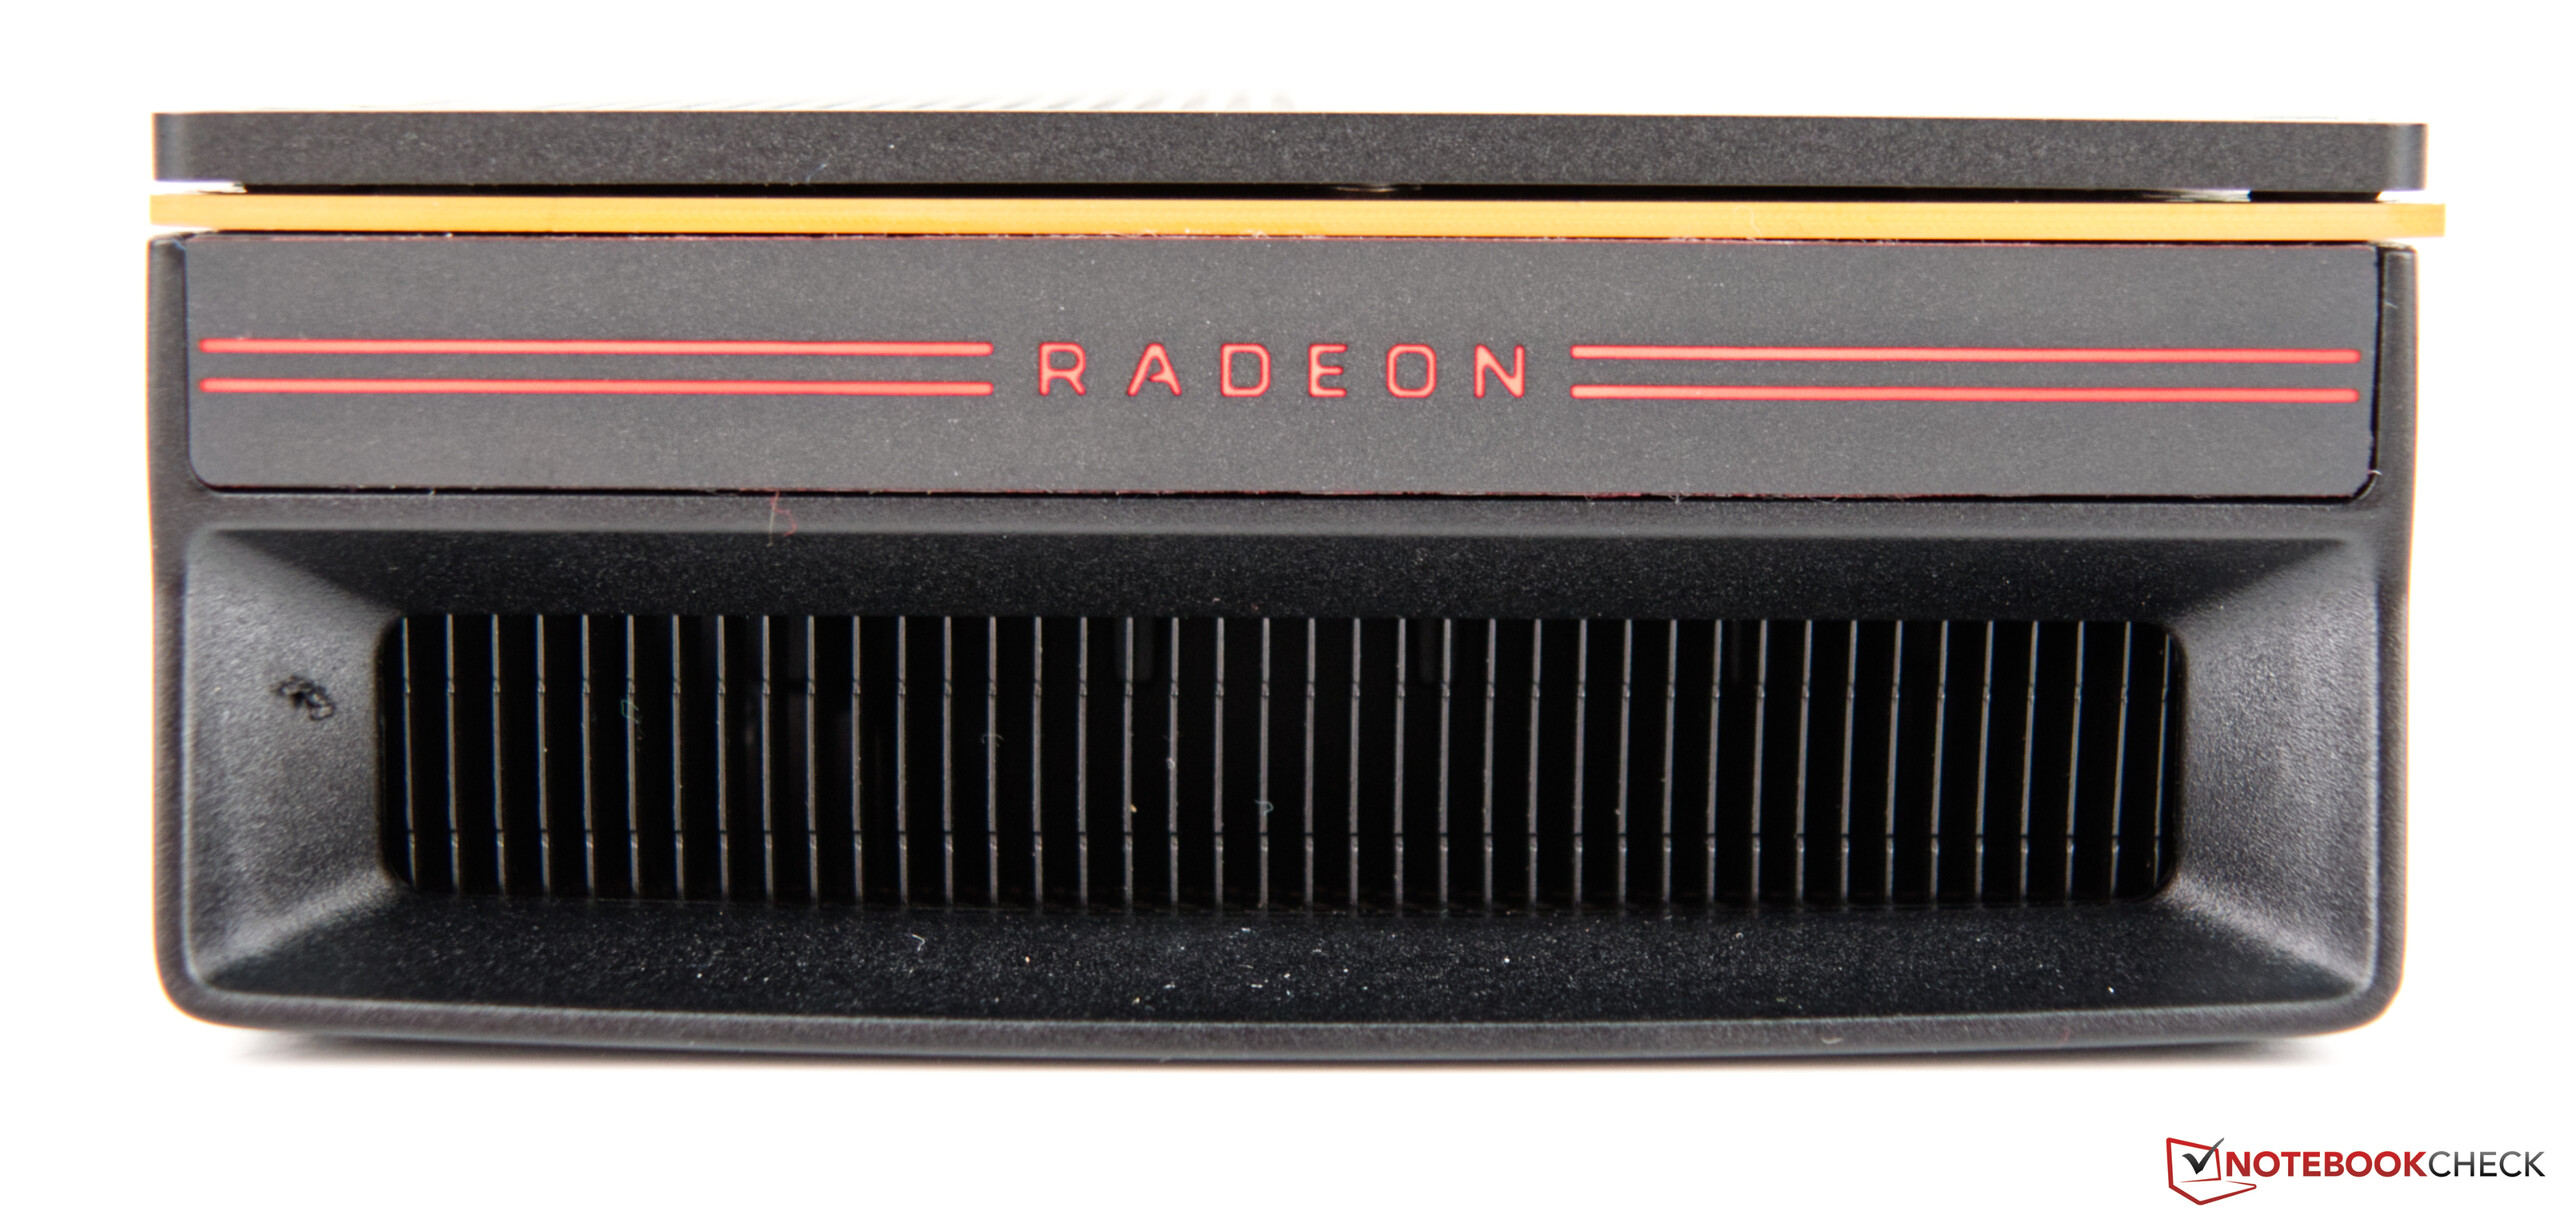
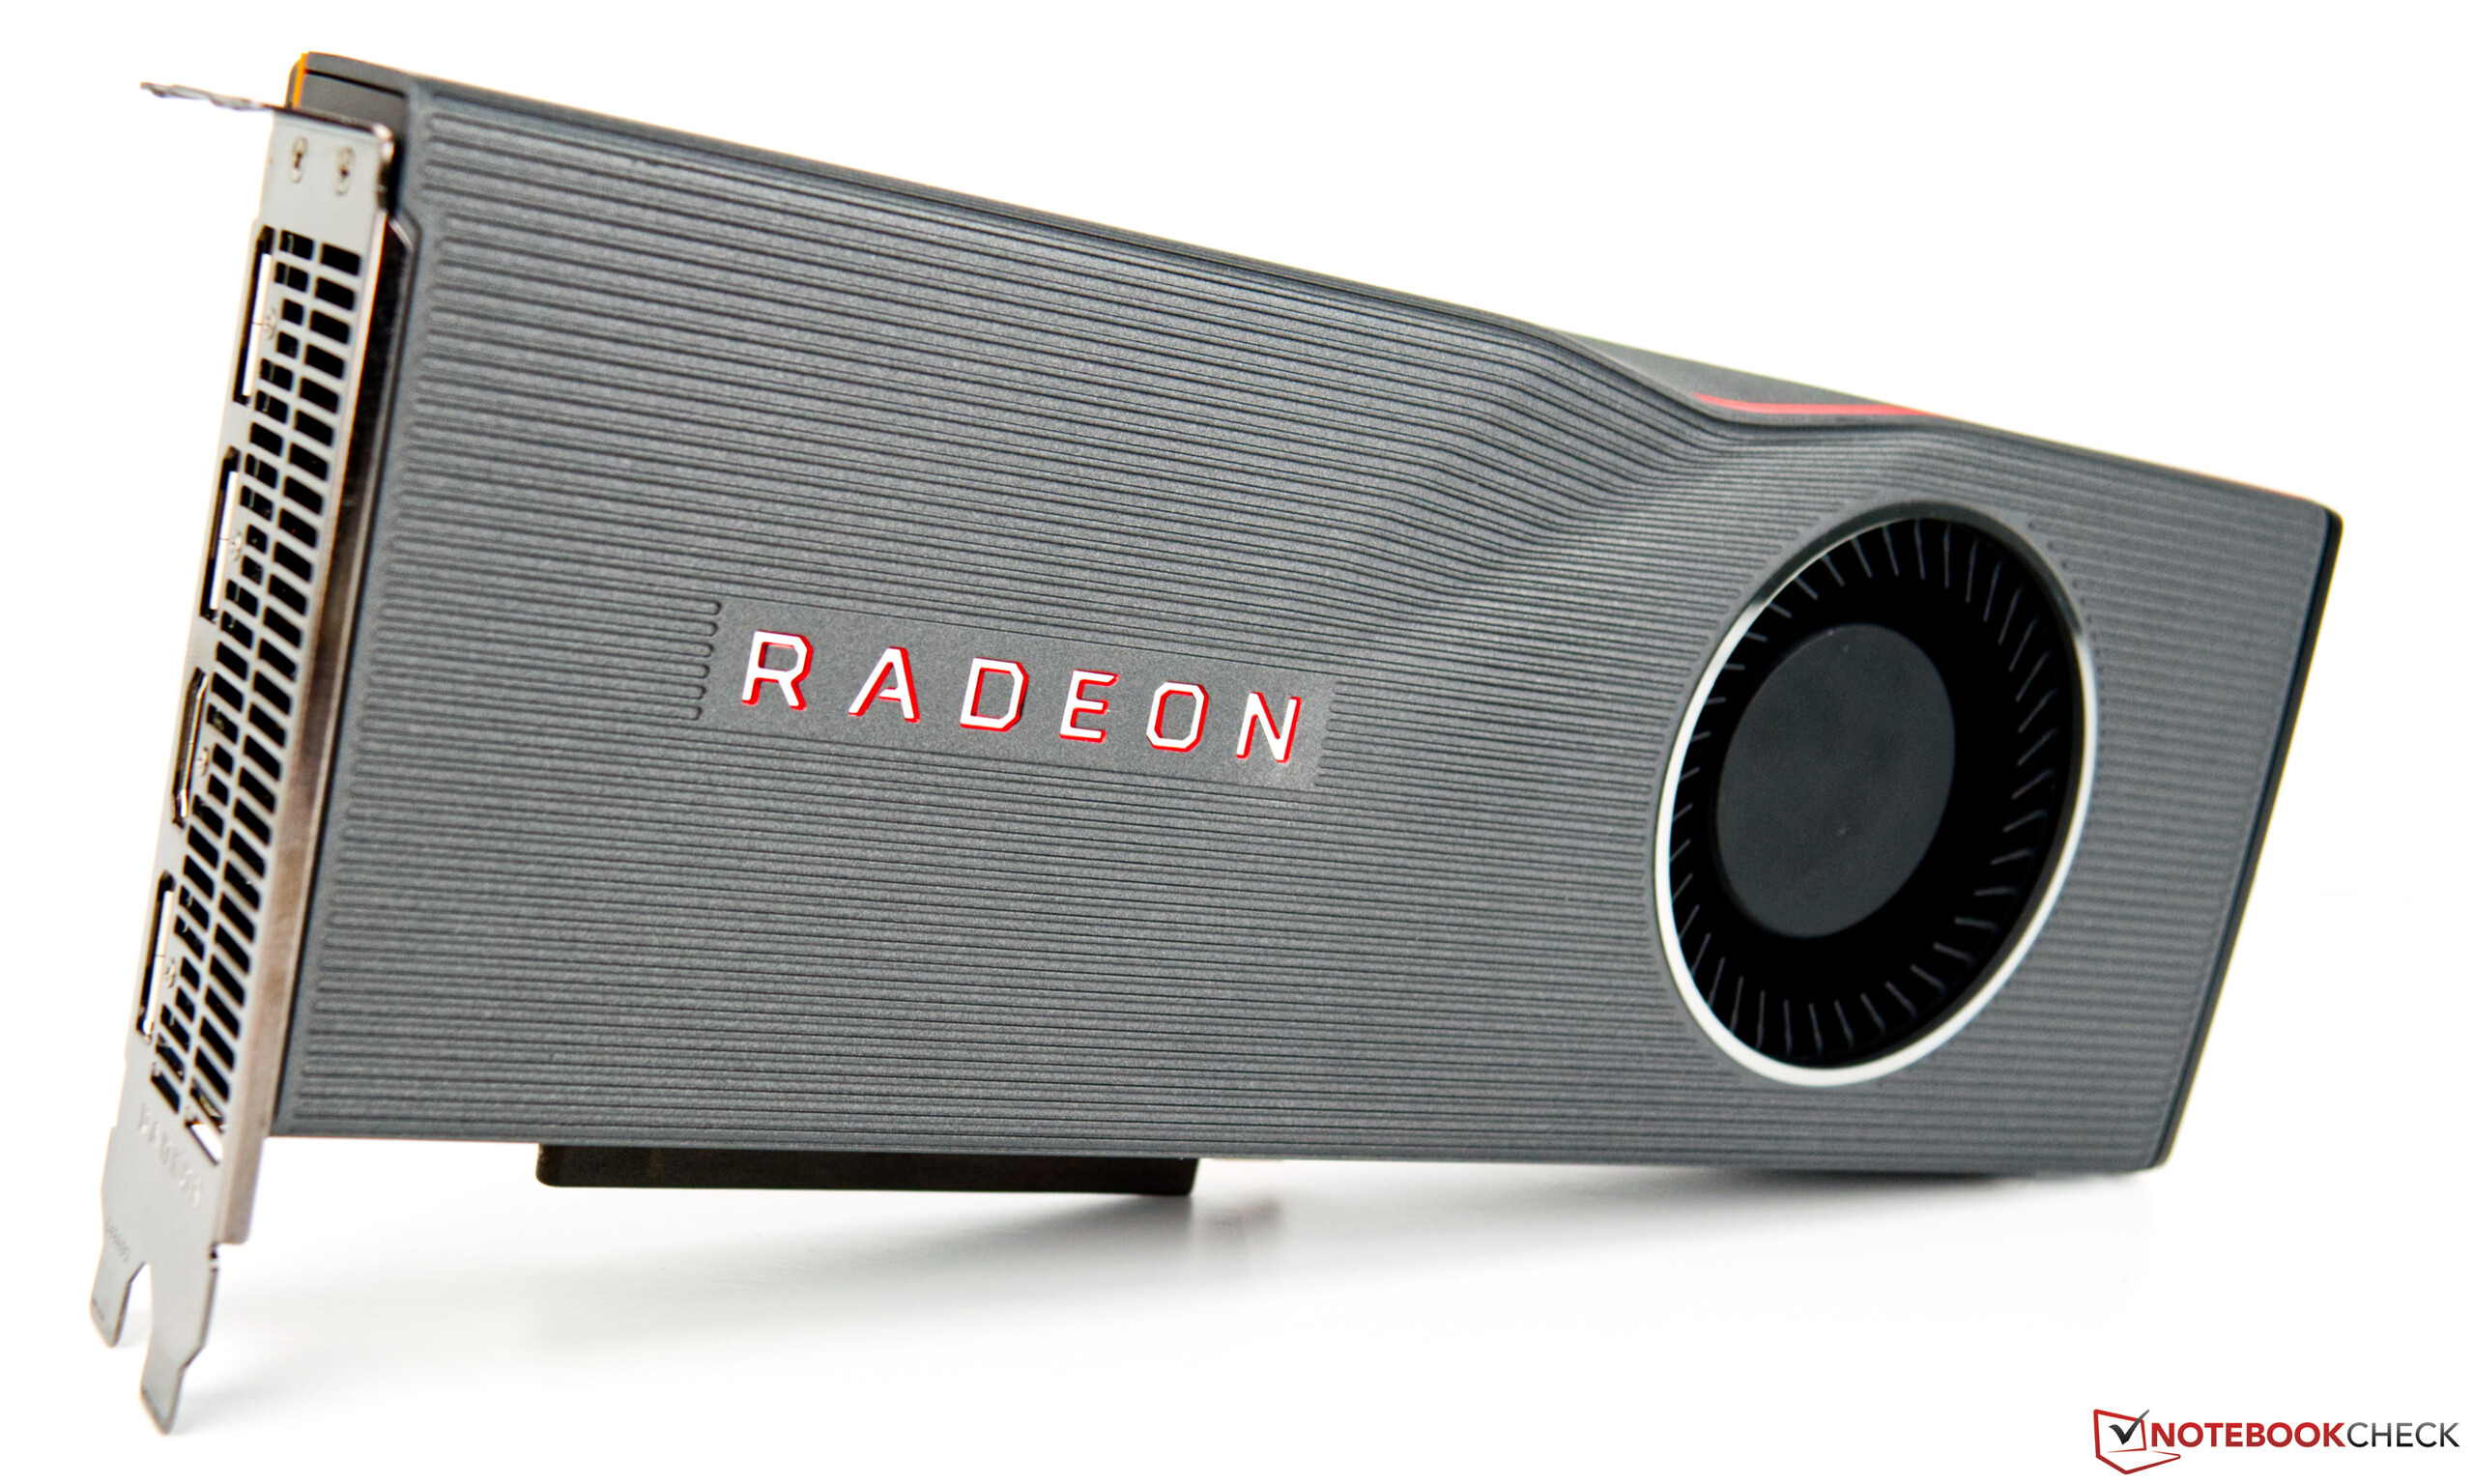
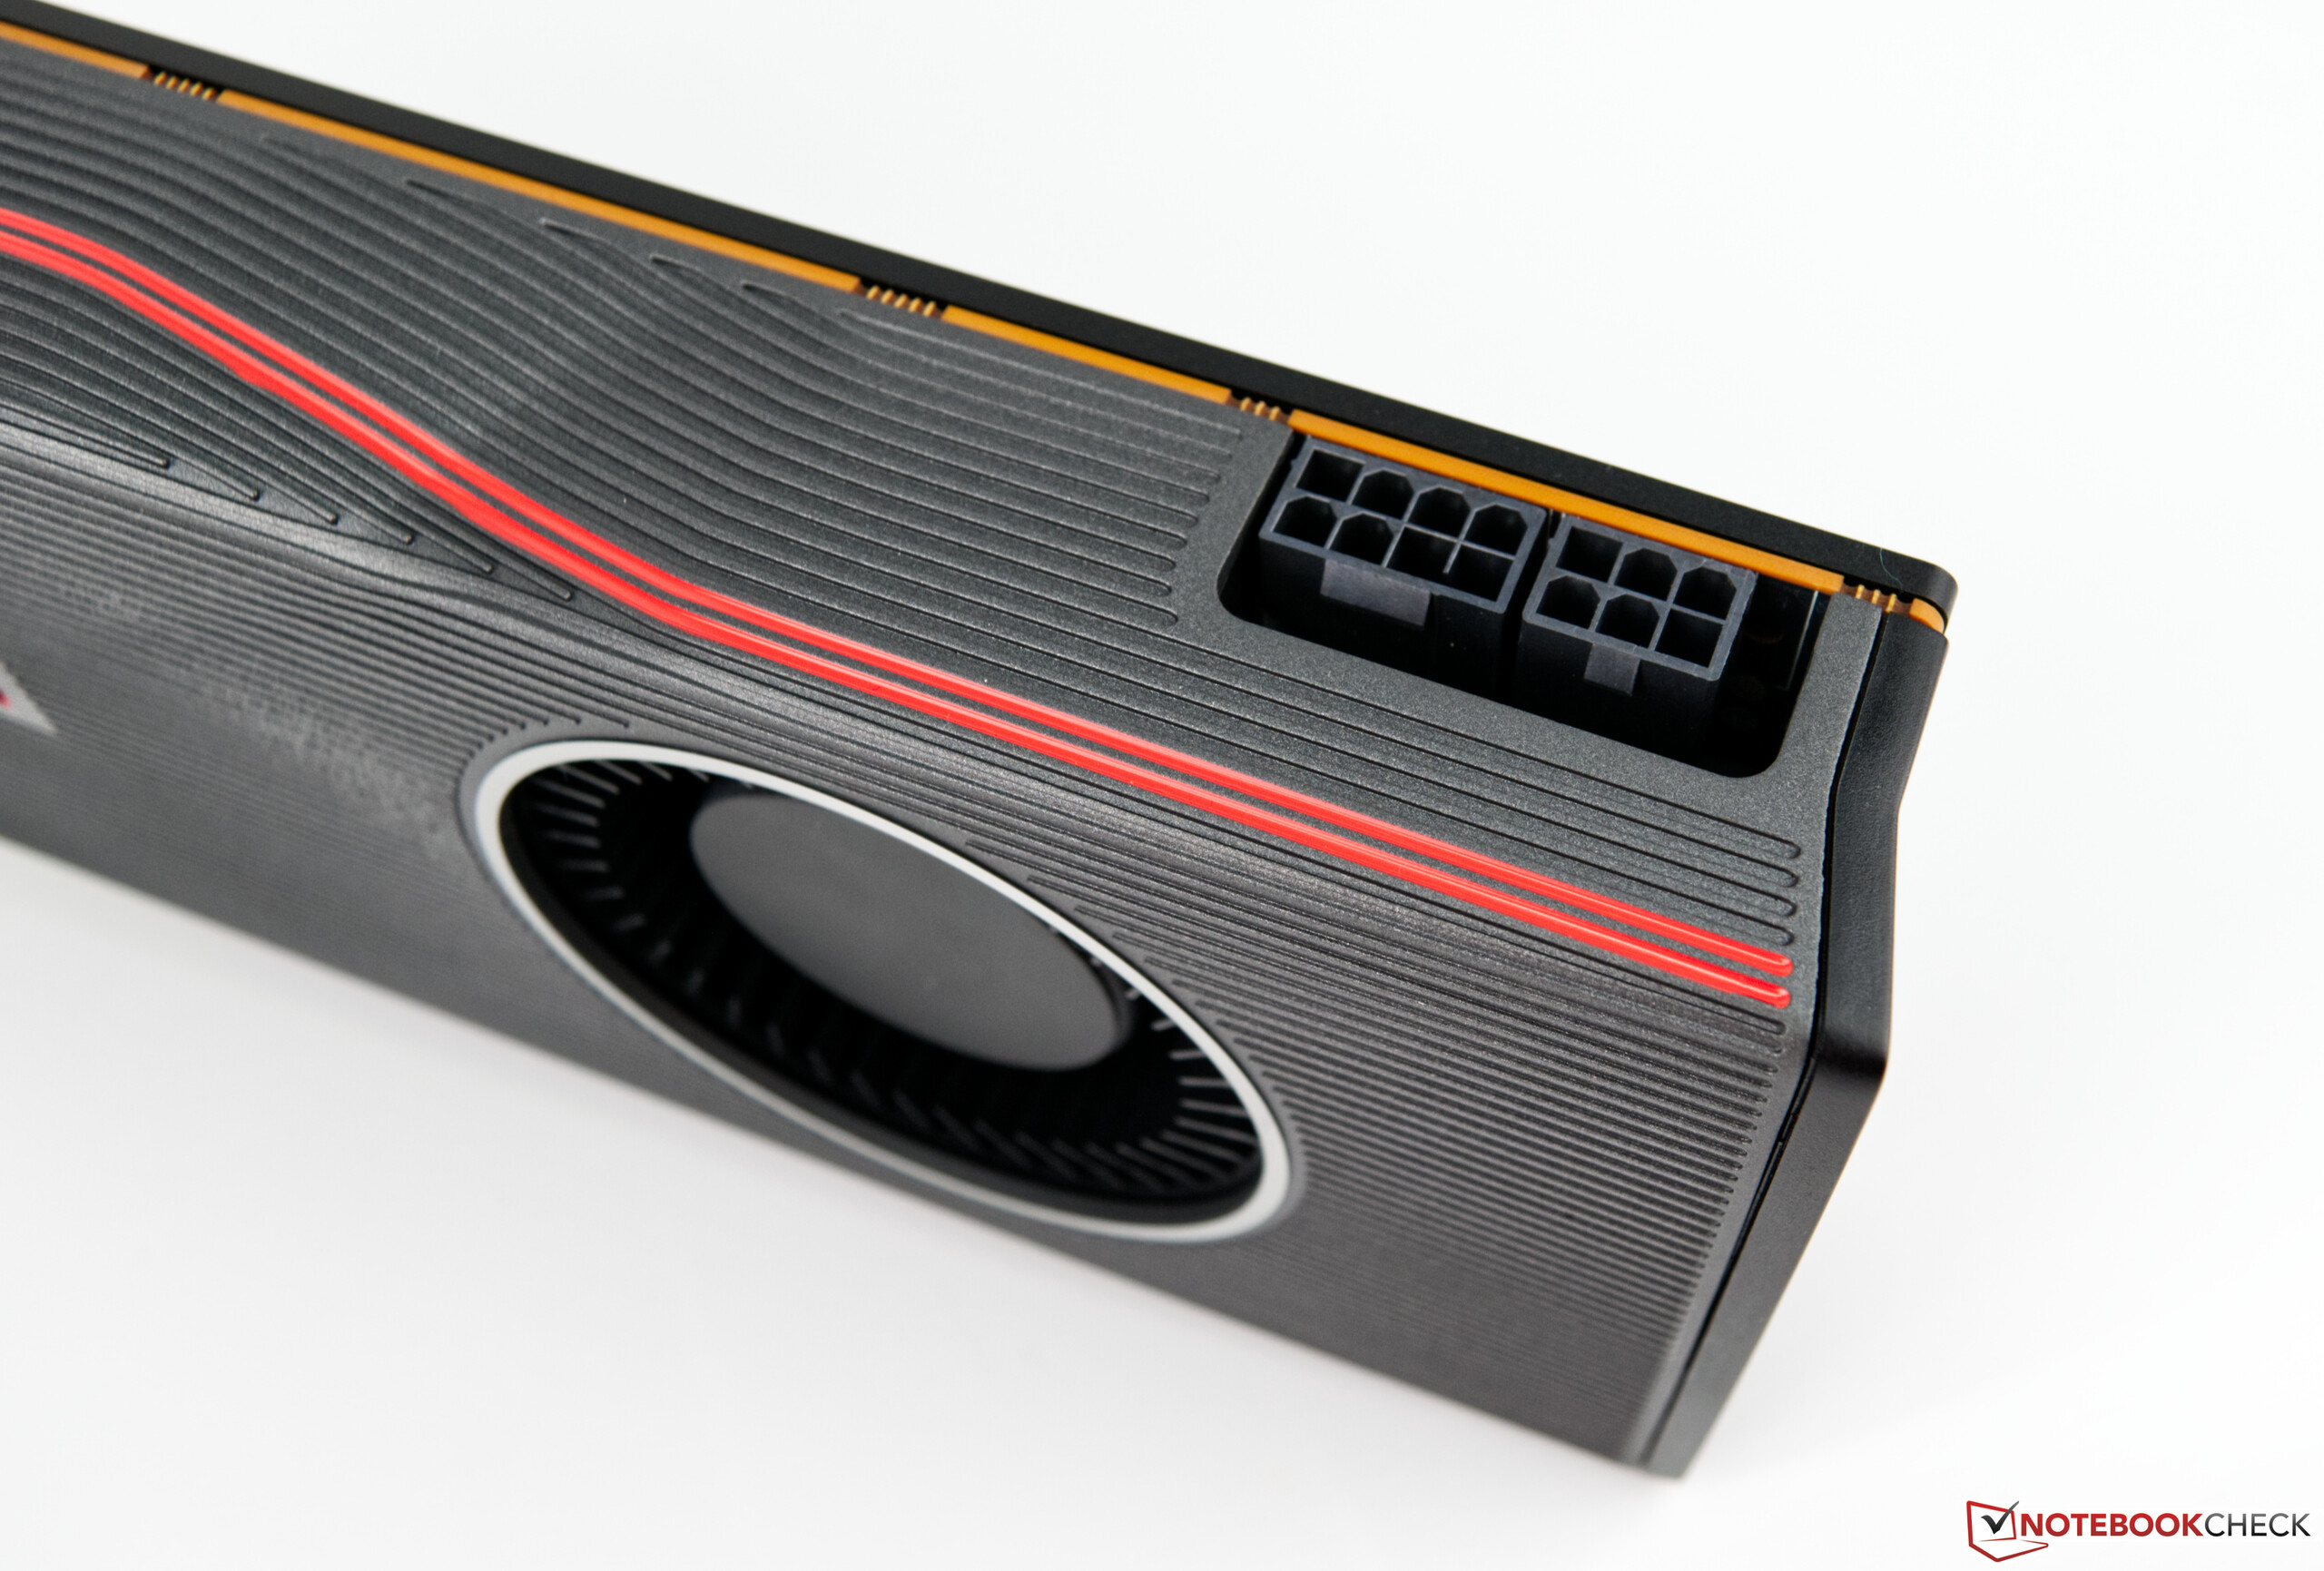
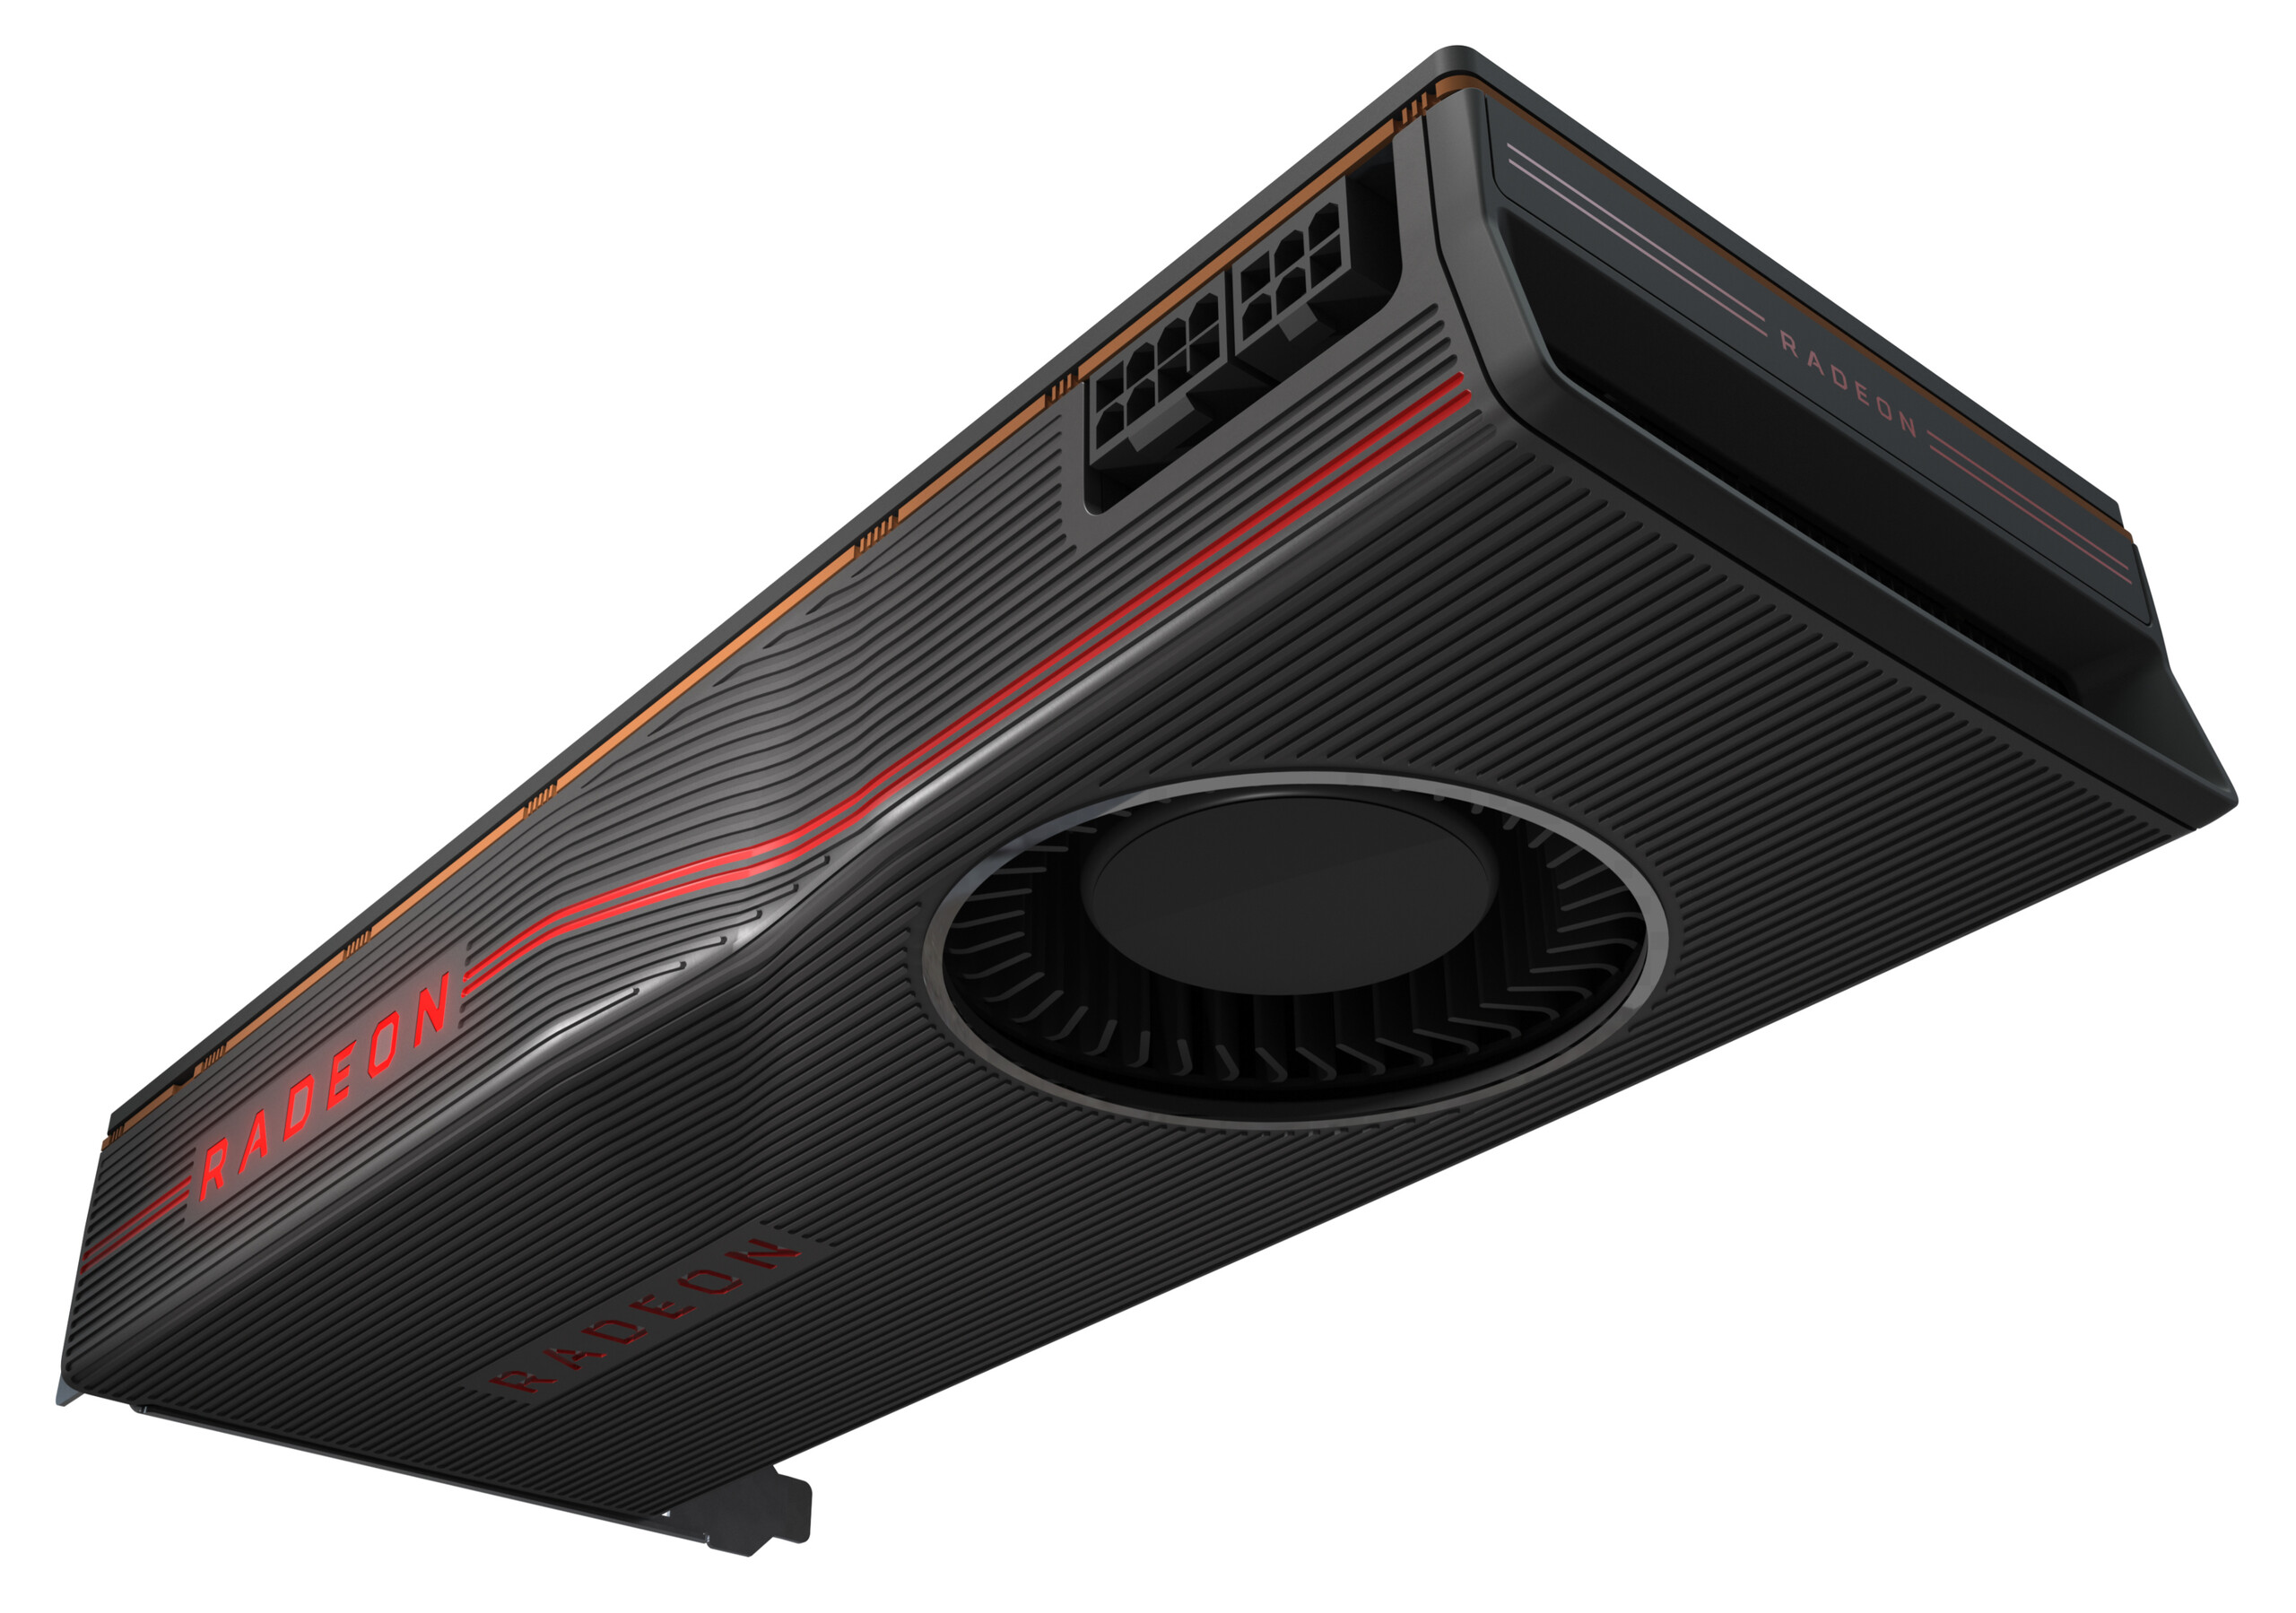
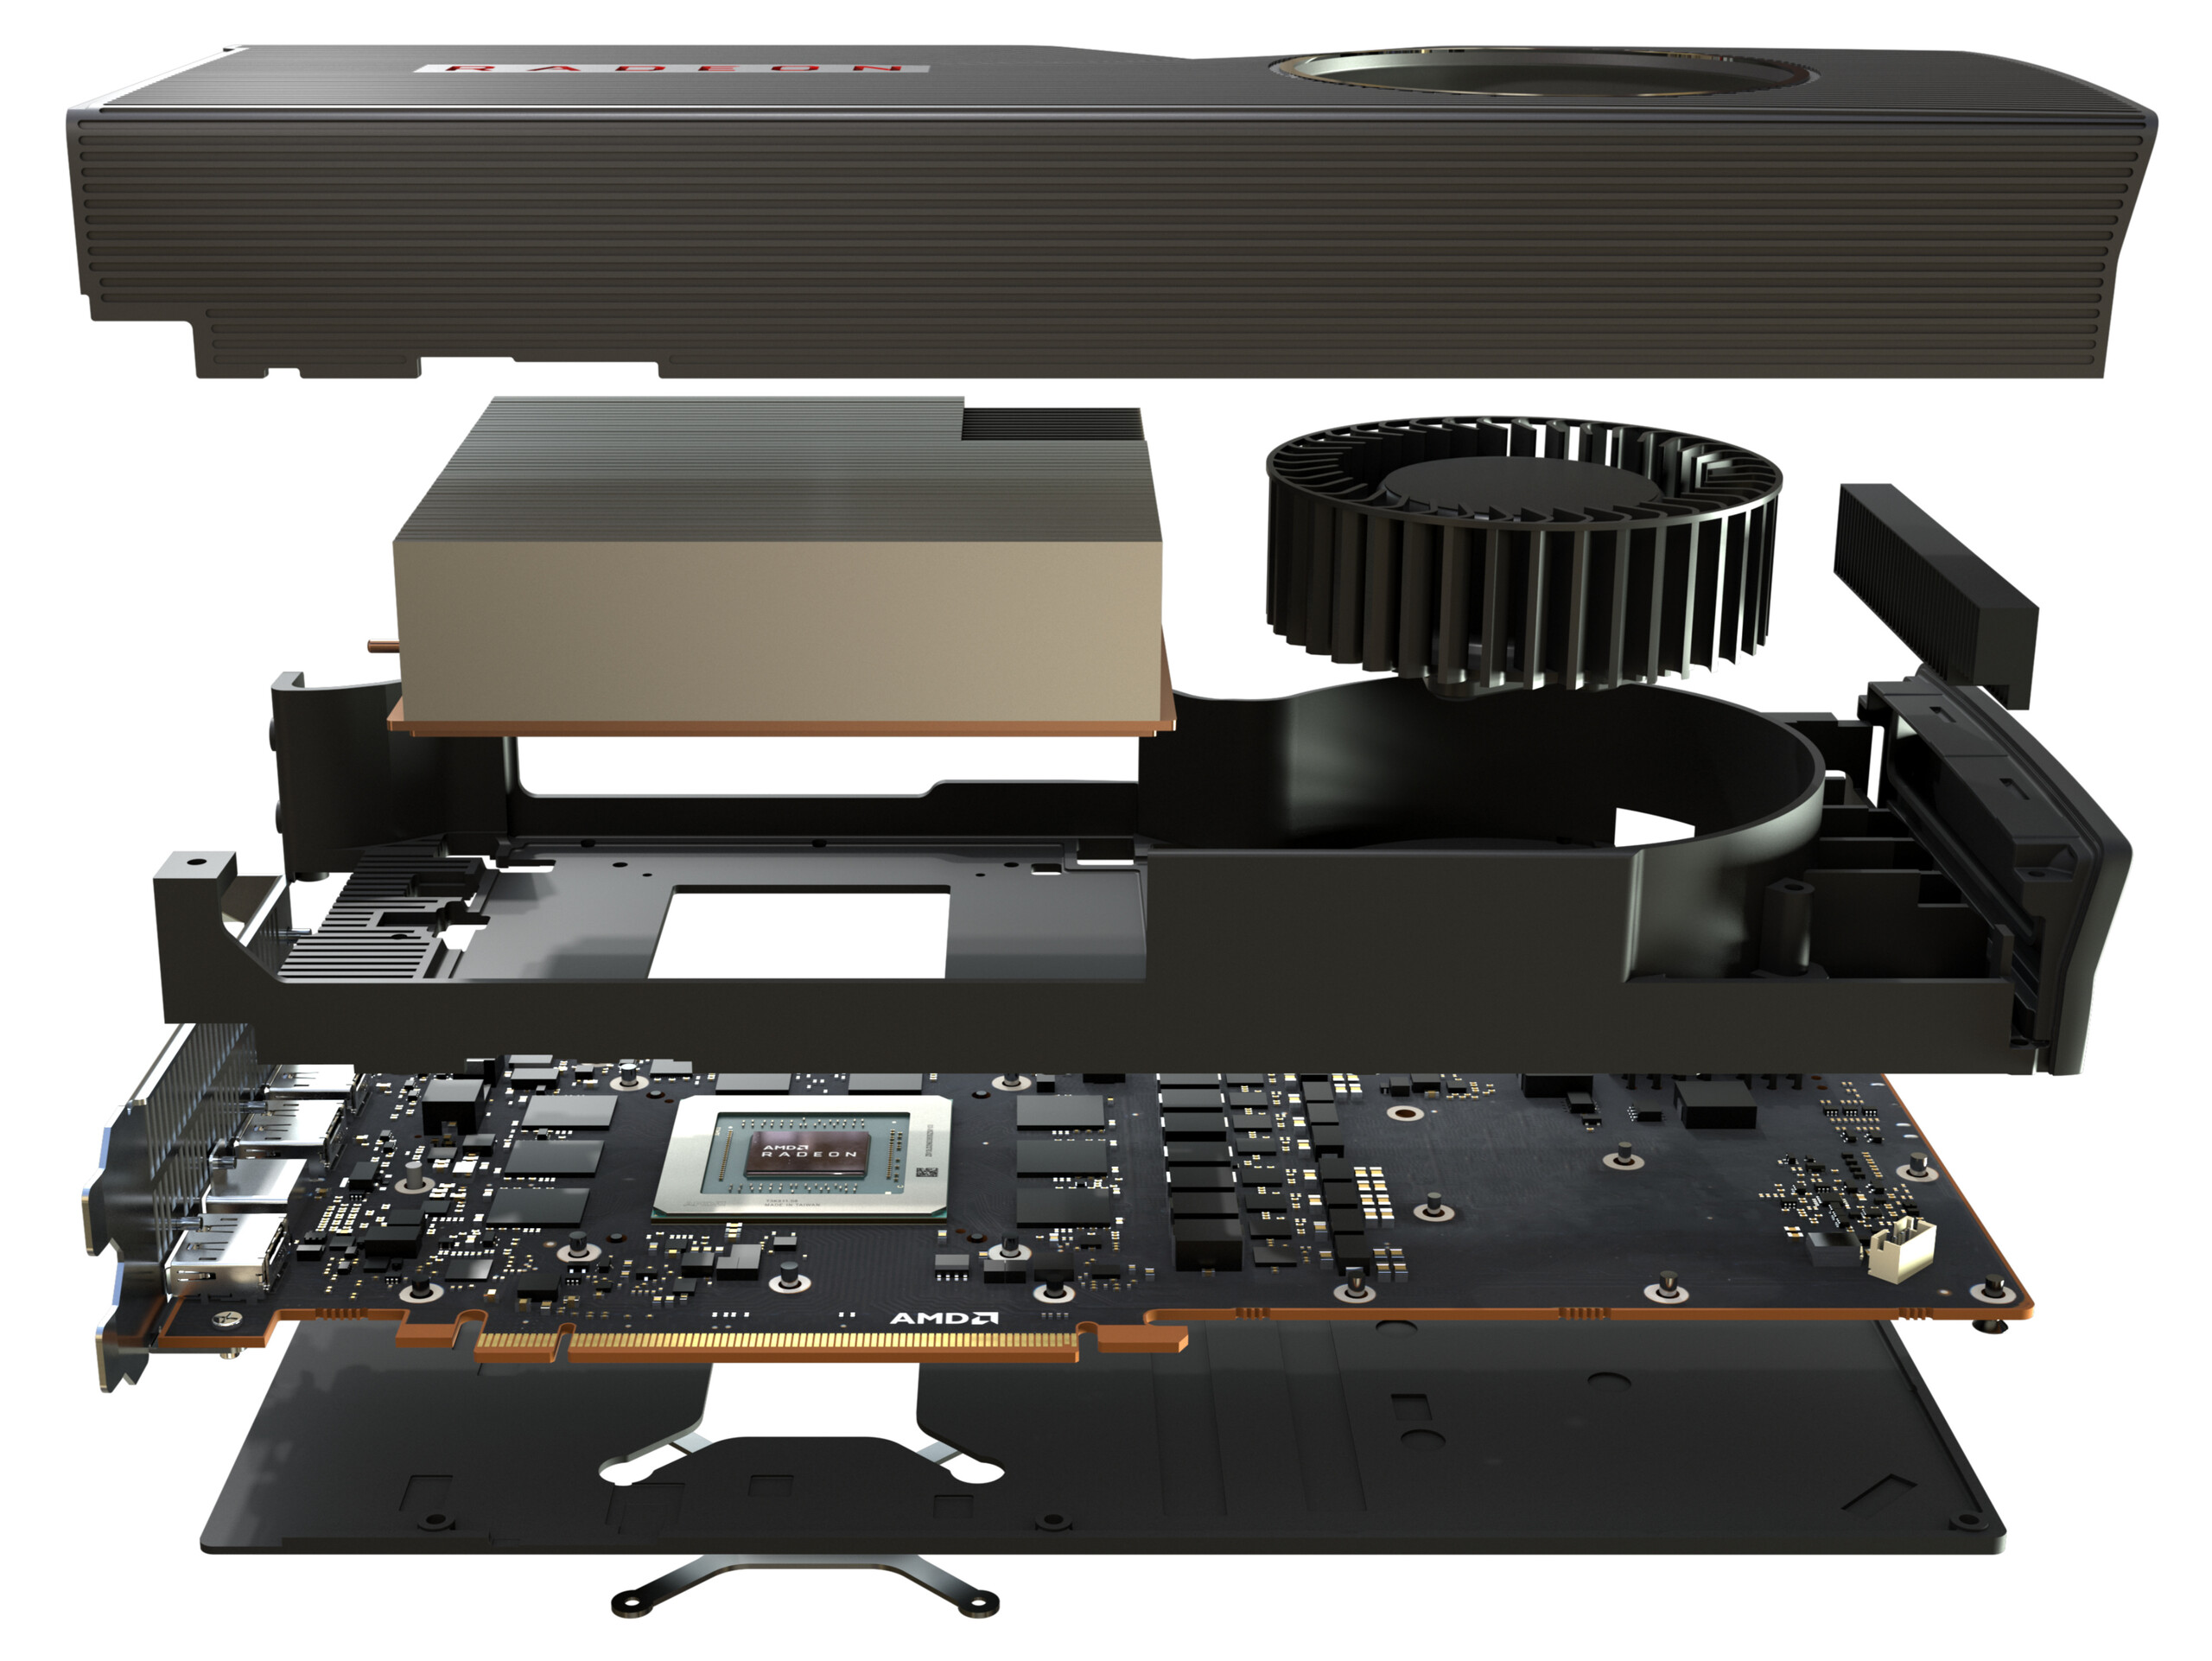
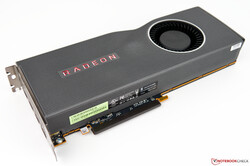
The AMD Radeon RX 5700 XT has a TDP of 225 watts, which is slightly higher than that of the RTX 2070S FE (215 watts). The latest AMD GPUs from the Radeon RX 5700 series still feature a radial cooling fan, which blows the hot air away from the GPU. A vapor chamber is located right above the GPU die to facilitate the removal of excess heat.
If you want to get an RX 5700 XT from AMD, you will have to shell out 420 Euros ($468), including tax. The RX 5700 XT is a lot cheaper than the GeForce RTX 2070S Founders Edition (529 Euros ($589)) and costs about as much as the GeForce RTX 2060S Founders Edition (419 Euros ($467)).
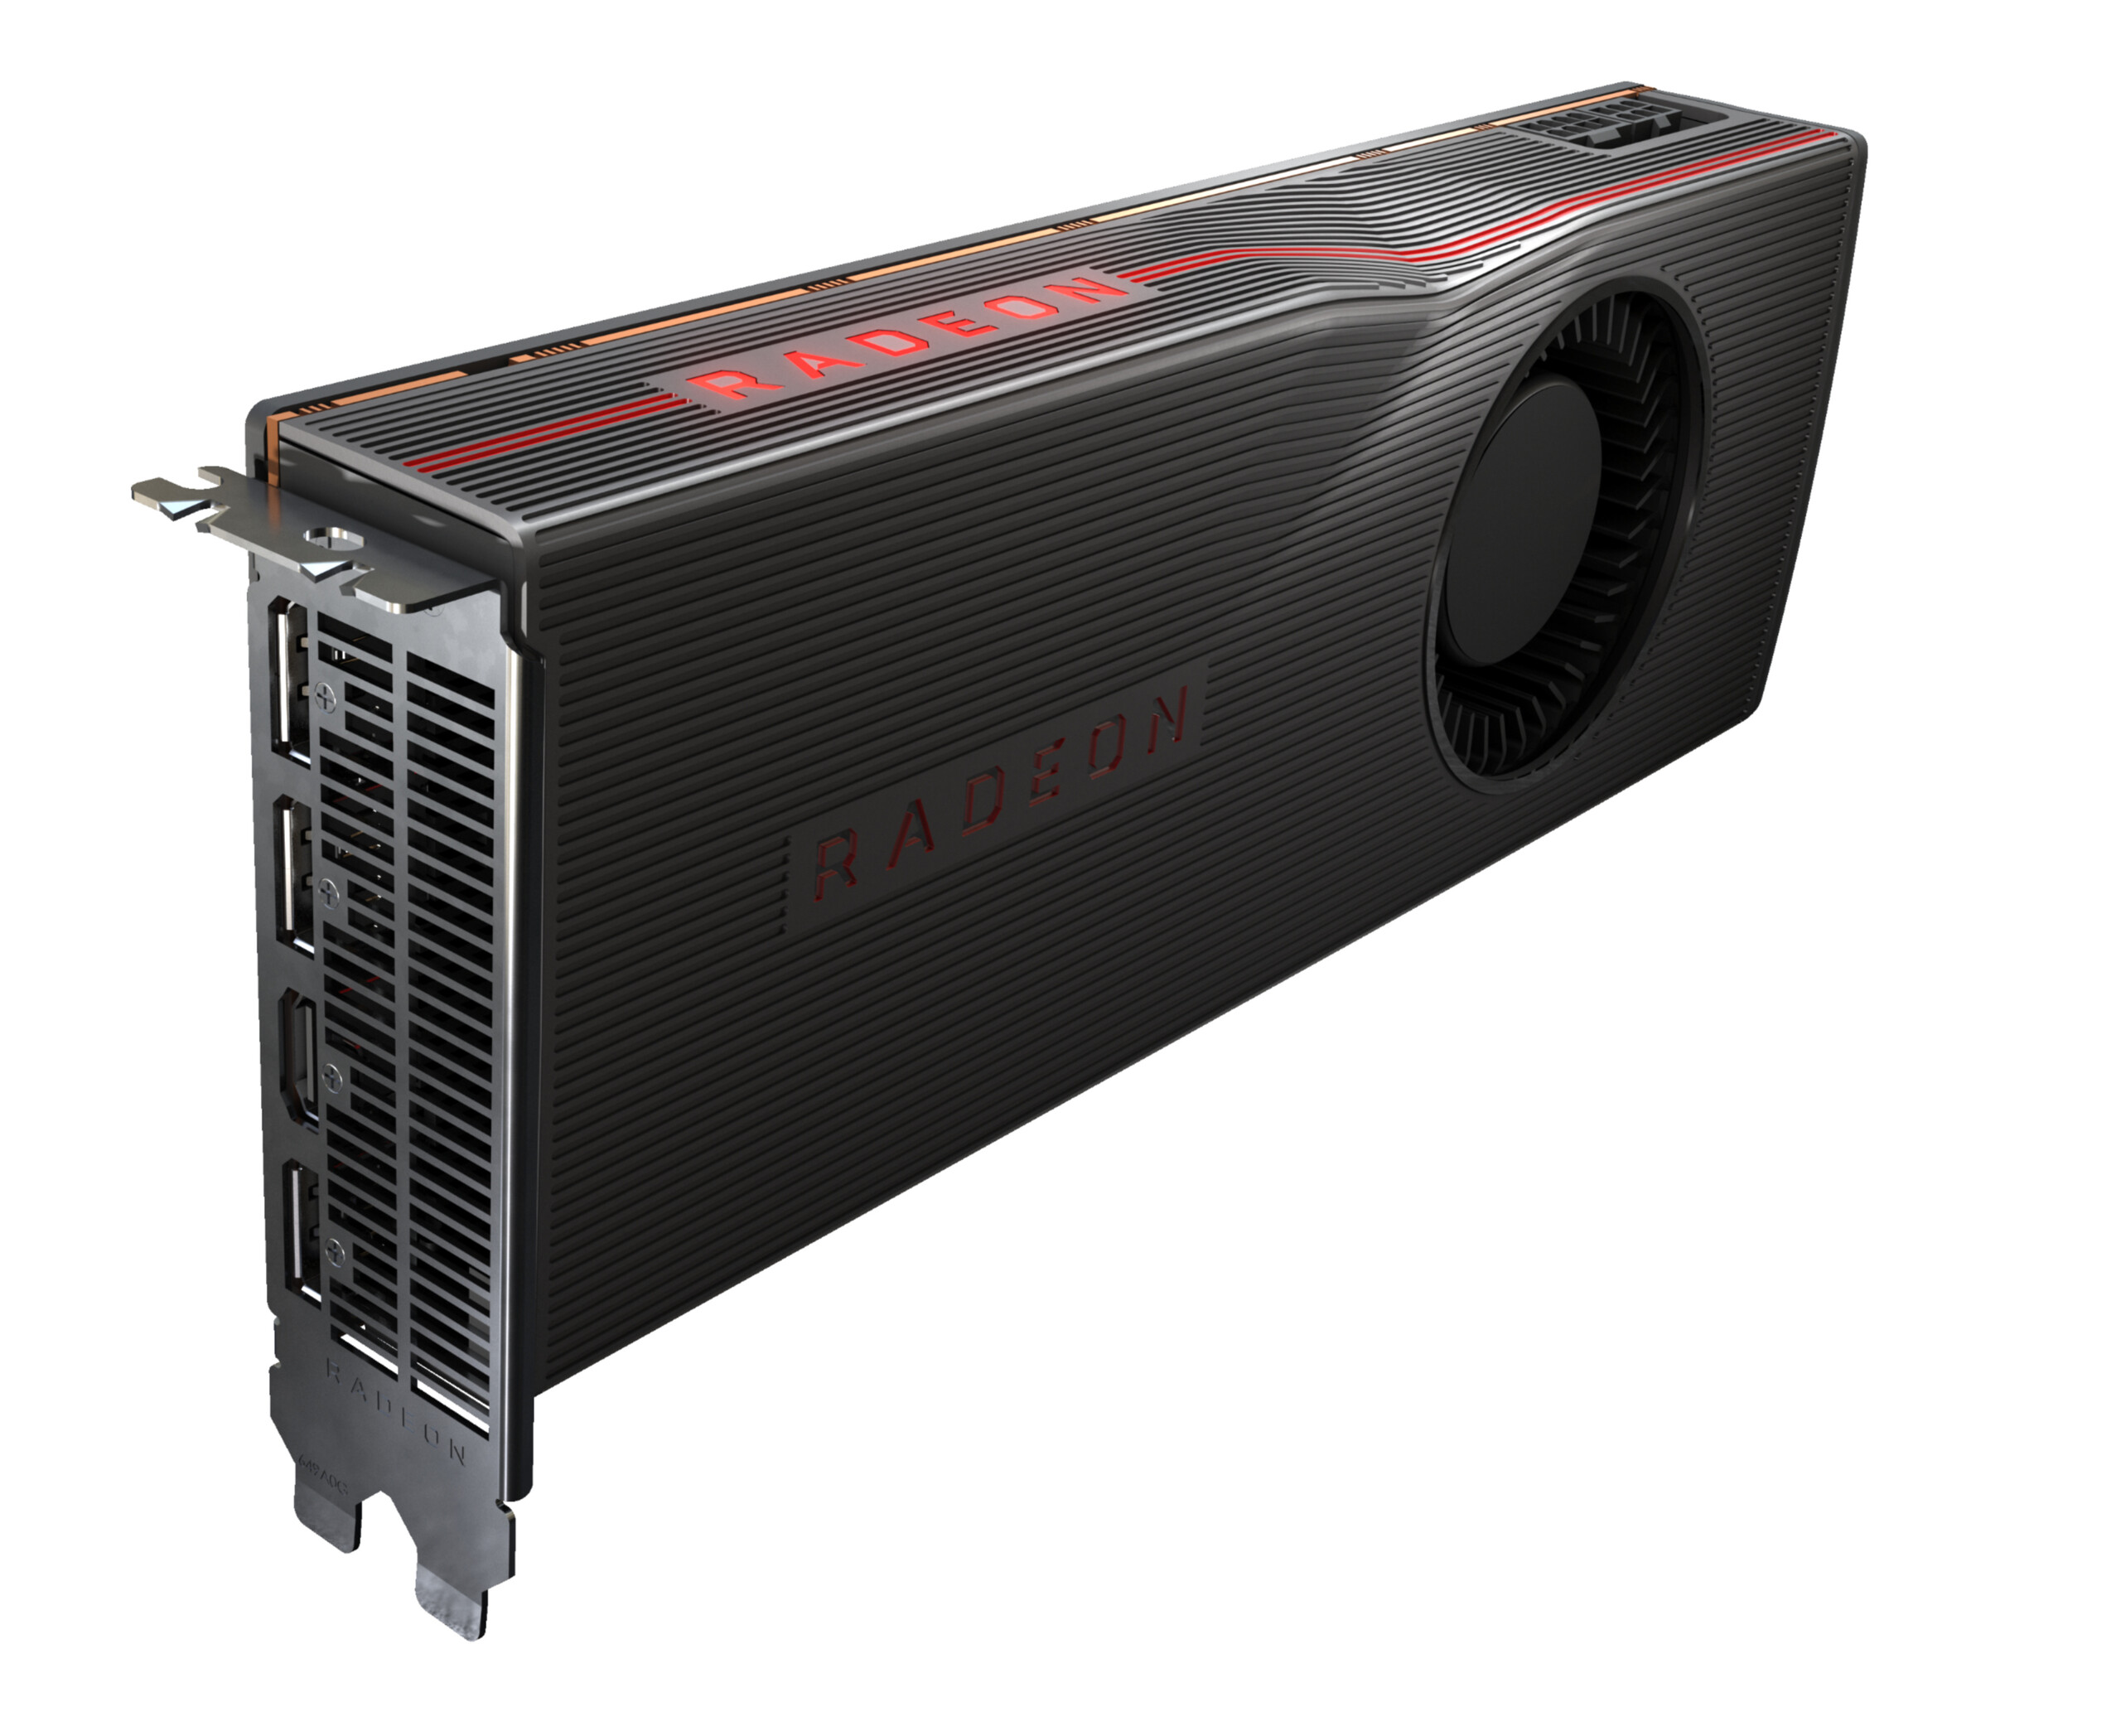
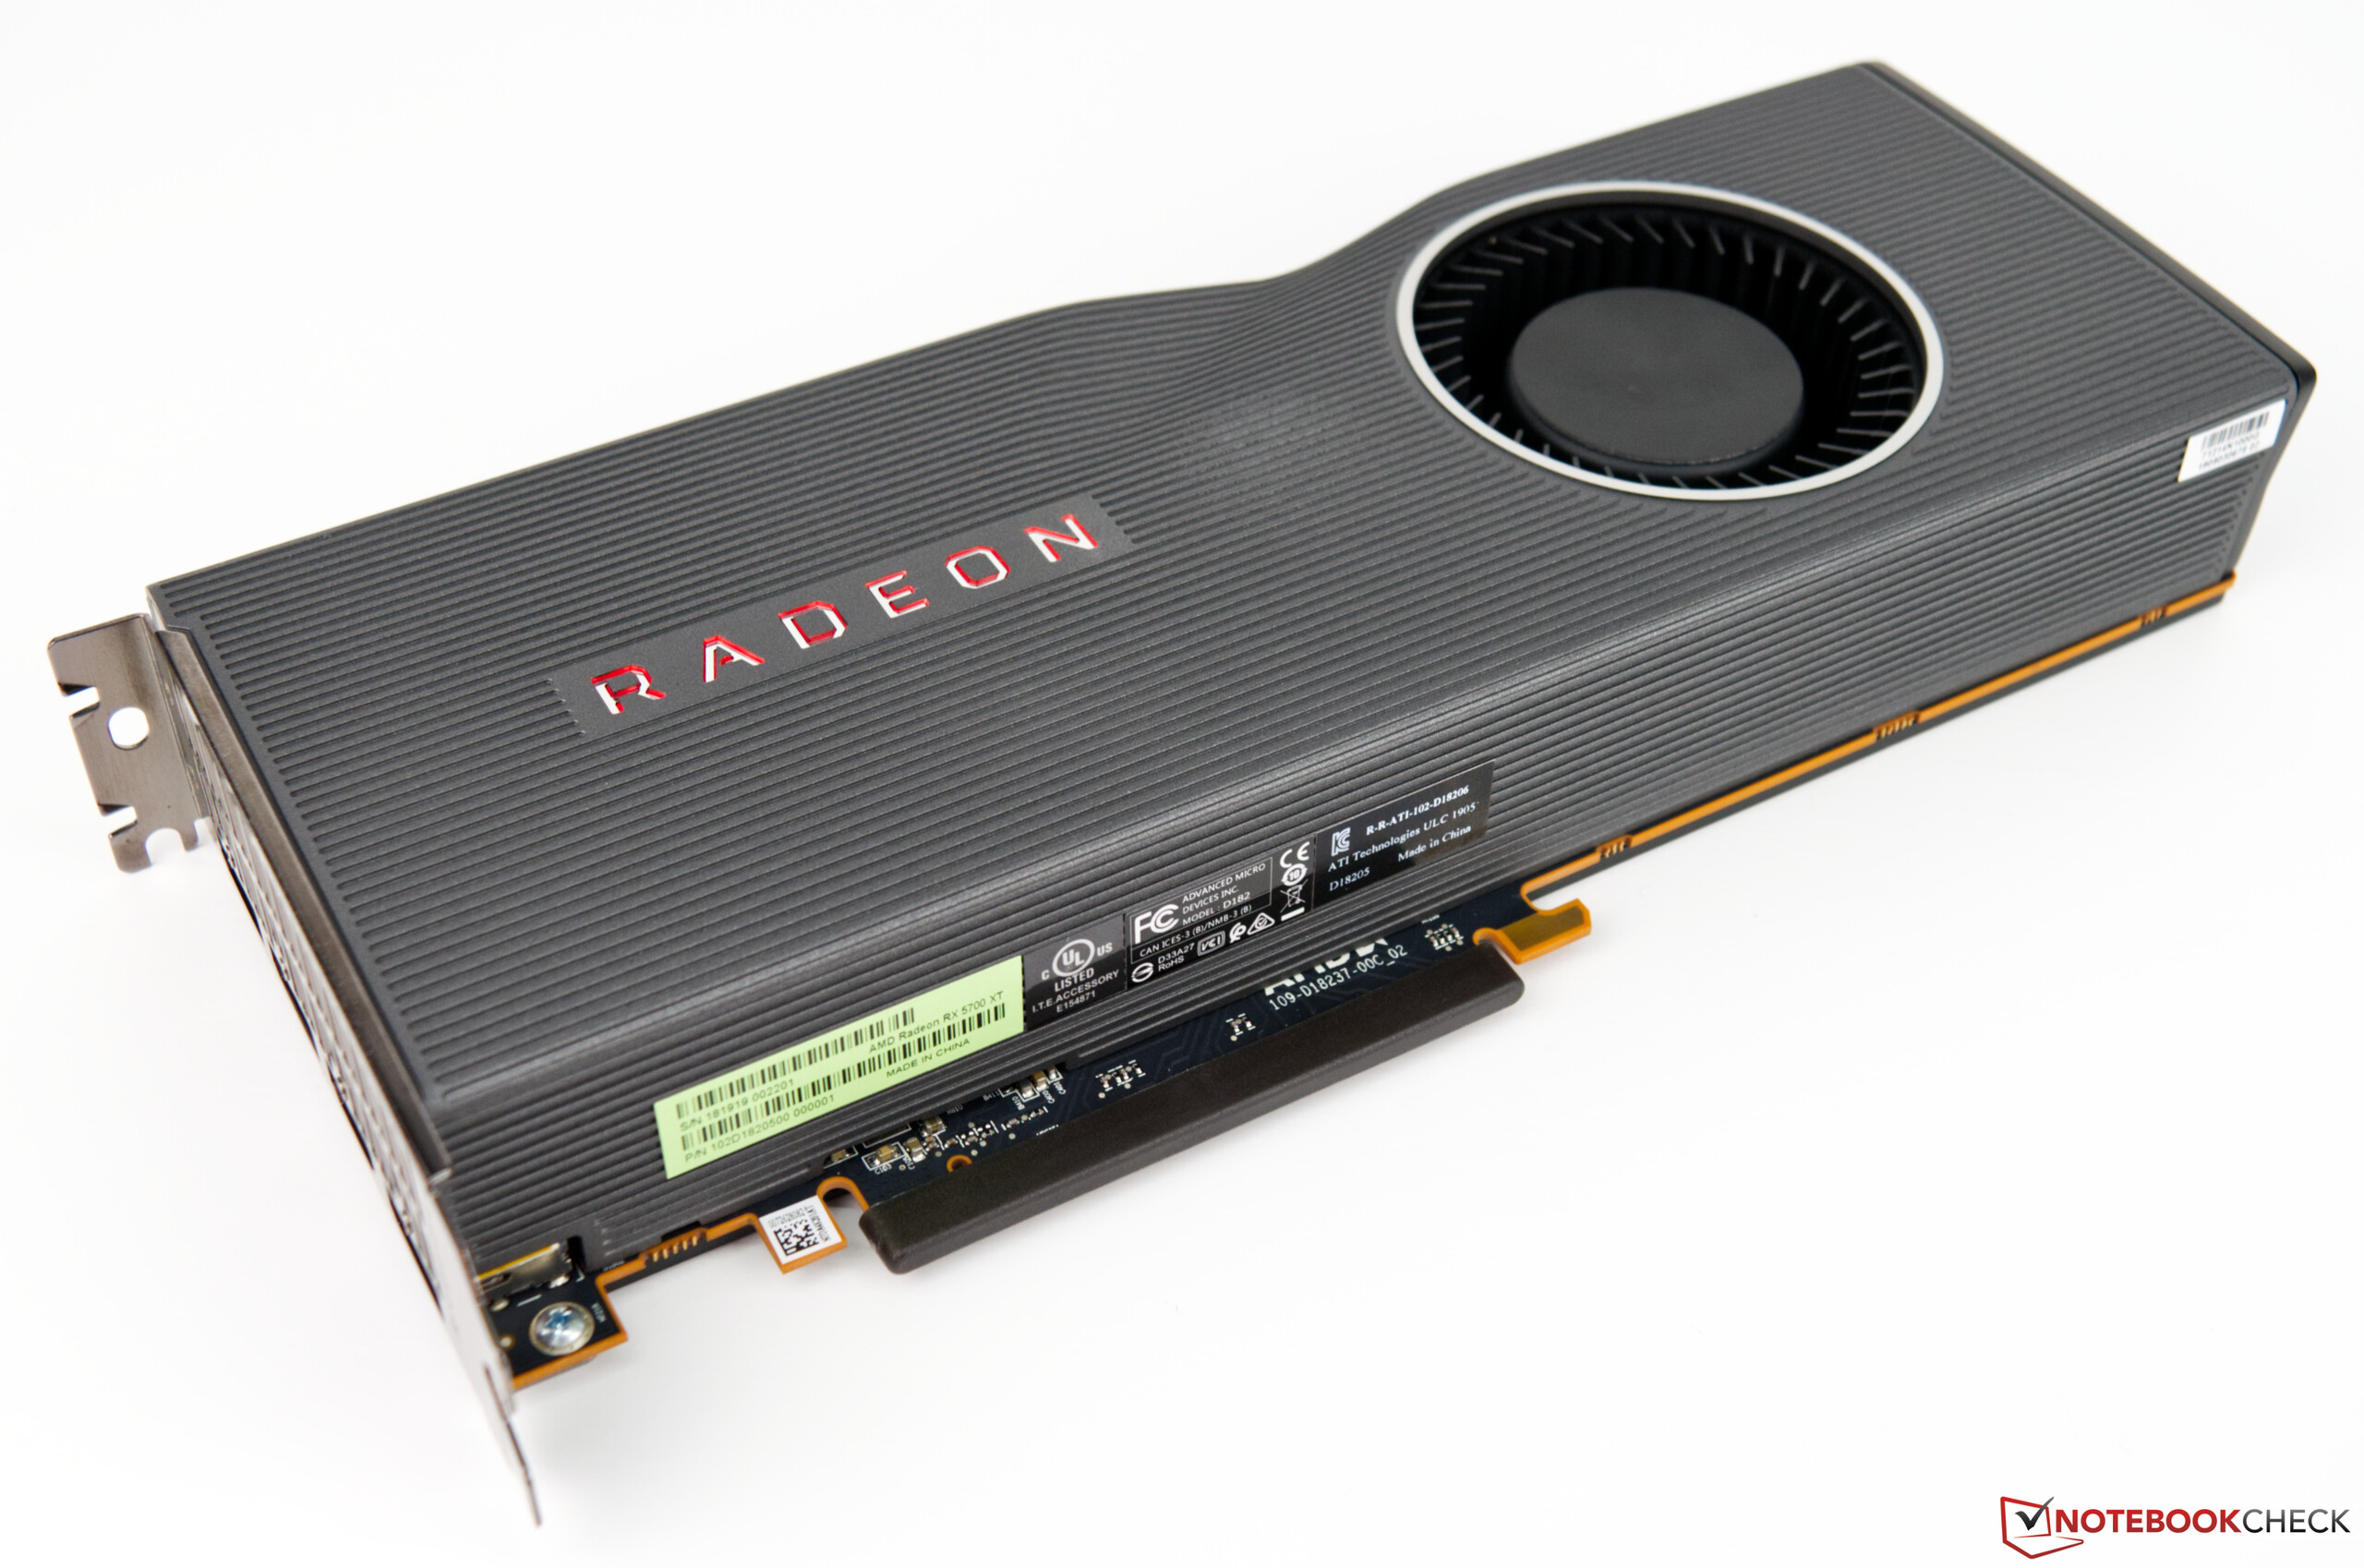
A Look at The AMD Radeon RX 5700 XT
| Specifications | AMD Radeon RX 5700 | AMD Radeon RX 5700 XT | AMD Radeon VII | RX Vega 64 | RTX 2060 | RTX 2060S | RTX 2070 | RTX 2070S |
| Chip | Navi 10 | Navi 10 | Vega 20 | Vega 10 | TU106 | TU106 | TU106 | TU104 |
| Manufacturing process | 7 nm | 7 nm | 7 nm | 14 nm | 12 nm | 12 nm | 12 nm | 12 nm |
| Shading Units | 2304 | 2560 | 3840 | 4096 | 1920 | 2176 | 2304 | 2560 |
| Texture Mapping Units | 144 | 160 | 240 | 256 | 120 | 136 | 144 | 160 |
| Tensor Cores | - | - | - | - | 240 | 272 | 288 | 320 |
| RT Cores | - | - | - | - | 30 | 34 | 36 | 40 |
| Base Clock | 1465 MHz | 1605 MHz | 1400 MHz | 1200 MHz | 1365 MHz | 1470 MHz | 1410 MHz | 1605 MHz |
| Boost Clock | 1625 MHz | 1755 MHz | 1750 MHz | 1536 MHz | 1680 MHz | 1650 MHz | 1620 MHz | 1770 MHz |
| Memory Bus Width | 256 Bit | 256 Bit | 4096 Bit | 2048 Bit | 192 Bit | 256 Bit | 256 Bit | 256 Bit |
| Memory Bandwidth | 448 GB/s | 448 GB/s | 1.024 GB/s | 483.8 GB/s | 336 GB/s | 448 GB/s | 448 GB/s | 448 GB/s |
| Memory Size | 8 GB GDDR6 | 8 GB GDDR6 | 16 GB HBM2 | 8 GB HBM2 | 6 GB GDDR6 | 8 GB GDDR6 | 8 GB GDDR6 | 8 GB GDDR6 |
| TDP (in watts) | 180 W | 225 W | 295 W | 295 W | 160 W | 175 W | 175 W | 215 W |
The Test Bench - Based on the Ryzen 7 2700X
Our test bench is based on a current AMD platform. The Gigabyte X470 Aorus Gaming 7 WiFi serves as the motherboard. The CPU, the AMD Ryzen 7 2700X, offers a lot of performance. The system is cooled by an all-in-one water cooler from Be Quiet (Silent Loop 280mm). The 16 GB of 3400 MHz RAM comes from G-Skill. The Acer Predator XB321HK does not represent a bottleneck, thanks to its 4K resolution. We are very grateful to AMD for providing us with the above-mentioned system.
We made a conscious decision not to use the X570 platform with the Ryzen 3900X to ensure a fair comparison with Nvidia’s Super GPUs.
| Case | Corsair Carbide Air 540 ATX Cube |
| CPU | AMD Ryzen 7 2700X |
| CPU Kühler | Be Quiet Silent Loop 280mm |
| RAM | G-Skill Sniper X 16 GB DDR4 3.400 MHz |
| Motherboard | Gigabyte X470 Aorus Gaming 7 WiFi |
| Monitor | Acer Predator XB321HK 4K |
| SSD | ADATA SP900 M.2 SSD 256GB (system) |
| SSD | Western Digital PC SN720 NVMe SSD 512GB (for games) |
| SSD | Crucial MX500 2TB (for games) |
| OS | Microsoft Windows 10 Professional 64-Bit (Version 1903) |
| AMD Drivers | Adrenalin 19.7.2 (20.07.2019) |
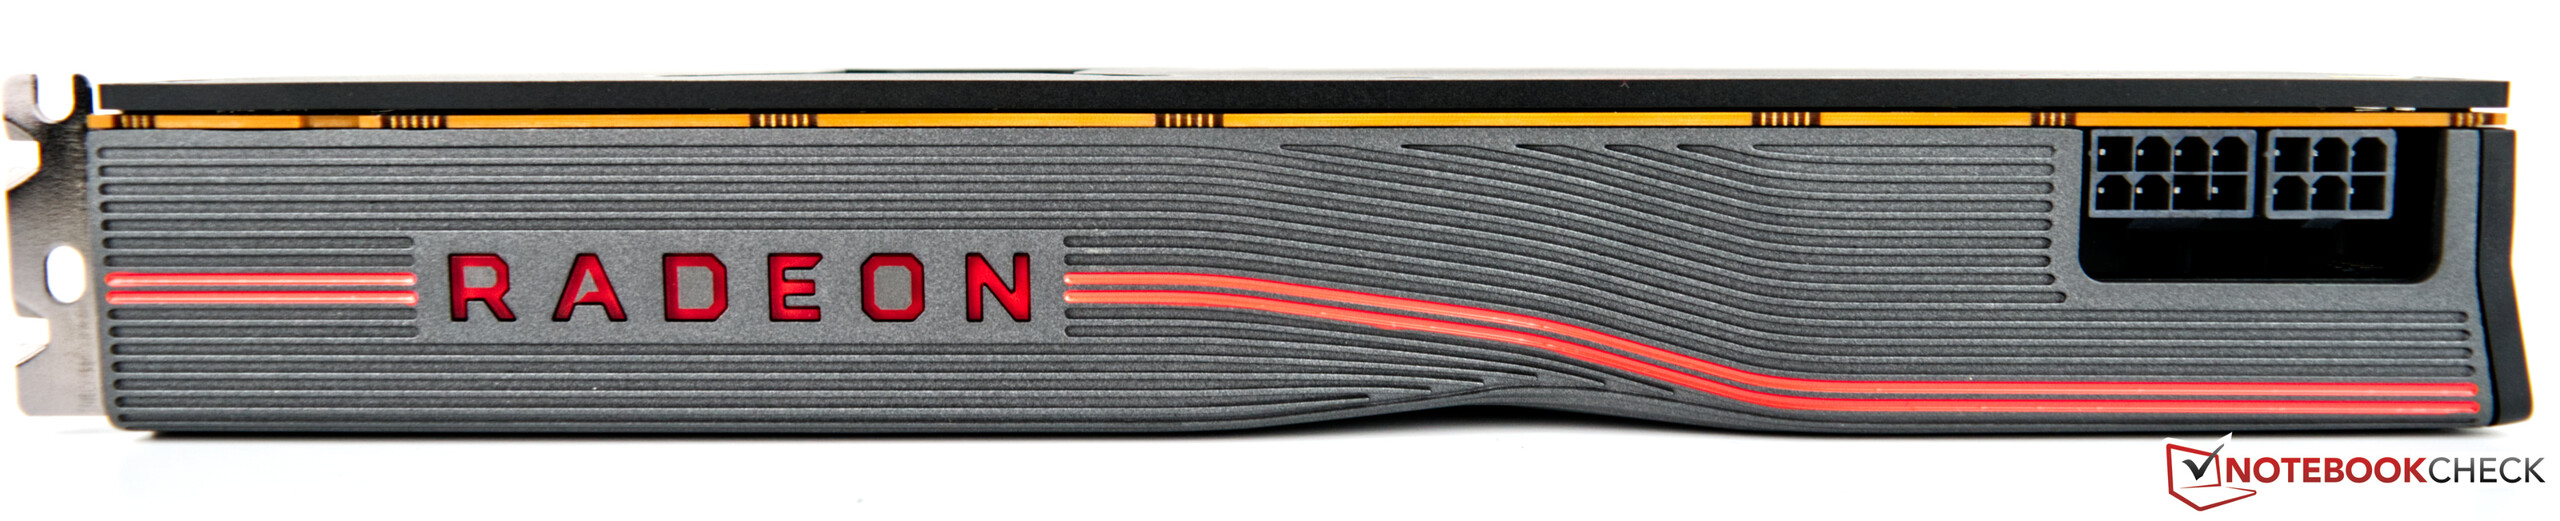
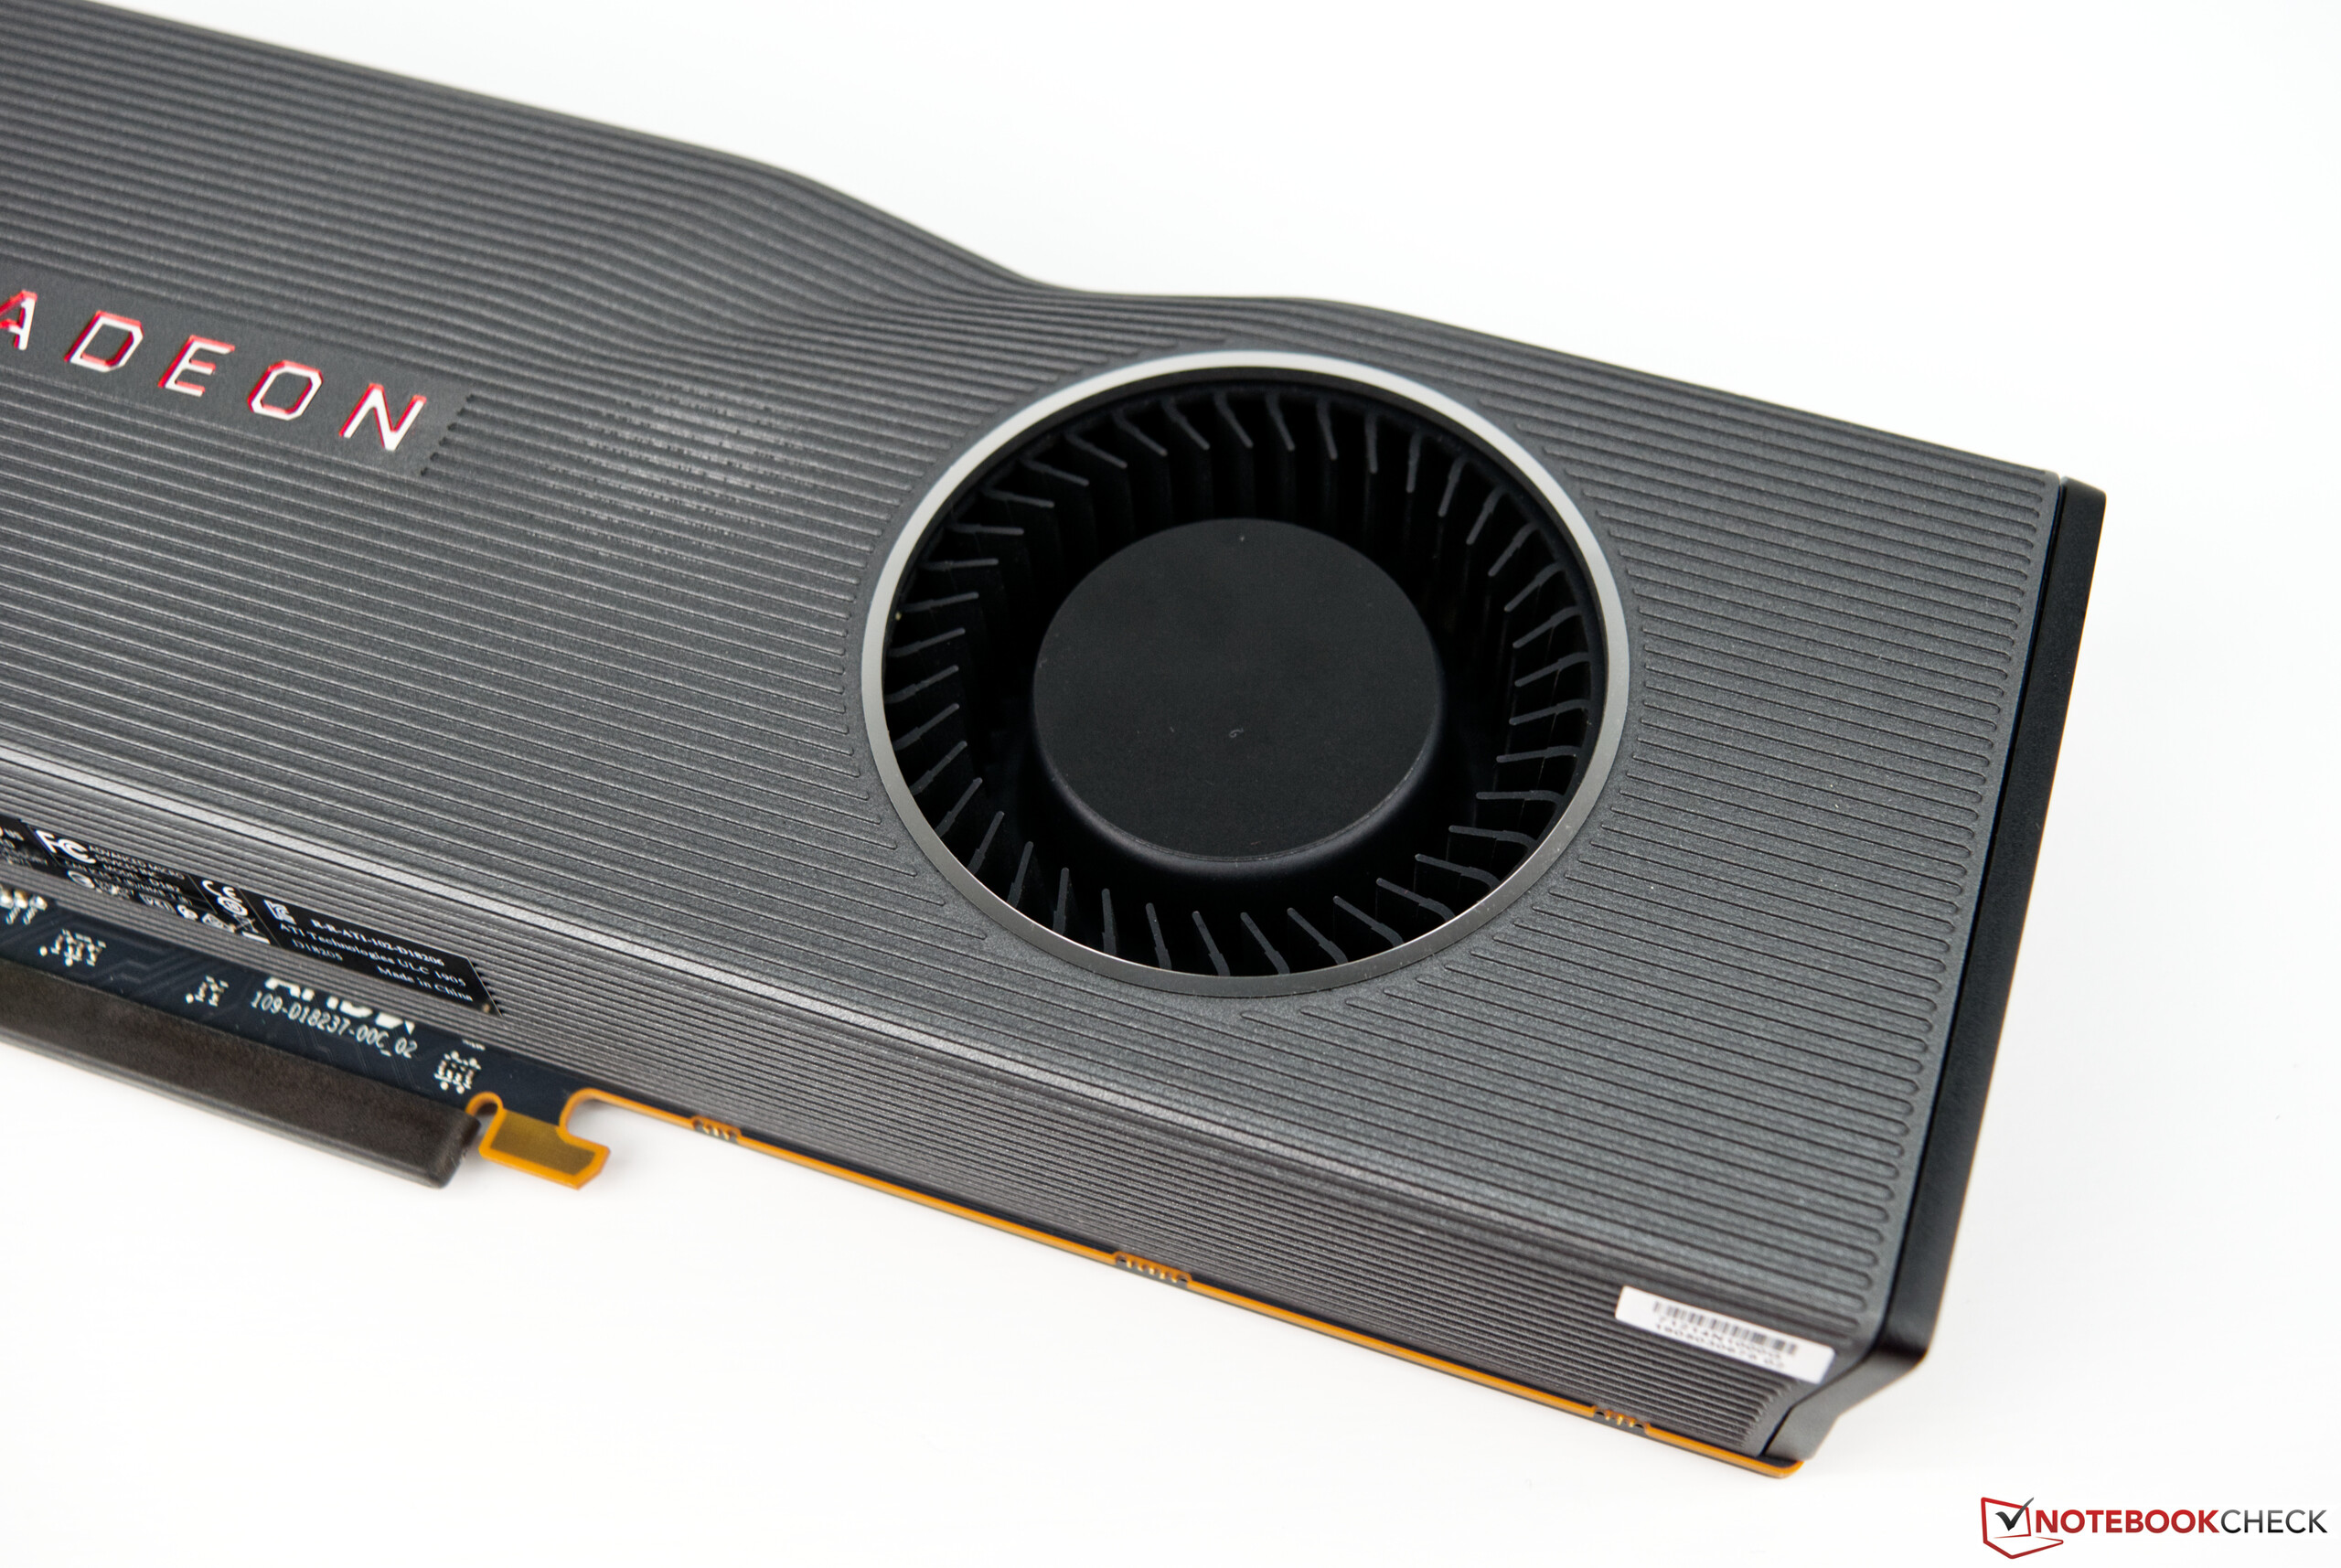
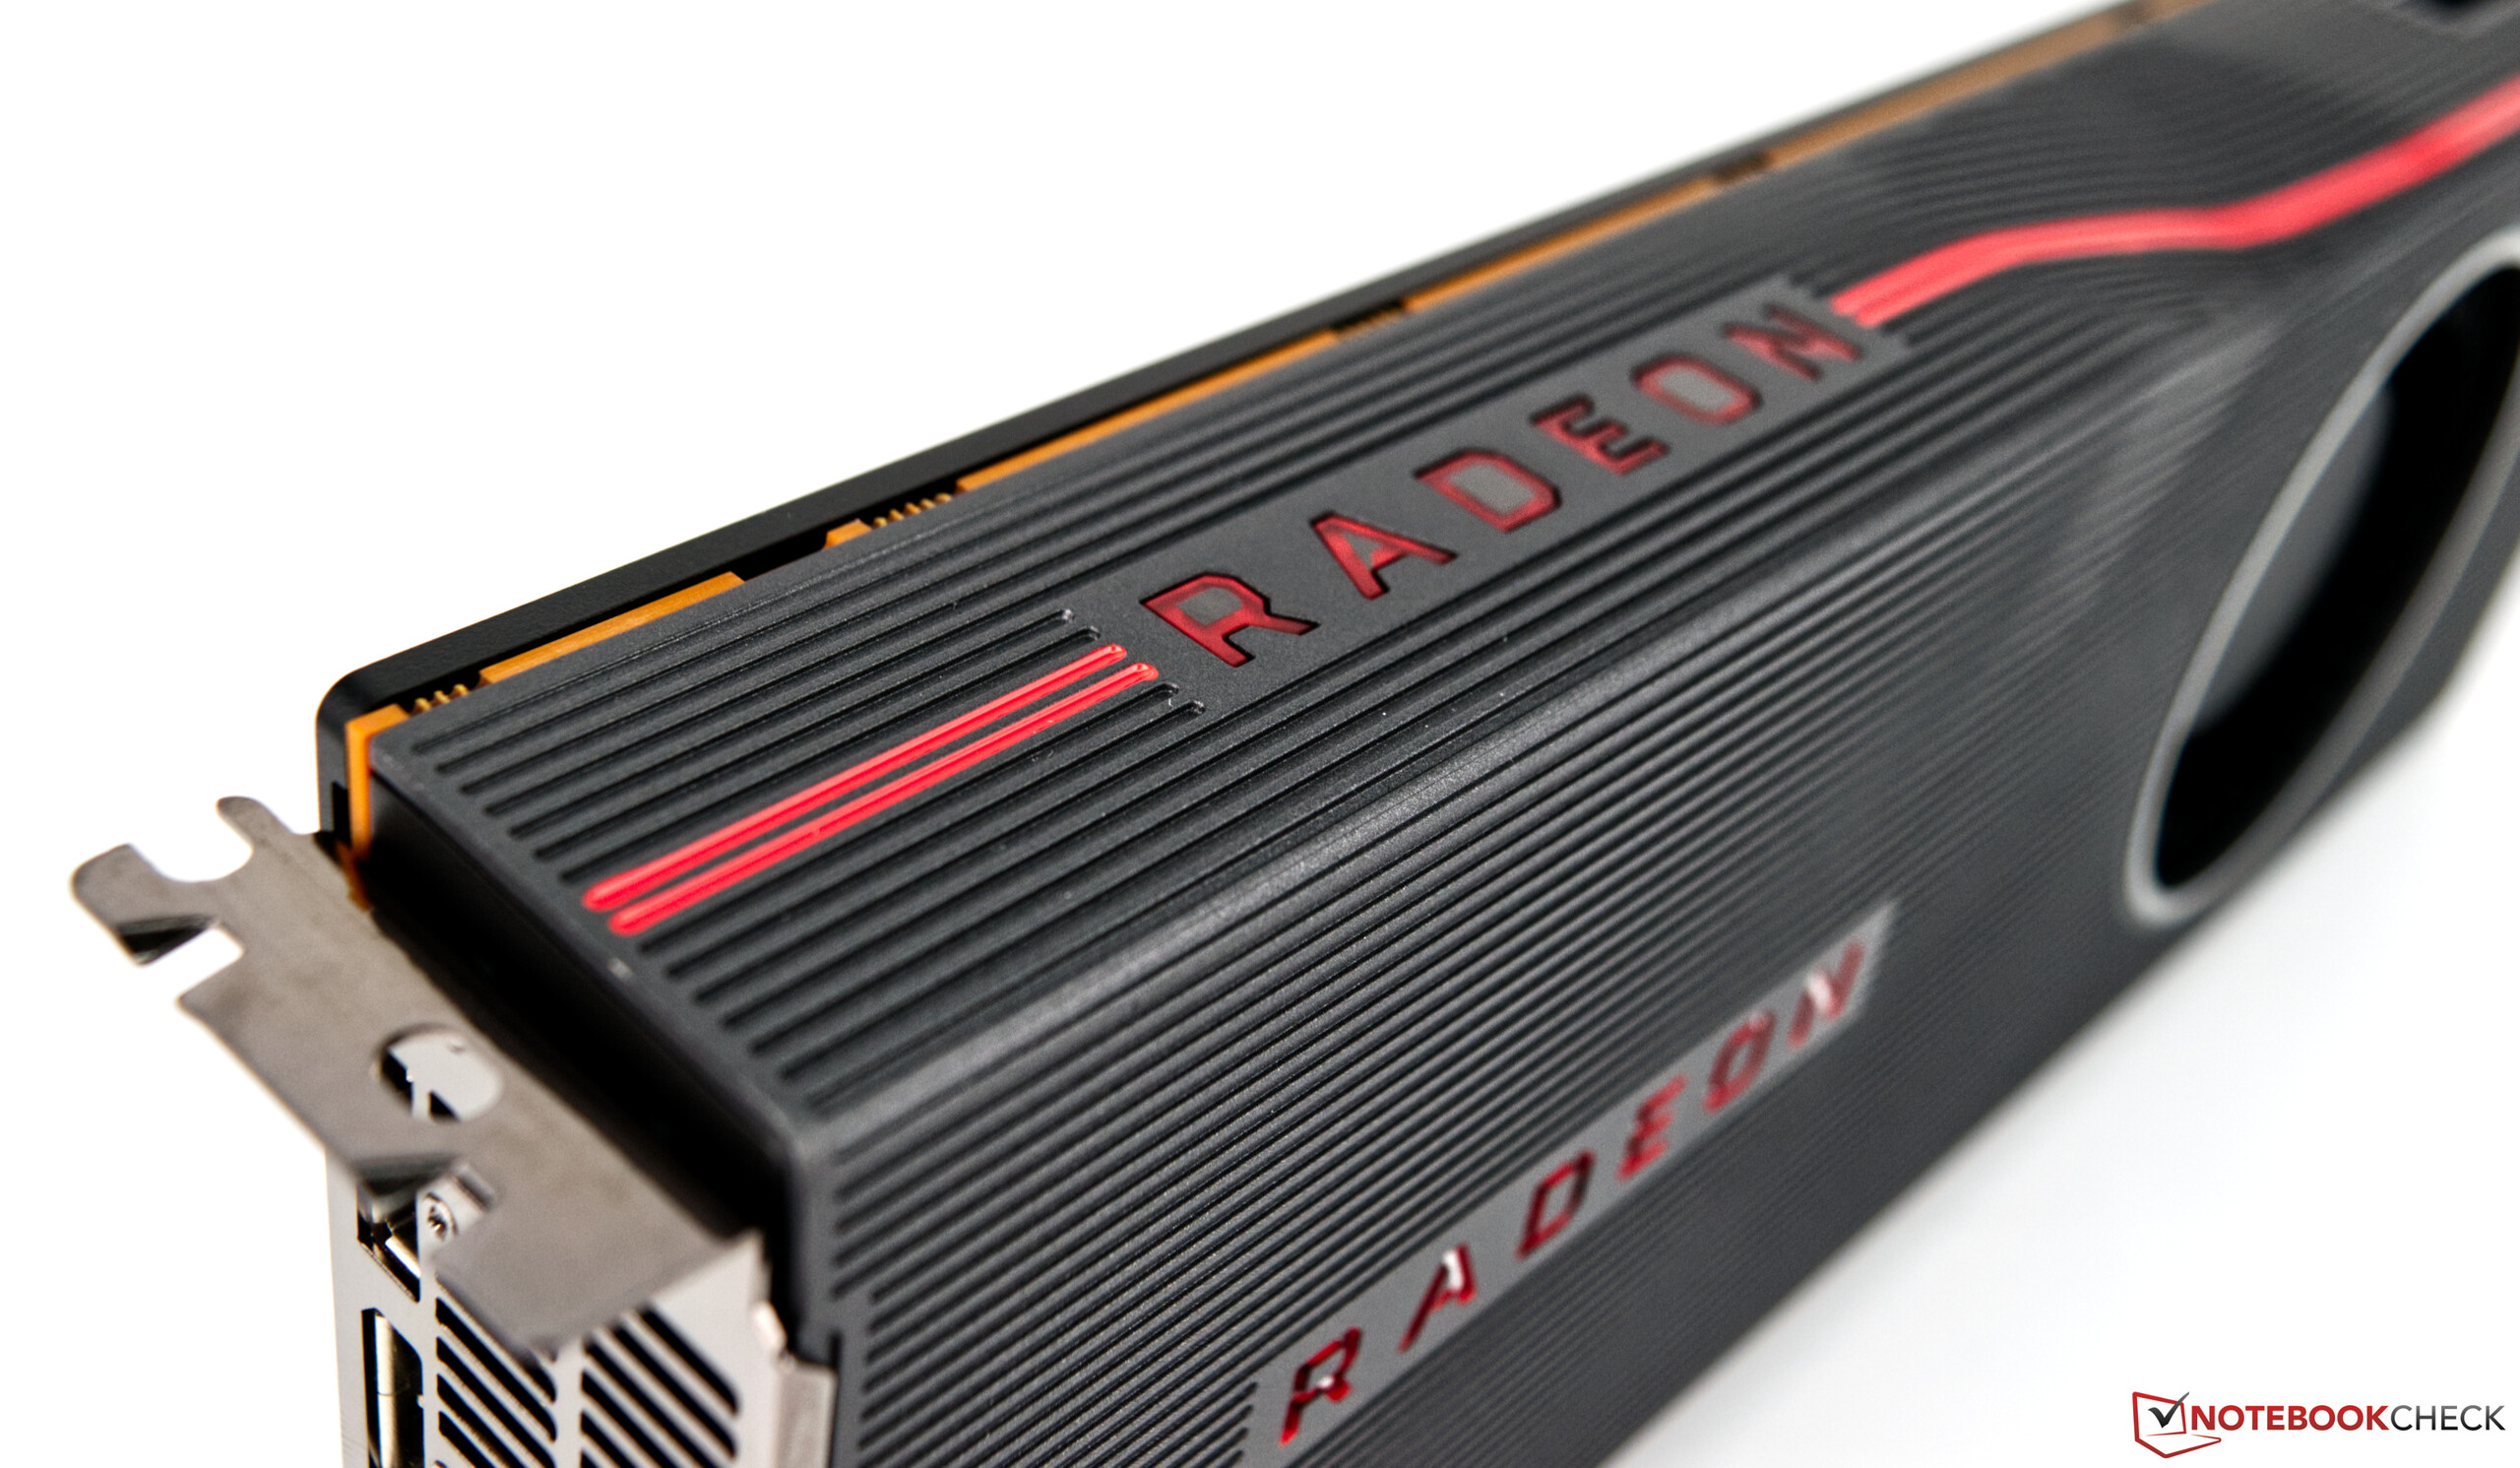
The AMD Radeon RX 5700 XT in Overview
The Core Clocks of the AMD Radeon RX 5700 XT
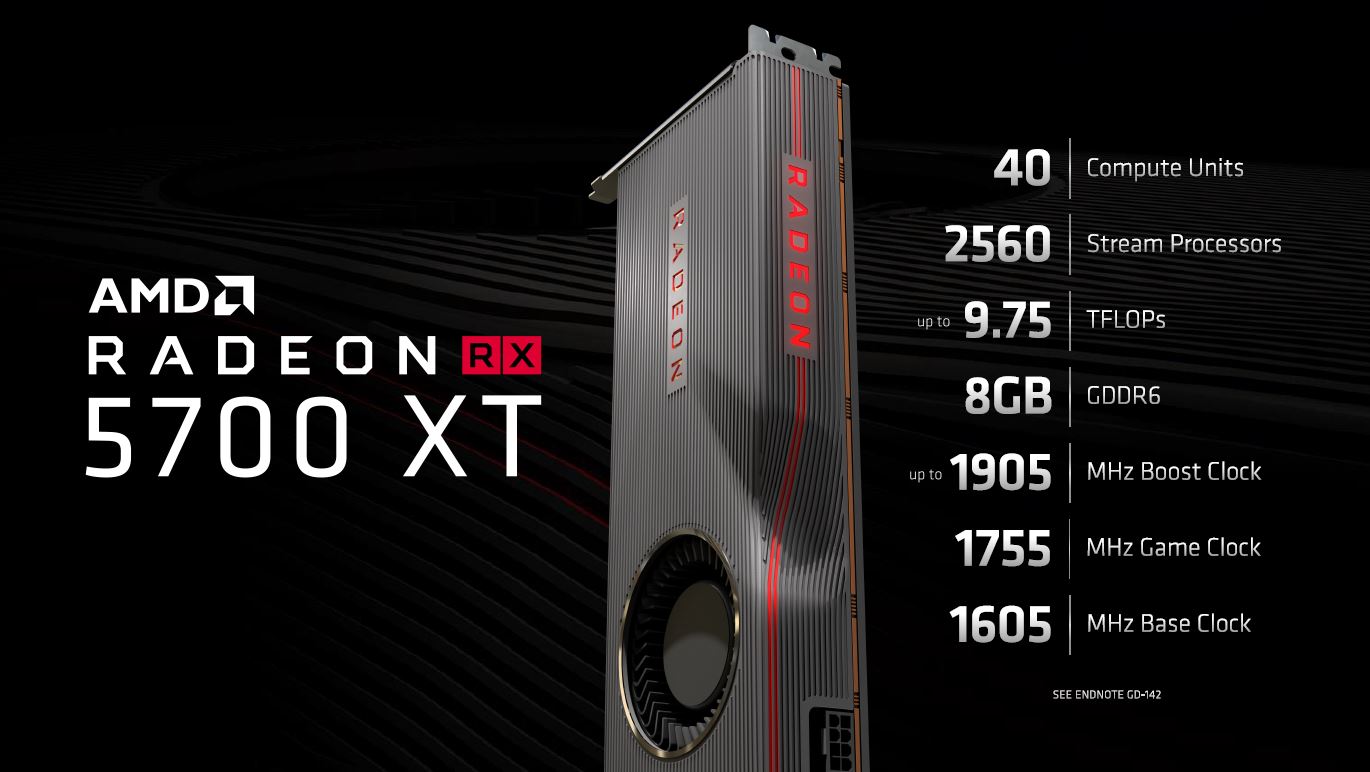
Just like with the smaller Navi-based GPU, AMD specifies three different clock rates for the RX 5700 XT. The base clock of the reference model is 1605 MHz and the maximum boost clock is 1905 MHz. There is also the game clock (1755 MHz), which is an average core clock that users should expect to see in most games.
With the RX 5700 series, AMD relies on GDDR6 memory for the first time. AMD could have utilized HBM2 memory, but it decided to go with a cheaper solution. This was a good choice, especially in terms of keeping the costs down. This does not disadvantage AMD in any way, shape or form because the RTX 2070S FE uses the same GDDR6 video memory. Both GPUs have the same memory speed (7000 MHz). The bandwidth amounts to 448 GB/s, which is somewhat lower than the memory bandwidth of the RX Vega 64. The significantly higher manufacturing costs of the Vega 64 do not seem to result in any sort of significant performance advantage.
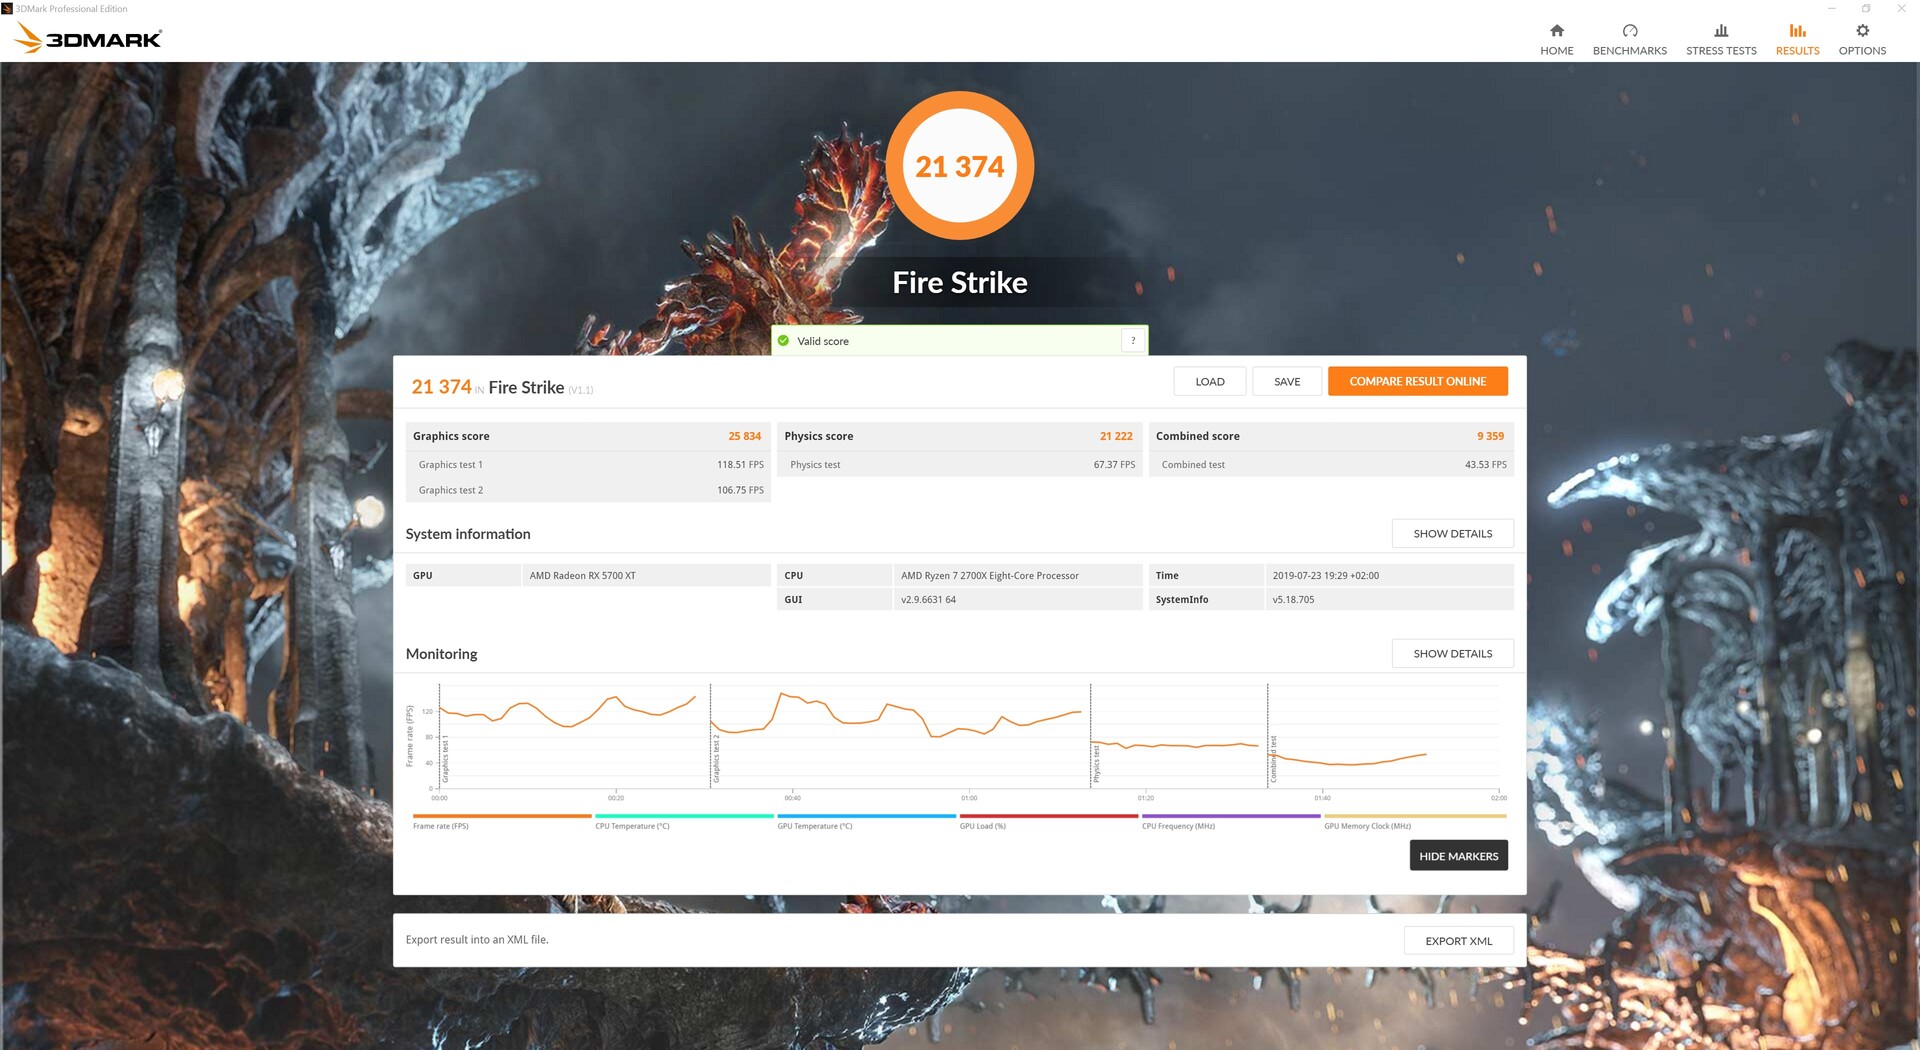
Synthetic Benchmarks
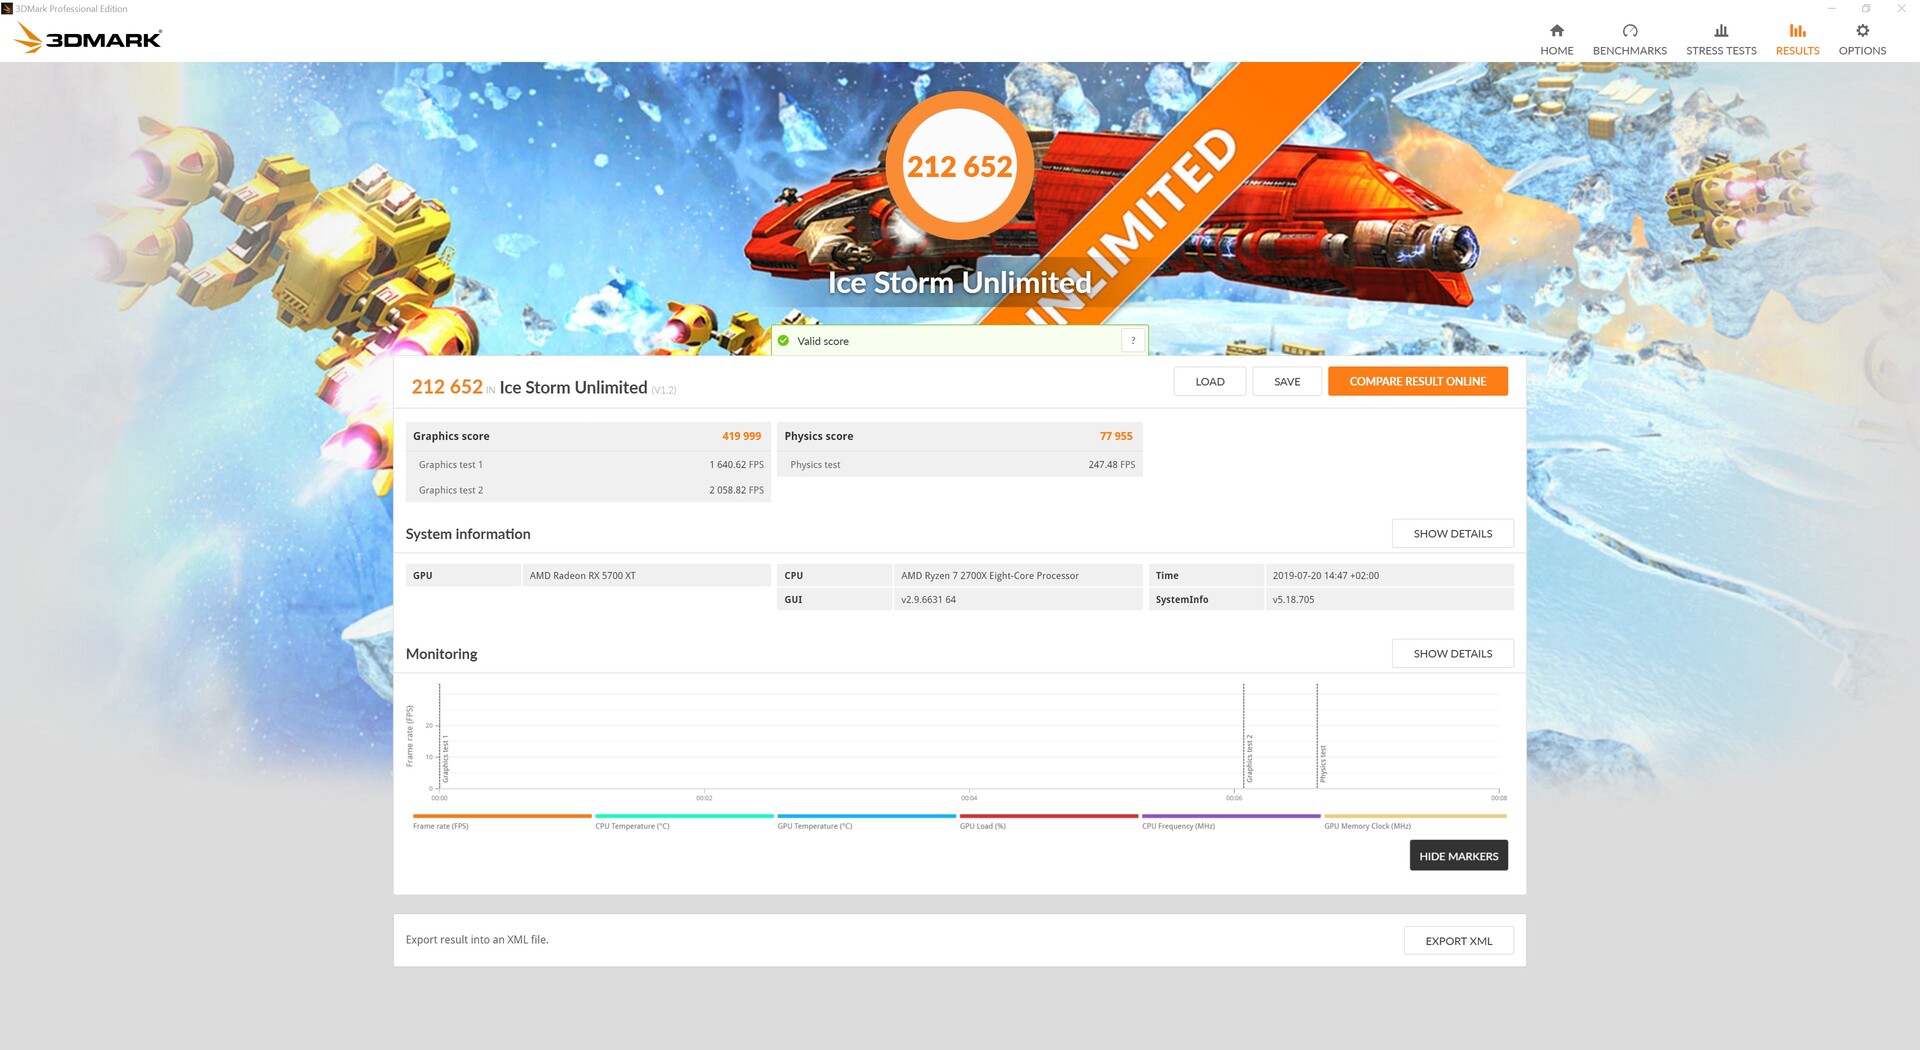
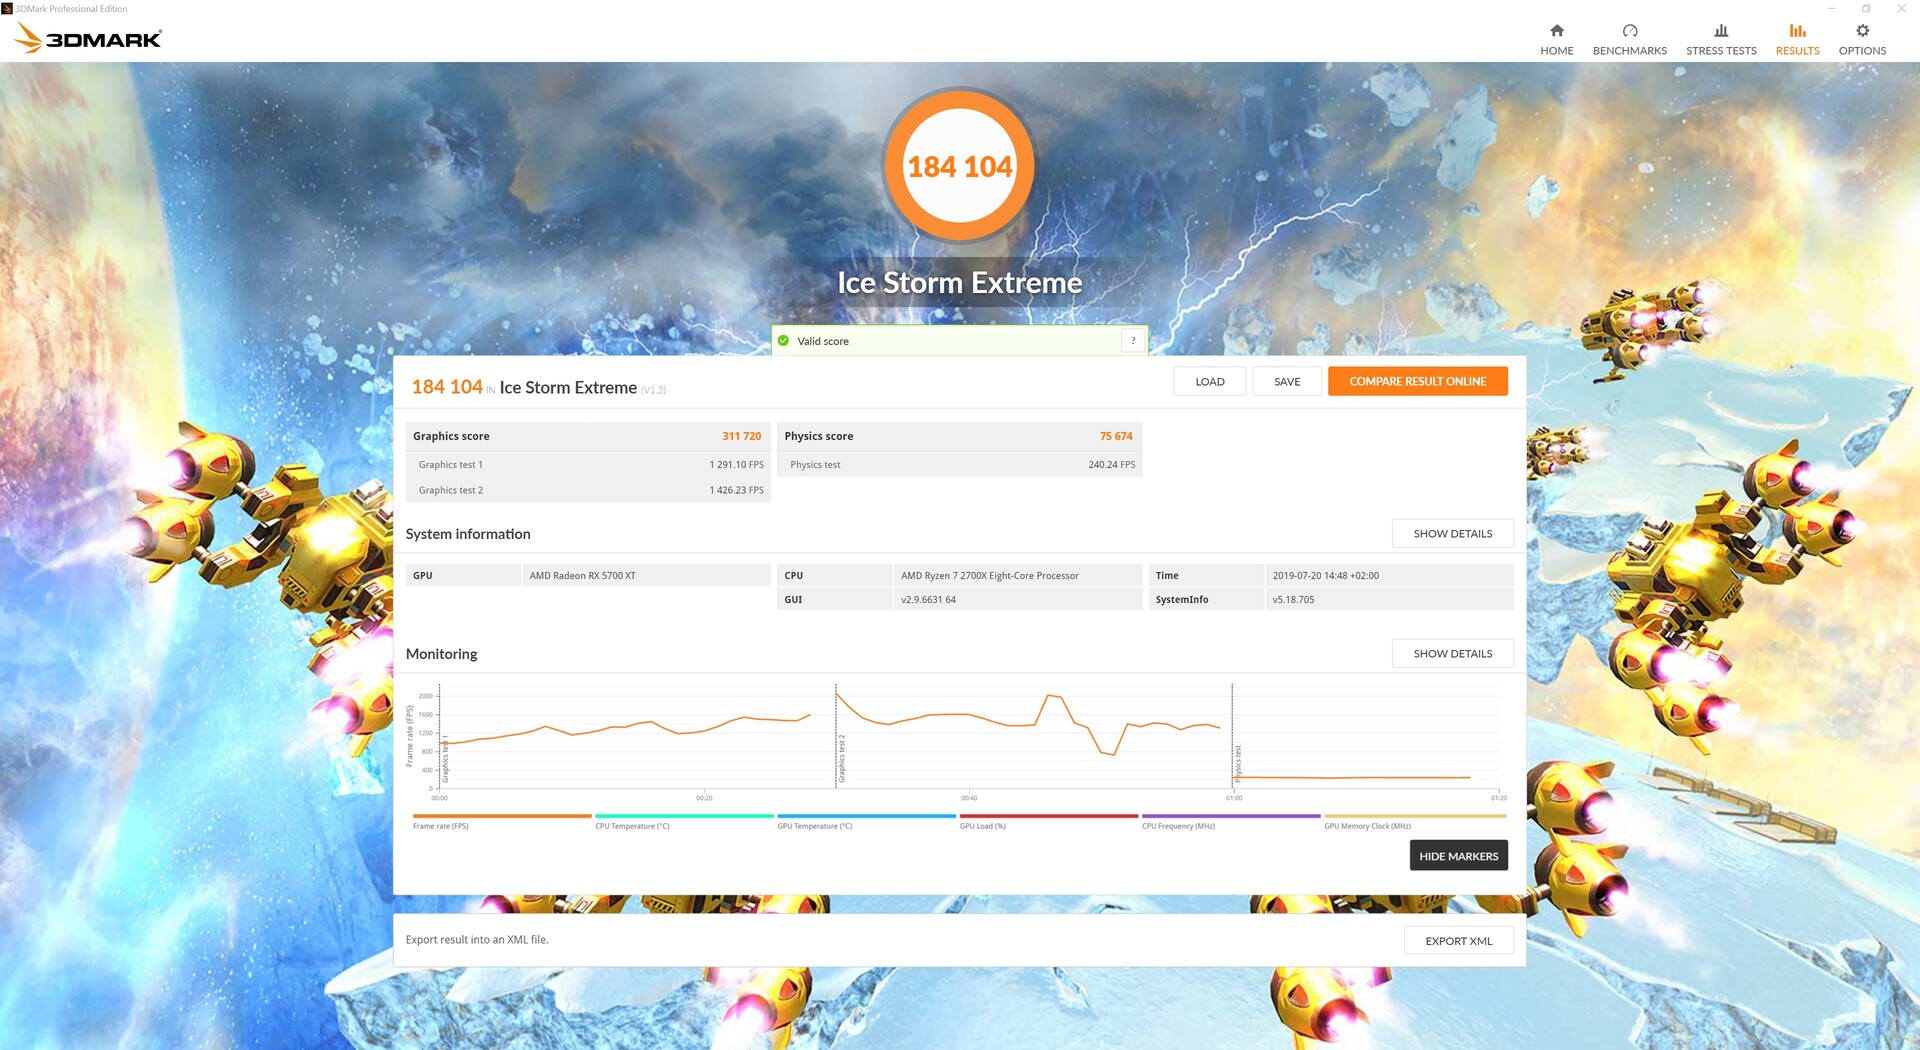
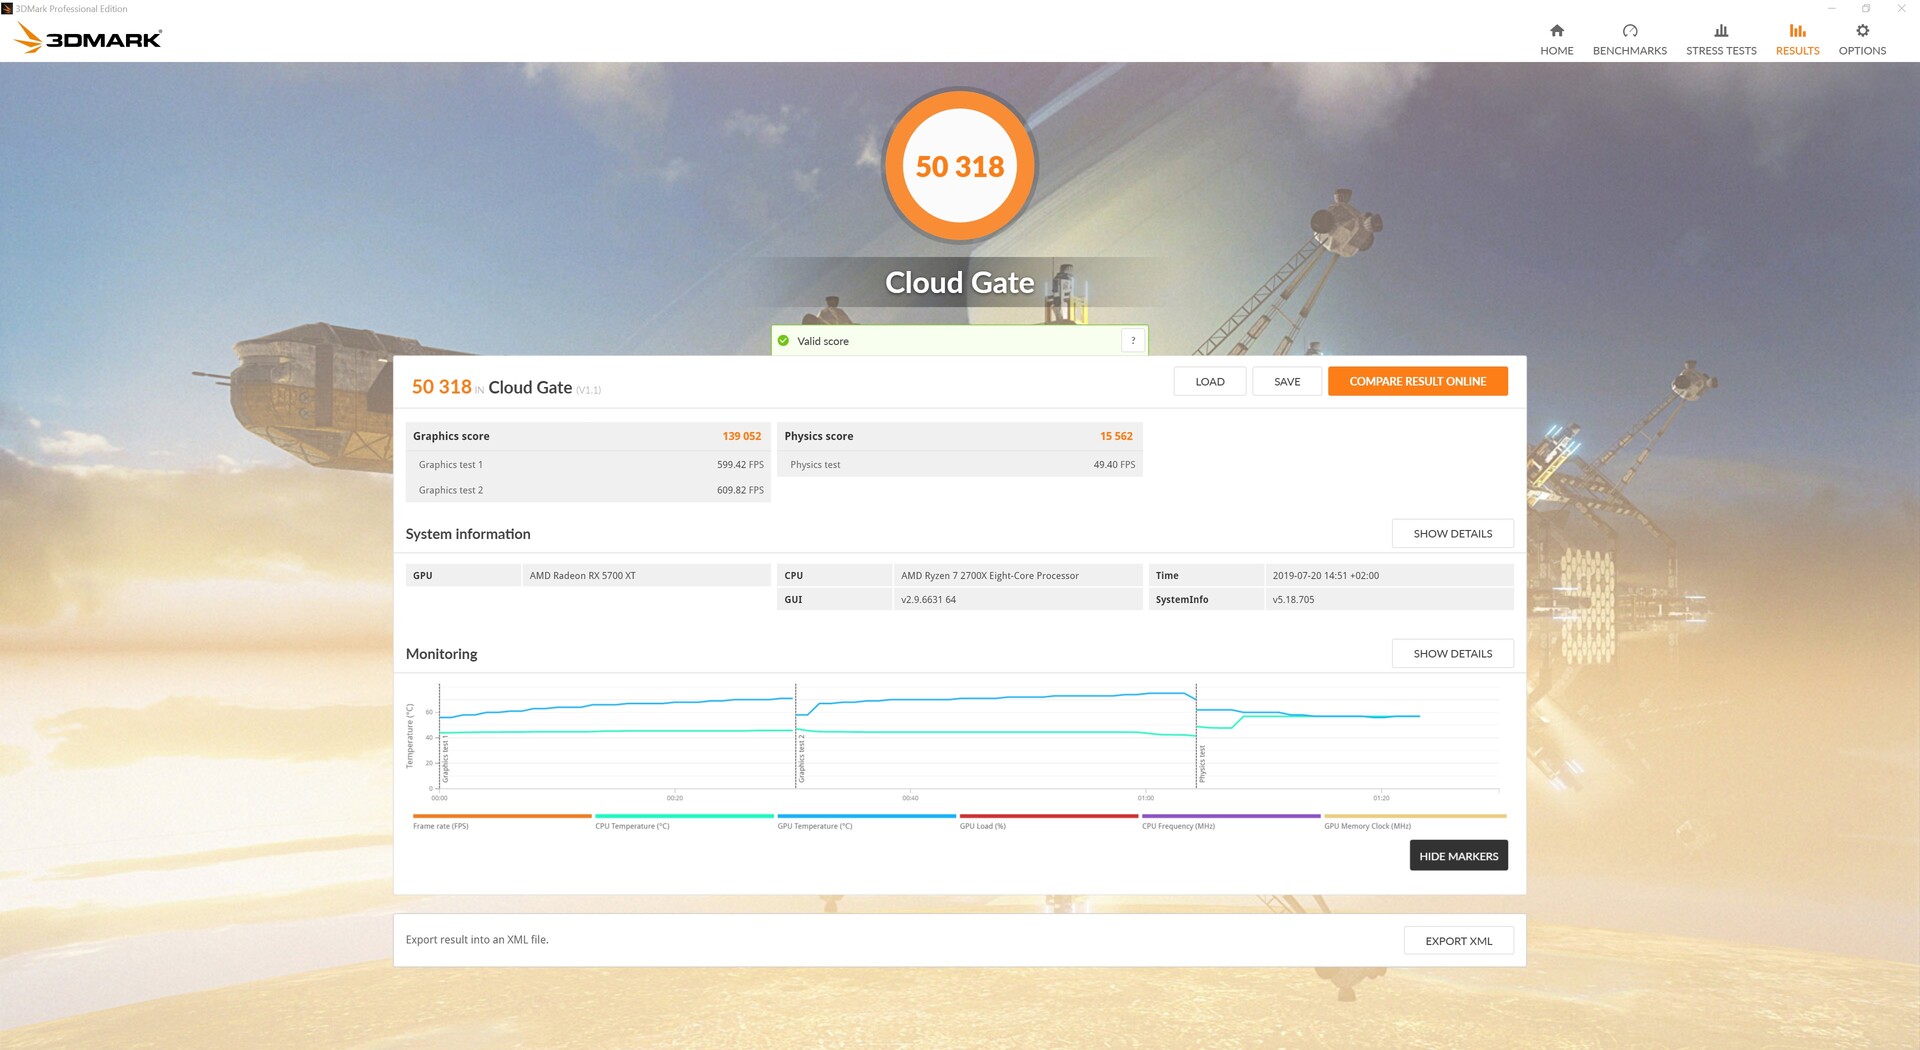
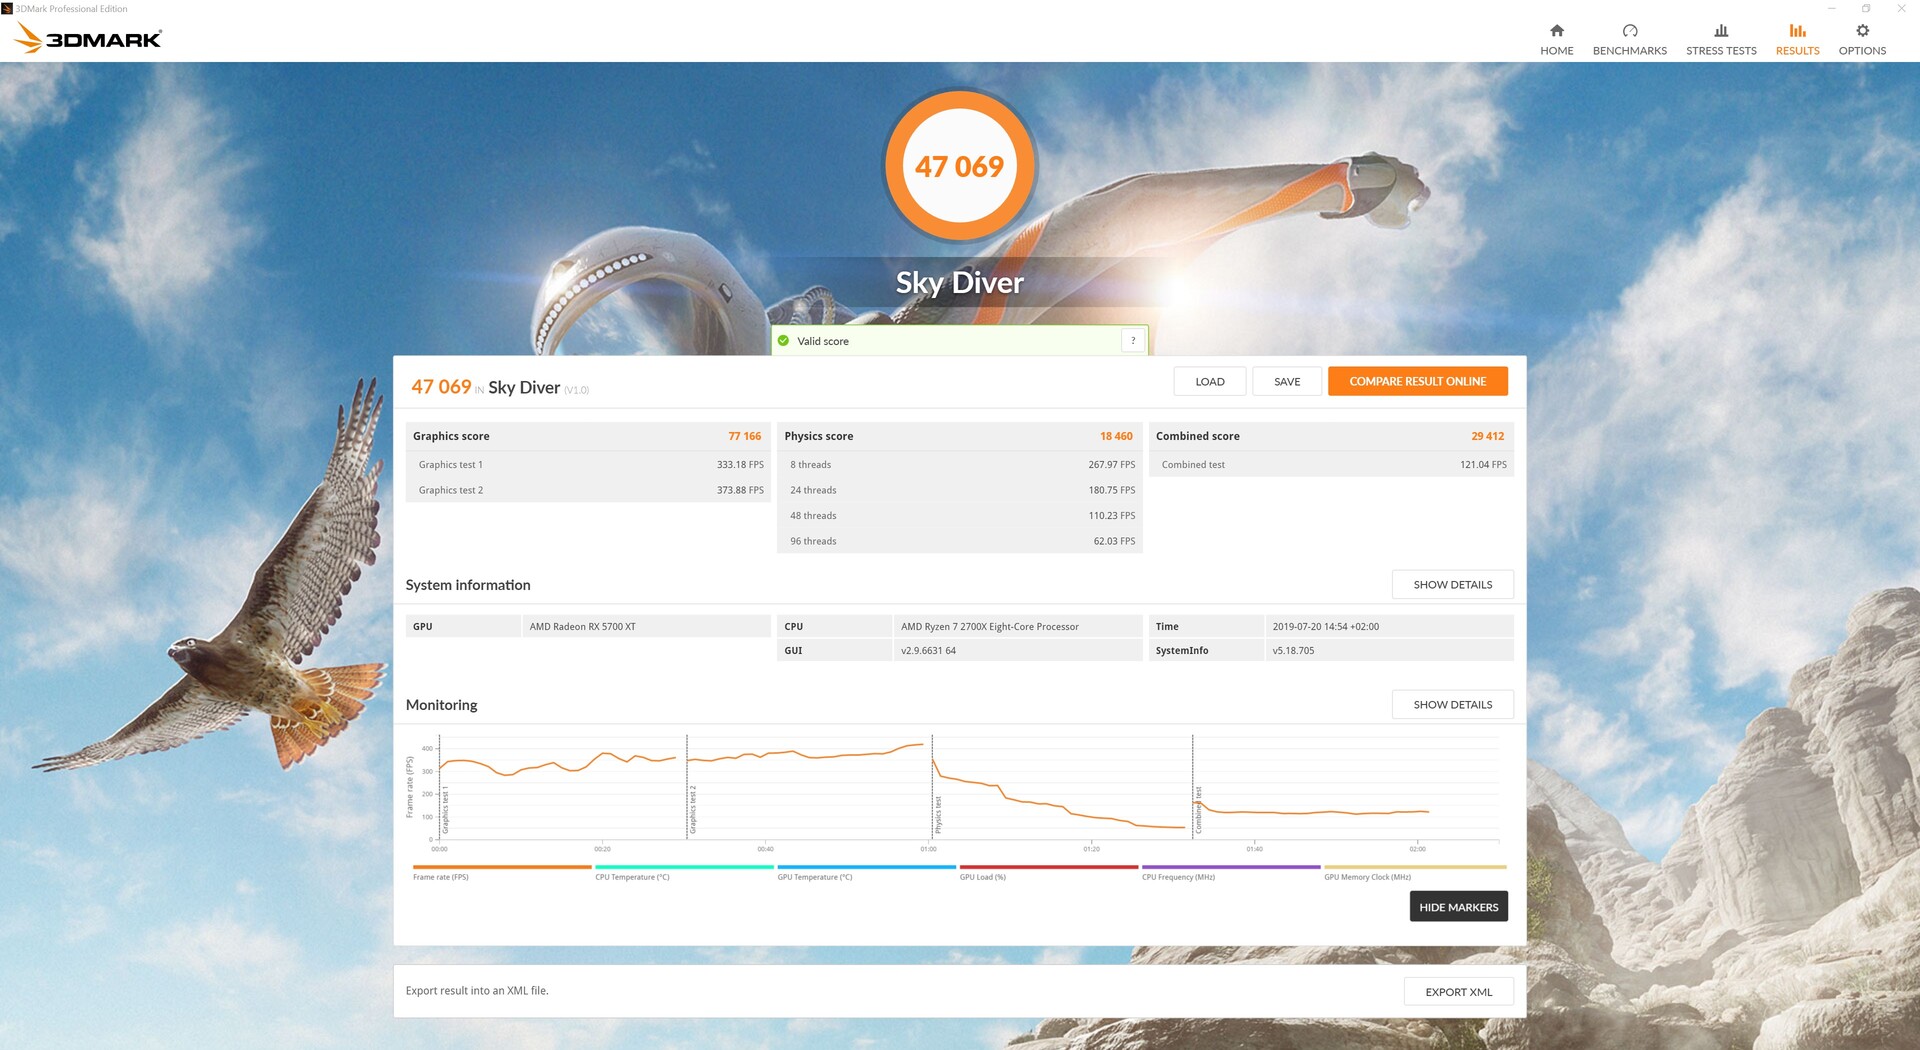
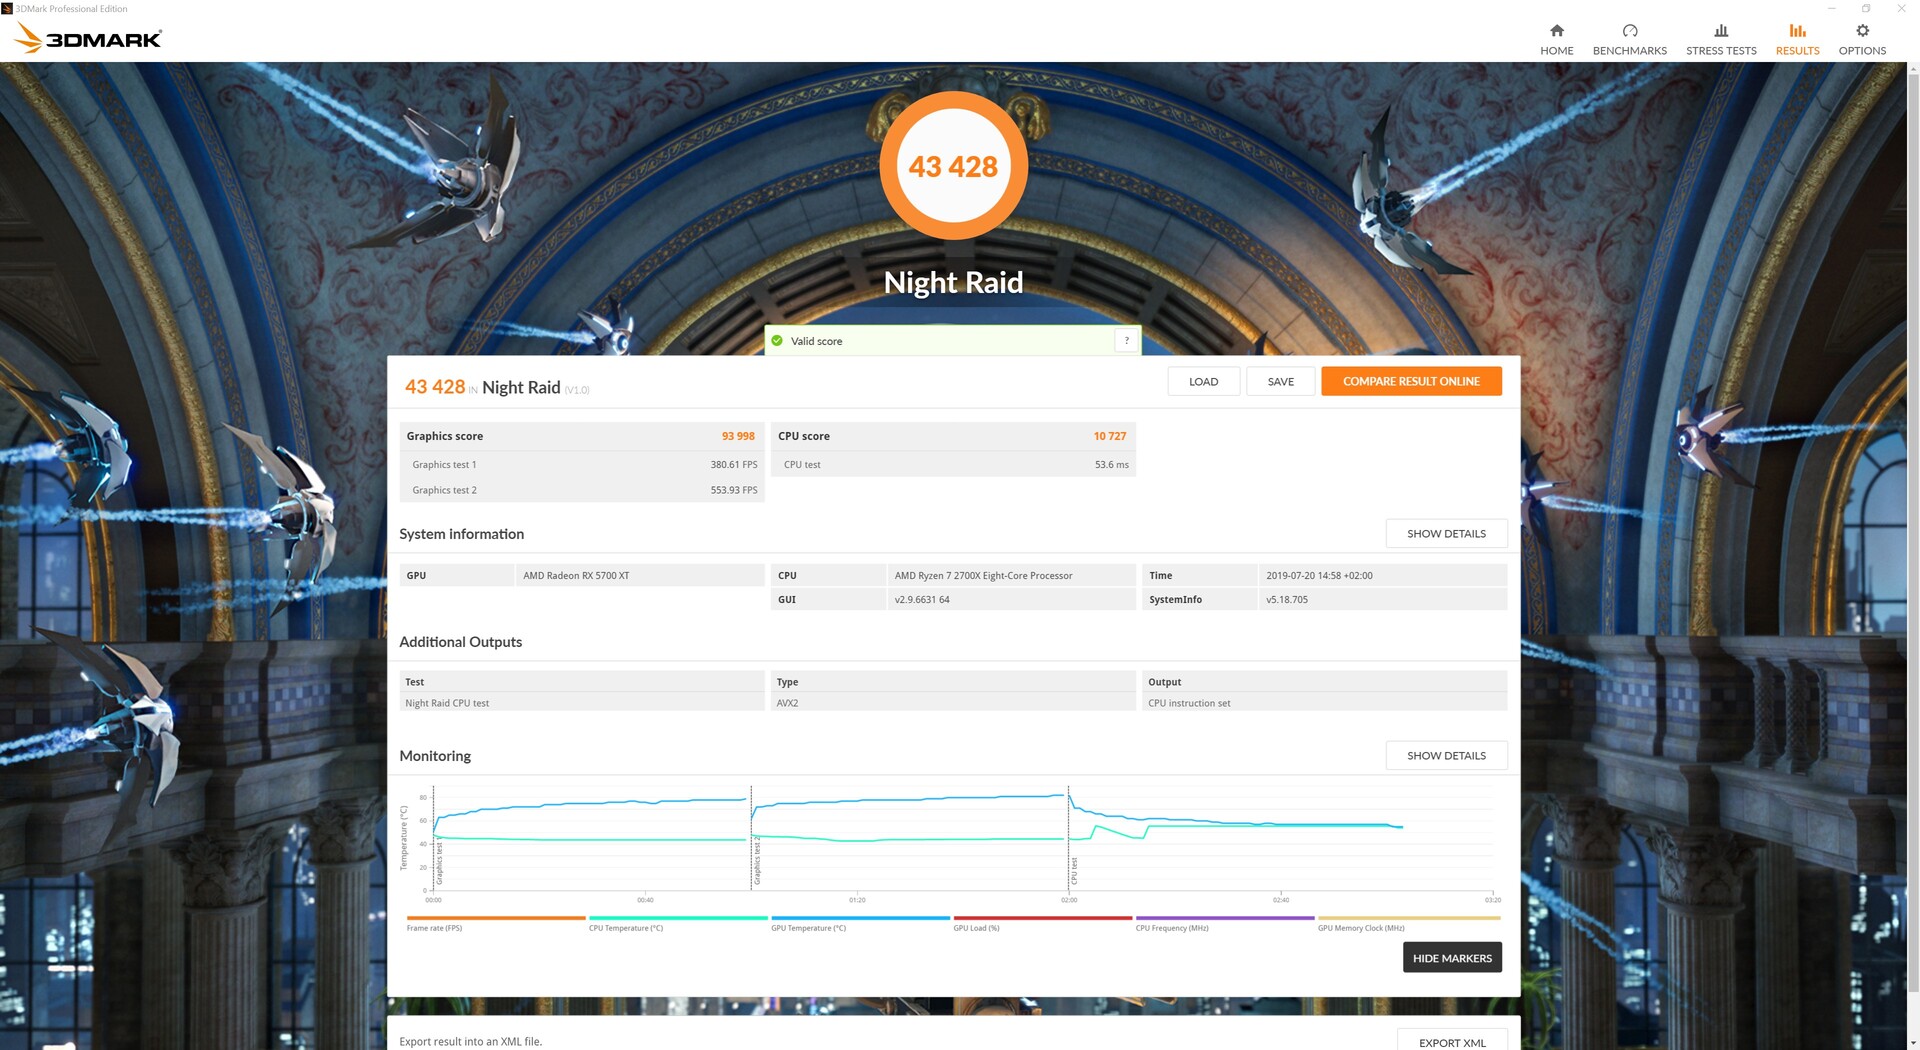
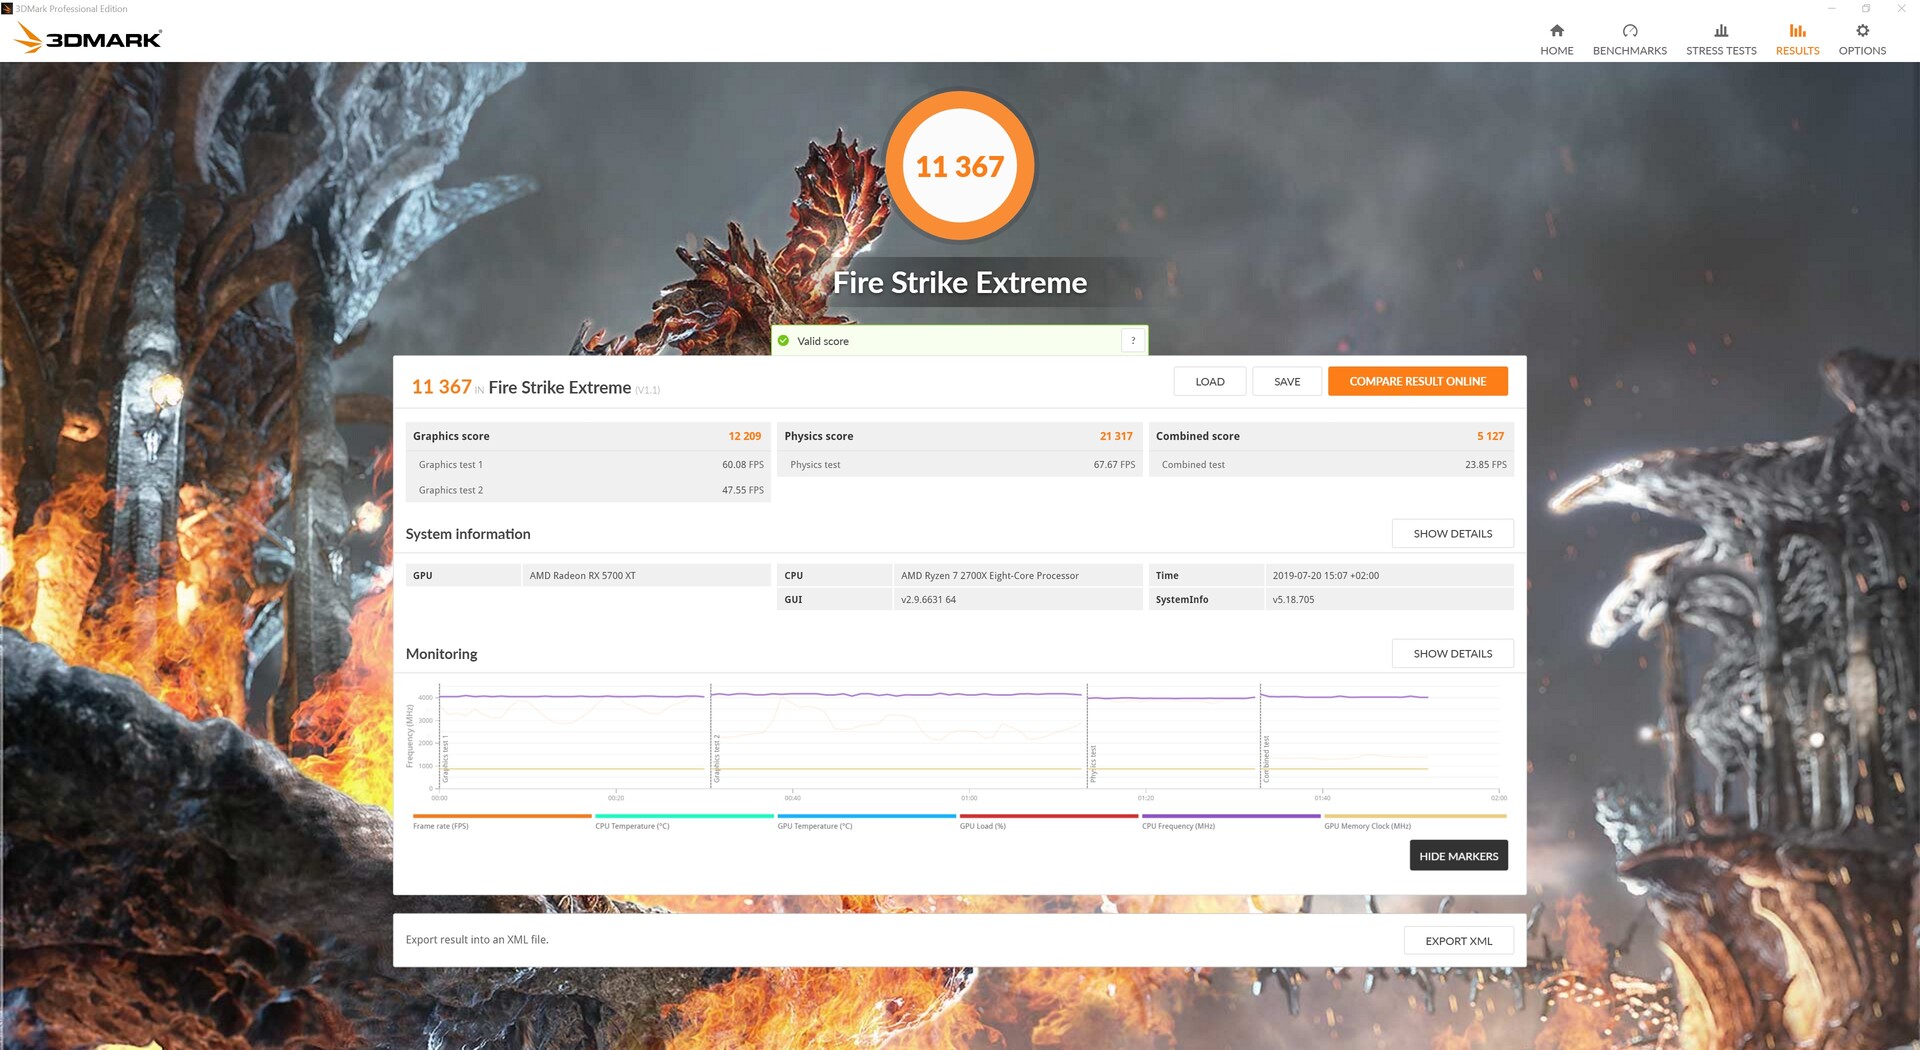
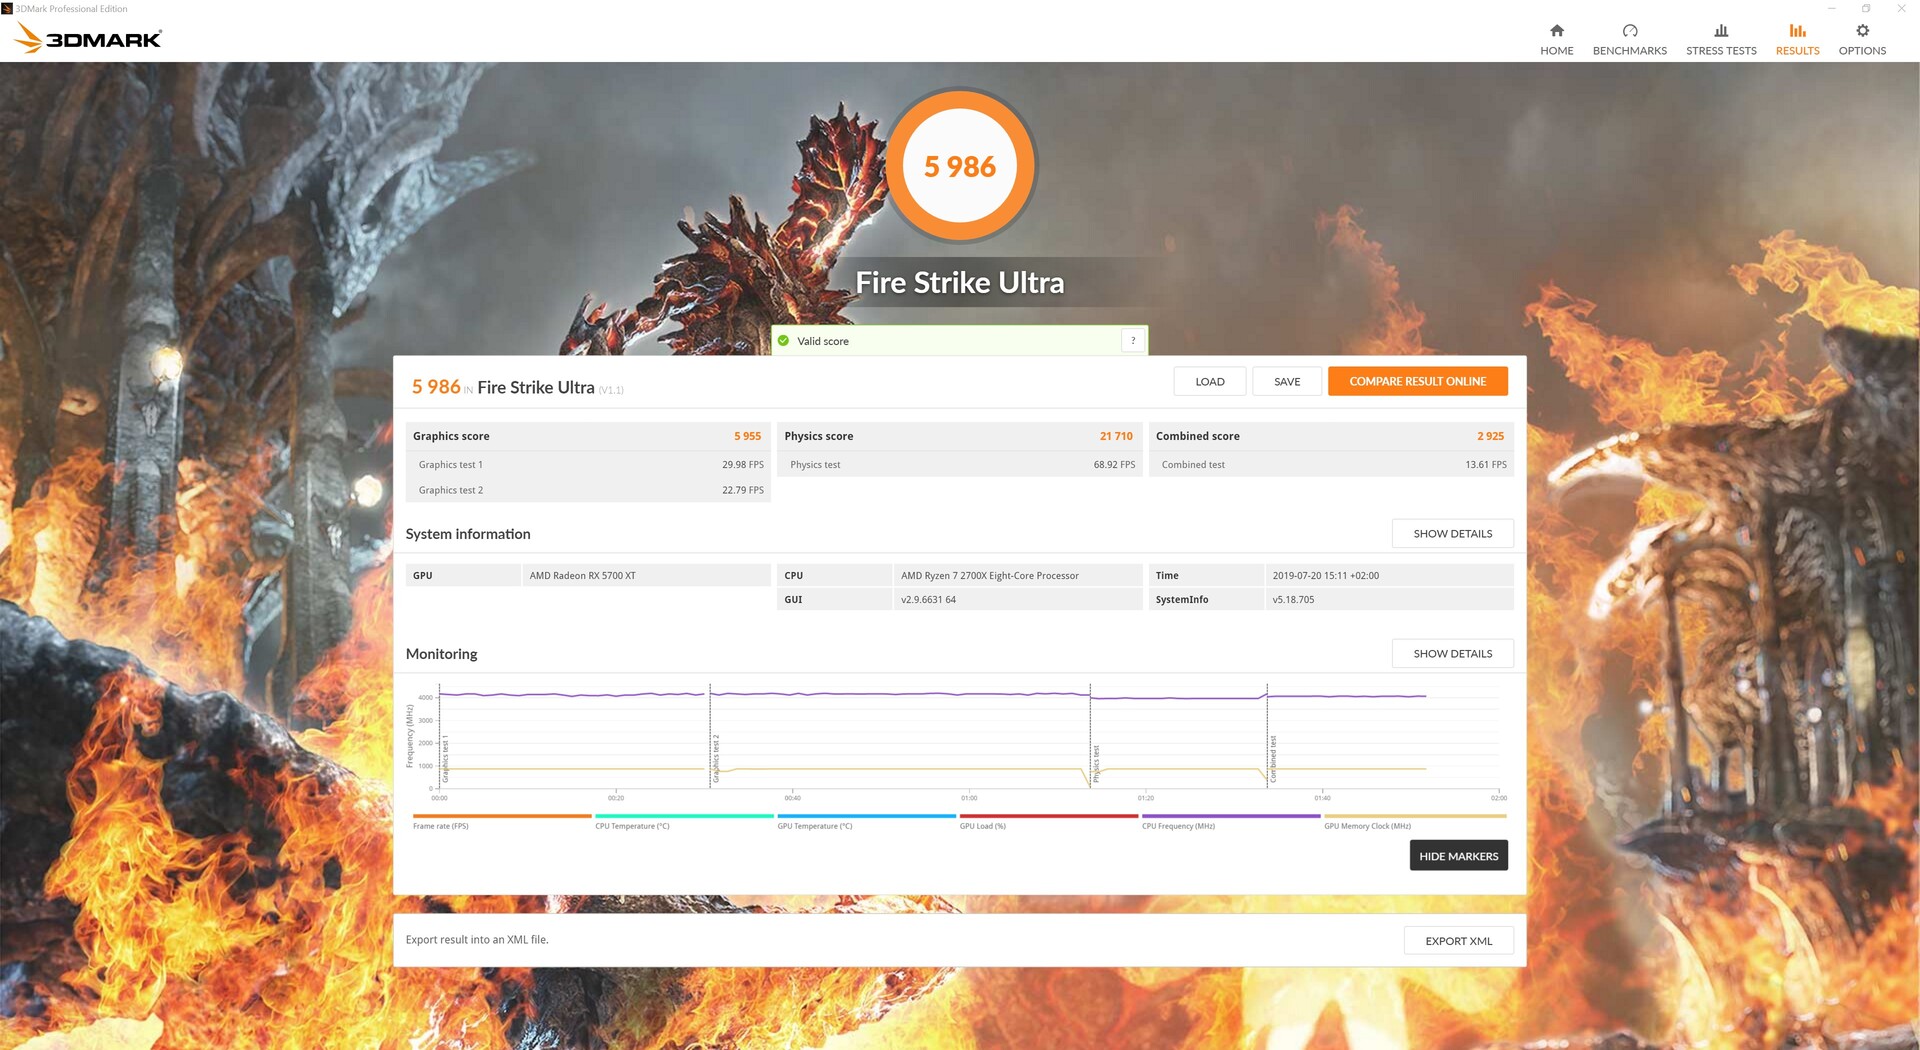
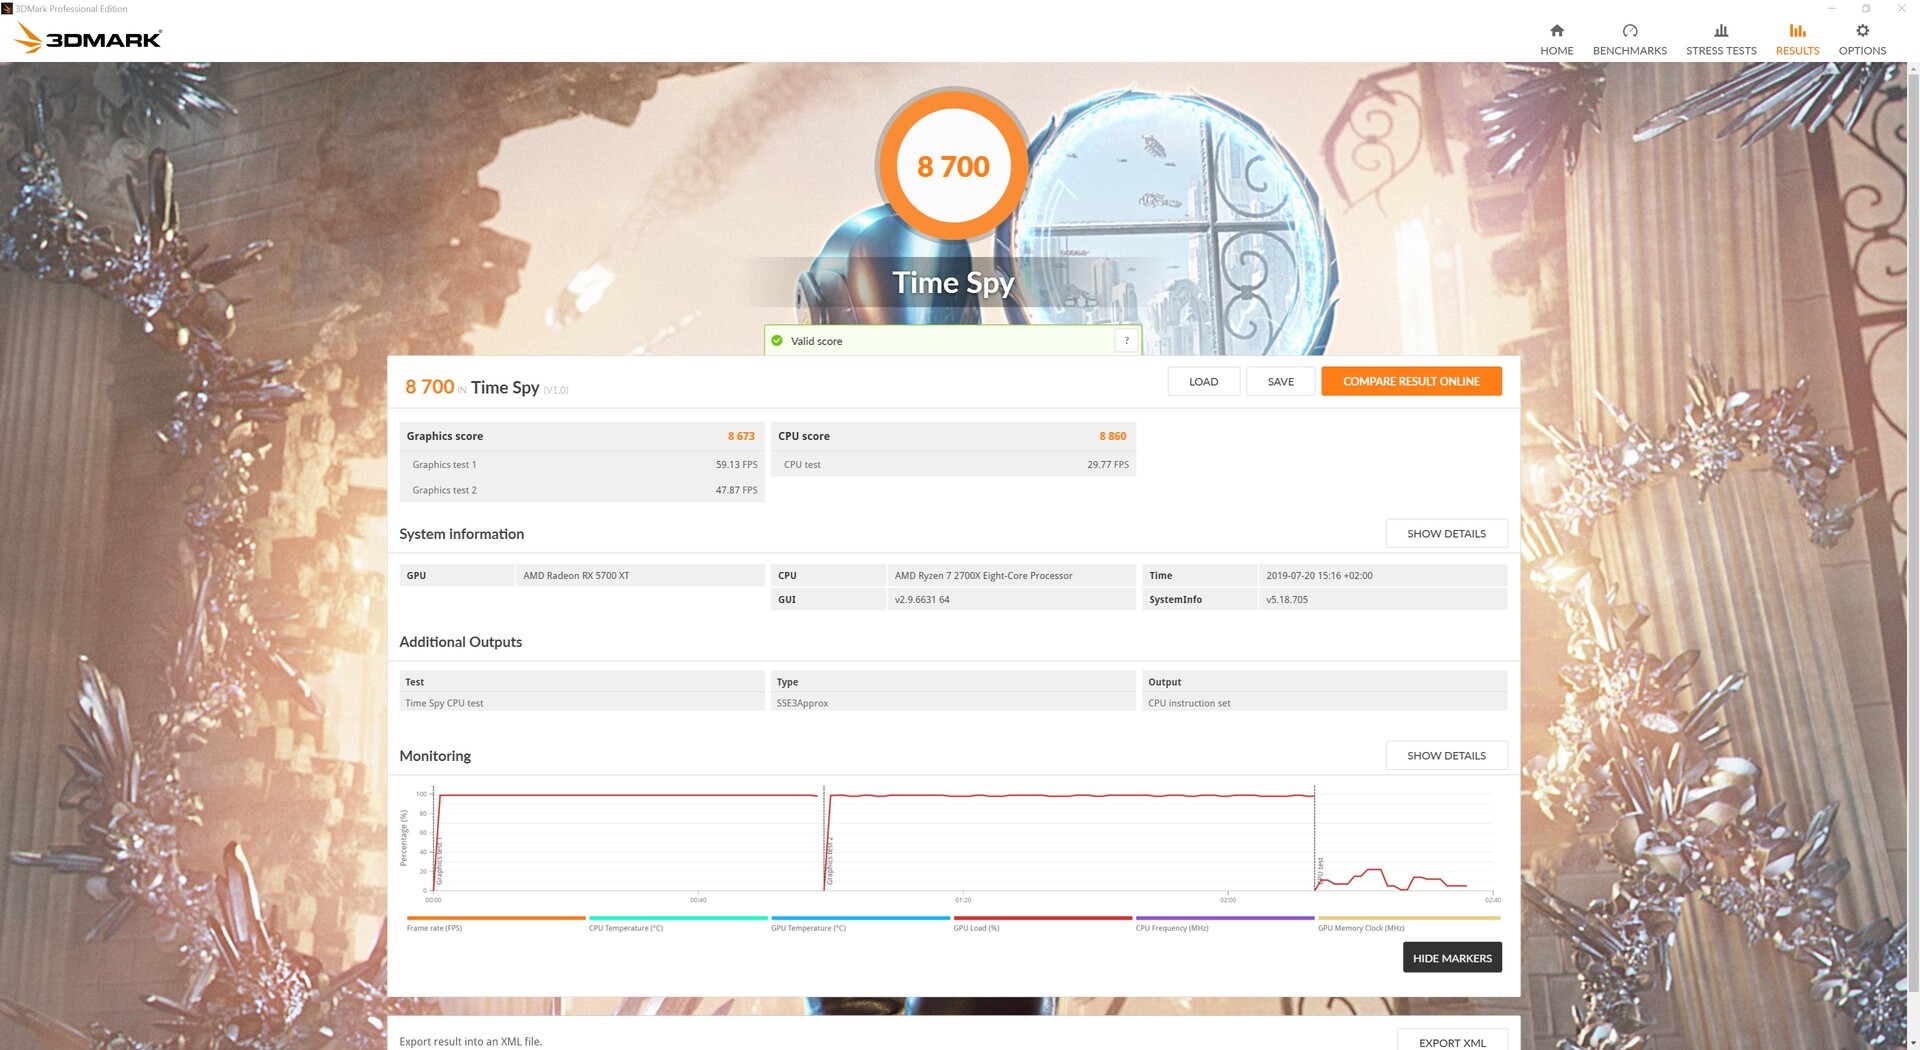
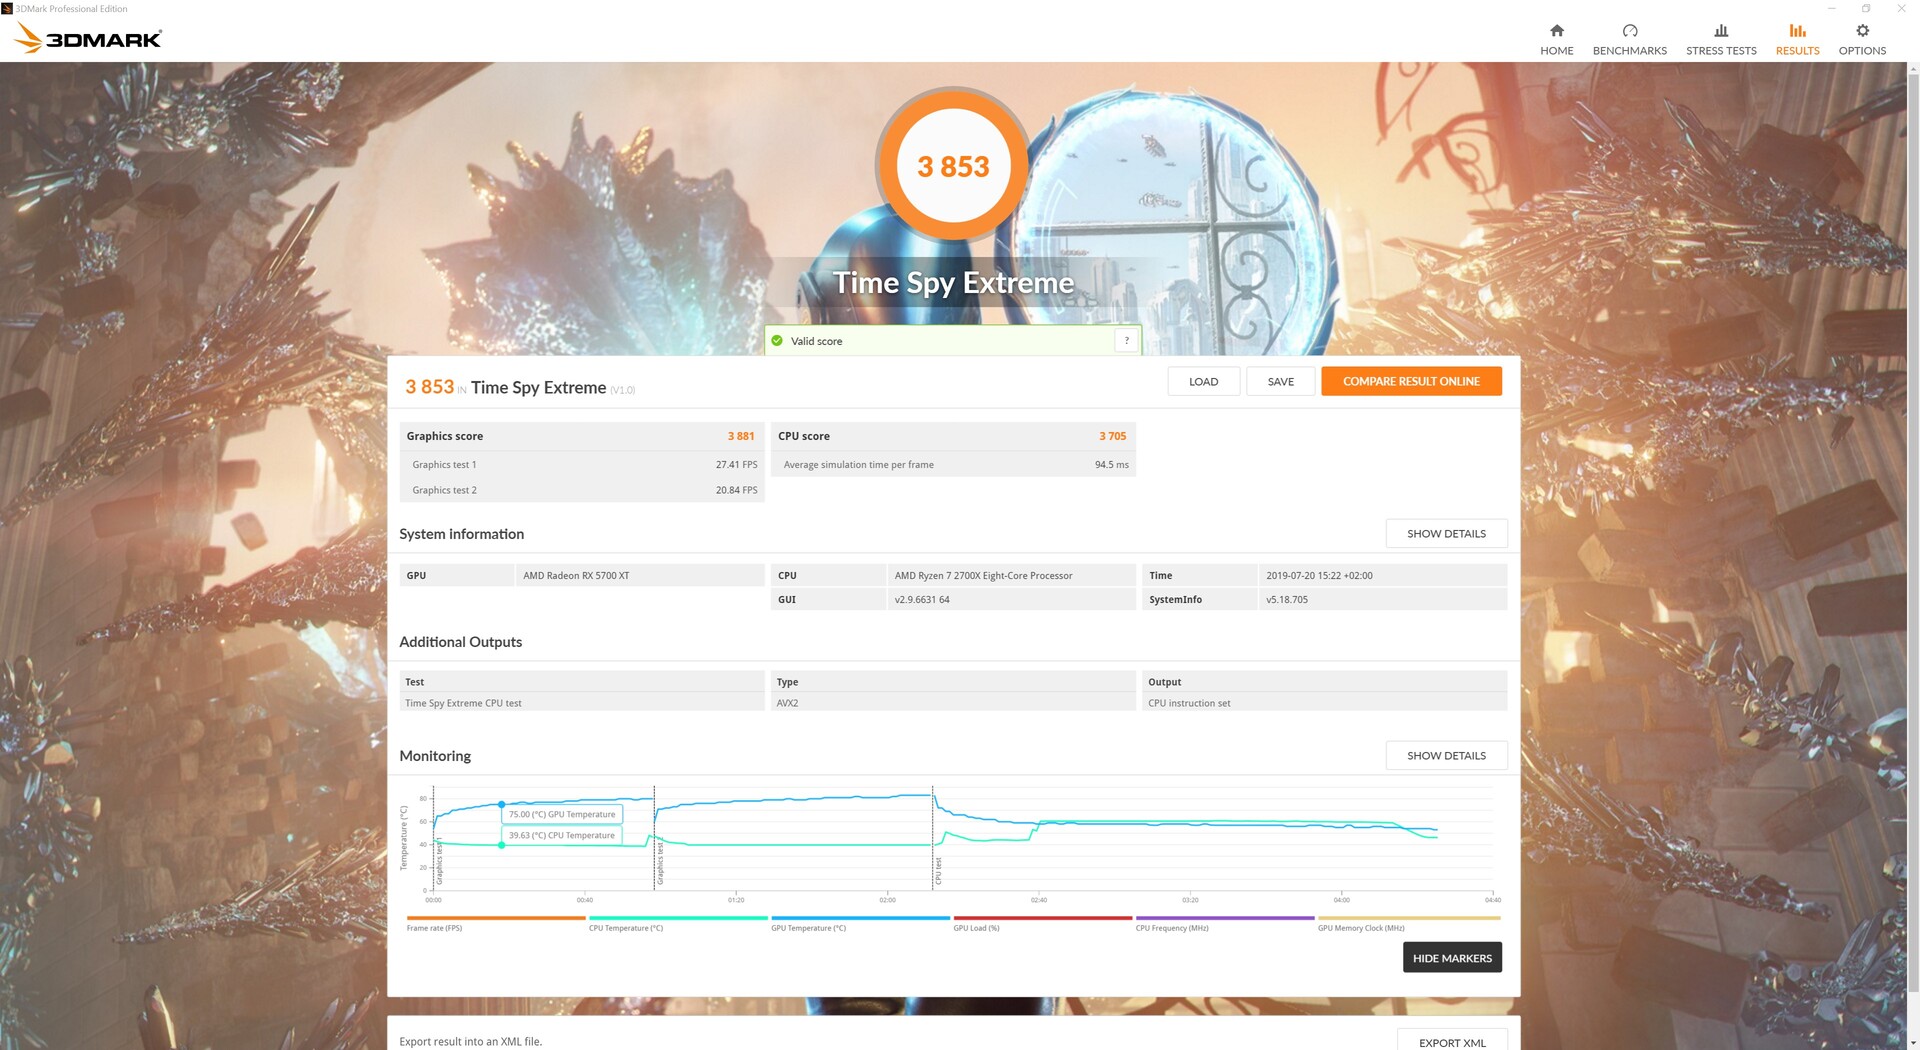
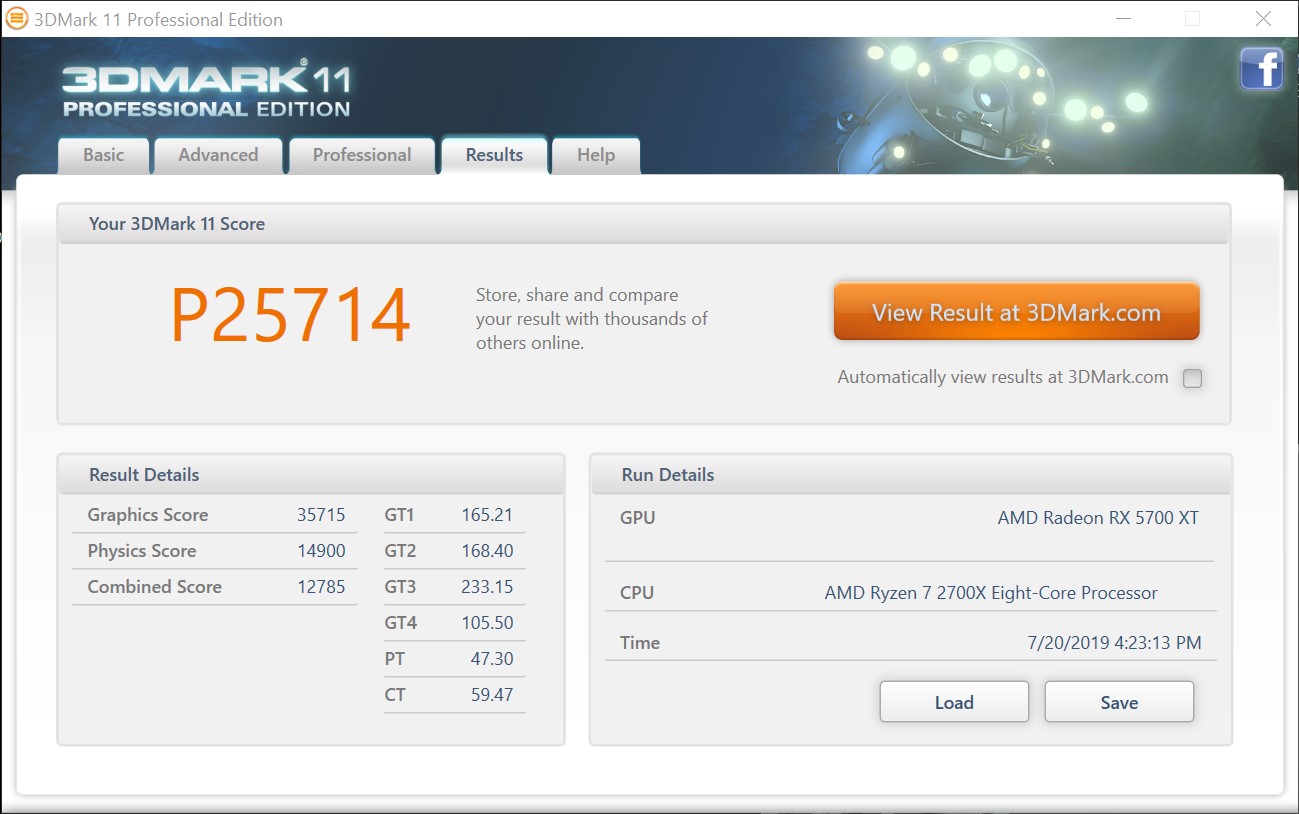
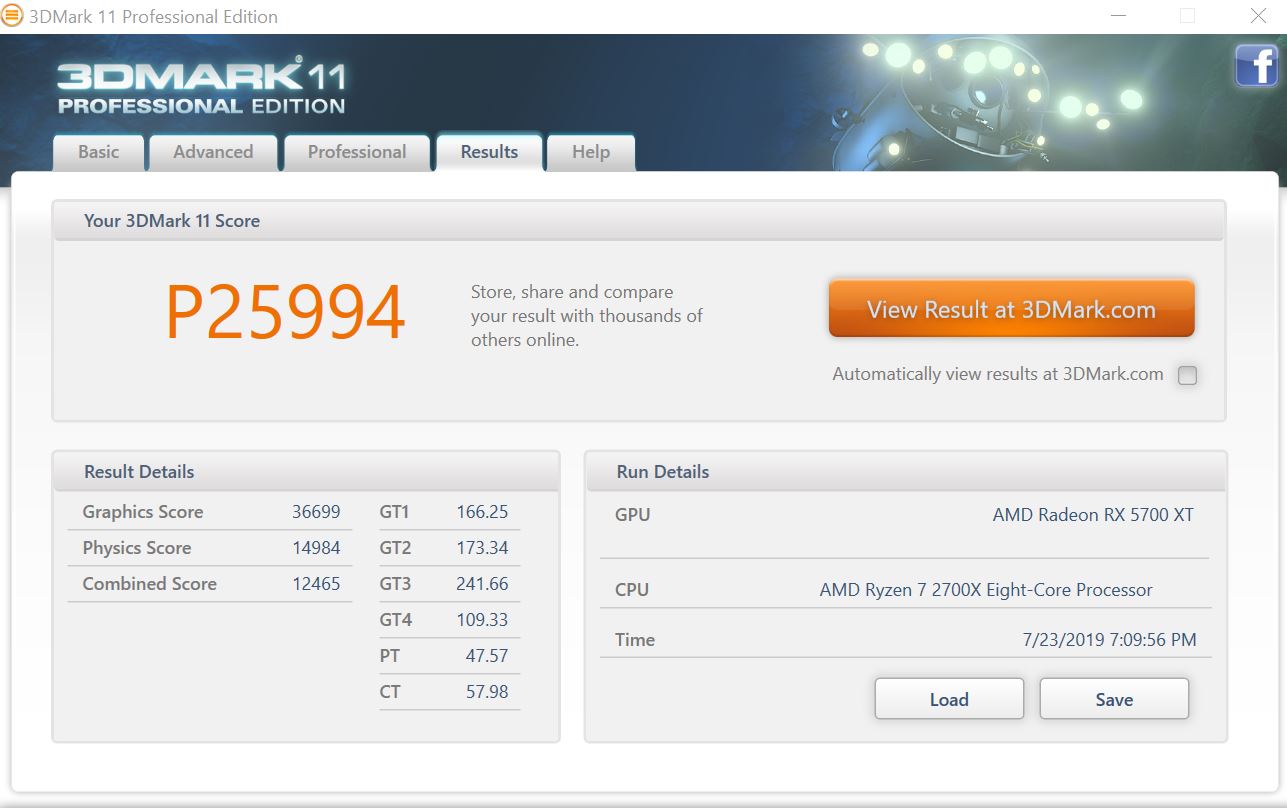
The synthetic benchmarks reveal the true performance of a GPU. However, such benchmarks are not a good proxy for the kind of performance a GPU can achieve in actual games. In the 3DMark benchmarks, the AMD Radeon RX 5700 XT achieves very good results and even manages to beat the GeForce RTX 2070S FE. That being said, when we ran Unigine Heaven and Unigine Valley, the RX 5700 XT did not do very well. Here, the RX 5700 XT can only compete with the MSI RTX 2060 Gaming Z 6G. The Navi-based GPU cannot keep up with either the RTX 2070 or the RTX 2070S.

| 3DMark 11 - 1280x720 Performance GPU | |
| Nvidia Titan RTX | |
| MSI RTX 2080 Gaming X Trio | |
| AMD Radeon VII | |
| AMD Radeon RX 5700 XT | |
| Nvidia GeForce RTX 2070 Super | |
| AMD Radeon RX 5700 | |
| MSI RTX 2070 Gaming Z 8G | |
| Nvidia GeForce RTX 2060 Super | |
| AMD Radeon RX Vega 64 | |
| MSI RTX 2060 Gaming Z 6G | |
| Unigine Heaven 4.0 | |
| Extreme Preset OpenGL | |
| Nvidia Titan RTX | |
| MSI RTX 2080 Gaming X Trio | |
| Nvidia GeForce RTX 2070 Super | |
| MSI RTX 2070 Gaming Z 8G | |
| Nvidia GeForce RTX 2060 Super | |
| MSI RTX 2060 Gaming Z 6G | |
| AMD Radeon RX 5700 XT | |
| AMD Radeon VII | |
| AMD Radeon RX 5700 | |
| Extreme Preset DX11 | |
| Nvidia Titan RTX | |
| MSI RTX 2080 Gaming X Trio | |
| Nvidia GeForce RTX 2070 Super | |
| MSI RTX 2070 Gaming Z 8G | |
| Nvidia GeForce RTX 2060 Super | |
| AMD Radeon VII | |
| AMD Radeon RX 5700 XT | |
| MSI RTX 2060 Gaming Z 6G | |
| AMD Radeon RX 5700 | |
| Unigine Valley 1.0 | |
| 1920x1080 Extreme HD DirectX AA:x8 | |
| Nvidia Titan RTX | |
| MSI RTX 2080 Gaming X Trio | |
| Nvidia GeForce RTX 2070 Super | |
| MSI RTX 2070 Gaming Z 8G | |
| AMD Radeon VII | |
| Nvidia GeForce RTX 2060 Super | |
| AMD Radeon RX 5700 XT | |
| AMD Radeon RX 5700 | |
| MSI RTX 2060 Gaming Z 6G | |
| 1920x1080 Extreme HD Preset OpenGL AA:x8 | |
| Nvidia Titan RTX | |
| MSI RTX 2080 Gaming X Trio | |
| Nvidia GeForce RTX 2070 Super | |
| MSI RTX 2070 Gaming Z 8G | |
| Nvidia GeForce RTX 2060 Super | |
| AMD Radeon RX 5700 XT | |
| MSI RTX 2060 Gaming Z 6G | |
| AMD Radeon RX 5700 | |
| AMD Radeon VII | |
| 3DMark 05 Standard | 42481 points | |
| 3DMark 06 Standard Score | 36709 points | |
| 3DMark Vantage P Result | 60890 points | |
| 3DMark 11 Performance | 25714 points | |
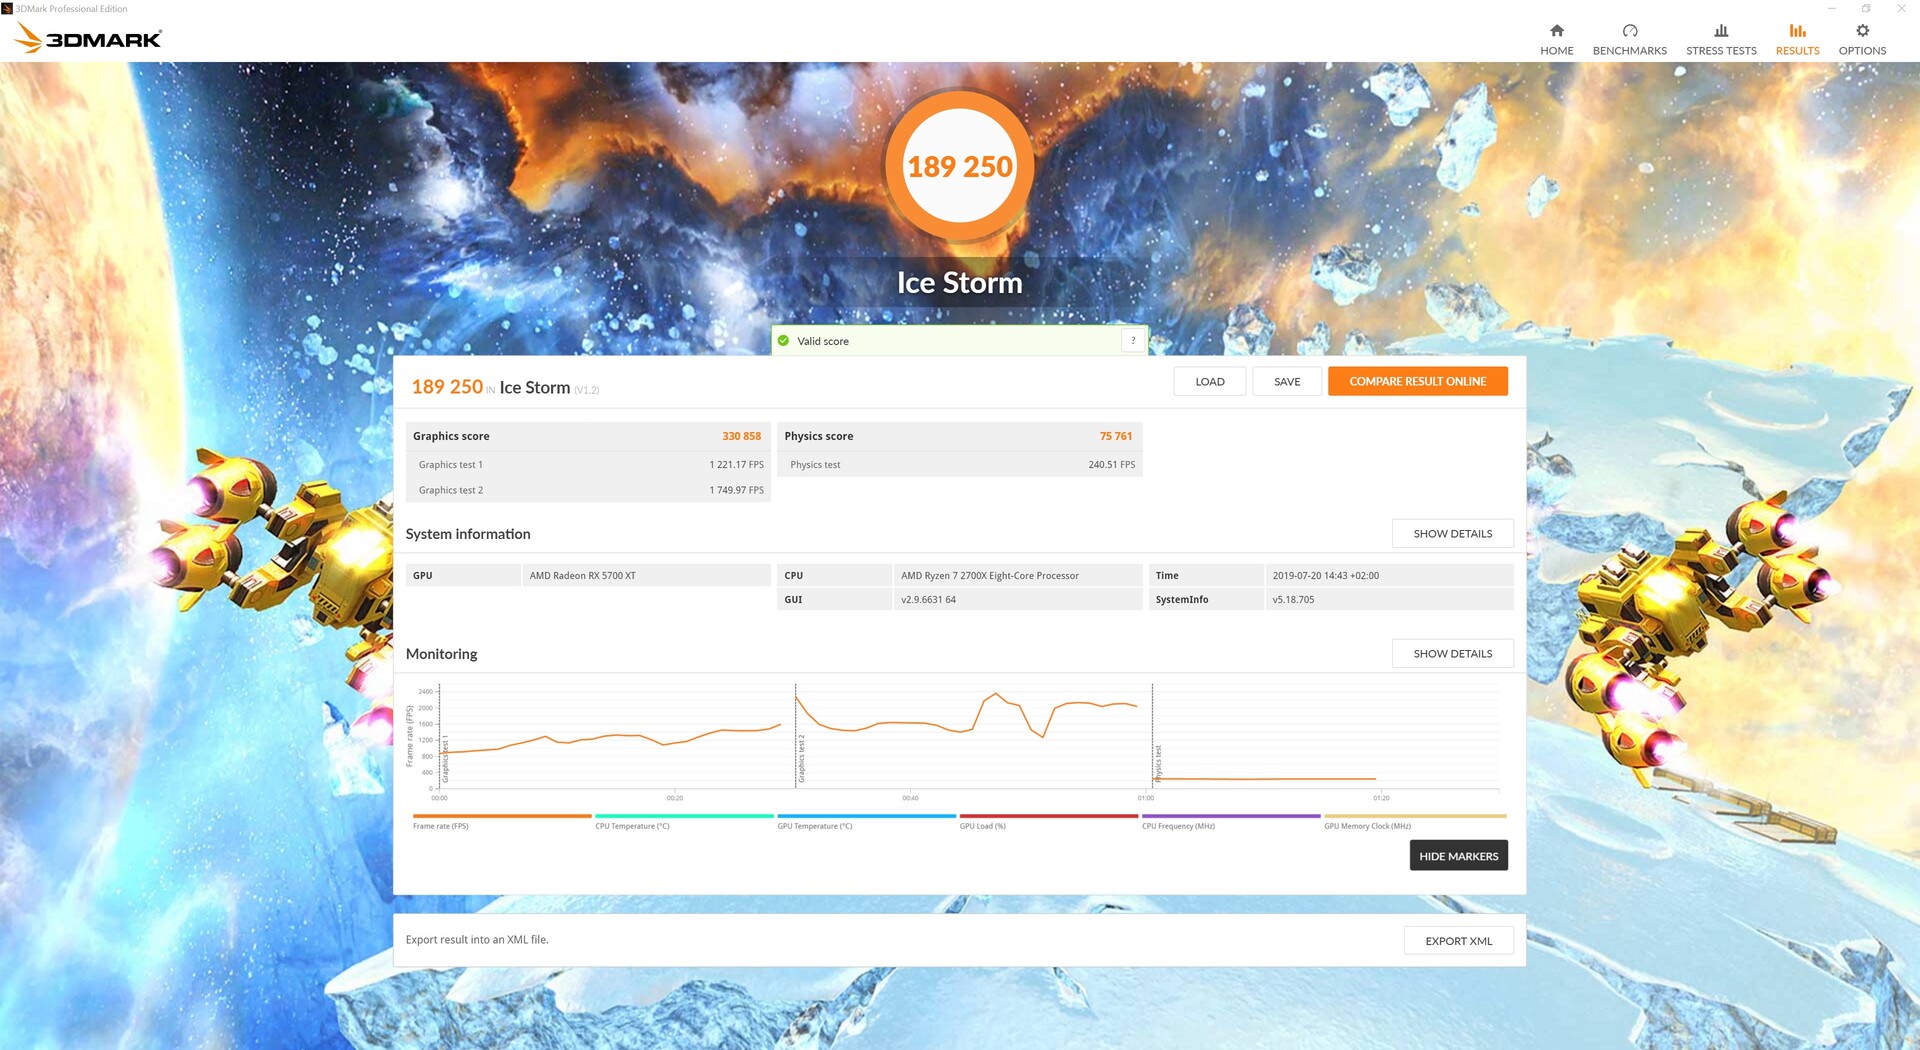
| 3DMark Ice Storm Standard Score | 189250 points | |
| 3DMark Cloud Gate Standard Score | 50318 points | |
| 3DMark Fire Strike Score | 21296 points | |
| 3DMark Fire Strike Extreme Score | 11367 points | |
| 3DMark Time Spy Score | 8700 points | |
Help | ||
Gaming Benchmarks
AMD says the Radeon RX 5700 XT is a GPU built for 1440p gaming. Our gaming benchmarks confirm this. While the RX 5700 XT can achieve playable frame rates at 1440p, it struggles to keep its head above water at 2160p. However, there are a few titles that are playable in UHD on medium to high settings.
The competing GPUs from Team Green put up quite a fight against the RX 5700 XT. Even the factory-overclocked RTX 2070 from MSI is able to beat the Navi-based graphics card in certain titles. An RTX 2070 Founders Edition would probably be just a bit slower than the Radeon RX 5700 XT. The GeForce RTX 2070S FE is generally faster than the Navi-based GPU. However, there are titles in which both graphics cards achieve a very similar level of performance.
Just like its smaller variant (AMD Radeon RX 5700), the AMD Radeon RX 5700 XT can run the vast majority of games in QHD on ultra settings. It cannot handle higher resolutions, though. However, the RTX 2070S FE meets the same fate when gaming at 2160p, because Nvidia’s GPU is also only suitable for 1440p gaming.
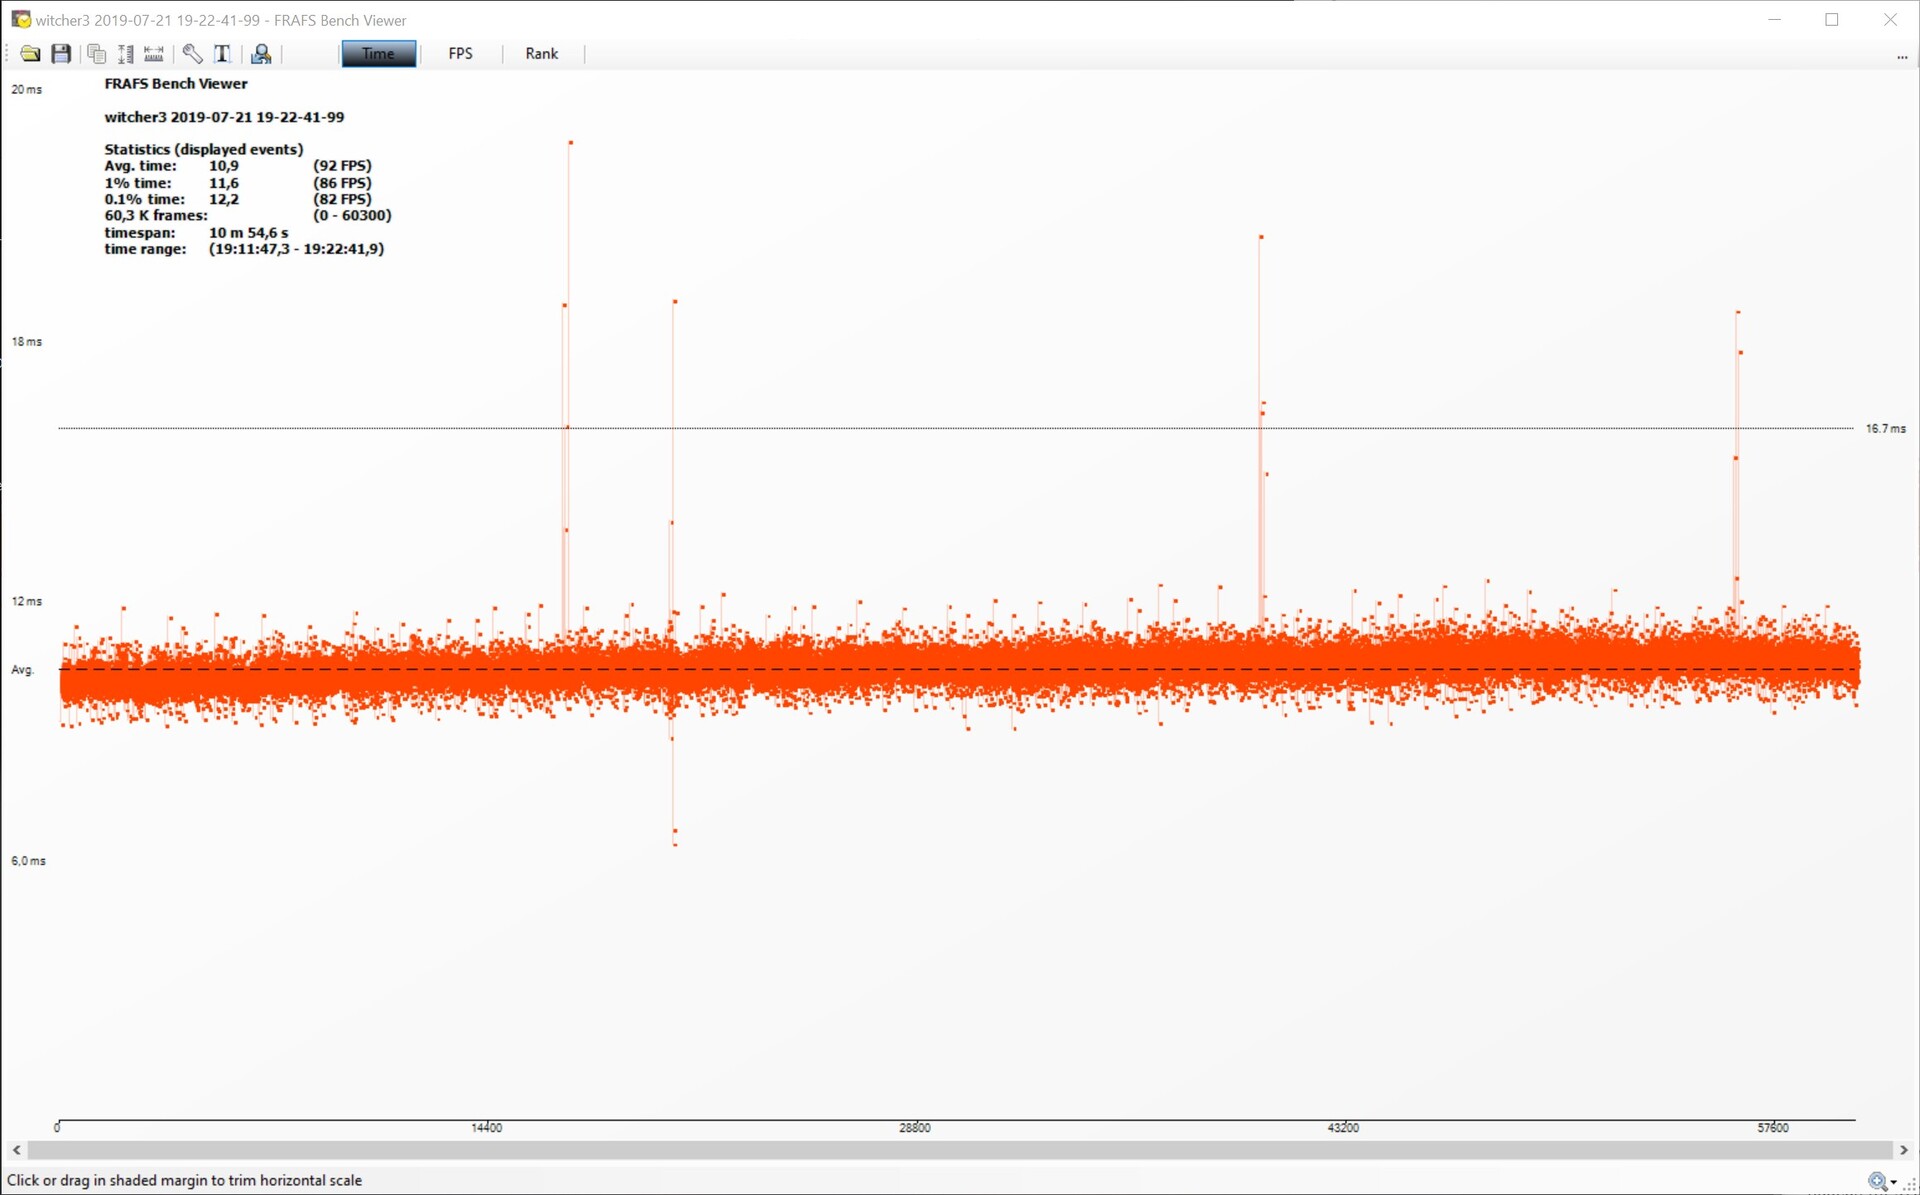
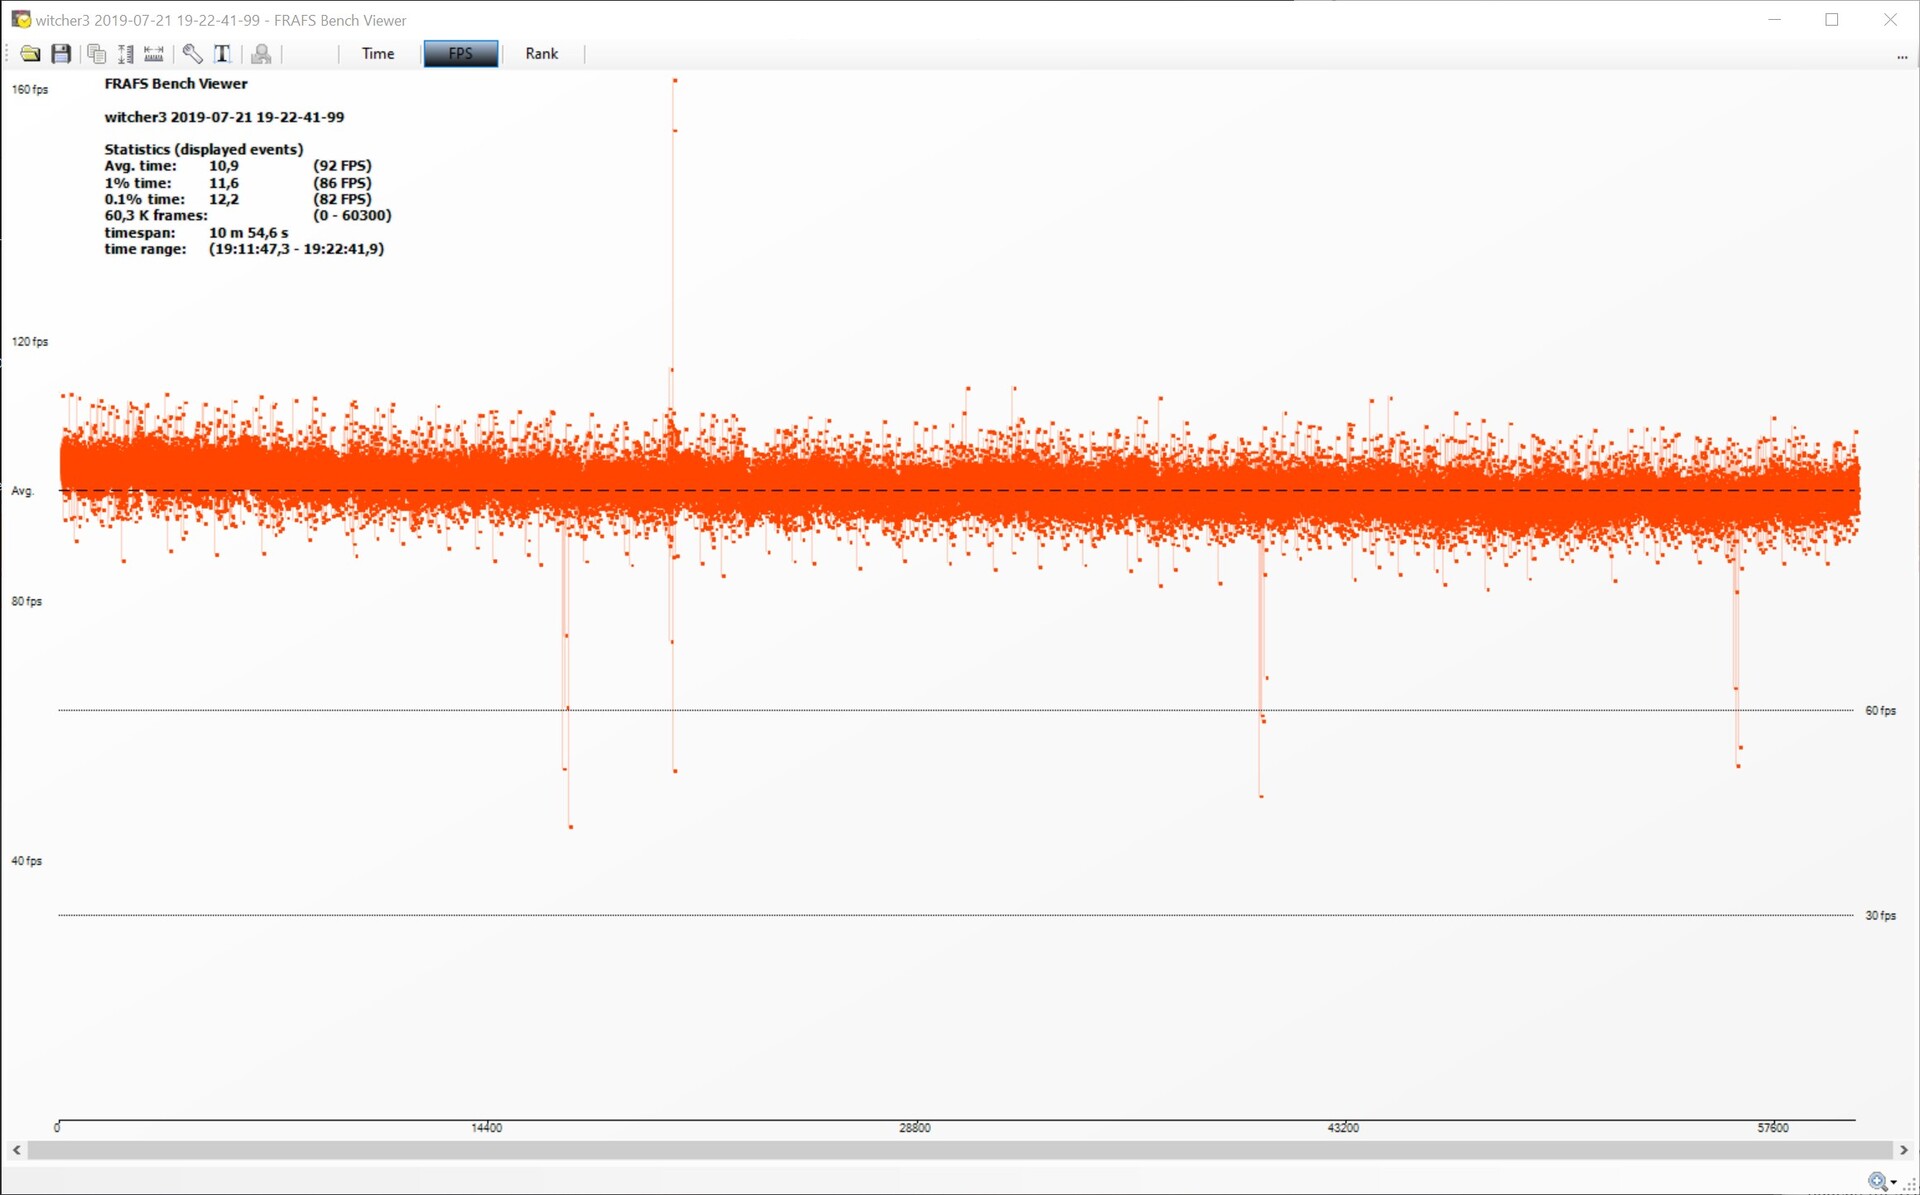
We use The Witcher 3 to examine how well the graphics card performs under load. We run the game on ultra settings and record both the frame rate and the frame time. Here, the RX 5700 XT performs better than the RTX 2070S. There are fewer spikes in the frame-time graph, and the spikes that we did measure should not be noticeable during actual gameplay. The same applies to the frame rate. Even though we did observe a slight drop in the frame rate due to thermal issues, 92 FPS is still way more than enough for the game to feel very smooth.
The Witcher 3 benchmark- frame rates on ultra settings
| Call of Duty Black Ops 4 | |
| 1920x1080 Very High / On | |
| Nvidia Titan RTX | |
| MSI RTX 2080 Gaming X Trio | |
| AMD Radeon RX Vega 64 | |
| Nvidia GeForce RTX 2070 Super | |
| MSI RTX 2070 Gaming Z 8G | |
| AMD Radeon VII | |
| Nvidia GeForce RTX 2060 Super | |
| AMD Radeon RX 5700 XT | |
| MSI RTX 2060 Gaming Z 6G | |
| AMD Radeon RX 5700 | |
| 3840x2160 Very High / On | |
| Nvidia Titan RTX | |
| MSI RTX 2080 Gaming X Trio | |
| AMD Radeon RX Vega 64 | |
| AMD Radeon VII | |
| AMD Radeon RX 5700 XT | |
| Nvidia GeForce RTX 2070 Super | |
| AMD Radeon RX 5700 | |
| Nvidia GeForce RTX 2060 Super | |
| MSI RTX 2070 Gaming Z 8G | |
| MSI RTX 2060 Gaming Z 6G | |
| 2560x1440 Very High / On | |
| AMD Radeon RX 5700 XT | |
| MSI RTX 2080 Gaming X Trio | |
| Nvidia GeForce RTX 2070 Super | |
| MSI RTX 2070 Gaming Z 8G | |
| AMD Radeon RX 5700 | |
| Nvidia GeForce RTX 2060 Super | |
| Assassin´s Creed Odyssey | |
| 1920x1080 Ultra High Preset | |
| Nvidia Titan RTX | |
| MSI RTX 2080 Gaming X Trio | |
| MSI RTX 2070 Gaming Z 8G | |
| Nvidia GeForce RTX 2070 Super | |
| AMD Radeon VII | |
| AMD Radeon RX 5700 XT | |
| Nvidia GeForce RTX 2060 Super | |
| AMD Radeon RX 5700 | |
| MSI RTX 2060 Gaming Z 6G | |
| AMD Radeon RX Vega 64 | |
| 3840x2160 Ultra High Preset | |
| Nvidia Titan RTX | |
| AMD Radeon VII | |
| MSI RTX 2080 Gaming X Trio | |
| Nvidia GeForce RTX 2070 Super | |
| MSI RTX 2070 Gaming Z 8G | |
| AMD Radeon RX 5700 XT | |
| Nvidia GeForce RTX 2060 Super | |
| AMD Radeon RX 5700 | |
| AMD Radeon RX Vega 64 | |
| MSI RTX 2060 Gaming Z 6G | |
| 2560x1440 Ultra High Preset | |
| MSI RTX 2080 Gaming X Trio | |
| Nvidia GeForce RTX 2070 Super | |
| MSI RTX 2070 Gaming Z 8G | |
| AMD Radeon RX 5700 XT | |
| Nvidia GeForce RTX 2060 Super | |
| AMD Radeon RX 5700 | |
| FIFA 19 | |
| 1920x1080 Ultra Preset AA:4x MS | |
| AMD Radeon RX Vega 64 | |
| AMD Radeon RX 5700 XT | |
| AMD Radeon RX 5700 | |
| Nvidia GeForce RTX 2070 Super | |
| Nvidia Titan RTX | |
| MSI RTX 2080 Gaming X Trio | |
| AMD Radeon VII | |
| MSI RTX 2070 Gaming Z 8G | |
| Nvidia GeForce RTX 2060 Super | |
| MSI RTX 2060 Gaming Z 6G | |
| 3840x2160 Ultra Preset AA:4x MS | |
| Nvidia Titan RTX | |
| AMD Radeon VII | |
| MSI RTX 2080 Gaming X Trio | |
| AMD Radeon RX 5700 XT | |
| Nvidia GeForce RTX 2060 Super | |
| MSI RTX 2070 Gaming Z 8G | |
| Nvidia GeForce RTX 2070 Super | |
| AMD Radeon RX 5700 | |
| AMD Radeon RX Vega 64 | |
| MSI RTX 2060 Gaming Z 6G | |
| 2560x1440 Ultra Preset AA:4x MS | |
| AMD Radeon RX 5700 XT | |
| AMD Radeon RX 5700 | |
| Nvidia GeForce RTX 2070 Super | |
| MSI RTX 2080 Gaming X Trio | |
| Nvidia GeForce RTX 2060 Super | |
| MSI RTX 2070 Gaming Z 8G | |
| Forza Horizon 4 | |
| 1920x1080 Ultra Preset AA:2xMS | |
| MSI RTX 2080 Gaming X Trio | |
| AMD Radeon RX 5700 XT | |
| Nvidia Titan RTX | |
| AMD Radeon VII | |
| Nvidia GeForce RTX 2070 Super | |
| AMD Radeon RX Vega 64 | |
| AMD Radeon RX 5700 | |
| MSI RTX 2070 Gaming Z 8G | |
| Nvidia GeForce RTX 2060 Super | |
| MSI RTX 2060 Gaming Z 6G | |
| 3840x2160 Ultra Preset AA:2xMS | |
| Nvidia Titan RTX | |
| MSI RTX 2080 Gaming X Trio | |
| AMD Radeon RX 5700 XT | |
| AMD Radeon VII | |
| Nvidia GeForce RTX 2070 Super | |
| AMD Radeon RX 5700 | |
| MSI RTX 2070 Gaming Z 8G | |
| AMD Radeon RX Vega 64 | |
| Nvidia GeForce RTX 2060 Super | |
| MSI RTX 2060 Gaming Z 6G | |
| 2560x1440 Ultra Preset AA:2xMS | |
| AMD Radeon RX 5700 XT | |
| MSI RTX 2080 Gaming X Trio | |
| Nvidia GeForce RTX 2070 Super | |
| AMD Radeon RX 5700 | |
| MSI RTX 2070 Gaming Z 8G | |
| Nvidia GeForce RTX 2060 Super | |
| Monster Hunter World | |
| 1920x1080 Highest Preset (Image Quality High) | |
| Nvidia Titan RTX | |
| MSI RTX 2080 Gaming X Trio | |
| Nvidia GeForce RTX 2070 Super | |
| MSI RTX 2070 Gaming Z 8G | |
| AMD Radeon VII | |
| Nvidia GeForce RTX 2060 Super | |
| AMD Radeon RX 5700 XT | |
| MSI RTX 2060 Gaming Z 6G | |
| AMD Radeon RX Vega 64 | |
| AMD Radeon RX 5700 | |
| 3840x2160 Highest Preset (Image Quality High) | |
| Nvidia Titan RTX | |
| MSI RTX 2080 Gaming X Trio | |
| Nvidia GeForce RTX 2070 Super | |
| AMD Radeon VII | |
| MSI RTX 2070 Gaming Z 8G | |
| AMD Radeon RX 5700 XT | |
| AMD Radeon RX Vega 64 | |
| Nvidia GeForce RTX 2060 Super | |
| AMD Radeon RX 5700 | |
| MSI RTX 2060 Gaming Z 6G | |
| 2560x1440 Highest Preset (Image Quality High) | |
| MSI RTX 2080 Gaming X Trio | |
| Nvidia GeForce RTX 2070 Super | |
| MSI RTX 2070 Gaming Z 8G | |
| AMD Radeon RX 5700 XT | |
| Nvidia GeForce RTX 2060 Super | |
| AMD Radeon RX 5700 | |
| Far Cry 5 | |
| 1920x1080 Ultra Preset AA:T | |
| MSI RTX 2080 Gaming X Trio | |
| Nvidia Titan RTX | |
| MSI RTX 2070 Gaming Z 8G | |
| AMD Radeon RX Vega 64 | |
| Nvidia GeForce RTX 2060 Super | |
| Nvidia GeForce RTX 2070 Super | |
| AMD Radeon RX 5700 XT | |
| MSI RTX 2060 Gaming Z 6G | |
| AMD Radeon VII | |
| AMD Radeon RX 5700 | |
| 3840x2160 Ultra Preset AA:T | |
| Nvidia Titan RTX | |
| MSI RTX 2080 Gaming X Trio | |
| AMD Radeon VII | |
| Nvidia GeForce RTX 2070 Super | |
| AMD Radeon RX 5700 XT | |
| MSI RTX 2070 Gaming Z 8G | |
| Nvidia GeForce RTX 2060 Super | |
| AMD Radeon RX 5700 | |
| AMD Radeon RX Vega 64 | |
| MSI RTX 2060 Gaming Z 6G | |
| 2560x1440 Ultra Preset AA:T | |
| MSI RTX 2080 Gaming X Trio | |
| Nvidia GeForce RTX 2070 Super | |
| AMD Radeon RX 5700 XT | |
| MSI RTX 2070 Gaming Z 8G | |
| Nvidia GeForce RTX 2060 Super | |
| AMD Radeon RX 5700 | |
| The Crew 2 | |
| 1920x1080 Ultra Preset | |
| Nvidia Titan RTX | |
| MSI RTX 2060 Gaming Z 6G | |
| MSI RTX 2070 Gaming Z 8G | |
| MSI RTX 2080 Gaming X Trio | |
| AMD Radeon VII | |
| Nvidia GeForce RTX 2060 Super | |
| Nvidia GeForce RTX 2070 Super | |
| AMD Radeon RX 5700 | |
| AMD Radeon RX 5700 XT | |
| 3840x2160 Ultra Preset | |
| Nvidia Titan RTX | |
| MSI RTX 2080 Gaming X Trio | |
| Nvidia GeForce RTX 2070 Super | |
| AMD Radeon RX 5700 XT | |
| MSI RTX 2070 Gaming Z 8G | |
| AMD Radeon VII | |
| AMD Radeon RX 5700 | |
| Nvidia GeForce RTX 2060 Super | |
| MSI RTX 2060 Gaming Z 6G | |
| 2560x1440 Ultra Preset | |
| MSI RTX 2070 Gaming Z 8G | |
| MSI RTX 2080 Gaming X Trio | |
| Nvidia GeForce RTX 2070 Super | |
| AMD Radeon RX 5700 | |
| AMD Radeon RX 5700 XT | |
| Nvidia GeForce RTX 2060 Super | |
| Assassin´s Creed Origins | |
| 1920x1080 Ultra High Preset | |
| Nvidia Titan RTX | |
| MSI RTX 2080 Gaming X Trio | |
| MSI RTX 2070 Gaming Z 8G | |
| Nvidia GeForce RTX 2070 Super | |
| Nvidia GeForce RTX 2060 Super | |
| MSI RTX 2060 Gaming Z 6G | |
| AMD Radeon RX Vega 64 | |
| AMD Radeon VII | |
| AMD Radeon RX 5700 | |
| AMD Radeon RX 5700 XT | |
| 3840x2160 Ultra High Preset | |
| Nvidia Titan RTX | |
| MSI RTX 2080 Gaming X Trio | |
| AMD Radeon VII | |
| Nvidia GeForce RTX 2070 Super | |
| MSI RTX 2070 Gaming Z 8G | |
| Nvidia GeForce RTX 2060 Super | |
| MSI RTX 2060 Gaming Z 6G | |
| AMD Radeon RX 5700 XT | |
| AMD Radeon RX 5700 | |
| AMD Radeon RX Vega 64 | |
| 2560x1440 Ultra High Preset | |
| MSI RTX 2080 Gaming X Trio | |
| Nvidia GeForce RTX 2070 Super | |
| MSI RTX 2070 Gaming Z 8G | |
| Nvidia GeForce RTX 2060 Super | |
| AMD Radeon RX 5700 XT | |
| AMD Radeon RX 5700 | |
| Kingdom Come: Deliverance | |
| 1920x1080 Ultra High Preset | |
| Nvidia Titan RTX | |
| MSI RTX 2080 Gaming X Trio | |
| Nvidia GeForce RTX 2070 Super | |
| MSI RTX 2070 Gaming Z 8G | |
| Nvidia GeForce RTX 2060 Super | |
| AMD Radeon RX 5700 XT | |
| AMD Radeon RX Vega 64 | |
| AMD Radeon VII | |
| MSI RTX 2060 Gaming Z 6G | |
| AMD Radeon RX 5700 | |
| 3840x2160 Ultra High Preset | |
| Nvidia Titan RTX | |
| MSI RTX 2080 Gaming X Trio | |
| AMD Radeon RX Vega 64 | |
| Nvidia GeForce RTX 2070 Super | |
| AMD Radeon VII | |
| MSI RTX 2070 Gaming Z 8G | |
| Nvidia GeForce RTX 2060 Super | |
| AMD Radeon RX 5700 XT | |
| AMD Radeon RX 5700 | |
| MSI RTX 2060 Gaming Z 6G | |
| 2560x1440 Ultra High Preset | |
| MSI RTX 2080 Gaming X Trio | |
| Nvidia GeForce RTX 2070 Super | |
| AMD Radeon RX 5700 XT | |
| Nvidia GeForce RTX 2060 Super | |
| MSI RTX 2070 Gaming Z 8G | |
| AMD Radeon RX 5700 | |
| Fortnite | |
| 1920x1080 Epic Preset | |
| Nvidia GeForce RTX 2070 Super | |
| Nvidia GeForce RTX 2060 Super | |
| MSI RTX 2080 Gaming X Trio | |
| AMD Radeon RX 5700 XT | |
| MSI RTX 2060 Gaming Z 6G | |
| MSI RTX 2070 Gaming Z 8G | |
| Nvidia Titan RTX | |
| AMD Radeon RX 5700 | |
| AMD Radeon VII | |
| 3840x2160 Epic Preset | |
| Nvidia Titan RTX | |
| MSI RTX 2080 Gaming X Trio | |
| Nvidia GeForce RTX 2070 Super | |
| MSI RTX 2070 Gaming Z 8G | |
| Nvidia GeForce RTX 2060 Super | |
| AMD Radeon RX 5700 XT | |
| AMD Radeon VII | |
| AMD Radeon RX 5700 | |
| MSI RTX 2060 Gaming Z 6G | |
| 2560x1440 Epic Preset | |
| MSI RTX 2080 Gaming X Trio | |
| Nvidia GeForce RTX 2070 Super | |
| MSI RTX 2070 Gaming Z 8G | |
| Nvidia GeForce RTX 2060 Super | |
| AMD Radeon RX 5700 XT | |
| AMD Radeon RX 5700 | |
| Far Cry Primal | |
| 1920x1080 Ultra Preset AA:SM | |
| AMD Radeon RX Vega 64 | |
| MSI RTX 2070 Gaming Z 8G | |
| AMD Radeon VII | |
| MSI RTX 2060 Gaming Z 6G | |
| AMD Radeon RX 5700 | |
| MSI RTX 2080 Gaming X Trio | |
| Nvidia GeForce RTX 2060 Super | |
| Nvidia GeForce RTX 2070 Super | |
| AMD Radeon RX 5700 XT | |
| Nvidia Titan RTX | |
| 3840x2160 High Preset AA:SM | |
| Nvidia Titan RTX | |
| MSI RTX 2080 Gaming X Trio | |
| AMD Radeon VII | |
| Nvidia GeForce RTX 2070 Super | |
| MSI RTX 2070 Gaming Z 8G | |
| AMD Radeon RX 5700 XT | |
| Nvidia GeForce RTX 2060 Super | |
| AMD Radeon RX 5700 | |
| MSI RTX 2060 Gaming Z 6G | |
| AMD Radeon RX Vega 64 | |
| The Witcher 3 | |
| 1920x1080 Ultra Graphics & Postprocessing (HBAO+) | |
| Nvidia Titan RTX | |
| MSI RTX 2080 Gaming X Trio | |
| Nvidia GeForce RTX 2070 Super | |
| AMD Radeon RX 5700 XT | |
| MSI RTX 2070 Gaming Z 8G | |
| AMD Radeon RX 5700 | |
| Nvidia GeForce RTX 2060 Super | |
| AMD Radeon RX Vega 64 | |
| AMD Radeon VII | |
| MSI RTX 2060 Gaming Z 6G | |
| 3840x2160 High Graphics & Postprocessing (Nvidia HairWorks Off) | |
| Nvidia Titan RTX | |
| MSI RTX 2080 Gaming X Trio | |
| Nvidia GeForce RTX 2070 Super | |
| MSI RTX 2070 Gaming Z 8G | |
| Nvidia GeForce RTX 2060 Super | |
| AMD Radeon VII | |
| AMD Radeon RX 5700 XT | |
| MSI RTX 2060 Gaming Z 6G | |
| AMD Radeon RX Vega 64 | |
| AMD Radeon RX 5700 | |
| The Division | |
| 1920x1080 Ultra Preset AF:16x | |
| Nvidia Titan RTX | |
| MSI RTX 2080 Gaming X Trio | |
| AMD Radeon RX 5700 XT | |
| AMD Radeon RX 5700 | |
| Nvidia GeForce RTX 2070 Super | |
| MSI RTX 2070 Gaming Z 8G | |
| Nvidia GeForce RTX 2060 Super | |
| AMD Radeon RX Vega 64 | |
| MSI RTX 2060 Gaming Z 6G | |
| AMD Radeon VII | |
| 3840x2160 High Preset AF:8x | |
| Nvidia Titan RTX | |
| MSI RTX 2080 Gaming X Trio | |
| AMD Radeon RX 5700 XT | |
| Nvidia GeForce RTX 2070 Super | |
| AMD Radeon VII | |
| MSI RTX 2070 Gaming Z 8G | |
| AMD Radeon RX 5700 | |
| Nvidia GeForce RTX 2060 Super | |
| AMD Radeon RX Vega 64 | |
| MSI RTX 2060 Gaming Z 6G | |
| For Honor | |
| 1920x1080 Extreme Preset AA:T AF:16x | |
| Nvidia Titan RTX | |
| MSI RTX 2080 Gaming X Trio | |
| AMD Radeon RX 5700 XT | |
| Nvidia GeForce RTX 2070 Super | |
| AMD Radeon RX 5700 | |
| MSI RTX 2070 Gaming Z 8G | |
| Nvidia GeForce RTX 2060 Super | |
| AMD Radeon RX Vega 64 | |
| MSI RTX 2060 Gaming Z 6G | |
| AMD Radeon VII | |
| 3840x2160 High Preset AA:T AF:8x | |
| Nvidia Titan RTX | |
| MSI RTX 2080 Gaming X Trio | |
| Nvidia GeForce RTX 2070 Super | |
| AMD Radeon VII | |
| AMD Radeon RX 5700 XT | |
| MSI RTX 2070 Gaming Z 8G | |
| Nvidia GeForce RTX 2060 Super | |
| AMD Radeon RX 5700 | |
| MSI RTX 2060 Gaming Z 6G | |
| AMD Radeon RX Vega 64 | |
| Ghost Recon Wildlands | |
| 1920x1080 Ultra Preset AA:T AF:16x | |
| Nvidia Titan RTX | |
| MSI RTX 2080 Gaming X Trio | |
| Nvidia GeForce RTX 2070 Super | |
| AMD Radeon RX 5700 XT | |
| MSI RTX 2070 Gaming Z 8G | |
| Nvidia GeForce RTX 2060 Super | |
| AMD Radeon RX 5700 | |
| MSI RTX 2060 Gaming Z 6G | |
| AMD Radeon RX Vega 64 | |
| AMD Radeon VII | |
| 3840x2160 Ultra Preset AA:T AF:16x | |
| Nvidia Titan RTX | |
| MSI RTX 2080 Gaming X Trio | |
| Nvidia GeForce RTX 2070 Super | |
| AMD Radeon RX 5700 XT | |
| MSI RTX 2070 Gaming Z 8G | |
| AMD Radeon RX 5700 | |
| Nvidia GeForce RTX 2060 Super | |
| GTA V | |
| 1920x1080 Highest AA:4xMSAA + FX AF:16x | |
| Nvidia Titan RTX | |
| MSI RTX 2080 Gaming X Trio | |
| AMD Radeon VII | |
| MSI RTX 2070 Gaming Z 8G | |
| MSI RTX 2060 Gaming Z 6G | |
| Nvidia GeForce RTX 2060 Super | |
| Nvidia GeForce RTX 2070 Super | |
| AMD Radeon RX 5700 | |
| AMD Radeon RX 5700 XT | |
| 3840x2160 High/On (Advanced Graphics Off) AA:FX AF:8x | |
| Nvidia Titan RTX | |
| Nvidia GeForce RTX 2070 Super | |
| AMD Radeon RX 5700 XT | |
| MSI RTX 2080 Gaming X Trio | |
| Nvidia GeForce RTX 2060 Super | |
| AMD Radeon RX 5700 | |
| AMD Radeon VII | |
| MSI RTX 2070 Gaming Z 8G | |
| MSI RTX 2060 Gaming Z 6G | |
| Hitman 2 | |
| 1920x1080 Ultra AF:16x | |
| AMD Radeon VII | |
| AMD Radeon RX 5700 XT | |
| AMD Radeon RX 5700 | |
| MSI RTX 2060 Gaming Z 6G | |
| MSI RTX 2080 Gaming X Trio | |
| Nvidia GeForce RTX 2060 Super | |
| AMD Radeon RX Vega 64 | |
| MSI RTX 2070 Gaming Z 8G | |
| Nvidia GeForce RTX 2070 Super | |
| Nvidia Titan RTX | |
| 3840x2160 Ultra AF:16x | |
| Nvidia Titan RTX | |
| MSI RTX 2080 Gaming X Trio | |
| Nvidia GeForce RTX 2070 Super | |
| AMD Radeon VII | |
| AMD Radeon RX 5700 XT | |
| AMD Radeon RX Vega 64 | |
| MSI RTX 2070 Gaming Z 8G | |
| AMD Radeon RX 5700 | |
| Nvidia GeForce RTX 2060 Super | |
| MSI RTX 2060 Gaming Z 6G | |
| 2560x1440 Ultra AF:16x | |
| MSI RTX 2080 Gaming X Trio | |
| AMD Radeon RX 5700 XT | |
| AMD Radeon RX 5700 | |
| Nvidia GeForce RTX 2070 Super | |
| MSI RTX 2070 Gaming Z 8G | |
| Nvidia GeForce RTX 2060 Super | |
| Battlefield V | |
| 1920x1080 Ultra Preset | |
| Nvidia Titan RTX | |
| MSI RTX 2080 Gaming X Trio | |
| AMD Radeon RX Vega 64 | |
| AMD Radeon VII | |
| MSI RTX 2070 Gaming Z 8G | |
| MSI RTX 2060 Gaming Z 6G | |
| AMD Radeon RX 5700 XT | |
| AMD Radeon RX 5700 | |
| Nvidia GeForce RTX 2070 Super | |
| Nvidia GeForce RTX 2060 Super | |
| 3840x2160 Ultra Preset | |
| Nvidia Titan RTX | |
| MSI RTX 2080 Gaming X Trio | |
| AMD Radeon VII | |
| MSI RTX 2070 Gaming Z 8G | |
| AMD Radeon RX Vega 64 | |
| AMD Radeon RX 5700 XT | |
| AMD Radeon RX 5700 | |
| MSI RTX 2060 Gaming Z 6G | |
| Nvidia GeForce RTX 2070 Super | |
| Nvidia GeForce RTX 2060 Super | |
| 2560x1440 Ultra Preset | |
| MSI RTX 2080 Gaming X Trio | |
| MSI RTX 2070 Gaming Z 8G | |
| AMD Radeon RX 5700 XT | |
| AMD Radeon RX 5700 | |
| Nvidia GeForce RTX 2070 Super | |
| Nvidia GeForce RTX 2060 Super | |
| Farming Simulator 19 | |
| 1920x1080 Very High Preset | |
| Nvidia Titan RTX | |
| MSI RTX 2080 Gaming X Trio | |
| MSI RTX 2060 Gaming Z 6G | |
| Nvidia GeForce RTX 2070 Super | |
| MSI RTX 2070 Gaming Z 8G | |
| Nvidia GeForce RTX 2060 Super | |
| AMD Radeon RX 5700 XT | |
| AMD Radeon VII | |
| AMD Radeon RX Vega 64 | |
| AMD Radeon RX 5700 | |
| 3840x2160 Very High Preset | |
| Nvidia Titan RTX | |
| MSI RTX 2080 Gaming X Trio | |
| Nvidia GeForce RTX 2070 Super | |
| MSI RTX 2070 Gaming Z 8G | |
| Nvidia GeForce RTX 2060 Super | |
| MSI RTX 2060 Gaming Z 6G | |
| AMD Radeon RX 5700 XT | |
| AMD Radeon VII | |
| AMD Radeon RX 5700 | |
| AMD Radeon RX Vega 64 | |
| 2560x1440 Very High Preset | |
| MSI RTX 2080 Gaming X Trio | |
| MSI RTX 2070 Gaming Z 8G | |
| Nvidia GeForce RTX 2070 Super | |
| Nvidia GeForce RTX 2060 Super | |
| AMD Radeon RX 5700 XT | |
| AMD Radeon RX 5700 | |
| Darksiders III | |
| 1920x1080 Epic | |
| Nvidia Titan RTX | |
| MSI RTX 2080 Gaming X Trio | |
| Nvidia GeForce RTX 2070 Super | |
| MSI RTX 2070 Gaming Z 8G | |
| AMD Radeon RX 5700 XT | |
| AMD Radeon VII | |
| MSI RTX 2060 Gaming Z 6G | |
| Nvidia GeForce RTX 2060 Super | |
| AMD Radeon RX 5700 | |
| AMD Radeon RX Vega 64 | |
| 3840x2160 Epic | |
| Nvidia Titan RTX | |
| MSI RTX 2080 Gaming X Trio | |
| Nvidia GeForce RTX 2070 Super | |
| MSI RTX 2070 Gaming Z 8G | |
| AMD Radeon VII | |
| AMD Radeon RX 5700 XT | |
| Nvidia GeForce RTX 2060 Super | |
| AMD Radeon RX 5700 | |
| AMD Radeon RX Vega 64 | |
| MSI RTX 2060 Gaming Z 6G | |
| Just Cause 4 | |
| 1920x1080 Very High / On AA:SM AF:16x | |
| Nvidia Titan RTX | |
| MSI RTX 2080 Gaming X Trio | |
| Nvidia GeForce RTX 2070 Super | |
| AMD Radeon RX 5700 XT | |
| MSI RTX 2070 Gaming Z 8G | |
| Nvidia GeForce RTX 2060 Super | |
| AMD Radeon VII | |
| MSI RTX 2060 Gaming Z 6G | |
| AMD Radeon RX Vega 64 | |
| AMD Radeon RX 5700 | |
| 3840x2160 Very High / On AA:SM AF:16x | |
| Nvidia Titan RTX | |
| MSI RTX 2080 Gaming X Trio | |
| Nvidia GeForce RTX 2070 Super | |
| AMD Radeon VII | |
| AMD Radeon RX 5700 XT | |
| MSI RTX 2070 Gaming Z 8G | |
| Nvidia GeForce RTX 2060 Super | |
| AMD Radeon RX 5700 | |
| MSI RTX 2060 Gaming Z 6G | |
| AMD Radeon RX Vega 64 | |
| 2560x1440 Very High / On AA:SM AF:16x | |
| MSI RTX 2080 Gaming X Trio | |
| Nvidia GeForce RTX 2070 Super | |
| AMD Radeon RX 5700 XT | |
| MSI RTX 2070 Gaming Z 8G | |
| Nvidia GeForce RTX 2060 Super | |
| AMD Radeon RX 5700 | |
| Apex Legends | |
| 1920x1080 Maximum Settings AA:TS AF:16x | |
| MSI RTX 2070 Gaming Z 8G | |
| MSI RTX 2080 Gaming X Trio | |
| Nvidia Titan RTX 24 GB | |
| Nvidia GeForce RTX 2060 Super | |
| Nvidia GeForce RTX 2070 Super | |
| AMD Radeon RX 5700 XT | |
| AMD Radeon RX 5700 | |
| MSI RTX 2060 Gaming Z 6G | |
| AMD Radeon RX Vega 64 | |
| 3840x2160 Maximum Settings AA:TS AF:16x | |
| Nvidia Titan RTX 24 GB | |
| MSI RTX 2080 Gaming X Trio | |
| MSI RTX 2070 Gaming Z 8G | |
| Nvidia GeForce RTX 2070 Super | |
| AMD Radeon RX 5700 XT | |
| Nvidia GeForce RTX 2060 Super | |
| AMD Radeon RX 5700 | |
| AMD Radeon RX Vega 64 | |
| MSI RTX 2060 Gaming Z 6G | |
| 2560x1440 Maximum Settings AA:TS AF:16x | |
| Nvidia Titan RTX 24 GB | |
| MSI RTX 2070 Gaming Z 8G | |
| MSI RTX 2080 Gaming X Trio | |
| Nvidia GeForce RTX 2070 Super | |
| AMD Radeon RX 5700 XT | |
| Nvidia GeForce RTX 2060 Super | |
| AMD Radeon RX 5700 | |
| MSI RTX 2060 Gaming Z 6G | |
| AMD Radeon RX Vega 64 | |
| Far Cry New Dawn | |
| 1920x1080 Ultra Preset | |
| MSI RTX 2080 Gaming X Trio | |
| MSI RTX 2070 Gaming Z 8G | |
| MSI RTX 2060 Gaming Z 6G | |
| Nvidia GeForce RTX 2070 Super | |
| AMD Radeon RX Vega 64 | |
| Nvidia GeForce RTX 2060 Super | |
| AMD Radeon VII | |
| AMD Radeon RX 5700 | |
| AMD Radeon RX 5700 XT | |
| Nvidia Titan RTX 24 GB | |
| 3840x2160 Ultra Preset | |
| Nvidia Titan RTX 24 GB | |
| MSI RTX 2080 Gaming X Trio | |
| AMD Radeon VII | |
| Nvidia GeForce RTX 2070 Super | |
| AMD Radeon RX 5700 XT | |
| MSI RTX 2070 Gaming Z 8G | |
| AMD Radeon RX 5700 | |
| Nvidia GeForce RTX 2060 Super | |
| AMD Radeon RX Vega 64 | |
| MSI RTX 2060 Gaming Z 6G | |
| 2560x1440 Ultra Preset | |
| MSI RTX 2080 Gaming X Trio | |
| Nvidia GeForce RTX 2070 Super | |
| AMD Radeon VII | |
| MSI RTX 2070 Gaming Z 8G | |
| AMD Radeon RX 5700 XT | |
| AMD Radeon RX Vega 64 | |
| Nvidia GeForce RTX 2060 Super | |
| AMD Radeon RX 5700 | |
| MSI RTX 2060 Gaming Z 6G | |
| Nvidia Titan RTX 24 GB | |
| Metro Exodus | |
| 1920x1080 Ultra Quality AF:16x | |
| MSI RTX 2080 Gaming X Trio | |
| Nvidia Titan RTX 24 GB | |
| Nvidia GeForce RTX 2070 Super | |
| AMD Radeon VII | |
| AMD Radeon RX 5700 XT | |
| MSI RTX 2070 Gaming Z 8G | |
| Nvidia GeForce RTX 2060 Super | |
| AMD Radeon RX 5700 | |
| AMD Radeon RX Vega 64 | |
| MSI RTX 2060 Gaming Z 6G | |
| 3840x2160 Ultra Quality AF:16x | |
| Nvidia Titan RTX 24 GB | |
| AMD Radeon RX Vega 64 | |
| MSI RTX 2080 Gaming X Trio | |
| AMD Radeon VII | |
| Nvidia GeForce RTX 2070 Super | |
| MSI RTX 2070 Gaming Z 8G | |
| Nvidia GeForce RTX 2060 Super | |
| AMD Radeon RX 5700 XT | |
| AMD Radeon RX 5700 | |
| MSI RTX 2060 Gaming Z 6G | |
| 2560x1440 Ultra Quality AF:16x | |
| Nvidia Titan RTX 24 GB | |
| MSI RTX 2080 Gaming X Trio | |
| AMD Radeon VII | |
| AMD Radeon RX 5700 XT | |
| Nvidia GeForce RTX 2070 Super | |
| MSI RTX 2070 Gaming Z 8G | |
| AMD Radeon RX 5700 | |
| Nvidia GeForce RTX 2060 Super | |
| AMD Radeon RX Vega 64 | |
| MSI RTX 2060 Gaming Z 6G | |
| Anthem | |
| 1920x1080 Ultra Preset | |
| MSI RTX 2080 Gaming X Trio | |
| AMD Radeon RX Vega 64 | |
| Nvidia GeForce RTX 2070 Super | |
| Nvidia Titan RTX 24 GB | |
| MSI RTX 2070 Gaming Z 8G | |
| AMD Radeon VII | |
| Nvidia GeForce RTX 2060 Super | |
| MSI RTX 2060 Gaming Z 6G | |
| AMD Radeon RX 5700 XT | |
| AMD Radeon RX 5700 | |
| 2560x1440 Ultra Preset | |
| Nvidia Titan RTX 24 GB | |
| MSI RTX 2080 Gaming X Trio | |
| AMD Radeon RX 5700 XT | |
| AMD Radeon VII | |
| Nvidia GeForce RTX 2070 Super | |
| MSI RTX 2070 Gaming Z 8G | |
| AMD Radeon RX 5700 | |
| AMD Radeon RX Vega 64 | |
| Nvidia GeForce RTX 2060 Super | |
| MSI RTX 2060 Gaming Z 6G | |
| Dirt Rally 2.0 | |
| 1920x1080 Ultra Preset AA:T AF:16x | |
| Nvidia Titan RTX 24 GB | |
| AMD Radeon RX 5700 XT | |
| Nvidia GeForce RTX 2070 Super | |
| MSI RTX 2080 Gaming X Trio | |
| AMD Radeon VII | |
| AMD Radeon RX 5700 | |
| MSI RTX 2070 Gaming Z 8G | |
| Nvidia GeForce RTX 2060 Super | |
| AMD Radeon RX Vega 64 | |
| MSI RTX 2060 Gaming Z 6G | |
| 3840x2160 Ultra Preset AA:T AF:16x | |
| Nvidia Titan RTX 24 GB | |
| MSI RTX 2080 Gaming X Trio | |
| Nvidia GeForce RTX 2070 Super | |
| AMD Radeon VII | |
| AMD Radeon RX 5700 XT | |
| MSI RTX 2070 Gaming Z 8G | |
| AMD Radeon RX 5700 | |
| Nvidia GeForce RTX 2060 Super | |
| AMD Radeon RX Vega 64 | |
| MSI RTX 2060 Gaming Z 6G | |
| 2560x1440 Ultra Preset AA:T AF:16x | |
| Nvidia Titan RTX 24 GB | |
| Nvidia GeForce RTX 2070 Super | |
| AMD Radeon RX 5700 XT | |
| MSI RTX 2080 Gaming X Trio | |
| AMD Radeon VII | |
| AMD Radeon RX 5700 | |
| MSI RTX 2070 Gaming Z 8G | |
| Nvidia GeForce RTX 2060 Super | |
| AMD Radeon RX Vega 64 | |
| MSI RTX 2060 Gaming Z 6G | |
| The Division 2 | |
| 1920x1080 Ultra Preset | |
| Nvidia Titan RTX 24 GB | |
| MSI RTX 2080 Gaming X Trio | |
| MSI RTX 2070 Gaming Z 8G | |
| Nvidia GeForce RTX 2070 Super | |
| AMD Radeon RX 5700 XT | |
| MSI RTX 2060 Gaming Z 6G | |
| Nvidia GeForce RTX 2060 Super | |
| AMD Radeon RX Vega 64 | |
| AMD Radeon RX 5700 | |
| 3840x2160 Ultra Preset | |
| Nvidia Titan RTX 24 GB | |
| MSI RTX 2080 Gaming X Trio | |
| MSI RTX 2070 Gaming Z 8G | |
| Nvidia GeForce RTX 2070 Super | |
| AMD Radeon RX 5700 XT | |
| MSI RTX 2060 Gaming Z 6G | |
| AMD Radeon RX Vega 64 | |
| Nvidia GeForce RTX 2060 Super | |
| AMD Radeon RX 5700 | |
| 2560x1440 Ultra Preset | |
| Nvidia Titan RTX 24 GB | |
| MSI RTX 2080 Gaming X Trio | |
| MSI RTX 2070 Gaming Z 8G | |
| Nvidia GeForce RTX 2070 Super | |
| AMD Radeon RX 5700 XT | |
| MSI RTX 2060 Gaming Z 6G | |
| Nvidia GeForce RTX 2060 Super | |
| AMD Radeon RX Vega 64 | |
| AMD Radeon RX 5700 | |
| Anno 1800 | |
| 3840x2160 Ultra Graphics Quality (DX11) | |
| Nvidia Titan RTX 24 GB | |
| MSI RTX 2080 Gaming X Trio | |
| Nvidia GeForce RTX 2070 Super | |
| MSI RTX 2070 Gaming Z 8G | |
| AMD Radeon RX 5700 XT | |
| Nvidia GeForce RTX 2060 Super | |
| AMD Radeon RX 5700 | |
| MSI RTX 2060 Gaming Z 6G | |
| AMD Radeon RX Vega 64 | |
| 1920x1080 Ultra Graphics Quality (DX11) | |
| MSI RTX 2080 Gaming X Trio | |
| Nvidia GeForce RTX 2070 Super | |
| AMD Radeon RX 5700 XT | |
| MSI RTX 2070 Gaming Z 8G | |
| MSI RTX 2060 Gaming Z 6G | |
| Nvidia GeForce RTX 2060 Super | |
| AMD Radeon RX 5700 | |
| Nvidia Titan RTX 24 GB | |
| AMD Radeon RX Vega 64 | |
| 2560x1440 Ultra Graphics Quality (DX11) | |
| MSI RTX 2080 Gaming X Trio | |
| Nvidia GeForce RTX 2070 Super | |
| AMD Radeon RX 5700 XT | |
| MSI RTX 2070 Gaming Z 8G | |
| Nvidia GeForce RTX 2060 Super | |
| AMD Radeon RX 5700 | |
| MSI RTX 2060 Gaming Z 6G | |
| Nvidia Titan RTX 24 GB | |
| AMD Radeon RX Vega 64 | |
| Rage 2 | |
| 3840x2160 Ultra Preset (Resolution Scale Off) | |
| Nvidia Titan RTX 24 GB | |
| MSI RTX 2080 Gaming X Trio | |
| Nvidia GeForce RTX 2070 Super | |
| MSI RTX 2070 Gaming Z 8G | |
| AMD Radeon RX 5700 XT | |
| Nvidia GeForce RTX 2060 Super | |
| AMD Radeon RX Vega 64 | |
| AMD Radeon RX 5700 | |
| MSI RTX 2060 Gaming Z 6G | |
| 1920x1080 Ultra Preset (Resolution Scale Off) | |
| Nvidia Titan RTX 24 GB | |
| MSI RTX 2080 Gaming X Trio | |
| Nvidia GeForce RTX 2070 Super | |
| MSI RTX 2070 Gaming Z 8G | |
| AMD Radeon RX Vega 64 | |
| Nvidia GeForce RTX 2060 Super | |
| AMD Radeon RX 5700 XT | |
| MSI RTX 2060 Gaming Z 6G | |
| 2560x1440 Ultra Preset (Resolution Scale Off) | |
| Nvidia Titan RTX 24 GB | |
| MSI RTX 2080 Gaming X Trio | |
| Nvidia GeForce RTX 2070 Super | |
| MSI RTX 2070 Gaming Z 8G | |
| AMD Radeon RX Vega 64 | |
| Nvidia GeForce RTX 2060 Super | |
| AMD Radeon RX 5700 XT | |
| AMD Radeon RX 5700 | |
| MSI RTX 2060 Gaming Z 6G | |
| F1 2019 | |
| 3840x2160 Ultra High Preset AA:T AF:16x | |
| Nvidia Titan RTX 24 GB | |
| Nvidia GeForce RTX 2070 Super | |
| AMD Radeon RX 5700 XT | |
| AMD Radeon RX 5700 | |
| Nvidia GeForce RTX 2060 Super | |
| AMD Radeon RX Vega 64 | |
| 1920x1080 Ultra High Preset AA:T AF:16x | |
| AMD Radeon RX 5700 XT | |
| Nvidia GeForce RTX 2070 Super | |
| Nvidia Titan RTX 24 GB | |
| AMD Radeon RX Vega 64 | |
| AMD Radeon RX 5700 | |
| Nvidia GeForce RTX 2060 Super | |
| 2560x1440 Ultra High Preset AA:T AF:16x | |
| Nvidia Titan RTX 24 GB | |
| Nvidia GeForce RTX 2070 Super | |
| AMD Radeon RX 5700 XT | |
| AMD Radeon RX 5700 | |
| Nvidia GeForce RTX 2060 Super | |
| AMD Radeon RX Vega 64 | |
| Destiny 2 | |
| 2560x1440 Highest Preset AA:SM AF:16x | |
| MSI RTX 2080 Gaming X Trio | |
| Nvidia GeForce RTX 2070 Super | |
| MSI RTX 2070 Gaming Z 8G | |
| AMD Radeon RX 5700 XT | |
| Nvidia GeForce RTX 2060 Super | |
| AMD Radeon RX 5700 | |
| 1920x1080 Highest Preset AA:SM AF:16x | |
| Nvidia Titan RTX | |
| MSI RTX 2070 Gaming Z 8G | |
| MSI RTX 2080 Gaming X Trio | |
| Nvidia GeForce RTX 2060 Super | |
| Nvidia GeForce RTX 2070 Super | |
| AMD Radeon RX 5700 XT | |
| AMD Radeon RX 5700 | |
| AMD Radeon VII | |
| MSI RTX 2060 Gaming Z 6G | |
| 3840x2160 Highest Preset AA:SM AF:16x | |
| Nvidia Titan RTX | |
| MSI RTX 2080 Gaming X Trio | |
| Nvidia GeForce RTX 2070 Super | |
| MSI RTX 2070 Gaming Z 8G | |
| AMD Radeon RX 5700 XT | |
| Nvidia GeForce RTX 2060 Super | |
| AMD Radeon VII | |
| MSI RTX 2060 Gaming Z 6G | |
| AMD Radeon RX 5700 | |
| low | med. | high | ultra | QHD | 4K | |
|---|---|---|---|---|---|---|
| GTA V (2015) | 167 | 160 | 142 | 81 | 90 | |
| The Witcher 3 (2015) | 297 | 144 | 92 | 52.1 | ||
| Dota 2 Reborn (2015) | 132.4 | 122.4 | 88.5 | 87.4 | 91 | |
| Rainbow Six Siege (2015) | 320.6 | 258.5 | 246.4 | 115.9 | ||
| Far Cry Primal (2016) | 120 | 108 | 99 | 89 | 59 | |
| The Division (2016) | 285.5 | 163.8 | 126 | 62.3 | ||
| Overwatch (2016) | 300 | 300 | 228 | 154 | ||
| For Honor (2017) | 295 | 208 | 198.7 | 156.4 | 63.5 | |
| Ghost Recon Wildlands (2017) | 125.6 | 94.6 | 93.3 | 64.8 | 48.4 | |
| Rocket League (2017) | 249 | 249 | 242 | 144 | ||
| Playerunknown's Battlegrounds (PUBG) (2017) | 201 | 177 | 166 | 139 | 52.5 | |
| Destiny 2 (2017) | 147 | 148 | 145 | 142 | 106 | 56.5 |
| Assassin´s Creed Origins (2017) | 74 | 69 | 68 | 63 | 61 | 39 |
| Fortnite (2018) | 318 | 223 | 179 | 143 | 93 | 45.4 |
| Final Fantasy XV Benchmark (2018) | 151 | 112 | 69 | 32.8 | ||
| Kingdom Come: Deliverance (2018) | 151 | 125 | 101 | 73 | 59 | 29.6 |
| X-Plane 11.11 (2018) | 66 | 56.5 | 48.1 | 38 | ||
| Far Cry 5 (2018) | 118 | 105 | 101 | 96 | 89 | 51 |
| The Crew 2 (2018) | 60 | 60 | 60 | 60 | 60 | 43.2 |
| Monster Hunter World (2018) | 127 | 119 | 113 | 91 | 58.7 | 29.6 |
| Shadow of the Tomb Raider (2018) | 138 | 118 | 118 | 110 | 76 | 38 |
| FIFA 19 (2018) | 305 | 298 | 283 | 276 | 273 | 186 |
| Forza Horizon 4 (2018) | 179 | 155 | 154 | 138 | 119 | 79 |
| Assassin´s Creed Odyssey (2018) | 82 | 76 | 70 | 62 | 53 | 35 |
| Call of Duty Black Ops 4 (2018) | 231 | 199 | 194 | 135 | 126 | 55.7 |
| Hitman 2 (2018) | 95 | 93 | 84 | 81 | 80 | 52.3 |
| Battlefield V (2018) | 140 | 119 | 110 | 105 | 89 | 59.5 |
| Farming Simulator 19 (2018) | 191 | 147 | 125 | 116 | 93 | 53.2 |
| Darksiders III (2018) | 199 | 139 | 128 | 121 | 82 | 41.7 |
| Just Cause 4 (2018) | 124 | 118 | 109 | 106 | 84 | 44.1 |
| Apex Legends (2019) | 144 | 144 | 144 | 144 | 117 | 65 |
| Far Cry New Dawn (2019) | 97 | 91 | 88 | 79 | 80 | 56 |
| Metro Exodus (2019) | 143 | 75 | 67 | 61 | 54.5 | 29.6 |
| Anthem (2019) | 101 | 95 | 94 | 88 | 84 | 47.1 |
| Dirt Rally 2.0 (2019) | 247 | 192 | 186 | 120 | 88 | 49.9 |
| The Division 2 (2019) | 158 | 128 | 107 | 88 | 64 | 34.1 |
| Anno 1800 (2019) | 99 | 93 | 71 | 40.9 | 38.6 | 25.5 |
| Rage 2 (2019) | 256 | 133 | 108 | 103 | 68 | 34.7 |
| F1 2019 (2019) | 238 | 218 | 178 | 140 | 109 | 67 |
Compute Performance
Due to unoptimized drivers, consumer graphics cards are not really suitable for use in workstations. However, we still benchmark these lower-priced consumer-grade GPUs to see how they perform in professional applications. Even though the RX 5700 XT and the RTX 2070S FE have the same number of shading units, the Navi-based video card cannot keep up with the Turing-based GPU. The RX 5700 XT manages to beat the RTX 2070S FE only in a few very specific workloads.
| LuxMark v2.0 64Bit | |
| Room GPUs-only | |
| Nvidia Titan RTX | |
| AMD Radeon VII | |
| MSI RTX 2080 Gaming X Trio | |
| Nvidia GeForce RTX 2070 Super | |
| MSI RTX 2070 Gaming Z 8G | |
| Nvidia GeForce RTX 2060 Super | |
| MSI RTX 2060 Gaming Z 6G | |
| AMD Radeon RX 5700 XT | |
| AMD Radeon RX 5700 | |
| Sala GPUs-only | |
| Nvidia Titan RTX | |
| MSI RTX 2080 Gaming X Trio | |
| Nvidia GeForce RTX 2070 Super | |
| MSI RTX 2070 Gaming Z 8G | |
| Nvidia GeForce RTX 2060 Super | |
| AMD Radeon VII | |
| AMD Radeon RX 5700 XT | |
| MSI RTX 2060 Gaming Z 6G | |
| AMD Radeon RX 5700 | |
| SiSoft Sandra 2016 | |
| GP Financial Analysis (FP High/Double Precision) | |
| AMD Radeon VII | |
| MSI RTX 2080 Gaming X Trio | |
| Nvidia GeForce RTX 2070 Super | |
| MSI RTX 2070 Gaming Z 8G | |
| Nvidia GeForce RTX 2060 Super | |
| MSI RTX 2060 Gaming Z 6G | |
| AMD Radeon RX 5700 XT | |
| AMD Radeon RX 5700 | |
| Image Processing | |
| AMD Radeon VII | |
| MSI RTX 2080 Gaming X Trio | |
| Nvidia GeForce RTX 2070 Super | |
| MSI RTX 2070 Gaming Z 8G | |
| Nvidia GeForce RTX 2060 Super | |
| AMD Radeon RX 5700 XT | |
| MSI RTX 2060 Gaming Z 6G | |
| AMD Radeon RX 5700 | |
Emissions of the AMD Radeon RX 5700 XT
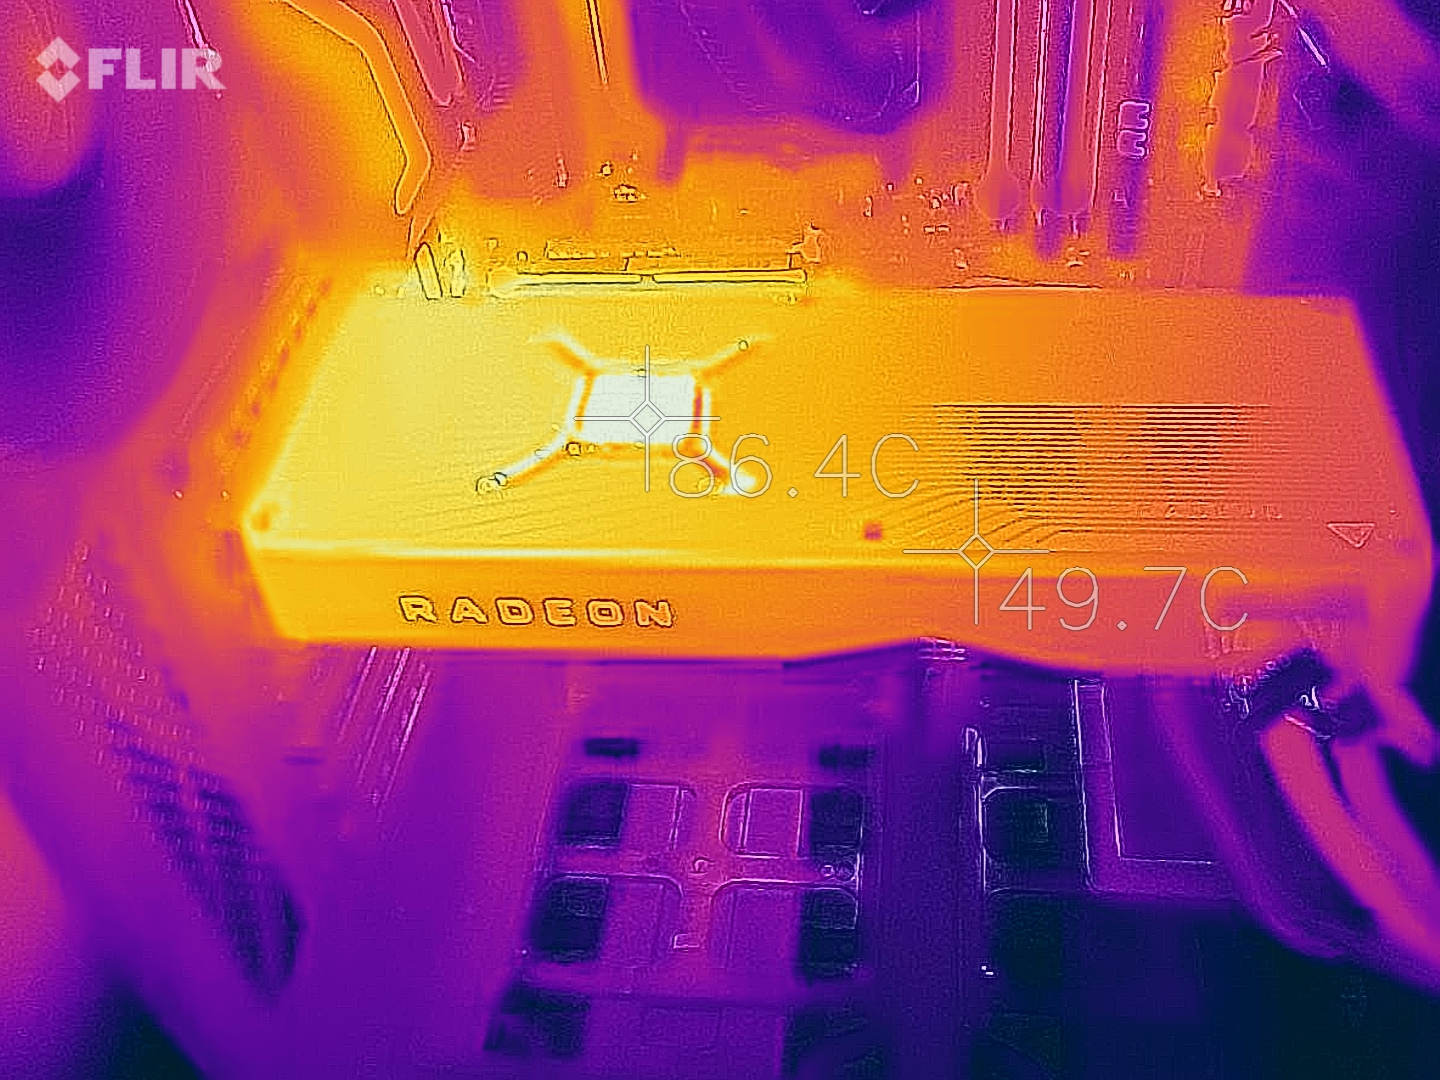
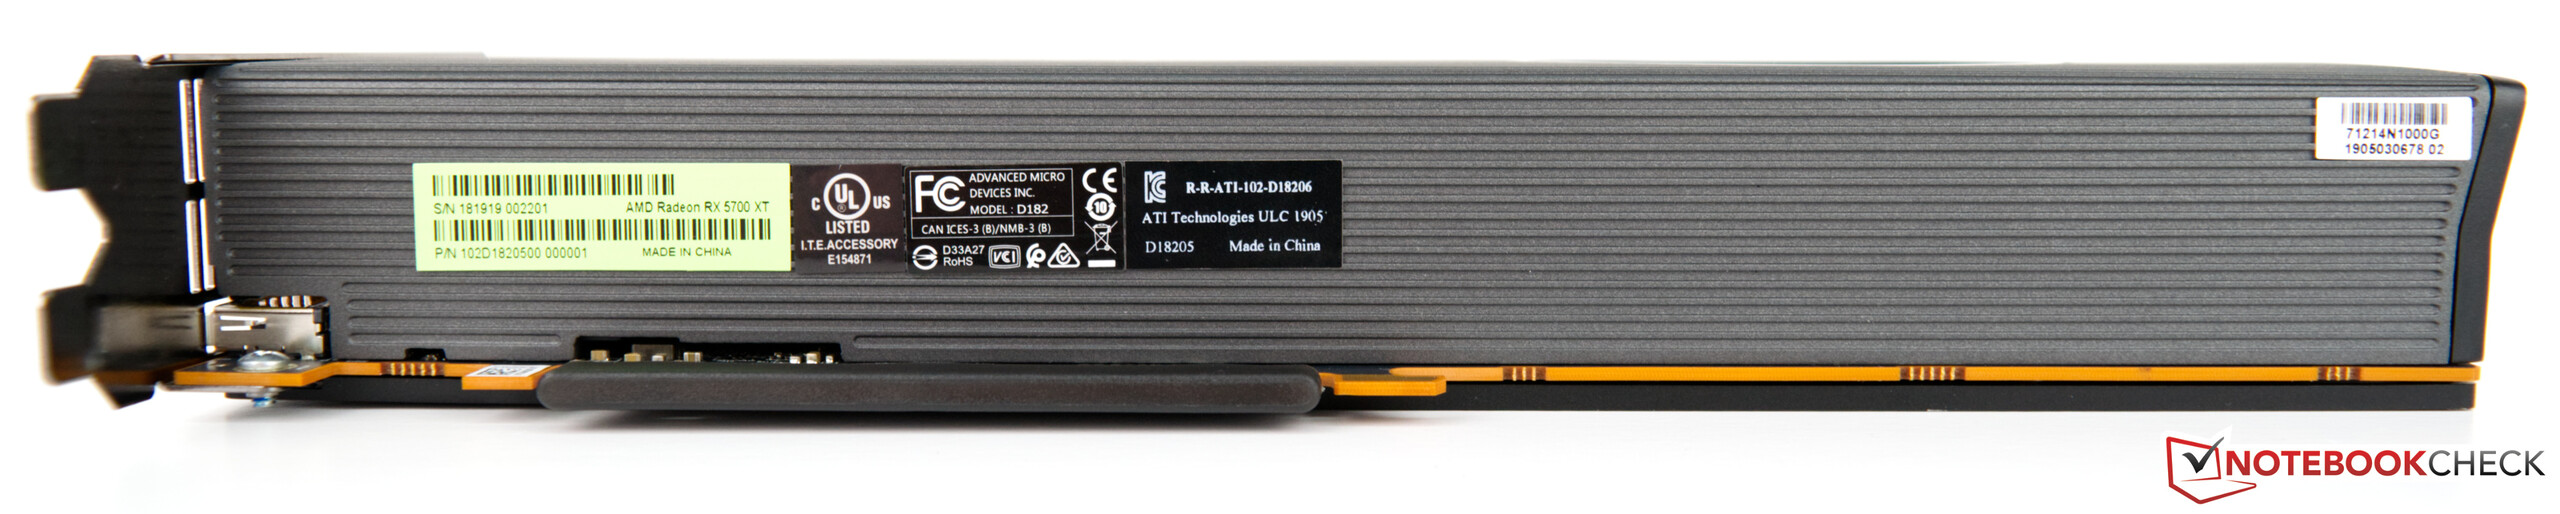
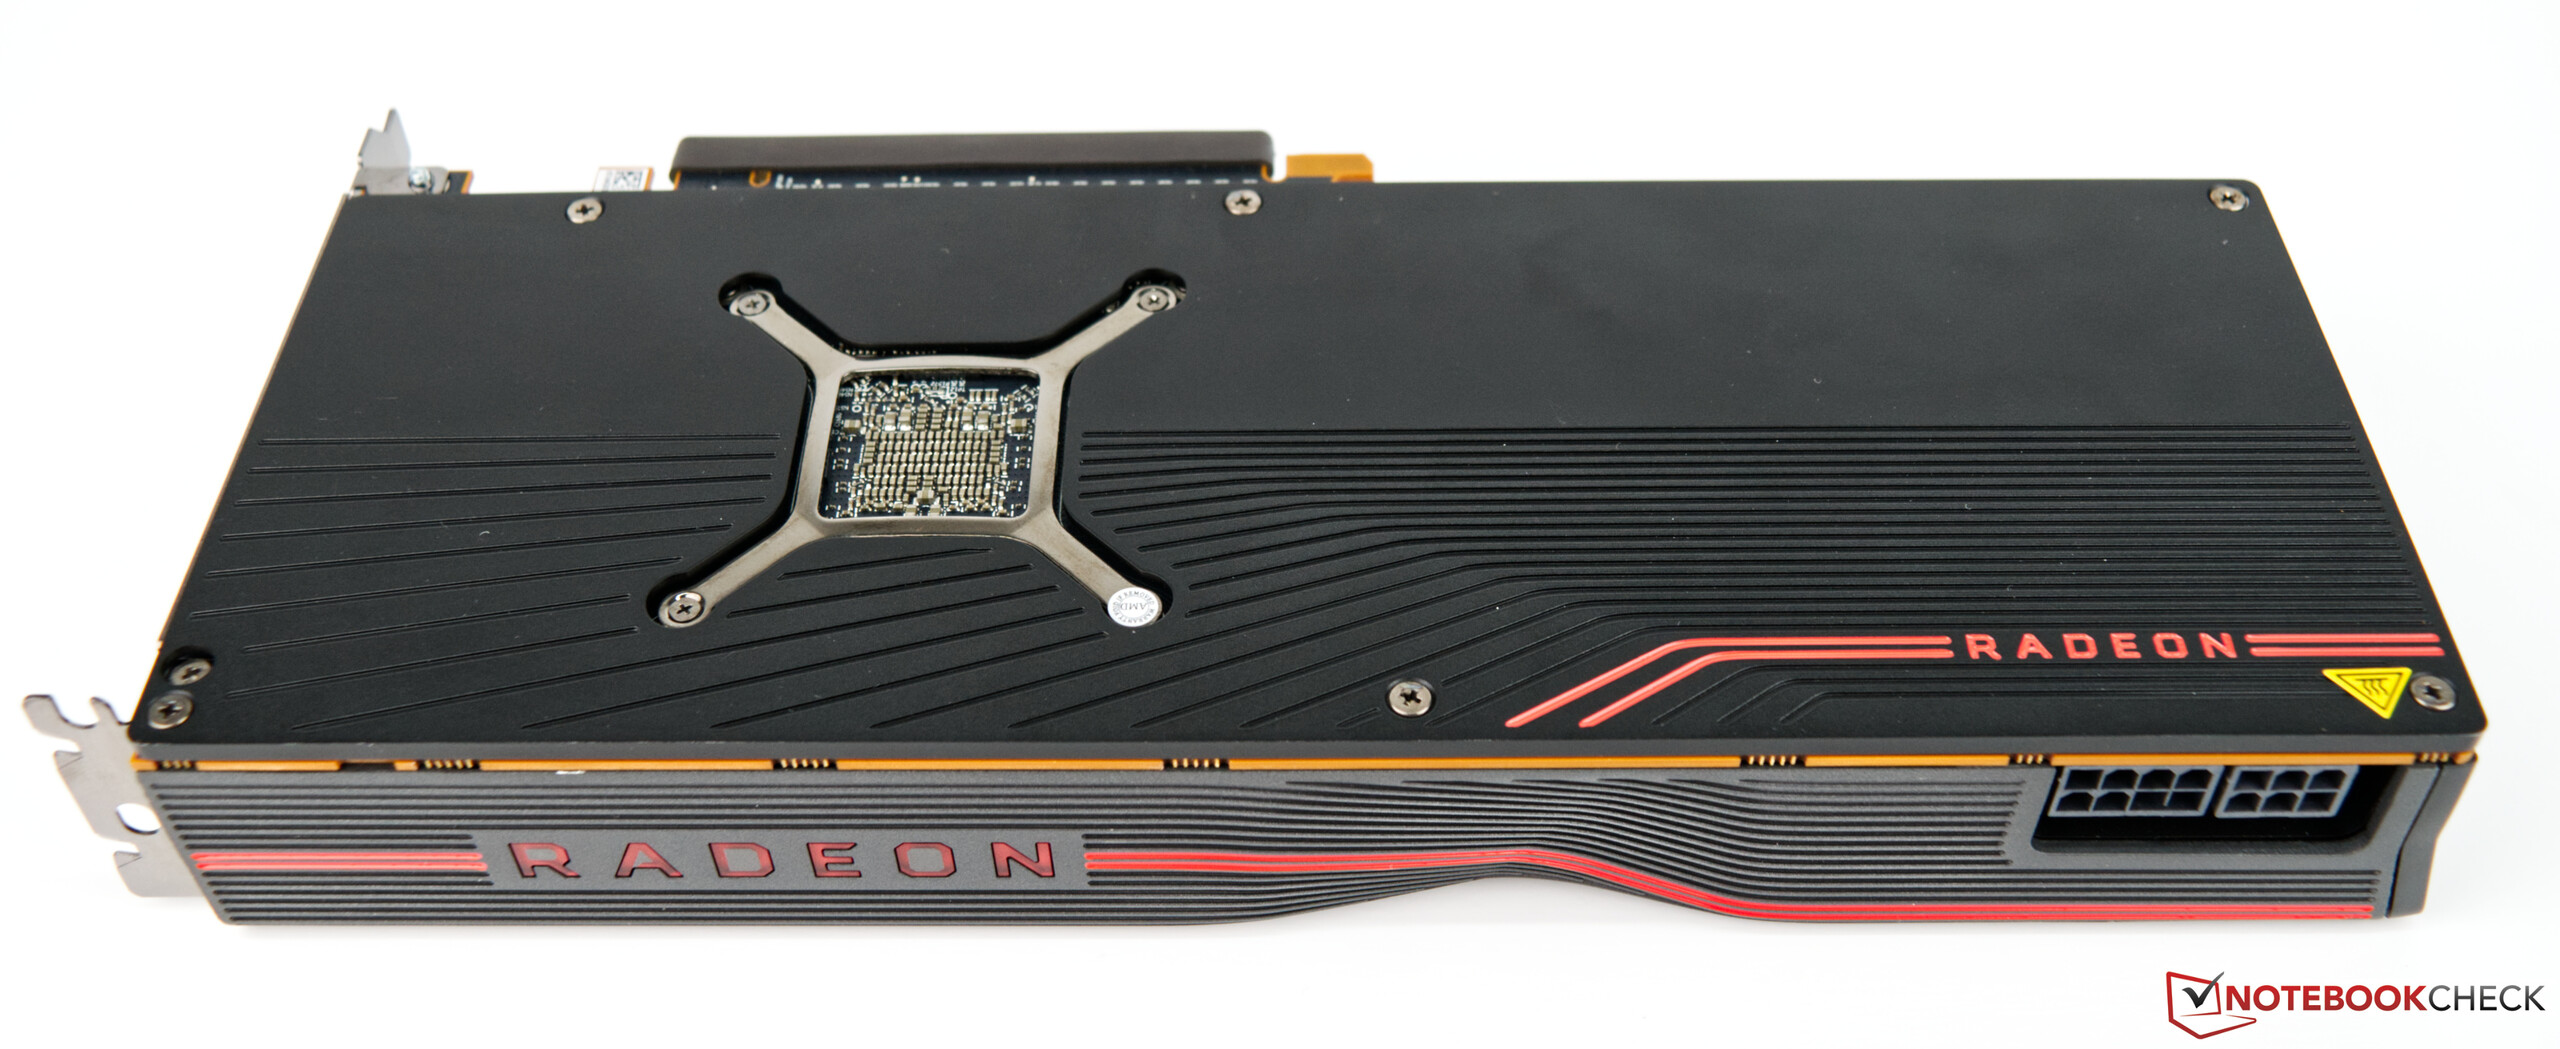
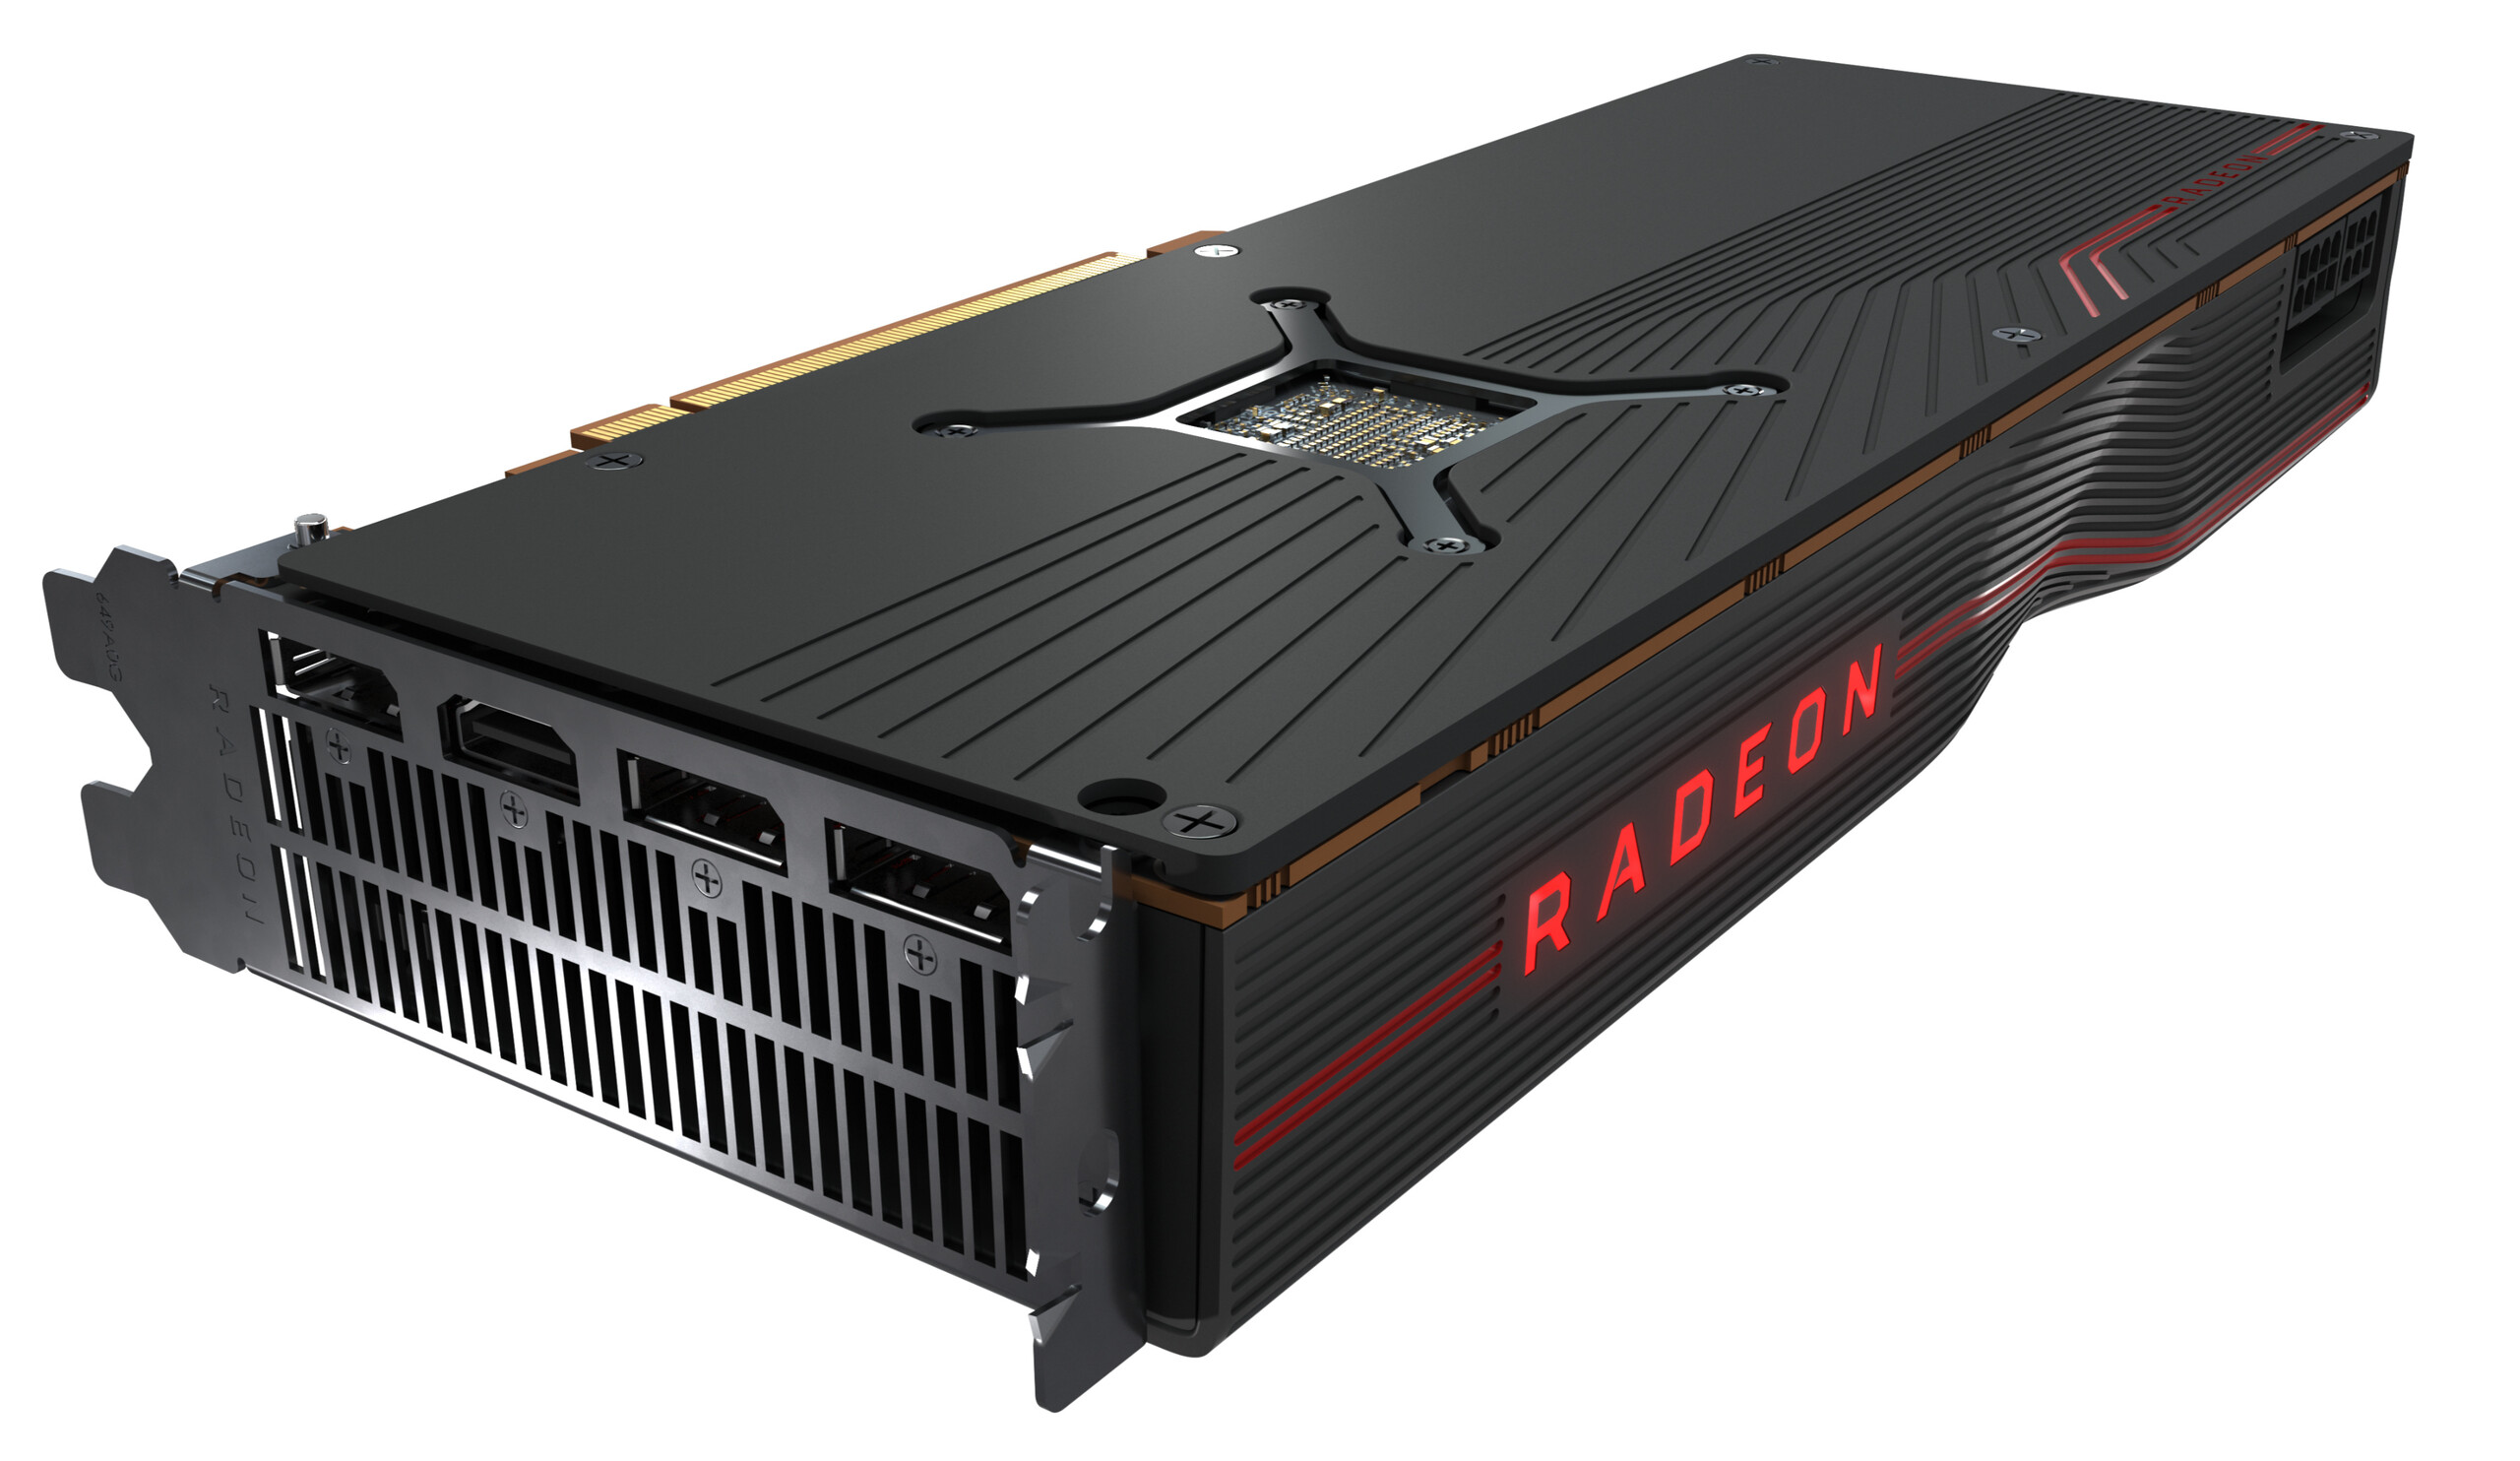
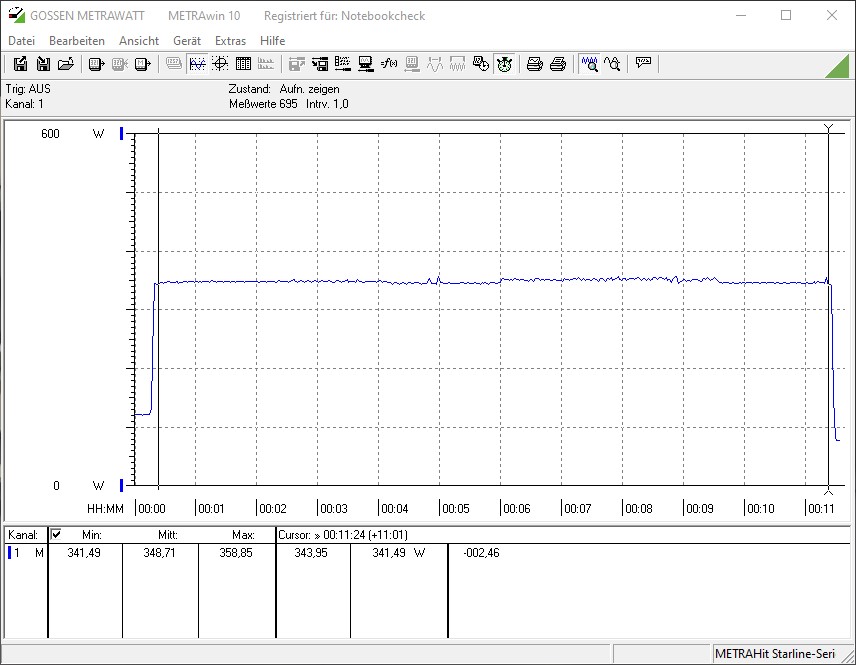
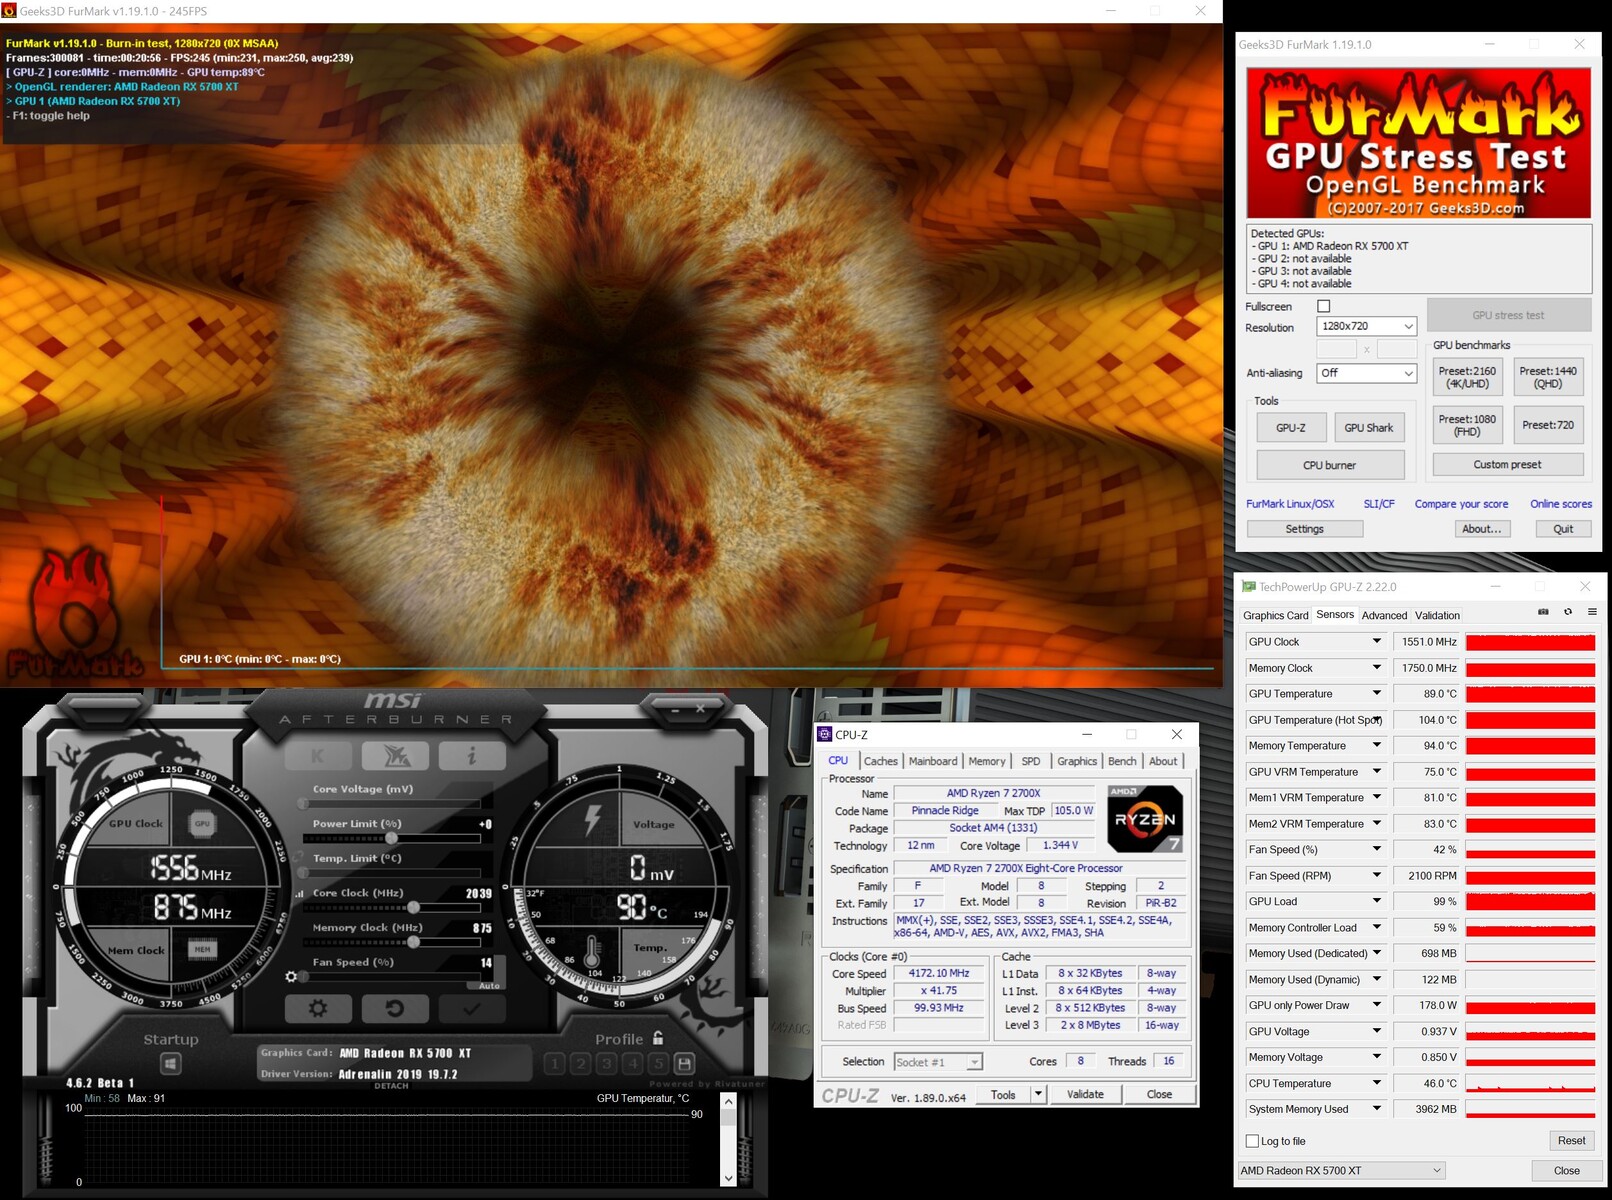
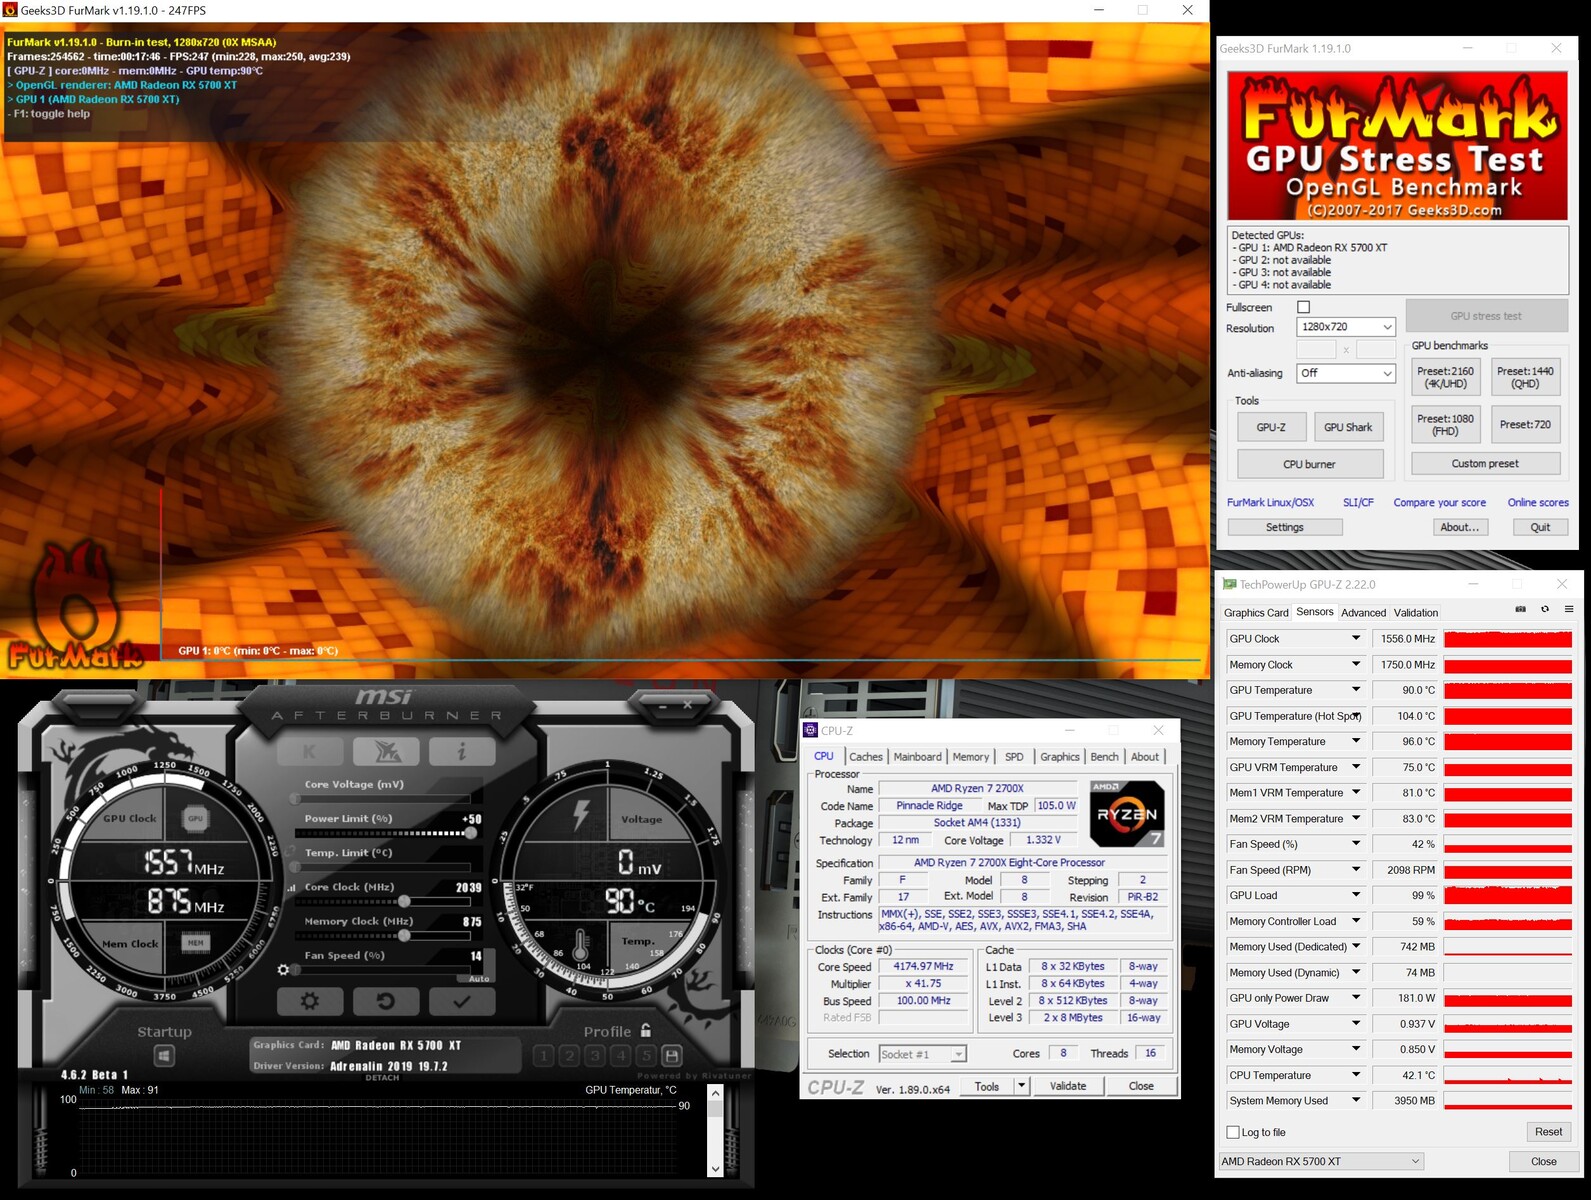
There are no major differences between the two Navi-based GPUs when it comes to the cooler. However, the XT version comes with a backplate to help dissipate the heat. Because the Radeon RX 5700 XT has a much higher TDP, it gets significantly hotter than the smaller model. The speed of the radial fan depends heavily on the temperature of the GPU. The temperature of the graphics card is measured at a special spot. During our stress test, the temperature at that spot reached 104 °C (219.2 °F). The VRAM temperature amounted to 75 °C (167 °F), which is not critical. The fans spin at 2100 RPM under full load. Here, the Radeon RX 5700 XT is quite audible, even when the case is closed. However, under load, the RX 5700 XT is somewhat quieter than the Radeon RX Vega 64 and the Radeon VII.
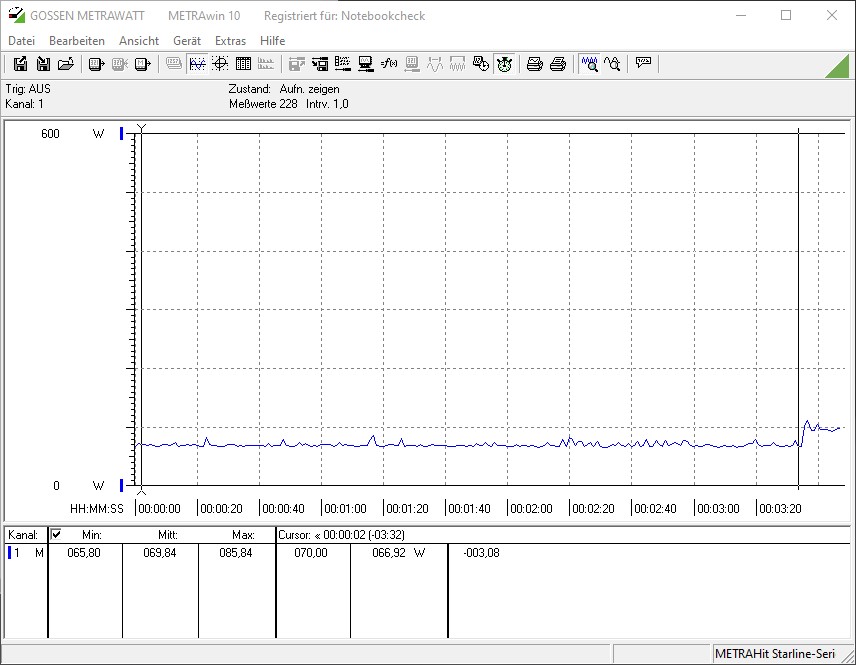
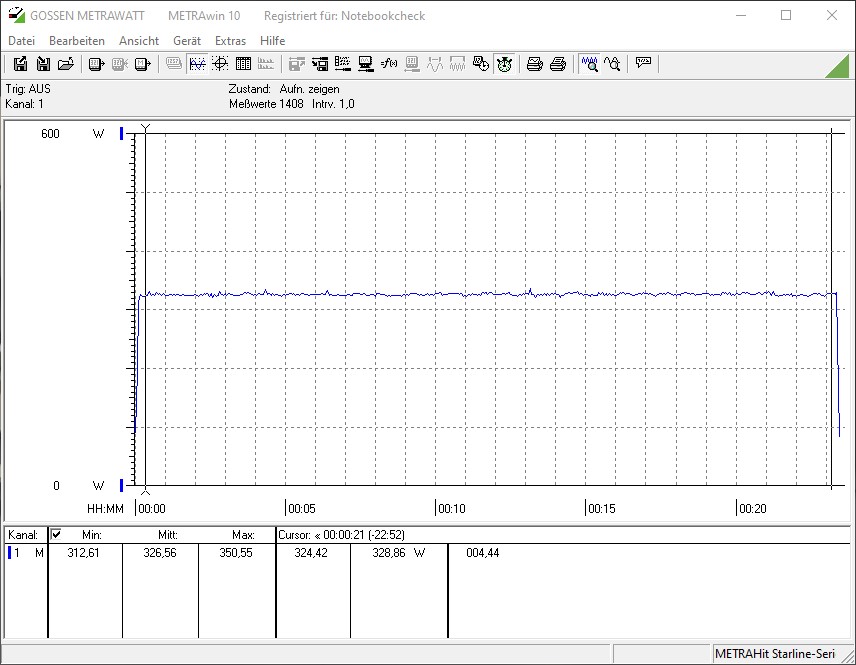
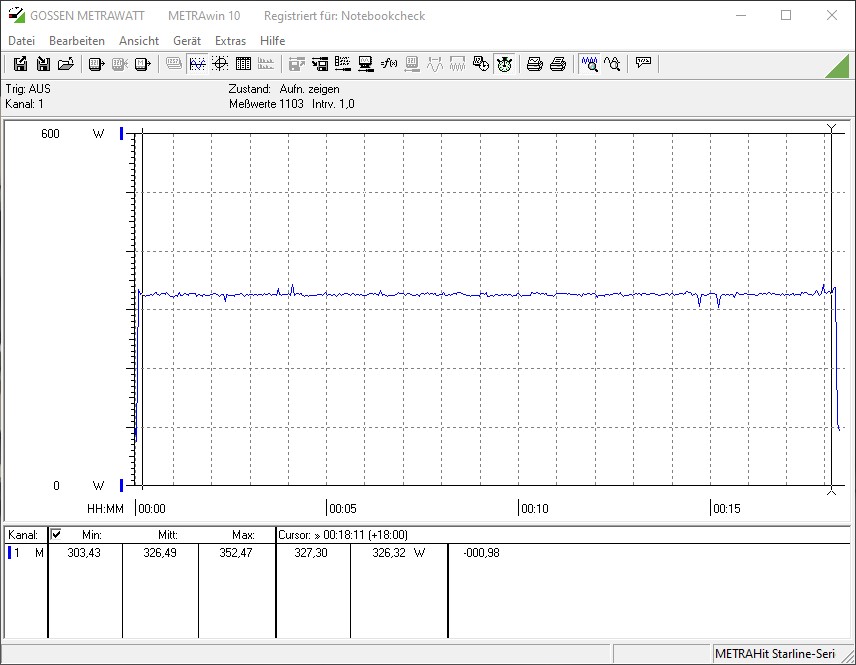
Because the Navi-based GPU overheats at its stock TDP, increasing the power limit is not going to result in any improvements in performance. In fact, the system power consumption amounts to 326 watts with both the stock TDP and the increased TDP. When idle, the system draws 70 watts, which is less than what the system with the RTX 2070S consumes at idle. When gaming, the system power consumption averages 348 watts, which is 4 watts higher than the power draw of the system with the slightly more powerful RTX 2070S. In a duel between the RX 5700 and the RX 5700 XT, the RX 5700 is a clear winner, because it draws 50 watts less and still provides enough horsepower for most people.
Note:
All gaming benchmarks were carried out with the case closed to simulate most common real-world operating conditions.
| Power Consumption | |
| 1920x1080 The Witcher 3 ultra (external Monitor) | |
| Nvidia Titan RTX | |
| AMD Radeon RX Vega 64 (Idle: 74.3 W) | |
| MSI RTX 2080 Gaming X Trio (Idle: 87.78 W) | |
| AMD Radeon RX 5700 XT (Idle: 69.8 W) | |
| Nvidia GeForce RTX 2070 Super (96.8 fps, Idle: 80.5 W) | |
| MSI RTX 2070 Gaming Z 8G (Idle: 73.3 W) | |
| AMD Radeon VII (Idle: 81.39 W) | |
| Nvidia GeForce RTX 2060 Super (82.7 fps, Idle: 77.12 W) | |
| AMD Radeon RX 5700 (84.2 fps, Idle: 64.5 W) | |
| MSI RTX 2060 Gaming Z 6G (Idle: 74.66 W) | |
| 1280x720 FurMark 1.19 GPU Stress Test (external Monitor) | |
| AMD Radeon VII (Idle: 81.39 W) | |
| MSI RTX 2080 Gaming X Trio | |
| MSI RTX 2070 Gaming Z 8G (Idle: 73.3 W) | |
| AMD Radeon RX 5700 XT (239 fps, Idle: 69.8 W) | |
| Nvidia GeForce RTX 2070 Super (283 fps, Idle: 80.5 W) | |
| MSI RTX 2060 Gaming Z 6G (Idle: 74.66 W) | |
| Nvidia GeForce RTX 2060 Super (237 fps, Idle: 77.12 W) | |
| AMD Radeon RX 5700 (207 fps, Idle: 64.5 W) | |
* ... smaller is better
Overclocking - Not advisable with the reference card
It is entirely possible to squeeze more performance out of the AMD Radeon RX 5700 XT. However, it is not something users should try to do with the reference cooling solution. The RX 5700 XT reaches its thermal limits in stock operation. Our frame rate log of the play session with The Witcher 3 can serve as proof of that.
Nevertheless, we still made an attempt to overlock the reference model of the RX 5700 XT. We managed to increase the core clock by 100 MHz. However, we were only able to increase the VRAM speed by 25 MHz. The results of the benchmarks were a bit higher, but this was not due to manual overclocking. The increased power limit alone led to an improvement in performance, because it allowed the GPU to achieve higher boost clocks as long as it did not completely overheat. Those who have a custom water cooler will be able to unlock the full potential of the RX 5700 XT.
Those who are brave enough can try using soft power play table modifications to get more performance out of the Navi-based video card. However, here we have to warn our readers that using such modifications will void your warranty. Because our RX 5700 XT was lent to us for this review by AMD, we decided not to tinker around with various modifications. Additionally, the use of power play table modifications does not make any sense with AMD’s stock cooling solution.

Pros
Cons
Verdict - AMD is competitive again with Navi
The AMD Radeon RX 5700 XT can give Turing-based GPUs a run for their money. The RX 5700 XT has a very similar MSRP to the RTX 2060S Founders Edition. However, the Navi-based graphics card outperforms the RTX 2070 FE. Here, AMD has done a good job and is able to compete with Nvidia once again, thanks to its new RDNA architecture. This is good news for us and for customers, because competition exerts downward pressure on prices. However, it is still not entirely clear in which direction the GPU prices are going to go in the following days and weeks. Moreover, the customized models of the Navi-based GPUs are coming. These graphics cards should be able to definitively beat the RTX 2070S FE.
Unfortunately, the stock cooler keeps the RX 5700 XT from reaching its full potential. It barely manages to keep the video card from overheating without being deafeningly loud, which was the case with the Vega 64. Having said that, the RX 5700 XT is not a quiet GPU by any means. Those who are really sensitive to fan noise should avoid this graphics card, because even with the case closed the fan is still very audible.
The biggest drawback of the Radeon RX 5700 XT is the cooling solution. All in all, the Navi 10-based GPU offers a very good level of performance, which is good enough for 1440p gaming.
Those who are very price-conscious should take a look at the AMD Radeon RX 5700. It offers a similar level of performance but does not suffer from the same thermal issues, because it has a lower TDP.
In the battle for the best upper mid-range GPU, the RX 5700 XT gives as good as it gets. With the GeForce RTX 2070S FE, Nvidia offers a better overall package with a better cooling system. However, the MSRP of 529 Euros ($589) is not something most buyers will be able to overlook.
Thanks to the new architecture, smaller manufacturing process and fast GDDR6 VRAM, AMD has managed to bring a viable GPU to the market. Now it is up to the board-partners to iron out the kinks in the new product.
Benchmarks
3DM Vant. Perf. total +
specvp12 sw-03 +
Cinebench R15 OpenGL 64 Bit +
GFXBench T-Rex HD Offscreen C24Z16 +
* Smaller numbers mean a higher performance
Game Benchmarks
The following benchmarks stem from our benchmarks of review laptops. The performance depends on the used graphics memory, clock rate, processor, system settings, drivers, and operating systems. So the results don't have to be representative for all laptops with this GPU. For detailed information on the benchmark results, click on the fps number.

F1 24
2024

Ghost of Tsushima
2024

Alone in the Dark
2024
Dragon's Dogma 2
2024
Last Epoch
2024
Skull & Bones
2024
Helldivers 2
2024
Enshrouded
2024
Palworld
2024

Ready or Not
2023
The Finals
2023


EA Sports WRC
2023
Alan Wake 2
2023
Lords of the Fallen
2023
Total War Pharaoh
2023

EA Sports FC 24
2023
Counter-Strike 2
2023
Cyberpunk 2077
2023
Baldur's Gate 3
2023
Lies of P
2023
Starfield
2023
Armored Core 6
2023
Immortals of Aveum
2023
Atlas Fallen
2023

F1 23
2023
Diablo 4
2023

Dead Island 2
2023
The Last of Us
2023

Company of Heroes 3
2023
Sons of the Forest
2023
Atomic Heart
2023
Returnal
2023
Hogwarts Legacy
2023
Dead Space Remake
2023
The Witcher 3 v4
2023
High On Life
2023


FIFA 23
2022
The Quarry
2022
F1 22
2022
Vampire Bloodhunt
2022
Ghostwire Tokyo
2022

Cyberpunk 2077 1.6
2022
Elex 2
2022
GRID Legends
2022
Elden Ring
2022
Dying Light 2
2022

God of War
2022
Halo Infinite
2021
Farming Simulator 22
2021
Battlefield 2042
2021
Forza Horizon 5
2021

Riders Republic
2021

Back 4 Blood
2021
Far Cry 6
2021
Alan Wake Remastered
2021
New World
2021
Deathloop
2021
F1 2021
2021

Days Gone
2021


Outriders
2021
Hitman 3
2021
Cyberpunk 2077 1.0
2020

Yakuza Like a Dragon
2020


Dirt 5
2020
Watch Dogs Legion
2020
FIFA 21
2020
Star Wars Squadrons
2020

Serious Sam 4
2020
Crysis Remastered
2020

Horizon Zero Dawn
2020
Death Stranding
2020
F1 2020
2020
Valorant
2020
Gears Tactics
2020
Doom Eternal
2020
Hunt Showdown
2020
Escape from Tarkov
2020


Need for Speed Heat
2019

GRID 2019
2019

FIFA 20
2019
Borderlands 3
2019
Control
2019
F1 2019
2019

Rage 2
2019
Anno 1800
2019
The Division 2
2019
Dirt Rally 2.0
2019
Anthem
2019
Far Cry New Dawn
2019
Metro Exodus
2019
Apex Legends
2019
Just Cause 4
2018
Darksiders III
2018
Battlefield V
2018
Farming Simulator 19
2018
Hitman 2
2018


Forza Horizon 4
2018
FIFA 19
2018

Strange Brigade
2018
Monster Hunter World
2018
The Crew 2
2018
Far Cry 5
2018
X-Plane 11.11
2018


Fortnite
2018

Destiny 2
2017
Rocket League
2017For Honor
2017
Overwatch
2016
The Division
2016
Far Cry Primal
2016

Rainbow Six Siege
2015Dota 2 Reborn
2015
The Witcher 3
2015
GTA V
2015| low | med. | high | ultra | QHD | 4K | |
|---|---|---|---|---|---|---|
| F1 24 | 235 | 205 | 145.4 | |||
| Senua's Saga Hellblade 2 | 54.1 | 46 | 24.2 | 15.9 | 7.9 | |
| Ghost of Tsushima | 104.5 | 85.1 | 76.8 | 61.9 | 37.8 | 27.9 |
| Horizon Forbidden West | 105.2 | 94.8 | 62.5 | 62.4 | 47.4 | 27.4 |
| Alone in the Dark | 221 | 183.8 | 154.8 | 80.3 | 43.8 | |
| Dragon's Dogma 2 | 76.6 | 70.8 | 53.9 | 30.4 | ||
| Last Epoch | 268 | 212 | 173.2 | 117.6 | 74.8 | 35.1 |
| Skull & Bones | 107 | 96 | 77 | 67 | 50 | 29 |
| Helldivers 2 | 108.5 | 85.1 | 75.1 | 73.9 | 51.3 | 25.2 |
| Enshrouded | 69.7 | 59.7 | 50 | 42.6 | 31.8 | 17.4 |
| Palworld | 125.7 | 100.7 | 73 | 68.2 | 47.1 | 25.9 |
| Prince of Persia The Lost Crown | 358 | 359 | 359 | 350 | 173.3 | |
| Ready or Not | 176.4 | 162 | 150.3 | 102.5 | 61.8 | 28.1 |
| The Finals | 212 | 158.2 | 136.9 | 98.9 | 62.2 | 30.1 |
| Avatar Frontiers of Pandora | 78 | 71 | 60 | 47 | 36 | 31 |
| Call of Duty Modern Warfare 3 2023 | 128 | 115 | 87 | 83 | 59 | 34 |
| EA Sports WRC | 138 | 89.4 | 80.1 | 72.6 | 52.7 | 30.1 |
| Alan Wake 2 | 43.1 | 39.2 | 35.8 | 24.4 | 13.6 | |
| Lords of the Fallen | 77 | 63.6 | 43.4 | 30.7 | 20.4 | 10.2 |
| Total War Pharaoh | 336.7 | 238.7 | 126.8 | 104.1 | 66.1 | 31.7 |
| Assassin's Creed Mirage | 100 | 89 | 83 | 67 | 53 | 31 |
| EA Sports FC 24 | 285 | 250 | 195.7 | 173 | 139.7 | 88.1 |
| Counter-Strike 2 | 347 | 308 | 205 | 149.3 | 105.2 | 55 |
| Cyberpunk 2077 | 93 | 75.6 | 63.8 | 56.7 | 36.2 | 15.6 |
| Baldur's Gate 3 | 113.9 | 92.5 | 77.7 | 75.9 | 52.9 | 28 |
| Lies of P | 158.3 | 138.3 | 119.7 | 104.6 | 69.5 | 35.6 |
| Starfield | 66.4 | 57.4 | 47.8 | 43.2 | 33.9 | 20.8 |
| Armored Core 6 | 119.6 | 108.4 | 82 | 64.7 | 38.8 | |
| Immortals of Aveum | 64.9 | 54.5 | 42.1 | 15.9 | 29 | |
| Atlas Fallen | 131.9 | 124.7 | 115.1 | 92.9 | 65.1 | 35.8 |
| Ratchet & Clank Rift Apart | 81.8 | 67.5 | 53.8 | 46.6 | 38.6 | 23.8 |
| F1 23 | 279 | 245 | 171.5 | 119.2 | 89.4 | 51.6 |
| Diablo 4 | 206 | 176.6 | 157.6 | 133.7 | 90.7 | 48.1 |
| Star Wars Jedi Survivor | 76 | 65.7 | 60.8 | 57.3 | 36.5 | 18.7 |
| Dead Island 2 | 225 | 189.2 | 137.5 | 104.7 | 70.5 | 35.8 |
| The Last of Us | 97.1 | 78 | 70.2 | 57 | 35 | 16.5 |
| Resident Evil 4 Remake | 144.5 | 106.2 | 93.2 | 81 | 57.9 | 32.3 |
| Company of Heroes 3 | 169.3 | 142.1 | 112.6 | 111.1 | 81.5 | 48.4 |
| Sons of the Forest | 112.4 | 86.9 | 82.3 | 80 | 58.6 | 32.3 |
| Atomic Heart | 174.6 | 133.2 | 78 | 61.7 | 47.2 | 27.7 |
| Returnal | 71 | 69 | 65 | 56 | 44 | 26 |
| Hogwarts Legacy | 121.9 | 99.2 | 77.1 | 58.5 | 42.2 | 23.9 |
| Dead Space Remake | 86.1 | 81.8 | 69.1 | 69 | 46.3 | 22.4 |
| The Witcher 3 v4 | 190.1 | 149.7 | 125.8 | 105.1 | 74.2 | 40.9 |
| High On Life | 256 | 155.8 | 127.1 | 98 | 59.1 | 26.7 |
| The Callisto Protocol | 149 | 103 | 67 | 66 | 48 | 27 |
| Need for Speed Unbound | 130.5 | 124.6 | 99.3 | 82 | 62.3 | 36.3 |
| Spider-Man Miles Morales | 125.1 | 107 | 101.7 | 93.2 | 68 | 36.3 |
| Call of Duty Modern Warfare 2 2022 | 150 | 135 | 97 | 92 | 64 | 37 |
| Uncharted Legacy of Thieves Collection | 86.3 | 82.2 | 79 | 74.5 | 55.4 | 27.8 |
| A Plague Tale Requiem | 106.7 | 82 | 59.9 | 44.6 | 33.5 | 18.9 |
| FIFA 23 | 303 | 275 | 179 | 178.2 | 139.3 | 85.9 |
| The Quarry | 136 | 107 | 86 | 64 | 42 | 20 |
| F1 22 | 265 | 235 | 177 | 117 | 89 | 54 |
| Vampire Bloodhunt | 339 | 178.2 | 167.7 | 163.4 | 106.8 | 47.6 |
| Ghostwire Tokyo | 147 | 140 | 138 | 137 | 85 | 39 |
| Tiny Tina's Wonderlands | 214 | 167 | 108 | 83 | 58 | 30 |
| Cyberpunk 2077 1.6 | 78 | 77.6 | 74.8 | 67 | 40.2 | 17 |
| Elex 2 | 78 | 79 | 72.7 | 67.7 | 52.1 | 29.9 |
| GRID Legends | 254 | 205 | 165 | 133 | 107 | 65 |
| Elden Ring | 60 | 60 | 60 | 59.8 | 58.3 | 37.8 |
| Dying Light 2 | 196 | 81.7 | 68.5 | 47 | 24.7 | |
| Rainbow Six Extraction | 199 | 170 | 164 | 136 | 88 | 39 |
| God of War | 131 | 111 | 91 | 59 | 55 | 32 |
| Halo Infinite | 87.8 | 71.3 | 67.5 | 67.1 | 36.7 | |
| Farming Simulator 22 | 291 | 213 | 159 | 135 | 105 | 68.5 |
| Battlefield 2042 | 162 | 128 | 108 | 91.7 | 70.6 | 42.7 |
| Forza Horizon 5 | 292 | 157 | 138 | 68 | 57 | 40 |
| Call of Duty Vanguard | 95.1 | 126 | 110 | 101 | 71.7 | 37.3 |
| Riders Republic | 134 | 130 | 113 | 104 | 74 | 39 |
| Guardians of the Galaxy | 149 | 114 | 112 | 106 | 79 | 45 |
| Back 4 Blood | 218 | 185 | 170 | 114 | 59.5 | |
| Far Cry 6 | 204 | 144 | 126 | 108 | 75 | 30 |
| Alan Wake Remastered | 94.4 | 90.4 | 88.9 | 83.8 | ||
| New World | 143 | 103 | 96.6 | 85.5 | 58.5 | |
| Deathloop | 131 | 119 | 98.6 | 71.9 | 49.8 | 25.8 |
| F1 2021 | 629 | 346 | 272 | 177 | 133 | 77 |
| Monster Hunter Stories 2 | 144 | 143 | 139 | 141 | 115 | |
| Days Gone | 170 | 147 | 128 | 91.4 | 65.1 | 35.3 |
| Mass Effect Legendary Edition | 109 | 105 | 104 | 78.7 | ||
| Resident Evil Village | 320 | 189 | 186 | 159 | 102 | 51.7 |
| Outriders | 191 | 153 | 125 | 110 | 73.1 | 37.2 |
| Hitman 3 | 299 | 172 | 153 | 141 | 95 | 53 |
| Cyberpunk 2077 1.0 | 141 | 85.8 | 69 | 58.9 | 36.9 | 16.5 |
| Immortals Fenyx Rising | 112 | 102 | 97 | 92 | 73 | 45 |
| Yakuza Like a Dragon | 87.5 | 84.3 | 86.2 | 82.6 | 59.1 | 32.4 |
| Call of Duty Black Ops Cold War | 193 | 139 | 106 | 81.3 | 59.6 | 33.3 |
| Assassin´s Creed Valhalla | 157 | 110 | 91 | 78 | 59 | 33 |
| Dirt 5 | 175 | 111 | 92.4 | 84.9 | 65.6 | 43 |
| Watch Dogs Legion | 142 | 121 | 106 | 66.8 | 46.4 | 12.7 |
| FIFA 21 | 258 | 259 | 248 | 249 | 241 | 200 |
| Star Wars Squadrons | 470.6 | 370.6 | 315.6 | 296.8 | 188.7 | 99.6 |
| Mafia Definitive Edition | 129.8 | 102.2 | 92.3 | 67.7 | 36.4 | |
| Serious Sam 4 | 153.3 | 106.5 | 98.4 | 83.7 | 70.3 | 47.6 |
| Crysis Remastered | 237 | 154 | 83.9 | 65.6 | 47.7 | 28 |
| Flight Simulator 2020 | 81.7 | 70.3 | 53.1 | 34.4 | 26.2 | 13.6 |
| Horizon Zero Dawn | 169 | 115 | 97 | 74 | 56 | 30 |
| Death Stranding | 203 | 138 | 128 | 125 | 87.9 | 47.6 |
| F1 2020 | 366 | 245 | 197 | 132 | 99 | 59 |
| Valorant | 329.4 | 312.6 | 293.5 | 286.3 | 242.3 | |
| Gears Tactics | 288 | 181 | 123 | 86 | 56 | 29 |
| Doom Eternal | 251 | 190 | 164 | 159 | 119 | 62 |
| Hunt Showdown | 195 | 128 | 112 | 71.4 | 33.6 | |
| Escape from Tarkov | 121 | 121 | 121 | 121 | 101 | 47.7 |
| Red Dead Redemption 2 | 152 | 121 | 81 | 51.5 | 41.8 | 27 |
| Star Wars Jedi Fallen Order | 115 | 115 | 108 | 79 | 40.2 | |
| Need for Speed Heat | 109 | 105 | 97 | 88 | 80 | 44.1 |
| Call of Duty Modern Warfare 2019 | 209 | 146 | 128 | 112 | 79 | 44.6 |
| GRID 2019 | 199 | 144 | 124 | 88 | 78 | 48 |
| Ghost Recon Breakpoint | 134 | 118 | 107 | 80 | 58 | 33 |
| FIFA 20 | 305 | 304 | 282 | 282 | 279 | 211 |
| Borderlands 3 | 187 | 147 | 102 | 77 | 54 | 30 |
| Control | 236 | 125 | 102 | 72 | 41 | |
| F1 2019 | 271 | 231 | 180 | 146 | 109 | 67 |
| Total War: Three Kingdoms | 239.3 | 132.6 | 85.7 | 60.7 | 39.8 | 20.1 |
| Rage 2 | 256 | 133 | 108 | 103 | 68 | 34.7 |
| Anno 1800 | 108 | 93 | 71 | 44 | 38.6 | 25.5 |
| The Division 2 | 158 | 124 | 103 | 79 | 57 | 30 |
| Dirt Rally 2.0 | 247 | 192 | 186 | 120 | 88 | 49.9 |
| Anthem | 101 | 95 | 94 | 88 | 84 | 47.1 |
| Far Cry New Dawn | 144 | 135 | 129 | 107 | 97 | 56 |
| Metro Exodus | 221 | 109 | 84 | 69 | 56 | 34 |
| Apex Legends | 144 | 144 | 144 | 144 | 117 | 65 |
| Just Cause 4 | 124 | 118 | 109 | 106 | 84 | 44.1 |
| Darksiders III | 199 | 139 | 128 | 121 | 82 | 41.7 |
| Battlefield V | 140 | 119 | 110 | 105 | 89 | 59.5 |
| Farming Simulator 19 | 191 | 147 | 125 | 116 | 93 | 53.2 |
| Hitman 2 | 95 | 93 | 84 | 81 | 80 | 52.3 |
| Call of Duty Black Ops 4 | 231 | 199 | 194 | 135 | 126 | 55.7 |
| Assassin´s Creed Odyssey | 82 | 76 | 70 | 62 | 53 | 35 |
| Forza Horizon 4 | 215 | 155 | 154 | 145 | 119 | 79 |
| FIFA 19 | 305 | 298 | 283 | 276 | 273 | 186 |
| Shadow of the Tomb Raider | 214 | 135 | 125 | 111 | 74 | 38 |
| Strange Brigade | 529 | 226 | 184 | 162 | 115 | 69 |
| Monster Hunter World | 127 | 119 | 113 | 91 | 58.7 | 29.6 |
| The Crew 2 | 60 | 60 | 60 | 60 | 60 | 43.2 |
| Far Cry 5 | 159 | 138 | 129 | 118 | 94 | 50 |
| X-Plane 11.11 | 101 | 80 | 64 | 47 | ||
| Kingdom Come: Deliverance | 151 | 125 | 101 | 73 | 59 | 29.6 |
| Final Fantasy XV Benchmark | 200 | 119 | 82 | 65 | 36 | |
| Fortnite | 318 | 223 | 179 | 143 | 93 | 45.4 |
| Assassin´s Creed Origins | 74 | 69 | 68 | 63 | 61 | 39 |
| Destiny 2 | 147 | 148 | 145 | 142 | 106 | 56.5 |
| Playerunknown's Battlegrounds (PUBG) | 201 | 177 | 166 | 139 | 52.5 | |
| Rocket League | 249 | 249 | 242 | 144 | ||
| Ghost Recon Wildlands | 125.6 | 94.6 | 93.3 | 64.8 | 48.4 | |
| For Honor | 324 | 208 | 198.7 | 159 | 63.5 | |
| Overwatch | 300 | 300 | 228 | 154 | ||
| The Division | 285.5 | 163.8 | 126 | 62.3 | ||
| Far Cry Primal | 120 | 108 | 99 | 89 | 59 | |
| Rise of the Tomb Raider | 313 | 131 | 109 | 51 | ||
| Rainbow Six Siege | 320.6 | 258.5 | 246.4 | 115.9 | ||
| Dota 2 Reborn | 187 | 170 | 141 | 138 | 101 | |
| The Witcher 3 | 385 | 301 | 153 | 92 | 52 | |
| GTA V | 181 | 178 | 170 | 98 | 79 | 82 |
| low | med. | high | ultra | QHD | 4K | < 30 fps < 60 fps < 120 fps ≥ 120 fps | 2 38 110 | 4 61 82 | 1 8 80 65 | 18 86 37 | 5 56 70 11 | 40 86 19 7 |
For more games that might be playable and a list of all games and graphics cards visit our Gaming List
