

Apple iMac 27 Mid 2020 Review: The All-in-One gets a matte display
Apple frequently refreshes its all-in-one system with new hardware upgrades. Today we have a closer look at the larger 27-inch unit, which gets new CPUs and GPUs, but it is also the first iMac with an optional matte screen. Apple calls it nano-texture glass and charges more than 600 Euros (~$709) for the option. We obviously want to find out whether this price is justified. We do not test many desktop systems, so we will mainly focus on the performance compared to other desktop and laptop components.
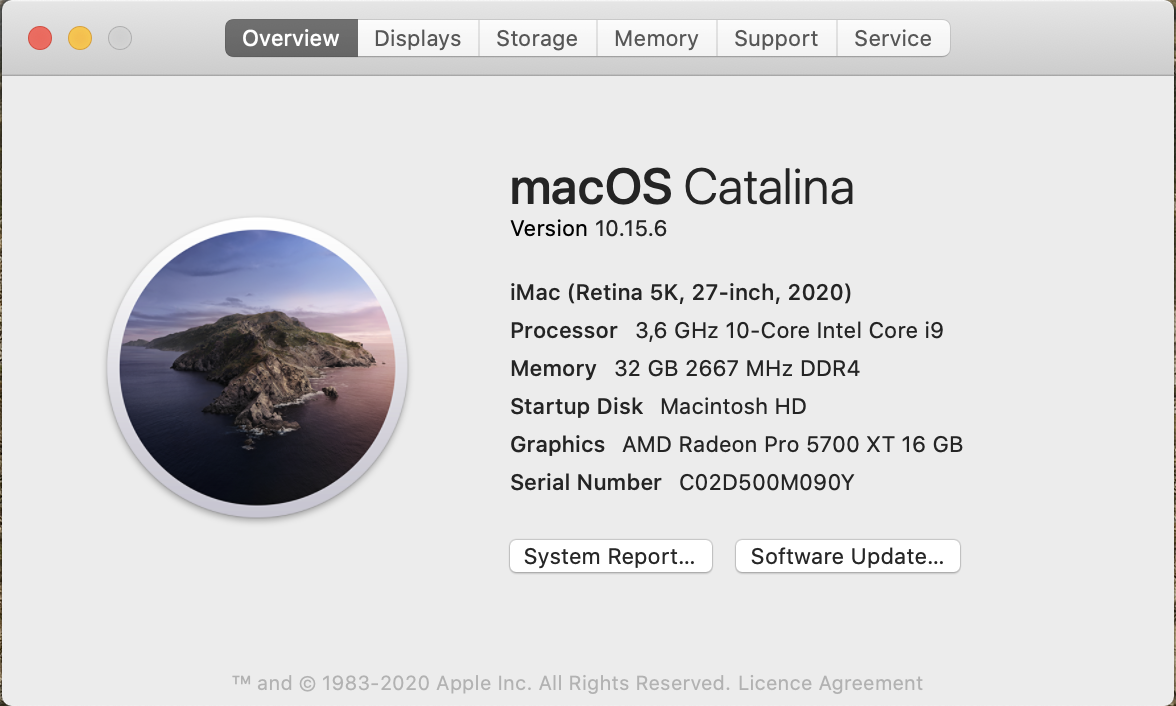
Our test unit ticked pretty much every box in the options list, only the storage and the RAM can be upgraded even further. Our unit with the Core i9 processor, Radeon RX 5700 XT GPU, 32 GB RAM, 1 TB SSD storage, 10 Gb/s Ethernet, and the nano-texture glass retails for 5,500 Euros (~$6,503). The base configuration of the iMac 27 currently starts at around 2,000 Euros (~$2,365).
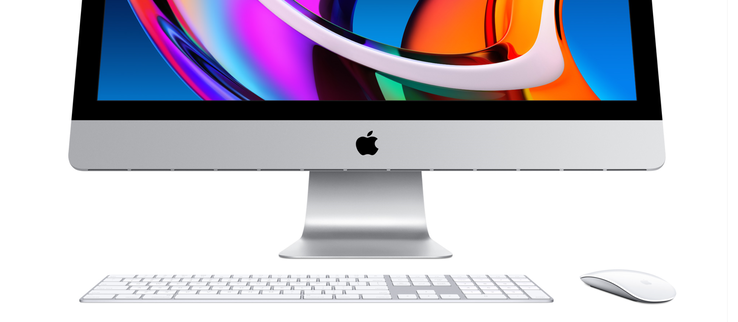
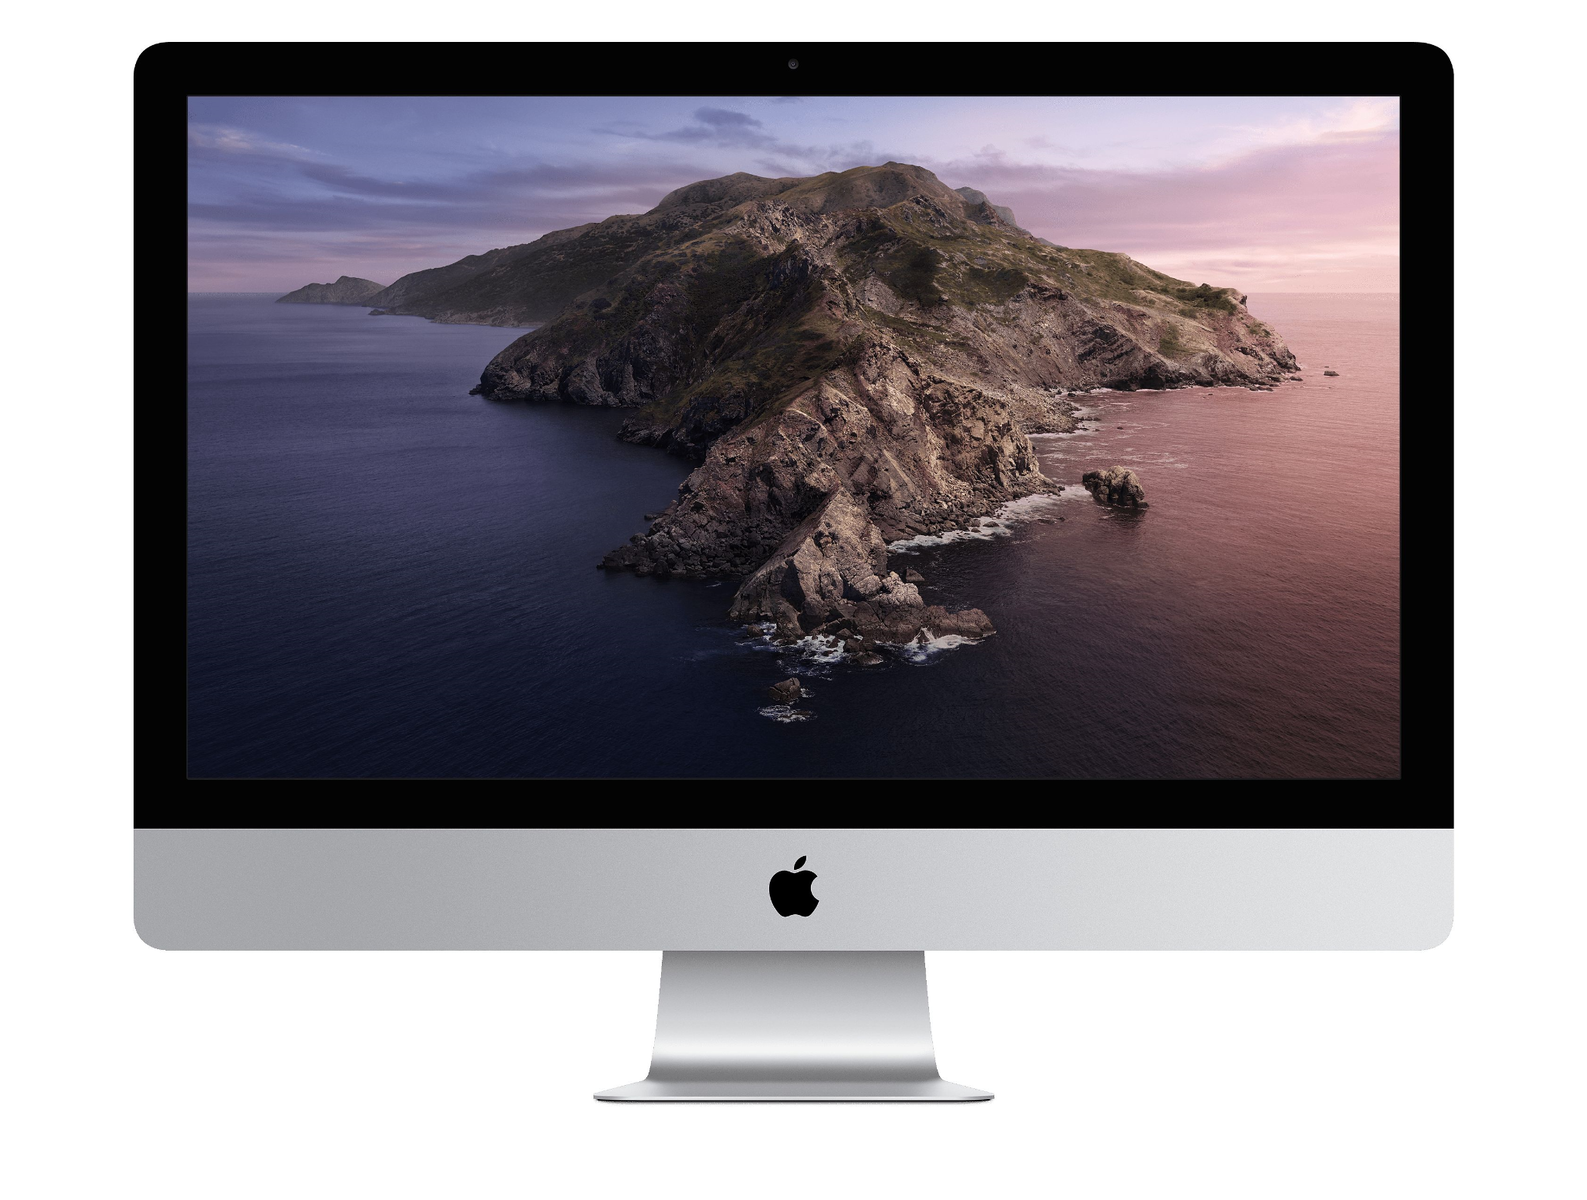
Case & Connectivity: Apple keeps the same design
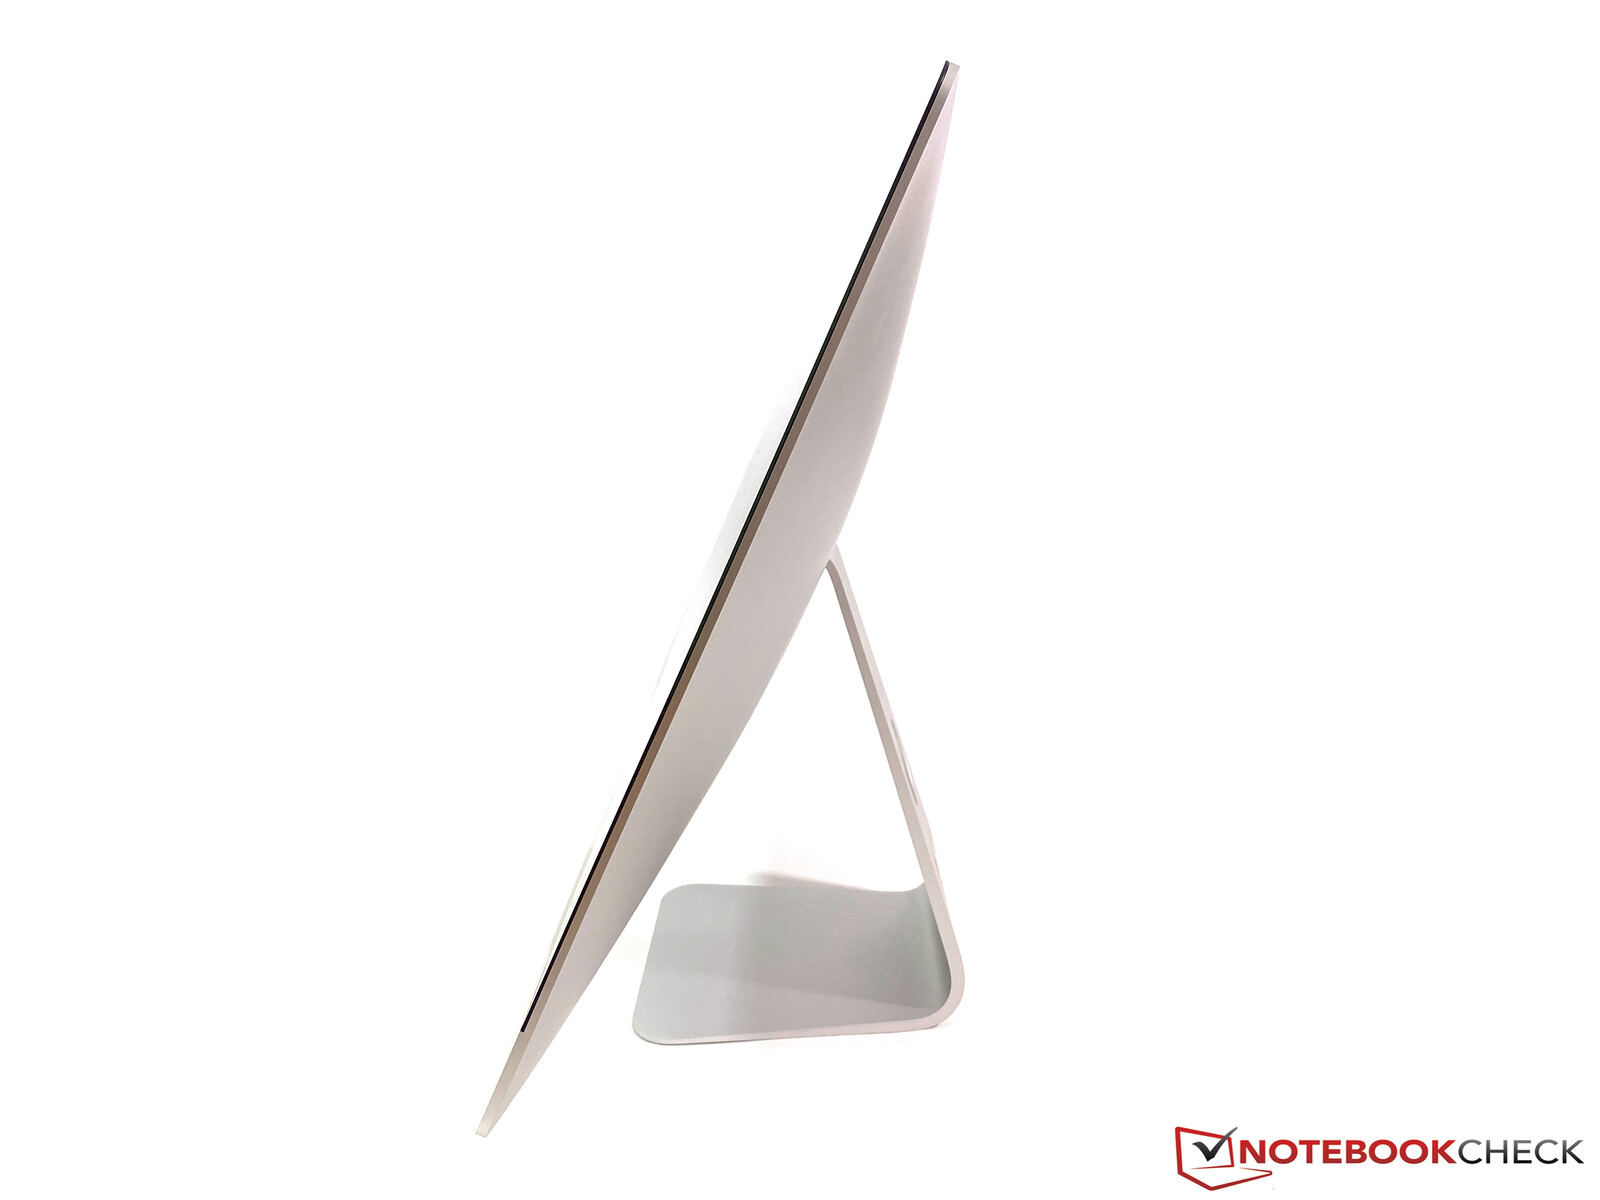
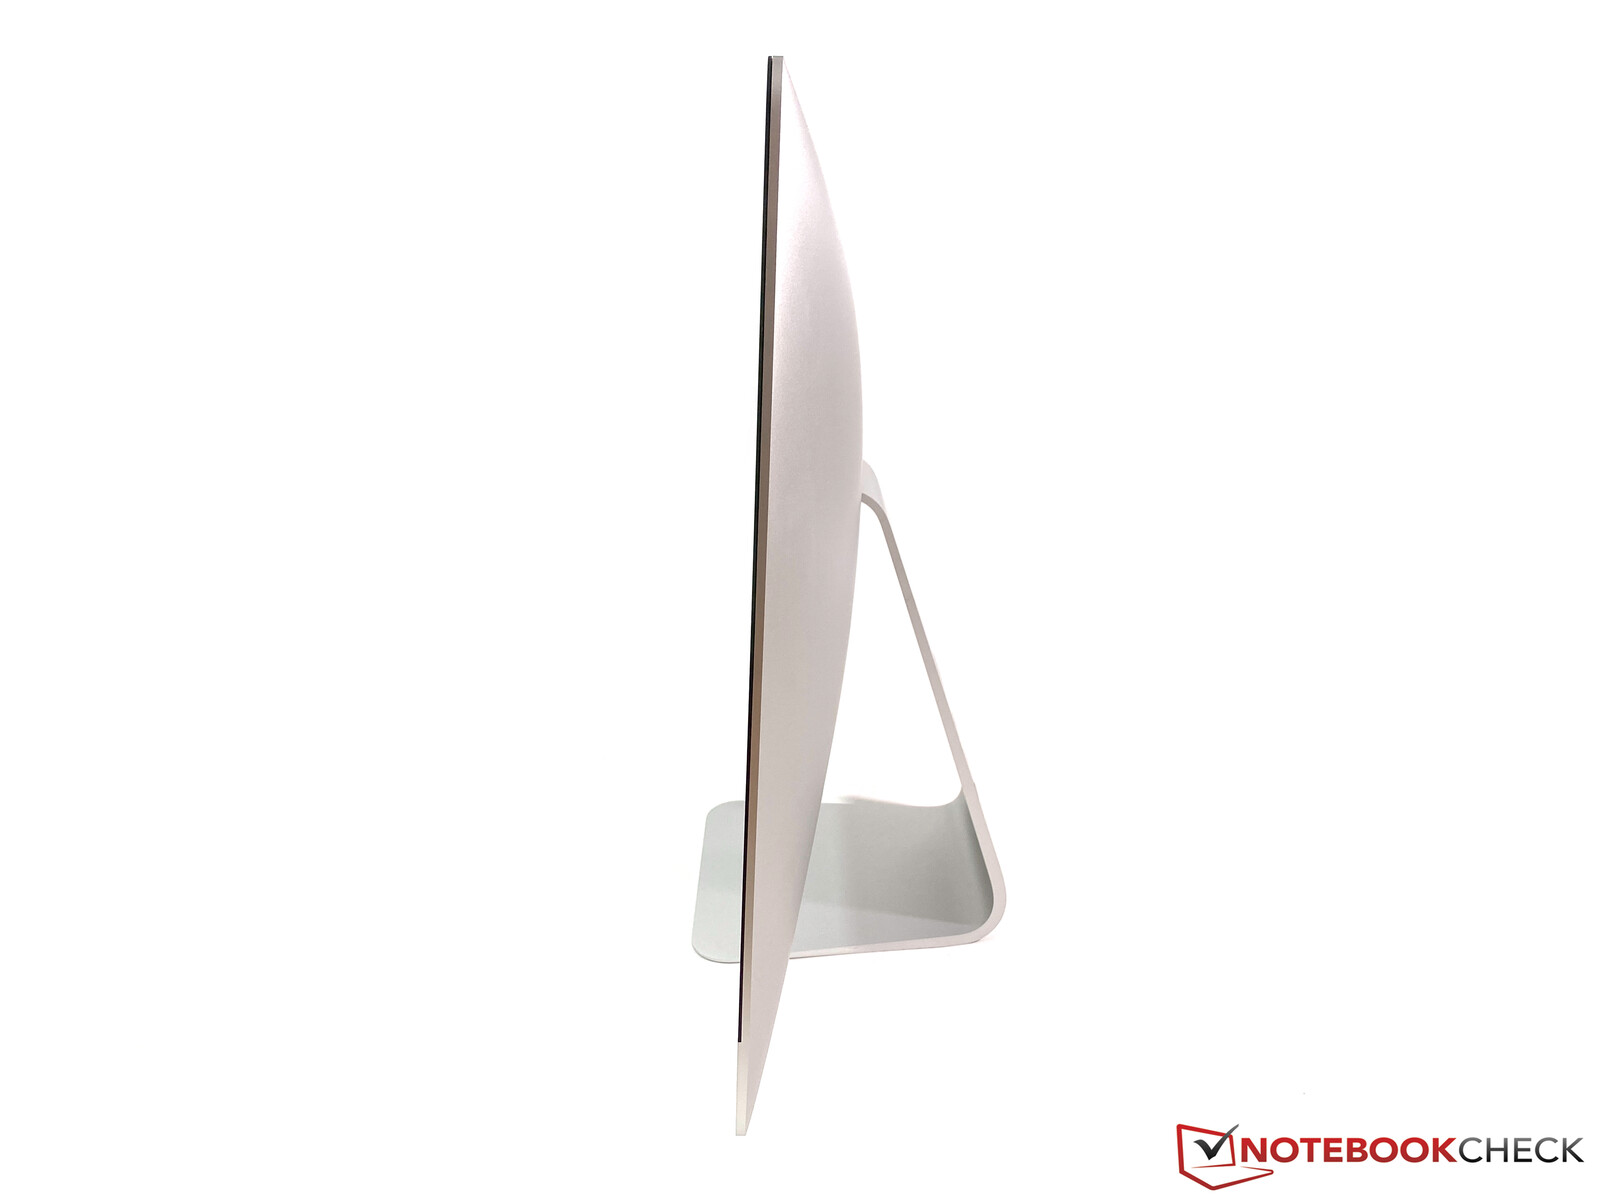
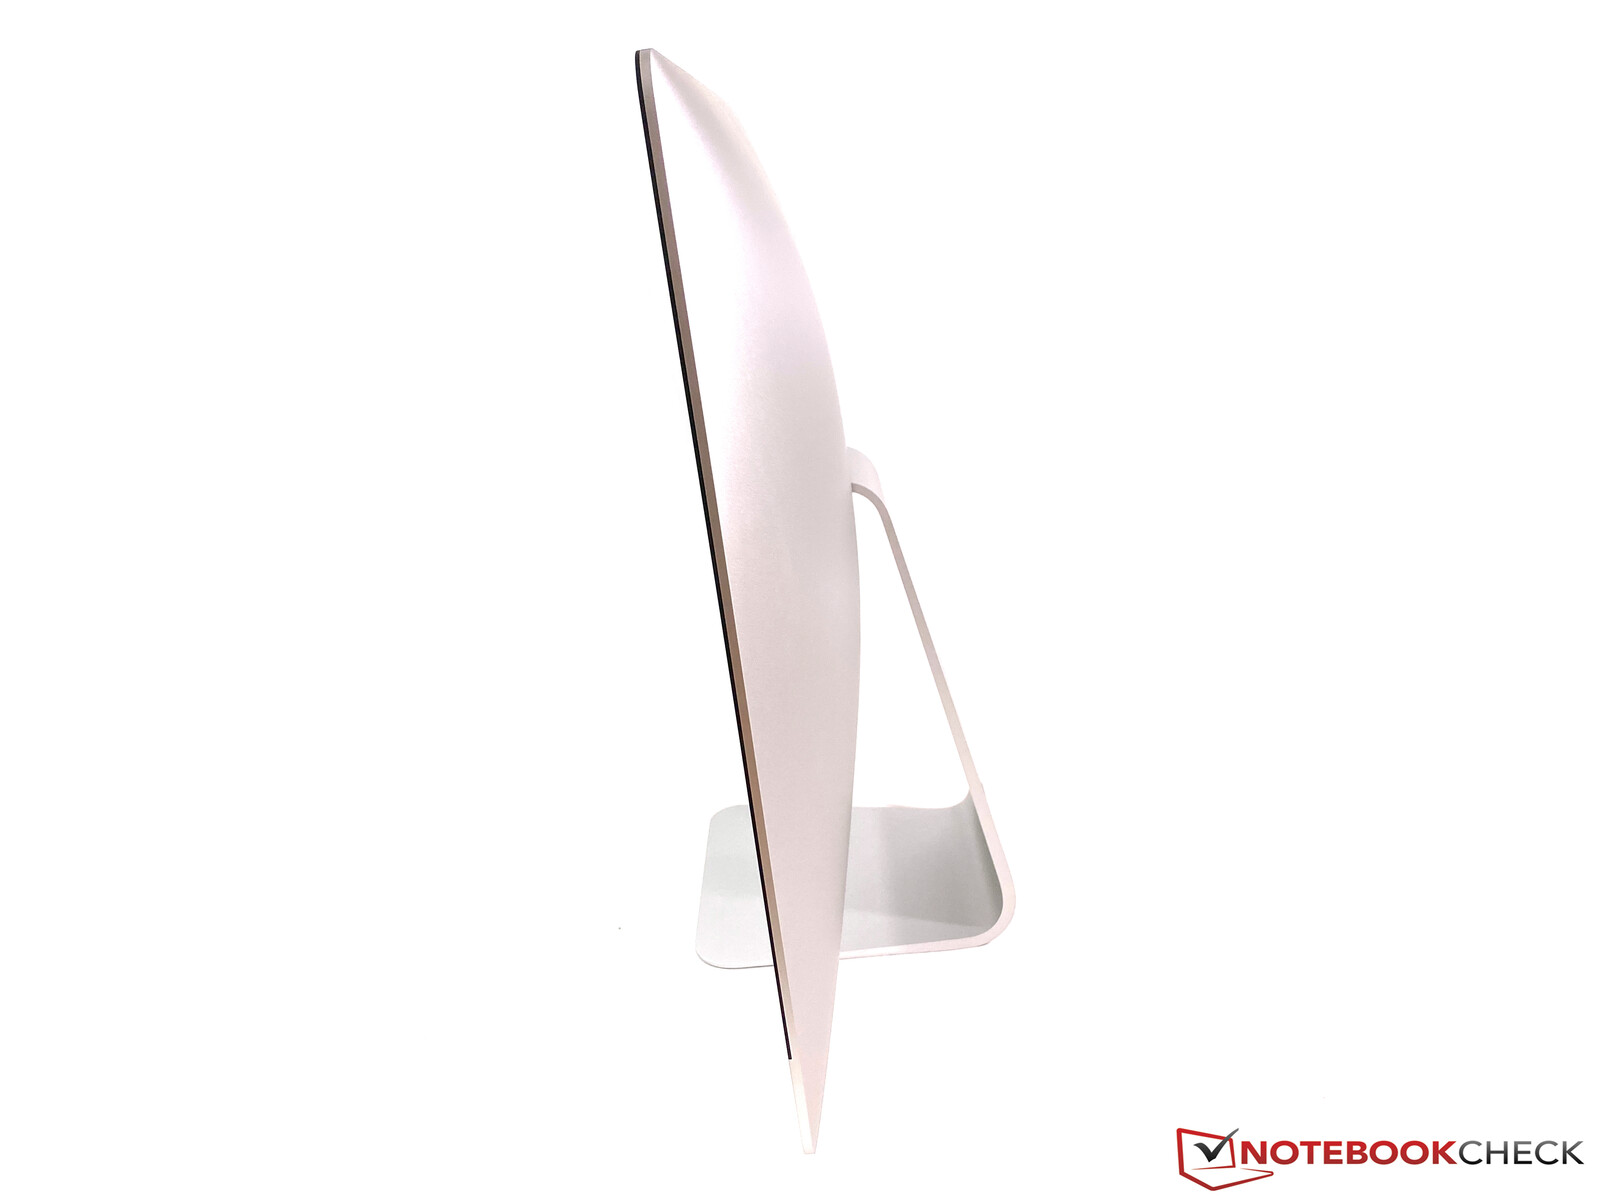
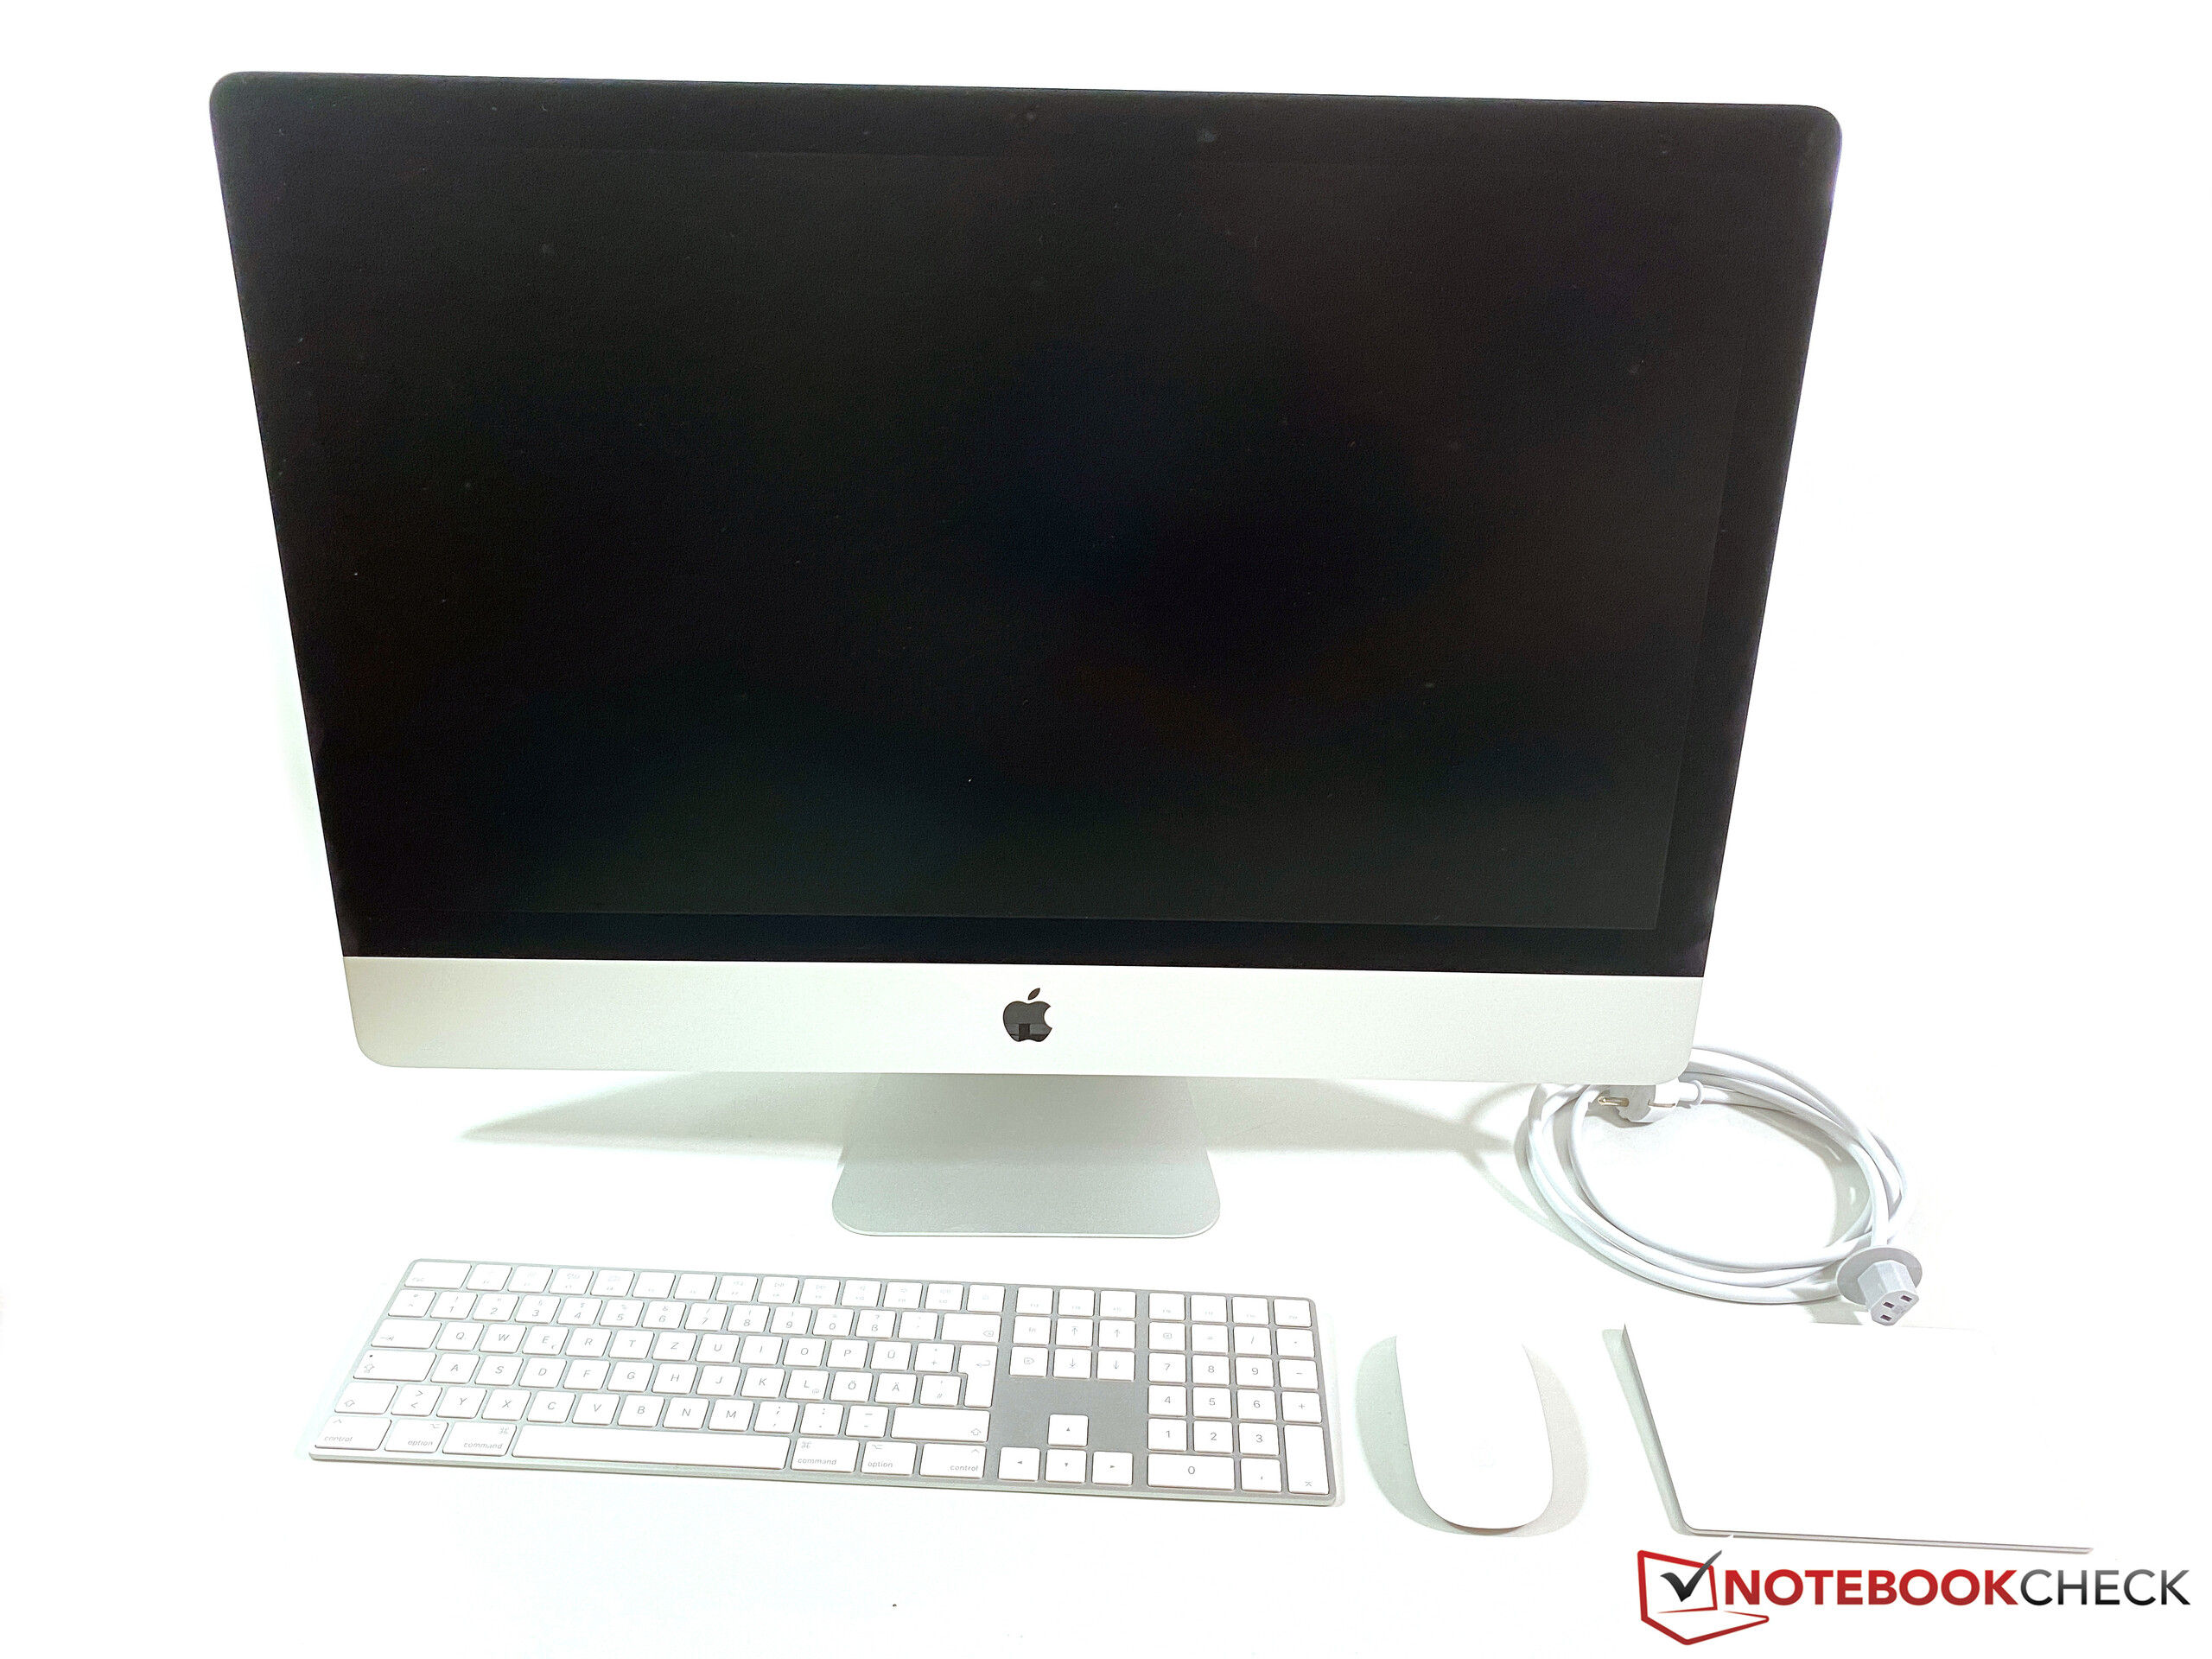
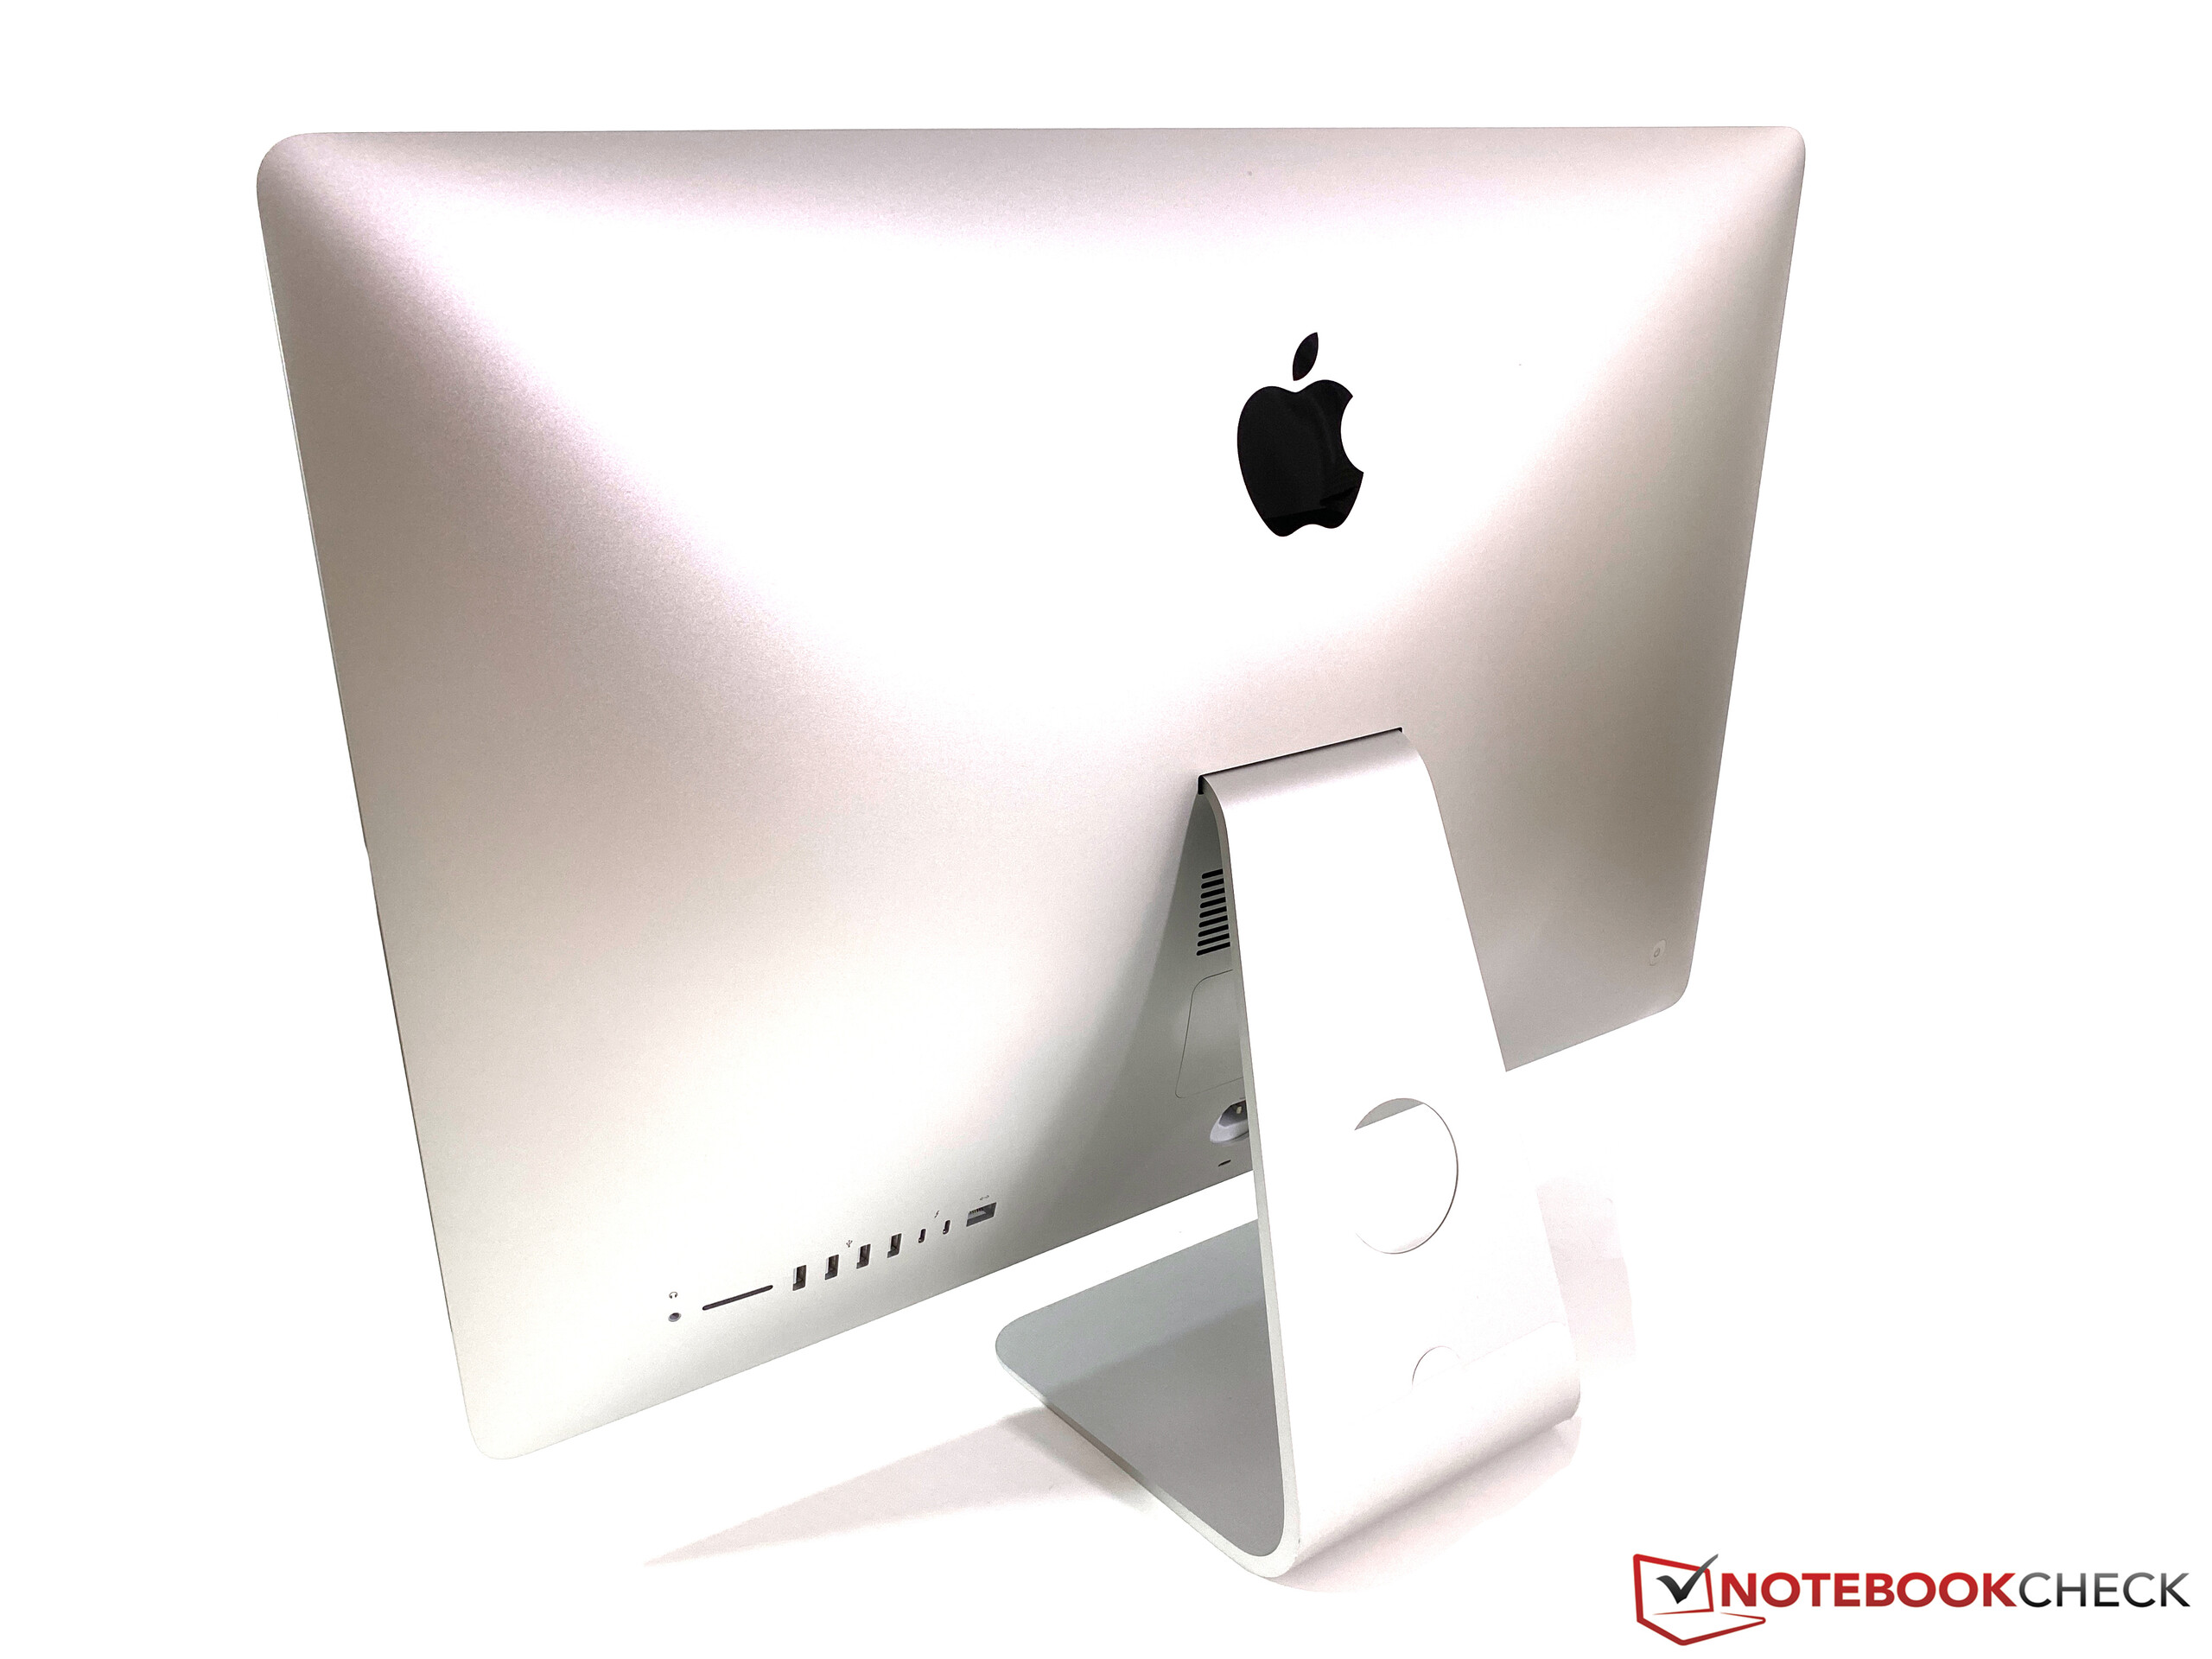
The design of the Apple iMac did not change since 2015, but there is still not much to criticize about the design of the all-in-one system. The case is almost completely made of aluminum and the build quality is perfect. However, the iMac 27 is no lightweight at almost 9 kg, but at least the power adapter is already included inside the case. You can change the tilting angle to a certain degree (see pictures below), but you cannot adjust the height. It is possible to use Vesa adapters for optional mounts.
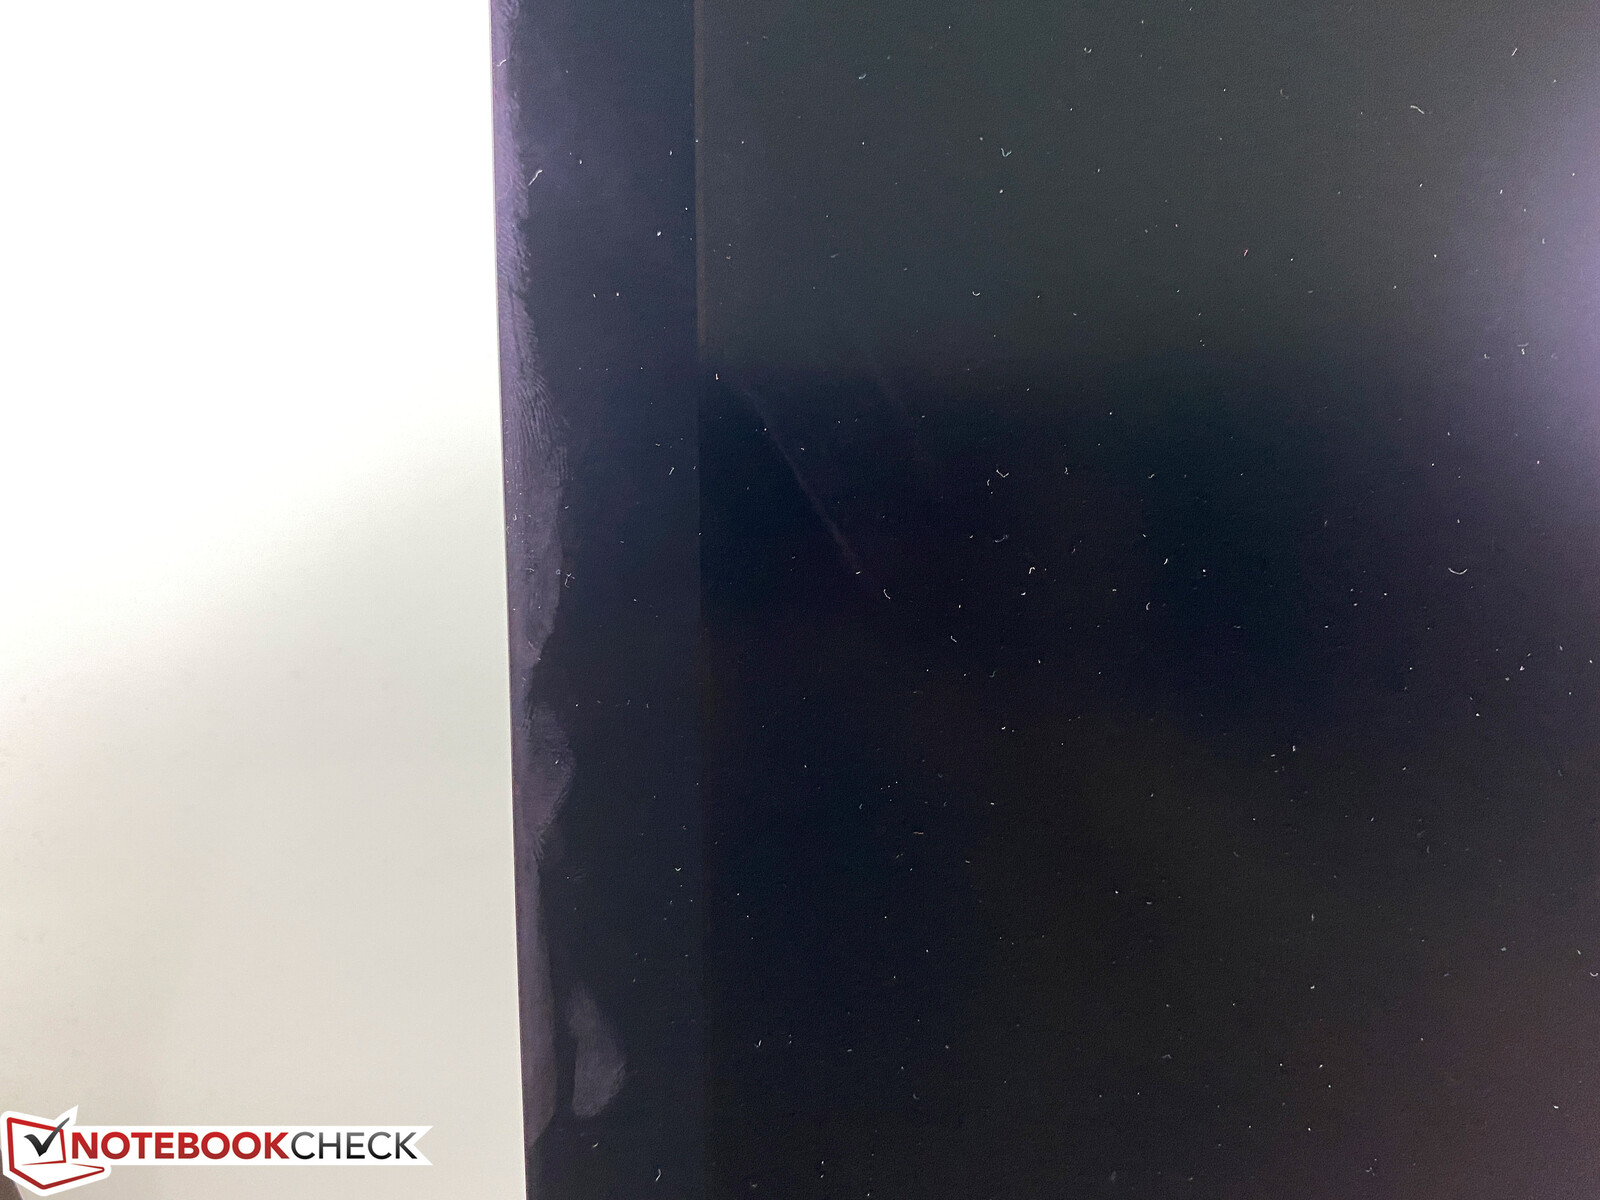
The black bezels still quickly attract fingerprints. We already know this from previous iMacs, and the problem is even more pronounced with the optional matte screen. You should therefore touch the case at the bottom of the aluminum case when you want to adjust the screen, otherwise you will have to clean the bezel.
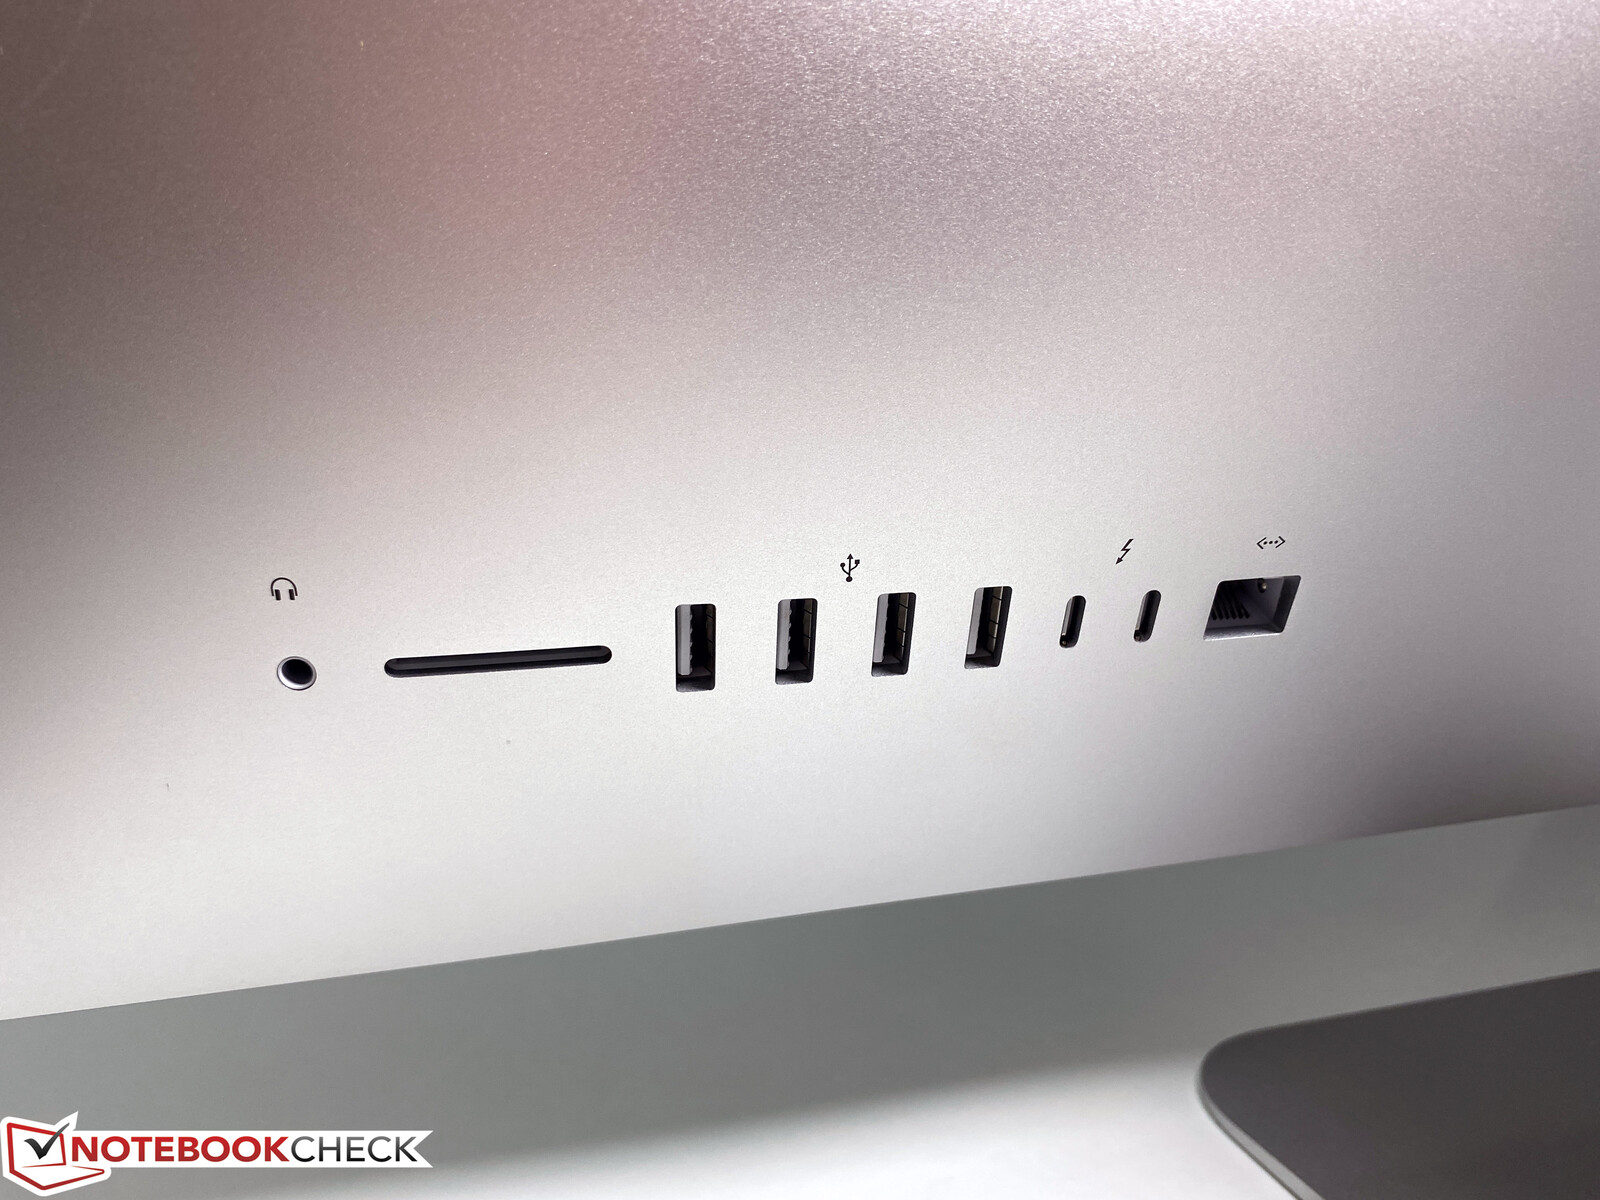
The port situation did not change, either, and the port selection is very good with 2x Thunderbolt 3, four regular USB-A connectors, and an Ethernet port (either 1 Gb/s or 10 Gb/s), but it is still tricky to access them. It is basically impossible to attach a USB drive without looking or turning the display around. We recommend a docking station.
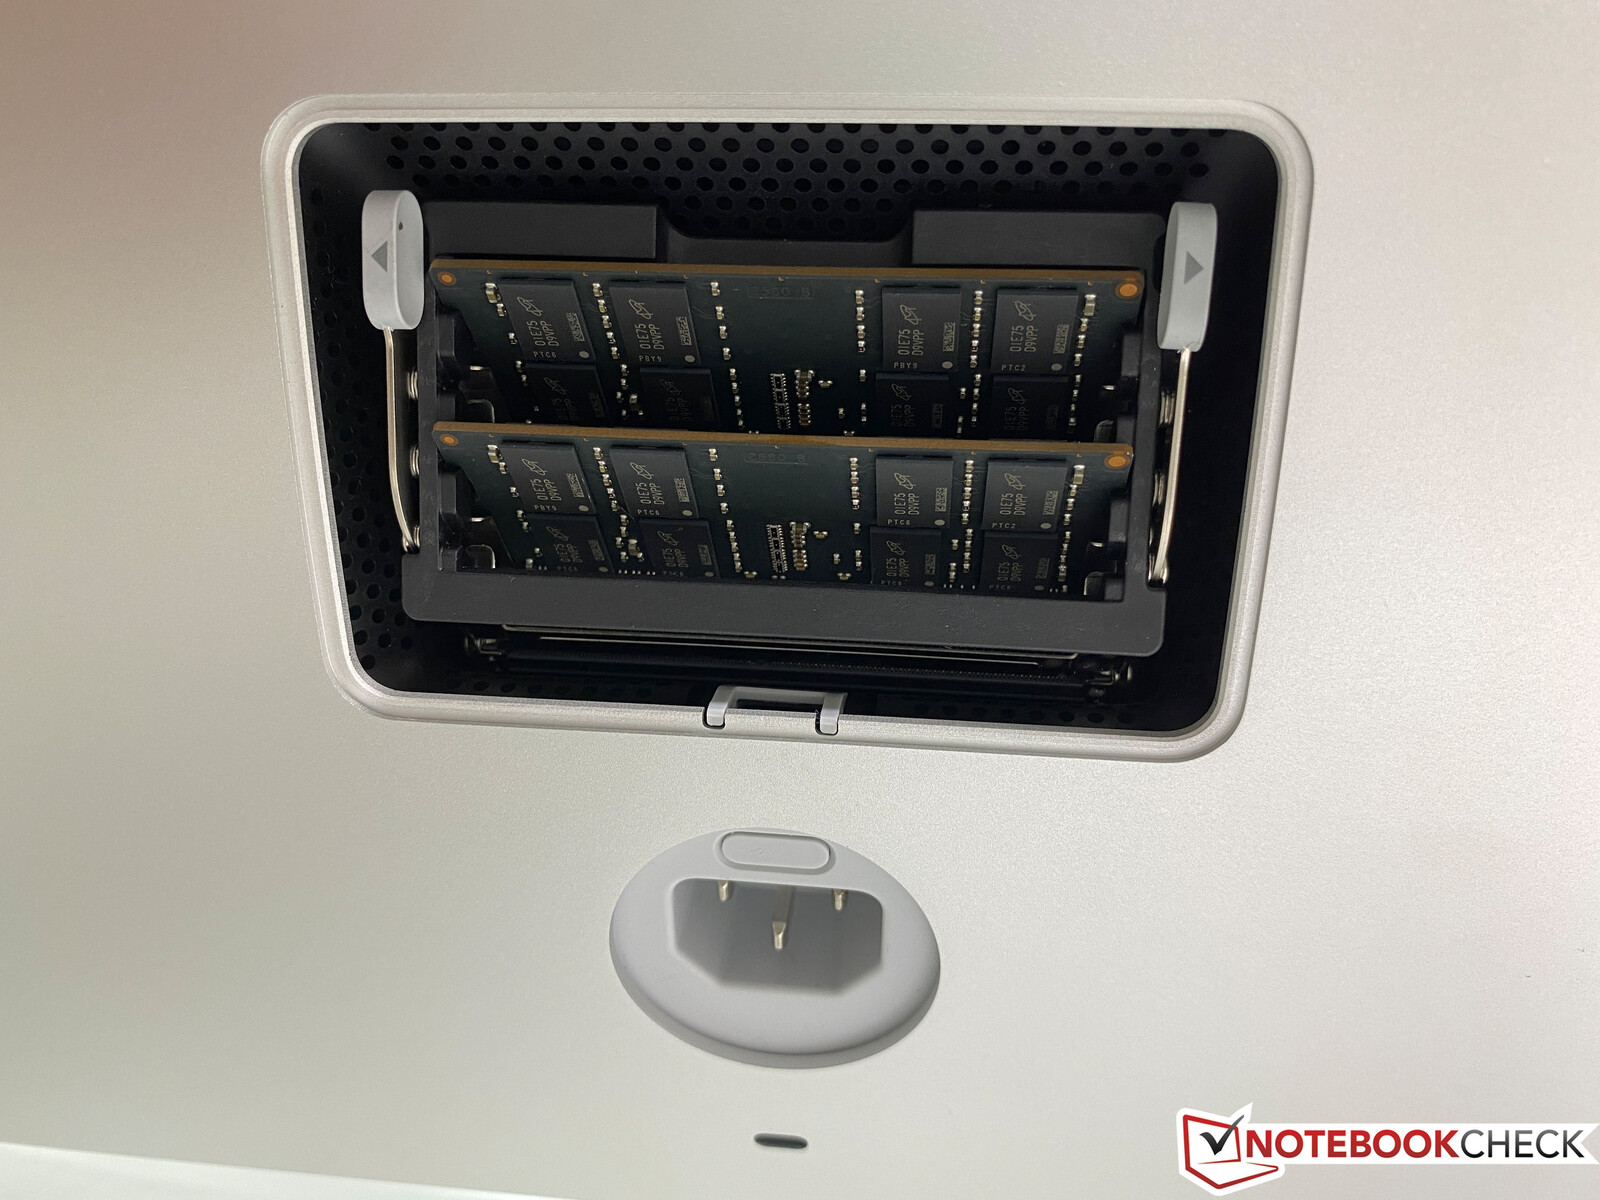
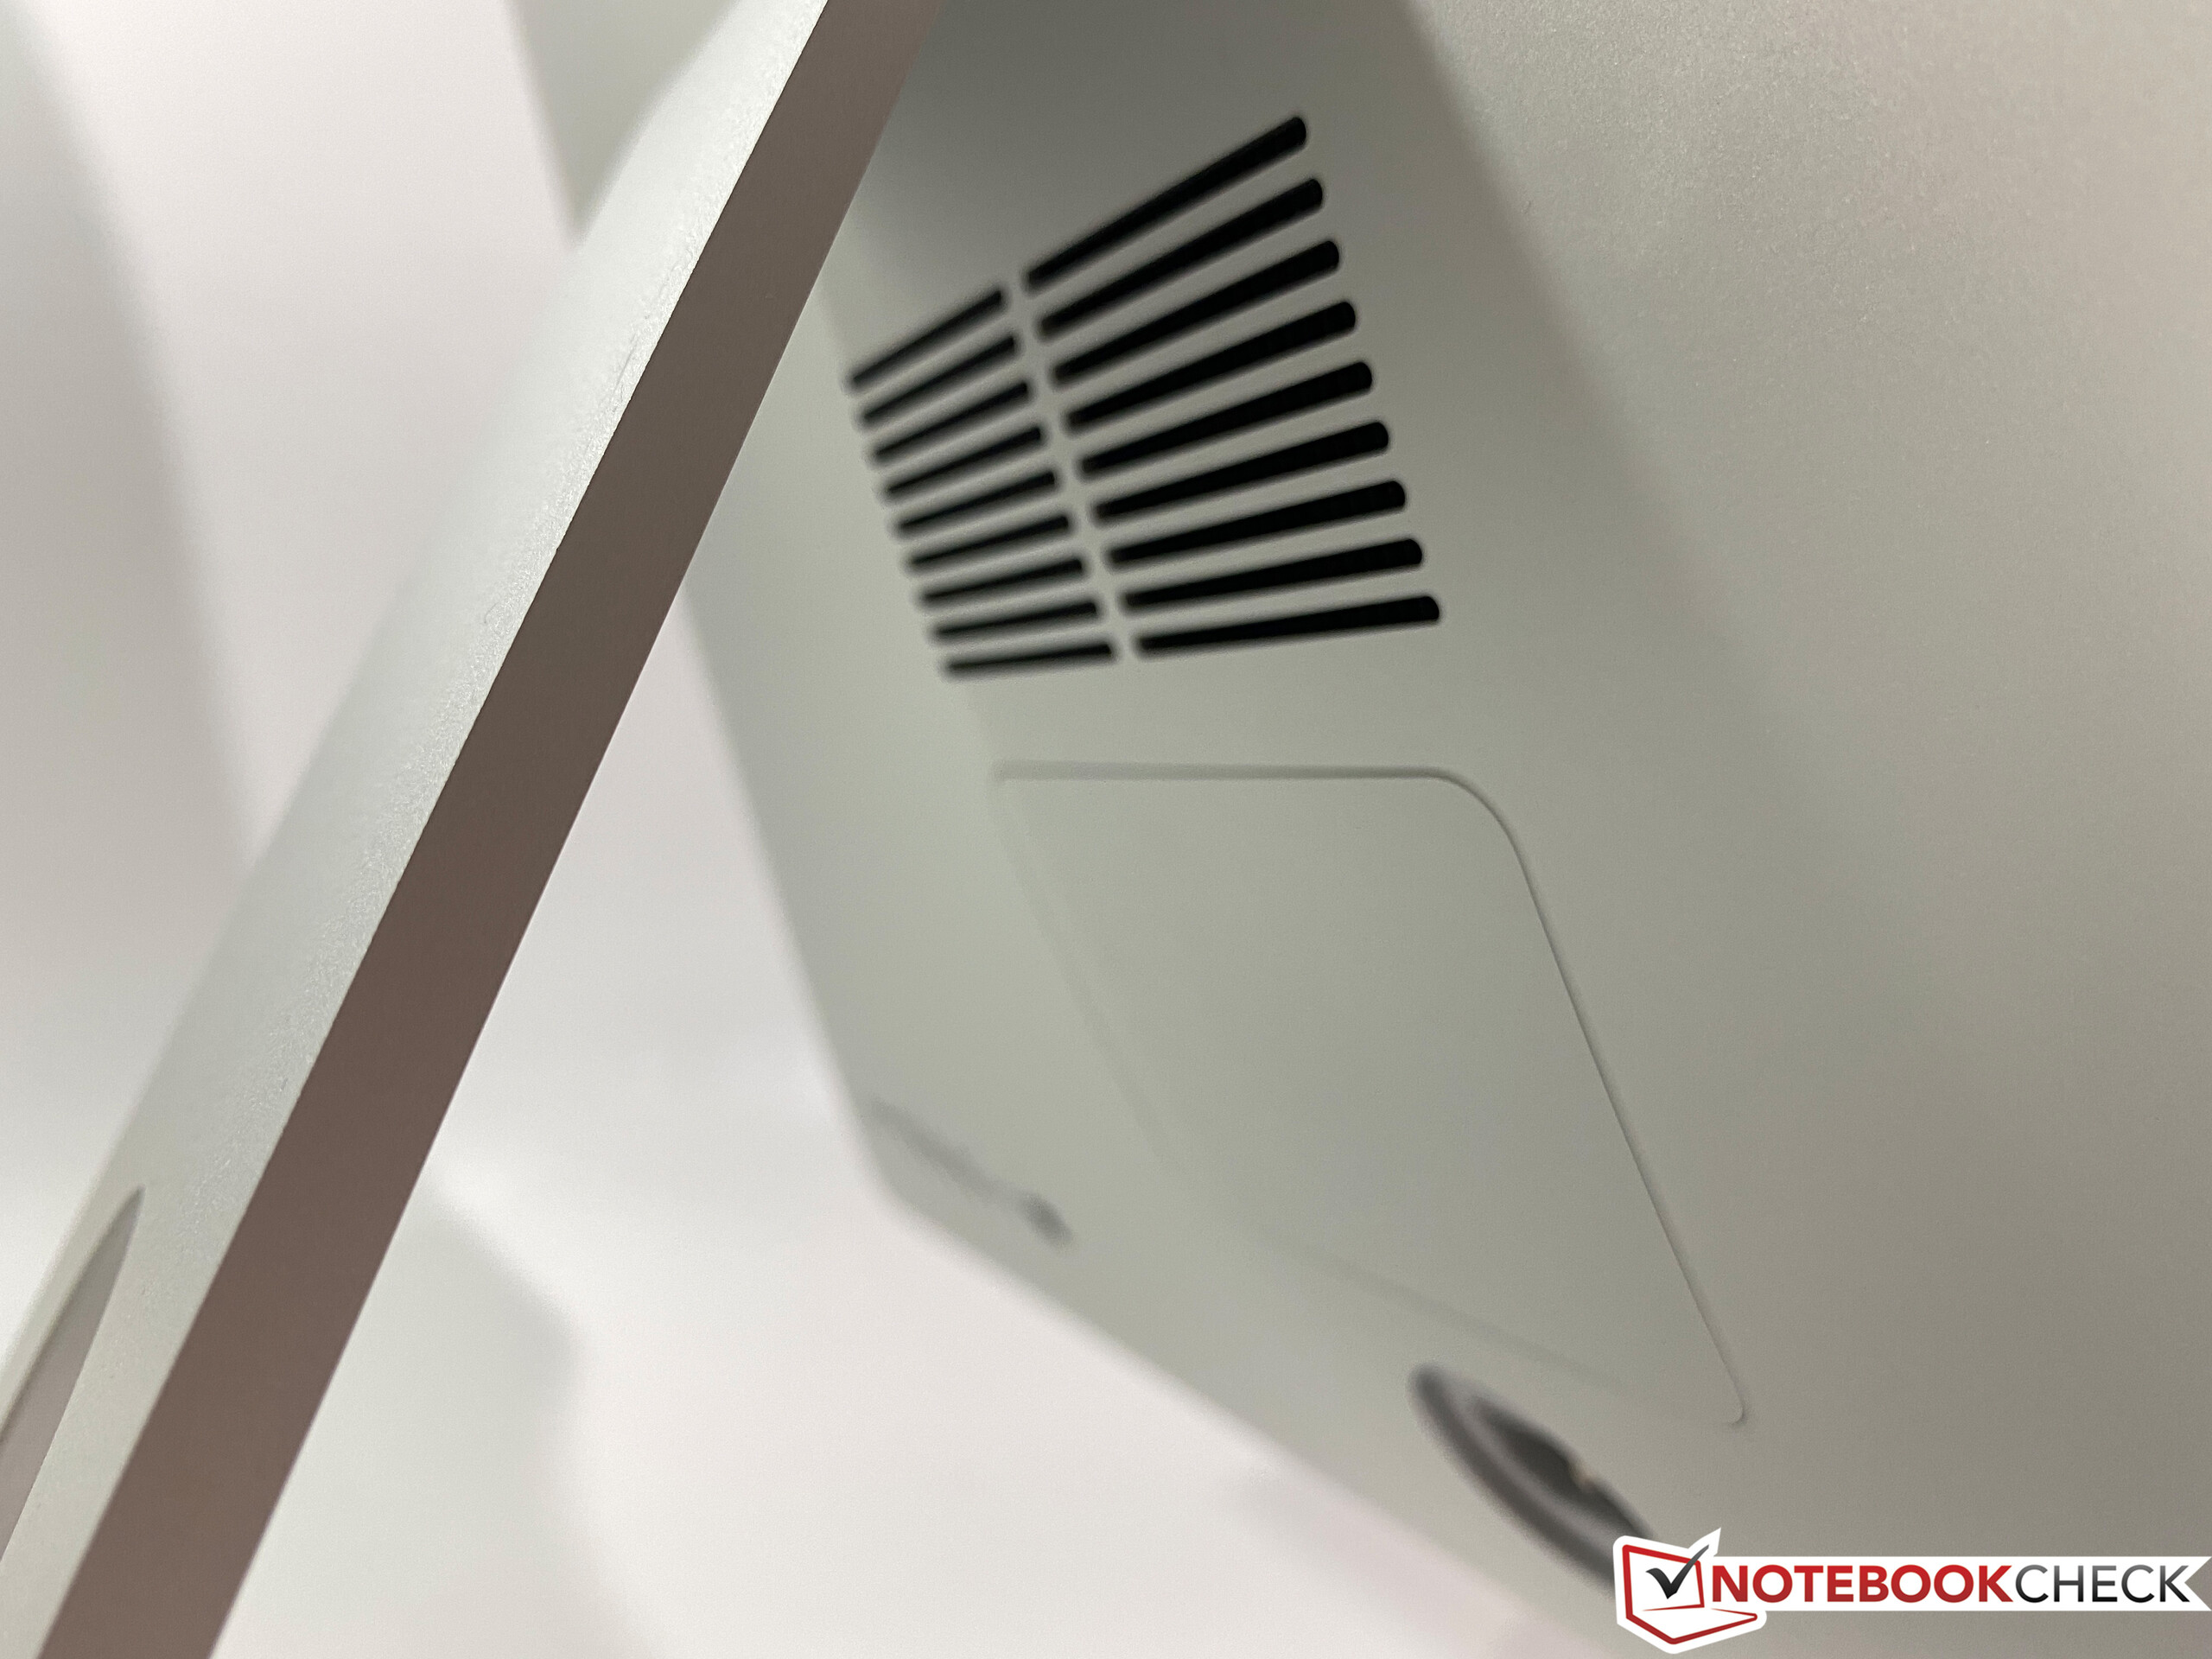
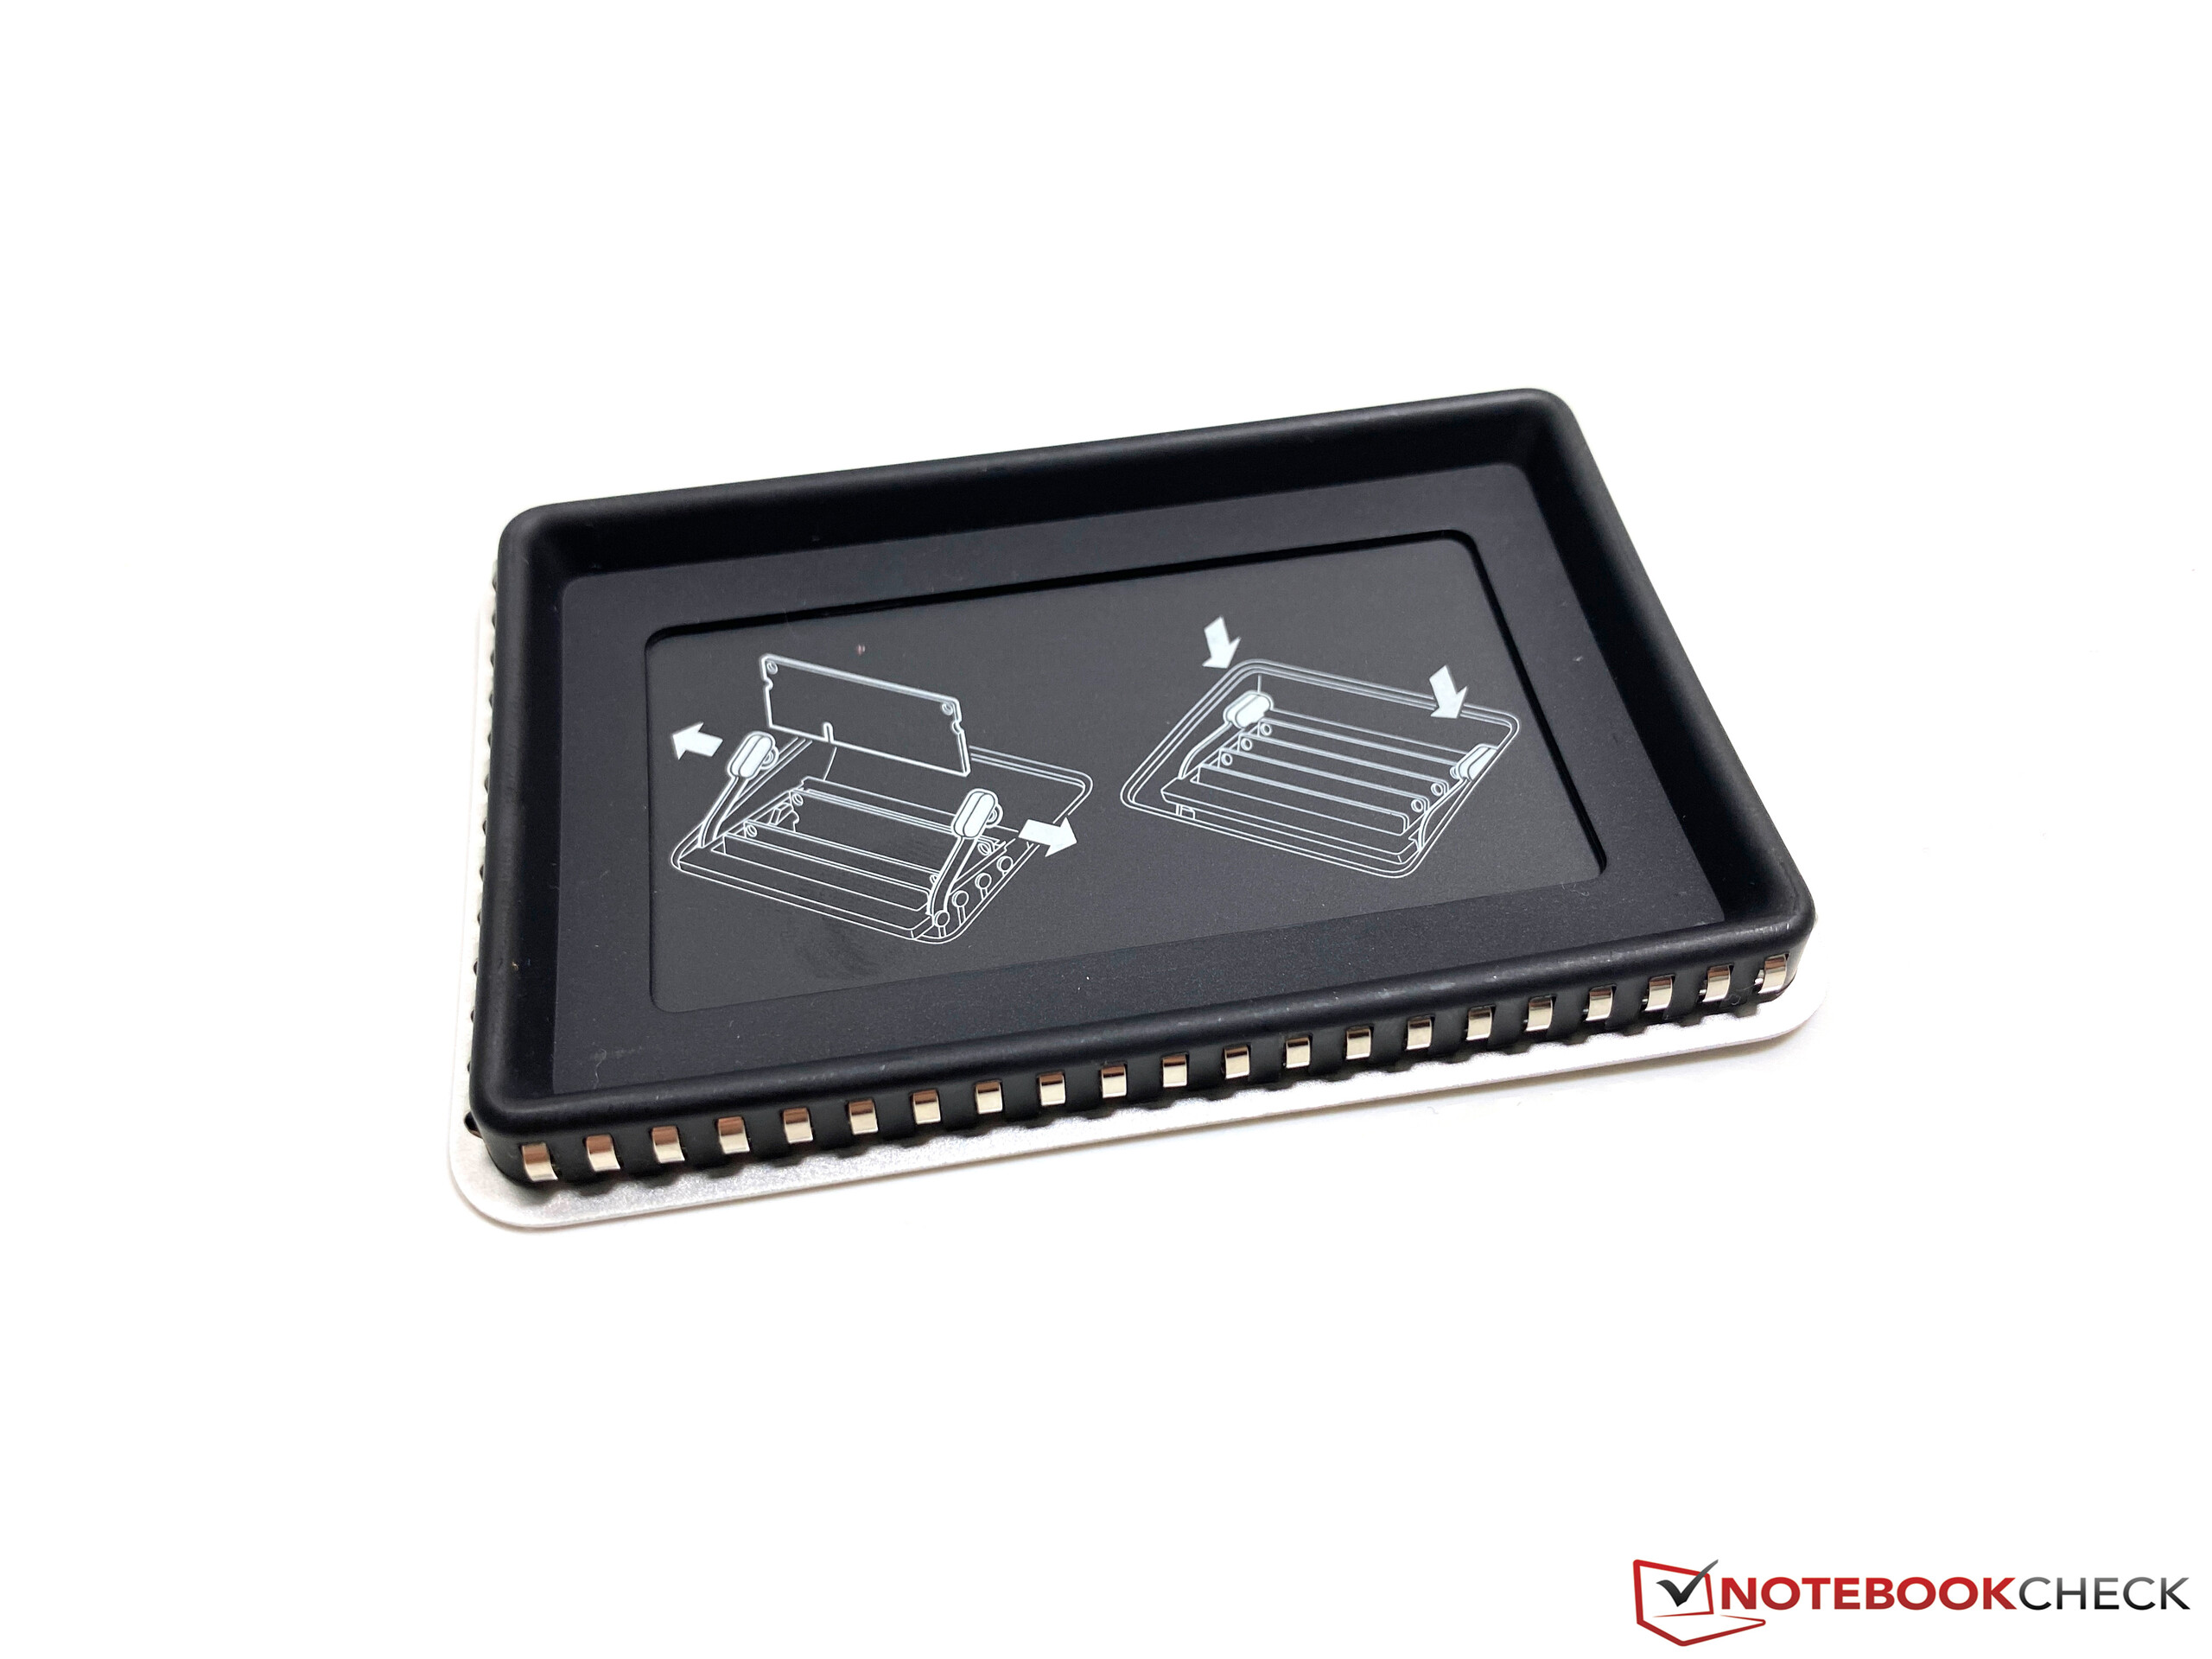
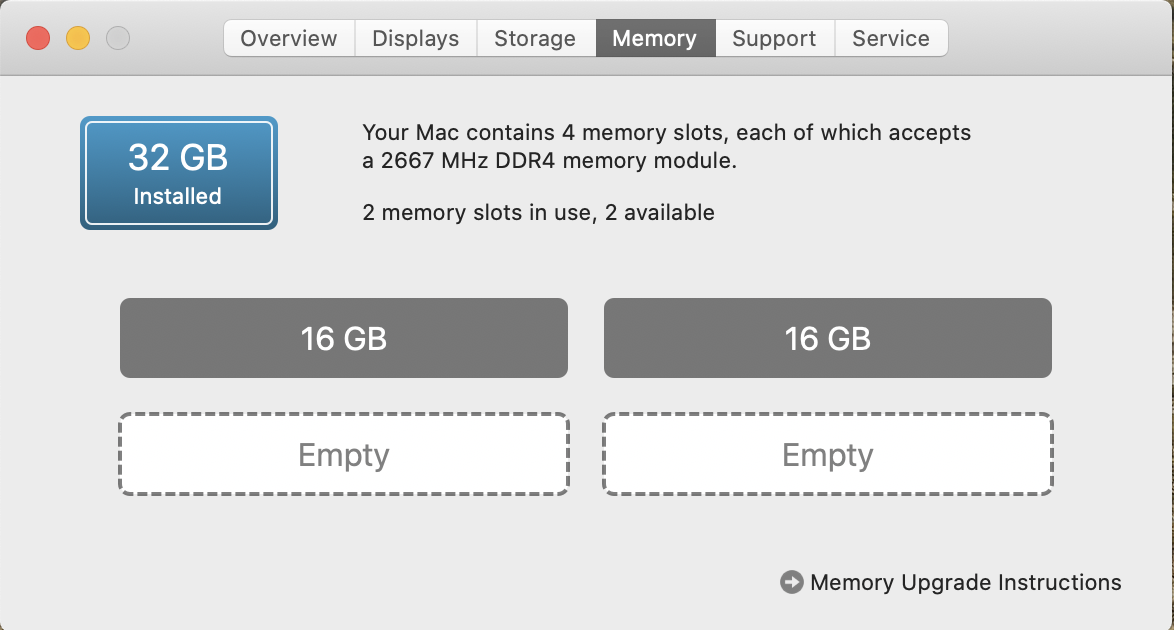
The iMac is hardly convincing in terms of maintenance. You can only access the four RAM slots via a small cover at the rear. To remove the cover, you must push a little button above the connector for the power cable. The mechanism was a bit tight on our unit. All in all, the maintenance is still extremely limited for a desktop PC.

SD-Card Reader
You still get a full-size SD-card reader at the rear. The access is obviously a problem, but the performance is very good. We measured transfer rates of more than 200 MB/s with our reference card from Toshiba (Exceria Pro SDXC 64 GB UHS-II).
| SD Card Reader | |
| average JPG Copy Test (av. of 3 runs) | |
| Apple iMac 27 Mid 2020 (Toshiba Exceria Pro SDXC 64 GB UHS-II) | |
| Dell XPS 17 9700 Core i7 RTX 2060 Max-Q (Toshiba Exceria Pro SDXC 64 GB UHS-II) | |
| Lenovo ThinkPad X1 Extreme 2019 20QV000WGE (Toshiba Exceria Pro SDXC 64 GB UHS-II) | |
| Apple iMac Pro (Toshiba Exceria Pro SDXC 64 GB UHS-II) | |
| maximum AS SSD Seq Read Test (1GB) | |
| Apple iMac 27 Mid 2020 (Toshiba Exceria Pro SDXC 64 GB UHS-II) | |
| Lenovo ThinkPad X1 Extreme 2019 20QV000WGE (Toshiba Exceria Pro SDXC 64 GB UHS-II) | |
| Dell XPS 17 9700 Core i7 RTX 2060 Max-Q (Toshiba Exceria Pro SDXC 64 GB UHS-II) | |
| Apple iMac Pro (Toshiba Exceria Pro SDXC 64 GB UHS-II) | |
Communication - iMac without Wi-Fi 6
Like the current MacBooks, Apple still uses a Wi-Fi 5 module from Broadcom. The Wi-Fi signal in general is very stable and we did not notice any problems during our review period even when we downloaded larger files for our gaming benchmarks, but the transfer rates are still not very high. We already know this phenomenon from previous iMac models. Our standardized Wi-Fi test with the router Netgear Nighthawk RAX120 only determined around 600-700 Mb/s. The current MacBook Pro 16 with its Wi-Fi 5 module is a bit faster, but we have also included two Windows laptops in the comparison chart. Their Wi-Fi 6 modules manage much higher transfer rates.
Webcam - Apple now uses a 1080p camera
Apple upgraded the webcam of the iMac, but the jump is not huge. Instead of the old 720p webcam, you now get a 1080p module. The quality is a bit better compared to many notebooks, but it is not a really good camera, either. There are no space restrictions here, and especially in the current time with more home office work we would have liked to see a much better camera, for example a front camera from Apple's iPhone portfolio.

, i9-10910, Apple SSD AP1024")
, i9-10910, Apple SSD AP1024")
Input Devices
The input devices did not change. You can choose between two keyboards (with and without numpad), the Magic Mouse 2, and the Magic TrackPad 2. The functionality of the three input devices (all wireless) is good, but the keyboard does not offer much key travel and is not illuminated. There are better desktop keyboards, especially if you want to write longer texts. The location of the charging port at the bottom of the Magic Mouse 2 is still inconvenient and Apple still uses the old Lightning connector instead of a more modern USB-C port.
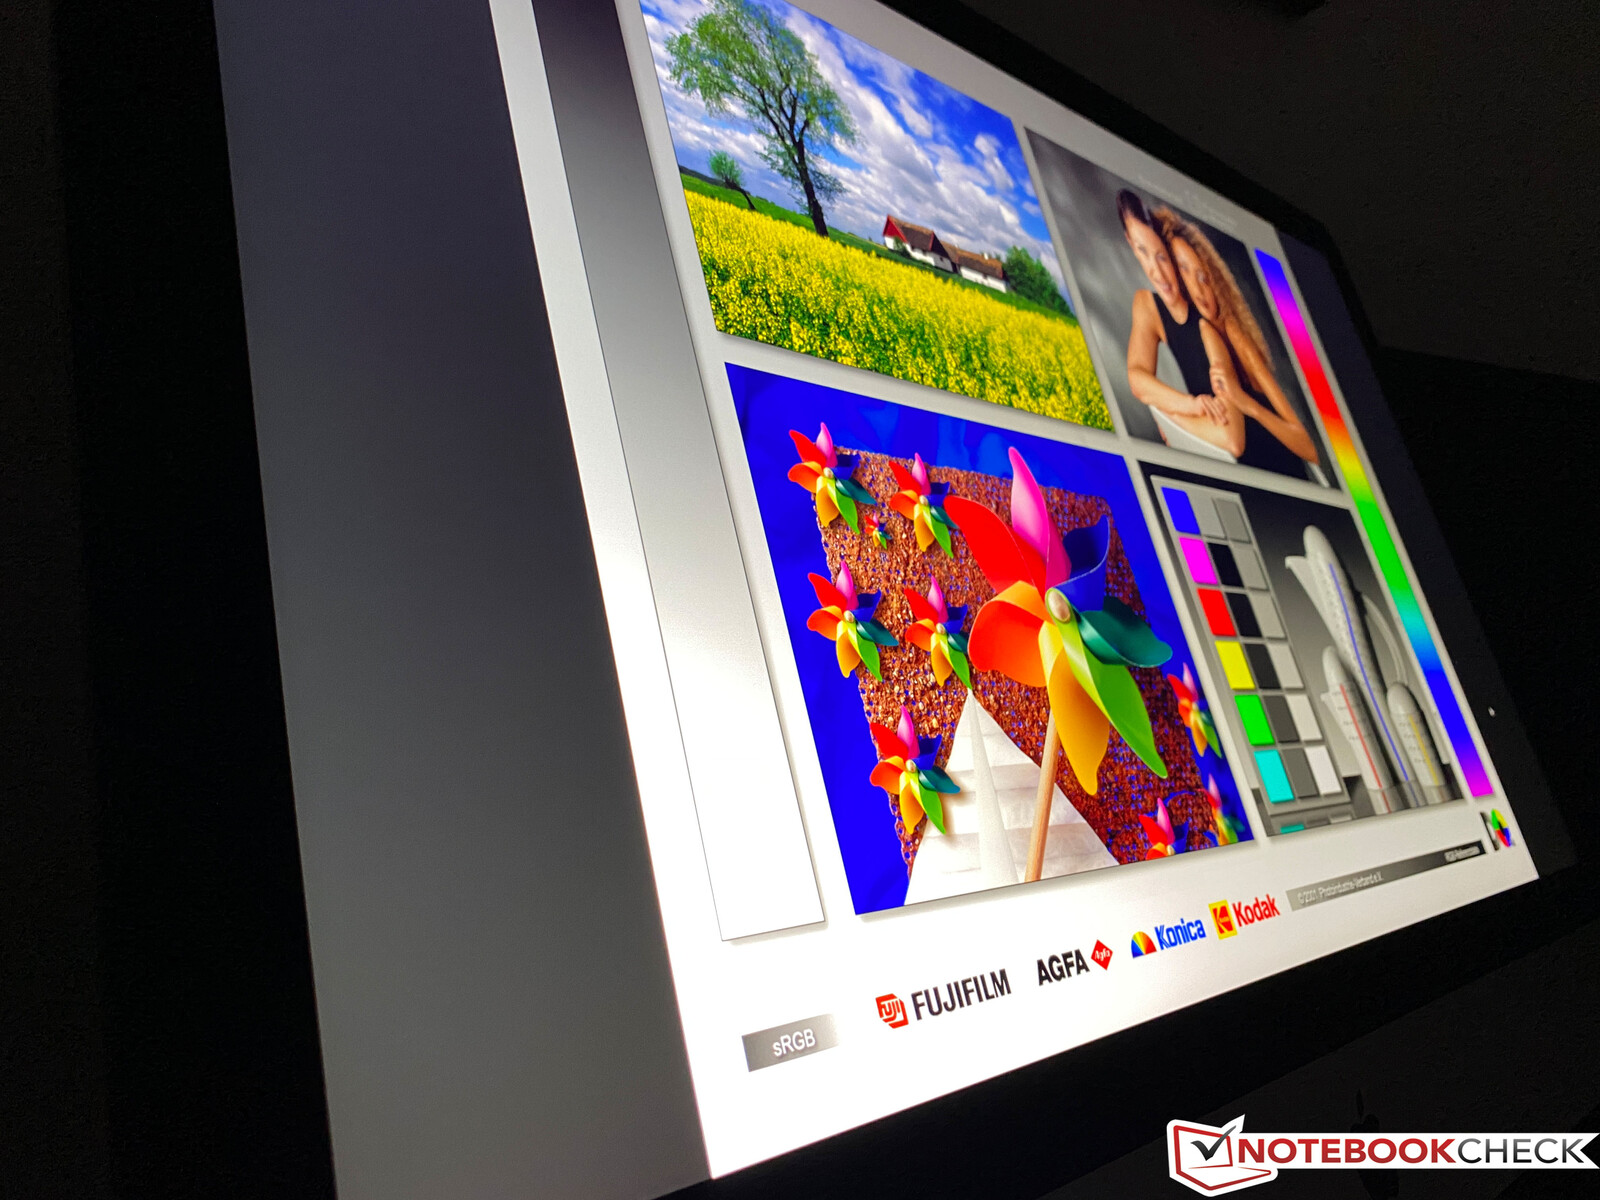
Display - iMac with 5K Retina Screen

The 27-inch 5K panel did not change. The resolution is still 5120x2880 pixels (16:9) and there are no scaling issues in macOS. It is still a glossy panel by default, but now you can select the matte nano-texture glass for 609 Euros (~$720). Many manufacturers use additional matte filters, but the nano-texture is etched into the glass in this case. This process is supposed to ensure the same picture quality you get with a glossy screen. But does it work?
Not completely. The subjective picture impression is still very good, but the picture just does not look as vivid. Bright surfaces also look a bit grainy, but this is hard to notice from a regular viewing distance. Still, the matte panel works extremely well in bright rooms or when the iMac is located close to a window and we would always prefer it over a glossy screen for work. However, you have to decide for yourself whether you want to pay more than 600 Euros (~$709) for this feature.
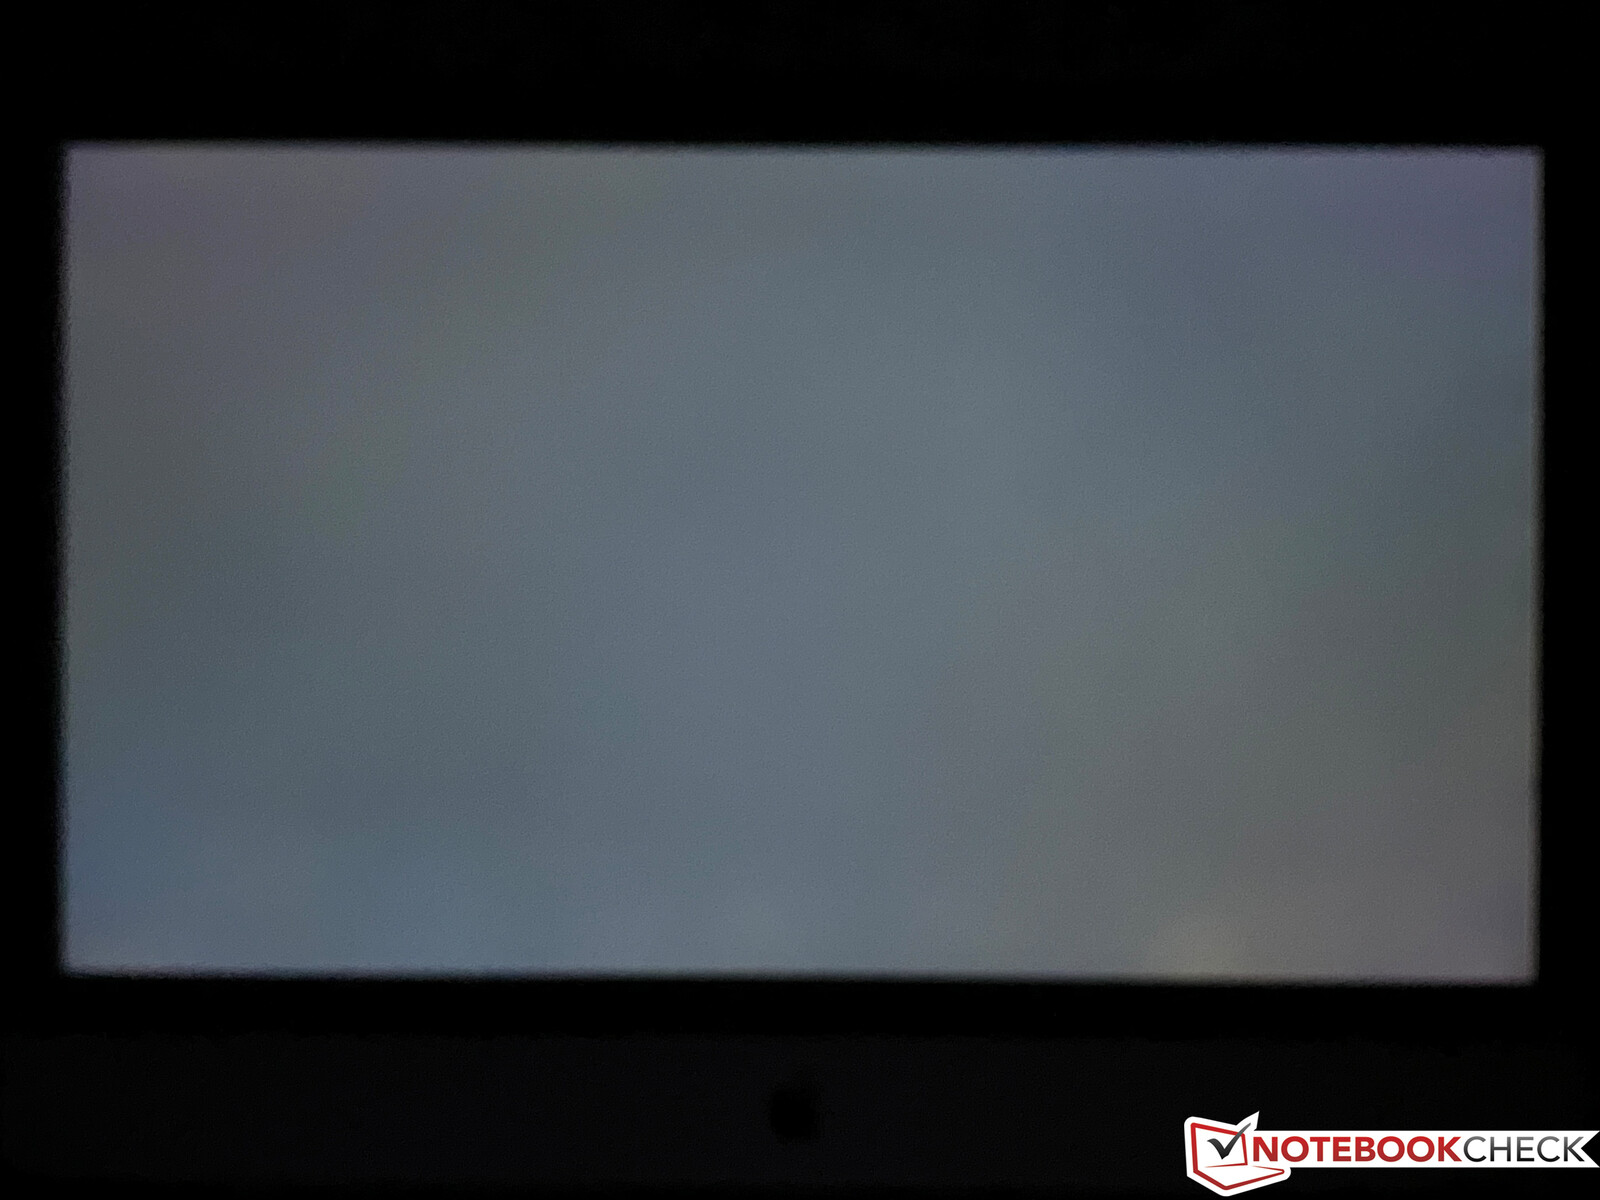
There is hardly any visible backlight bleeding, despite the large panel and the high luminance. We can detect PWM flickering at a brightness of 66% or lower, but the high frequency of more than 22 kHz should not cause any problems.
| |||||||||||||||||||||||||
Brightness Distribution: 88 %
Center on Battery: 529 cd/m²
Contrast: 1102:1 (Black: 0.48 cd/m²)
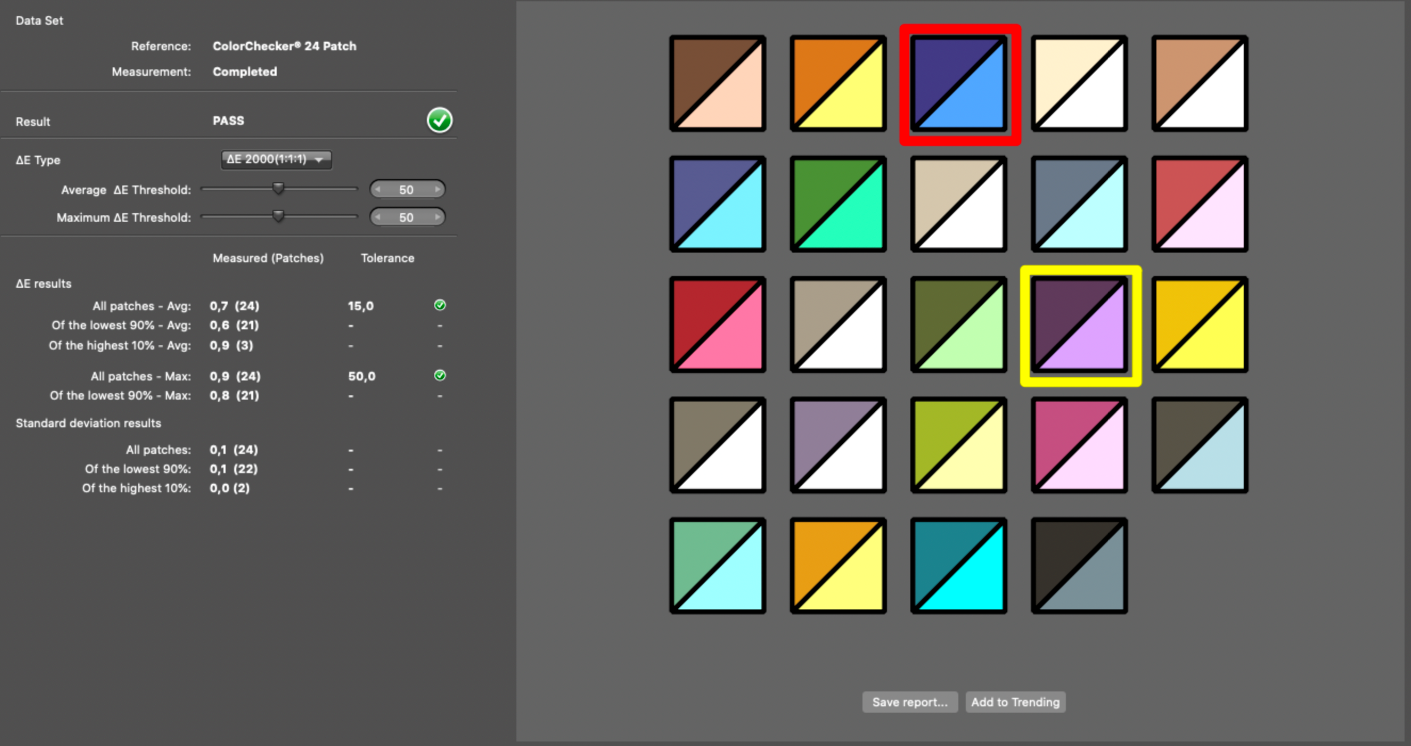
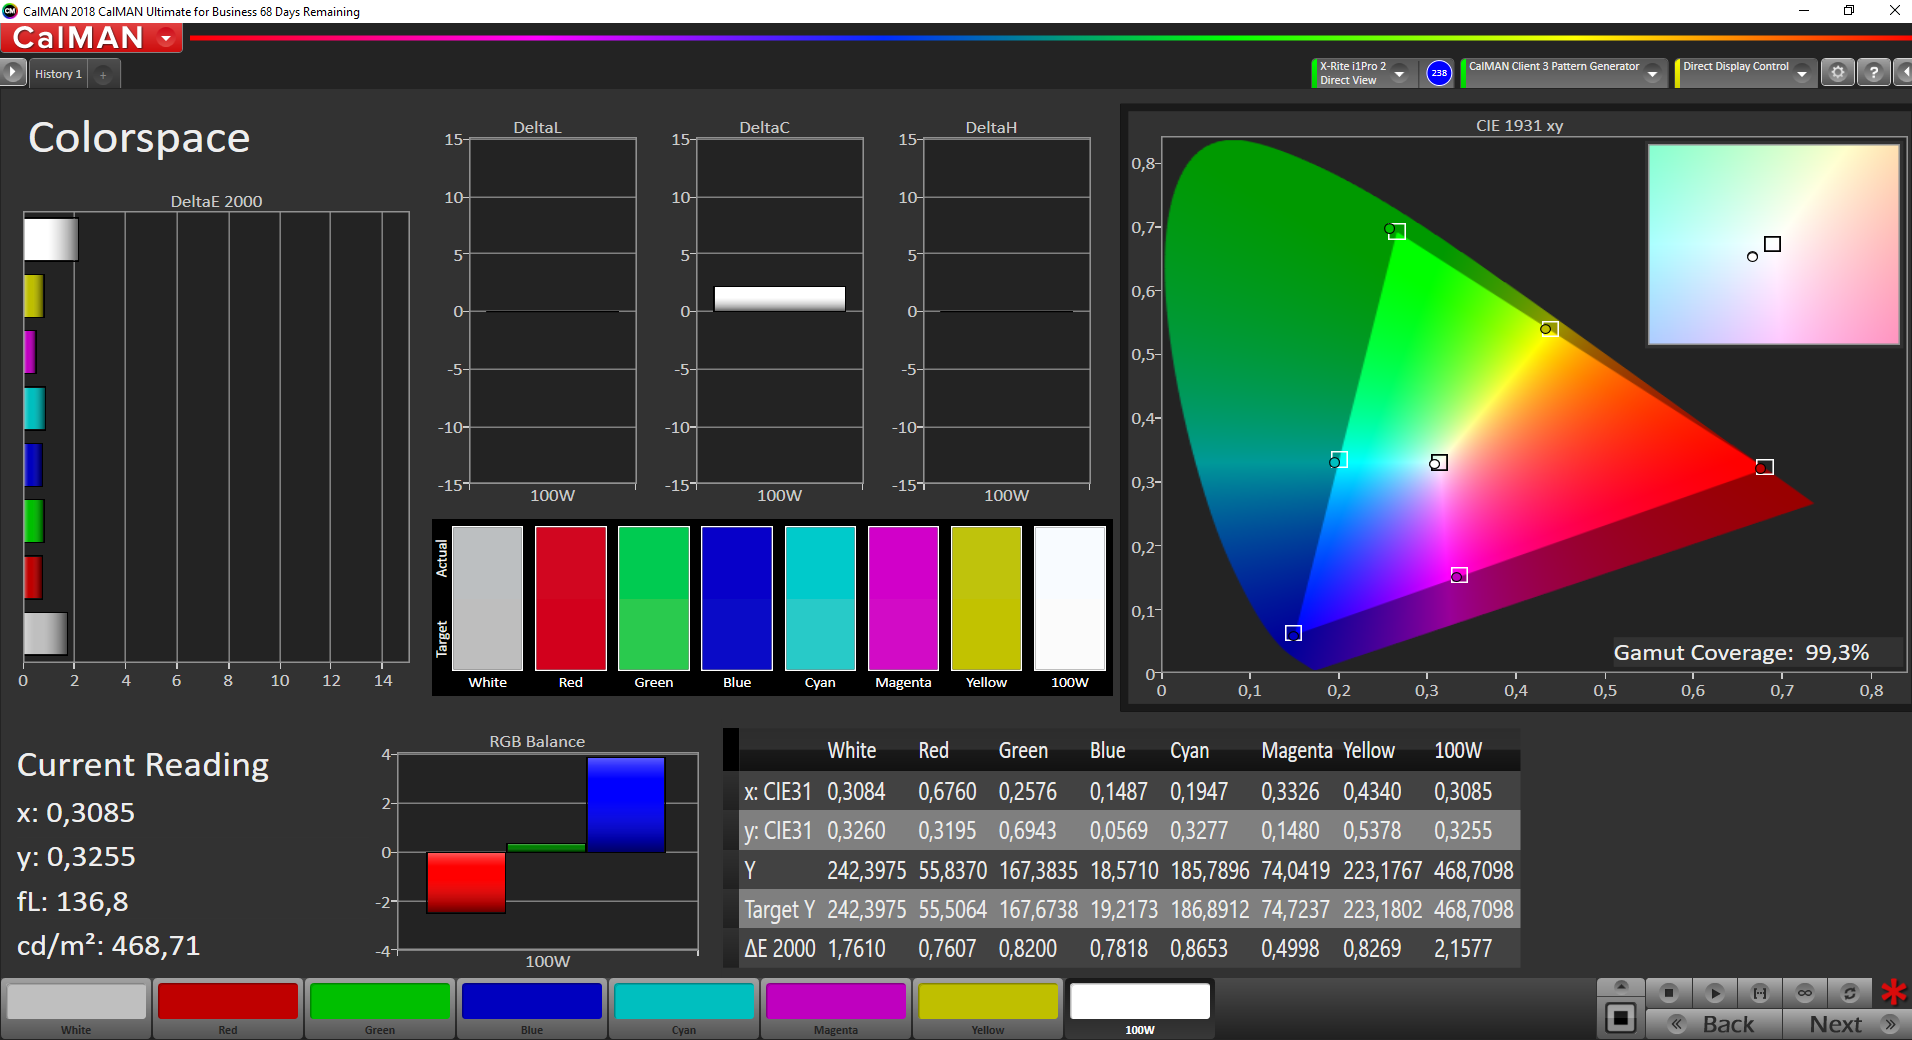
ΔE ColorChecker Calman: 1.4 | ∀{0.5-29.43 Ø4.79}
ΔE Greyscale Calman: 2.2 | ∀{0.09-98 Ø5}
100% sRGB (Argyll 1.6.3 3D)
80% AdobeRGB 1998 (Argyll 1.6.3 3D)
89.5% AdobeRGB 1998 (Argyll 3D)
100% sRGB (Argyll 3D)
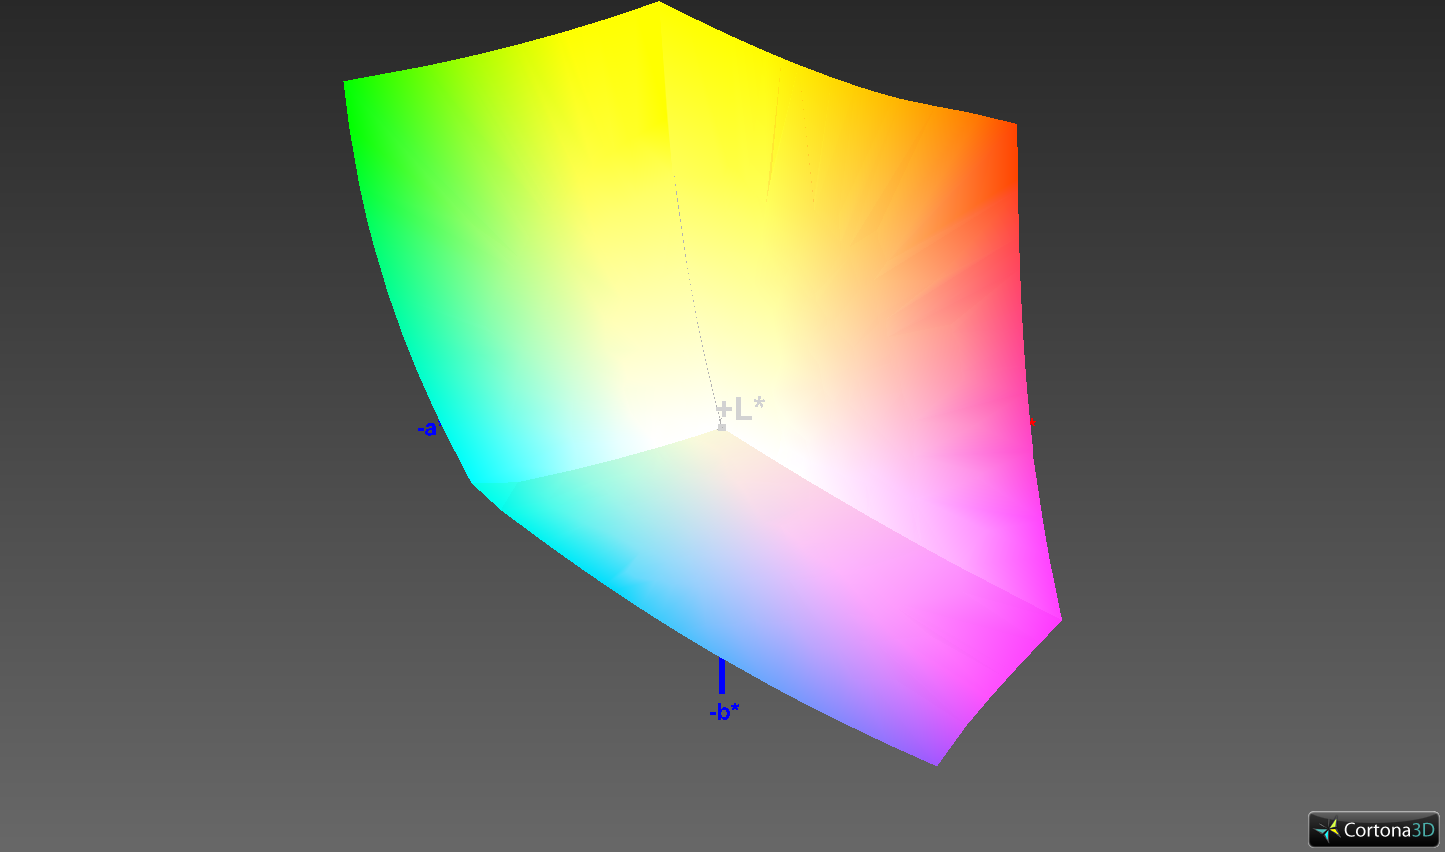
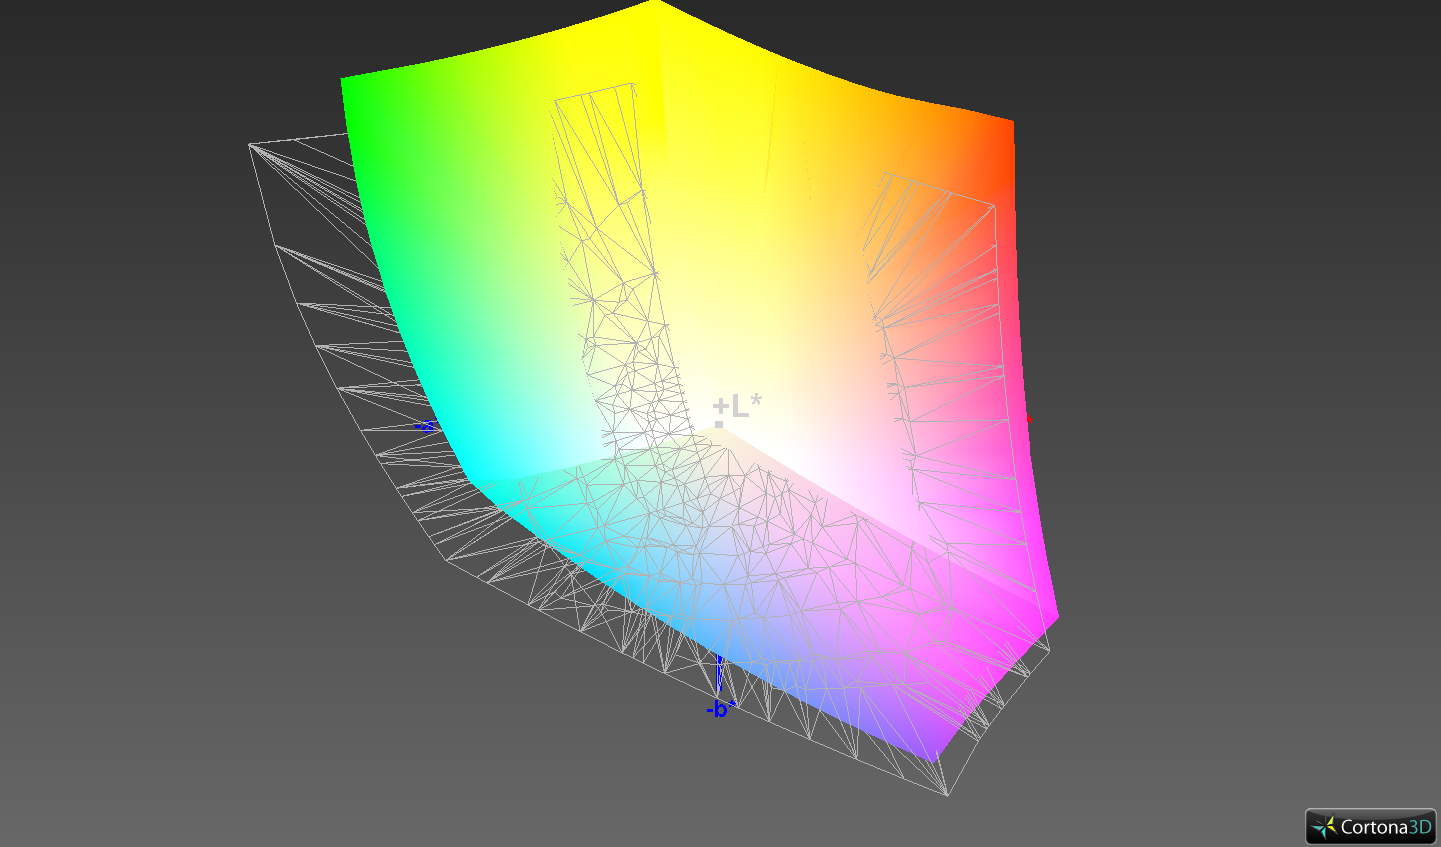
98.7% Display P3 (Argyll 3D)
Gamma: 2.32
CCT: 6826 K
| Apple iMac 27 Mid 2020 APPAE32, IPS, 5120x2880, 27" | Apple iMac Pro APPAE1E, , 5120x2880, 27" | Apple iMac Retina 5K 27 Late 2015 3.2 GHz M390 MK472D/A 5120x2880, 27" | Apple iMac Retina 5K 27 Late 2014 i7-4790K M295X APPAE01, IPS, 5120x2880, 27" | |
|---|---|---|---|---|
| Display | -0% | 0% | ||
| Display P3 Coverage (%) | 98.7 | 99 0% | 99.3 1% | |
| sRGB Coverage (%) | 100 | 100 0% | 100 0% | |
| AdobeRGB 1998 Coverage (%) | 89.5 | 88.8 -1% | 88.2 -1% | |
| Response Times | -32% | -40% | -22% | |
| Response Time Grey 50% / Grey 80% * (ms) | 27.2 ? | 30.4 ? -12% | 30.4 ? -12% | 27 ? 1% |
| Response Time Black / White * (ms) | 12.4 ? | 18.8 ? -52% | 20.8 ? -68% | 18 ? -45% |
| PWM Frequency (Hz) | 22730 ? | 208.3 ? | ||
| Screen | -30% | -19% | -41% | |
| Brightness middle (cd/m²) | 529 | 496 -6% | 429 -19% | |
| Brightness (cd/m²) | 511 | 468 -8% | 424 -17% | |
| Brightness Distribution (%) | 88 | 87 -1% | 95 8% | |
| Black Level * (cd/m²) | 0.48 | 0.54 -13% | 0.58 -21% | |
| Contrast (:1) | 1102 | 919 -17% | 740 -33% | |
| Colorchecker dE 2000 * | 1.4 | 3 -114% | 2.8 -100% | 2.66 -90% |
| Colorchecker dE 2000 max. * | 2.6 | 5.8 -123% | ||
| Greyscale dE 2000 * | 2.2 | 2.5 -14% | 1.97 10% | 3.47 -58% |
| Gamma | 2.32 95% | 2.22 99% | 2.13 103% | 2.32 95% |
| CCT | 6826 95% | 6824 95% | 6889 94% | 7127 91% |
| Color Space (Percent of AdobeRGB 1998) (%) | 80 | 79.4 -1% | 79 -1% | 66.2 -17% |
| Color Space (Percent of sRGB) (%) | 100 | 100 0% | 99.97 0% | 99.62 0% |
| Colorchecker dE 2000 calibrated * | 0.9 | |||
| Total Average (Program / Settings) | -21% /
-24% | -20% /
-18% | -32% /
-35% |
* ... smaller is better
We use the professional CalMAN software in combination with the X-Rite i1 Pro 2 spectrophotometer. Compared to the iMac Pro we reviewed back in 2018, the panel ID has changed and we measured better values across the board. The brightness is a bit higher (more than 500 cd/m² on average) and the black value is a bit lower, so the contrast ratio has improved. The color accuracy is very good out of the box and calibration is not necessary, because all the color deviations are already lower than 3 (compared to the P3 reference color space). We can only improve the color accuracy slightly with our own calibration; the corresponding profile can be downloaded for free in the box above.
The panel, like most Apple devices, targets the P3 color gamut and it is completely covered according to CalMAN (2D comparison). This means the panel is very well suited for picture or video-editing. True Tone (automatic adjustment of the color temperature to the environment) is supported and also very comfortable in practice, but you should deactivate this feature for the most accurate color presentation.
The viewing-angle stability on large desktop systems is not quite as important as on mobile devices, but Apple's iMac does not reveal any weaknesses here with its IPS display.
Display Response Times
| ↔ Response Time Black to White | ||
|---|---|---|
| 12.4 ms ... rise ↗ and fall ↘ combined | ↗ 4.8 ms rise | 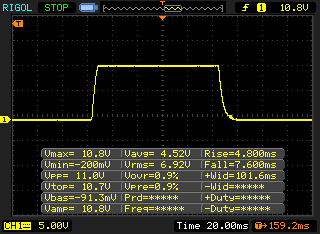 |
| ↘ 7.6 ms fall | ||
| The screen shows good response rates in our tests, but may be too slow for competitive gamers. In comparison, all tested devices range from 0.1 (minimum) to 240 (maximum) ms. » 31 % of all devices are better. This means that the measured response time is better than the average of all tested devices (20.3 ms). | ||
| ↔ Response Time 50% Grey to 80% Grey | ||
| 27.2 ms ... rise ↗ and fall ↘ combined | ↗ 12.4 ms rise | 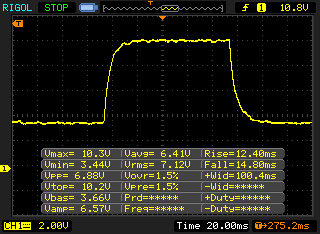 |
| ↘ 14.8 ms fall | ||
| The screen shows relatively slow response rates in our tests and may be too slow for gamers. In comparison, all tested devices range from 0.165 (minimum) to 636 (maximum) ms. » 36 % of all devices are better. This means that the measured response time is better than the average of all tested devices (31.7 ms). | ||
Screen Flickering / PWM (Pulse-Width Modulation)
| Screen flickering / PWM detected | 22730 Hz | ≤ 66 % brightness setting | 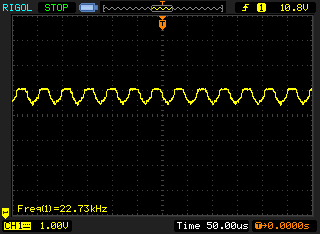 |
The display backlight flickers at 22730 Hz (worst case, e.g., utilizing PWM) Flickering detected at a brightness setting of 66 % and below. There should be no flickering or PWM above this brightness setting. The frequency of 22730 Hz is quite high, so most users sensitive to PWM should not notice any flickering. In comparison: 53 % of all tested devices do not use PWM to dim the display. If PWM was detected, an average of 8152 (minimum: 5 - maximum: 343500) Hz was measured. | |||
Performance - iMac with 10 CPU cores
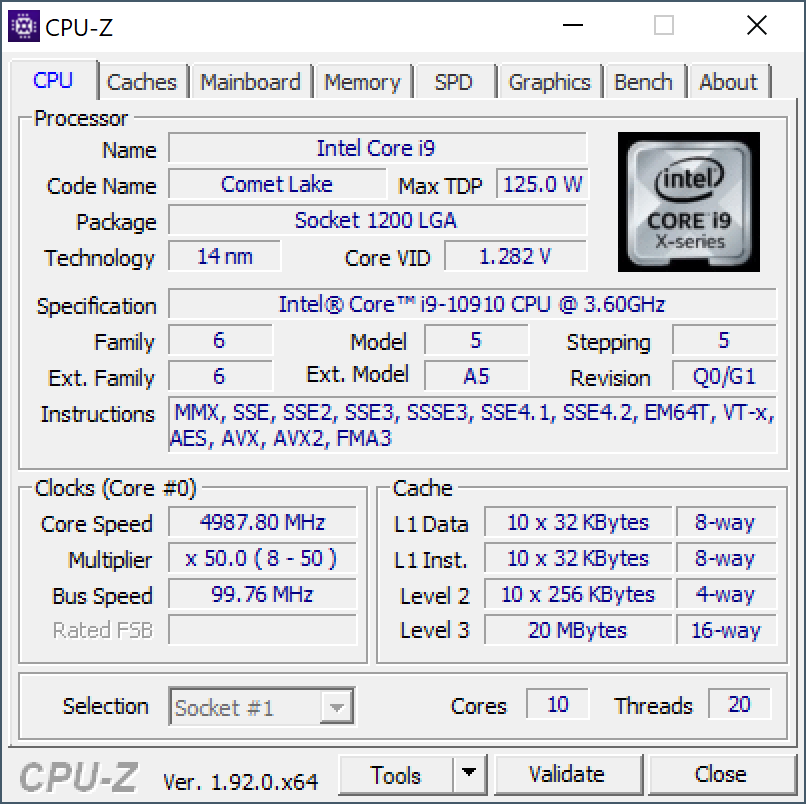
Processor - Intel Core i9-10910
The processor is an Intel Core i9-10910, which is exclusive for Apple's iMac. The CPU shows many similarities with the regular Core i9-10900 but has a slightly lower clock, so the i9-10910 should also consume a little less power. It offers 10 cores (20 threads) with a maximum clock of 5.0 GHz. Please see our tech section for more information.
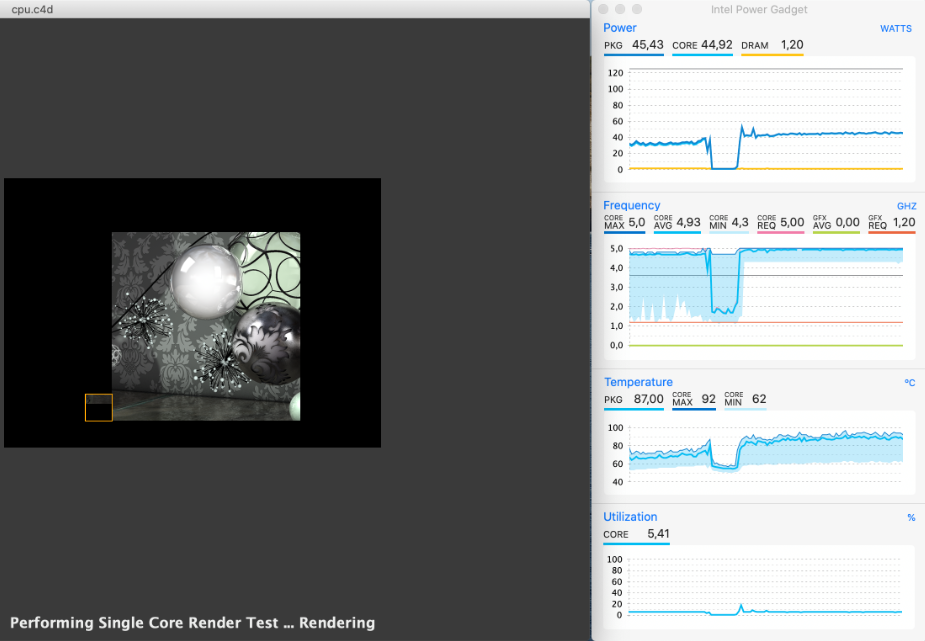
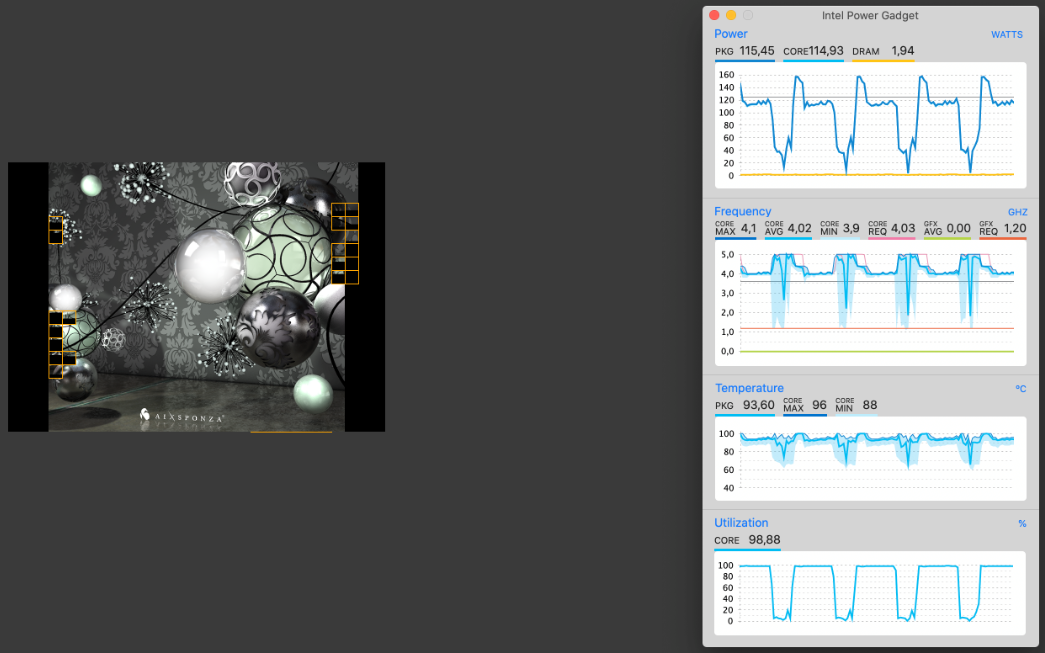
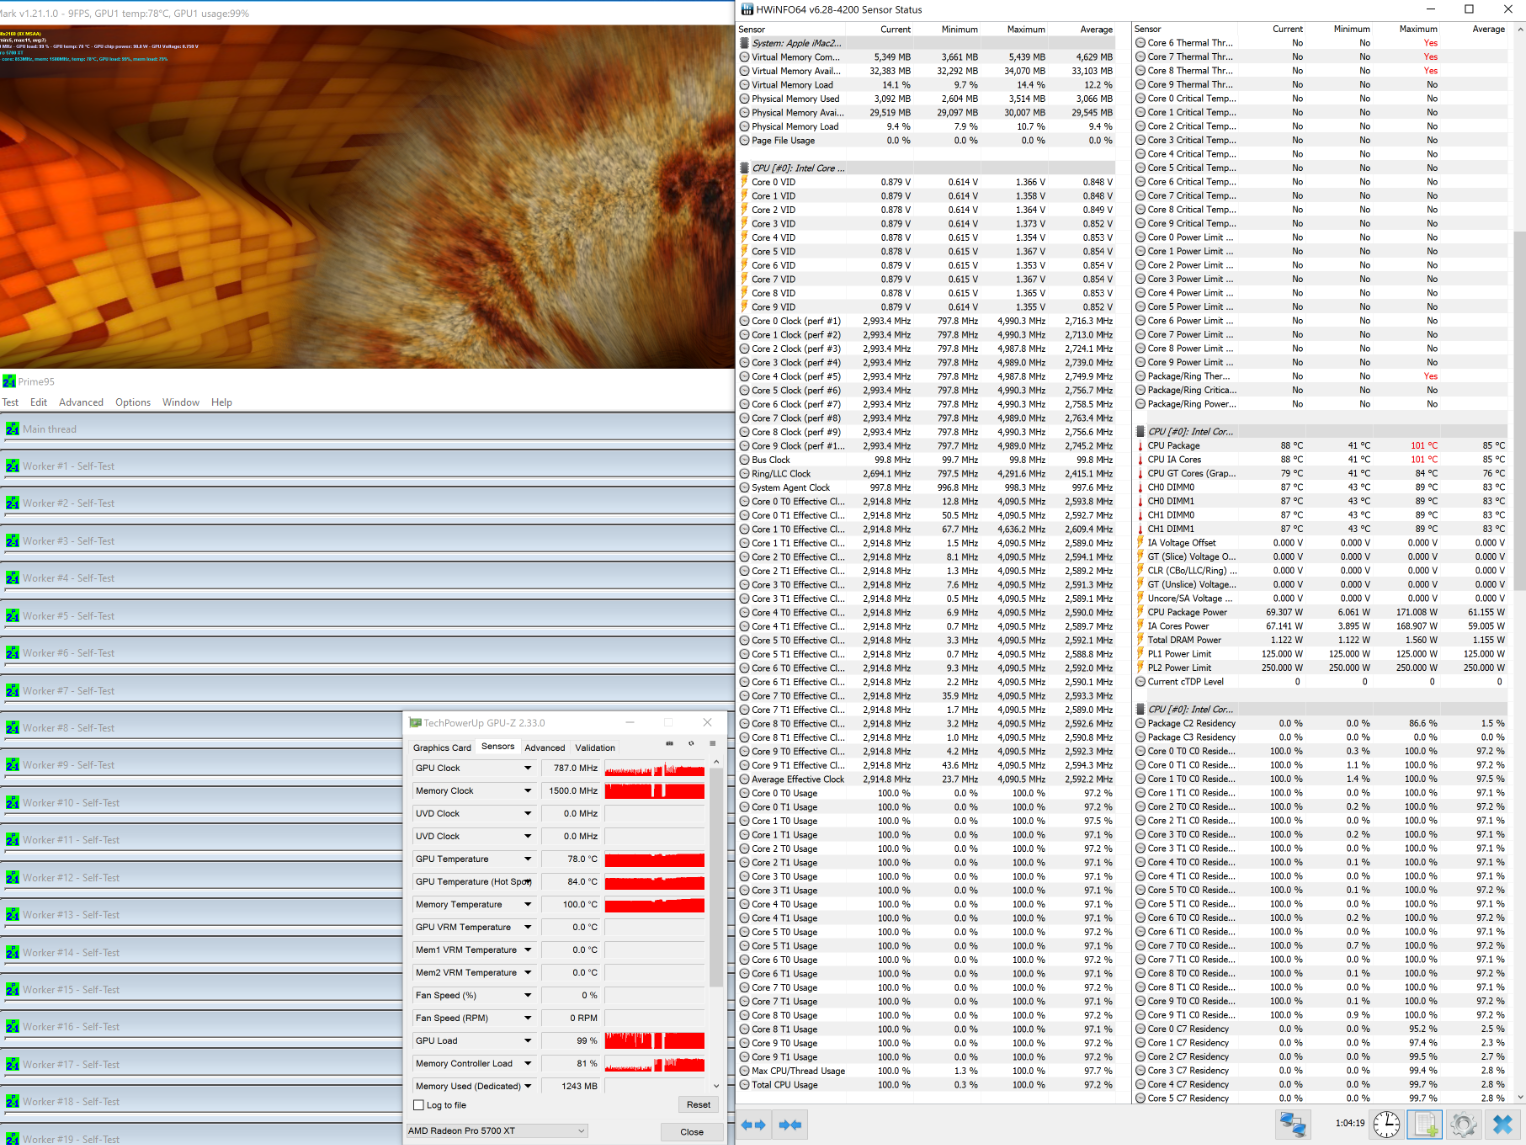
A look at the performance figures under load quickly shows that the performance utilization of the Core i9-10910 is not perfect and the cooling is insufficient. The performance is stable, but the power consumption levels off at around 115-120 W under sustained workloads, which corresponds with a clock of 4.0-4.1 GHz. We can record a maximum of 160 W at the beginning of the benchmarks.
The performance utilization of the Core i9 in the current iMac 27 is still decent and there is just a small drop under sustained workloads. Compared to the iMac Pro 2018 and especially the most powerful MacBook Pro 16, there is a significant performance advantage. So much about the current Intel situation, but then there is the problem with AMD CPUs. Even a 45 W processor like the Ryzen 7 4800H is not much slower, and AMD's desktop counterparts are just much faster. AMD also managed to improve the single-core performance noticeably with the brand-new models like the Ryzen 7 5800X and is now ahead of Intel in these scenarios as well. According to rumors, there will be an iMac with Apple's own silicon next year, and we are already curious to see what the performance will be like.
Cinebench R15: CPU Single 64Bit | CPU Multi 64Bit
Blender: v2.79 BMW27 CPU
7-Zip 18.03: 7z b 4 -mmt1 | 7z b 4
Geekbench 5.5: Single-Core | Multi-Core
HWBOT x265 Benchmark v2.2: 4k Preset
LibreOffice : 20 Documents To PDF
R Benchmark 2.5: Overall mean
| Cinebench R20 / CPU (Single Core) | |
| Average of class Desktop (674 - 902, n=14, last 2 years) | |
| AMD Ryzen 9 5900X | |
| AMD Ryzen 9 3950X | |
| Apple iMac 27 Mid 2020 | |
| Average Intel Core i9-10910 (n=1) | |
| Dell XPS 17 9700 Core i7 RTX 2060 Max-Q | |
| Schenker XMG Core 15 GK5NR0O | |
| Apple MacBook Pro 16 2019 i9 5500M | |
| Apple MacBook Pro 16 2019 i9 5500M | |
| Cinebench R20 / CPU (Multi Core) | |
| Average of class Desktop (5710 - 16722, n=14, last 2 years) | |
| AMD Ryzen 9 3950X | |
| AMD Ryzen 9 5900X | |
| Apple iMac 27 Mid 2020 | |
| Average Intel Core i9-10910 (n=1) | |
| Schenker XMG Core 15 GK5NR0O | |
| Apple MacBook Pro 16 2019 i9 5500M | |
| Apple MacBook Pro 16 2019 i9 5500M | |
| Dell XPS 17 9700 Core i7 RTX 2060 Max-Q | |
| Blender / v2.79 BMW27 CPU | |
| Lenovo ThinkPad X1 Extreme 2019 20QV000WGE | |
| Apple MacBook Pro 16 2019 i9 5500M | |
| Dell XPS 17 9700 Core i7 RTX 2060 Max-Q | |
| Schenker XMG Core 15 GK5NR0O | |
| Apple iMac 27 Mid 2020 | |
| Average Intel Core i9-10910 (n=1) | |
| AMD Ryzen 9 5900X | |
| AMD Ryzen 9 3950X | |
| Average of class Desktop (75 - 218, n=16, last 2 years) | |
| 7-Zip 18.03 / 7z b 4 -mmt1 | |
| Average of class Desktop (5092 - 8392, n=16, last 2 years) | |
| AMD Ryzen 9 5900X | |
| Apple iMac 27 Mid 2020 | |
| Average Intel Core i9-10910 (n=1) | |
| AMD Ryzen 9 3950X | |
| Dell XPS 17 9700 Core i7 RTX 2060 Max-Q | |
| Apple MacBook Pro 16 2019 i9 5500M | |
| Schenker XMG Core 15 GK5NR0O | |
| Lenovo ThinkPad X1 Extreme 2019 20QV000WGE | |
| 7-Zip 18.03 / 7z b 4 | |
| Average of class Desktop (54166 - 163125, n=16, last 2 years) | |
| AMD Ryzen 9 3950X | |
| AMD Ryzen 9 5900X | |
| Apple iMac 27 Mid 2020 | |
| Average Intel Core i9-10910 (n=1) | |
| Schenker XMG Core 15 GK5NR0O | |
| Dell XPS 17 9700 Core i7 RTX 2060 Max-Q | |
| Apple MacBook Pro 16 2019 i9 5500M | |
| Lenovo ThinkPad X1 Extreme 2019 20QV000WGE | |
| Geekbench 5.5 / Single-Core | |
| Average of class Desktop (1755 - 2559, n=29, last 2 years) | |
| AMD Ryzen 9 5900X | |
| Apple iMac 27 Mid 2020 | |
| Average Intel Core i9-10910 (n=1) | |
| AMD Ryzen 9 3950X | |
| Dell XPS 17 9700 Core i7 RTX 2060 Max-Q | |
| Schenker XMG Core 15 GK5NR0O | |
| Apple MacBook Pro 16 2019 i9 5500M | |
| Geekbench 5.5 / Multi-Core | |
| Average of class Desktop (12626 - 26186, n=29, last 2 years) | |
| AMD Ryzen 9 5900X | |
| AMD Ryzen 9 3950X | |
| Apple iMac 27 Mid 2020 | |
| Average Intel Core i9-10910 (n=1) | |
| Dell XPS 17 9700 Core i7 RTX 2060 Max-Q | |
| Apple MacBook Pro 16 2019 i9 5500M | |
| Schenker XMG Core 15 GK5NR0O | |
| HWBOT x265 Benchmark v2.2 / 4k Preset | |
| Average of class Desktop (18.6 - 48.5, n=14, last 2 years) | |
| AMD Ryzen 9 5900X | |
| Apple iMac 27 Mid 2020 | |
| Average Intel Core i9-10910 (n=1) | |
| AMD Ryzen 9 3950X | |
| Schenker XMG Core 15 GK5NR0O | |
| Dell XPS 17 9700 Core i7 RTX 2060 Max-Q | |
| Apple MacBook Pro 16 2019 i9 5500M | |
| Lenovo ThinkPad X1 Extreme 2019 20QV000WGE | |
| LibreOffice / 20 Documents To PDF | |
| Apple iMac 27 Mid 2020 | |
| Average Intel Core i9-10910 (n=1) | |
| Schenker XMG Core 15 GK5NR0O | |
| Apple MacBook Pro 16 2019 i9 5500M | |
| Apple MacBook Pro 16 2019 i9 5500M | |
| AMD Ryzen 9 3950X | |
| AMD Ryzen 9 5900X | |
| Dell XPS 17 9700 Core i7 RTX 2060 Max-Q | |
| Average of class Desktop (35.5 - 79.2, n=15, last 2 years) | |
| R Benchmark 2.5 / Overall mean | |
| Apple MacBook Pro 16 2019 i9 5500M | |
| Apple MacBook Pro 16 2019 i9 5500M | |
| Dell XPS 17 9700 Core i7 RTX 2060 Max-Q | |
| Schenker XMG Core 15 GK5NR0O | |
| Apple iMac 27 Mid 2020 | |
| Average Intel Core i9-10910 (n=1) | |
| AMD Ryzen 9 3950X | |
| AMD Ryzen 9 5900X | |
| Average of class Desktop (0.3307 - 0.4909, n=15, last 2 years) | |
* ... smaller is better
System Performance - iMac with fast SSD and plenty of RAM
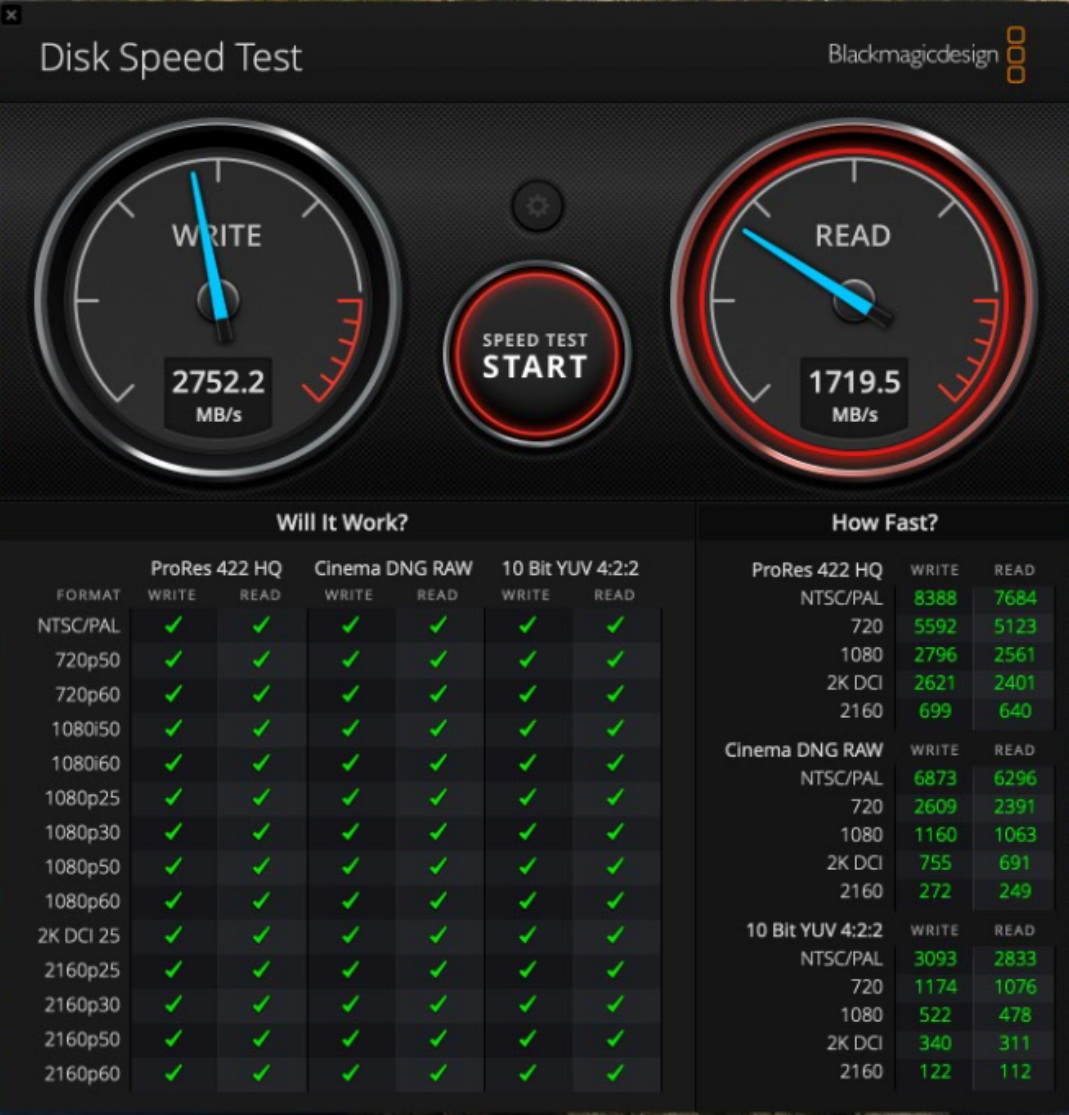
Thanks to the powerful components and especially the fast PCIe-SSD, the iMac is a very responsive system, and we did not notice any problems during our review period. Windows 10 also works very well when you run Windows 10 via BootCamp and it is a good choice when you want (or have to) use applications that are not available for Apple's operating system. The results in the synthetic benchmarks (PCMark) are also very good, so there do not seem to be any limitations caused by the BootCamp drivers.
The iMac 27 is only available with SSDs, but a storage capacity of 256 GB for the base model (more than 2000 Euros, ~$2,365) is not much. However, you can get up to 8 TB SSD storage, even though the prices are extremely high at about ~3000 Euros (~$3,548) for the jump from 512 GB to 8 TB.
Note: The smaller iMac with the 21.5-inch screen is also shipped with a small 256 GB SSD by default, but there is still the option for a 1 TB FusionDrive, which is a combination of SSD cache and HDD storage. We cannot recommend this option, because the subjective system performance can be much worse in certain situations.
| PCMark 8 Home Score Accelerated v2 | 4946 points | |
| PCMark 8 Creative Score Accelerated v2 | 8396 points | |
| PCMark 8 Work Score Accelerated v2 | 4550 points | |
| PCMark 10 Score | 5859 points | |
Help | ||

DiskSpd Read Loop, Queue Depth 8
GPU Performance - AMD Radeon RX 5700 XT
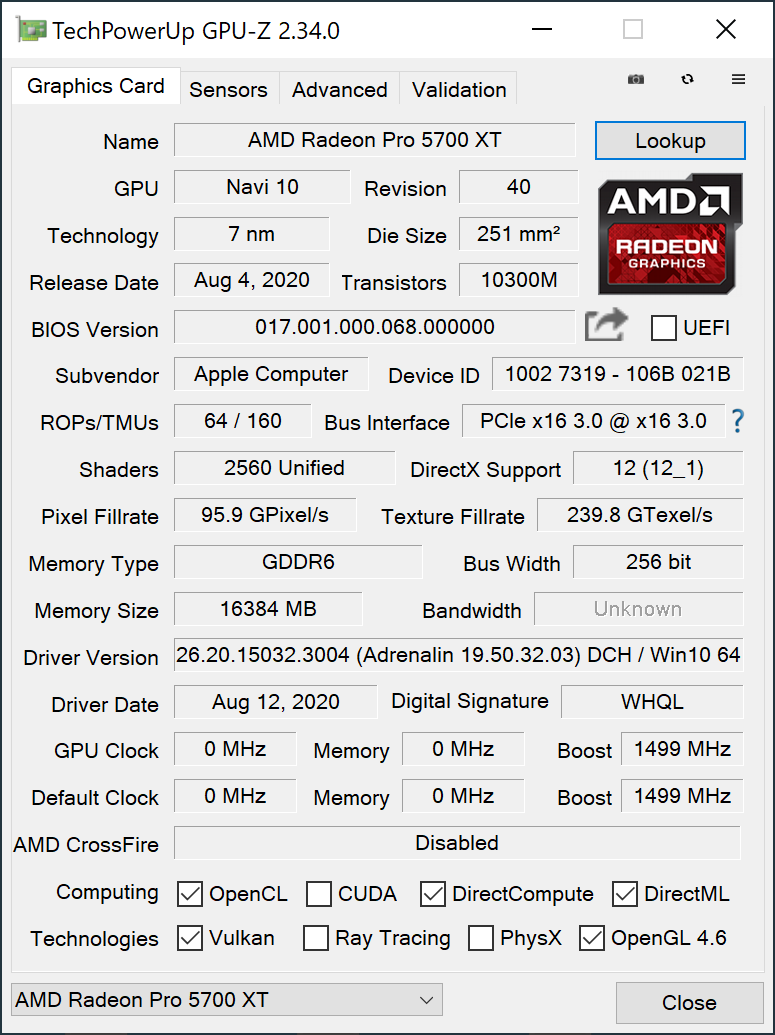
The AMD Radeon RX 5700 XT is an upper mainstream desktop graphics card, but the core clock is much lower compared to other versions of the RX 5700 XT and the iMac also falls behind in the benchmarks. Similar to the processor, we suspect that there is a limitation of the power consumption, and the graphics drivers might have an impact as well.
The old Radeon Pro Vega 56 of the 2018 iMac Pro is just beaten, and the current MacBook Pro 16 is much slower. Depending on the benchmarks, the performance sits between the Nvidia GeForce RTX 2060 Mobile and the RTX 2070 Mobile.
| 3DMark 11 - 1280x720 Performance GPU | |
| Average of class Desktop (3175 - 130697, n=35, last 2 years) | |
| Nvidia GeForce RTX 2070 Super | |
| Average AMD Radeon RX 5700 XT (Desktop) (27697 - 36522, n=6) | |
| Apple iMac 27 Mid 2020 | |
| Asus ROG Strix G15 G512LW | |
| Apple iMac Pro | |
| Schenker XMG Core 15 GK5NR0O | |
| Dell XPS 17 9700 Core i7 RTX 2060 Max-Q | |
| Apple MacBook Pro 16 2019 i9 5500M | |
| 3DMark | |
| 1280x720 Cloud Gate Standard Graphics | |
| Average of class Desktop (13814 - 401257, n=27, last 2 years) | |
| Average AMD Radeon RX 5700 XT (Desktop) (115246 - 154025, n=6) | |
| Nvidia GeForce RTX 2070 Super | |
| Asus ROG Strix G15 G512LW | |
| Apple MacBook Pro 16 2019 i9 5500M | |
| Schenker XMG Core 15 GK5NR0O | |
| Dell XPS 17 9700 Core i7 RTX 2060 Max-Q | |
| 1920x1080 Fire Strike Graphics | |
| Average of class Desktop (2192 - 108886, n=48, last 2 years) | |
| Average AMD Radeon RX 5700 XT (Desktop) (19850 - 27164, n=7) | |
| Nvidia GeForce RTX 2070 Super | |
| Asus ROG Strix G15 G512LW | |
| Apple iMac 27 Mid 2020 | |
| Apple iMac Pro | |
| Schenker XMG Core 15 GK5NR0O | |
| Dell XPS 17 9700 Core i7 RTX 2060 Max-Q | |
| Apple MacBook Pro 16 2019 i9 5500M | |
| 2560x1440 Time Spy Graphics | |
| Average of class Desktop (636 - 49144, n=47, last 2 years) | |
| Nvidia GeForce RTX 2070 Super | |
| Average AMD Radeon RX 5700 XT (Desktop) (6050 - 9371, n=7) | |
| Asus ROG Strix G15 G512LW | |
| Apple iMac 27 Mid 2020 | |
| Schenker XMG Core 15 GK5NR0O | |
| Apple iMac Pro | |
| Dell XPS 17 9700 Core i7 RTX 2060 Max-Q | |
| Apple MacBook Pro 16 2019 i9 5500M | |
| 3DMark 11 Performance | 24377 points | |
| 3DMark Fire Strike Score | 17390 points | |
| 3DMark Time Spy Score | 6525 points | |
Help | ||
Gaming Performance
The gaming performance of the iMac is decent. We tried multiple titles running Windows 10, and 1080p with the maximum settings is no problem at all. Many titles even run smoothly in our 4K setting. There were some warning messages about the driver version, but the games still ran without a problem (like Doom Eternal or Horizon: Zero Dawn).
| low | med. | high | ultra | QHD | 4K | |
|---|---|---|---|---|---|---|
| The Witcher 3 (2015) | 331 | 130 | 71.6 | 44 | ||
| Dota 2 Reborn (2015) | 105 | 107 | 98.5 | 103 | 78.4 | |
| Rise of the Tomb Raider (2016) | 272 | 118 | 96 | 48 | ||
| X-Plane 11.11 (2018) | 79.2 | 65.6 | 55.7 | 41.5 | ||
| Far Cry 5 (2018) | 126 | 106 | 100 | 95 | 76 | 40 |
| Shadow of the Tomb Raider (2018) | 158 | 114 | 105 | 89 | 61 | 32 |
| The Division 2 (2019) | 119 | 98 | 69 | 49 | 26 | |
| GRID 2019 (2019) | 216 | 135 | 110 | 80 | 74 | 44 |
| Doom Eternal (2020) | 265 | 167 | 149 | 143 | 111 | 58 |
| Gears Tactics (2020) | 242 | 154 | 107 | 78.7 | 45.7 | 24.2 |
| F1 2020 (2020) | 283 | 214 | 169 | 108 | 80 | 47 |
| Horizon Zero Dawn (2020) | 160 | 107 | 89 | 67 | 48 | 25 |
Emissions - Pulsating fans under load
System Noise
The two fans run all the time, but the quiet murmur while idling is only audible in a very quiet environment. However, the fans will quickly ramp up under load and we measured the maximum 43.6 dB(A) in combined CPU and GPU workloads in macOS. The fan speed is increases seamlessly, so it depends how long the load period is. We measured the maximum noise after around 1.5 minutes. We also noticed that the fan noise fluctuates between ~38 and the maximum 43.6 dB(A) (also macOS), which can be annoying. We did not notice any other electronic noises.
Noise level
| Idle |
| 29.7 / 29.7 / 29.7 dB(A) |
| Load |
| 35 / 43.6 dB(A) |
 | ||
30 dB silent 40 dB(A) audible 50 dB(A) loud |
||
min: | ||
Temperature
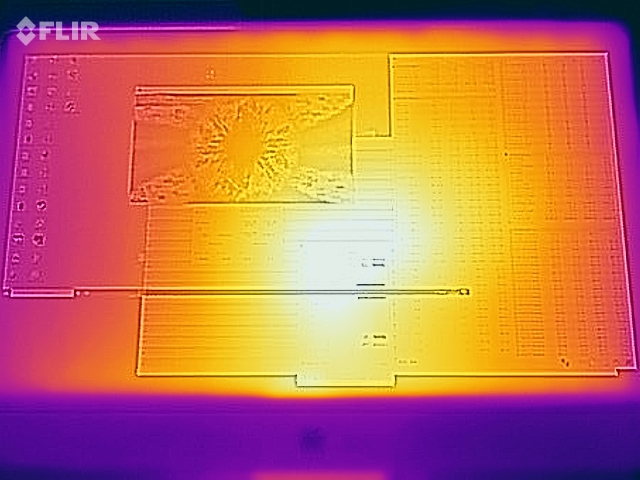
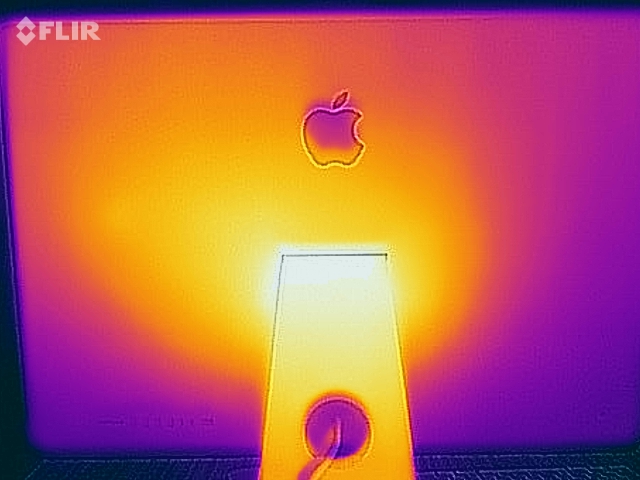
The surface temperatures are obviously not that important on a desktop system compared to a laptop, and the temperatures we measured are completely okay.
However, the performance utilization in the stress test is not particularly good, because the processor only runs at about 65 Watts (10x 3.0 GHz), which is significantly below the TDP recommendation of 125 W. The graphics card also runs at about 50% of the maximum clock. All in all, this shows that the cooling solution of the iMac 27 is insufficient for the components.
(+) The maximum temperature on the upper side is 39.9 °C / 104 F, compared to the average of 33.9 °C / 93 F, ranging from 25 to 47 °C for the class Desktop.
(-) The bottom heats up to a maximum of 50.1 °C / 122 F, compared to the average of 33.6 °C / 92 F
(+) In idle usage, the average temperature for the upper side is 24.8 °C / 77 F, compared to the device average of 29.5 °C / 85 F.
Speakers
Apple iMac 27 Mid 2020 audio analysis
(+) | speakers can play relatively loud (82.9 dB)
Bass 100 - 315 Hz
(+) | good bass - only 2.6% away from median
(+) | bass is linear (4.2% delta to prev. frequency)
Mids 400 - 2000 Hz
(+) | balanced mids - only 1.7% away from median
(+) | mids are linear (5% delta to prev. frequency)
Highs 2 - 16 kHz
(±) | reduced highs - on average 7.3% lower than median
(+) | highs are linear (5.1% delta to prev. frequency)
Overall 100 - 16.000 Hz
(+) | overall sound is linear (8.7% difference to median)
Compared to same class
» 22% of all tested devices in this class were better, 11% similar, 67% worse
» The best had a delta of 6%, average was 16%, worst was 46%
Compared to all devices tested
» 2% of all tested devices were better, 1% similar, 97% worse
» The best had a delta of 4%, average was 24%, worst was 134%
Apple MacBook Pro 16 2019 i9 5500M audio analysis
(+) | speakers can play relatively loud (82.3 dB)
Bass 100 - 315 Hz
(+) | good bass - only 2.3% away from median
(+) | bass is linear (5% delta to prev. frequency)
Mids 400 - 2000 Hz
(+) | balanced mids - only 2.7% away from median
(+) | mids are linear (3.4% delta to prev. frequency)
Highs 2 - 16 kHz
(+) | balanced highs - only 2.1% away from median
(+) | highs are linear (2.6% delta to prev. frequency)
Overall 100 - 16.000 Hz
(+) | overall sound is linear (6.9% difference to median)
Compared to same class
» 4% of all tested devices in this class were better, 1% similar, 95% worse
» The best had a delta of 5%, average was 17%, worst was 45%
Compared to all devices tested
» 1% of all tested devices were better, 0% similar, 99% worse
» The best had a delta of 4%, average was 24%, worst was 134%
Energy Management
Power Consumption
The consumption values are very similar to the old iMac 27 and lower compared to the iMac Pro. We measure a peak consumption of around 350 Watts under load, but it quickly levels off at around 250 Watts. We want to mention the extremely low consumption when the iMac is in stand-by or turned off. The iMac also performs much better than many compact notebooks in this respect.
| Off / Standby | |
| Idle | |
| Load |
|
Key:
min: | |
| Apple iMac 27 Mid 2020 i9-10910, Radeon RX 5700 XT (Desktop), Apple SSD AP1024, IPS, 5120x2880, 27" | Apple iMac Pro W-2145, Pro Vega 56, , , 5120x2880, 27" | Apple iMac Retina 5K 27 Late 2015 3.2 GHz M390 MK472D/A 6500, Radeon R9 M390, Apple Fusion Drive 1TB (24 GB SSD + 1 TB HDD), , 5120x2880, 27" | Average AMD Radeon RX 5700 XT (Desktop) | Average of class Desktop | |
|---|---|---|---|---|---|
| Power Consumption | -37% | 11% | 0% | 43% | |
| Idle Minimum * (Watt) | 27.6 | 49.5 -79% | 29.5 -7% | 27.6 ? -0% | 17.9 ? 35% |
| Idle Average * (Watt) | 64.7 | 86.7 -34% | 59.2 9% | 64.7 ? -0% | 37.2 ? 43% |
| Idle Maximum * (Watt) | 65.3 | 88.9 -36% | 68 -4% | 65.3 ? -0% | 41.3 ? 37% |
| Load Average * (Watt) | 162 | 150.1 7% | 126 22% | 162 ? -0% | 96.7 ? 40% |
| Witcher 3 ultra * (Watt) | 247 | ||||
| Load Maximum * (Watt) | 354 | 508.5 -44% | 231 35% | 354 ? -0% | 141.6 ? 60% |
* ... smaller is better
Pros
Cons
Verdict - Good desktop with a high price tag
Apple's iMac 27 is still a good all-in-one system and offers a great 5K screen and design. The integrated speakers are also excellent and many users won't need additional external speakers.
The problems start when we look at the performance of the components. Neither the CPU nor the GPU can utilize their full performance potential due to the limited cooling performance. Considering this, the optional components are not really worth it. The CPU comparison with current AMD models is another problem because they just offer much more performance. We are also not happy with the pulsating fans under combined workloads.
The iMac 27 is still a good all-in-one system in 2020, but you have to be careful with the components you select. The performance utilization of the optional components is not great.
Then there is the new nano-texture glass. Yes, the matte surface works well and the picture quality is just marginally worse compared to the glossy models, but the additional price is steep at more than 600 Euros (~$709). If you are interested in an iMac, you should save the money for the optional processors and graphics card and get more storage or RAM instead.
Apple iMac 27 Mid 2020
- 11/09/2020 v7 (old)
Andreas Osthoff
Price comparison
