Apple iMac 24 M1 2021 in review: Does Apple's M1 SoC also convince in the desktop?
Possible competitors in comparison
Rating | Date | Model | Weight | Height | Size | Resolution | Price |
|---|---|---|---|---|---|---|---|
| 85.4 % v7 (old) | 10 / 2021 | Apple iMac 24 M1 2021 M1, M1 8-Core GPU | 4.4 kg | 461 mm | 23.50" | 4480x2520 | |
| 86.4 % v7 (old) | 11 / 2020 | Apple iMac 27 Mid 2020 i9-10910, Radeon RX 5700 XT (Desktop) | 8.9 kg | 203 mm | 27.00" | 5120x2880 | |
| 86.8 % v6 (old) | 07 / 2018 | Apple iMac Pro W-2145, Pro Vega 56 | 9.8 kg | 516 mm | 27.00" | 5120x2880 |
Case, equipment and input devices
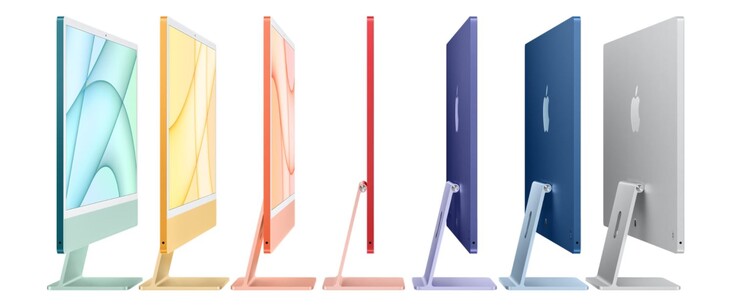
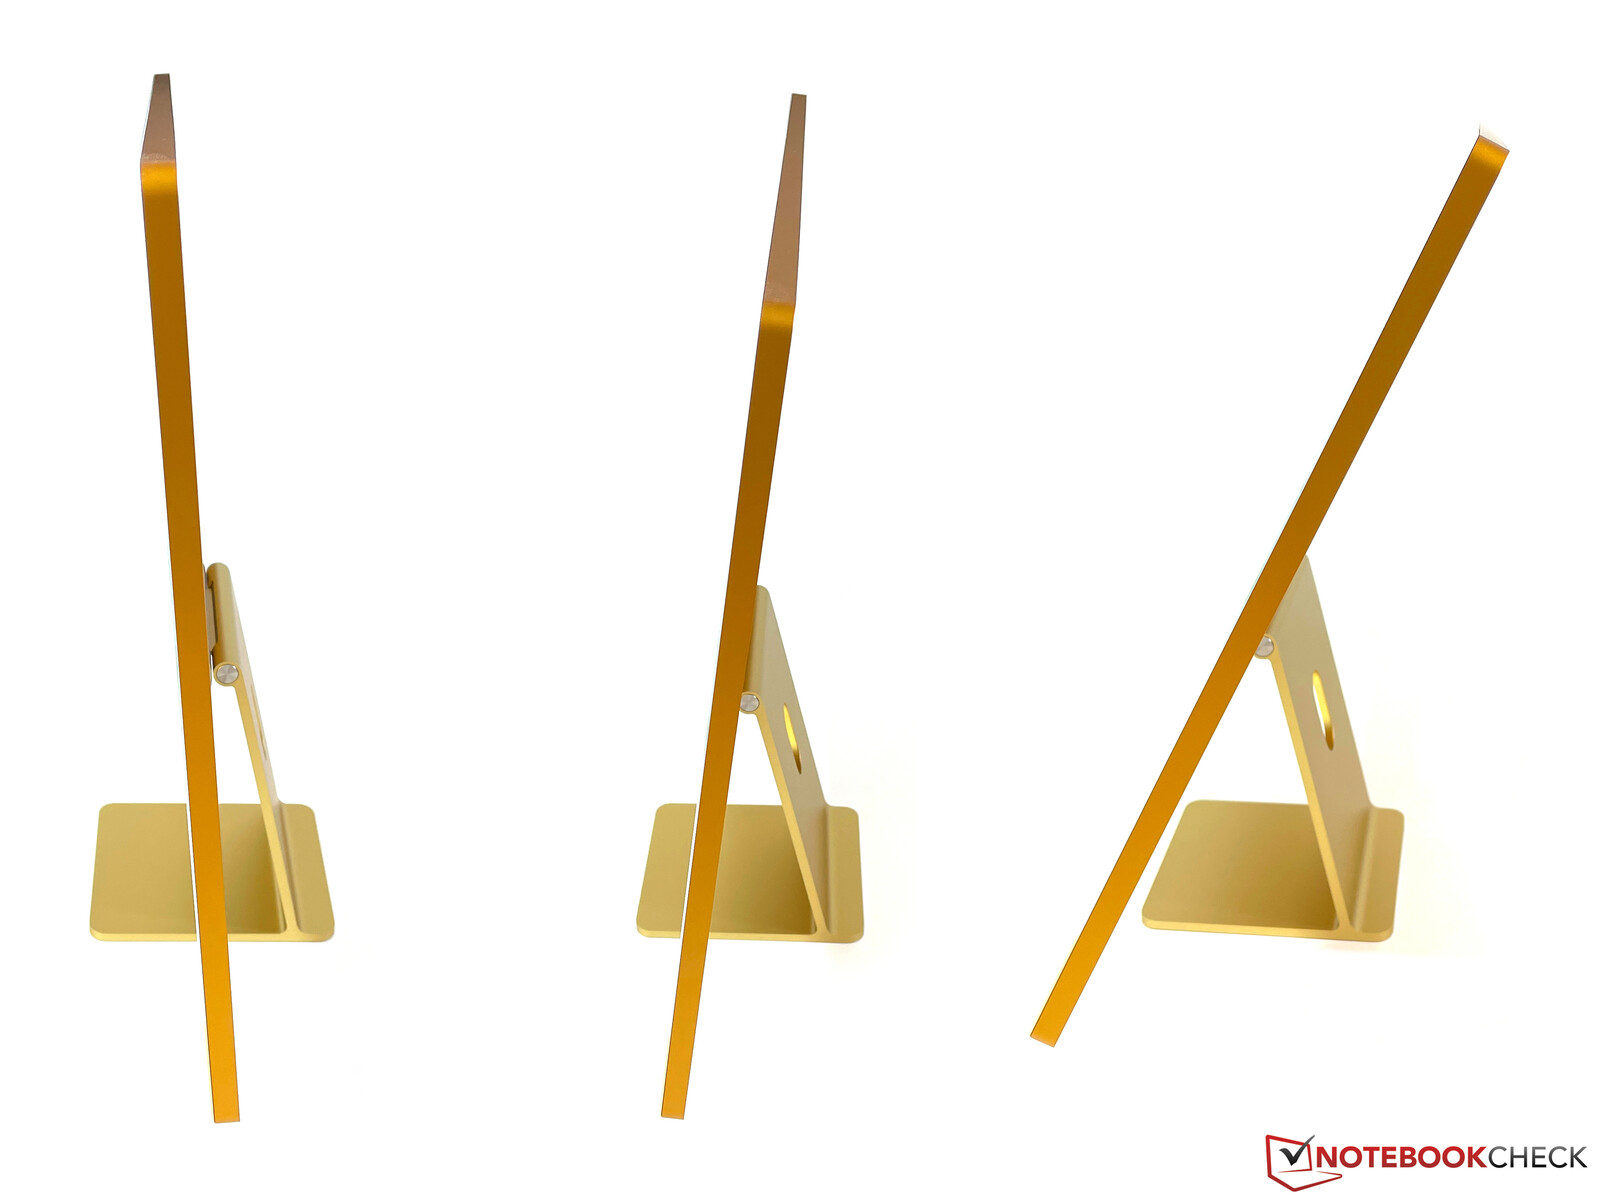
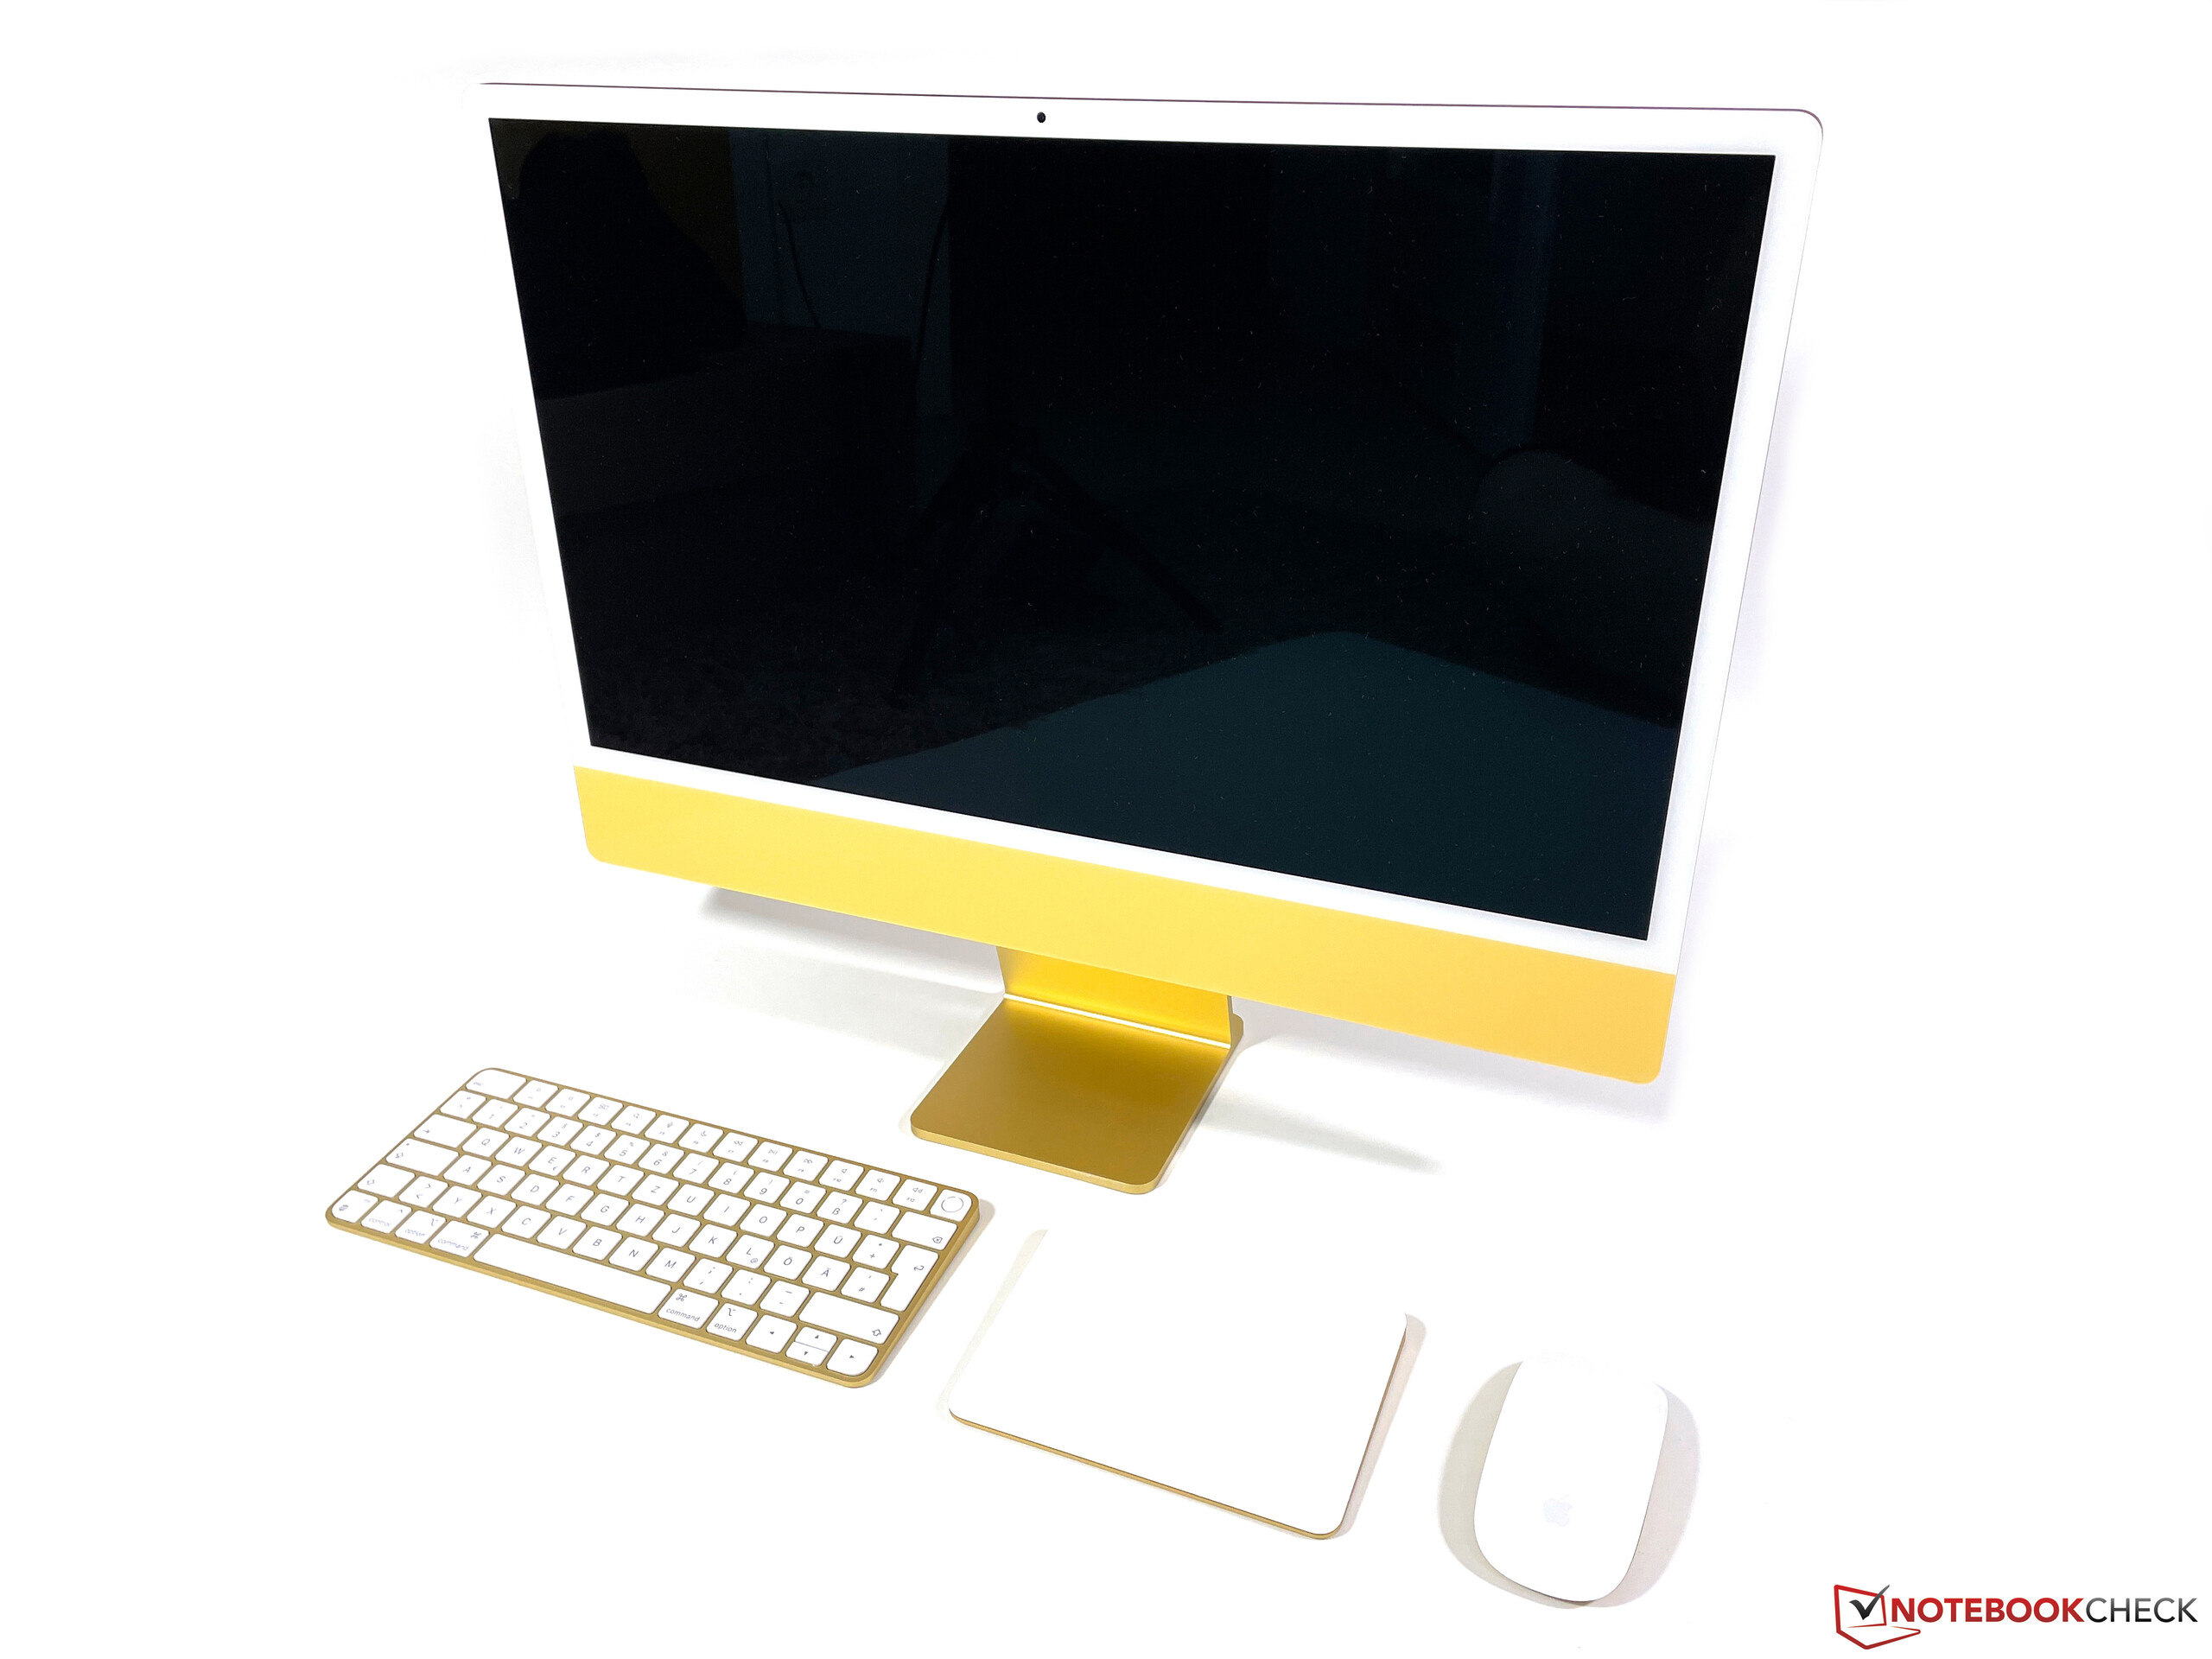
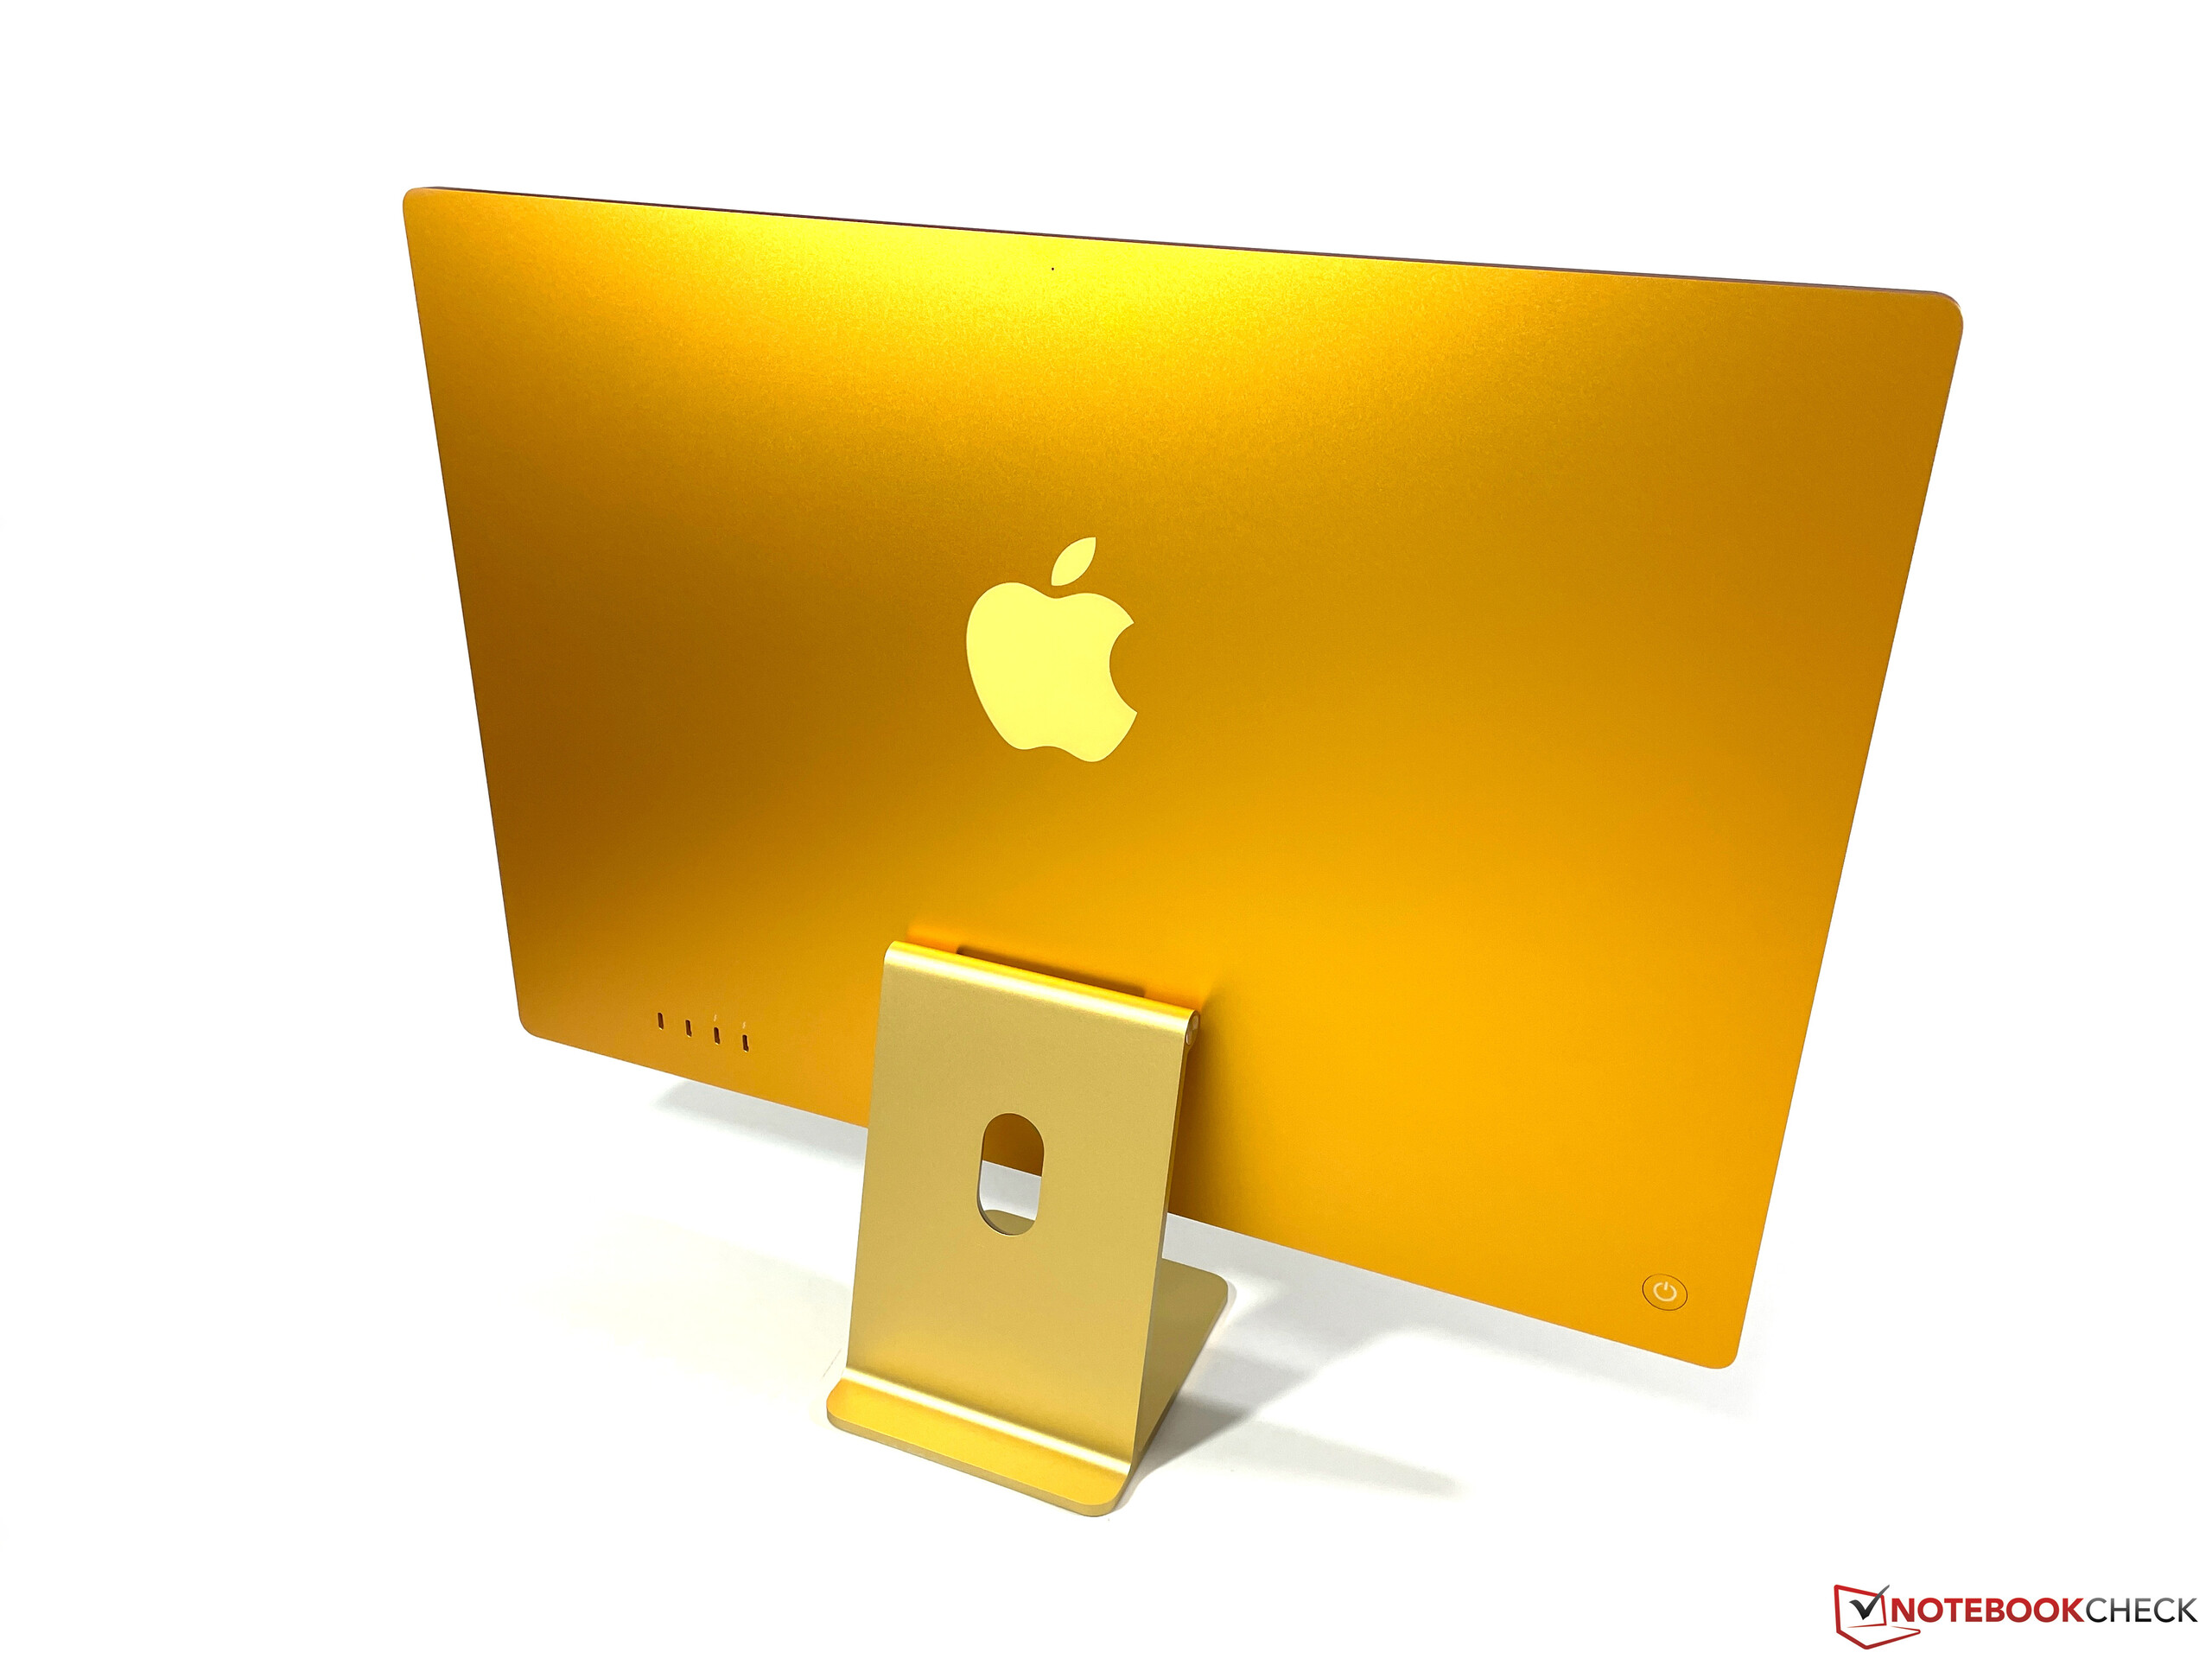
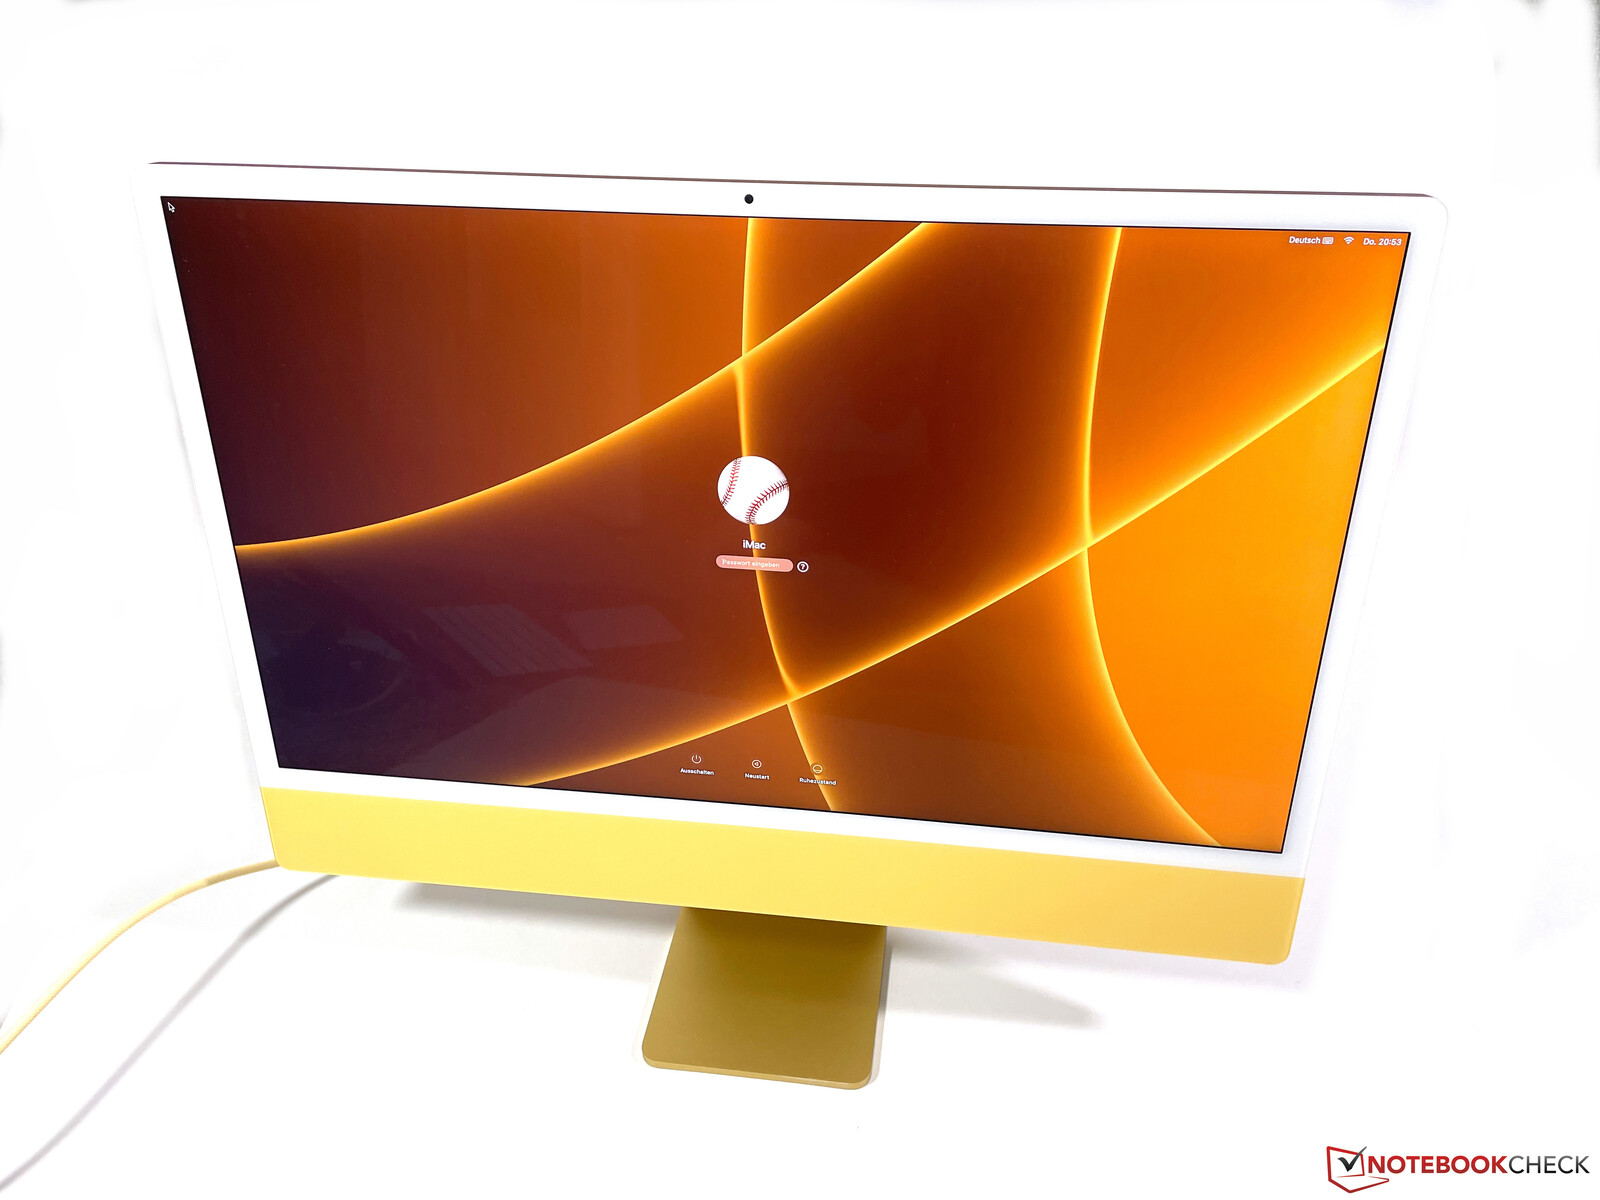
The case of the iMac differs from its predecessors. The thickness of the case is now the same in all places (previously very bulbous), but the use of plastic underneath the display means that the all-in-one no longer looks as high-quality. The width of the lower bezel also does not look particularly modern; more would certainly have been possible here. However, the build quality is still excellent and does not give reason for criticism. The built-in stand does not allow for height adjustment, only the tilt angle can be adjusted slightly. The iMac is also available as a version with an integrated VESA adapter (~50 Euros/~$58 surcharge), but there is no stand included and it cannot be retrofitted. Our test device in yellow looks very good, although every taste should find a suitable color here.
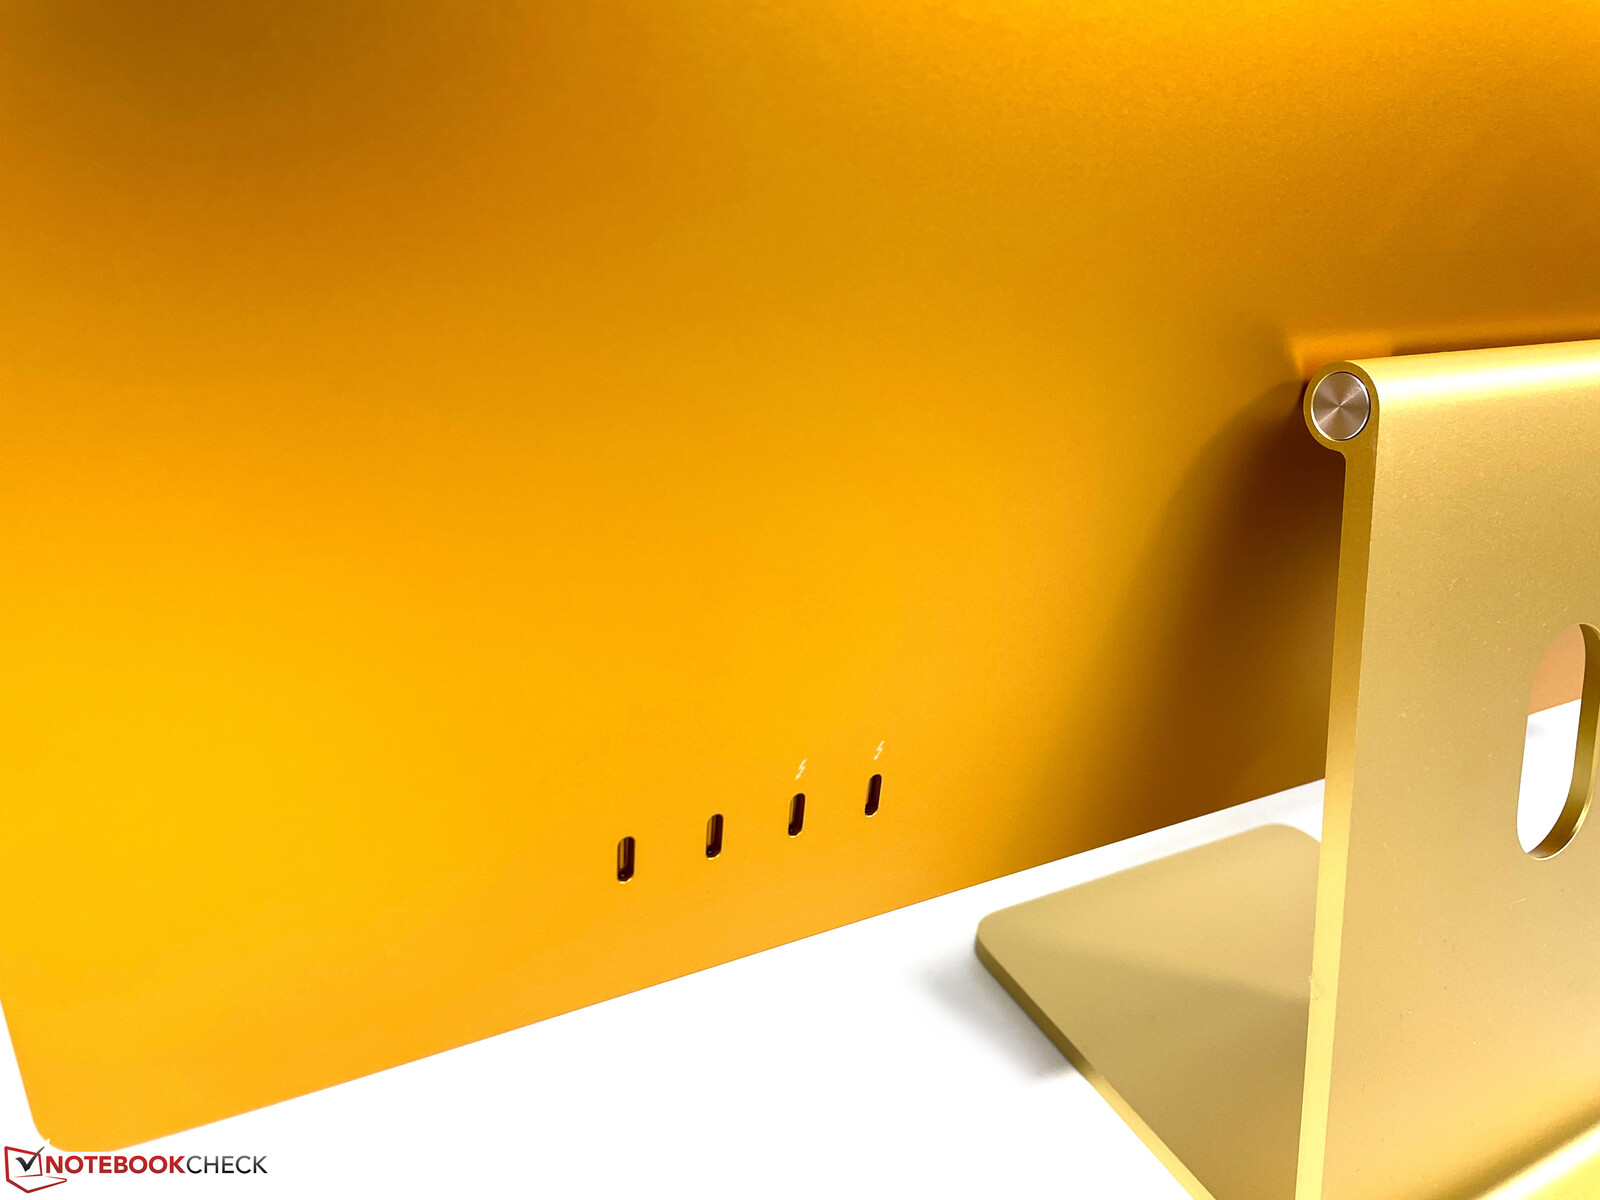
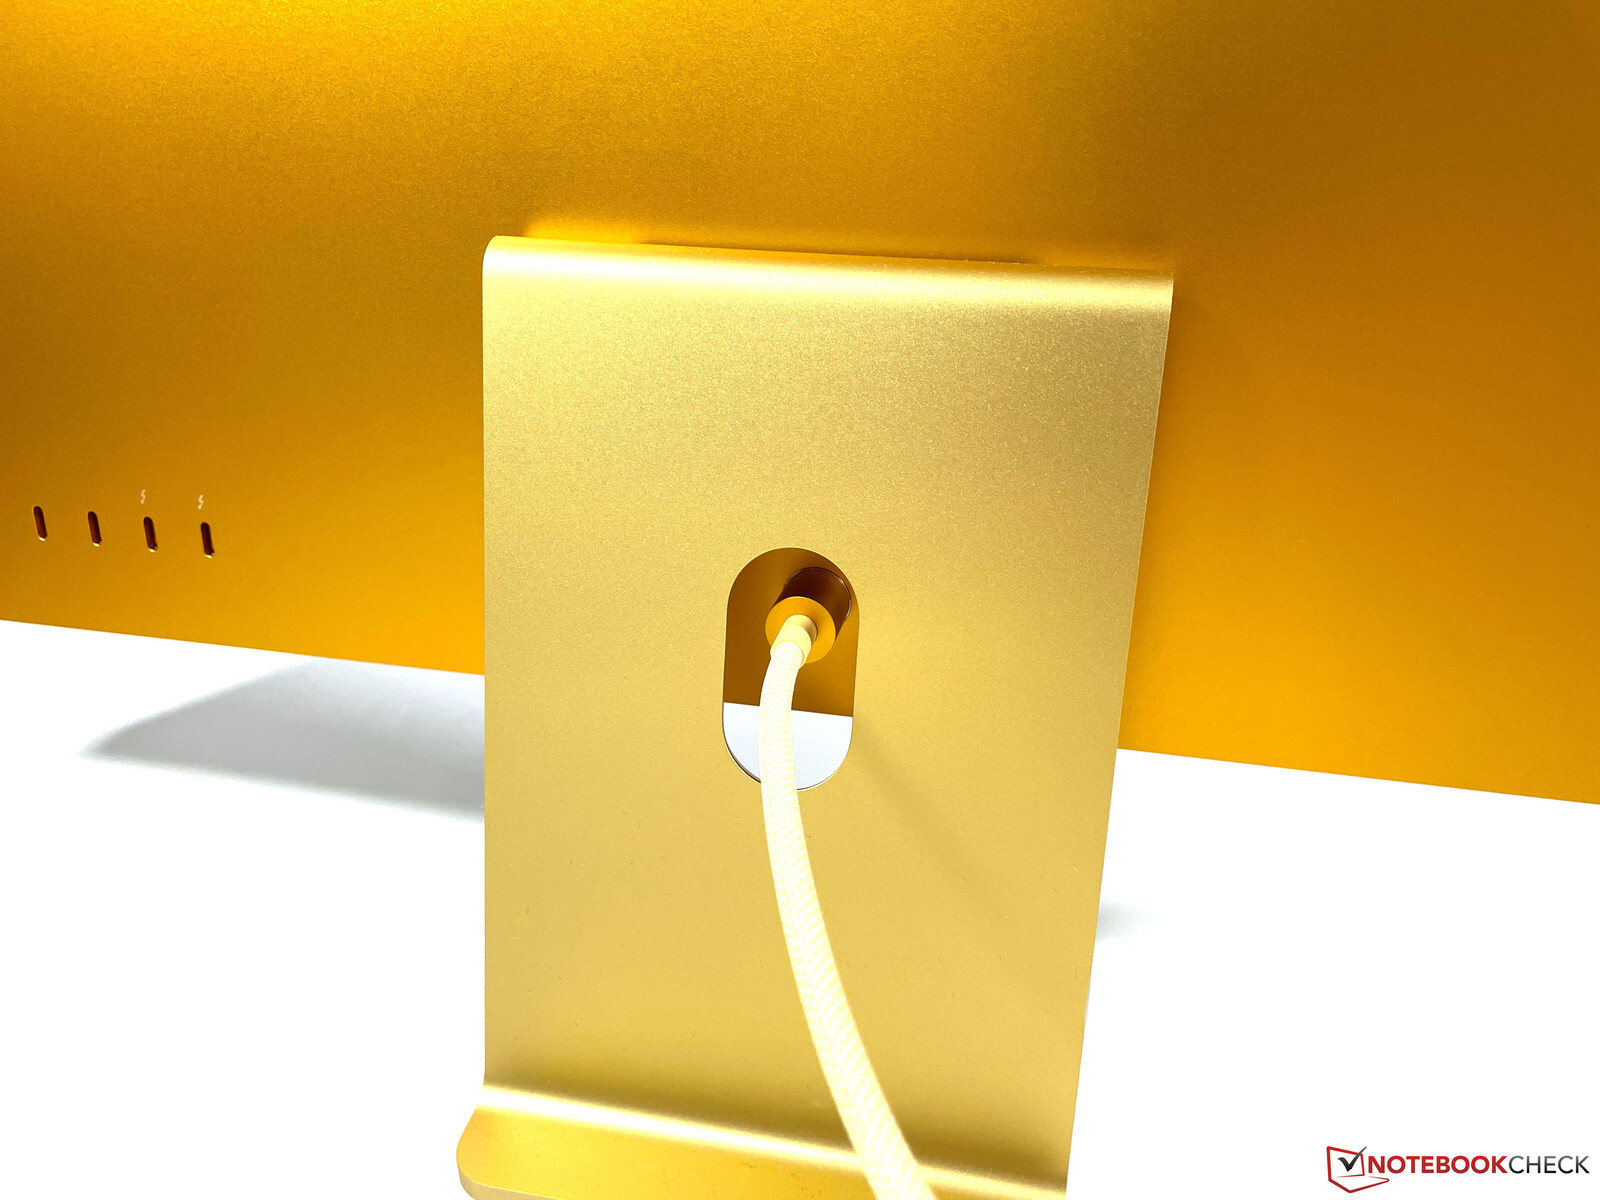
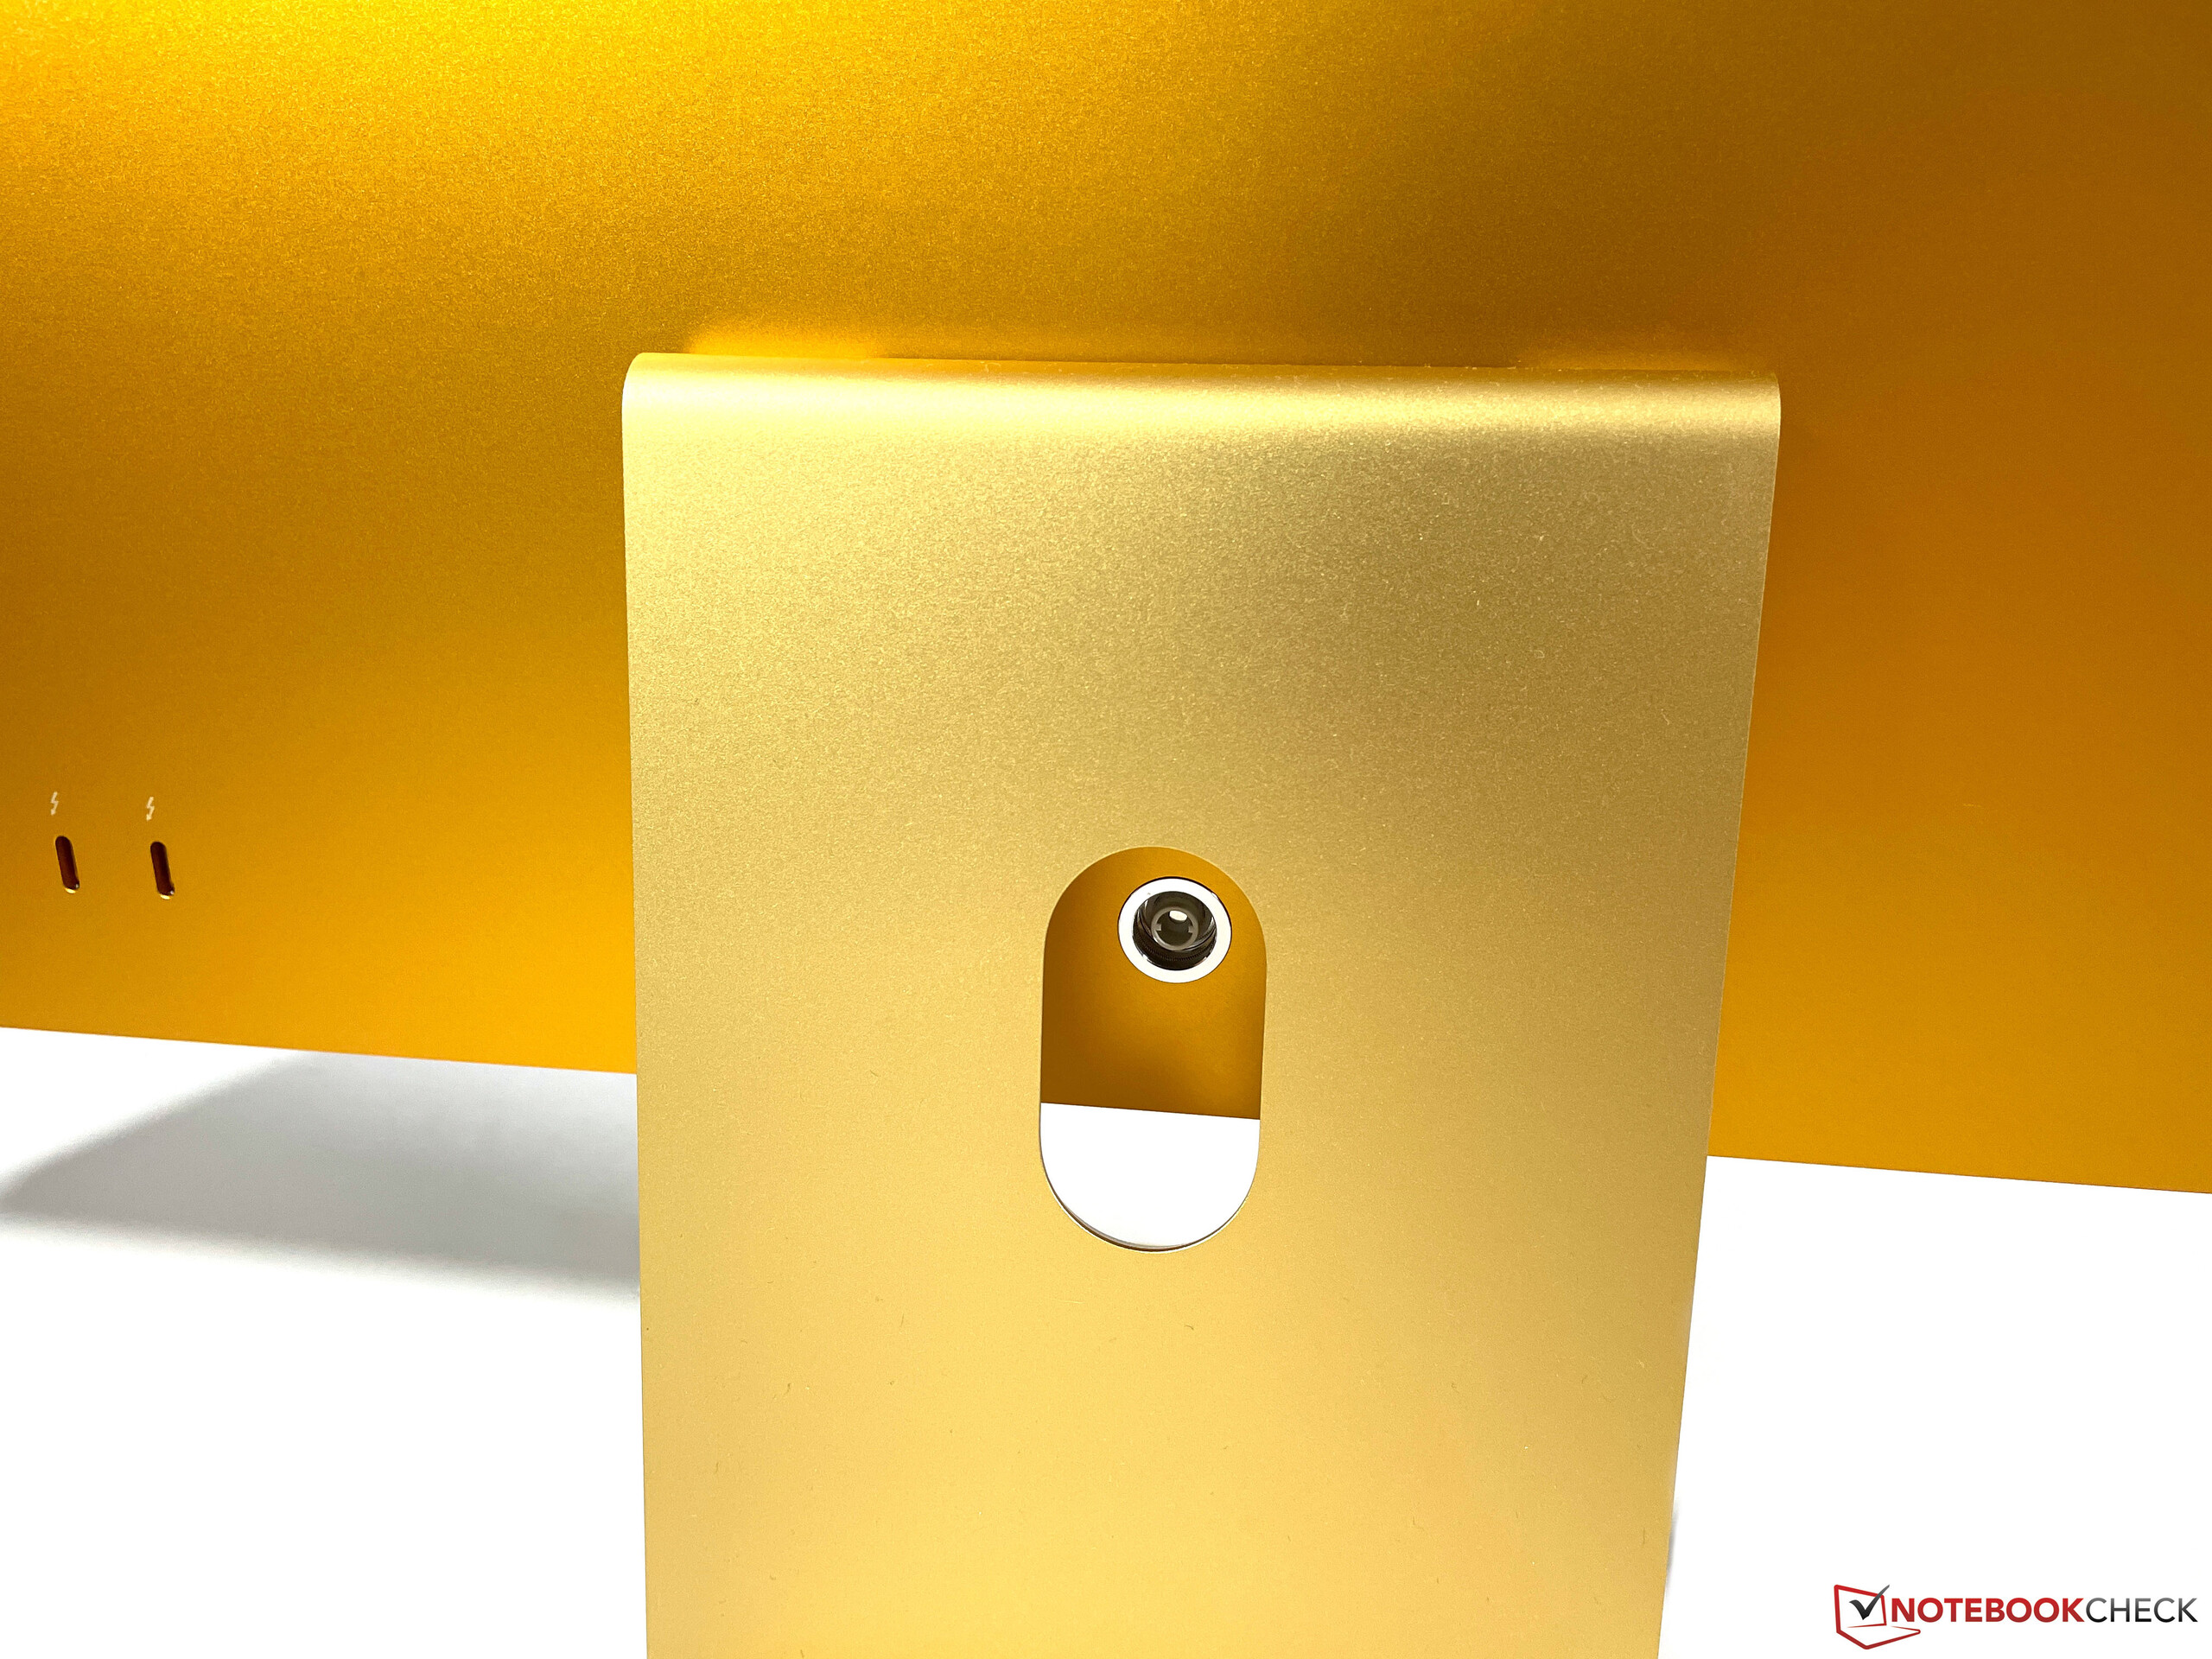
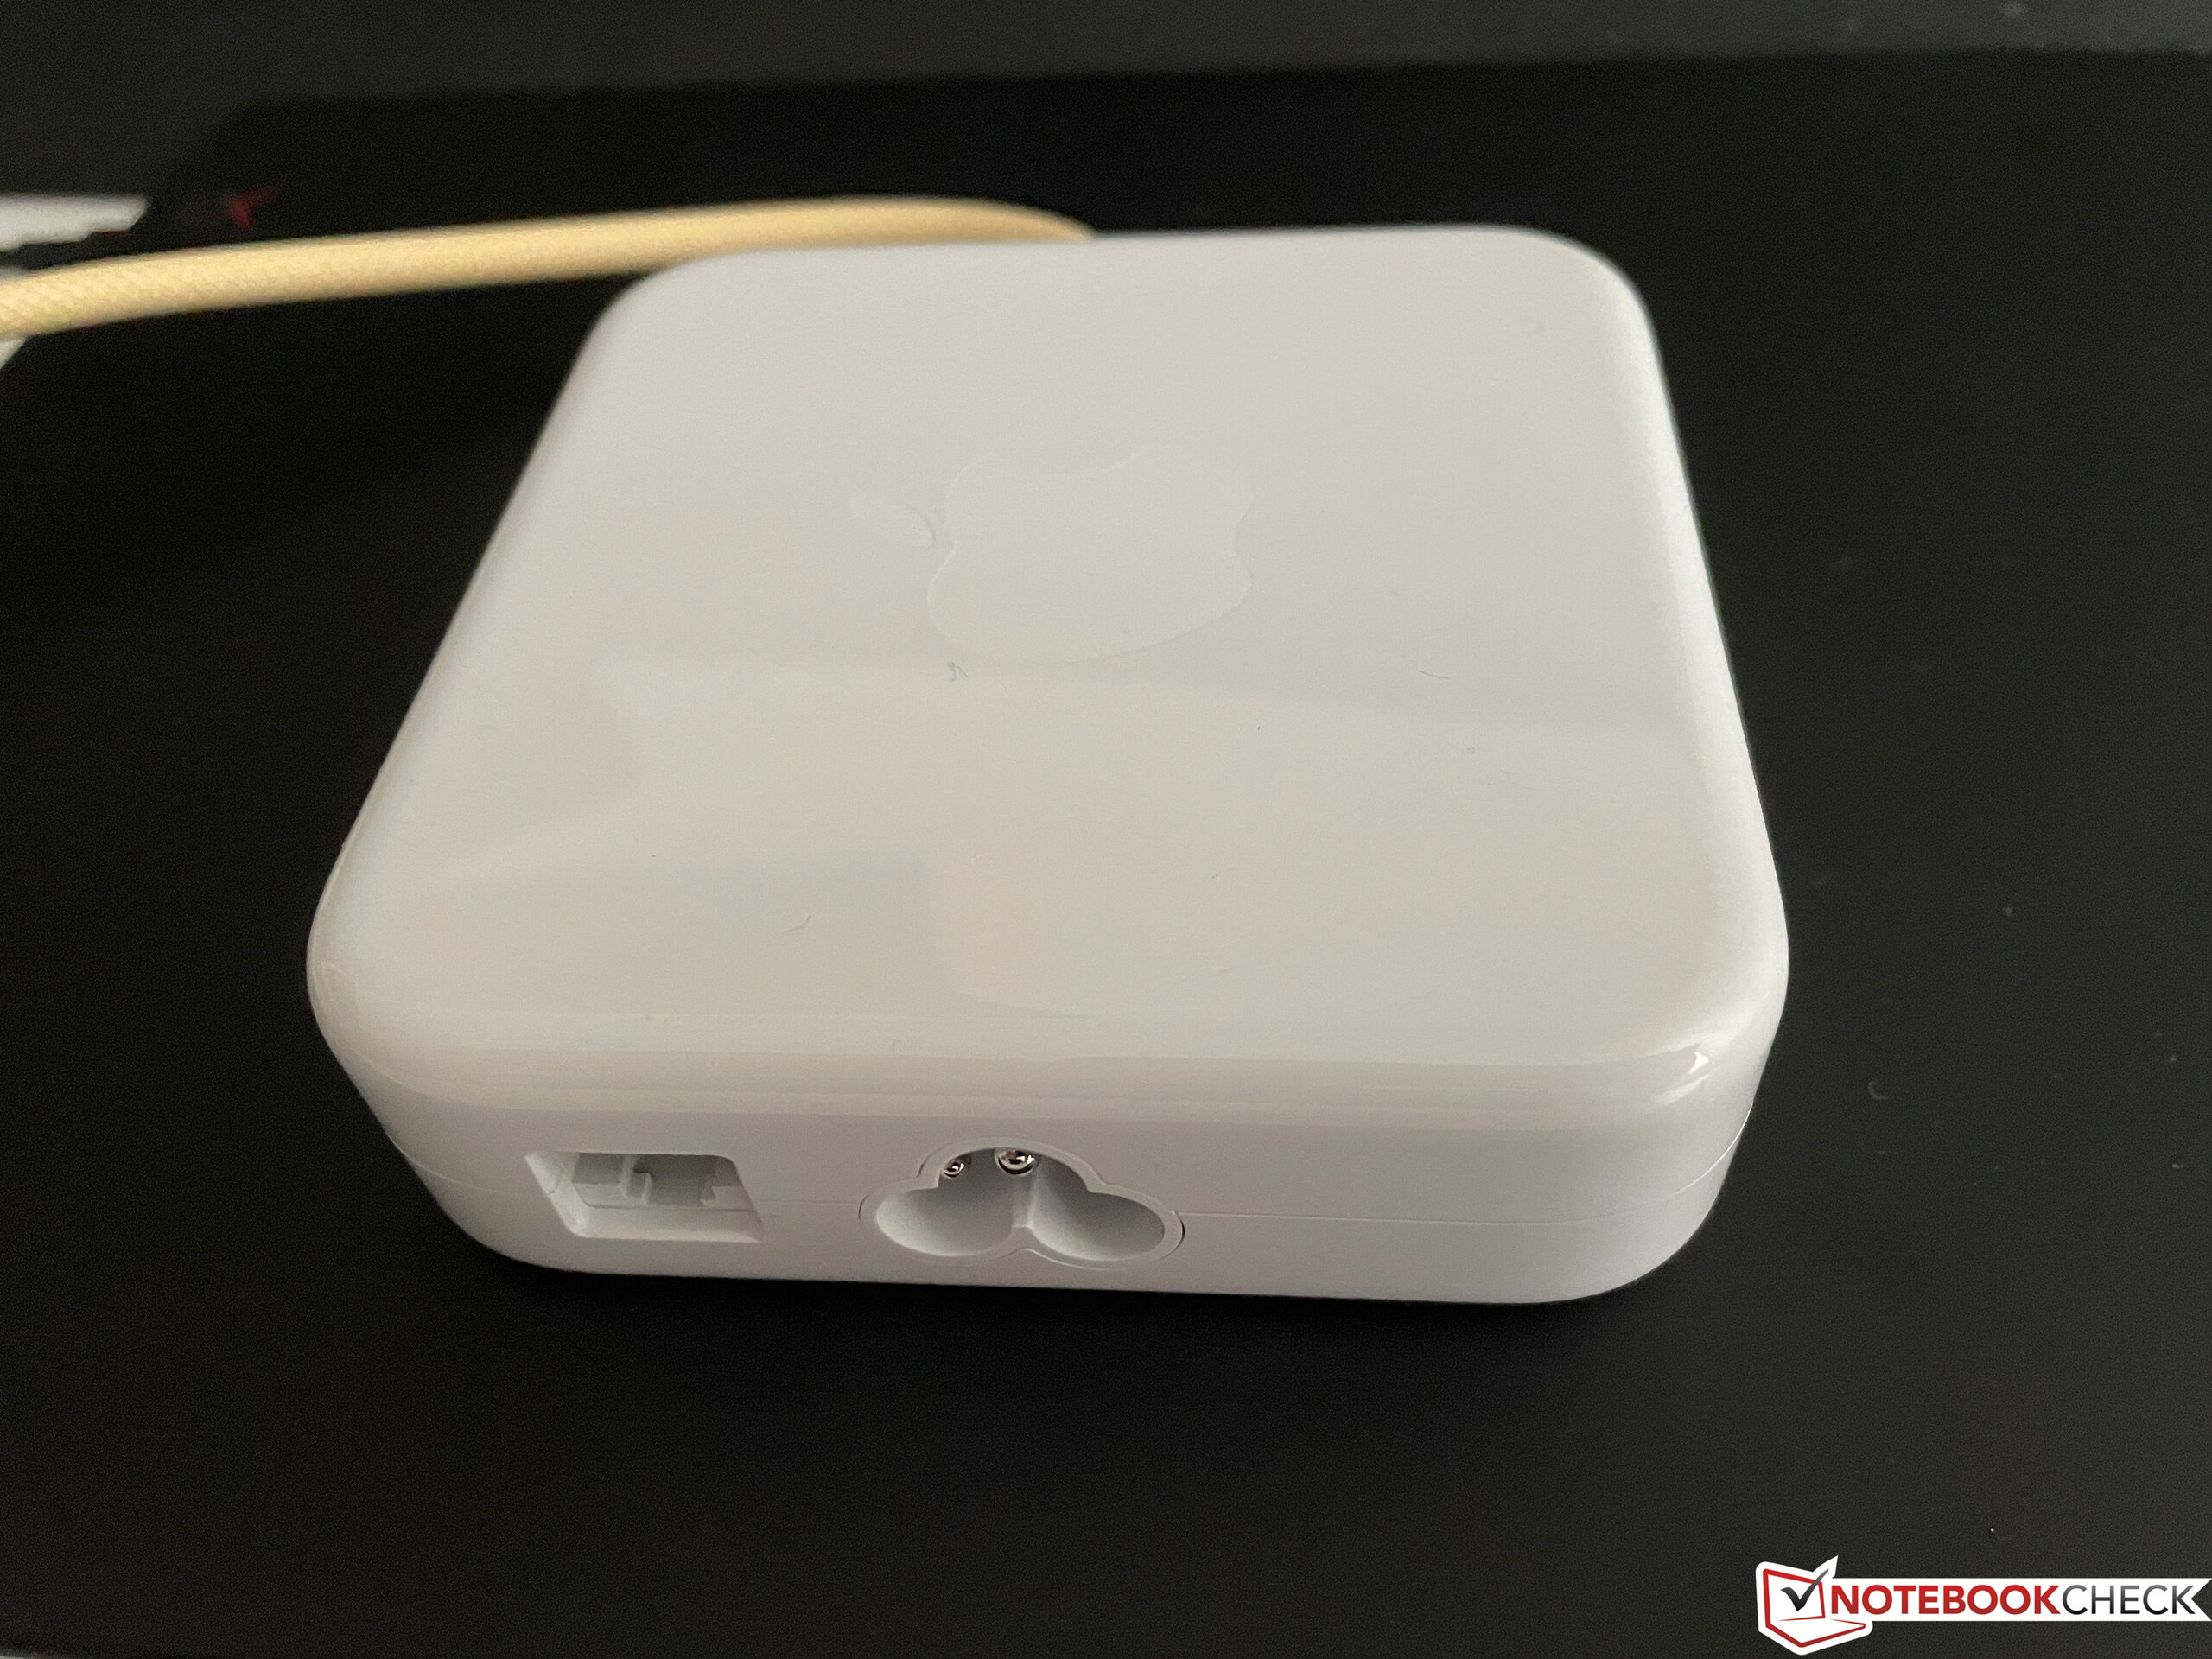
The base model with 7 GPU cores only offers two USB-C ports on the back (USB-4/Thunderbolt 3 with 40 GBit/s). Those who opt for a configuration with 8 GPU cores get two more USB-C ports (3.2 Gen.2) as well as the Gigabit Ethernet plug on the power supply as standard. Wi-Fi 6 and Bluetooth 5.0 are also included, although the WLAN performance (as with the M1 MacBooks) is a bit low (Wi-Fi 6 only with 80 MHz). However, the signal quality was very good in the test.
The iMac is very flexible with these ports, but the position is not very practical in practice when you want to quickly connect an external hard drive or a USB stick. We would have liked to see an additional USB connector on the side, similar to the jack on the left edge. Thus, you will hardly get around a USB hub.
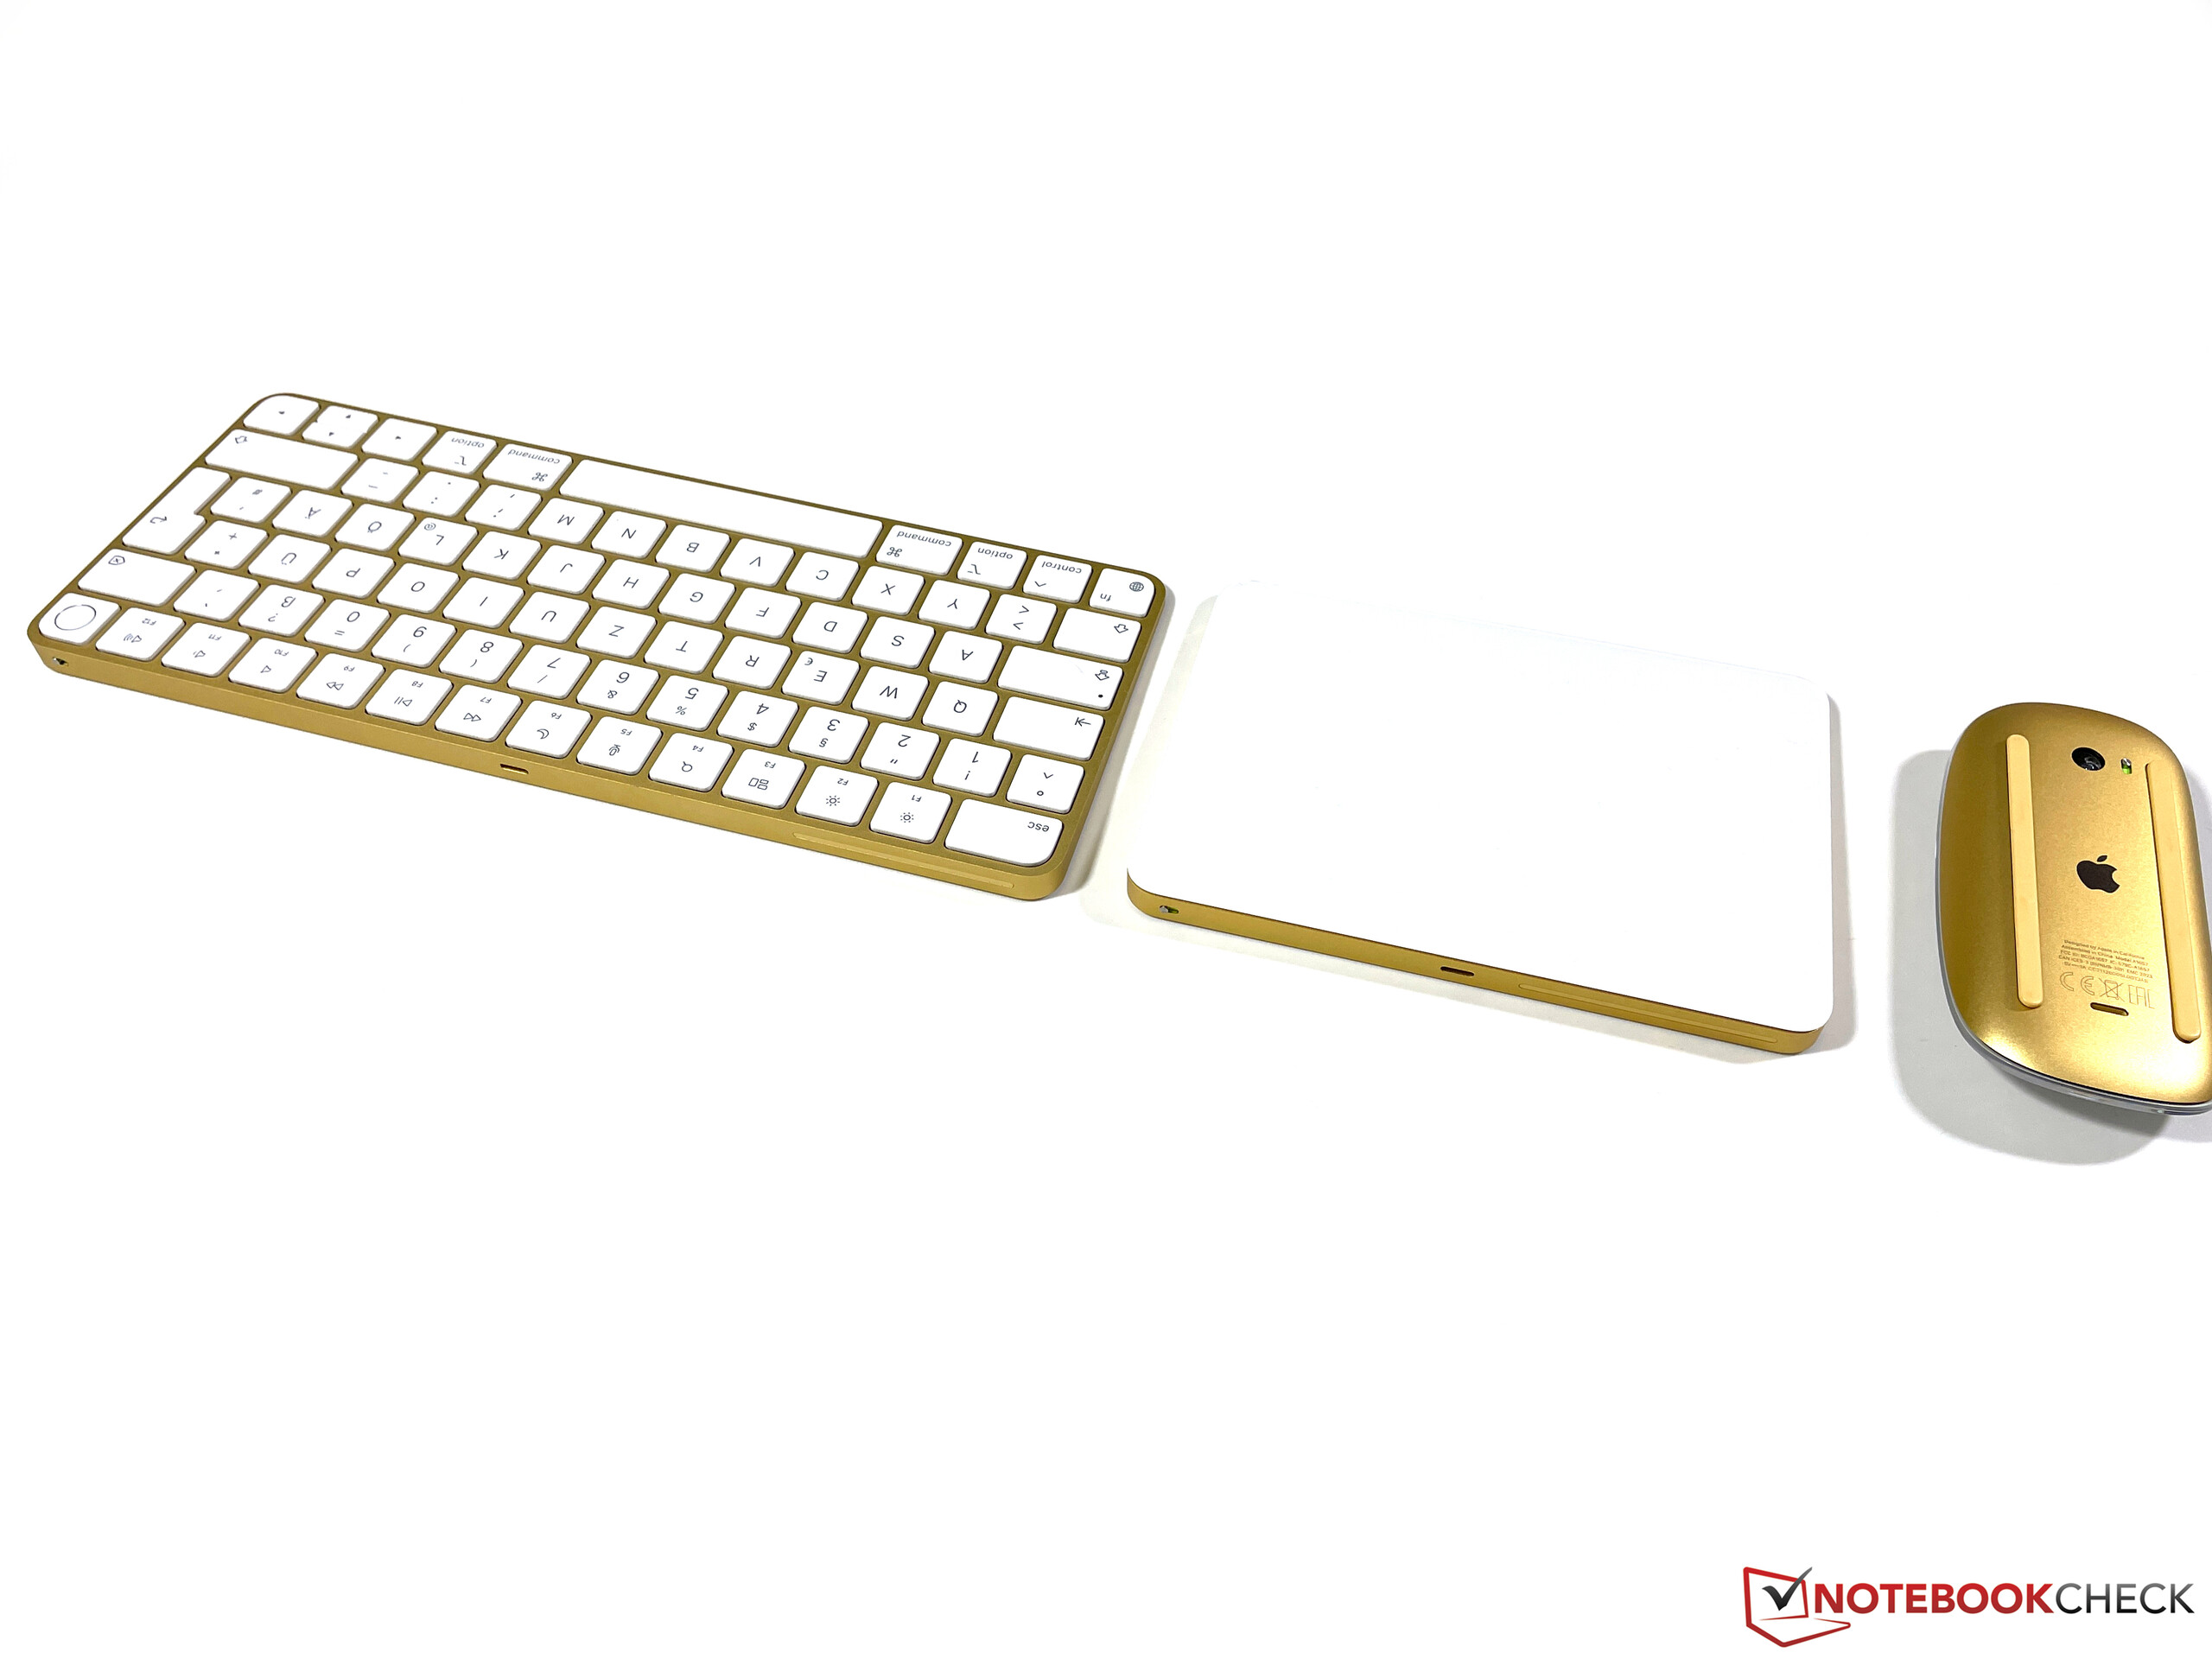
We already know the input devices from the predecessors and especially the TrackPad works very well. The keyboard is very practical thanks to the integrated Touch ID, but it only offers very little travel for desktop input (comparable to the MacBooks) and is also not illuminated. If you want to write a lot, you will certainly get better alternatives, but they do not offer all comfort features.


Display - iMac with 4.5K Retina Screen
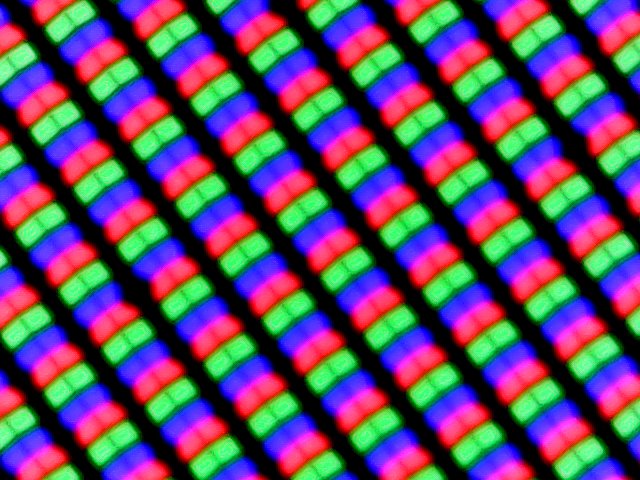
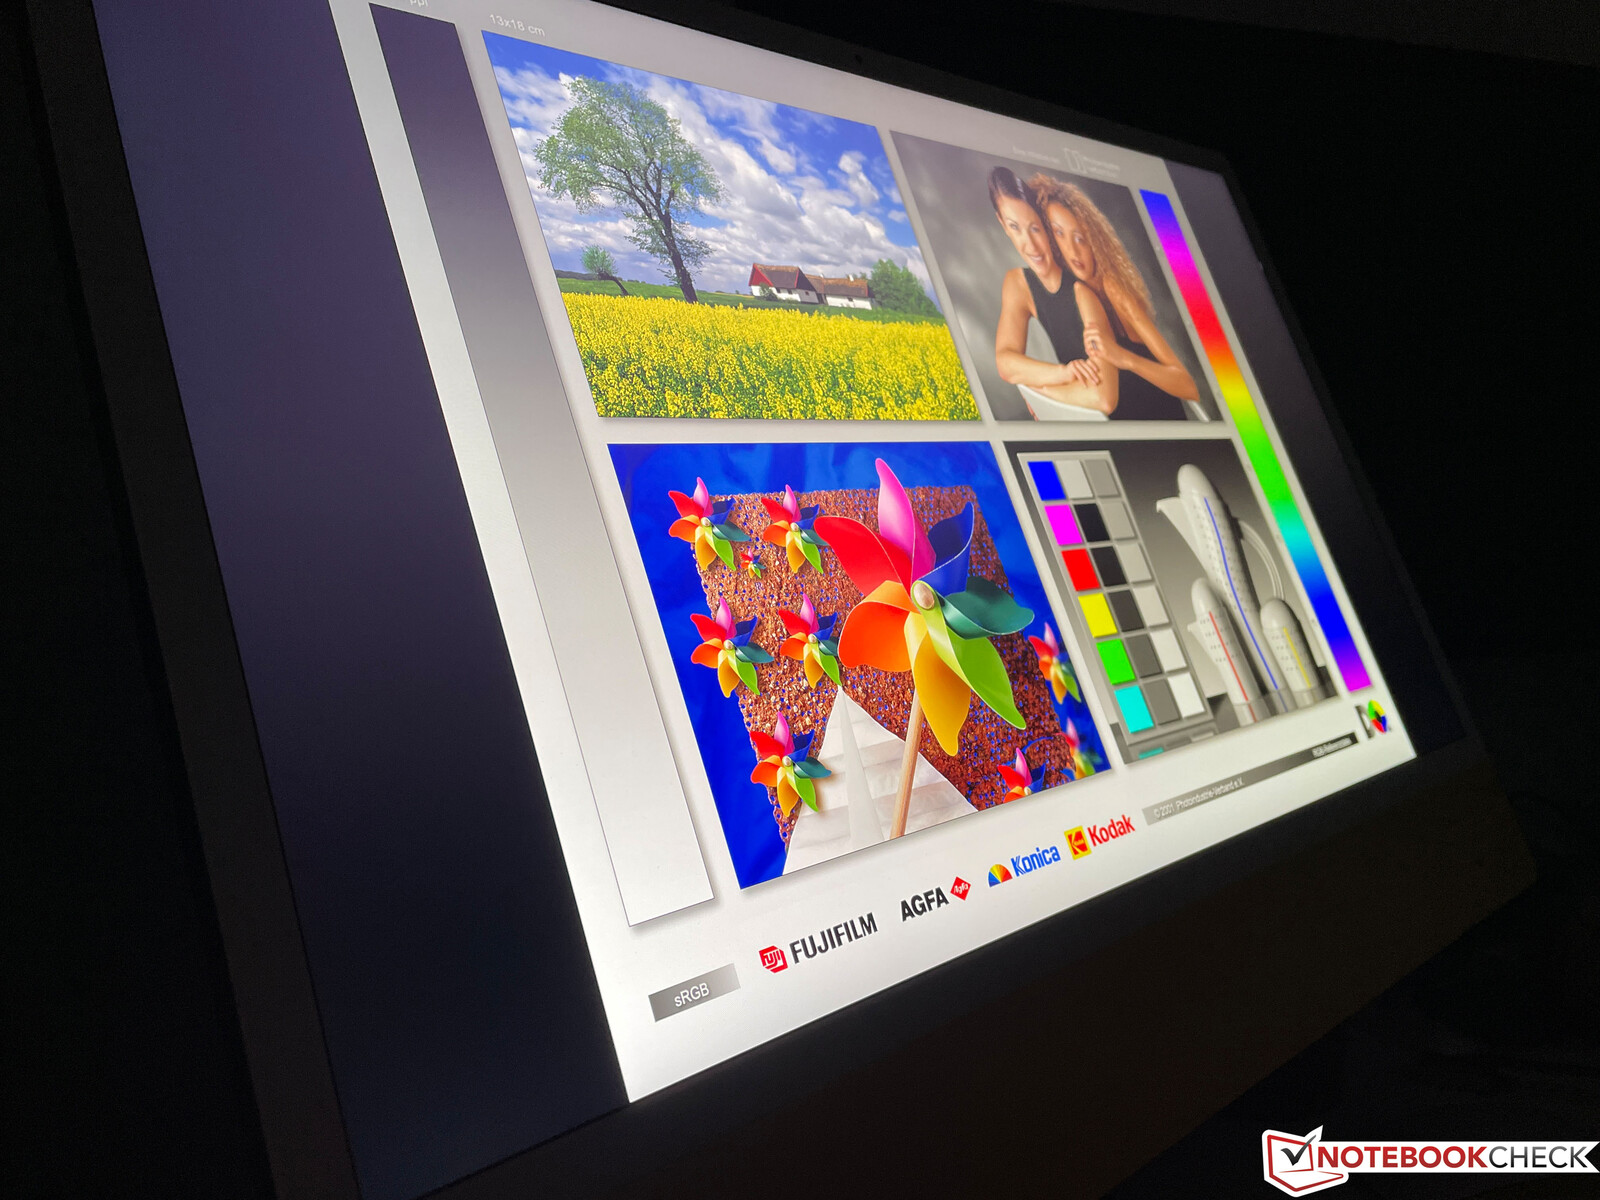
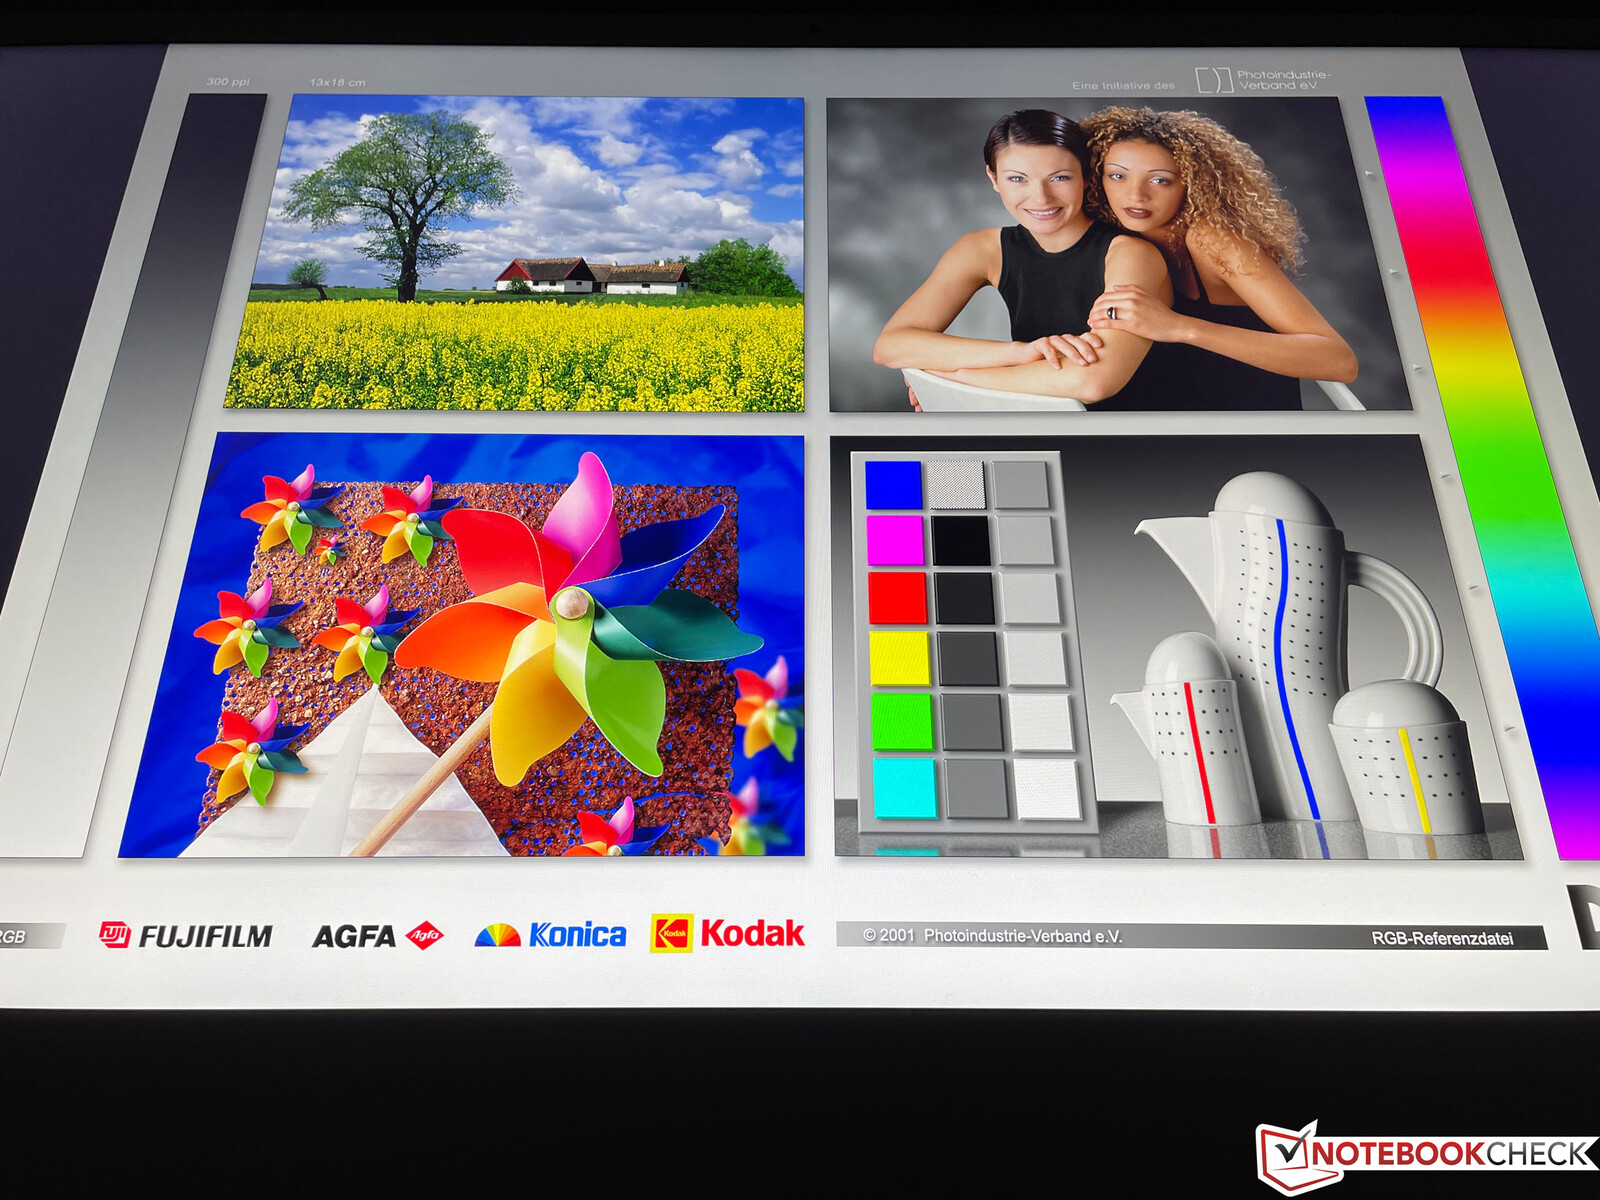
The 23.5-inch display offers a very high resolution of 4,480 x 2,520 pixels with a pixel density of 218 PPI. The content is thus displayed razor-sharp and there are also no scaling problems in conjunction with macOS. The subjective picture impression of the IPS panel is excellent and things like True Tone (automatic adjustment of the color temperature to the environment) as well as the brightness sensor are simply very practical and they also work flawlessly.
Apple states a brightness of 500 nits, but we can only confirm this in the center of the display according to our analysis (CalMAN Professional & X-Rite i1 Pro 2). The average brightness is around 480 cd/m². Compared to the previous iMacs, Apple was able to reduce the black value, which is why the contrast ratio (>1,400:1) is also better. We did not notice PWM flickering and the response times are comparatively good for an IPS display (no ghosting).
| |||||||||||||||||||||||||
Brightness Distribution: 82 %
Contrast: 1414:1 (Black: 0.37 cd/m²)
ΔE ColorChecker Calman: 1.1 | ∀{0.5-29.43 Ø4.72}
calibrated: 0.4
ΔE Greyscale Calman: 1.5 | ∀{0.09-98 Ø4.97}
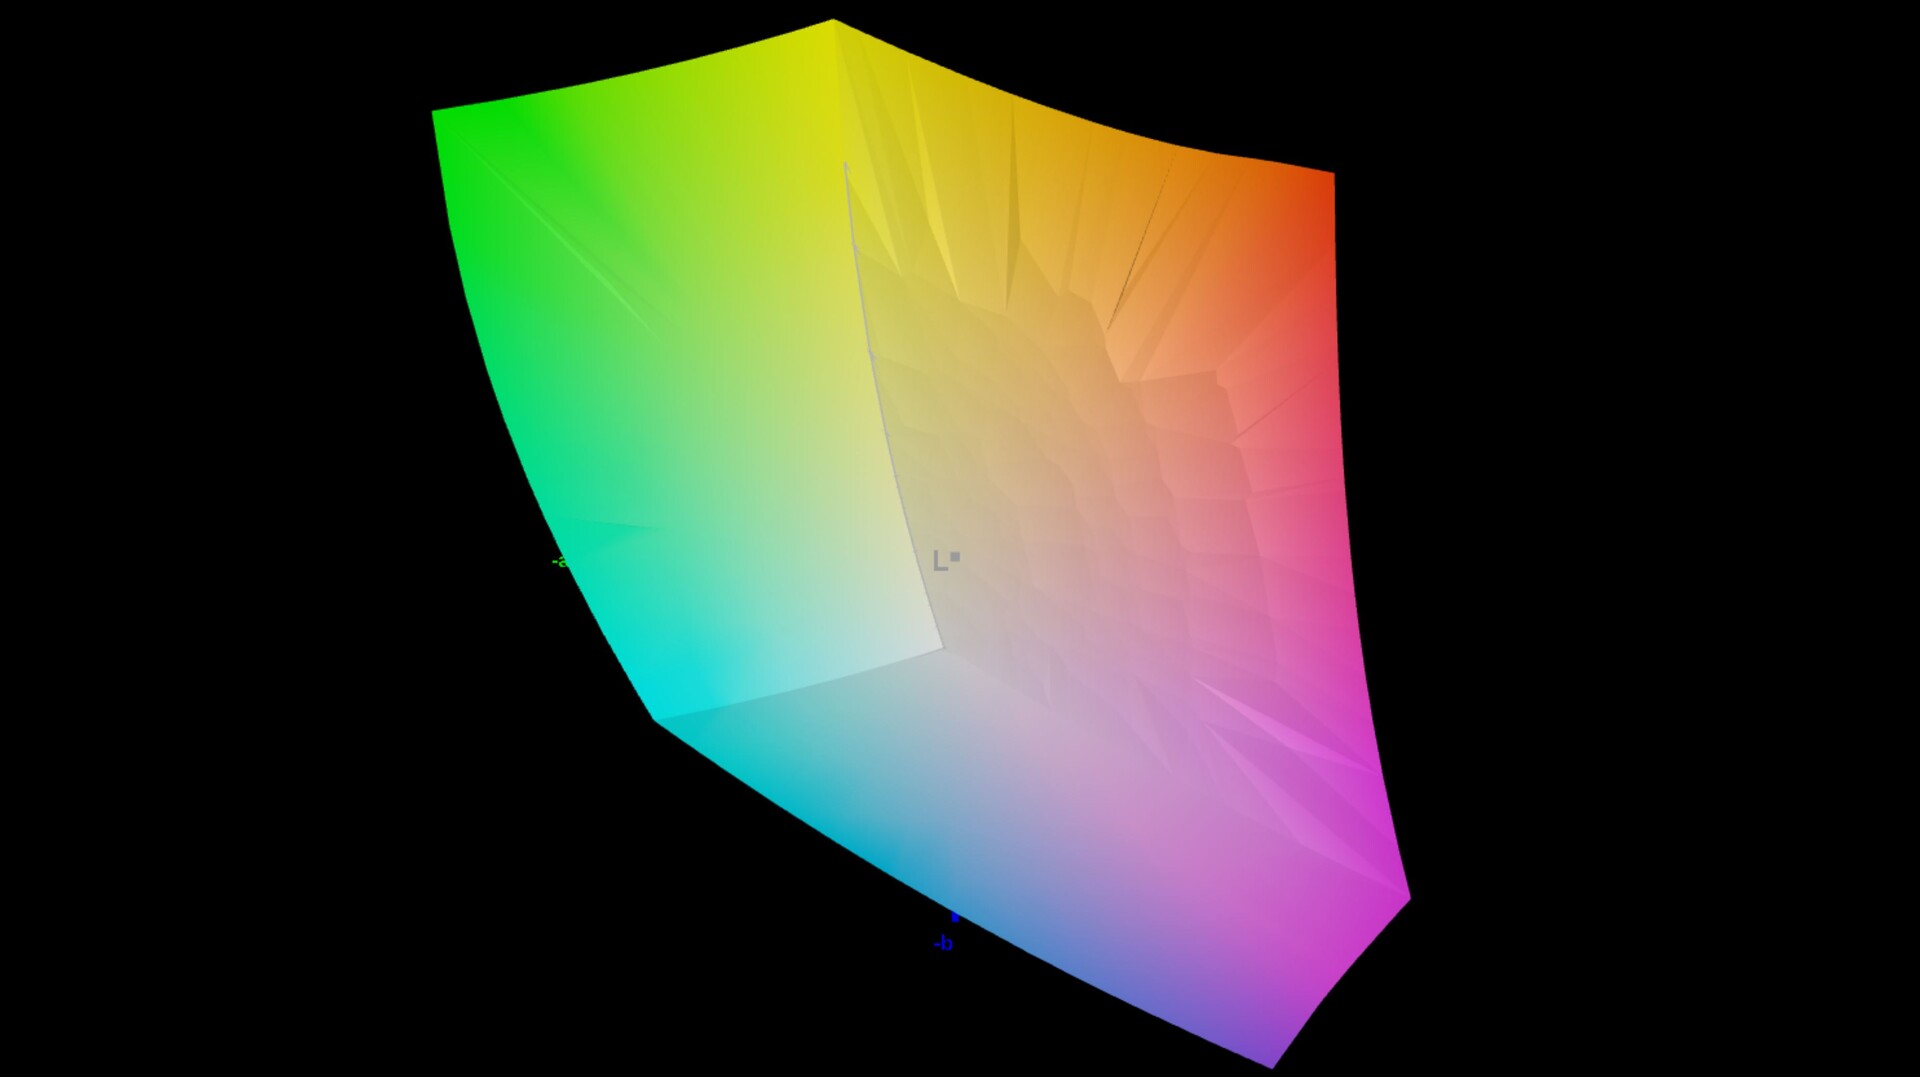
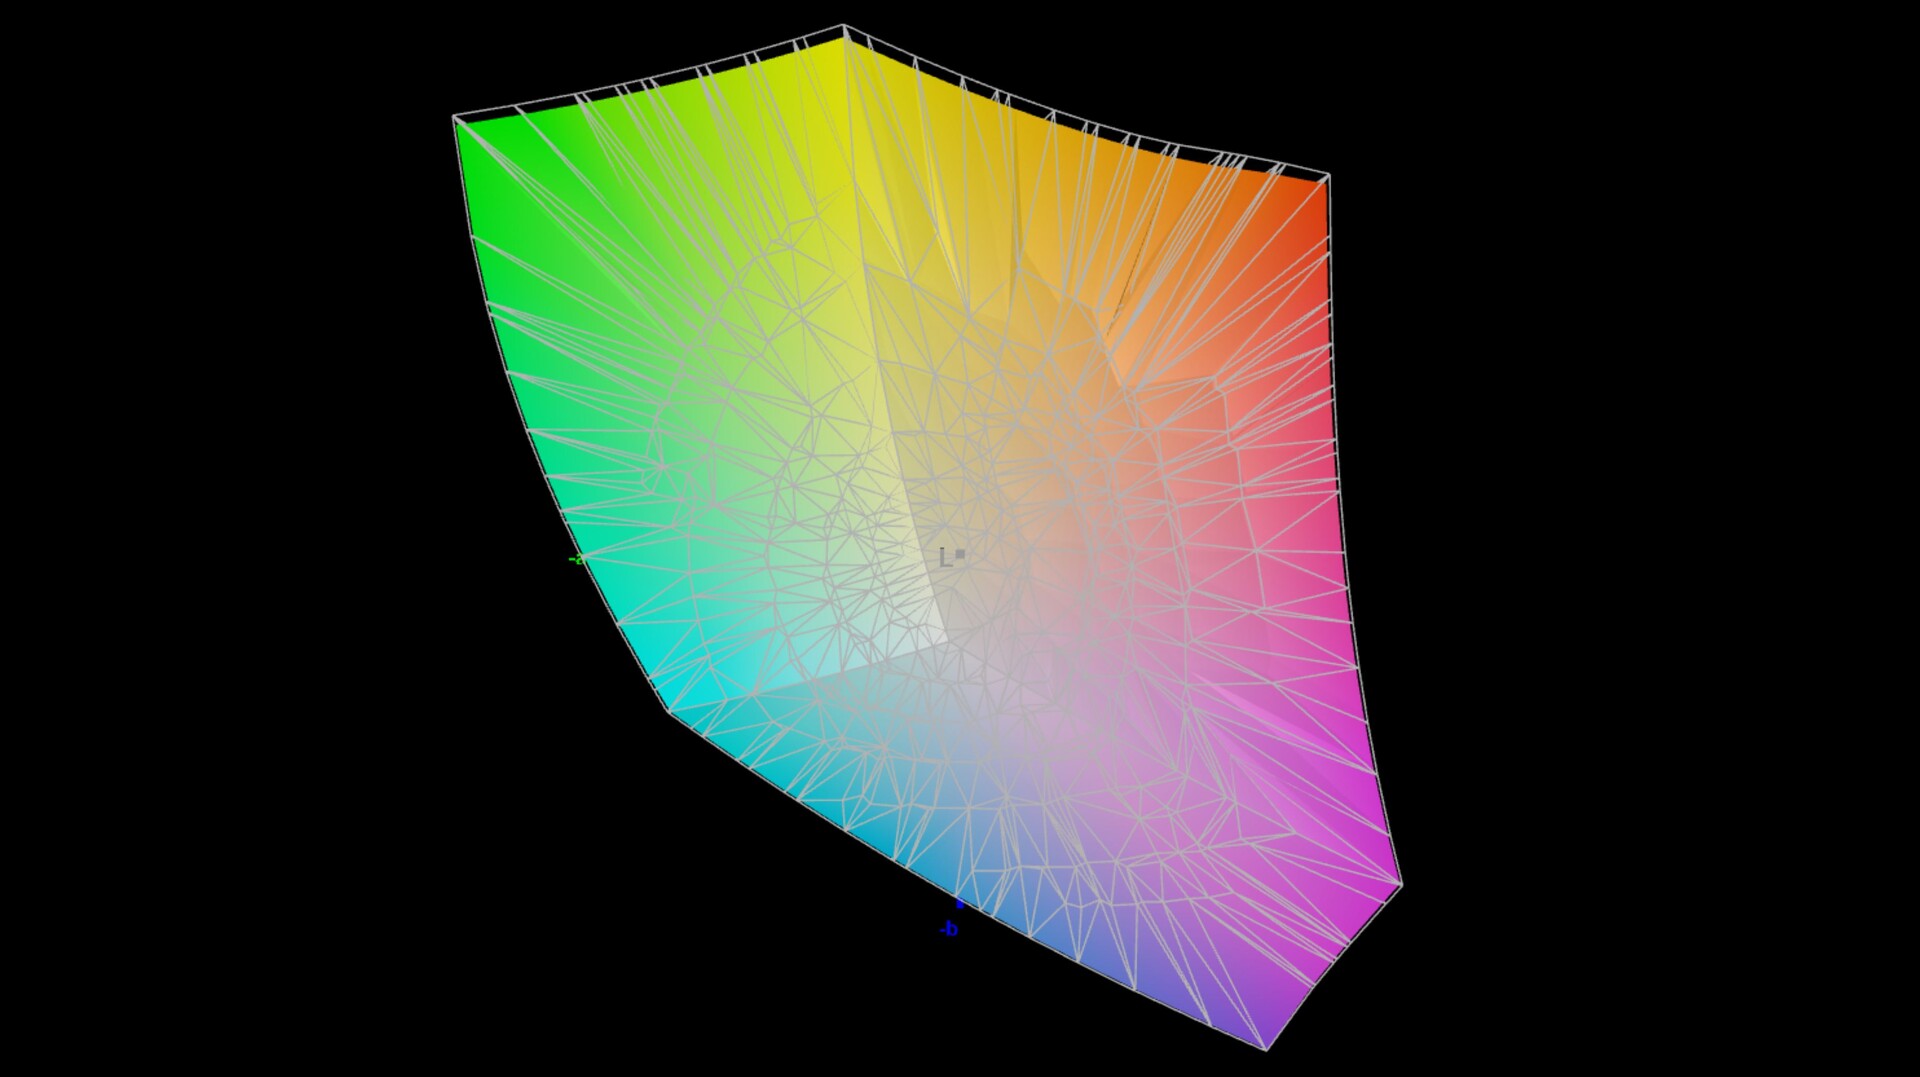
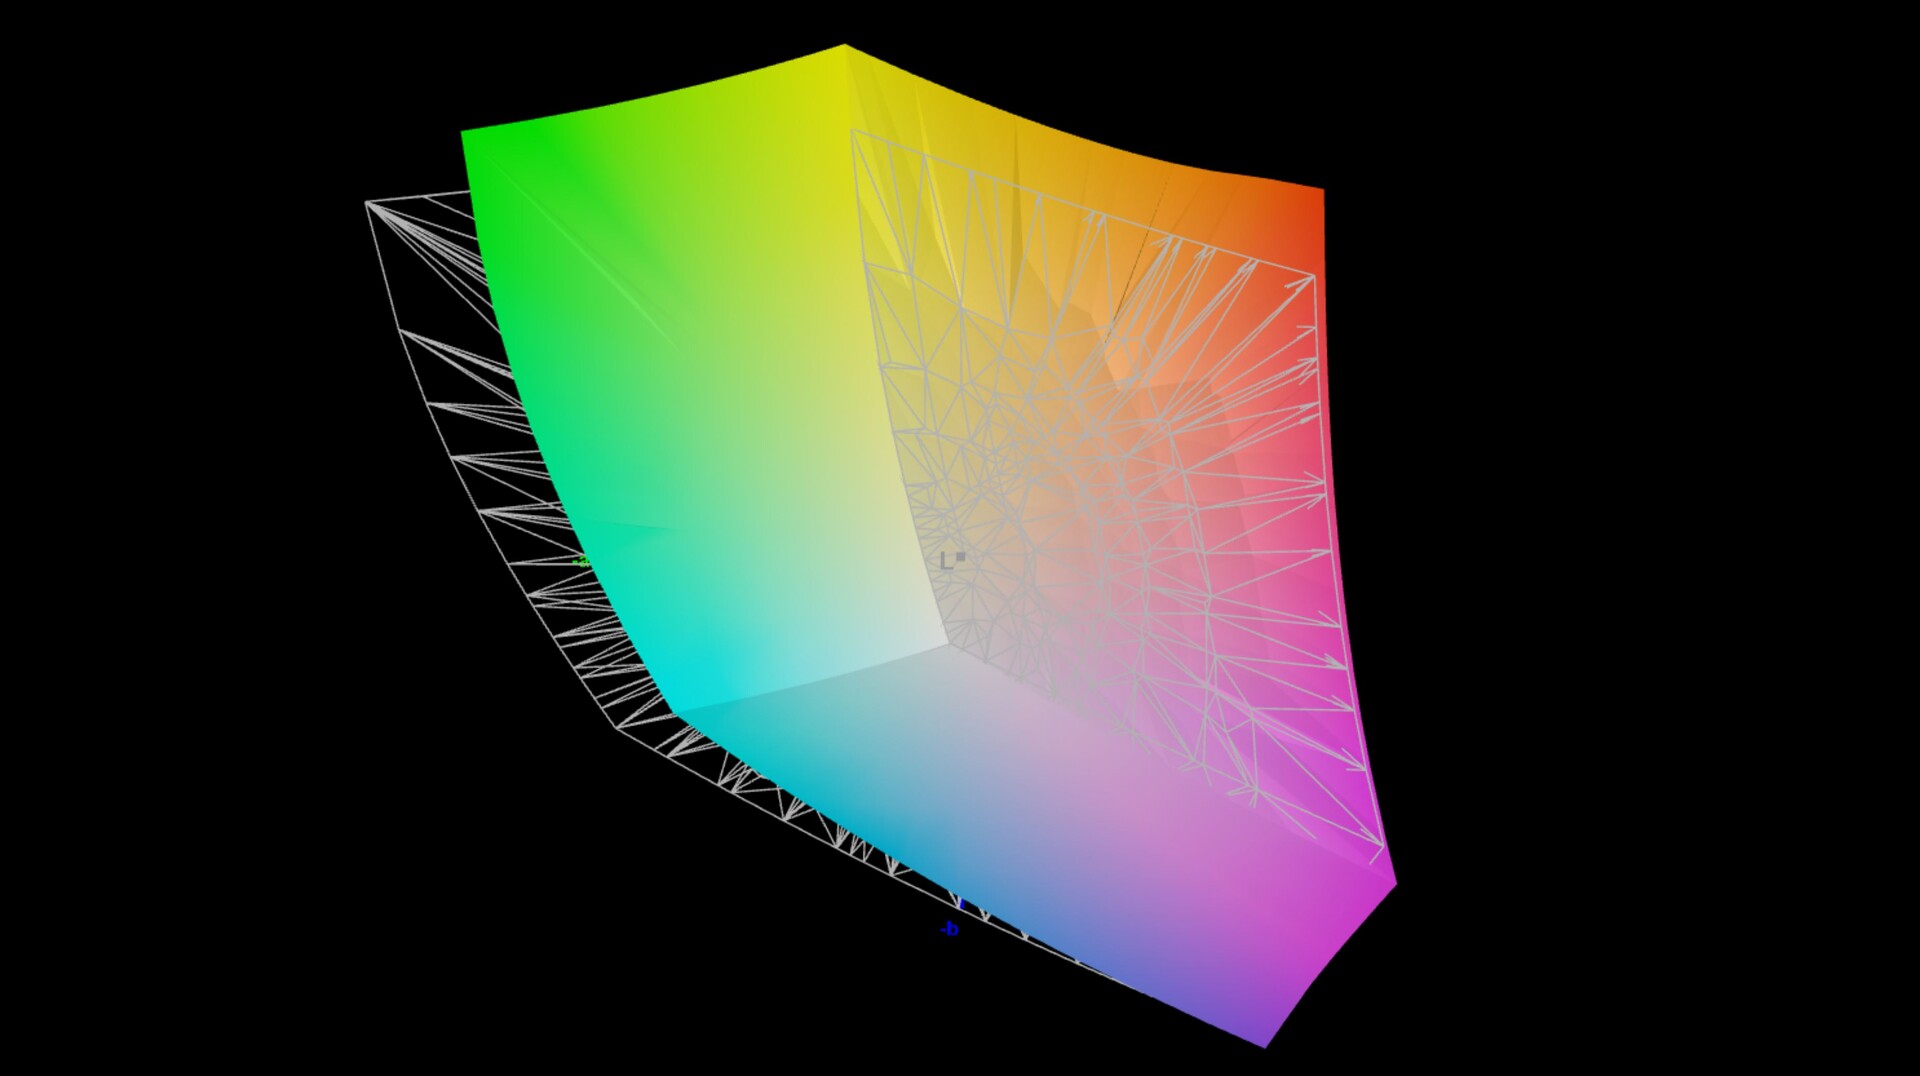
86.6% AdobeRGB 1998 (Argyll 3D)
100% sRGB (Argyll 3D)
97.7% Display P3 (Argyll 3D)
Gamma: 2.16
CCT: 6729 K
| Apple iMac 24 M1 2021 IPS, 4480x2520, 23.5" | Apple iMac 27 Mid 2020 APPAE32, IPS, 5120x2880, 27" | Apple iMac Pro APPAE1E, , 5120x2880, 27" | |
|---|---|---|---|
| Display | 1% | 1% | |
| Display P3 Coverage (%) | 97.7 | 98.7 1% | 99 1% |
| sRGB Coverage (%) | 100 | 100 0% | 100 0% |
| AdobeRGB 1998 Coverage (%) | 86.6 | 89.5 3% | 88.8 3% |
| Response Times | 19% | -6% | |
| Response Time Grey 50% / Grey 80% * (ms) | 29.2 ? | 27.2 ? 7% | 30.4 ? -4% |
| Response Time Black / White * (ms) | 17.6 ? | 12.4 ? 30% | 18.8 ? -7% |
| PWM Frequency (Hz) | 22730 ? | 208.3 ? | |
| Screen | -18% | -71% | |
| Brightness middle (cd/m²) | 523 | 529 1% | 496 -5% |
| Brightness (cd/m²) | 479 | 511 7% | 468 -2% |
| Brightness Distribution (%) | 82 | 88 7% | 87 6% |
| Black Level * (cd/m²) | 0.37 | 0.48 -30% | 0.54 -46% |
| Contrast (:1) | 1414 | 1102 -22% | 919 -35% |
| Colorchecker dE 2000 * | 1.1 | 1.4 -27% | 3 -173% |
| Colorchecker dE 2000 max. * | 2 | 2.6 -30% | 5.8 -190% |
| Colorchecker dE 2000 calibrated * | 0.4 | 0.9 -125% | |
| Greyscale dE 2000 * | 1.5 | 2.2 -47% | 2.5 -67% |
| Gamma | 2.16 102% | 2.32 95% | 2.22 99% |
| CCT | 6729 97% | 6826 95% | 6824 95% |
| Color Space (Percent of AdobeRGB 1998) (%) | 80 | 79.4 | |
| Color Space (Percent of sRGB) (%) | 100 | 100 | |
| Total Average (Program / Settings) | 1% /
-8% | -25% /
-46% |
* ... smaller is better
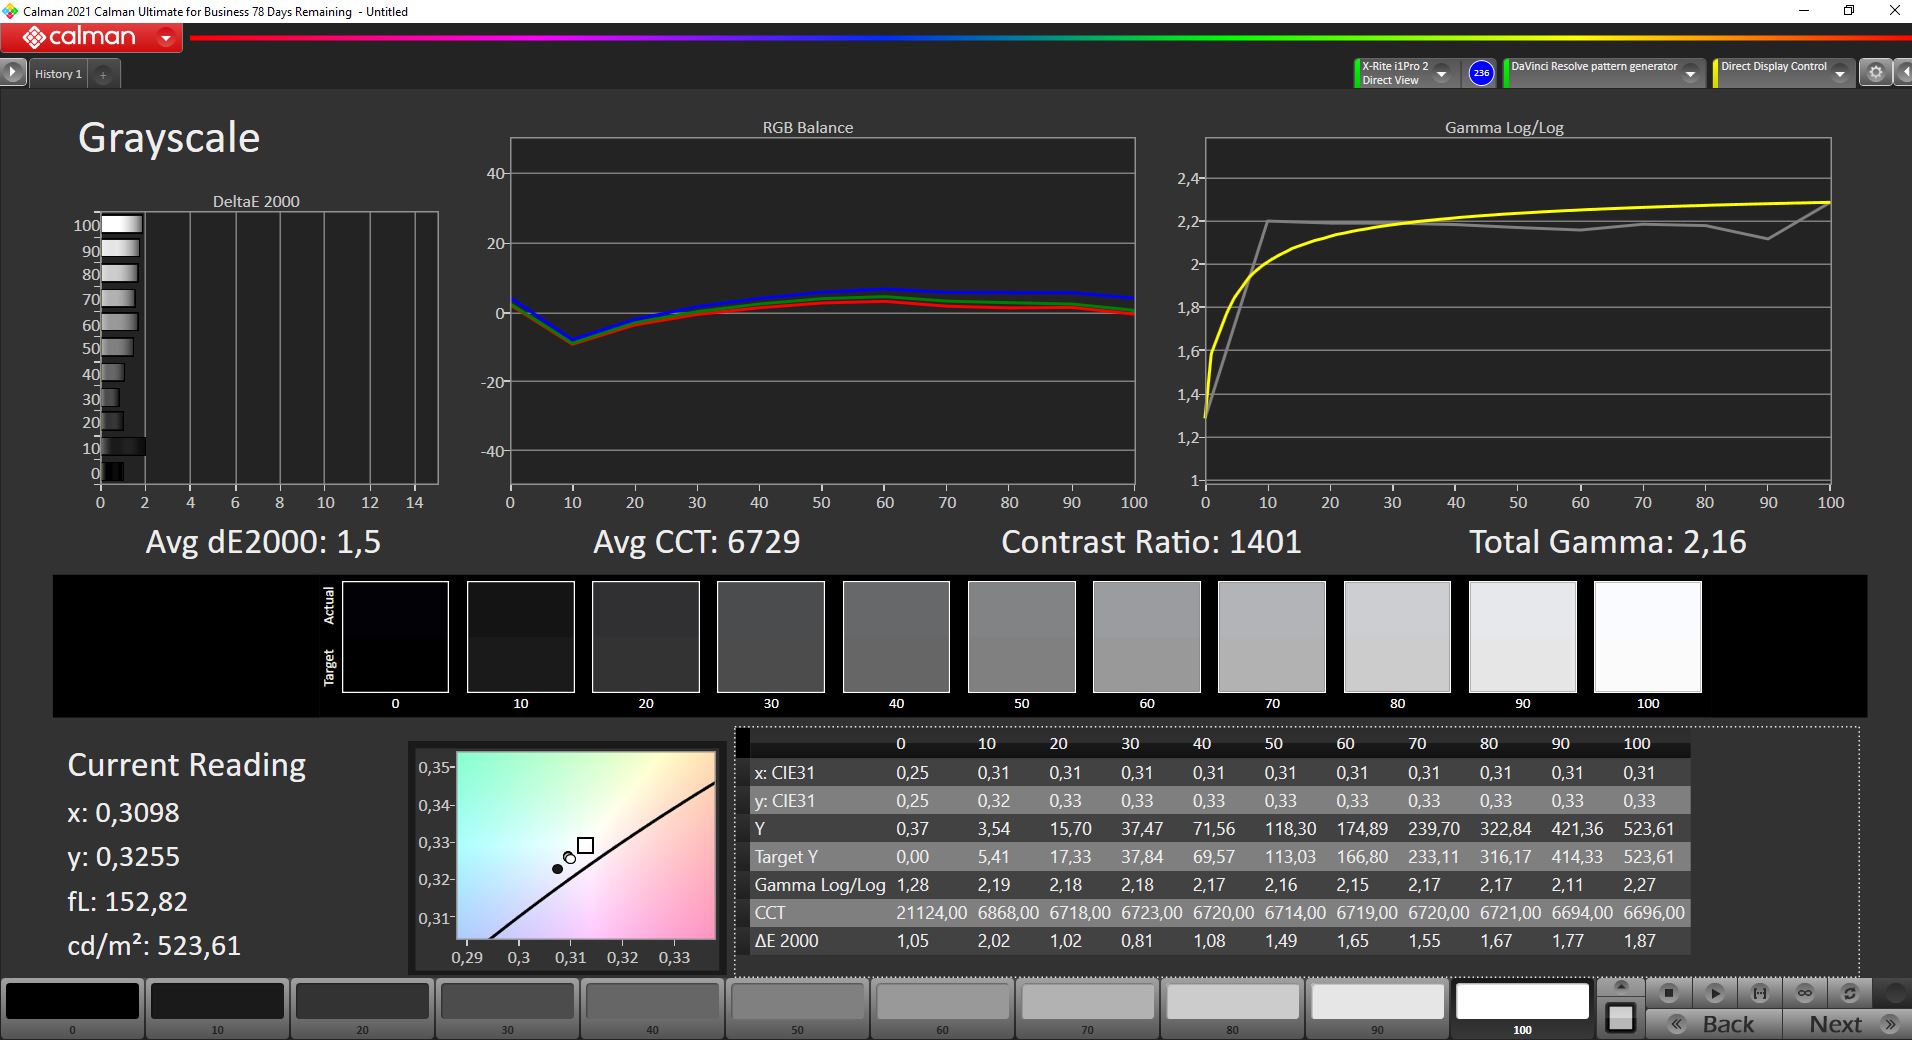
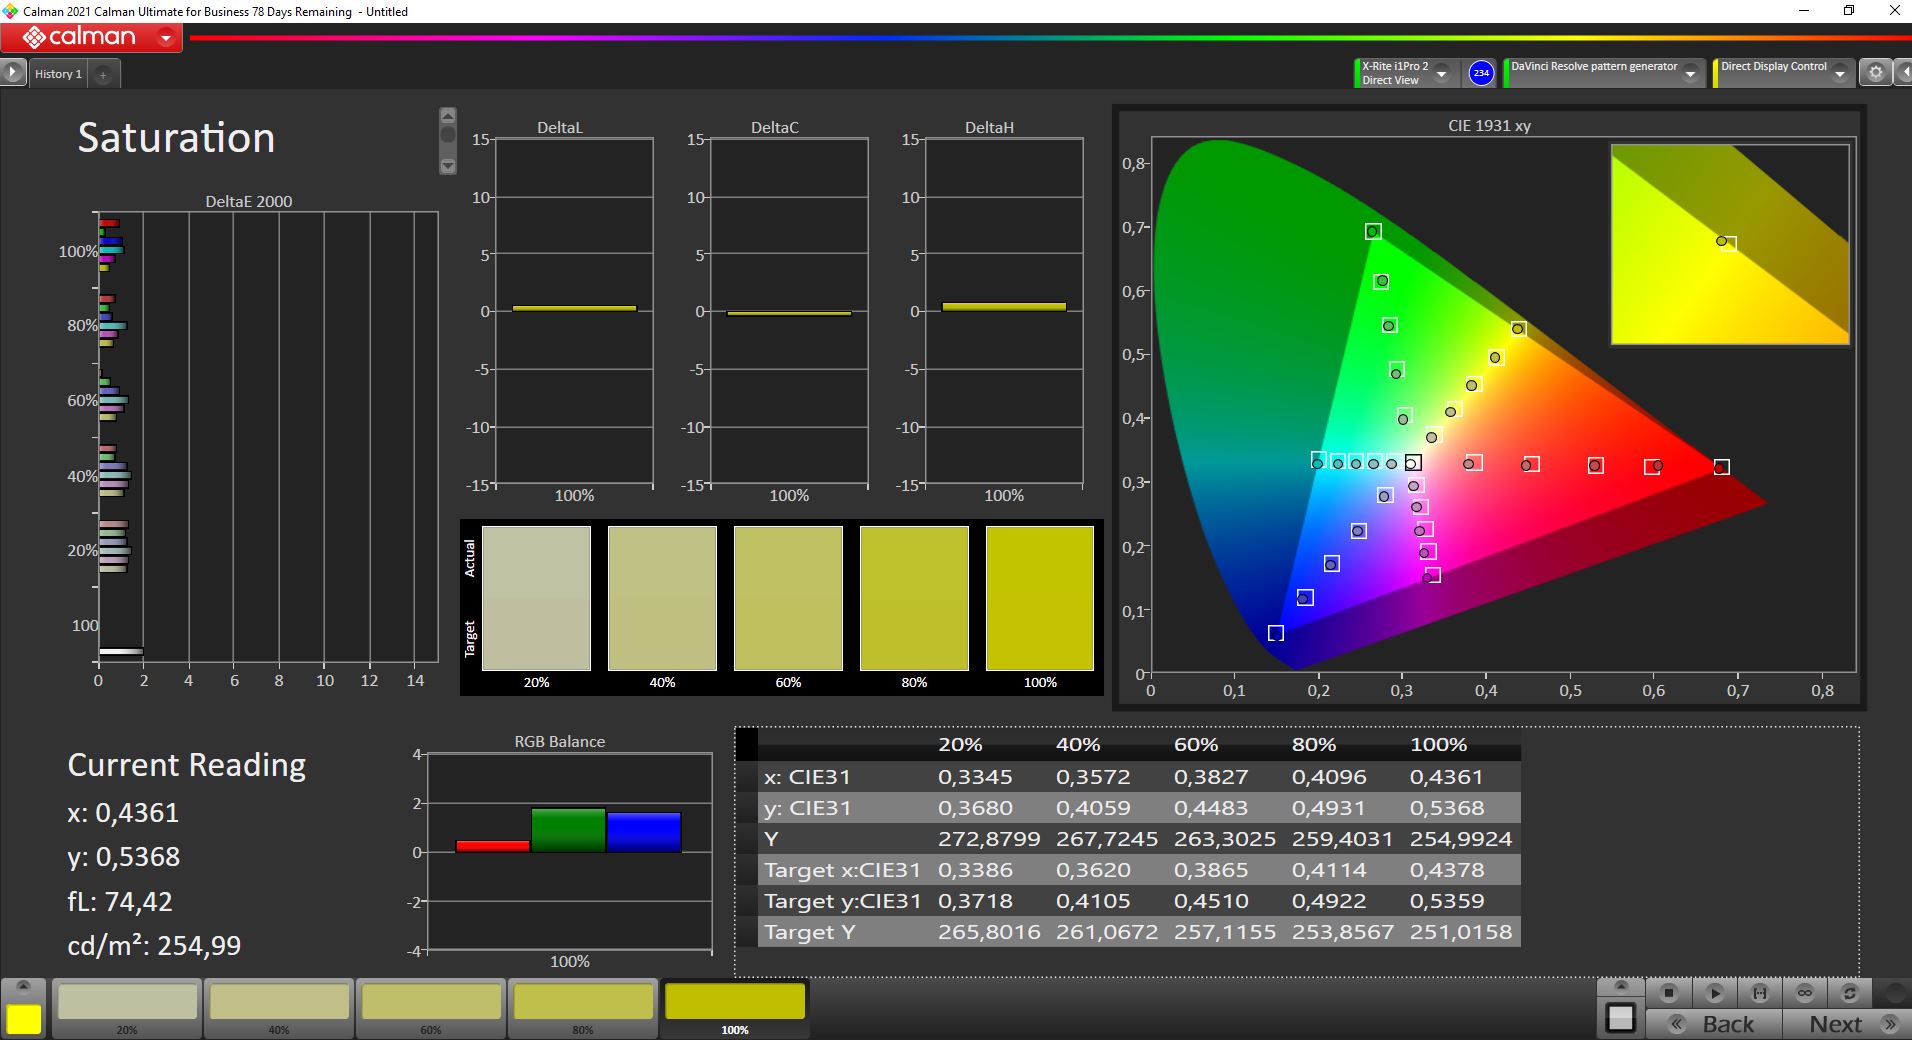
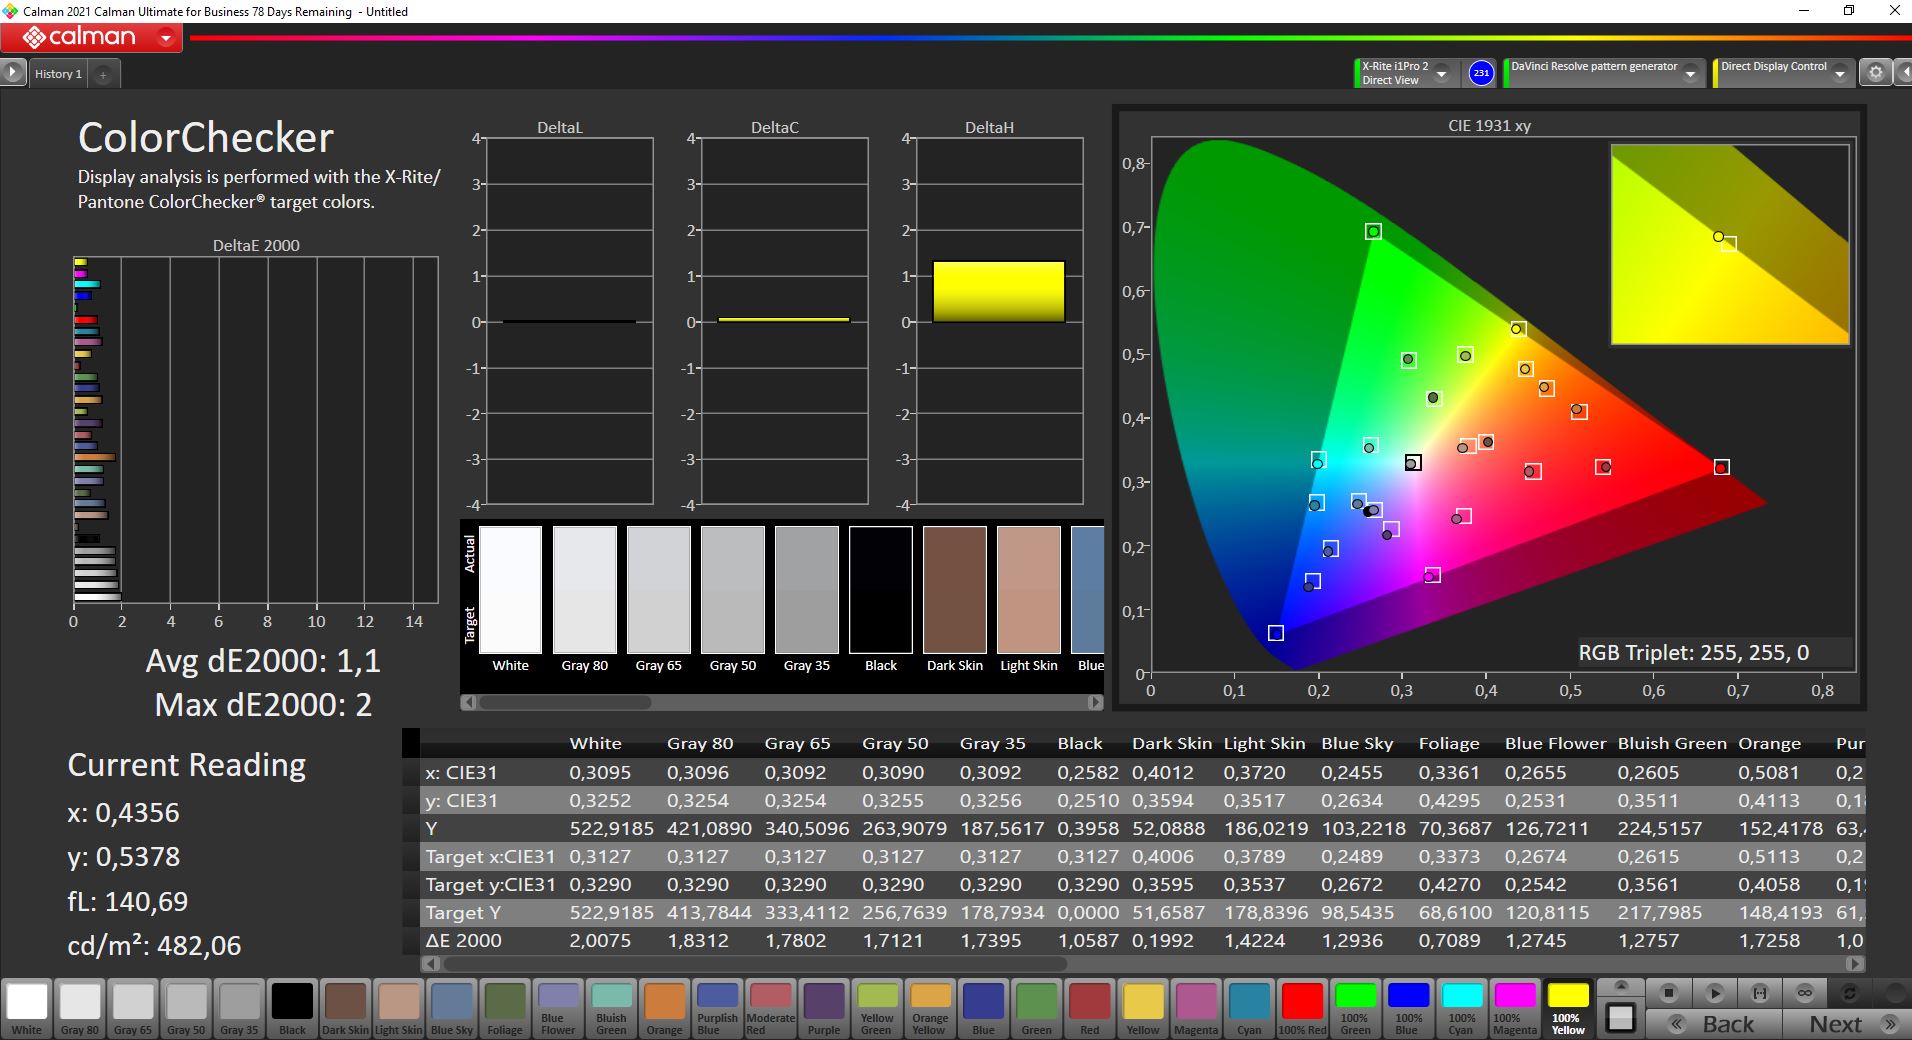
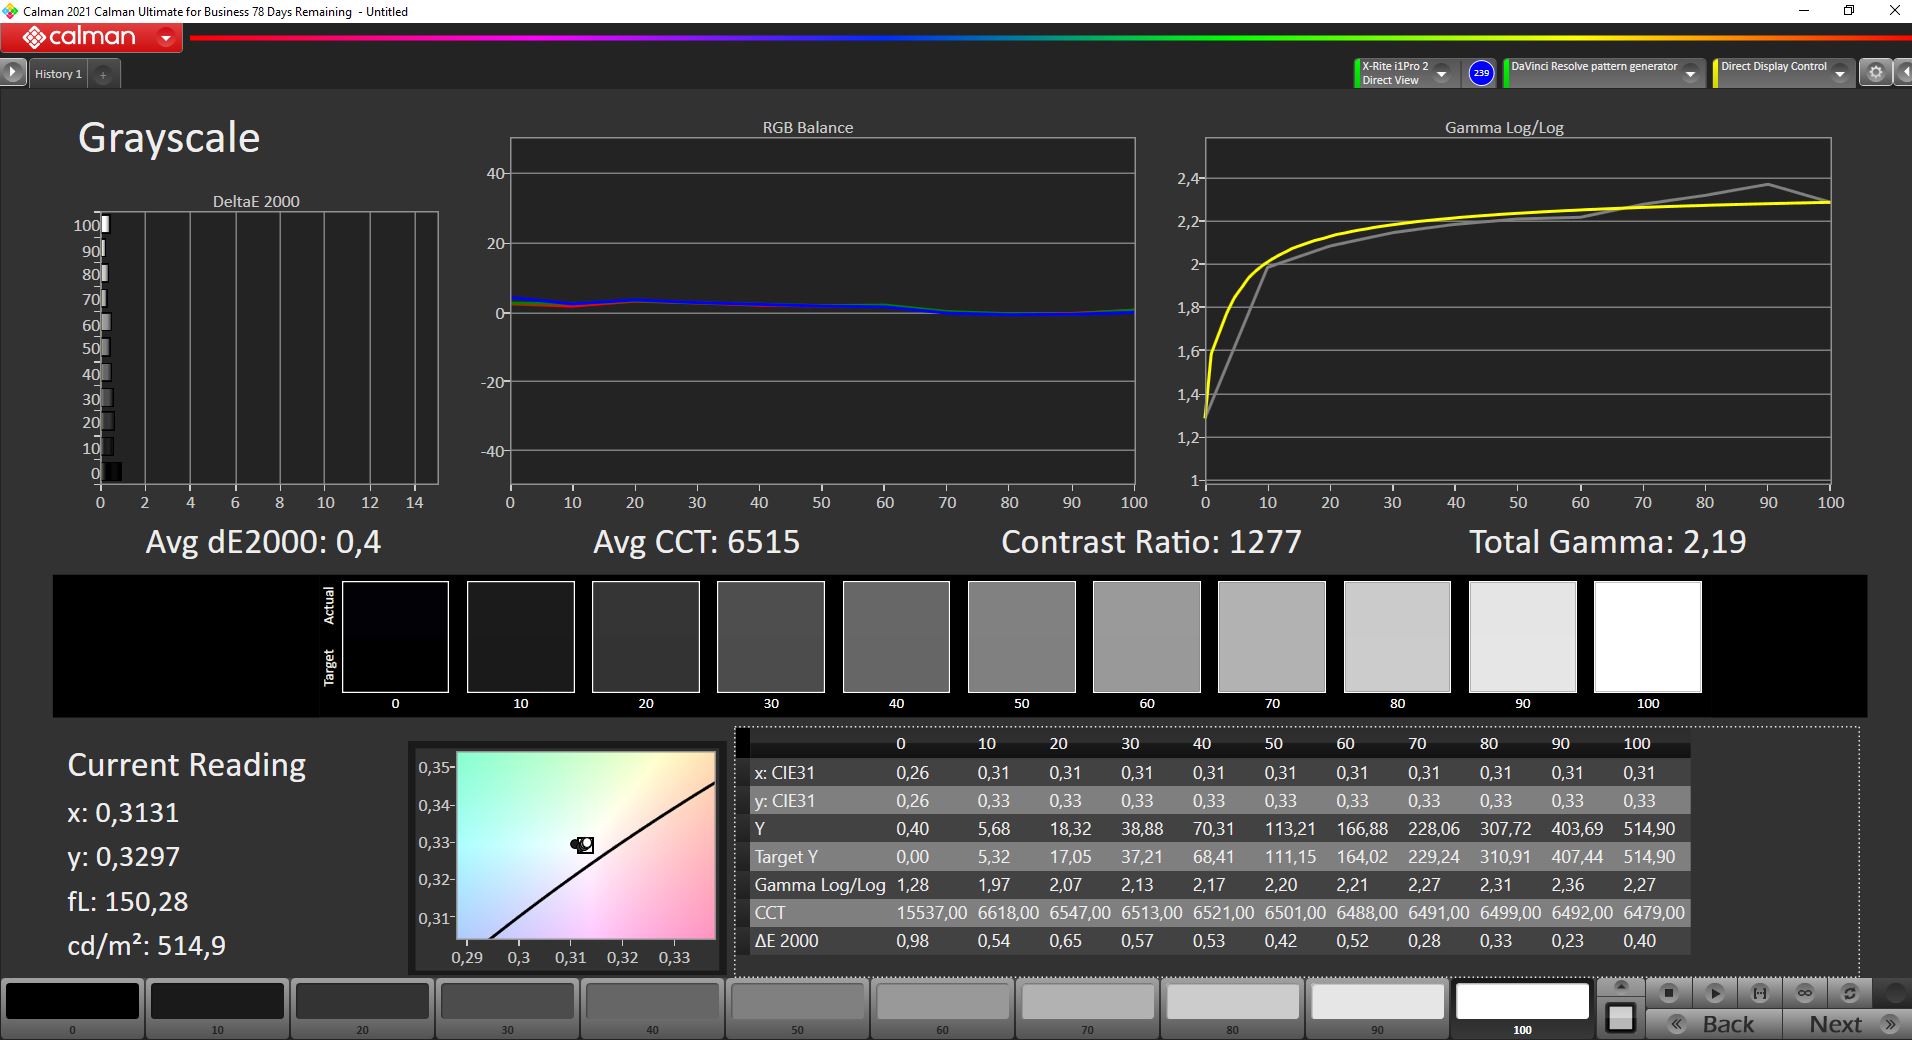
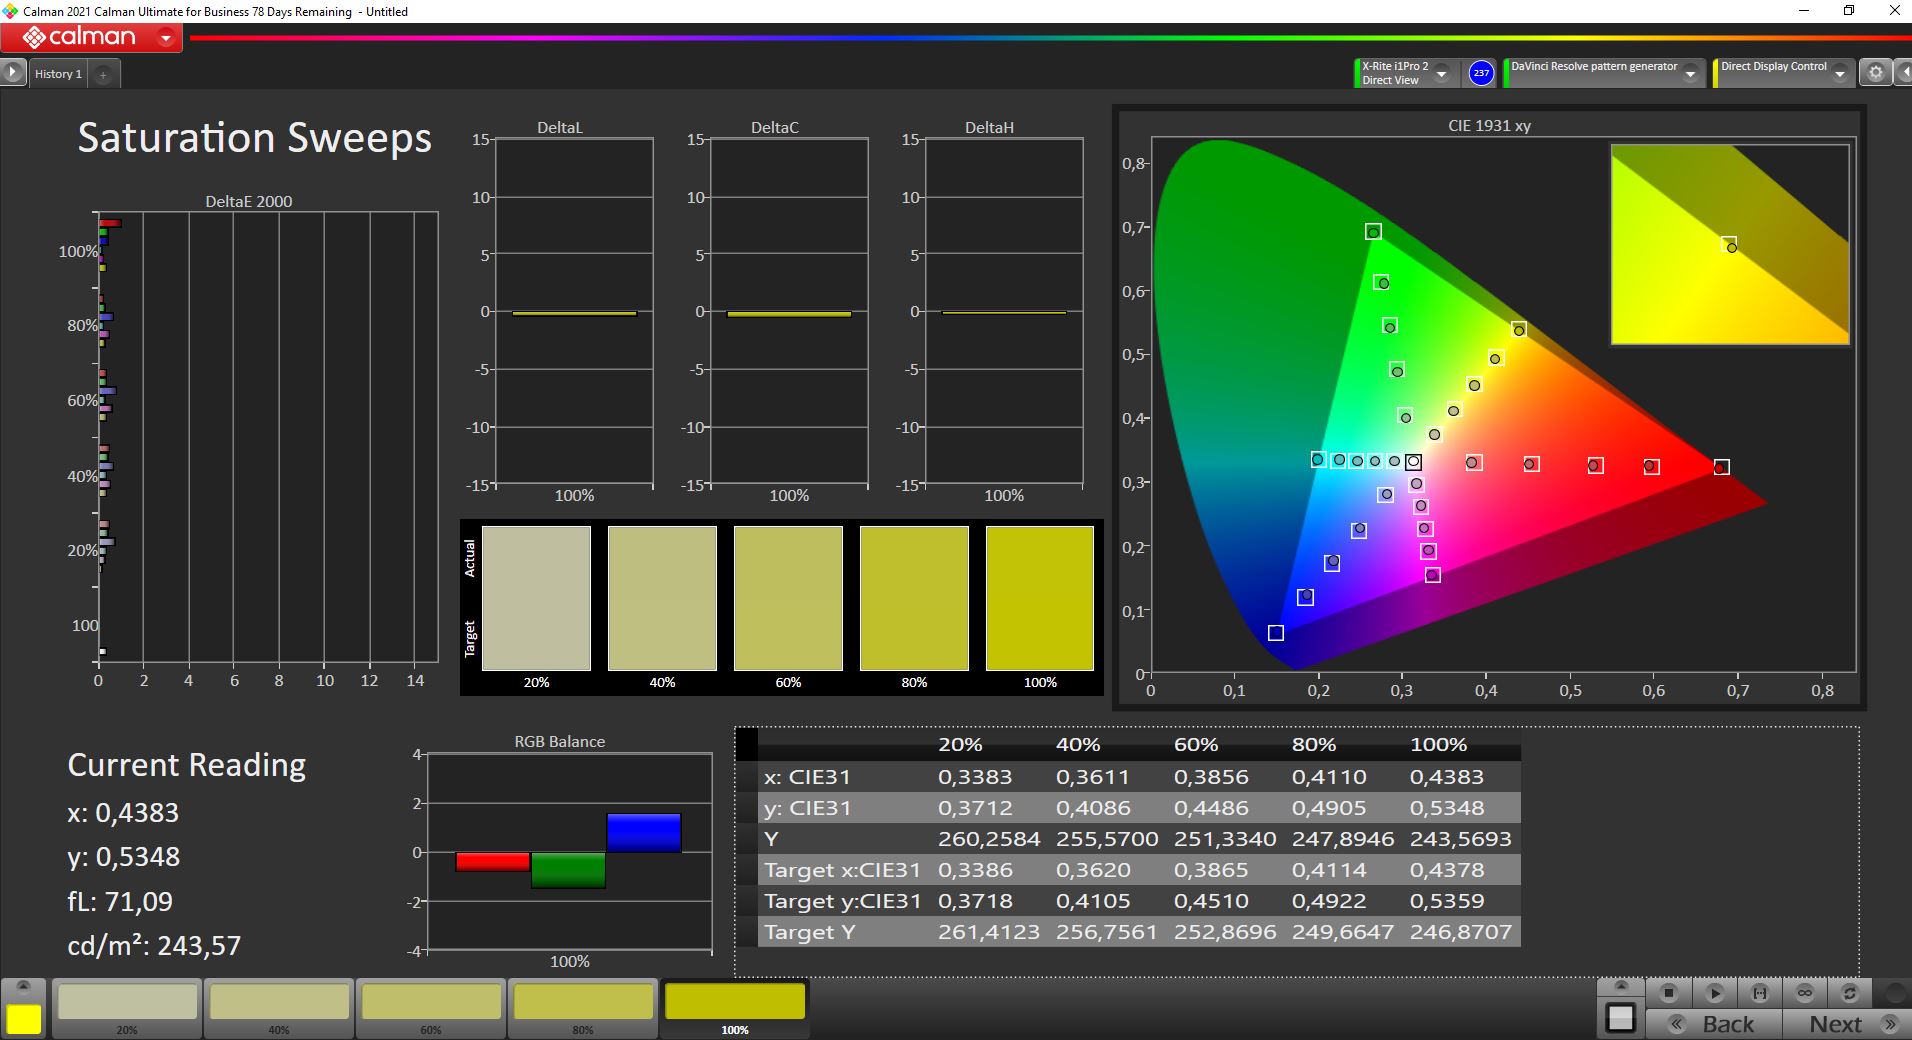

The display covers the P3 color space almost completely, and the panel is already very well calibrated in its factory state. There is no color cast in the grayscale and all color deviations are below the important mark of 3. We can still improve the display minimally with our calibration, but you can only see that in the measured values. Thus, the new iMac 24 is suitable for editing pictures/videos without restrictions.
Display Response Times
| ↔ Response Time Black to White | ||
|---|---|---|
| 17.6 ms ... rise ↗ and fall ↘ combined | ↗ 10 ms rise | 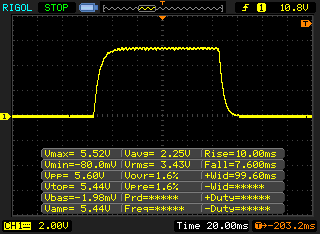 |
| ↘ 7.6 ms fall | ||
| The screen shows good response rates in our tests, but may be too slow for competitive gamers. In comparison, all tested devices range from 0.1 (minimum) to 240 (maximum) ms. » 40 % of all devices are better. This means that the measured response time is better than the average of all tested devices (19.8 ms). | ||
| ↔ Response Time 50% Grey to 80% Grey | ||
| 29.2 ms ... rise ↗ and fall ↘ combined | ↗ 15.6 ms rise | 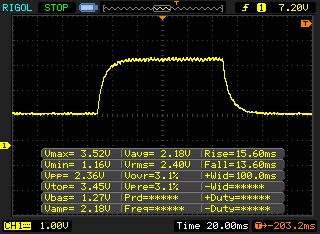 |
| ↘ 13.6 ms fall | ||
| The screen shows relatively slow response rates in our tests and may be too slow for gamers. In comparison, all tested devices range from 0.165 (minimum) to 636 (maximum) ms. » 40 % of all devices are better. This means that the measured response time is similar to the average of all tested devices (31 ms). | ||
Screen Flickering / PWM (Pulse-Width Modulation)
| Screen flickering / PWM not detected | 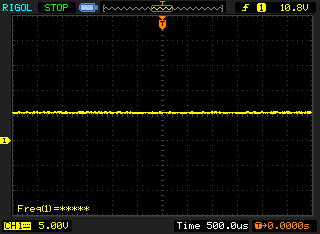 | ||
In comparison: 52 % of all tested devices do not use PWM to dim the display. If PWM was detected, an average of 7750 (minimum: 5 - maximum: 343500) Hz was measured. | |||
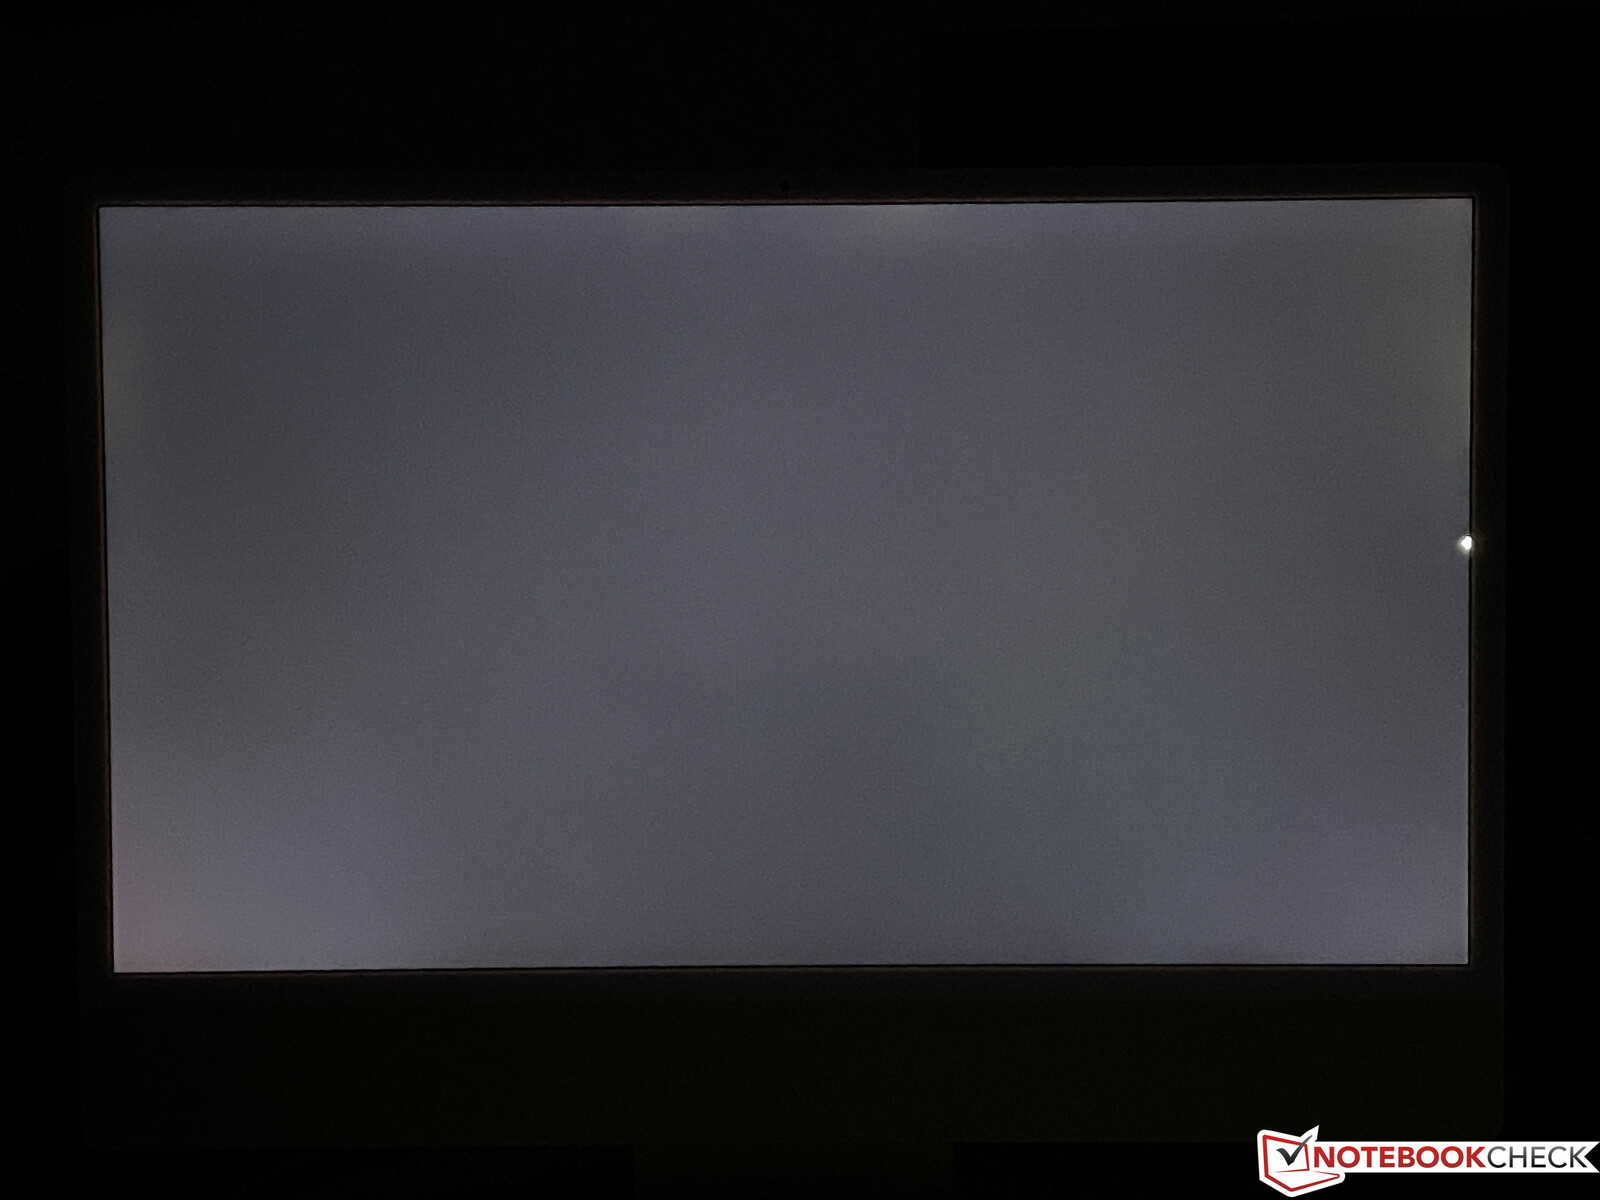
The viewing angle stability of the IPS screen is very good. However, you should not place the iMac 24 opposite windows due to the glossy surface, otherwise you might have problems with reflections. At full brightness and a dark background you can also see clear halos. In this respect the previous iMacs were better.
Performance and emissions
The Apple M1 SoC we already know from the MacBook Air, MacBook Pro 13 and the Mac Mini. Two fans are used in the iMac with 8 GPU cores (model with 7 GPU cores only one fan), which is why the performance is stable. The results are on par with the Mac Mini as well as the MacBook Pro 13. In practice, the iMac 24 is an extremely responsive system, but the old Intel models offer even more performance, especially in multi-core tests.
The system is only suitable for gaming to a limited extent because not many titles are supported. However, thanks to the ARM base, you have access to Apple's arcade collection, which you can get from the iPhones and iPads. We also really like the 6 speakers that can easily replace cheap external speakers. Apple uses the space in the case cleverly and the built-in modules will be completely sufficient for most users.
We were surprised by the loud cooling. In everyday use (browsing, videos), the system is almost always silent and even pure GPU load is practically inaudible, but under high CPU load, the two fans quickly reach more than 40 dB(A), both in native and emulated apps. We can even measure a maximum of 46 dB(A). When compared to the Mac Mini, which remains practically inaudible at the same performance, the new iMac 24 simply gets much too loud under load.
The included 143-watt power supply is perfectly sufficient and still has enough reserves for Thunderbolt or USB-C accessories, because we could measure a maximum of ~79 watts even in the stress test at full brightness.
Cinebench R15 Multi Endurance test
Cinebench R23: Multi Core | Single Core
Cinebench R20: CPU (Multi Core) | CPU (Single Core)
Cinebench R15: CPU Multi 64Bit | CPU Single 64Bit
Geekbench 5.5: Multi-Core | Single-Core
| CPU Performance rating | |
| Average of class Desktop | |
| Apple iMac 27 Mid 2020 -2! | |
| Apple MacBook Pro 13 Late 2020 M1 Entry (8 / 256 GB) | |
| Apple iMac 24 M1 2021 | |
| Average Apple M1 | |
| Apple iMac Pro -6! | |
| Apple Mac Mini Late 2020 Entry (M1, 8GB) -1! | |
| Apple MacBook Pro 16 2019 i9 5500M | |
| Cinebench R23 / Multi Core | |
| Average of class Desktop (16119 - 44253, n=16, last 2 years) | |
| Apple MacBook Pro 16 2019 i9 5500M | |
| Apple MacBook Pro 16 2019 i9 5500M | |
| Apple MacBook Pro 13 Late 2020 M1 Entry (8 / 256 GB) | |
| Apple iMac 24 M1 2021 | |
| Apple Mac Mini Late 2020 Entry (M1, 8GB) | |
| Average Apple M1 (7409 - 7830, n=6) | |
| Cinebench R23 / Single Core | |
| Average of class Desktop (1722 - 2439, n=16, last 2 years) | |
| Apple Mac Mini Late 2020 Entry (M1, 8GB) | |
| Apple MacBook Pro 13 Late 2020 M1 Entry (8 / 256 GB) | |
| Average Apple M1 (1496 - 1520, n=6) | |
| Apple iMac 24 M1 2021 | |
| Apple MacBook Pro 16 2019 i9 5500M | |
| Cinebench R20 / CPU (Multi Core) | |
| Average of class Desktop (5710 - 17190, n=15, last 2 years) | |
| Apple iMac 27 Mid 2020 | |
| Apple MacBook Pro 16 2019 i9 5500M | |
| Apple MacBook Pro 16 2019 i9 5500M | |
| Apple MacBook Pro 13 Late 2020 M1 Entry (8 / 256 GB) | |
| Apple iMac 24 M1 2021 | |
| Apple Mac Mini Late 2020 Entry (M1, 8GB) | |
| Average Apple M1 (1863 - 2109, n=4) | |
| Cinebench R20 / CPU (Single Core) | |
| Average of class Desktop (674 - 922, n=15, last 2 years) | |
| Apple iMac 27 Mid 2020 | |
| Apple MacBook Pro 16 2019 i9 5500M | |
| Apple MacBook Pro 16 2019 i9 5500M | |
| Apple MacBook Pro 13 Late 2020 M1 Entry (8 / 256 GB) | |
| Apple Mac Mini Late 2020 Entry (M1, 8GB) | |
| Average Apple M1 (401 - 406, n=4) | |
| Apple iMac 24 M1 2021 | |
| Cinebench R15 / CPU Multi 64Bit | |
| Average of class Desktop (2652 - 6656, n=16, last 2 years) | |
| Apple iMac 27 Mid 2020 | |
| Apple iMac Pro | |
| Apple iMac Pro | |
| Apple MacBook Pro 16 2019 i9 5500M | |
| Apple MacBook Pro 16 2019 i9 5500M | |
| Apple Mac Mini Late 2020 Entry (M1, 8GB) | |
| Apple iMac 24 M1 2021 | |
| Apple MacBook Pro 13 Late 2020 M1 Entry (8 / 256 GB) | |
| Average Apple M1 (1020 - 1087, n=4) | |
| Cinebench R15 / CPU Single 64Bit | |
| Average of class Desktop (246 - 356, n=16, last 2 years) | |
| Apple iMac 27 Mid 2020 | |
| Apple MacBook Pro 13 Late 2020 M1 Entry (8 / 256 GB) | |
| Average Apple M1 (206 - 208, n=3) | |
| Apple iMac 24 M1 2021 | |
| Apple MacBook Pro 16 2019 i9 5500M | |
| Apple MacBook Pro 16 2019 i9 5500M | |
| Apple iMac Pro | |
| Geekbench 5.5 / Multi-Core | |
| Average of class Desktop (12626 - 28535, n=30, last 2 years) | |
| Apple iMac 27 Mid 2020 | |
| Apple iMac 24 M1 2021 | |
| Apple Mac Mini Late 2020 Entry (M1, 8GB) | |
| Apple MacBook Pro 13 Late 2020 M1 Entry (8 / 256 GB) | |
| Average Apple M1 (7034 - 7710, n=9) | |
| Apple MacBook Pro 16 2019 i9 5500M | |
| Geekbench 5.5 / Single-Core | |
| Average of class Desktop (1755 - 2597, n=30, last 2 years) | |
| Apple Mac Mini Late 2020 Entry (M1, 8GB) | |
| Apple MacBook Pro 13 Late 2020 M1 Entry (8 / 256 GB) | |
| Apple iMac 24 M1 2021 | |
| Average Apple M1 (1710 - 1745, n=9) | |
| Apple iMac 27 Mid 2020 | |
| Apple MacBook Pro 16 2019 i9 5500M | |
WebXPRT 3: Overall
Octane V2: Total Score
Mozilla Kraken 1.1: Total
Speedometer 2.0: Result 2.0
Blackmagic Disk Speed Test: 5GB Read | 5GB Write
| Jetstream 2 / 2.0 Total | |
| Apple iMac 27 Mid 2020 | |
| Average Apple M1, Apple M1 8-Core GPU (175.4 - 184.3, n=6) | |
| Apple MacBook Pro 13 Late 2020 M1 Entry (8 / 256 GB) | |
| Apple Mac Mini Late 2020 Entry (M1, 8GB) | |
| Apple iMac 24 M1 2021 | |
| WebXPRT 3 / Overall | |
| Average of class Desktop (262 - 409, n=15, last 2 years) | |
| Apple Mac Mini Late 2020 Entry (M1, 8GB) | |
| Apple MacBook Pro 13 Late 2020 M1 Entry (8 / 256 GB) | |
| Apple iMac 24 M1 2021 | |
| Average Apple M1, Apple M1 8-Core GPU (216 - 293, n=6) | |
| Apple iMac 27 Mid 2020 | |
| Apple MacBook Pro 16 2019 i9 5500M | |
| Octane V2 / Total Score | |
| Average Apple M1, Apple M1 8-Core GPU (62055 - 66974, n=6) | |
| Apple Mac Mini Late 2020 Entry (M1, 8GB) | |
| Apple MacBook Pro 13 Late 2020 M1 Entry (8 / 256 GB) | |
| Apple iMac 24 M1 2021 | |
| Apple iMac 27 Mid 2020 | |
| Apple iMac Pro | |
| Mozilla Kraken 1.1 / Total | |
| Apple MacBook Pro 16 2019 i9 5500M | |
| Apple iMac 27 Mid 2020 | |
| Apple iMac Pro | |
| Apple MacBook Pro 13 Late 2020 M1 Entry (8 / 256 GB) | |
| Average Apple M1, Apple M1 8-Core GPU (446 - 516, n=6) | |
| Apple iMac 24 M1 2021 | |
| Apple Mac Mini Late 2020 Entry (M1, 8GB) | |
| Average of class Desktop (377 - 561, n=15, last 2 years) | |
| Speedometer 2.0 / Result 2.0 | |
| Average Apple M1, Apple M1 8-Core GPU (209 - 255, n=6) | |
| Apple Mac Mini Late 2020 Entry (M1, 8GB) | |
| Apple iMac 24 M1 2021 | |
| Apple MacBook Pro 13 Late 2020 M1 Entry (8 / 256 GB) | |
| Apple iMac 27 Mid 2020 | |
| Blackmagic Disk Speed Test / 5GB Read | |
| Apple Mac Mini Late 2020 Entry (M1, 8GB) | |
| Apple iMac 24 M1 2021 | |
| Average Apple M1, Apple M1 8-Core GPU (2728 - 2870, n=4) | |
| Apple MacBook Pro 13 Late 2020 M1 Entry (8 / 256 GB) | |
| Apple MacBook Pro 16 2019 i9 5500M | |
| Blackmagic Disk Speed Test / 5GB Write | |
| Apple MacBook Pro 16 2019 i9 5500M | |
| Apple iMac 24 M1 2021 | |
| Average Apple M1, Apple M1 8-Core GPU (2194 - 2895, n=4) | |
| Apple Mac Mini Late 2020 Entry (M1, 8GB) | |
| Apple MacBook Pro 13 Late 2020 M1 Entry (8 / 256 GB) | |
* ... smaller is better
| low | med. | high | ultra | |
|---|---|---|---|---|
| Total War: Three Kingdoms (2019) | 100 | 33 | 20 | 15 |
| Borderlands 3 (2019) | 54 | 33 | 20 |
| Apple iMac 24 M1 2021 M1 8-Core GPU, M1, Apple SSD AP0512 | Apple iMac 27 Mid 2020 Radeon RX 5700 XT (Desktop), i9-10910, Apple SSD AP1024 | Apple iMac Pro Pro Vega 56, W-2145 | Apple Mac Mini Late 2020 Entry (M1, 8GB) M1 8-Core GPU, M1, Apple SSD AP0256 | Apple MacBook Pro 13 Late 2020 M1 Entry (8 / 256 GB) M1 8-Core GPU, M1, Apple SSD AP0256 | |
|---|---|---|---|---|---|
| Noise | -21% | -25% | -17% | ||
| off / environment * (dB) | 24.2 | 29.1 -20% | 29.1 -20% | 29.2 -21% | |
| Idle Minimum * (dB) | 24.2 | 29.7 -23% | 29.8 -23% | 29.2 -21% | |
| Idle Average * (dB) | 24.2 | 29.7 -23% | 29.8 -23% | 29.2 -21% | |
| Idle Maximum * (dB) | 24.2 | 29.7 -23% | 29.8 -23% | 29.2 -21% | |
| Load Average * (dB) | 25 | 35 -40% | 39.7 -59% | 32.1 -28% | |
| Load Maximum * (dB) | 46 | 43.6 5% | 47.9 -4% | 41.9 9% | |
| Witcher 3 ultra * (dB) | 35 |
* ... smaller is better
Noise level
| Idle |
| 24.2 / 24.2 / 24.2 dB(A) |
| Load |
| 25 / 46 dB(A) |
 | ||
30 dB silent 40 dB(A) audible 50 dB(A) loud |
||
min: | ||
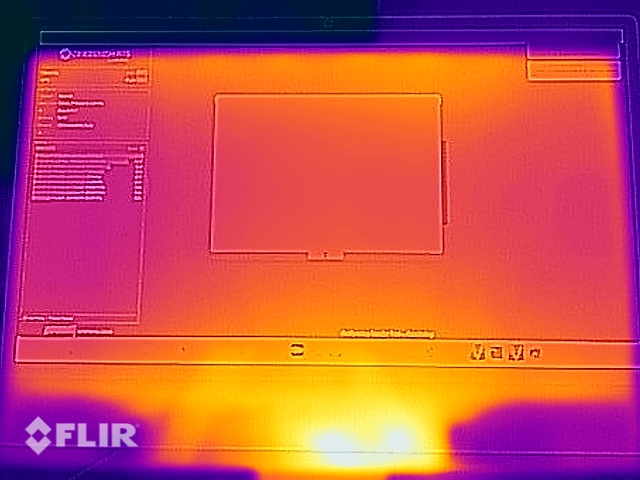
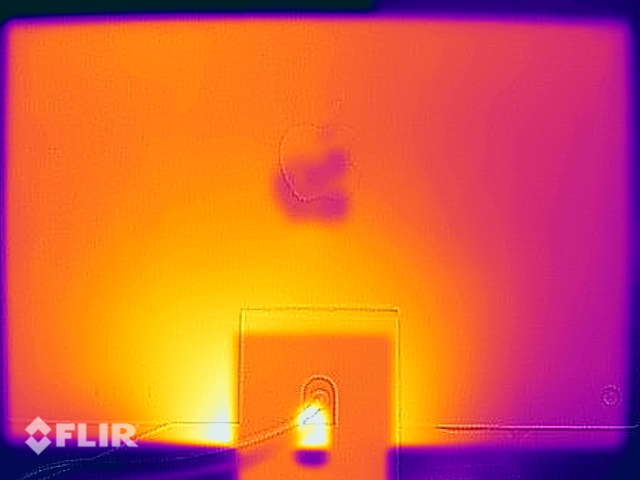
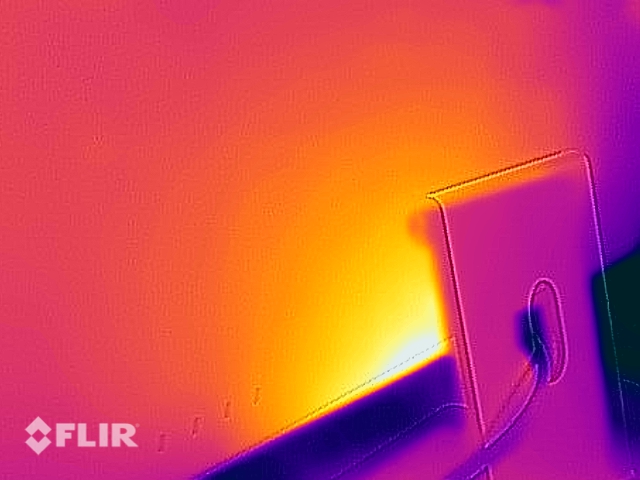
(+) The maximum temperature on the upper side is 39.1 °C / 102 F, compared to the average of 33.9 °C / 93 F, ranging from 25 to 47 °C for the class Desktop.
(+) The bottom heats up to a maximum of 38.1 °C / 101 F, compared to the average of 33.6 °C / 92 F
(+) In idle usage, the average temperature for the upper side is 26.2 °C / 79 F, compared to the device average of 29.5 °C / 85 F.
Apple iMac 24 M1 2021 audio analysis
(+) | speakers can play relatively loud (86.9 dB)
Bass 100 - 315 Hz
(+) | good bass - only 1.3% away from median
(+) | bass is linear (4.7% delta to prev. frequency)
Mids 400 - 2000 Hz
(+) | balanced mids - only 2.6% away from median
(+) | mids are linear (4.3% delta to prev. frequency)
Highs 2 - 16 kHz
(+) | balanced highs - only 2% away from median
(+) | highs are linear (4.2% delta to prev. frequency)
Overall 100 - 16.000 Hz
(+) | overall sound is linear (5.9% difference to median)
Compared to same class
» 0% of all tested devices in this class were better, 11% similar, 89% worse
» The best had a delta of 6%, average was 16%, worst was 46%
Compared to all devices tested
» 0% of all tested devices were better, 0% similar, 100% worse
» The best had a delta of 4%, average was 23%, worst was 134%
Apple iMac 27 Mid 2020 audio analysis
(+) | speakers can play relatively loud (82.9 dB)
Bass 100 - 315 Hz
(+) | good bass - only 2.6% away from median
(+) | bass is linear (4.2% delta to prev. frequency)
Mids 400 - 2000 Hz
(+) | balanced mids - only 1.7% away from median
(+) | mids are linear (5% delta to prev. frequency)
Highs 2 - 16 kHz
(±) | reduced highs - on average 7.3% lower than median
(+) | highs are linear (5.1% delta to prev. frequency)
Overall 100 - 16.000 Hz
(+) | overall sound is linear (8.7% difference to median)
Compared to same class
» 22% of all tested devices in this class were better, 11% similar, 67% worse
» The best had a delta of 6%, average was 16%, worst was 46%
Compared to all devices tested
» 3% of all tested devices were better, 1% similar, 97% worse
» The best had a delta of 4%, average was 23%, worst was 134%
| Off / Standby | |
| Idle | |
| Load |
|
Key:
min: | |
| Apple iMac 24 M1 2021 M1, M1 8-Core GPU, Apple SSD AP0512, IPS, 4480x2520, 23.5" | Apple iMac 27 Mid 2020 i9-10910, Radeon RX 5700 XT (Desktop), Apple SSD AP1024, IPS, 5120x2880, 27" | Apple iMac Pro W-2145, Pro Vega 56, , , 5120x2880, 27" | Average Apple M1 8-Core GPU | Average of class Desktop | |
|---|---|---|---|---|---|
| Power Consumption | -189% | -265% | 64% | -43% | |
| Idle Minimum * (Watt) | 9.7 | 27.6 -185% | 49.5 -410% | 3.34 ? 66% | 17.9 ? -85% |
| Idle Average * (Watt) | 42.3 | 64.7 -53% | 86.7 -105% | 14.6 ? 65% | 37.2 ? 12% |
| Idle Maximum * (Watt) | 42.6 | 65.3 -53% | 88.9 -109% | 13.3 ? 69% | 41.3 ? 3% |
| Load Average * (Watt) | 59.2 | 162 -174% | 150.1 -154% | 23 ? 61% | 96.7 ? -63% |
| Witcher 3 ultra * (Watt) | 59.2 | 247 -317% | |||
| Load Maximum * (Watt) | 78.7 | 354 -350% | 508.5 -546% | 33.2 ? 58% | 141.6 ? -80% |
* ... smaller is better
Energy consumption Unigine Valley / Stress test
Pros
Cons
Verdict - The iMac gets too loud
The new iMac 24 M1 replaces the previous iMac 21.5 and is primarily suitable for everyday tasks with the M1 processor. Here, the all-in-one can also convince with a silent operation, but the iMac gets too loud during high CPU loads (e.g. video editing), especially in comparison with the Mac Mini M1. The larger iMac 27 is still in the lineup and offers more performance with the Intel CPUs and can also be equipped with significantly more memory and dedicated GPUs, so it remains the better (but also more expensive) solution for demanding users.
The new 23.5-inch IPS display leaves a very good impression and is also suitable for color-accurate editing of pictures or videos. The user experience is improved, especially thanks to features like True Tone or the sensitive brightness sensor. The new speaker system is also convincing and can easily replace many inexpensive external speakers.
The Apple iMac 24 M1 is a good all-in-one computer for everyday use, where you will have a lot of fun with the screen and the speakers. However, the iMac gets significantly too loud under load and there are also no maintenance options.
Besides the too loud fans under high CPU load, the same disadvantages remain that we already know from the previous iMacs. The ports on the back are difficult to reach, there are now no maintenance options at all, and the included keyboard is hardly convincing due to the short key travel and the lack of backlight. Furthermore, you have to decide whether you want to use the iMac 24 with the stand or a VESA mount before buying it.
Price and availability
Our test unit of the new iMac 24 M1 is available at online stores like Cyberport for 1,869 Euro (~$2170) available. The cheapest model (silver) with 256 GB SSD storage and the slightly slower 7-core GPU, which is also perfectly sufficient for everyday use, starts at Amazon US for around $1,299.
Apple iMac 24 M1 2021
- 10/17/2021 v7 (old)
Andreas Osthoff
Price comparison

