Notebook reviews with NVIDIA GeForce GT 730M graphics card
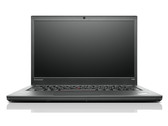
Lenovo ThinkPad T440s 20AQ006BGE Ultrabook Review Update
More power for business. The small ThinkPad is equipped with high quality components: Core i7 processor, full HD IPS display, fast SSD, 3G modem and GeForce gra...
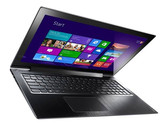
Intel Core i7-4600U | NVIDIA GeForce GT 730M | 14.00" | 1.5 kgReview Lenovo IdeaPad U530 Touch Notebook
Quiet worker. A conservative Intel Core i7, a dedicated graphics card from Nvidia and a fast SSD ensure great system performance. The manufacturer promises and ...
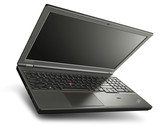
Intel Core i7-4500U | NVIDIA GeForce GT 730M | 15.60" | 2.3 kgReview Lenovo ThinkPad T540p-20BE005YGE Notebook
Old-school ThinkPad? Performance, security and office qualities are very important aspects of the new Lenovo ThinkPad T540p. Our review shows what the top versi...
Intel Core i7-4700MQ | NVIDIA GeForce GT 730M | 15.50" | 2.6 kgReview Update Asus Zenbook UX302LG-C4014H Ultrabook
Ultimate rush. Which tech specs does the technically savvy user find most compelling? A beefy CPU, lightning-fast SSD, and a potent graphics card propel an Ultr...
Intel Core i7-4500U | NVIDIA GeForce GT 730M | 13.30" | 1.6 kg
Review Lenovo ThinkPad T440p 20AN-006VGE Notebook
Imperfect. The Lenovo ThinkPad T440p belongs to a line of classic business notebooks and aims itself at professional users in particular. With high-performance ...
Intel Core i7-4700MQ | NVIDIA GeForce GT 730M | 14.00" | 2.2 kgToshiba Tecra A50-A-12Z: Intel Core i5-4300M, 15.60", 2.6 kg
Review » Review Toshiba Tecra A50-A-12Z Notebook
Lenovo IdeaPad U430 Touch 59372369: Intel Core i5-4200U, 14.00", 1.9 kg
Review » Review Lenovo IdeaPad U430 Touch Ultrabook
Acer Aspire TimelineU M3-581PTG-53334G25Makk: Intel Core i5-3337U, 15.60", 2.3 kg
Review » Review Acer Aspire TimelineU M3-581PTG Ultrabook
Acer Aspire V3-571G-53238G1TMaii: Intel Core i5-3230M, 15.60", 2.6 kg
Review » Review Acer Aspire V3-571G-53238G1TMaii Notebook
Asus ASUSPRO BU401LG: Intel Core i7-4500U, 14.00", 1.7 kg
External Review » Asus ASUSPRO BU401LG
Lenovo IdeaPad U530 Touch: Intel Core i7-4500U, 15.60", 2.3 kg
External Review » Lenovo IdeaPad U530 Touch
Lenovo IdeaPad U430-59399823: Intel Core i5-4200U, 14.00", 1.9 kg
External Review » Lenovo IdeaPad U430-59399823
Lenovo ThinkPad T540p-20BFA0AVPB: Intel Core i5-4200M, 15.60", 2.5 kg
External Review » Lenovo ThinkPad T540p-20BFA0AVPB
Lenovo ThinkPad T540p-20BE0086GE: Intel Core i7-4700MQ, 15.60", 2.5 kg
External Review » Lenovo ThinkPad T540p-20BE0086GE
Toshiba Tecra A50-A-12Z: Intel Core i5-4300M, 15.60", 2.6 kg
External Review » Toshiba Tecra A50-A-12Z
Lenovo IdeaPad U430p: Intel Core i3-4010U, 14.00", 1.7 kg
External Review » Lenovo IdeaPad U430p
Asus Zenbook UX302LA-C4009H: Intel Core i7-4500U, 13.30", 1.5 kg
External Review » Asus Zenbook UX302LA-C4009H
Asus Zenbook UX302LG-C4007P: Intel Core i7-4500U, 13.30", 1.6 kg
External Review » Asus Zenbook UX302LG-C4007P
Lenovo ThinkPad T440p: Intel Core i7-4600M, 14.00", 2.2 kg
External Review » Lenovo ThinkPad T440p
Lenovo ThinkPad T440p 20AN-006VGE: Intel Core i7-4700MQ, 14.00", 2.2 kg
External Review » Lenovo ThinkPad T440p 20AN-006VGE
Lenovo ThinkPad T540p-20BE005YGE: Intel Core i7-4700MQ, 15.50", 2.6 kg
External Review » Lenovo ThinkPad T540p-20BE005YGE
Acer Aspire V3-571G-53238G1TMakk: Intel Core i5-3230M, 15.60", 2.6 kg
External Review » Acer Aspire V3-571G-53238G1TMakk
Lenovo IdeaPad U430 Touch 59372369: Intel Core i5-4200U, 14.00", 1.9 kg
External Review » Lenovo IdeaPad U430 Touch 59372369
Lenovo IdeaPad Z500-59367049: Intel Core i5-3320M, 15.60", 2.2 kg
External Review » Lenovo IdeaPad Z500-59367049
Acer Aspire V3-571G-53238G75: Intel Core i5-3230M, 15.60", 2.6 kg
External Review » Acer Aspire V3-571G-53238G75
Gigabyte U2442T-CF1: Intel Core i5-3230M, 14.00", 1.7 kg
External Review » Gigabyte U2442T-CF1
HP Pavilion m4-1003tx: Intel Core i5-3230M, 14.00", 2 kg
External Review » HP Pavilion m4-1003tx
Asus Transformer P1801-B068K: AMD Athlon Neo X2 L335, 18.40", 6.5 kg
External Review » Asus Transformer P1801-B068K
Asus Transformer AiO P1801: Intel Core i3-3220, 18.40", 6.5 kg
External Review » Asus Transformer AiO P1801
Acer Aspire V3-571G-9683: Intel Core i7-3630QM, 15.60", 2.6 kg
External Review » Acer Aspire V3-571G-9683
Acer Aspire V3-571G-53238G1TMaii: Intel Core i5-3230M, 15.60", 2.6 kg
External Review » Acer Aspire V3-571G-53238G1TMaii
Gigabyte U2442D-CF1: Intel Core i5-3230M, 14.00", 1.6 kg
External Review » Gigabyte U2442D-CF1