Notebook reviews with Intel UHD Graphics 64EUs (Alder Lake 12th Gen) graphics card
Beautiful, fast, but power-hungry: The Samsung Galaxy Chromebook Plus review
The Samsung Galaxy Chromebook Plus impresses with its ultra-slim aluminum body and exceptionally brilliant AMOLED display that sets new standards in this class....
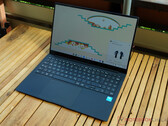
Intel Core 3 100U | Intel UHD Graphics 64EUs (Alder Lake 12th Gen) | 15.60" | 1.2 kgLenovo IdeaPad Flex 5 Chromebook Plus review: Elegant convertible with strong performance
This works well together and covers many areas of use. The Lenovo 2-in-1 laptop also serves as a powerful tablet with pen input and is fully compatible with man...
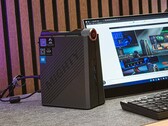
Intel Core i3-1315U | Intel UHD Graphics 64EUs (Alder Lake 12th Gen) | 14.00" | 1.6 kgNipogi AD08 mini PC review: The stylish PC with an Intel Core i7-12650H features a mini-tower design and three power modes
NiPoGi has given its AD08 an Intel Core i7-12650H which delivers enough performance to master everyday office tasks. As a compact gaming PC taking on a tower fo...
Intel Core i7-12650H | Intel UHD Graphics 64EUs (Alder Lake 12th Gen) | 878 gNipogi AD08 mini PC review: The stylish PC with an Intel Core i7-12650H features a mini-tower design and three power modes
NiPoGi has given its AD08 an Intel Core i7-12650H which delivers enough performance to master everyday office tasks. As a compact gaming PC taking on a tower fo...
Intel Core i7-12650H | Intel UHD Graphics 64EUs (Alder Lake 12th Gen) | 878 gHP 250 G9 7N029ES: Intel Core i3-1215U, 15.60", 1.7 kg
Review » HP 250 G9 review - An affordable office laptop with a Core i3 and an IPS panel
Geekom Mini IT12: Intel Core i5-12450H, 0.6 kg
Review » Geekom Mini IT12 with Intel Core i5-12450H in review - Mini PC with good performance and two USB 4 ports
NiPoGi CK10: Intel Core i5-12450H, 0.5 kg
Review » NiPoGi CK10 review - The mini PC with an Intel Core i5-12450H and 16 GB RAM falls short of expectations
Minisforum Venus Series UN1245: Intel Core i5-12450H, 0.5 kg
Review » Minisforum Venus Series UN1245 review: A powerful mini PC with an Intel Core i5-12450H starting at $310
GMK NucBox K3 Pro: Intel Core i7-12650H, 0.4 kg
Review » GMK NucBox K3 Pro mini PC review: The NucBox K2 is better
Minisforum Venus Series NAB6: Intel Core i7-12650H, 0.6 kg
Review » Minisforum Venus Series NAB6 review: The sleek mini PC with a fast Intel Core i7-12650H and active SSD cooling!
Lenovo IdeaPad Flex 5 14IAU7-82R7007TGE: Intel Core i3-1215U, 14.00", 1.6 kg
Review » Lenovo IdeaPad Flex 5 convertible review: Powerful entry of the small i3-1215U
Lenovo V15 G4 IRU, i3-1315U: Intel Core i3-1315U, 15.60", 1.7 kg
External Review » Lenovo V15 G4 IRU, i3-1315U
Acer Chromebook Plus 516 GE CBG516-2H, Core 3 100U: Intel Core 3 100U, 16.00", 0 kg
External Review » Acer Chromebook Plus 516 GE CBG516-2H, Core 3 100U
Acer Aspire Go 15 AG15-71P: Intel Core i7-13620H, 15.60", 1.8 kg
External Review » Acer Aspire Go 15 AG15-71P
Asus Vivobook S16 S3607VA: Intel Core i7-13620H, 16.00", 1.8 kg
External Review » Asus Vivobook S16 S3607VA
Asus ExpertBook P3 P3405CVA: Intel Core i7-13620H, 14.00", 1.4 kg
External Review » Asus ExpertBook P3 P3405CVA
Asus VivoBook 16 X1605VA, i3-1315U: Intel Core i3-1315U, 16.00", 1.9 kg
External Review » Asus VivoBook 16 X1605VA, i3-1315U
Acer Chromebook Plus 514 CBE594-2T: Intel Core 3 100U, 14.00", 1.4 kg
External Review » Acer Chromebook Plus 514 CBE594-2T
Asus ExpertBook P3 P3605CVA: Intel Core i7-13620H, 16.00", 1.8 kg
External Review » Asus ExpertBook P3 P3605CVA
Asus ExpertBook P1 P1403CVA: Intel Core i7-13620H, 14.00", 1.4 kg
External Review » Asus ExpertBook P1 P1403CVA
Lenovo V15 G5 IRL: Intel Core 7 240H, 15.60", 1.6 kg
External Review » Lenovo V15 G5 IRL
Asus ExpertBook P1 P1503CVA, i7-13620H: Intel Core i7-13620H, 15.60", 1.6 kg
External Review » Asus ExpertBook P1 P1503CVA, i7-13620H
Lenovo IP Flex 5 Chromebook Plus 14IAU7: Intel Core i3-1215U, 14.00", 1.6 kg
External Review » Lenovo IP Flex 5 Chromebook Plus 14IAU7
Dell Vostro 14 3440: Intel Core i3-1305U, 14.00", 1.6 kg
External Review » Dell Vostro 14 3440
Infinix Inbook X2 2025: Intel Core i5-1334U, 14.00", 1.2 kg
External Review » Infinix Inbook X2 2025
Acer Chromebook Plus 515 CBE595, Core 3 100U: Intel Core 3 100U, 15.60", 1.7 kg
External Review » Acer Chromebook Plus 515 CBE595, Core 3 100U
Acer Extensa 15 EX215-55: Intel Core i3-1215U, 15.60", 1.8 kg
External Review » Acer Extensa 15 EX215-55
Dell Inspiron 5440, i3-1305U: Intel Core i3-1305U, 14.00", 1.5 kg
External Review » Dell Inspiron 5440, i3-1305U
Acer Aspire 5 A515-57, i7-12650H: Intel Core i7-12650H, 15.60", 1.8 kg
External Review » Acer Aspire 5 A515-57, i7-12650H
Acer Chromebook Plus Spin 514 CP514-4HN: Intel Core 3 100U, 14.00", 1.5 kg
External Review » Acer Chromebook Plus Spin 514 CP514-4HN
Acer Aspire 5 A515-58P: Intel Core i3-1315U, 15.60", 1.8 kg
External Review » Acer Aspire 5 A515-58P
Samsung Galaxy Chromebook Plus XE550XGA: Intel Core 3 100U, 15.60", 1.2 kg
External Review » Samsung Galaxy Chromebook Plus XE550XGA
Acer Aspire Lite AL15-53: Intel Core i3-1305U, 15.60", 1.6 kg
External Review » Acer Aspire Lite AL15-53
Lenovo IdeaPad Slim 5 16IRL8: Intel Core i7-13620H, 16.00", 1.9 kg
External Review » Lenovo IdeaPad Slim 5 16IRL8
HP 14-dq5000: Intel Core i3-1215U, 14.00", 1.5 kg
External Review » HP 14-dq5000
Asus Vivobook 17 X1702, i3-1215: Intel Core i3-1215U, 17.30", 2.1 kg
External Review » Asus Vivobook 17 X1702, i3-1215
Acer TravelMate P2 TMP214-55: Intel Core i3-1315U, 14.00", 1.6 kg
External Review » Acer TravelMate P2 TMP214-55
Samsung Galaxy Book4 15: Intel Core 3 100U, 15.60", 1.6 kg
External Review » Samsung Galaxy Book4 15
Lenovo IdeaPad Slim 3 15IRH8, i7-13620H: Intel Core i7-13620H, 15.60", 1.6 kg
External Review » Lenovo IdeaPad Slim 3 15IRH8, i7-13620H
HP 14-ep0865no: Intel Core i3-1315U, 14.00", 2.2 kg
External Review » HP 14-ep0865no
Infinix Inbook Y4 Max: Intel Core i3-1315U, 16.00", 1.8 kg
External Review » Infinix Y4 Max
Asus Vivobook 14 X1404ZA: Intel Core i3-1215U, 14.00", 1.4 kg
External Review » Asus Vivobook 14 X1404ZA
Dell Vostro 3520, i3-1215U: Intel Core i3-1215U, 15.60", 1.7 kg
External Review » Dell Vostro 3520, i3-1215U
Dell Inspiron 15 3520, i3-1215U: Intel Core i3-1215U, 15.60", 1.9 kg
External Review » Dell Inspiron 15 3520, i3-1215U
Lenovo IdeaPad Slim 5 14IRL8: Intel Core i7-13620H, 14.00", 1.5 kg
External Review » Lenovo IdeaPad Slim 5 14IRL8
Lenovo IdeaPad Flex 5 14IRU8, i3-1315U: Intel Core i3-1315U, 14.00", 1.5 kg
External Review » Lenovo IdeaPad Flex 5 14IRU8, i3-1315U
HP 14-ee0035ng: Intel Core i3-1315U, 14.00", 1.4 kg
External Review » HP 14-ee0035ng
HP 240 G9: Intel Core i3-1215U, 14.00", 1.4 kg
External Review » HP 240 G9
Lenovo IdeaPad Slim 3 15IRU8: Intel Core i3-1315U, 15.60", 1.6 kg
External Review » Lenovo IdeaPad Slim 3 15IRU8
Acer Aspire 5 A514-55: Intel Core i3-1215U, 14.00", 1.7 kg
External Review » Acer Aspire 5 A514-55
Lenovo IP Flex 5 Chrome 14IAU7 Plus: Intel Core i3-1315U, 14.00", 1.6 kg
External Review » Lenovo IP Flex 5 Chrome 14IAU7
HP 15s-fq5000TU: Intel Core i3-1215U, 15.60", 1.7 kg
External Review » HP 15s-fq5000TU
Acer Chromebook Plus 515 CB515-2H: Intel Core i3-1215U, 15.60", 1.7 kg
External Review » Acer Chromebook Plus 515 CB515-2H
Asus Chromebook Plus CX3402: Intel Core i3-1215U, 14.00", 1.4 kg
External Review » Asus Chromebook Plus CX3402
Lenovo IP 5 Chrome 16IAU7: Intel Core i3-1215U, 16.00", 1.8 kg
External Review » Lenovo IP 5 Chrome 16IAU7
MSI Modern 15 B12M, i3-1215U: Intel Core i3-1215U, 15.60", 1.7 kg
External Review » MSI Modern 15 B12M, i3-1215U
HP Chromebook x360 14c-cd000: Intel Core i3-1215U, 14.00", 1.5 kg
External Review » HP Chromebook x360 14c-cd000
Acer Aspire 5 A515-58, i3-1315U: Intel Core i3-1315U, 15.60", 1.8 kg
External Review » Acer Aspire 5 A515-58, i3-1315U
Lenovo IdeaPad 3 14IAU7: Intel Core i3-1215U, 14.00", 1.4 kg
External Review » Lenovo IdeaPad 3 14IAU7
Asus ExpertBook B1 B1502CBA: Intel Core i3-1215U, 15.60", 1.7 kg
External Review » Asus ExpertBook B1 B1502CBA
Asus Vivobook 14 A1405VA, i3-1315U: Intel Core i3-1315U, 14.00", 1.6 kg
External Review » Asus Vivobook 14 A1405VA, i3-1315U
Asus Vivobook 14 A1405ZA: Intel Core i3-1215U, 14.00", 1.6 kg
External Review » Asus Vivobook 14 A1405ZA
Asus VivoBook 14 F1402ZA, i3-1215U: Intel Core i3-1215U, 14.00", 1.5 kg
External Review » Asus VivoBook 14 F1402ZA, i3-1215U
Acer Chromebook Vero 514 CBV514-1H-321H: Intel Core i3-1215U, 14.00", 1.5 kg
External Review » Acer Chromebook Vero 514 CBV514-1H-321H
Lenovo IdeaPad Duet 5 12IAU7, i3-1215U: Intel Core i3-1215U, 12.40", 0.8 kg
External Review » Lenovo IdeaPad Duet 5 12IAU7, i3-1215U
Nokia PureBook Pro 15, i3-1220P: Intel Core i3-1220P, 16.00", 2 kg
External Review » Nokia PureBook Pro 15, i3-1220P
Asus Vivobook 15 X1502ZA, i3-1220P: Intel Core i3-1220P, 15.60", 1.7 kg
External Review » Asus Vivobook 15 X1502ZA, i3-1220P
Asus Vivobook 16X X1603ZA, i3-1220P: Intel Core i3-1220P, 16.00", 1.9 kg
External Review » Asus Vivobook 16X X1603ZA, i3-1220P
Acer Aspire 5 A515-57-335Y: Intel Core i3-1220P, 15.60", 1.8 kg
External Review » Acer Aspire 5 A515-57-335Y
Lenovo IdeaPad Gaming Chromebook 16, i3-1215U: Intel Core i3-1215U, 16.00", 1.8 kg
External Review » Lenovo IdeaPad Gaming Chromebook 16, i3-1215U
Lenovo Ideapad 3 15IAU7-82RK001VGE: Intel Core i3-1215U, 15.60", 1.6 kg
External Review » Lenovo Ideapad 3 15IAU7-82RK001VGE
Acer Aspire 3 A315-59, i3-1215U: Intel Core i3-1215U, 15.60", 1.8 kg
External Review » Acer Aspire 3 A315-59, i3-1215U
Acer Swift 3 SF314-71-79ZW: Intel Core i7-12650H, 14.00", 1.4 kg
External Review » Acer Swift 3 SF314-71-79ZW
Acer Aspire 5 A515-57-3488: Intel Core i3-1215U, 15.60", 1.8 kg
External Review » Acer Aspire 5 A515-57-3488
Nokia PureBook Pro 17: Intel Core i3-1220P, 17.30", 2.5 kg
External Review » Nokia PureBook Pro 17
Geekom Mini IT12: Intel Core i5-12450H, 0.6 kg
» Geekom Mini IT12 with Intel Core i5-12450H reviewed
Lenovo IdeaPad Flex 5 14IAU7-82R7007TGE: Intel Core i3-1215U, 14.00", 1.6 kg
» Convertible with fitting equipment: Lenovo IdeaPad Flex 5 succeeds in the test