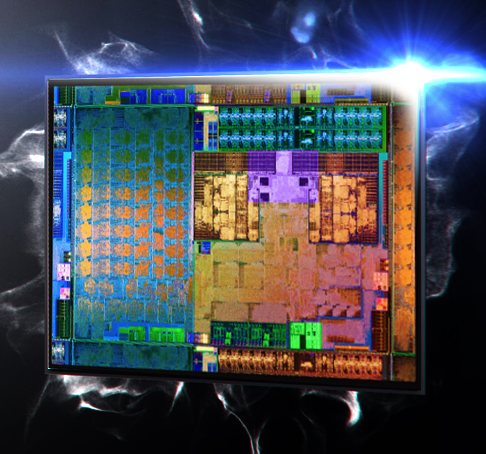
AMD Radeon R7 (Bristol Ridge)
The AMD Radeon R7 (Bristol Ridge) is an integrated graphics card for the fastest mobile AMD Carrizo APUs. At its launch, the R7 is available on the top model FX9830P with 512 GCN shader units and a core clock of 900 MHz. The technical specifications do not differ from the AMD Radeon R7 in Carrizo, but the clock is up to 100 MHz higher. Depending on the cooling and the configurable TDP (12-45 Watts), the performance can differ quite a lot. The performance also depends on the memory (best performance with dual-channel DDR4).
Architecture and Features
According to AMD, the Radeon R7 consists of eight cores based on the third GCN generation (often called GCN 1.2 or 2.0 in the press). It is therefore very similar to the Tonga desktop chip and supports DirectX 12 (FL 12_0). Furthermore, its shaders can be used with Mantle, OpenGL and OpenCL. HSA 1.0 is supported for running code on both CPU and GPU cores simultaneously.
Compared to the Kaveri generation (Kaveri R7 with GCN 1.1), the new color compression in particular results in better memory utilization and improves the gaming performance by 5-7 %.
The improved video decoder of Carrizo/Bristol Ridge now includes UVD 6 (Unified Video Decoder), which can decode HVEC / H.265 up to 4K in hardware. Furthermore, the VCE (Video Codec Engine) has been improved for faster transcoding of H.264. More information on architecture and features of the Bristol Ridge architecture can be found in our launch article.
Performance
Depending on the configurable TDP of the Bristol Ridge chips between 12 up to 45 Watts, there can be significant differences in games. Overall, the results are slightly better compared to the Carrizo Radeon R7 due to the higher clocks for comparable model. You can still use the Kaveri R7 benchmarks to check the gaming performance.
Power Consumption
Depending on the configurable TDP (cTDP), the 28 nm chip is specified at 12-45 Watts. It can therefore be used for thin and light notebooks as well as medium-sized devices or All-in-Ones (AiO).
Radeon R (Stoney / Bristol Ridge) Series Codename Bristol Ridge Architecture GCN 1.2 Pipelines 512 - unified Core Speed 900 (Boost) MHz Memory Bus Width 64/128 Bit Shared Memory yes API DirectX 12 (FL 12_0), OpenGL 4.4 Power Consumption 12-45 Watt Transistor Count 2.4 Billion technology 28 nm Features UVD 6, VCE Notebook Size medium sized Date of Announcement 01.06.2016
Benchmarks Performance Rating - 3DMark 11 + Fire Strike + Time Spy
0.5 pt (1%)
...
AMD Radeon R7 (Bristol Ridge)
...
max:
3DMark - 3DMark Time Spy Score
min: 338 avg: 364.7 median: 358 (1%) max: 398 Points
...
AMD Radeon R7 (Bristol Ridge)
...
max:
3DMark - 3DMark Time Spy Graphics
min: 325 avg: 343.7 median: 347 (1%) max: 359 Points
...
AMD Radeon R7 (Bristol Ridge)
...
max:
3DMark - 3DMark Ice Storm Unlimited Graphics
min: 34845 avg: 49654 median: 52245.5 (6%) max: 59281 Points
...
AMD Radeon R7 (Bristol Ridge)
...
max:
3DMark - 3DMark Ice Storm Extreme Graphics
min: 32062 avg: 34971 median: 32389 (4%) max: 40461 Points
...
AMD Radeon R7 (Bristol Ridge)
...
max:
3DMark - 3DMark Cloud Gate Score
min: 3162 avg: 4026 median: 3942 (4%) max: 5173 Points
...
AMD Radeon R7 (Bristol Ridge)
...
max:
3DMark - 3DMark Cloud Gate Graphics
min: 3477 avg: 5531 median: 5311 (1%) max: 8107 Points
...
AMD Radeon R7 (Bristol Ridge)
...
max:
3DMark - 3DMark Fire Strike Standard Score
min: 667 avg: 938 median: 866 (2%) max: 1230 Points
...
AMD Radeon R7 (Bristol Ridge)
...
max:
3DMark - 3DMark Fire Strike Standard Graphics
min: 750 avg: 1081 median: 1013 (1%) max: 1466 Points
...
AMD Radeon R7 (Bristol Ridge)
...
max:
3DMark - 3DMark Ice Storm Graphics
min: 44545 avg: 48082 median: 46007 (6%) max: 53693 Points
...
AMD Radeon R7 (Bristol Ridge)
...
max:
3DMark 11 - 3DM11 Performance Score
min: 1737 avg: 1859 median: 1794 (2%) max: 2130 Points
...
AMD Radeon R7 (Bristol Ridge)
...
max:
3DMark 11 - 3DM11 Performance GPU
min: 1820 avg: 1913 median: 1852 (2%) max: 2210 Points
...
AMD Radeon R7 (Bristol Ridge)
...
max:
3DMark Vantage + 3DMark Vantage - 3DM Vant. Perf. total
5568 Points (2%)
...
AMD Radeon R7 (Bristol Ridge)
...
max:
3DM Vant. Perf. GPU no PhysX + 3DMark Vantage - 3DM Vant. Perf. GPU no PhysX
5111 Points (3%)
...
AMD Radeon R7 (Bristol Ridge)
...
max:
3DMark 06 3DMark 06 - Standard 1280x1024 +
min: 5635 avg: 6645 median: 6644.5 (9%) max: 7654 Points
...
AMD Radeon R7 (Bristol Ridge)
...
max:
Unigine Valley 1.0 - Unigine Valley 1.0 DX
3.5 fps (1%)
AMD Radeon R7 (Bristol Ridge)
...
max:
Unigine Heaven 3.0 - Unigine Heaven 3.0 DX 11
13.9 fps (5%)
...
AMD Radeon R7 (Bristol Ridge)
...
Unigine Heaven 2.1 - Heaven 2.1 high
19.5 fps (4%)
...
AMD Radeon R7 (Bristol Ridge)
...
Cinebench R10 Cinebench R10 Shading (32bit) + Cinebench R10 - Cinebench R10 Shading (32bit)
min: 4680 avg: 4943 median: 4845 (3%) max: 5403 points
...
AMD Radeon R7 (Bristol Ridge)
...
Cinebench R11.5 Cinebench R11.5 OpenGL 64 Bit + Cinebench R11.5 - Cinebench R11.5 OpenGL 64 Bit
min: 18.06 avg: 20.1 median: 18.3 (6%) max: 25.65 fps
...
AMD Radeon R7 (Bristol Ridge)
...
max:
Cinebench R15 + Cinebench R15 - Cinebench R15 OpenGL 64 Bit
min: 22.88 avg: 25.1 median: 23.2 (1%) max: 31.43 fps
...
AMD Radeon R7 (Bristol Ridge)
...
Cinebench R15 OpenGL Ref. Match 64 Bit + Cinebench R15 - Cinebench R15 OpenGL Ref. Match 64 Bit
98 % (98%)
...
AMD Radeon R7 (Bristol Ridge)
...
GFXBench - GFXBench Car Chase Offscreen
23.8 fps (3%)
...
AMD Radeon R7 (Bristol Ridge)
...
GFXBench 3.1 - GFXBench Manhattan ES 3.1 Offscreen
24.3 fps (1%)
...
AMD Radeon R7 (Bristol Ridge)
...
GFXBench 3.0 - GFXBench 3.0 Manhattan Offscreen
25.9 fps (2%)
...
AMD Radeon R7 (Bristol Ridge)
...
GFXBench (DX / GLBenchmark) 2.7 + GFXBench (DX / GLBenchmark) 2.7 - GFXBench T-Rex HD Offscreen C24Z16
90 fps (1%)
...
AMD Radeon R7 (Bristol Ridge)
...
LuxMark v2.0 64Bit - LuxMark v2.0 Room GPU
min: 175 avg: 178.5 median: 178.5 (1%) max: 182 Samples/s
...
AMD Radeon R7 (Bristol Ridge)
...
max:
LuxMark v2.0 64Bit - LuxMark v2.0 Sala GPU
min: 358 avg: 362.5 median: 362.5 (1%) max: 367 Samples/s
...
AMD Radeon R7 (Bristol Ridge)
...
max:
ComputeMark v2.1 - ComputeMark v2.1 Result
min: 1093 avg: 1346 median: 1450 (2%) max: 1495 points
...
AMD Radeon R7 (Bristol Ridge)
...
max:
Power Consumption - The Witcher 3 Power Consumption - external Monitor *
29.1 Watt (4%)
...
AMD Radeon R7 (Bristol Ridge)
...
max:
Clock Speed - GPU Clock Witcher 3 ultra
472 MHz (19%)
AMD Radeon R7 (Bristol Ridge)
...
- Range of benchmark values for this graphics card
- Average benchmark values for this graphics card
* Smaller numbers mean a higher performance
Game Benchmarks The following benchmarks stem from our benchmarks of review laptops. The performance depends on the used graphics memory, clock rate, processor, system settings, drivers, and operating systems. So the results don't have to be representative for all laptops with this GPU. For detailed information on the benchmark results, click on the fps number.
AMD Radeon R7 (Bristol Ridge)
...
» The benchmarks indicate that the game is not playable in the tested settings.
AMD Radeon R7 (Bristol Ridge)
...
max:
» The benchmarks indicate that the game is not playable in the tested settings.
...
AMD Radeon R7 (Bristol Ridge)
...
AMD Radeon R7 (Bristol Ridge)
...
» With all tested laptops playable in detail settings low.
...
AMD Radeon R7 (Bristol Ridge)
...
» With all tested laptops playable in detail settings low.
...
AMD Radeon R7 (Bristol Ridge)
...
...
AMD Radeon R7 (Bristol Ridge)
...
max:
AMD Radeon R7 (Bristol Ridge)
...
max:
» With all tested laptops playable in detail settings low.
...
AMD Radeon R7 (Bristol Ridge)
...
max:
...
AMD Radeon R7 (Bristol Ridge)
...
max:
» The benchmarks indicate that the game is not playable in the tested settings.
...
AMD Radeon R7 (Bristol Ridge)
...
max:
AMD Radeon R7 (Bristol Ridge)
...
max:
» The benchmarks indicate that the game is not playable in the tested settings.
...
AMD Radeon R7 (Bristol Ridge)
...
max:
AMD Radeon R7 (Bristol Ridge)
...
max:
» The benchmarks indicate that the game is not playable in the tested settings.
AMD Radeon R7 (Bristol Ridge)
...
max:
AMD Radeon R7 (Bristol Ridge)
...
max:
» The benchmarks indicate that the game is not playable in the tested settings.
...
AMD Radeon R7 (Bristol Ridge)
...
max:
...
AMD Radeon R7 (Bristol Ridge)
...
max:
AMD Radeon R7 (Bristol Ridge)
...
max:
» The benchmarks indicate that the game is not playable in the tested settings.
...
AMD Radeon R7 (Bristol Ridge)
...
...
AMD Radeon R7 (Bristol Ridge)
...
...
AMD Radeon R7 (Bristol Ridge)
...
max:
» With all tested laptops playable in detail settings med..
...
AMD Radeon R7 (Bristol Ridge)
...
max:
...
AMD Radeon R7 (Bristol Ridge)
...
max:
AMD Radeon R7 (Bristol Ridge)
...
max:
» The benchmarks indicate that the game is not playable in the tested settings.
...
AMD Radeon R7 (Bristol Ridge)
...
...
AMD Radeon R7 (Bristol Ridge)
...
...
AMD Radeon R7 (Bristol Ridge)
...
» The benchmarks indicate that the game is not playable in the tested settings.
...
AMD Radeon R7 (Bristol Ridge)
...
max:
AMD Radeon R7 (Bristol Ridge)
...
max:
AMD Radeon R7 (Bristol Ridge)
...
max:
» The benchmarks indicate that the game is not playable in the tested settings.
AMD Radeon R7 (Bristol Ridge)
...
max:
AMD Radeon R7 (Bristol Ridge)
...
max:
» The benchmarks indicate that the game is not playable in the tested settings.
AMD Radeon R7 (Bristol Ridge)
...
» The benchmarks indicate that the game is not playable in the tested settings.
...
AMD Radeon R7 (Bristol Ridge)
...
max:
...
AMD Radeon R7 (Bristol Ridge)
...
max:
» The benchmarks indicate that the game is not playable in the tested settings.
...
AMD Radeon R7 (Bristol Ridge)
...
...
AMD Radeon R7 (Bristol Ridge)
...
max:
AMD Radeon R7 (Bristol Ridge)
...
max:
» The benchmarks indicate that the game is not playable in the tested settings.
...
AMD Radeon R7 (Bristol Ridge)
...
...
AMD Radeon R7 (Bristol Ridge)
...
AMD Radeon R7 (Bristol Ridge)
...
» The benchmarks indicate that the game is not playable in the tested settings.
...
AMD Radeon R7 (Bristol Ridge)
...
max:
...
AMD Radeon R7 (Bristol Ridge)
...
max:
...
AMD Radeon R7 (Bristol Ridge)
...
max:
» The benchmarks indicate that the game is not playable in the tested settings.
...
AMD Radeon R7 (Bristol Ridge)
...
max:
...
AMD Radeon R7 (Bristol Ridge)
...
max:
...
AMD Radeon R7 (Bristol Ridge)
...
max:
» With all tested laptops playable in detail settings low.
...
AMD Radeon R7 (Bristol Ridge)
...
max:
AMD Radeon R7 (Bristol Ridge)
...
max:
» The benchmarks indicate that the game is not playable in the tested settings.
...
AMD Radeon R7 (Bristol Ridge)
...
...
AMD Radeon R7 (Bristol Ridge)
...
max:
...
AMD Radeon R7 (Bristol Ridge)
...
» The benchmarks indicate that the game is not playable in the tested settings.
...
AMD Radeon R7 (Bristol Ridge)
...
...
AMD Radeon R7 (Bristol Ridge)
...
...
AMD Radeon R7 (Bristol Ridge)
...
max:
» The benchmarks indicate that the game is not playable in the tested settings.
...
AMD Radeon R7 (Bristol Ridge)
...
max:
...
AMD Radeon R7 (Bristol Ridge)
...
max:
...
AMD Radeon R7 (Bristol Ridge)
...
max:
» With all tested laptops playable in detail settings med..
...
AMD Radeon R7 (Bristol Ridge)
...
...
AMD Radeon R7 (Bristol Ridge)
...
...
AMD Radeon R7 (Bristol Ridge)
...
» With all tested laptops playable in detail settings med..
...
AMD Radeon R7 (Bristol Ridge)
...
max:
...
AMD Radeon R7 (Bristol Ridge)
...
max:
...
AMD Radeon R7 (Bristol Ridge)
...
max:
» With all tested laptops playable in detail settings low.
AMD Radeon R7 (Bristol Ridge)
...
AMD Radeon R7 (Bristol Ridge)
...
» The benchmarks indicate that the game is not playable in the tested settings.
...
AMD Radeon R7 (Bristol Ridge)
...
max:
...
AMD Radeon R7 (Bristol Ridge)
...
max:
» The benchmarks indicate that the game is not playable in the tested settings.
...
AMD Radeon R7 (Bristol Ridge)
...
...
AMD Radeon R7 (Bristol Ridge)
...
max:
...
AMD Radeon R7 (Bristol Ridge)
...
» With all tested laptops playable in detail settings low.
...
AMD Radeon R7 (Bristol Ridge)
...
max:
...
AMD Radeon R7 (Bristol Ridge)
...
max:
...
AMD Radeon R7 (Bristol Ridge)
...
max:
» With all tested laptops playable in detail settings med..
...
AMD Radeon R7 (Bristol Ridge)
...
...
AMD Radeon R7 (Bristol Ridge)
...
...
AMD Radeon R7 (Bristol Ridge)
...
» With all tested laptops playable in detail settings low.
...
AMD Radeon R7 (Bristol Ridge)
...
max:
...
AMD Radeon R7 (Bristol Ridge)
...
max:
...
AMD Radeon R7 (Bristol Ridge)
...
» The benchmarks indicate that the game is not playable in the tested settings.
AMD Radeon R7 (Bristol Ridge)
...
» The benchmarks indicate that the game is not playable in the tested settings.
...
AMD Radeon R7 (Bristol Ridge)
...
max:
...
AMD Radeon R7 (Bristol Ridge)
...
...
AMD Radeon R7 (Bristol Ridge)
...
» With all tested laptops playable in detail settings med..
...
AMD Radeon R7 (Bristol Ridge)
...
max:
...
AMD Radeon R7 (Bristol Ridge)
...
max:
» The benchmarks indicate that the game is not playable in the tested settings.
...
AMD Radeon R7 (Bristol Ridge)
...
...
AMD Radeon R7 (Bristol Ridge)
...
» The benchmarks indicate that the game is not playable in the tested settings.
...
AMD Radeon R7 (Bristol Ridge)
...
max:
...
AMD Radeon R7 (Bristol Ridge)
...
max:
...
AMD Radeon R7 (Bristol Ridge)
...
» With all tested laptops playable in detail settings med..
...
AMD Radeon R7 (Bristol Ridge)
...
...
AMD Radeon R7 (Bristol Ridge)
...
...
AMD Radeon R7 (Bristol Ridge)
...
max:
» With all tested laptops playable in detail settings med..
...
AMD Radeon R7 (Bristol Ridge)
...
...
AMD Radeon R7 (Bristol Ridge)
...
...
AMD Radeon R7 (Bristol Ridge)
...
» The benchmarks indicate that the game is not playable in the tested settings.
...
AMD Radeon R7 (Bristol Ridge)
...
max:
...
AMD Radeon R7 (Bristol Ridge)
...
max:
...
AMD Radeon R7 (Bristol Ridge)
...
max:
...
AMD Radeon R7 (Bristol Ridge)
...
max:
» The benchmarks indicate that the game is not playable in the tested settings.
...
AMD Radeon R7 (Bristol Ridge)
...
max:
...
AMD Radeon R7 (Bristol Ridge)
...
...
AMD Radeon R7 (Bristol Ridge)
...
» With all tested laptops playable in detail settings low.
...
AMD Radeon R7 (Bristol Ridge)
...
...
AMD Radeon R7 (Bristol Ridge)
...
AMD Radeon R7 (Bristol Ridge)
...
» The benchmarks indicate that the game is not playable in the tested settings.
...
AMD Radeon R7 (Bristol Ridge)
...
...
AMD Radeon R7 (Bristol Ridge)
...
» The benchmarks indicate that the game is not playable in the tested settings.
...
AMD Radeon R7 (Bristol Ridge)
...
...
AMD Radeon R7 (Bristol Ridge)
...
...
AMD Radeon R7 (Bristol Ridge)
...
...
AMD Radeon R7 (Bristol Ridge)
...
max:
» With all tested laptops playable in detail settings low.
...
AMD Radeon R7 (Bristol Ridge)
...
...
AMD Radeon R7 (Bristol Ridge)
...
...
AMD Radeon R7 (Bristol Ridge)
...
...
AMD Radeon R7 (Bristol Ridge)
...
» With all tested laptops playable in detail settings low.
...
AMD Radeon R7 (Bristol Ridge)
...
...
AMD Radeon R7 (Bristol Ridge)
...
...
AMD Radeon R7 (Bristol Ridge)
...
...
AMD Radeon R7 (Bristol Ridge)
...
max:
» With all tested laptops playable in detail settings ultra.
...
AMD Radeon R7 (Bristol Ridge)
...
...
AMD Radeon R7 (Bristol Ridge)
...
...
AMD Radeon R7 (Bristol Ridge)
...
» The benchmarks indicate that the game is not playable in the tested settings.
...
AMD Radeon R7 (Bristol Ridge)
...
AMD Radeon R7 (Bristol Ridge)
...
...
AMD Radeon R7 (Bristol Ridge)
...
» With all tested laptops playable in detail settings low.
For more games that might be playable and a list of all games and graphics cards visit our Gaming List
v1.26
log 24. 17:22:05
#0 no ids found in url (should be separated by "_") +0s ... 0s
#1 not redirecting to Ajax server +0s ... 0s
#2 did not recreate cache, as it is less than 5 days old! Created at Mon, 22 Apr 2024 05:40:21 +0200 +0.001s ... 0.001s
#3 composed specs +0.037s ... 0.038s
#4 did output specs +0s ... 0.038s
#5 start showIntegratedCPUs +0s ... 0.038s
#6 getting avg benchmarks for device 7442 +0.028s ... 0.066s
#7 got single benchmarks 7442 +0.02s ... 0.086s
#8 got avg benchmarks for devices +0s ... 0.086s
#9 min, max, avg, median took s +0.586s ... 0.672s
#10 before gaming benchmark output +0s ... 0.672s
#11 Got 178 rows for game benchmarks. +0.013s ... 0.685s
#12 composed SQL query for gamebenchmarks +0s ... 0.685s
#13 got data and put it in $dataArray +0.037s ... 0.722s
#14 benchmarks composed for output. +1.185s ... 1.906s
#15 return log +0.05s ... 1.956s
Notebook reviews with AMD Radeon R7 (Bristol Ridge) graphics card
Lenovo ThinkPad A275 (A12-9800B, 256GB) Laptop Review Uncertain Prospect. Lenovo has created an AMD version of the X270. It excels in terms of input devices, security and portability. However, the stability and bu...
AMD PRO A12-9800B | AMD Radeon R7 (Bristol Ridge) | 12.50" | 1.6 kg
HP 15-bw075ax (A12-9720P, Radeon R7) Laptop Review Choppy waters. The HP 15-bw07ax brings AMD's newest high-end APU, the A12-9720P, to the market. However, the APU may be a bit too new - the system is remarkably...
AMD A12-9720P | AMD Radeon R7 (Bristol Ridge) | 15.60" | 1.9 kg
HP EliteBook 755 G4 (AMD PRO A12-9800B) Laptop Review Appropriate performance? The EliteBook series from HP stands for business devices for the demanding customer. You will find out in this detailed review of the E...
AMD PRO A12-9800B | AMD Radeon R7 (Bristol Ridge) | 15.60" | 1.8 kg
HP EliteBook 725 G4 (A12-9800B, Full-HD) Notebook Review Bristol Ridge business.HP's 12.5-inch EliteBook is powered by an AMD APU. Thus, HP is one of the few manufacturers that still use AMD's APUs in the business sec...
AMD PRO A12-9800B | AMD Radeon R7 (Bristol Ridge) | 12.50" | 1.3 kg
HP 15-ba077ng Notebook Review Low-cost office. HP delivers a home-office laptop with the 15-ba077ng. Its quiet system noise, low temperature development, and fast solid-state drive speak for...
AMD A12-9700P | AMD Radeon R7 (Bristol Ridge) | 15.60" | 2 kg
Asus VivoBook S15 S510QR-BR011T : AMD FX-9800P, 15.60", 1.7 kgExternal Review » Asus VivoBook S15 S510QR-BR011T
Lenovo ThinkPad A275 : AMD PRO A12-9800B, 12.50", 1.6 kgExternal Review » Lenovo ThinkPad A275
Lenovo Ideapad 320-15ABR-80XS007XGE : AMD A12-9720P, 15.60", 2.2 kgExternal Review » Lenovo Ideapad 320-15ABR-80XS007XGE
HP Pavilion 15-cd0000nu : AMD A12-9720P, 15.60", 2 kgExternal Review » HP Pavilion 15-cd0000nu
HP Envy 15-bq015nd x360 : AMD A12-9720P, 15.60", 2.2 kgExternal Review » HP Envy 15-bq015nd x360
HP EliteBook 755 G4 Z2W11EA : AMD PRO A12-9800B, 15.60", 1.8 kgExternal Review » HP EliteBook 755 G4 Z2W11EA
HP EliteBook 745 G4 Z2W06EA : AMD PRO A12-9800B, 14.00", 1.5 kgExternal Review » HP EliteBook 745 G4 Z2W06EA
Lenovo Ideapad 310-15ABR 80ST : AMD A12-9700P, 15.60", 2.2 kgExternal Review » Lenovo Ideapad 310-15ABR 80ST
Asus X555QG : AMD FX-9800P, 15.60", 2.2 kgExternal Review » Asus X555QG
Please share our article, every link counts!
» Comparison of GPUs
» Benchmark List
» Notebook Gaming List
Class 1
Class 2 Radeon PRO W6600M *
Class 3 UHD Graphics 32EUs
UHD Graphics 750
Class 4
Class 5 * Approximate position of the graphics adapter
Working For Notebookcheck
Are you a techie who knows how to translate? Then join our Team!
Details here
Top 10 Laptops Multimedia , Budget Multimedia , Gaming , Budget Gaming , Lightweight Gaming , Business , Budget Office , Workstation , Subnotebooks , Ultrabooks , Chromebooks
under 300 USD/Euros , under 500 USD/Euros , 1,000 USD/Euros , for University Students , Best Displays
Top 10 Smartphones Smartphones , Phablets , ≤6-inch , Camera Smartphones
Klaus Hinum (Update: 2017-09- 5)
 Deutsch
 English
 Español
 Français
 Italiano
 Nederlands
 Polski
 Português
 Русский
 Türkçe
 Svenska
 Chinese
 Magyar