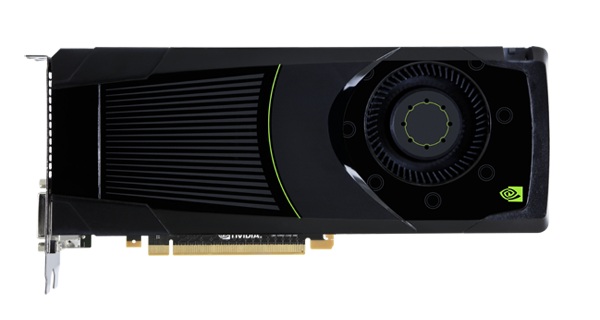
NVIDIA GeForce GTX 680
The Nvidia GeForce GTX 680 is a DirectX 11 high-end desktop graphics card. It is based on the GK104 chip and manufactured in 28 nm at TSMC. The core clock can be boosted up to 1058 MHz (from 1006 base clock) and the memory is clocked at 3004 MHz (GDDR5). The similar named mobile GeForce GTX 680M is also based on the GK104 chip, but offers only 1344 shader as the desktop GTX 670 and a low clock rate of 720 MHz.
Depending on game and settings, the performance of the GTX 680 is similar to a Radeon R9 280X . Therefore, even the fastest mobile GPUs like the GeForce GTX 780M are outperformed by more than 30 percent. Demanding games like Metro: Last Light can be played fluently in 1080p and maximum detail settings. In some cases, even higher resolutions or additional AA/AF are possible.
The power consumption of the GTX 680 desktop card is rated at 195 Watt TDP and therefore two 6-pin power connectors are needed to power the card.
GeForce GTX 600 Series GeForce GTX 680 1536 @ 1.01 - 1.06 GHz 256 Bit @ 6000 MHz GeForce GTX 660 Ti 1344 @ 0.92 - 0.98 GHz 192 Bit @ 6000 MHz
Codename GK104 Architecture Kepler Pipelines 1536 - unified Core Speed 1006 - 1058 (Boost) MHz Memory Speed 6000 MHz Memory Bus Width 256 Bit Memory Type GDDR5 Max. Amount of Memory 2048 MB Shared Memory no API DirectX 11, Shader 5.1, OpenGL 4.2 Power Consumption 195 Watt Transistor Count 3.5 Billion technology 28 nm Features SLI, PhysX, CUDA, 3D Vision, GPU Boost Date of Announcement 22.03.2012 Link to Manufacturer Page www.geforce.com
Benchmarks Performance Rating - 3DMark 11 + Fire Strike + Time Spy
3.5 pt (10%)
...
...
3DMark - 3DMark Time Spy Score
2332 Points (7%)
Model CPU GPU RAM Value Desktop PC GeForce GTX 680 1069 / 3104 MHz 2 GB 64 GB 2332
...
...
3DMark - 3DMark Time Spy Graphics
2068 Points (5%)
Model CPU GPU RAM Value Desktop PC GeForce GTX 680 1069 / 3104 MHz 2 GB 64 GB 2068
...
...
3DMark - 3DMark Ice Storm Unlimited Graphics
min: 215624 avg: 247307 median: 247306 (28%) max: 278989 Points
...
unknown
...
3DMark - 3DMark Ice Storm Extreme Graphics
min: 177730 avg: 202749 median: 202749 (26%) max: 227768 Points
...
Intel Arc A380
...
3DMark - 3DMark Cloud Gate Score
min: 19275 avg: 23150 median: 23150 (25%) max: 27025 Points
...
...
3DMark - 3DMark Cloud Gate Graphics
min: 46869 avg: 47130 median: 47130 (12%) max: 47391 Points
...
...
3DMark - 3DMark Fire Strike Standard Score
min: 6119 avg: 6861 median: 6861 (12%) max: 7603 Points
...
...
3DMark - 3DMark Fire Strike Standard Graphics
min: 6904 avg: 7587 median: 7587 (9%) max: 8270 Points
...
...
3DMark - 3DMark Ice Storm Graphics
min: 190182 avg: 235508 median: 235508 (28%) max: 280833 Points
...
Intel Arc A380
...
3DMark 11 - 3DM11 Performance Score
min: 9255 avg: 10000 median: 10000 (14%) max: 10745 Points
...
...
3DMark 11 - 3DM11 Performance GPU
min: 9861 avg: 10217 median: 10216.5 (9%) max: 10572 Points
...
...
3DMark Vantage + 3DMark Vantage - 3DM Vant. Perf. total
29702 Points (9%)
...
...
3DM Vant. Perf. GPU no PhysX + 3DMark Vantage - 3DM Vant. Perf. GPU no PhysX
33025 Points (19%)
...
...
3DMark 2001SE - 3DMark 2001 - Standard
52955 Points (55%)
...
ATI Radeon HD 5570
NVIDIA GeForce GTX 580
NVIDIA GeForce GTS 450
ATI Radeon HD 5670
ATI Radeon HD 5770
AMD Radeon HD 6790
...
3DMark 03 - 3DMark 03 - Standard
min: 84572 avg: 91644 median: 91644 (48%) max: 98716 Points
...
NVIDIA GeForce GTX 570
AMD Radeon HD 6970
NVIDIA GeForce GTX 580
...
3DMark 05 - 3DMark 05 - Standard
min: 24071 avg: 27536 median: 27536 (30%) max: 31001 Points
...
ATI Radeon HD 5770
AMD Radeon HD 6790
NVIDIA GeForce GTS 450
...
3DMark 06 3DMark 06 - Standard 1280x1024 +
min: 21143 avg: 24731 median: 24660 (32%) max: 28391 Points
Model CPU GPU RAM Value 3DMark 06 - Standard 1280x1024 Desktop PC (3DMark 06 - Standard 1280x1024) GeForce GTX 680 1069 / 3104 MHz 2 GB 64 GB 21143 Desktop GTX 680 (3DMark 06 - Standard 1280x1024) 2600K GeForce GTX 680 1059 / 1502 MHz 2 GB 8 GB 24660 (3DMark 06 - Standard 1280x1024) 4770K GeForce GTX 680 8 GB 28391
...
AMD Radeon HD 6970
...
Unigine Valley 1.0 - Unigine Valley 1.0 DX
45.1 fps (15%)
Model CPU GPU RAM Value Desktop PC GeForce GTX 680 1069 / 3104 MHz 2 GB 64 GB 45.1
...
...
Unigine Heaven 2.1 - Heaven 2.1 high
139.4 fps (26%)
...
...
Cinebench R15 + Cinebench R15 - Cinebench R15 OpenGL 64 Bit
78.2 fps (5%)
...
...
Cinebench R15 OpenGL Ref. Match 64 Bit + Cinebench R15 - Cinebench R15 OpenGL Ref. Match 64 Bit
99.6 % (100%)
...
...
GFXBench (DX / GLBenchmark) 2.7 + GFXBench (DX / GLBenchmark) 2.7 - GFXBench T-Rex HD Offscreen C24Z16
652 fps (5%)
...
...
LuxMark v2.0 64Bit - LuxMark v2.0 Room GPU
284 Samples/s (1%)
...
Intel UHD Graphics 32EUs (Alder Lake)
...
LuxMark v2.0 64Bit - LuxMark v2.0 Sala GPU
626 Samples/s (1%)
...
...
ComputeMark v2.1 - ComputeMark v2.1 Result
5790 points (6%)
...
...
- Range of benchmark values for this graphics card
- Average benchmark values for this graphics card
* Smaller numbers mean a higher performance
Game Benchmarks The following benchmarks stem from our benchmarks of review laptops. The performance depends on the used graphics memory, clock rate, processor, system settings, drivers, and operating systems. So the results don't have to be representative for all laptops with this GPU. For detailed information on the benchmark results, click on the fps number.
...
...
...
...
...
...
...
...
...
» With all tested laptops playable in detail settings med..
Additional Benchmarks
Medium Preset 2xAF 1920x1080
34.6 [X] Desktop PC GeForce GTX 680
min:
27.3 fps, max:
44.1 fps
...
...
...
...
...
...
» With all tested laptops playable in detail settings high.
Additional Benchmarks
Medium 4x AF Off AA 1920x1080
80 [X] Desktop PC GeForce GTX 680
min:
61 fps, max:
96 fps
...
...
...
...
...
...
...
...
» With all tested laptops playable in detail settings ultra.
Additional Benchmarks
Medium Preset 4xAF 1920x1080
68.2 [X] Desktop PC GeForce GTX 680
min:
64 fps, max:
73 fps
...
...
...
...
...
...
...
...
...
...
» With all tested laptops playable in detail settings ultra.
Additional Benchmarks
Medium (Render Scale 100 %) 2xAF FXAA 1920x1080
163.9 [X] Desktop PC GeForce GTX 680
min:
132 fps, max:
195 fps
...
...
...
...
...
...
...
...
...
» With all tested laptops playable in detail settings ultra.
Additional Benchmarks
Medium Preset 1920x1080
58.4 [X] Desktop PC GeForce GTX 680
min:
43 fps, max:
88 fps
...
» With all tested laptops playable in detail settings low.
...
...
...
...
...
...
...
...
...
...
» With all tested laptops playable in detail settings high.
Additional Benchmarks
Medium Preset 4xAF 1920x1080
60 [X] Desktop PC GeForce GTX 680
Low Preset 1xAF 1920x1080
...
...
...
...
...
...
...
...
...
...
» With all tested laptops playable in detail settings ultra.
Additional Benchmarks
Low Preset 1920x1080
77 [X] Desktop PC GeForce GTX 680
min:
68 fps, max:
86 fps
...
...
...
...
...
...
...
...
...
» With all tested laptops playable in detail settings high.
Additional Benchmarks
Low Preset TrilinearAF 1920x1080
67.1 [X] Desktop PC GeForce GTX 680
min:
52 fps, max:
86 fps
...
...
...
...
...
...
...
...
...
...
» With all tested laptops playable in detail settings ultra.
...
...
...
...
...
...
...
...
...
...
» With all tested laptops playable in detail settings ultra.
...
...
...
...
...
...
...
...
...
» With all tested laptops playable in detail settings ultra.
...
...
...
...
...
...
...
...
...
...
» With all tested laptops playable in detail settings ultra.
...
...
...
...
...
...
» With all tested laptops playable in detail settings high.
...
...
...
...
...
...
...
...
...
...
» With all tested laptops playable in detail settings ultra.
...
...
...
...
...
...
...
...
...
...
» With all tested laptops playable in detail settings high.
...
...
173 [X] Desktop GTX 680, Intel Core i7-2600K Intel Core i7-2600K 3.4GHz
GeForce GTX 680
min:
152 fps, max:
190 fps
212 [X] Desktop PC GeForce GTX 680
min:
94 fps, max:
233 fps
~ 193 fps
+ Compare
- Hide Comparison
...
...
84 [X] Desktop GTX 680, Intel Core i7-2600K Intel Core i7-2600K 3.4GHz
GeForce GTX 680
min:
77 fps, max:
90 fps
90.2 [X] Desktop PC GeForce GTX 680
min:
36 fps, max:
98 fps
~ 87 fps
+ Compare
- Hide Comparison
...
...
» With all tested laptops playable in detail settings ultra.
...
...
...
...
...
...
...
...
...
...
» With all tested laptops playable in detail settings high.
105 [X] Desktop GTX 680, Intel Core i7-2600K Intel Core i7-2600K 3.4GHz
GeForce GTX 680
min:
76 fps, max:
121 fps
125.6 [X] Desktop PC GeForce GTX 680
min:
109 fps, max:
143 fps
~ 115 fps
+ Compare
- Hide Comparison
...
...
65 [X] Desktop GTX 680, Intel Core i7-2600K Intel Core i7-2600K 3.4GHz
GeForce GTX 680
min:
55 fps, max:
78 fps
79.7 [X] Desktop PC GeForce GTX 680
min:
71 fps, max:
92 fps
~ 72 fps
+ Compare
- Hide Comparison
...
...
39 [X] Desktop GTX 680, Intel Core i7-2600K Intel Core i7-2600K 3.4GHz
GeForce GTX 680
min:
28 fps, max:
47 fps
44.6 [X] Desktop PC GeForce GTX 680
min:
39 fps, max:
50 fps
~ 42 fps
+ Compare
- Hide Comparison
...
...
20.5 [X] Desktop GTX 680, Intel Core i7-2600K Intel Core i7-2600K 3.4GHz
GeForce GTX 680
min:
16 fps, max:
25 fps
24.4 [X] Desktop PC GeForce GTX 680
min:
19 fps, max:
31 fps
~ 22 fps
+ Compare
- Hide Comparison
...
...
14.9 [X] Desktop GTX 680, Intel Core i7-2600K Intel Core i7-2600K 3.4GHz
GeForce GTX 680
min:
12 fps, max:
17 fps
16.6 [X] Desktop PC GeForce GTX 680
min:
14 fps, max:
18 fps
~ 16 fps
+ Compare
- Hide Comparison
...
...
» With all tested laptops playable in detail settings high.
...
...
...
...
...
...
...
...
...
...
» With all tested laptops playable in detail settings ultra.
134 [X] Desktop GTX 680, Intel Core i7-2600K Intel Core i7-2600K 3.4GHz
GeForce GTX 680
min:
45 fps, max:
206 fps
166.6 [X] Desktop PC GeForce GTX 680
min:
4.8 fps, max:
278 fps
~ 150 fps
+ Compare
- Hide Comparison
...
...
128 [X] Desktop GTX 680, Intel Core i7-2600K Intel Core i7-2600K 3.4GHz
GeForce GTX 680
min:
26 fps, max:
198 fps
159.8 [X] Desktop PC GeForce GTX 680
min:
10.8 fps, max:
226.9 fps
~ 144 fps
+ Compare
- Hide Comparison
...
...
72 [X] Desktop GTX 680, Intel Core i7-2600K Intel Core i7-2600K 3.4GHz
GeForce GTX 680
min:
21 fps, max:
122 fps
80 [X] Desktop PC GeForce GTX 680
min:
17.3 fps, max:
164.1 fps
~ 76 fps
+ Compare
- Hide Comparison
...
...
32 [X] Desktop GTX 680, Intel Core i7-2600K Intel Core i7-2600K 3.4GHz
GeForce GTX 680
min:
1 fps, max:
119 fps
40.3 [X] Desktop PC GeForce GTX 680
min:
3.2 fps, max:
87 fps
~ 36 fps
+ Compare
- Hide Comparison
...
...
...
» With most tested laptops playable in detail settings ultra.
...
...
...
...
...
...
...
» With all tested laptops playable in detail settings ultra.
...
...
...
...
...
...
...
...
» With all tested laptops playable in detail settings ultra.
...
...
» With all tested laptops playable in detail settings ultra.
183.1 [X] Desktop PC GeForce GTX 680
min:
146 fps, max:
196 fps
191 [X] Desktop GTX 680, Intel Core i7-2600K Intel Core i7-2600K 3.4GHz
GeForce GTX 680
min:
155 fps, max:
201 fps
~ 187 fps
+ Compare
- Hide Comparison
...
...
129 [X] Desktop GTX 680, Intel Core i7-2600K Intel Core i7-2600K 3.4GHz
GeForce GTX 680
min:
72 fps, max:
200 fps
154.3 [X] Desktop PC GeForce GTX 680
min:
99 fps, max:
192 fps
~ 142 fps
+ Compare
- Hide Comparison
...
...
104 [X] Desktop GTX 680, Intel Core i7-2600K Intel Core i7-2600K 3.4GHz
GeForce GTX 680
min:
50 fps, max:
164 fps
133.2 [X] Desktop PC GeForce GTX 680
min:
86 fps, max:
192 fps
~ 119 fps
+ Compare
- Hide Comparison
...
...
96 [X] Desktop GTX 680, Intel Core i7-2600K Intel Core i7-2600K 3.4GHz
GeForce GTX 680
min:
46 fps, max:
174 fps
122.8 [X] Desktop PC GeForce GTX 680
min:
72 fps, max:
189 fps
~ 109 fps
+ Compare
- Hide Comparison
...
...
» With all tested laptops playable in detail settings ultra.
...
...
...
...
» With all tested laptops playable in detail settings ultra.
...
...
...
...
...
...
...
...
» With all tested laptops playable in detail settings ultra.
...
...
...
...
...
...
...
...
» With all tested laptops playable in detail settings high.
...
...
...
...
...
...
» With all tested laptops playable in detail settings high.
...
...
...
...
» With all tested laptops playable in detail settings ultra.
...
...
...
...
...
...
...
...
» With all tested laptops playable in detail settings ultra.
...
...
...
...
...
...
...
...
» With all tested laptops playable in detail settings ultra.
...
...
...
...
» With all tested laptops playable in detail settings ultra.
...
...
...
...
...
...
...
» With all tested laptops playable in detail settings med..
...
...
...
...
...
...
...
» The benchmarks indicate that the game is not playable in the tested settings.
...
...
...
...
...
» With all tested laptops playable in detail settings ultra.
108 [X] Desktop GTX 680, Intel Core i7-2600K Intel Core i7-2600K 3.4GHz
GeForce GTX 680
min:
80 fps, max:
190 fps
199.2 [X] Desktop PC GeForce GTX 680
min:
189 fps, max:
201 fps
~ 154 fps
+ Compare
- Hide Comparison
...
...
90 [X] Desktop GTX 680, Intel Core i7-2600K Intel Core i7-2600K 3.4GHz
GeForce GTX 680
min:
67 fps, max:
128 fps
187.7 [X] Desktop PC GeForce GTX 680
min:
175 fps, max:
201 fps
~ 139 fps
+ Compare
- Hide Comparison
...
...
86 [X] Desktop GTX 680, Intel Core i7-2600K Intel Core i7-2600K 3.4GHz
GeForce GTX 680
min:
60 fps, max:
114 fps
143.5 [X] Desktop PC GeForce GTX 680
min:
131 fps, max:
189 fps
~ 115 fps
+ Compare
- Hide Comparison
...
...
50.6 [X] Desktop GTX 680, Intel Core i7-2600K Intel Core i7-2600K 3.4GHz
GeForce GTX 680
min:
41 fps, max:
69 fps
64.3 [X] Desktop PC GeForce GTX 680
min:
53 fps, max:
87 fps
~ 57 fps
+ Compare
- Hide Comparison
...
...
...
...
» With all tested laptops playable in detail settings ultra.
...
...
...
...
» With all tested laptops playable in detail settings ultra.
162 [X] Desktop GTX 680 Intel Core i7-2600K 3.4GHz
GeForce GTX 680
165 [X] Desktop GTX 680, Intel Core i7-2600K Intel Core i7-2600K 3.4GHz
GeForce GTX 680
min:
135 fps
~ 164 fps
+ Compare
- Hide Comparison
...
118 [X] Desktop GTX 680 Intel Core i7-2600K 3.4GHz
GeForce GTX 680
133 [X] Desktop GTX 680, Intel Core i7-2600K Intel Core i7-2600K 3.4GHz
GeForce GTX 680
min:
104 fps
~ 126 fps
+ Compare
- Hide Comparison
...
122 [X] Desktop GTX 680, Intel Core i7-2600K Intel Core i7-2600K 3.4GHz
GeForce GTX 680
min:
96 fps
128 [X] Desktop GTX 680 Intel Core i7-2600K 3.4GHz
GeForce GTX 680
~ 125 fps
+ Compare
- Hide Comparison
...
...
105 [X] Desktop GTX 680, Intel Core i7-2600K Intel Core i7-2600K 3.4GHz
GeForce GTX 680
min:
81 fps
113 [X] Desktop GTX 680 Intel Core i7-2600K 3.4GHz
GeForce GTX 680
min:
78 fps
~ 109 fps
+ Compare
- Hide Comparison
...
» With all tested laptops playable in detail settings ultra.
...
» With all tested laptops playable in detail settings ultra.
...
...
...
...
...
...
...
» With all tested laptops playable in detail settings ultra.
...
...
...
...
...
...
» With all tested laptops playable in detail settings ultra.
...
...
...
...
...
» With all tested laptops playable in detail settings ultra.
...
...
...
...
» With all tested laptops playable in detail settings ultra.
...
...
...
...
...
...
» With all tested laptops playable in detail settings ultra.
...
...
...
...
...
...
...
...
» With all tested laptops playable in detail settings high.
...
...
...
...
...
...
...
...
» With all tested laptops playable in detail settings ultra.
...
...
...
...
...
...
...
...
» With all tested laptops playable in detail settings ultra.
...
...
...
...
...
...
...
...
» With all tested laptops playable in detail settings ultra.
...
...
...
...
...
...
...
» With all tested laptops playable in detail settings ultra.
...
NVIDIA GeForce GTX 460 768MB
...
...
NVIDIA GeForce GTX 460 768MB
...
» With all tested laptops playable in detail settings ultra.
...
...
...
...
...
...
...
...
» With all tested laptops playable in detail settings ultra.
...
NVIDIA GeForce GTX 460 768MB
...
...
...
...
...
...
...
» With all tested laptops playable in detail settings ultra.
...
...
...
...
» With all tested laptops playable in detail settings ultra.
...
...
...
...
...
» With all tested laptops playable in detail settings ultra.
...
...
...
...
...
» With all tested laptops playable in detail settings ultra.
...
...
...
...
...
...
...
...
» With all tested laptops playable in detail settings ultra.
...
...
...
...
» With all tested laptops playable in detail settings ultra.
...
NVIDIA GeForce GTS 450
...
...
NVIDIA GeForce GTS 450
...
...
...
...
» With all tested laptops playable in detail settings ultra.
...
...
...
...
» With all tested laptops playable in detail settings ultra.
...
...
...
...
...
...
...
...
» With all tested laptops playable in detail settings ultra.
...
...
...
NVIDIA GeForce GTS 450
...
» With all tested laptops playable in detail settings ultra.
...
...
...
...
» With all tested laptops playable in detail settings ultra.
...
...
...
...
...
...
» With all tested laptops playable in detail settings ultra.
...
...
...
...
» With all tested laptops playable in detail settings ultra.
...
NVIDIA GeForce GTS 450
...
...
NVIDIA GeForce GTS 450
...
...
...
» With all tested laptops playable in detail settings ultra.
...
...
» With all tested laptops playable in detail settings ultra.
...
...
» With all tested laptops playable in detail settings ultra.
...
...
...
...
...
...
...
...
» With all tested laptops playable in detail settings ultra.
...
...
...
...
» With all tested laptops playable in detail settings ultra.
...
...
...
» With all tested laptops playable in detail settings ultra.
...
...
ATI Radeon HD 5850
...
...
...
» With all tested laptops playable in detail settings ultra.
...
...
...
ATI Radeon HD 5850
...
...
ATI Radeon HD 5850
...
...
» With all tested laptops playable in detail settings ultra.
...
NVIDIA GeForce GTS 450
...
...
ATI Radeon HD 5850
...
...
...
...
» With all tested laptops playable in detail settings ultra.
...
...
...
ATI Radeon HD 5850
...
...
ATI Radeon HD 5850
...
...
» With all tested laptops playable in detail settings ultra.
...
...
...
ATI Radeon HD 5850
...
...
...
» With all tested laptops playable in detail settings ultra.
...
...
...
» With all tested laptops playable in detail settings ultra.
...
ATI Radeon HD 5850
...
...
...
» With all tested laptops playable in detail settings ultra.
...
» With all tested laptops playable in detail settings ultra.
...
» With all tested laptops playable in detail settings ultra.
...
ATI Radeon HD 5850
NVIDIA GeForce GTX 580
...
NVIDIA GeForce GTX 580
...
NVIDIA GeForce GTX 580
...
NVIDIA GeForce GTX 580
» With all tested laptops playable in detail settings ultra.
...
ATI Radeon HD 5850
...
ATI Radeon HD 5850
...
...
» With all tested laptops playable in detail settings ultra.
...
NVIDIA GeForce GTX 580
» With all tested laptops playable in detail settings ultra.
...
NVIDIA GeForce GTX 580
...
NVIDIA GeForce GTX 580
» With all tested laptops playable in detail settings ultra.
...
NVIDIA GeForce GTX 580
» With all tested laptops playable in detail settings ultra.
...
NVIDIA GeForce GTS 450
NVIDIA GeForce GTX 580
ATI Radeon HD 4850
...
ATI Radeon HD 4850
NVIDIA GeForce GTS 450
NVIDIA GeForce GTX 580
...
NVIDIA GeForce GTX 580
...
ATI Radeon HD 4850
NVIDIA GeForce GTS 450
NVIDIA GeForce GTX 580
...
NVIDIA GeForce GTX 580
» With all tested laptops playable in detail settings high.
...
ATI Radeon HD 5670
NVIDIA GeForce GTX 580
AMD Radeon HD 6790
...
...
NVIDIA GeForce GTX 580
AMD Radeon HD 6790
...
...
NVIDIA GeForce GTX 460 768MB
NVIDIA GeForce GTX 580
ATI Radeon HD 5850
...
NVIDIA GeForce GTX 580
» With all tested laptops playable in detail settings ultra.
Additional Benchmarks
Ultra DX11 High Res Textures 1920x1080
62 [X] Desktop GTX 680 Intel Core i7-2600K 3.4GHz
GeForce GTX 680
...
NVIDIA GeForce GTX 580
...
NVIDIA GeForce GTX 580
» With all tested laptops playable in detail settings ultra.
...
NVIDIA GeForce GTX 580
» With all tested laptops playable in detail settings ultra.
...
...
...
...
» With all tested laptops playable in detail settings ultra.
...
NVIDIA GeForce GTS 450
NVIDIA GeForce GTX 580
» With all tested laptops playable in detail settings ultra.
...
NVIDIA GeForce GTX 580
...
» With all tested laptops playable in detail settings ultra.
...
NVIDIA GeForce GTS 450
...
NVIDIA GeForce GTS 450
NVIDIA GeForce GTX 580
ATI Radeon HD 4850
...
ATI Radeon HD 4850
NVIDIA GeForce GTS 450
NVIDIA GeForce GTX 580
...
ATI Radeon HD 4850
NVIDIA GeForce GTS 450
NVIDIA GeForce GTX 580
» With all tested laptops playable in detail settings ultra.
...
NVIDIA GeForce GTX 580
» With all tested laptops playable in detail settings ultra.
...
NVIDIA GeForce GTX 580
...
NVIDIA GeForce GTX 580
...
NVIDIA GeForce GTX 570
NVIDIA GeForce GTX 580
» With all tested laptops playable in detail settings ultra.
ATI Radeon HD 4850
NVIDIA GeForce GTS 450
» With all tested laptops playable in detail settings ultra.
...
NVIDIA GeForce GTS 450
ATI Radeon HD 5770
NVIDIA GeForce GTX 570
AMD Radeon HD 6790
NVIDIA GeForce GTX 580
» With all tested laptops playable in detail settings high.
...
ATI Radeon HD 5670
AMD Radeon HD 6790
NVIDIA GeForce GTX 580
» With all tested laptops playable in detail settings ultra.
...
ATI Radeon HD 5850
NVIDIA GeForce GTX 560 Ti
NVIDIA GeForce GTX 580
» With all tested laptops playable in detail settings ultra.
...
ATI Radeon HD 5850
NVIDIA GeForce GTX 580
» With all tested laptops playable in detail settings ultra.
...
...
...
...
NVIDIA GeForce GTS 450
AMD Radeon HD 6790
NVIDIA GeForce GTX 580
» With all tested laptops playable in detail settings ultra.
...
» With all tested laptops playable in detail settings high.
For more games that might be playable and a list of all games and graphics cards visit our Gaming List
v1.26
log 18. 02:39:41
#0 no ids found in url (should be separated by "_") +0s ... 0s
#1 not redirecting to Ajax server +0s ... 0s
#2 did not recreate cache, as it is less than 5 days old! Created at Tue, 16 Apr 2024 05:39:00 +0200 +0.001s ... 0.001s
#3 composed specs +0.049s ... 0.05s
#4 did output specs +0s ... 0.05s
#5 start showIntegratedCPUs +0s ... 0.05s
#6 getting avg benchmarks for device 3270 +0.03s ... 0.08s
#7 got single benchmarks 3270 +0.019s ... 0.098s
#8 got avg benchmarks for devices +0s ... 0.098s
#9 min, max, avg, median took s +0.532s ... 0.63s
#10 before gaming benchmark output +0s ... 0.63s
#11 Got 394 rows for game benchmarks. +0.023s ... 0.654s
#12 composed SQL query for gamebenchmarks +0s ... 0.654s
#13 got data and put it in $dataArray +0.065s ... 0.719s
#14 benchmarks composed for output. +3.182s ... 3.901s
#15 return log +0.056s ... 3.957s
Please share our article, every link counts!
» Comparison of GPUs
» Benchmark List
» Notebook Gaming List
Class 1 Arc A580
Class 2 Arc A380
Class 3 UHD Graphics 32EUs
UHD Graphics 750
Class 4 * Approximate position of the graphics adapter
Working For Notebookcheck
Are you a techie who knows how to translate? Then join our Team!
Details here
Top 10 Laptops Multimedia , Budget Multimedia , Gaming , Budget Gaming , Lightweight Gaming , Business , Budget Office , Workstation , Subnotebooks , Ultrabooks , Chromebooks
under 300 USD/Euros , under 500 USD/Euros , 1,000 USD/Euros , for University Students , Best Displays
Top 10 Smartphones Smartphones , Phablets , ≤6-inch , Camera Smartphones
Klaus Hinum (Update: 2016-01-26)
 Deutsch
 English
 Español
 Français
 Italiano
 Nederlands
 Polski
 Português
 Русский
 Türkçe
 Svenska
 Chinese
 Magyar