Notebookcheck Logo

AMD Radeon R9 280X

AMD Radeon R9 280X

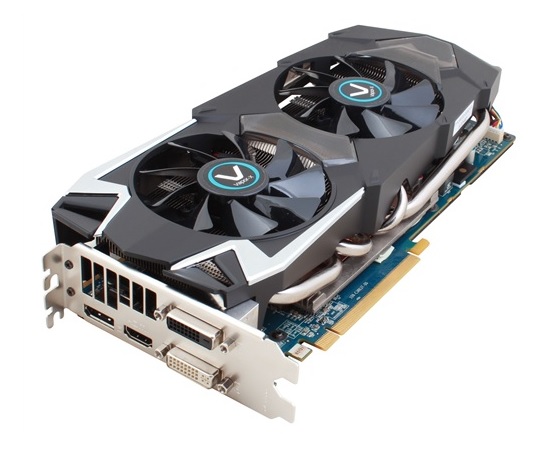
The AMD Radeon R9 280X is a fast single-GPU graphics card for desktop PCs, that has been presented in October 2013. It is based on the "Tahiti" GPU and manufactured in 28 nanometers. The card offers 2048 shader units and a 384-bit memory interface (3 GB GDDR5, 288 GB/s).

Architecture

The R9 280X uses the same chip as the older Radeon HD 7970. Tahiti is based on the GCN architecture and offers 2048 shaders, 128 TMUs and 32 ROPs. Compared to the HD 7970, the R9 280X clocks slightly higher at 1050 MHz for the Core (max. Boost) and 1500 MHz (6000 MHz effective) for the memory. The 280X supports DirectX 12 (FL 11_1), but lacks the new Trueaudio feature.

Performance

Depending on game and settings, the performance of the Radeon R9 280X is similar to the Nvidia GeForce GTX 770. Therefore, even the fastest mobile GPUs like the GeForce GTX 780M are outperformed by more than 30 percent. Demanding games like Metro: Last Light can be played fluently in 2560 x 1600 pixels and maximum settings. In some cases, even higher resolutions or additional AA/AF are possible.

Features

The R9 280X supports well-known features like Eyefinity, but also some innovations such as a new turbo mode. Depending on power consumption and temperature, the core can be boosted up to 1050 MHz. However, there is no offical base clock respectively a lower limit.

Power Consumption

Thanks to dynamic clock adjustments and the Zero Core technology, the R9 280X is very energy efficient while idle. Under load, the card is rated at a typical power consumption of 250 watts.

R9 Series

Radeon R9 290X compare 2816 @ 1 GHz512 Bit @ 5000 MHz
Radeon R9 280X 2048 @ 1 GHz384 Bit @ 6000 MHz
Radeon R9 270X compare 1280 @ 1.05 GHz256 Bit @ 5600 MHz
CodenameThaiti XTL
ArchitectureGCN
Pipelines2048 - unified
Core Speed1000 MHz
Memory Speed6000 MHz
Memory Bus Width384 Bit
Memory TypeGDDR5
Max. Amount of Memory3 GB
Shared Memoryno
APIDirectX 12 (FL 11_1), OpenGL 4.3
Power Consumption250 Watt
Transistor Count4.3 Billion
technology28 nm
FeaturesMantle, Eyefinity, App Acceleration, CrossFire, PowerTune, ZeroCore, HD3D
Date of Announcement08.10.2013
InformationPCI-E 3.0, HDMI mit 4K-Support
Link to Manufacturer Pagewww.amd.com

Benchmarks

Performance Rating - 3DMark 11 + Fire Strike + Time Spy
3.8 pt (11%)
3DMark Vantage
3DM Vant. Perf. total +
3DM Vant. Perf. GPU no PhysX +
3DMark 06 3DMark 06 - Standard 1280x1024 +
Unigine Heaven 3.0 - Unigine Heaven 3.0 DX 11
min: 94.6     avg: 95.2     median: 95.2 (32%)     max: 95.8 fps
SPECviewperf 11
specvp11 snx-01 +
specvp11 tcvis-02 +
specvp11 sw-02 +
specvp11 proe-05 +
specvp11 maya-03 +
specvp11 lightwave-01 +
SPECviewperf 11 - specvp11 lightwave-01
34.3 fps (37%)
specvp11 ensight-04 +
specvp11 catia-03 +
GFXBench (DX / GLBenchmark) 2.7
GFXBench T-Rex HD Offscreen C24Z16 +
- Range of benchmark values for this graphics card
- Average benchmark values for this graphics card
* Smaller numbers mean a higher performance

Game Benchmarks

The following benchmarks stem from our benchmarks of review laptops. The performance depends on the used graphics memory, clock rate, processor, system settings, drivers, and operating systems. So the results don't have to be representative for all laptops with this GPU. For detailed information on the benchmark results, click on the fps number.

med. 1920x1080
40.8  fps    + Compare
» With all tested laptops playable in detail settings med..
Fortnite

Fortnite

2018
med. 1920x1080
158  fps    + Compare
high 1920x1080
60  fps    + Compare
ultra 1920x1080
47.5  fps    + Compare
» With all tested laptops playable in detail settings ultra.
ultra 1920x1080
29.4  fps    + Compare
» The benchmarks indicate that the game is not playable in the tested settings.
med. 1920x1080
61  fps    + Compare
high 1920x1080
36.5  fps    + Compare
ultra 1920x1080
30.5  fps    + Compare
4K 3840x2160
12  fps    + Compare
» With all tested laptops playable in detail settings high.
high 1920x1080
66.7  fps    + Compare
ultra 1920x1080
60.2  fps    + Compare
4K 3840x2160
17  fps    + Compare
» With all tested laptops playable in detail settings ultra.
Mafia 3

Mafia 3

2016
med. 1366x768
49.4  fps    + Compare
high 1920x1080
27.9  fps    + Compare
» With all tested laptops playable in detail settings med..
Overwatch

Overwatch

2016
high 1920x1080
146  fps    + Compare
ultra 1920x1080
73  fps    + Compare
4K 3840x2160
47.4  fps    + Compare
» With all tested laptops playable in detail settings ultra.
med. 1920x1080
44.4  fps    + Compare
high 1920x1080
40.9  fps    + Compare
4K 3840x2160
10.1  fps    + Compare
» With all tested laptops playable in detail settings high.
ultra 1920x1080
51  fps    + Compare
4K 3840x2160
26.6  fps    + Compare
» With all tested laptops playable in detail settings ultra.
ultra 1920x1080
41  fps    + Compare
» With all tested laptops playable in detail settings ultra.
high 1920x1080
47.6  fps    + Compare
ultra 1920x1080
39.7  fps    + Compare
4K 3840x2160
22.5  fps    + Compare
» With all tested laptops playable in detail settings ultra.
low 1024x768
116  fps    + Compare
med. 1366x768
78  fps    + Compare
high 1920x1080
49.3  fps    + Compare
ultra 1920x1080
39.4  fps    + Compare
4K 3840x2160
21.1  fps    + Compare
» With all tested laptops playable in detail settings ultra.
low 1024x768
195  fps    + Compare
med. 1366x768
168  fps    + Compare
high 1920x1080
92  fps    + Compare
ultra 1920x1080
76  fps    + Compare
4K 3840x2160
32.4  fps    + Compare
» With all tested laptops playable in detail settings ultra.
low 1024x768
72  fps    + Compare
med. 1366x768
74  fps    + Compare
high 1920x1080
54  fps    + Compare
ultra 1920x1080
4.3  fps    + Compare
4K 3840x2160
19.4  fps    + Compare
» With all tested laptops playable in detail settings high.
Fallout 4

Fallout 4

2015
low 1280x720
135  fps    + Compare
med. 1366x768
97  fps    + Compare
high 1920x1080
57  fps    + Compare
ultra 1920x1080
44.7  fps    + Compare
4K 3840x2160
17  fps    + Compare
» With all tested laptops playable in detail settings ultra.
low 1024x768
136  fps    + Compare
med. 1366x768
125  fps    + Compare
high 1920x1080
68  fps    + Compare
ultra 1920x1080
45  fps    + Compare
4K 3840x2160
24.2  fps    + Compare
» With all tested laptops playable in detail settings ultra.
Anno 2205

Anno 2205

2015
low 1024x768
129  fps    + Compare
med. 1366x768
95  fps    + Compare
high 1920x1080
52  fps    + Compare
ultra 1920x1080
22.7  fps    + Compare
4K 3840x2160
22.8  fps    + Compare
» With all tested laptops playable in detail settings high.
low 1366x768
224  fps    + Compare
med. 1366x768
180  fps    + Compare
ultra 1920x1080
124  fps    + Compare
4K 3840 x 2160
45  fps    + Compare
» With all tested laptops playable in detail settings ultra.
low 1024x768
60  fps    + Compare
med. 1366x768
60  fps    + Compare
high 1920x1080
60  fps    + Compare
ultra 1920x1080
60  fps    + Compare
4K 3840x2160
35.3  fps    + Compare
» With all tested laptops playable in detail settings ultra.
Mad Max

Mad Max

2015
med. 1366x768
190  fps    + Compare
high 1920x1080
107  fps    + Compare
ultra 1920x1080
91.4  fps    + Compare
4K 3840x2160
35.4  fps    + Compare
» With all tested laptops playable in detail settings ultra.
ultra 1920x1080
137  fps    + Compare
4K 3840x2160
68  fps    + Compare
» With all tested laptops playable in detail settings ultra.
low 1280x720
96  fps    + Compare
med. 1366x768
89  fps    + Compare
high 1920x1080
58  fps    + Compare
4K 3840x2160
20  fps    + Compare
» With all tested laptops playable in detail settings high.
low 1024x768
114.4  fps    + Compare
med. 1366x768
76.4  fps    + Compare
high 1920x1080
47.6  fps    + Compare
ultra 1920x1080
20.2  fps    + Compare
» With all tested laptops playable in detail settings high.
low 1024x768
403.2  fps    + Compare
med. 1366x768
133.5  fps    + Compare
high 1920x1080
109.9  fps    + Compare
ultra 1920x1080
69.5  fps    + Compare
4K 3840x2160
52  fps    + Compare
» With all tested laptops playable in detail settings ultra.
GTA V

GTA V

2015
low 1024x768
129.5  fps    + Compare
med. 1366x768
121.9  fps    + Compare
high 1920x1080
76.3  fps    + Compare
ultra 1920x1080
31.9  fps    + Compare
» With all tested laptops playable in detail settings high.
low 1024x768
149.5  fps    + Compare
med. 1366x768
126.9  fps    + Compare
high 1920x1080
94.4  fps    + Compare
ultra 1920x1080
62  fps    + Compare
» With all tested laptops playable in detail settings ultra.
Evolve

Evolve

2015
low 1024x768
106.1  fps    + Compare
med. 1366x768
97.1  fps    + Compare
high 1920x1080
85.9  fps    + Compare
ultra 1920x1080
75.1  fps    + Compare
» With all tested laptops playable in detail settings ultra.
The Crew

The Crew

2014
low 1280x720
59.9  fps    + Compare
med. 1366x768
59.9  fps    + Compare
high 1920x1080
59.6  fps    + Compare
ultra 1920x1080
52.3  fps    + Compare
» With all tested laptops playable in detail settings ultra.
low 1024x768
141.6  fps    + Compare
med. 1366x768
131.4  fps    + Compare
high 1920x1080
64  fps    + Compare
ultra 1920x1080
40.7  fps    + Compare
» With all tested laptops playable in detail settings ultra.
Far Cry 4

Far Cry 4

2014
low 1024x768
96.4  fps    + Compare
med. 1366x768
92.9  fps    + Compare
high 1920x1080
72  fps    + Compare
ultra 1920x1080
60.4  fps    + Compare
» With all tested laptops playable in detail settings ultra.
low 1024x768
49.3  fps    + Compare
med. 1366x768
43.6  fps    + Compare
high 1920x1080
31.3  fps    + Compare
ultra 1920x1080
23.8  fps    + Compare
» With all tested laptops playable in detail settings med..
low 1024x768
102.1  fps    + Compare
med. 1366x768
77.7  fps    + Compare
high 1920x1080
70.6  fps    + Compare
ultra 1920x1080
53.4  fps    + Compare
» With all tested laptops playable in detail settings ultra.
low 1024x768
160.3  fps    + Compare
med. 1366x768
103.1  fps    + Compare
high 1920x1080
72.2  fps    + Compare
ultra 1920x1080
65.5  fps    + Compare
» With all tested laptops playable in detail settings ultra.
F1 2014

F1 2014

2014
low 1024x768
132  fps    + Compare
med. 1366x768
127  fps    + Compare
high 1920x1080
123  fps    + Compare
ultra 1920x1080
105  fps    + Compare
» With all tested laptops playable in detail settings ultra.
low 1024x768
53.6  fps    + Compare
med. 1366x768
52.1  fps    + Compare
high 1920x1080
52.1  fps    + Compare
» With all tested laptops playable in detail settings high.
low 1024x768
87.6  fps    + Compare
med. 1366x768
83.9  fps    + Compare
high 1920x1080
63.2  fps    + Compare
ultra 1920x1080
59.4  fps    + Compare
» With all tested laptops playable in detail settings ultra.
low 1024x768
197.7  fps    + Compare
med. 1366x768
167  fps    + Compare
high 1920x1080
111.6  fps    + Compare
ultra 1920x1080
85.6  fps    + Compare
» With all tested laptops playable in detail settings ultra.
low 1280x720
198.2  fps    + Compare
med. 1344x756
156.4  fps    + Compare
high 1920x1080
70.7  fps    + Compare
ultra 1920x1080
51.3  fps    + Compare
» With all tested laptops playable in detail settings ultra.
Fifa 15

Fifa 15

2014
low 1280x720
301.1  fps    + Compare
high 1366x768
269.8  fps    + Compare
ultra 1920x1080
147.8  fps    + Compare
» With all tested laptops playable in detail settings ultra.
Sims 4

Sims 4

2014
low 1024x768
187.9  fps    + Compare
med. 1366x768
104.8  fps    + Compare
high 1920x1080
83.8  fps    + Compare
ultra 1920x1080
79.4  fps    + Compare
» With all tested laptops playable in detail settings ultra.
low 1024x768
77.9  fps    + Compare
med. 1366x768
94.7  fps    + Compare
high 1920x1080
50.4  fps    + Compare
ultra 1920x1080
56.4  fps    + Compare
» With all tested laptops playable in detail settings ultra.
low 1024x768
288.4  fps    + Compare
med. 1366x768
143.6  fps    + Compare
high 1920x1080
117.5  fps    + Compare
ultra 1920x1080
90.8  fps    + Compare
» With all tested laptops playable in detail settings ultra.
low 1024x768
73.6  fps    + Compare
med. 1366x768
60.6  fps    + Compare
high 1920x1080
46.4  fps    + Compare
ultra 1920x1080
34.6  fps    + Compare
» With all tested laptops playable in detail settings high.
low 1280x720
60  fps    + Compare
med. 1280x720
60  fps    + Compare
high 1920x1080
59.4  fps    + Compare
ultra 1920x1080
57.3  fps    + Compare
» With all tested laptops playable in detail settings ultra.
low 1024x768
97.4  fps    + Compare
med. 1366x768
94  fps    + Compare
high 1366x768
84.1  fps    + Compare
ultra 1920x1080
53.7  fps    + Compare
» With all tested laptops playable in detail settings ultra.
Titanfall

Titanfall

2014
low 1024x768
60  fps    + Compare
med. 1366x768
60  fps    + Compare
high 1366x768
60  fps    + Compare
ultra 1920x1080
59.9  fps    + Compare
» With all tested laptops playable in detail settings ultra.
Thief

Thief

2014
low 1024x768
69.4  fps    + Compare
med. 1366x768
67.4  fps    + Compare
high 1366x768
65.6  fps    + Compare
ultra 1920x1080
53.4  fps    + Compare
» With all tested laptops playable in detail settings ultra.
low 1024x768
61.7  fps    + Compare
med. 1366x768
61.7  fps    + Compare
high 1366x768
61.7  fps    + Compare
ultra 1920x1080
42.8  fps    + Compare
» With all tested laptops playable in detail settings ultra.
low 1024x768
89.1  fps    + Compare
med. 1366x768
47.8  fps    + Compare
high 1366x768
24.8  fps    + Compare
ultra 1920x1080
18.6  fps    + Compare
» With all tested laptops playable in detail settings med..
low 1024x768
30  fps    + Compare
med. 1366x768
30  fps    + Compare
high 1366x768
30  fps    + Compare
ultra 1920x1080
30  fps    + Compare
» The benchmarks indicate that the game is not playable in the tested settings.
low 1024x768
84.2  fps    + Compare
med. 1366x768
87.6  fps    + Compare
high 1366x768
69.2  fps    + Compare
ultra 1920x1080
47.8  fps    + Compare
» With all tested laptops playable in detail settings ultra.
low 1024x768
137.3  fps    + Compare
med. 1366x768
114.2  fps    + Compare
high 1366x768
101.7  fps    + Compare
ultra 1920x1080
58.5  fps    + Compare
» With all tested laptops playable in detail settings ultra.
low 1024x768
320  fps    + Compare
med. 1366x768
261  fps    + Compare
high 1366x768
175  fps    + Compare
ultra 1920x1080
79  fps    + Compare
» With all tested laptops playable in detail settings ultra.
F1 2013

F1 2013

2013
low 1024x768
133  fps    + Compare
med. 1366x768
129  fps    + Compare
high 1366x768
124  fps    + Compare
ultra 1920x1080
112  fps    + Compare
» With all tested laptops playable in detail settings ultra.
low 1024x768
56.4  fps    + Compare
med. 1366x768
56.3  fps    + Compare
high 1366x768
55.5  fps    + Compare
ultra 1920x1080
36.2  fps    + Compare
» With all tested laptops playable in detail settings ultra.
GRID 2

GRID 2

2013
low 1024x768
196.2  fps    + Compare
med. 1366x768
140.7  fps    + Compare
high 1366x768
129  fps    + Compare
ultra 1920x1080
97.2  fps    + Compare
» With all tested laptops playable in detail settings ultra.
low 1024x768
132.1  fps    + Compare
med. 1366x768
129.3  fps    + Compare
high 1366x768
94.2  fps    + Compare
ultra 1920x1080
53.9  fps    + Compare
» With all tested laptops playable in detail settings ultra.
low 1280x720
253.3  fps    + Compare
med. 1366x768
211.7  fps    + Compare
high 1366x768
182.6  fps    + Compare
ultra 1920x1080
76.3  fps    + Compare
» With all tested laptops playable in detail settings ultra.
low 1024x768
486.2  fps    + Compare
med. 1366x768
310.5  fps    + Compare
high 1366x768
207.8  fps    + Compare
ultra 1920x1080
101.1  fps    + Compare
» With all tested laptops playable in detail settings ultra.
Crysis 3

Crysis 3

2013
low 1024x768
143.5  fps    + Compare
med. 1366x768
124.1  fps    + Compare
high 1366x768
88.3  fps    + Compare
ultra 1920x1080
38.5  fps    + Compare
» With all tested laptops playable in detail settings ultra.
lowmed.highultraQHD4K
Final Fantasy XV Benchmark40.8
Fortnite1586047.5
Playerunknown's Battlegrounds (PUBG)29.4
Team Fortress 292
Mass Effect Andromeda6136.530.512
Battlefield 166.760.217
Mafia 349.427.9
Deus Ex Mankind Divided43.2
Overwatch1467347.4
Ashes of the Singularity44.440.910.1
Need for Speed 20165126.6
Hitman 201641
The Division47.639.722.5
Rise of the Tomb Raider1167849.339.421.1
Star Wars Battlefront195168927632.4
Assassin's Creed Syndicate7274544.319.4
Fallout 4135975744.717
Call of Duty: Black Ops 3136125684524.2
Anno 2205129955222.722.8
World of Warships22418012445
Metal Gear Solid V6060606035.3
Mad Max19010791.435.4
Dota 2 Reborn13768
Batman: Arkham Knight96895820
The Witcher 3114.476.447.620.2
Dirt Rally403.2133.5109.969.552
GTA V129.5121.976.331.9
Battlefield Hardline149.5126.994.462
Evolve106.197.185.975.1
The Crew59.959.959.652.3
Dragon Age: Inquisition141.6131.46440.7
Far Cry 496.492.97260.4
Assassin's Creed Unity49.343.631.323.8
Call of Duty: Advanced Warfare102.177.770.653.4
Civilization: Beyond Earth160.3103.172.265.5
F1 2014132127123105
The Evil Within53.652.152.1
Ryse: Son of Rome87.683.963.259.4
Alien: Isolation197.7167111.685.6
Middle-earth: Shadow of Mordor198.2156.470.751.3
Fifa 15301.1269.8147.8
Sims 4187.9104.883.879.4
Risen 3: Titan Lords77.994.750.456.4
GRID: Autosport288.4143.6117.590.8
Watch Dogs73.660.646.434.6
Wolfenstein: The New Order606059.457.3
The Elder Scrolls Online97.49484.153.7
Titanfall60606059.9
Thief69.467.465.653.4
Assassin´s Creed IV: Black Flag61.761.761.742.8
X-Plane 10.2589.147.824.818.6
Need for Speed: Rivals30303030
Call of Duty: Ghosts84.287.669.247.8
Battlefield 4137.3114.2101.758.5
Batman: Arkham Origins32026117579
F1 2013133129124112
Company of Heroes 256.456.355.536.2
GRID 2196.2140.712997.2
Metro: Last Light132.1129.394.253.9
BioShock Infinite253.3211.7182.676.3
Tomb Raider486.2310.5207.8101.1
Crysis 3143.5124.188.338.5
< 30 fps
< 60 fps
< 120 fps
≥ 120 fps

5
18
24

9
23
20
2
18
27
8
6
27
19
3


11
6
2

For more games that might be playable and a list of all games and graphics cards visit our Gaming List

Add one or more devices and compare

In the following list you can select (and also search for) devices that should be added to the comparison. You can select more than one device.

restrict list:

show all (including archived), 2024, 2023
v1.26
log 05. 19:05:58

#0 no ids found in url (should be separated by "_") +0s ... 0s

#1 not redirecting to Ajax server +0s ... 0s

#2 did not recreate cache, as it is less than 5 days old! Created at Mon, 04 Mar 2024 05:34:43 +0100 +0.001s ... 0.001s

#3 composed specs +0.037s ... 0.038s

#4 did output specs +0s ... 0.038s

#5 start showIntegratedCPUs +0s ... 0.038s

#6 getting avg benchmarks for device 5060 +0.027s ... 0.066s

#7 got single benchmarks 5060 +0.011s ... 0.077s

#8 got avg benchmarks for devices +0s ... 0.077s

#9 min, max, avg, median took s +0.515s ... 0.591s

#10 before gaming benchmark output +0s ... 0.591s

#11 Got 228 rows for game benchmarks. +0.007s ... 0.598s

#12 composed SQL query for gamebenchmarks +0s ... 0.598s

#13 got data and put it in $dataArray +0.045s ... 0.643s

#14 benchmarks composed for output. +2.022s ... 2.665s

#15 return log +0.042s ... 2.706s

No reviews found for this graphics card.

Please share our article, every link counts!

» Comparison of GPUs
Detailed list of all laptop GPUs sorted by class and performance.

» Benchmark List
Sort and restrict laptop GPUs based on performance in synthetic benchmarks.

» Notebook Gaming List
Playable games for each graphics card and their average FPS results.

Class 1

Class 2

Class 3

UHD Graphics 32EUs
UHD Graphics 750

Class 4

* Approximate position of the graphics adapter