OCZ Vertex 460 240 GB SSD (VTX460-25SAT3-240G) Review
For the original German review, see here.
Performance and capacity for little money? As the prices for SSDs have fallen rapidly, the robust and mostly frugal flash memories have become alternatives for nearly everyone nowadays. Although many budget and midrange laptops still come with rotating hard drives, many customers upgrade to 2.5-inch SSDs after a while.
OCZ, who now belongs to the Toshiba group, offers the Vector 150 (e.g. 240 GB, about 136 Euros; ~$189) and the Vertex 460 with the same capacity (about 133 Euros; ~$185) for very similar prices. The only apparent difference is the clock of the controller: The Vector 150 features an Indilinx Barefoot 3 (IDX500M00-BC) with 397 MHz, and the Vertex 460, a Barefoot 3 M10 with 352 MHz. The power consumption of the Vector 150 is marginally lower: 2.5 instead of 2.7 W (in operation), 0.55 instead of 0.6 W (idle). Anandtech checked the manufacturer's specification and confirmed that it is very accurate for the Vertex. However, the Vector 150 is on par according to their measurements (idle/write).
We already reviewed the 120 GB model of the Vector 150; therefore, we can make comparisons.
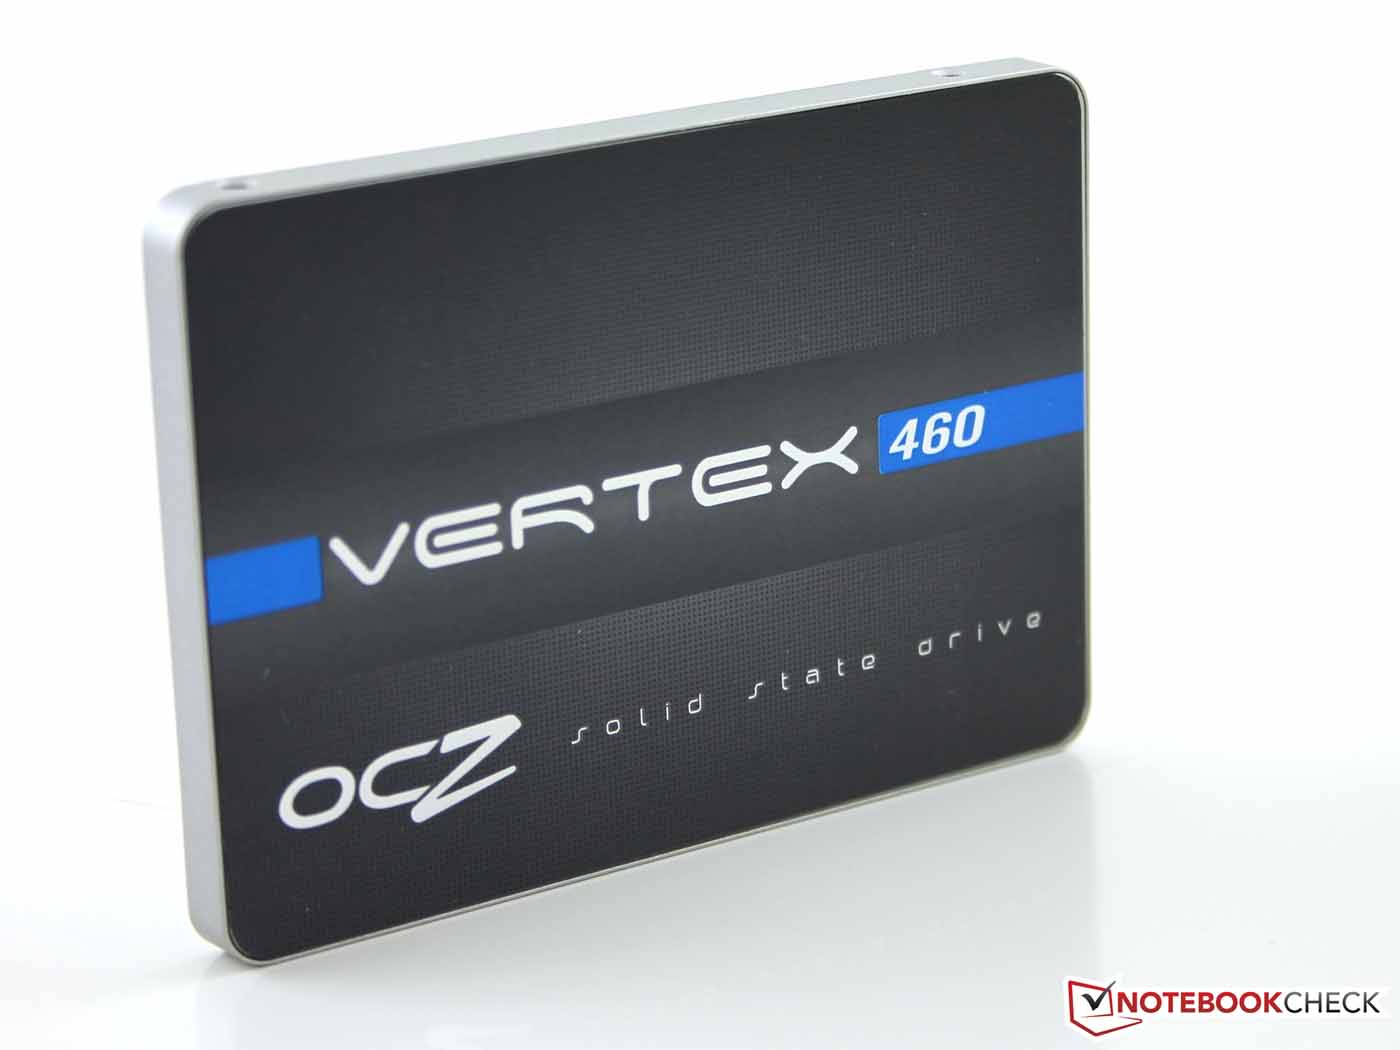
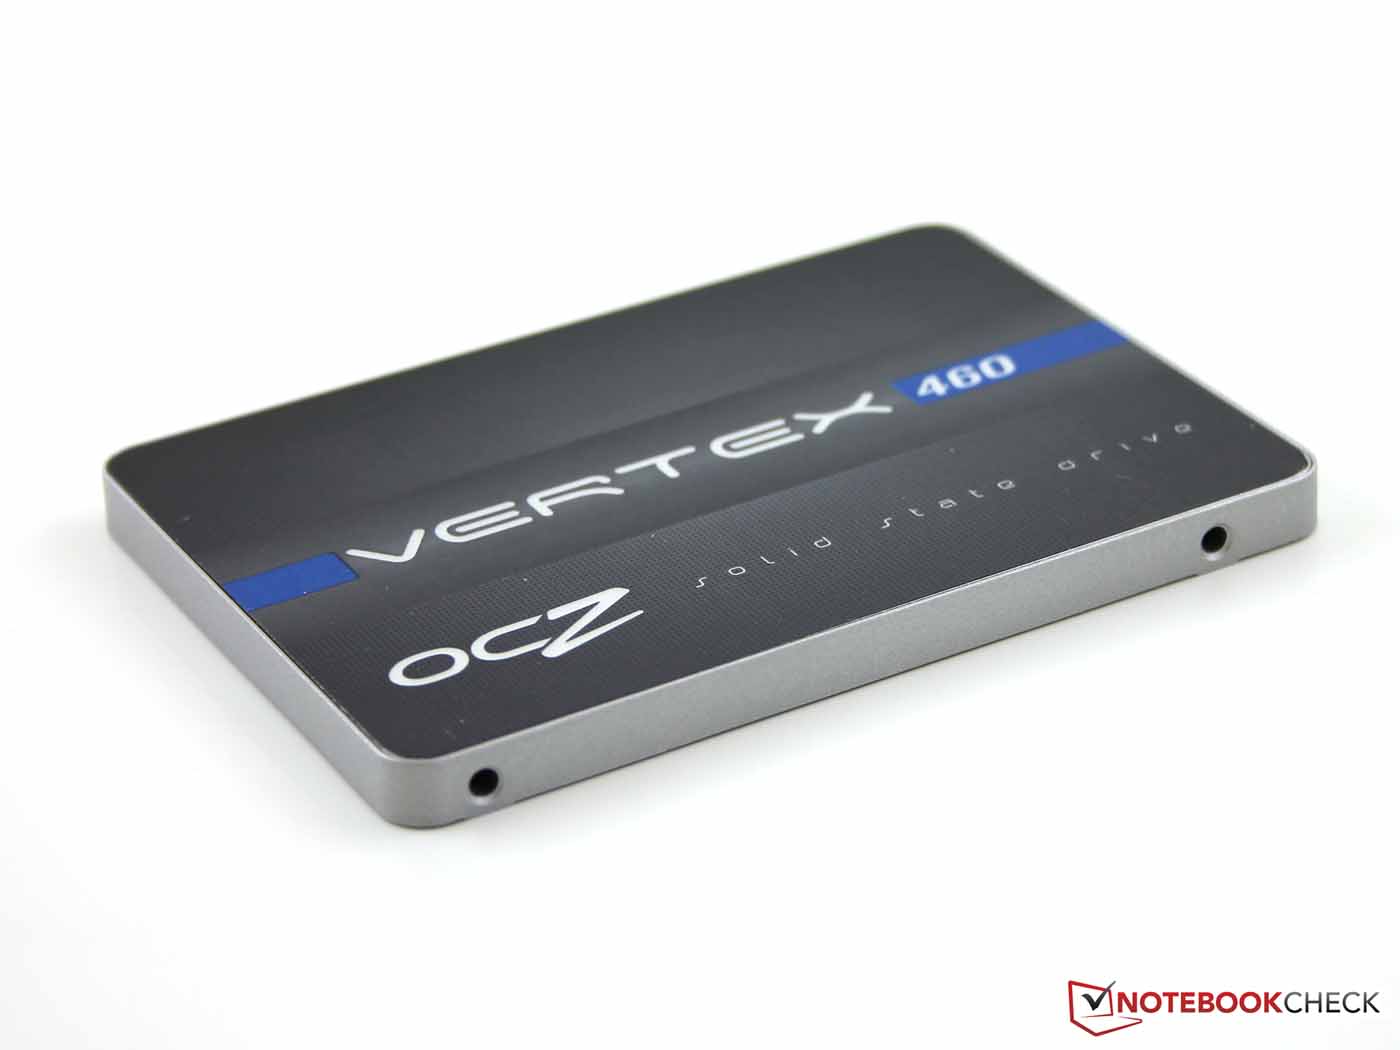
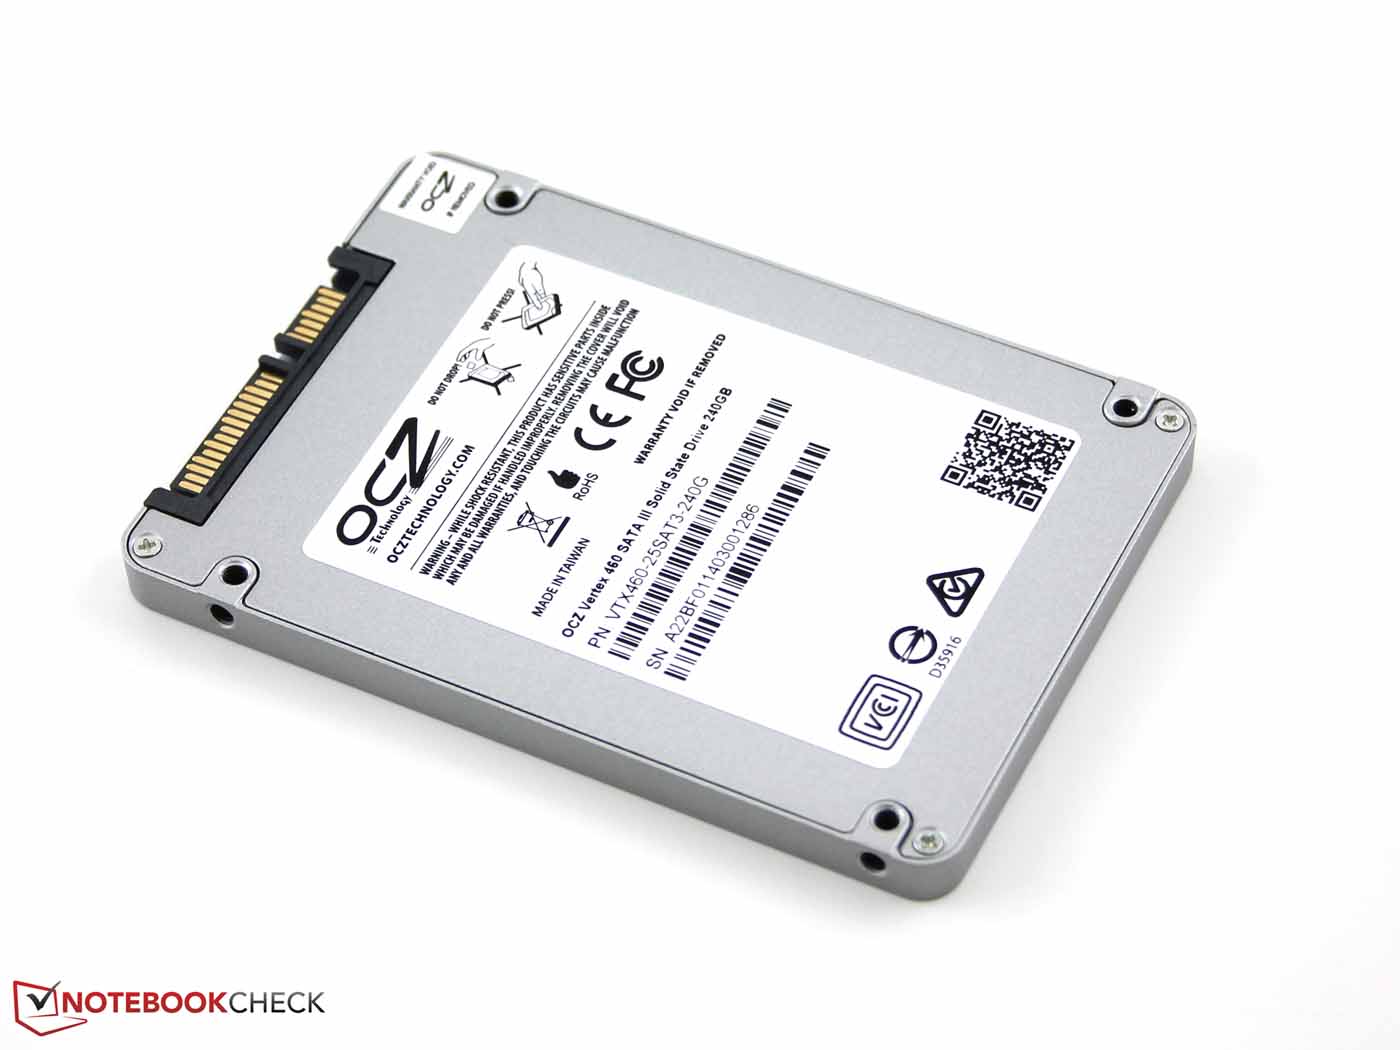
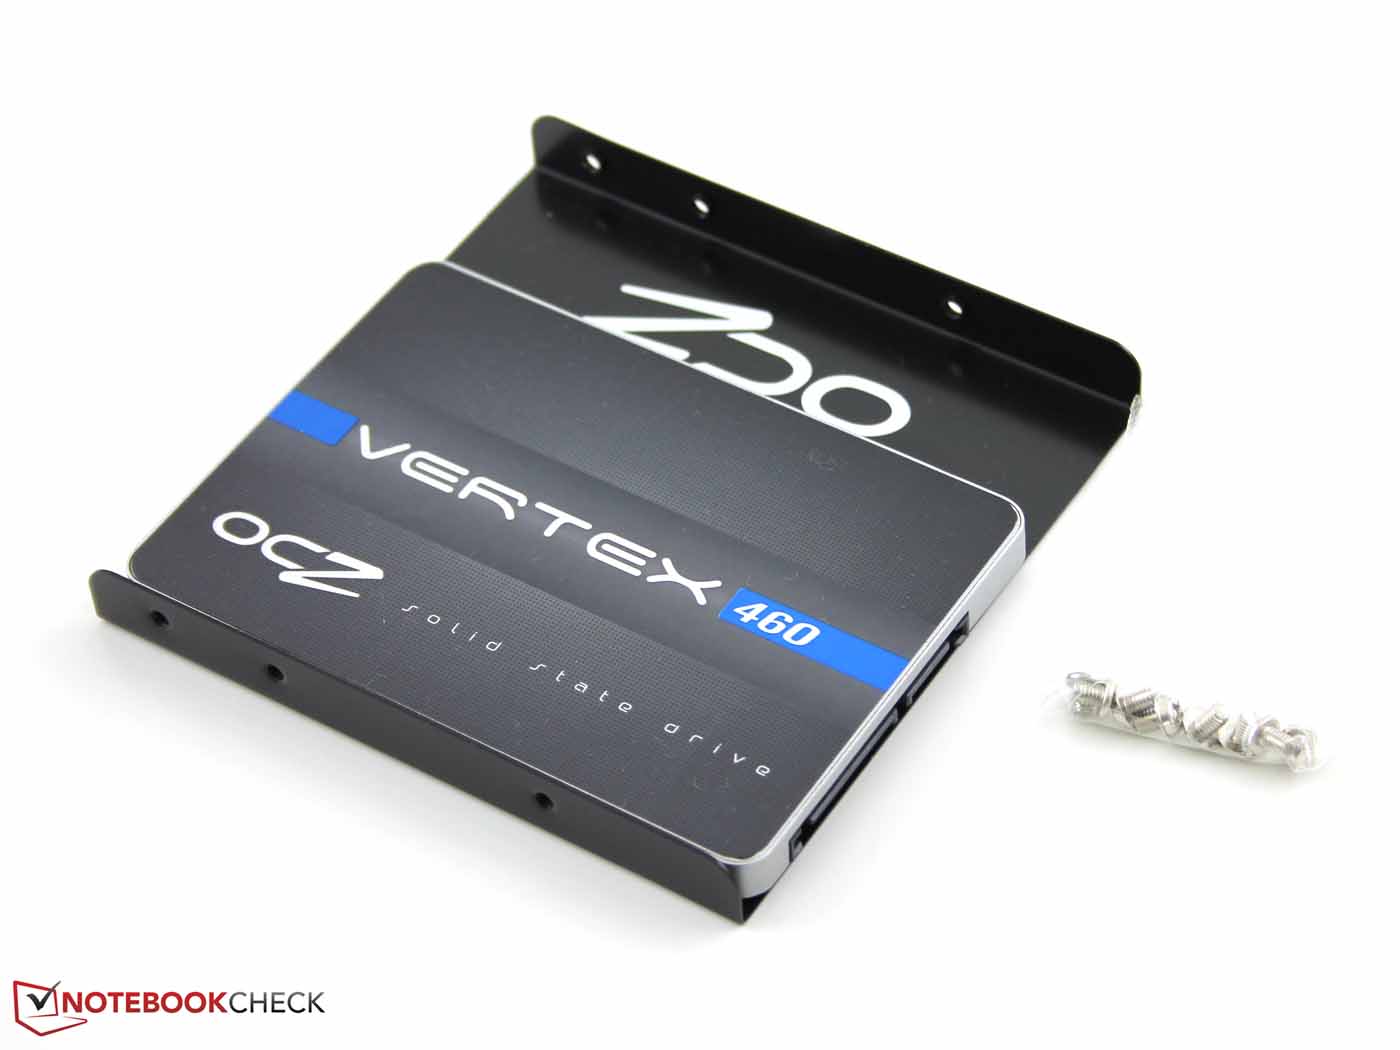
Currently, OCZ is represented with three Vertex 460 models (120, 240, 480 GB) in the upper class market. All of them are based on the Indilinx Barefoot 3 M10 controller. OCZ ships the 2.5-inch SATA drive (99.7 x 69.75 x 7 mm; ~3.9 x 2.7 x 0.3 inches) with the Acronis True Image HD cloning software. This also makes moving the system from a bigger HDD (500 GB in our case) to a smaller SSD possible. The size of the main partition is reduced appropriately. Laymen had better not use this tool, since moving the visible and the hidden partitions is rather difficult despite a user guide. Thanks to the included 2.5-inch to 3.5-inch mounting bracket, the Vertex 460 can also be incorporated in a desktop computer.
Not yet available: The OCZ Deneva 2 C M3T with SandForce SF-2281 controller. The price of the 240 GB model (200 to 240 Euros; ~$278 to $333) is significantly higher. The Deneva is an Enterprise solution.
- 2.5-inch, SATA 6 GB/s
- Power consumption: 2.7 W (in operation)/0.6 W (idle)
- MTBF: 2 million hours
- Read: 540 MB/s; Write: 525 MB/s
- NAND type: MLC (19 nm, Toshiba)
- Controller: Indilinx Barefoot 3 M10
- Manufacturer's warranty: three years
- Supplies: software included, 2.5" to 3.5" mounting bracket
Sequential Performance
The 240 GB model of the Vertex 460 performs very well in the sequential tests and is on par with the top models from Samsung (SM841, PM841, 840 Pro, 840 EVO), Crucial (M500 120 GB), or Intel (520 series). However, the data transfer rates of the MLC chips are so close to each other that sequential reading can hardly determine the quality.
However, the results in sequential writing are noticeably different. Our test model belongs to the leading devices. Samsung's PM841 and Crucial's M500 perform significantly worse. The differences are even bigger in CrystalDiskMark 3.0, but the ranking is basically the same. Not so the Read 512: The Vertex 460 is no longer leading; it is 20% slower than Samsung's 840 Pro and EVO.
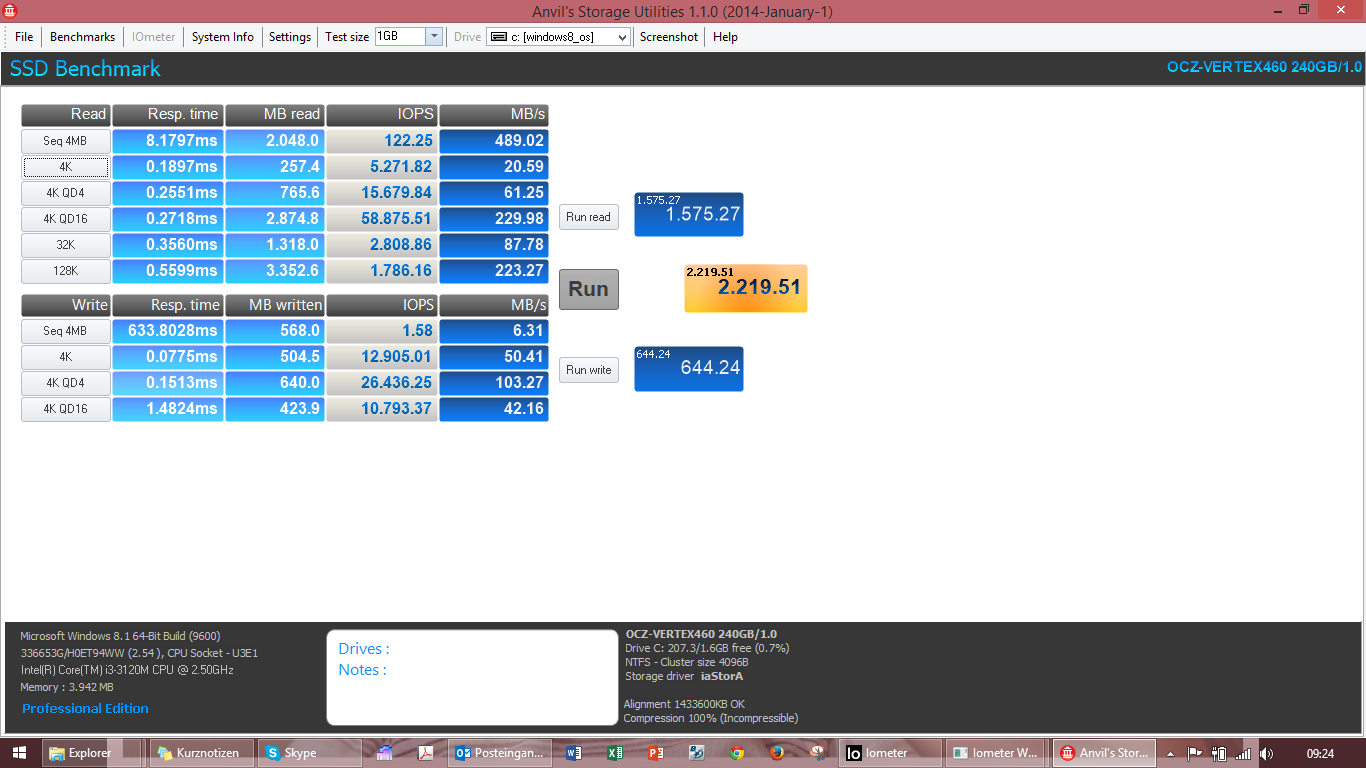
Anvil's Storage benchmark confirms the sequential data transfer rate, but focuses on small, fragmented files. It achieves high 50 MB/s in 4K writing, but only 20 MB/s in reading.
| AS SSD | |
| Seq Read (sort by value) | |
| OCZ Vertex 460 VTX460-25SAT3-240G | |
| Samsung SSD SM841 256GB MZ7PD256HAFV | |
| Samsung SSD PM841 MZMTD512HAGL | |
| OCZ Vector 256 GB | |
| Corsair Neutron GTX SSD | |
| Samsung SSD 840 Pro 256GB MZ7PD256HAFV | |
| Samsung SSD 840 EVO 250GB | |
| OCZ Vertex 4 256 GB VTX4-25SAT3-256G | |
| Crucial M500 120 GB CT120M500SSD3 | |
| OCZ Vector 150 120 GB | |
| Intel SSD 520 Series SSDSC2CW240A | |
| Liteonit LMT-256M6S | |
| OCZ Vertex 460 Notebook 3120M | |
| Seq Write (sort by value) | |
| OCZ Vertex 460 VTX460-25SAT3-240G | |
| Samsung SSD SM841 256GB MZ7PD256HAFV | |
| Samsung SSD PM841 MZMTD512HAGL | |
| OCZ Vector 256 GB | |
| Corsair Neutron GTX SSD | |
| Samsung SSD 840 Pro 256GB MZ7PD256HAFV | |
| Samsung SSD 840 EVO 250GB | |
| OCZ Vertex 4 256 GB VTX4-25SAT3-256G | |
| Crucial M500 120 GB CT120M500SSD3 | |
| OCZ Vector 150 120 GB | |
| Intel SSD 520 Series SSDSC2CW240A | |
| Liteonit LMT-256M6S | |
| OCZ Vertex 460 Notebook 3120M | |
4K Benchmarks
The 4K benchmarks are not a strength of the OCZ Vertex 460. The PM841 or the 840 EVO perform about 60 to 140% better and are more likely leading devices. Although there is also a difference in CrystalDiskMark, it is not that big. Overall, (average of all values), the Samsung, the Corsair, and the Vector 256/Vertex 4 256 perform 20 to 60% better than our Vertex 460 in the AS SSD and the CrystalDiskMark tests. Samsung's SM841 performs best with +61%.
Access Times
The write access times of the Vertex 460 are significantly worse than the competition's. The same was already true for the Vertex 4 256. The access times of the competition are about 30 to 60% shorter. It is striking how much worse Intel's 520 series (- 159%) perform in writing.
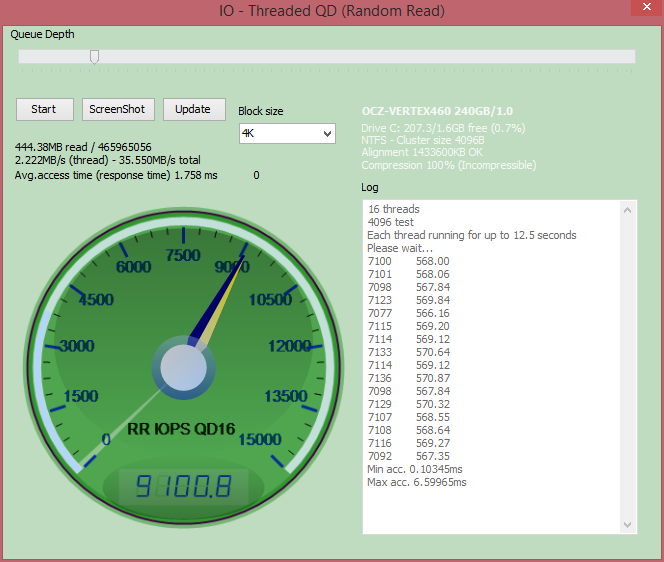
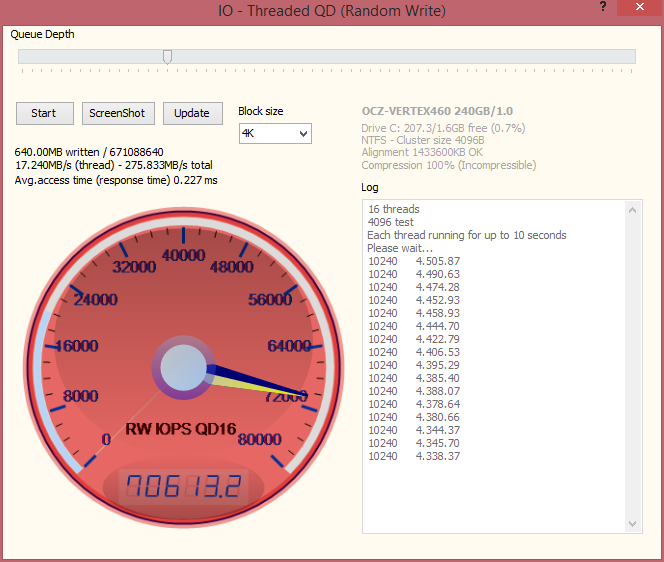
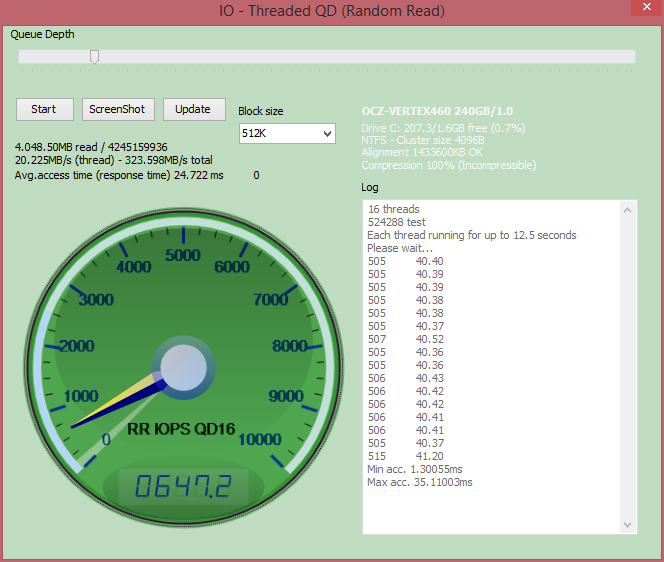
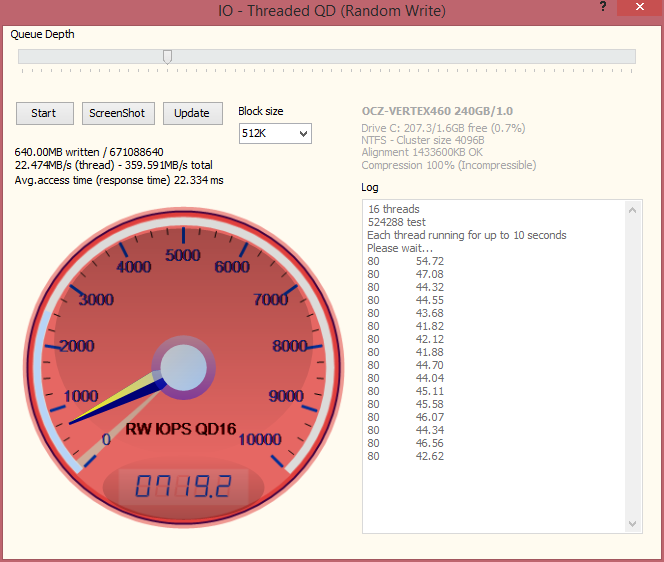
Anvil reports an average response time of 24.7 ms (512 K) in the IO Threaded QD (Random Write) test. It is 7.9 ms with IOMeter. Anvil says the access time is 0.227 ms in writing 4K blocks, while it is 0.114 ms according to AS SSD.
| AS SSD | |
| Access Time Read (sort by value) | |
| OCZ Vertex 460 VTX460-25SAT3-240G | |
| Samsung SSD SM841 256GB MZ7PD256HAFV | |
| Samsung SSD PM841 MZMTD512HAGL | |
| OCZ Vector 256 GB | |
| Corsair Neutron GTX SSD | |
| Samsung SSD 840 Pro 256GB MZ7PD256HAFV | |
| Samsung SSD 840 EVO 250GB | |
| OCZ Vertex 4 256 GB VTX4-25SAT3-256G | |
| Crucial M500 120 GB CT120M500SSD3 | |
| OCZ Vector 150 120 GB | |
| Intel SSD 520 Series SSDSC2CW240A | |
| Liteonit LMT-256M6S | |
| OCZ Vertex 460 Notebook 3120M | |
| Access Time Write (sort by value) | |
| OCZ Vertex 460 VTX460-25SAT3-240G | |
| Samsung SSD SM841 256GB MZ7PD256HAFV | |
| Samsung SSD PM841 MZMTD512HAGL | |
| OCZ Vector 256 GB | |
| Corsair Neutron GTX SSD | |
| Samsung SSD 840 Pro 256GB MZ7PD256HAFV | |
| Samsung SSD 840 EVO 250GB | |
| OCZ Vertex 4 256 GB VTX4-25SAT3-256G | |
| Crucial M500 120 GB CT120M500SSD3 | |
| OCZ Vector 150 120 GB | |
| Intel SSD 520 Series SSDSC2CW240A | |
| Liteonit LMT-256M6S | |
| OCZ Vertex 460 Notebook 3120M | |
* ... smaller is better
Realistic Tests
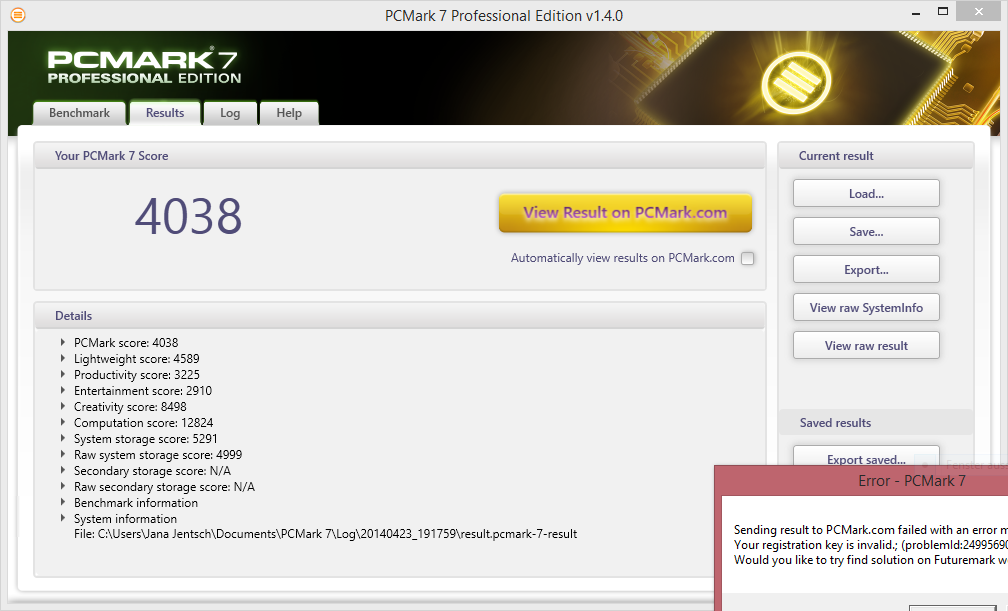
PCMark 7 impressively demonstrates the high level of all SSDs in our tests. Hardly any difference can be seen in the Storage test. Samsung's SM841 and 840 Pro perform best by a small margin. The overall scores differ greatly, but CPU and GPU of each system have an impact on it.
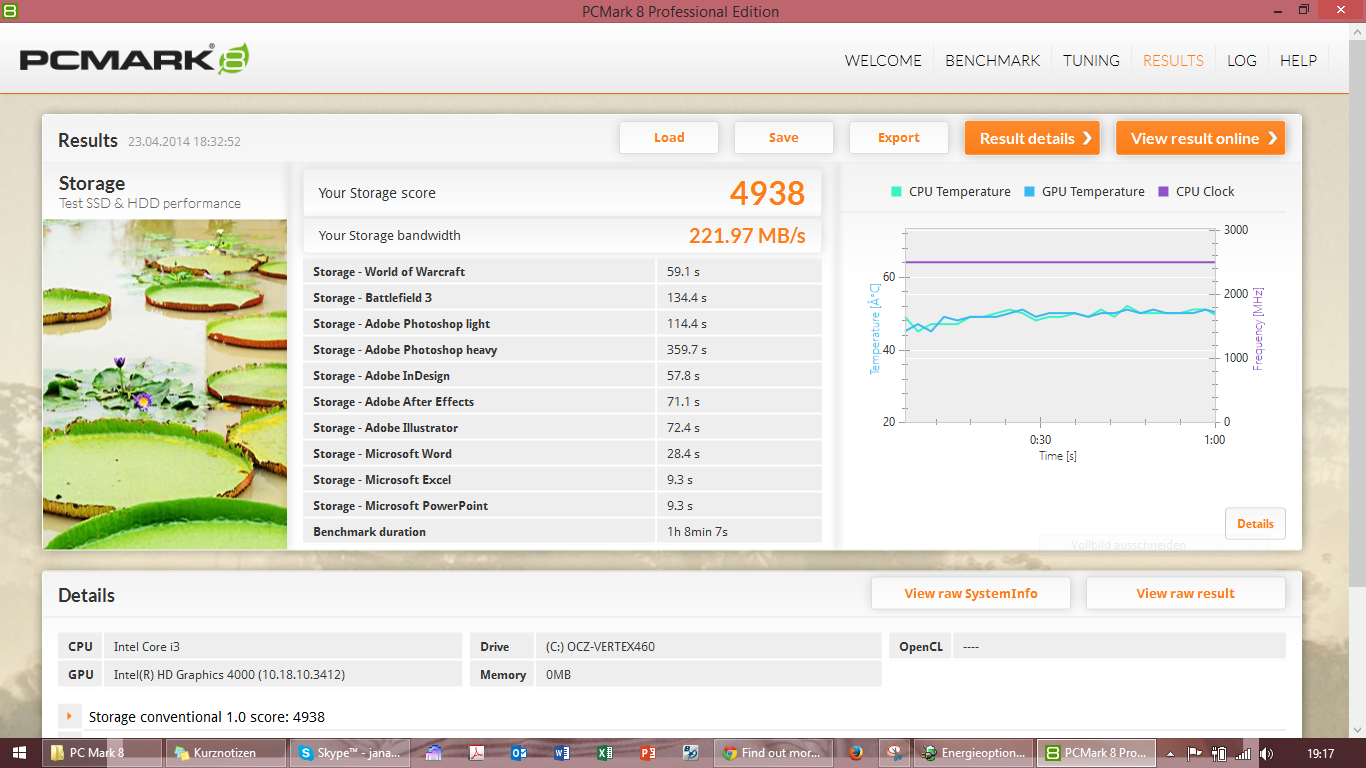
The PCMark 8.2 Storage score reports 4948 points. Other SSD systems can also achieve this. Although it took above one hour, it did not come up with a difference. Apparently, the SSD models are on such a high level, only bad controllers or HDDs would stand out of the crowd.
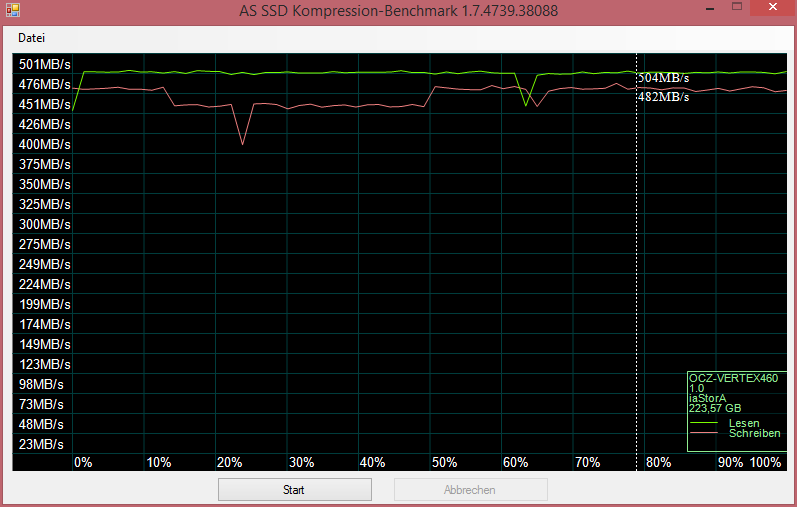
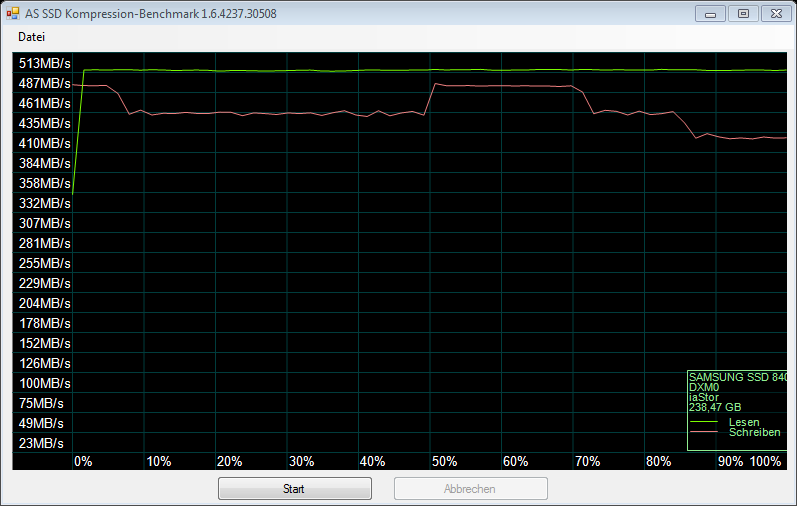
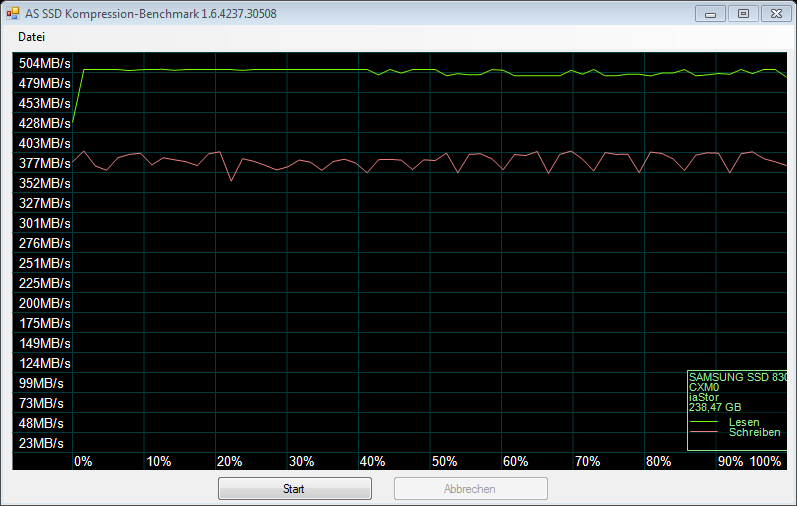
The Compression subtest of AS SSD tests the data transfer of data with a varying degree of compressibility. The Barefoot controller shows its strengths compared to the Samsung-MEX/MCX and SandForce competitors. Its write and read rates always remain high.
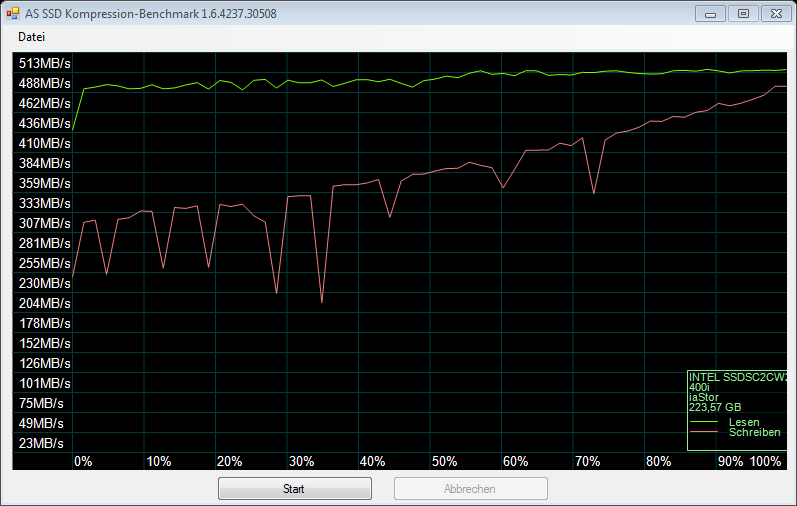
Unlike SSDs with SandForce SF-2000 controllers (e.g., the Intel SSD 520), the performance of the Vertex 460 does not depend on the compressibility of data. The two lines for read and write are even closer than the Samsung 840 (MEX)'s.
| PCMark 7 | |
| Score (sort by value) | |
| OCZ Vertex 460 VTX460-25SAT3-240G | |
| Samsung SSD SM841 256GB MZ7PD256HAFV | |
| Samsung SSD PM841 MZMTD512HAGL | |
| OCZ Vector 256 GB | |
| Corsair Neutron GTX SSD | |
| Samsung SSD 840 Pro 256GB MZ7PD256HAFV | |
| Samsung SSD 840 EVO 250GB | |
| OCZ Vertex 4 256 GB VTX4-25SAT3-256G | |
| Crucial M500 120 GB CT120M500SSD3 | |
| Intel SSD 520 Series SSDSC2CW240A | |
| Liteonit LMT-256M6S | |
| OCZ Vertex 460 Notebook 3120M | |
| System Storage (sort by value) | |
| OCZ Vertex 460 VTX460-25SAT3-240G | |
| Samsung SSD SM841 256GB MZ7PD256HAFV | |
| Samsung SSD PM841 MZMTD512HAGL | |
| OCZ Vector 256 GB | |
| Corsair Neutron GTX SSD | |
| Samsung SSD 840 Pro 256GB MZ7PD256HAFV | |
| Samsung SSD 840 EVO 250GB | |
| OCZ Vertex 4 256 GB VTX4-25SAT3-256G | |
| Crucial M500 120 GB CT120M500SSD3 | |
| Intel SSD 520 Series SSDSC2CW240A | |
| Liteonit LMT-256M6S | |
| OCZ Vertex 460 Notebook 3120M | |
| PCMark 8 - Storage Score (sort by value) | |
| OCZ Vertex 460 VTX460-25SAT3-240G | |
| Samsung SSD SM841 256GB MZ7PD256HAFV | |
| Samsung SSD 840 EVO 250GB | |
| Crucial M500 120 GB CT120M500SSD3 | |
| Liteonit LMT-256M6S | |
| OCZ Vertex 460 Notebook 3120M | |
The AS SSD Copy benchmark tests copying of realistic data. The results of different runs differ slightly (uncontrolled use of the SSD by the OS, system programs). Therefore, the following image is rather a snapshot than a real result. In any case, the Vertex 460 could not take the lead. This corresponds to the 4K Read/Write benchmarks from above.
System Performance
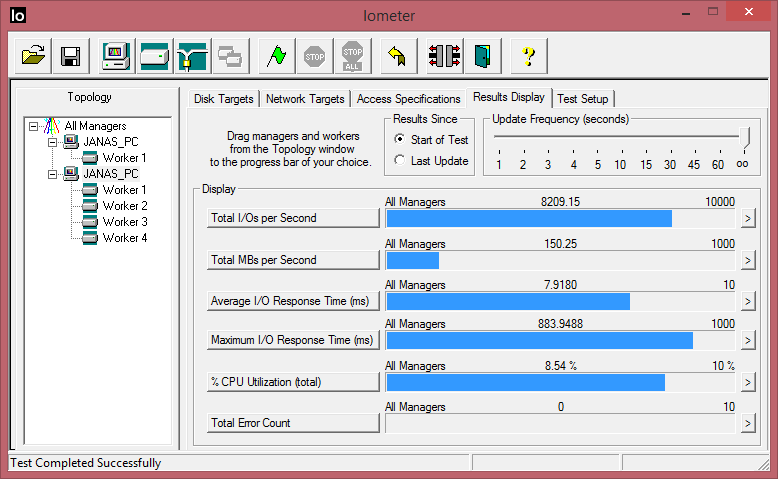
In our opinion, the performance with the profile "IOMix" in the IOMeter benchmark tool belongs to the system tests. It tests typical access to the SSD in everyday use. The Vertex 460 is outperformed by the mentioned competitors in the IOMix test. The Vector 256 from the same manufacturer performed 83% better and even the older Intel SSD 520 is 53% better.
| IOMeter - IOMix, 5min, 10GB Partition (sort by value) | |
| OCZ Vertex 460 VTX460-25SAT3-240G | |
| OCZ Vector 256 GB | |
| Samsung SSD 840 Pro 256GB MZ7PD256HAFV | |
| OCZ Vertex 4 256 GB VTX4-25SAT3-256G | |
| OCZ Vector 150 120 GB | |
| Intel SSD 520 Series SSDSC2CW240A | |
| OCZ Vertex 460 Notebook 3120M | |
Compatibility
The SSD was recognized by the target computer without problems (Lenovo ThinkPad Edge E530c). But, it took nerves to boot from the Acronis drive, which contained our HDD image (all partitions). We needed several trial and error attempts with different BIOS settings.
Reliability
Reliability and durability are important aspects for SSDs. OCZ had built up a bad reputation with its Agility 3 in 2012, since a large percentage of a batch already malfunctioned after a few weeks of use at customer sites. If we talk about durability, we mean lifetime in years and the remaining capacity after many write cycles. It is still not possible to write to flash memory arbitrarily often. Therefore, the controller features mechanisms for replacing bad sectors (garbage collection).
We mentioned a small difference between the Vector 150 (top model) and the Vertex 460 (midrange) above. Here we find a second one: The NAND chips of the Vector 150 go through more testing and validation cycles. Therefore, OCZ can specify a significantly higher endurance of 50 GB/days for 5 years for it. See Anandtech's OCZ Vertex 460 (240GB) review.
OCZ grants a shorter warranty period of 3 years for the Vertex 460 than for the Vector 150 (5 years). We do not know if this alone already allows drawing conclusions about lifespan. As the scores for the Vector 150 are the same or even better (4K Write +61%; Access Time Read +54%, AS SSD Copy Benchmarks +15 to 98%), there is no reason not to buy the sister model with five years of warranty for the same price.
The SSD Endurance test uses an interesting approach. SSDs are written live (simulated user, write 16 GB of random data) and so degraded. The amount of data in Terra byte is continuously reported to the website. Currently there are only four participants and OCZ does not belong to them. But Samsung's 840 EVO and Intel's 520 series do. OCZ specifies 20 GB write cycles for three years for its Vertex 460. With a maximum write volume (TBW) of 91 TB (specification of the Vector 150), this would give a lifetime of above 12 years.
OCZ uses so-called Idle Time Garbage Collection. The SSD uses idle times to reorganize data blocks. Thus, the performance should remain high during load.
Verdict
The OCZ Vertex 460 is a good SSD, although it cannot keep up with high-end SSDs in all aspects (at least in this comparison). Overall, the results in the synthetic tests speak in favor of the competition. However, users would have to be very accurate to be able to experience higher transfer rates and shorter access times in practice.
Certainly, fast copying, faster program launches and games are advantageous. However, apart from workstation use, no user will work on a PC with a stopwatch. All things considered, customers get a decent storage capacity (240 GB) for an affordable 134 Euros (~$186). But, the Vector 150 top model (same Toshiba-NAND, but better testing, 5 years instead of 3 years) costs about the same in the market. Therefore, there is no reason to buy the Vertex 460.
More important than discussing the performance level, is questioning the rather poor cloning solution; Acronis True Image HD, included with the drive. Beginners, who dare to physically replace an HDD with an SSD, might be unable to succeed with it. While it is easy to create an HDD image, it is difficult and time consuming to move from a bigger HDD to a smaller SSD with hidden partitions. This scenario is especially common when switching from HDDs to SSDs in laptops.
It is always difficult to evaluate durability and reliability of new SSDs and controllers. We did not face incompatibilities with data loss, blue screens and other anomalies.
An overview of all SSDs, which we tested separately or in a notebook review is available in our HDD-/SSD benchmark list.

