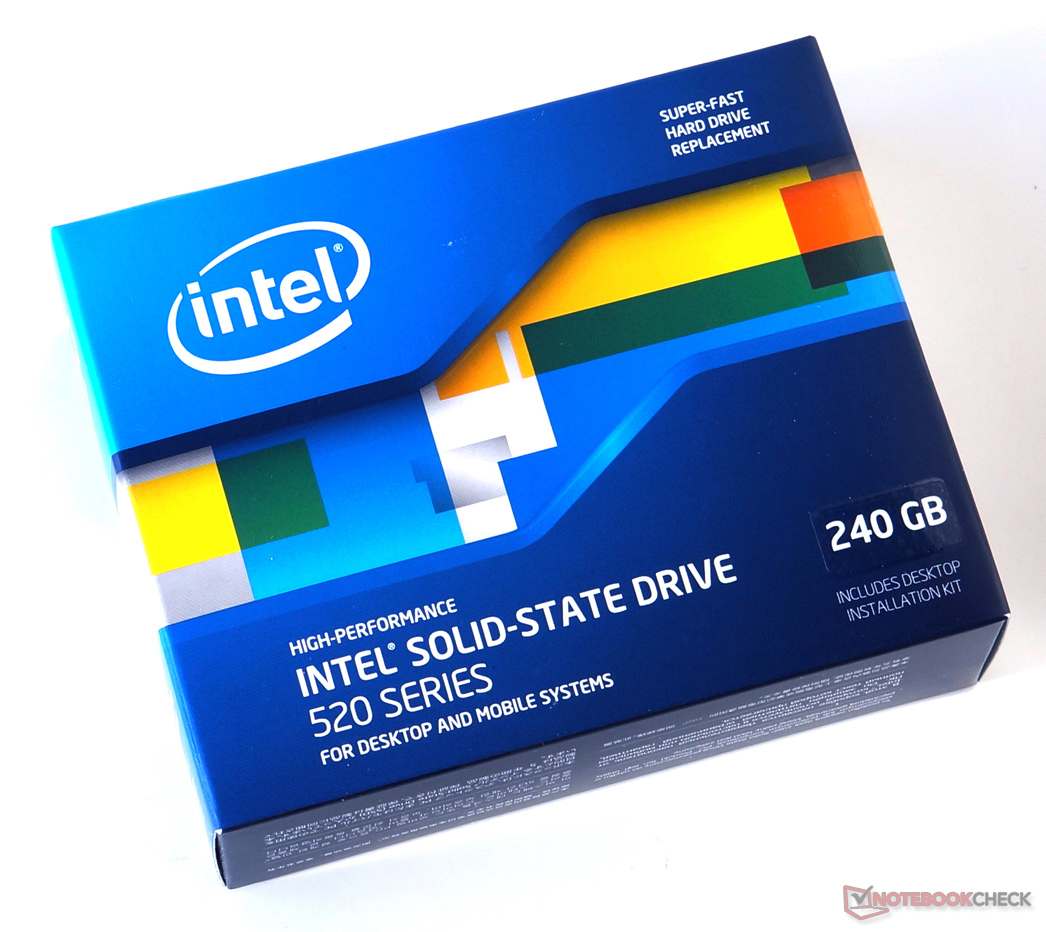
Review Intel 520 Series - 240 GB SSD
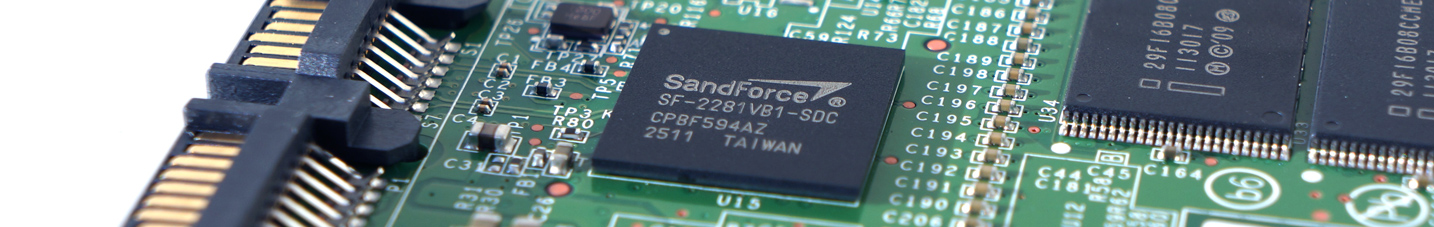
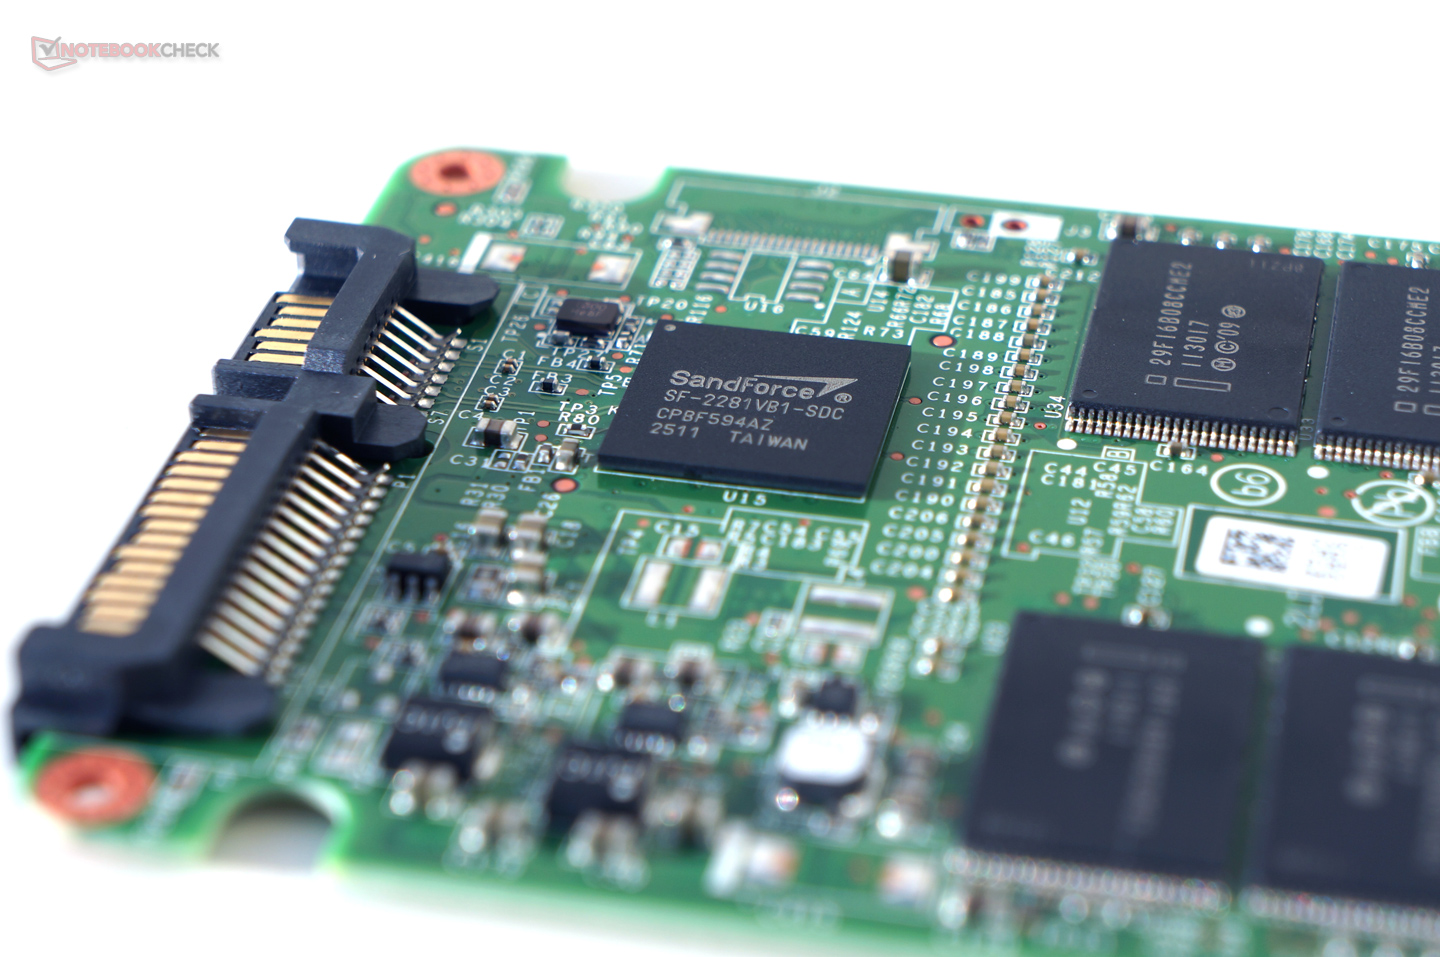
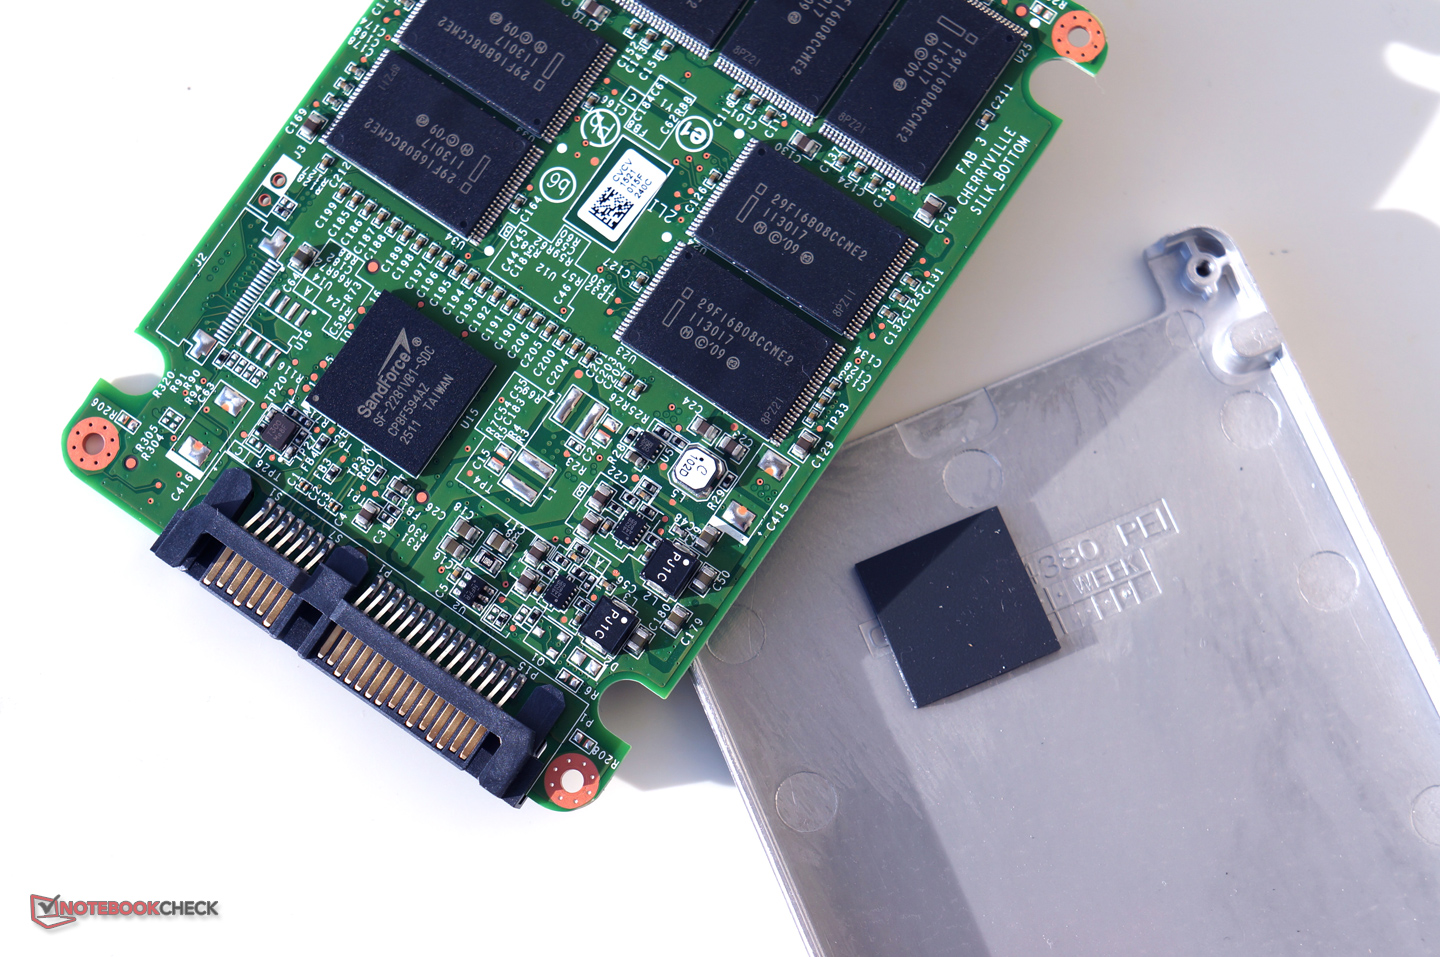
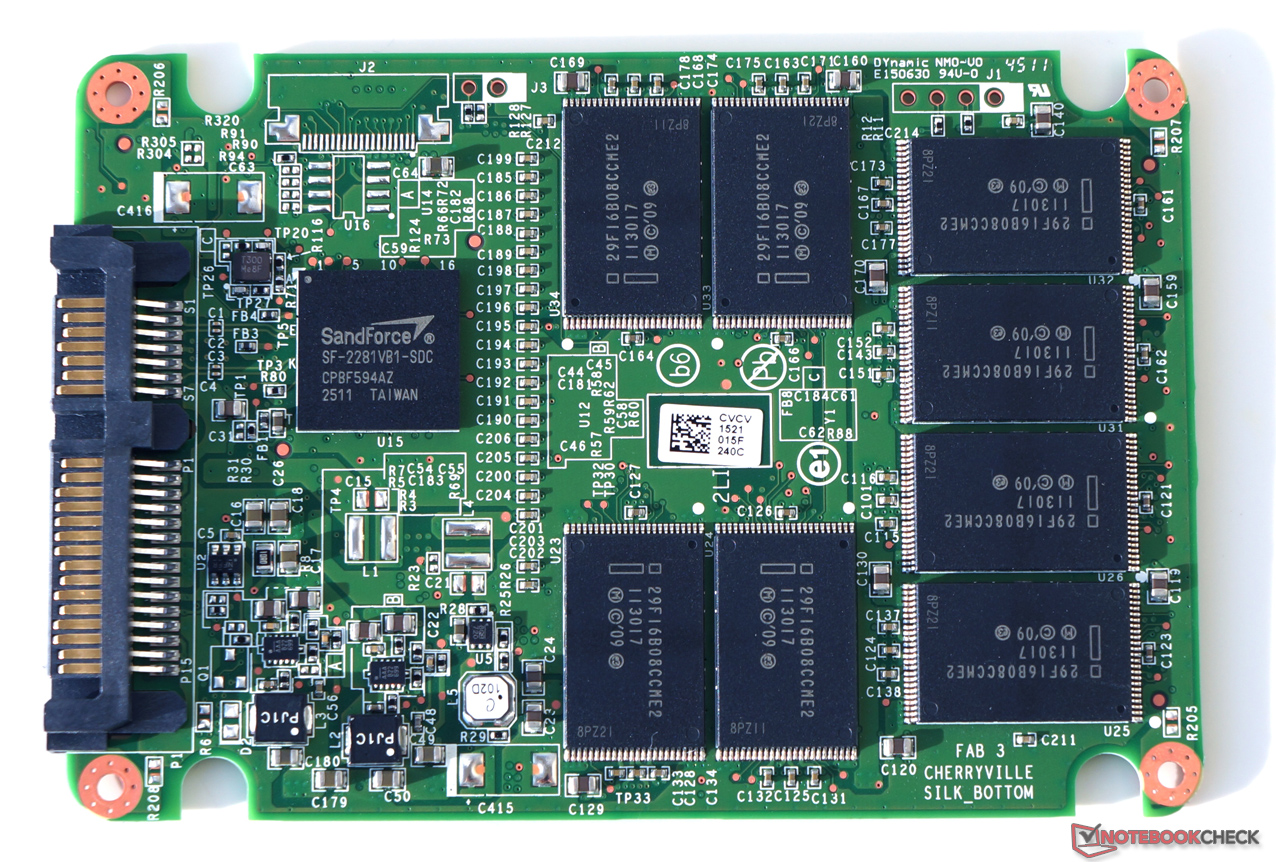
The Intel 520 series aspires for the top with its modified firmware and SandForce controller. According to Intel the 520 series stands above the crowd in terms of performance thanks to the extensive testing and optimizing of the controller. In addition, the new models will also offer the usual SandForce features: automatic data compression and 256 bit encoding.
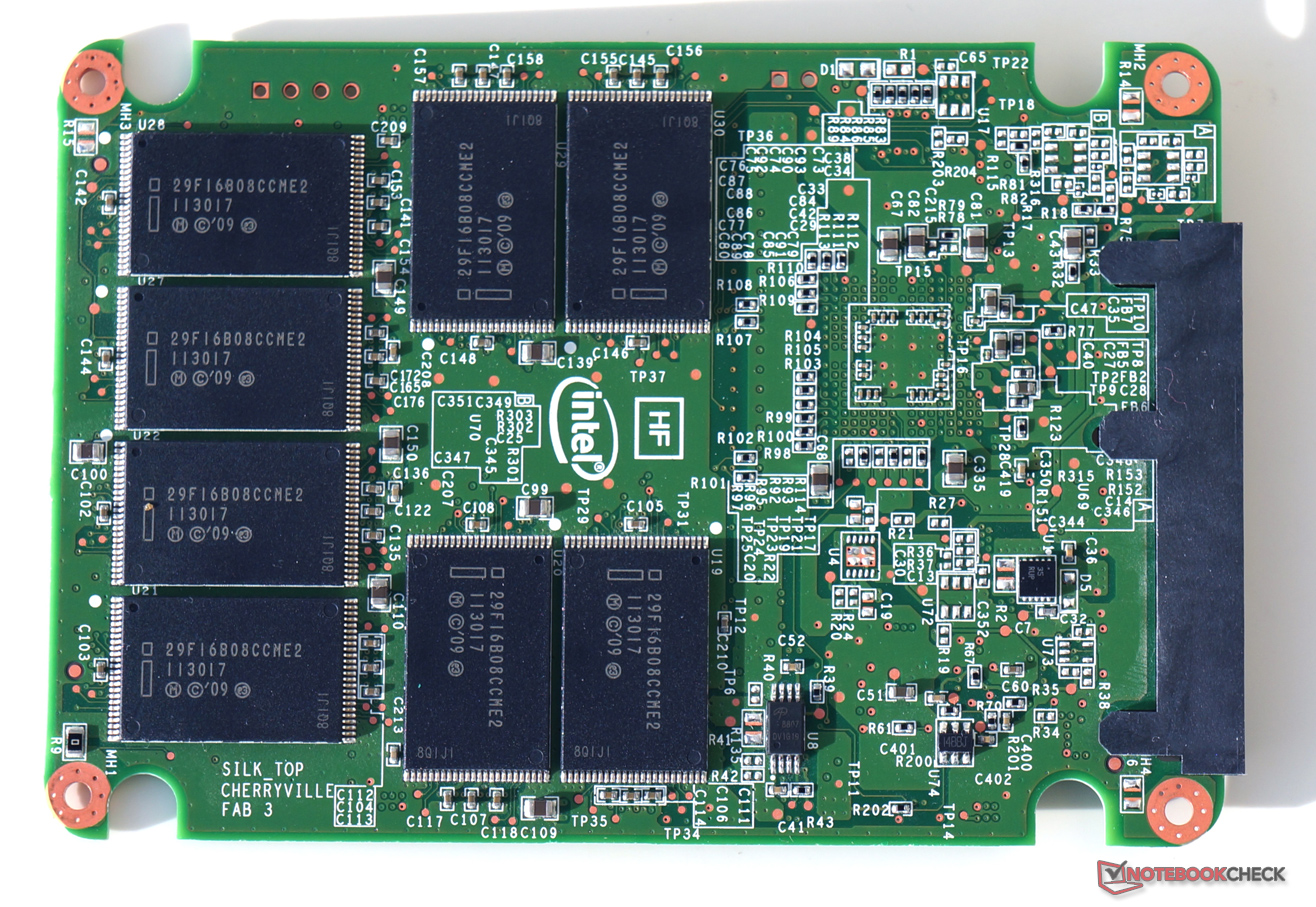
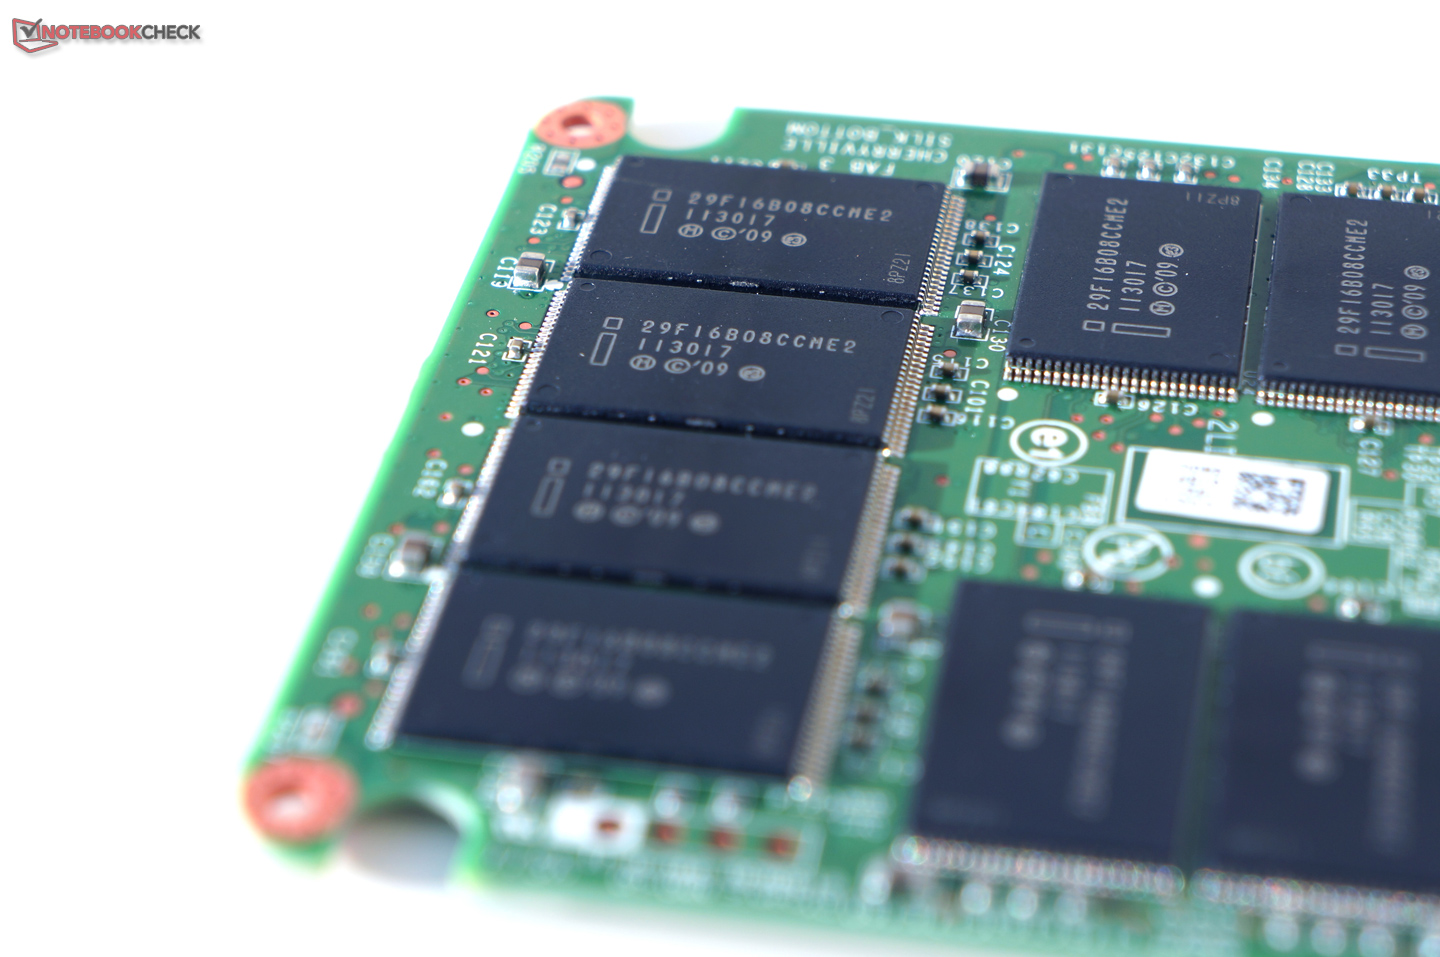
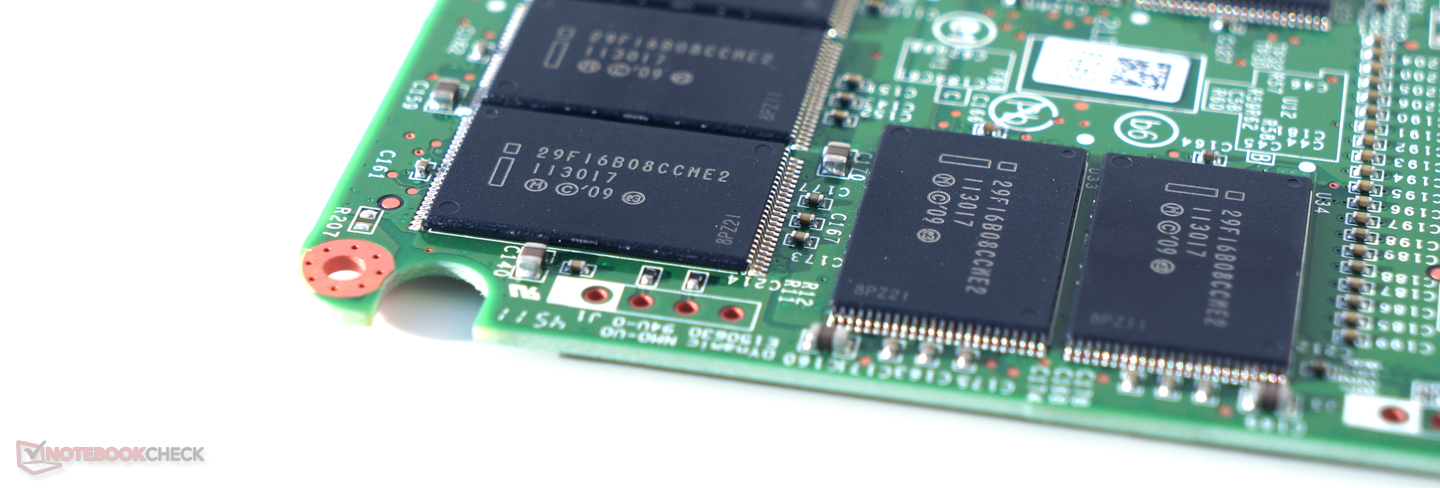
The Intel 520 series makes use of synchronized 29F16B08CCME2 NAND chips (25 nm format). According to Intel, the power consumption of the drives is 850 mW (during use) and 600 mW (idle).
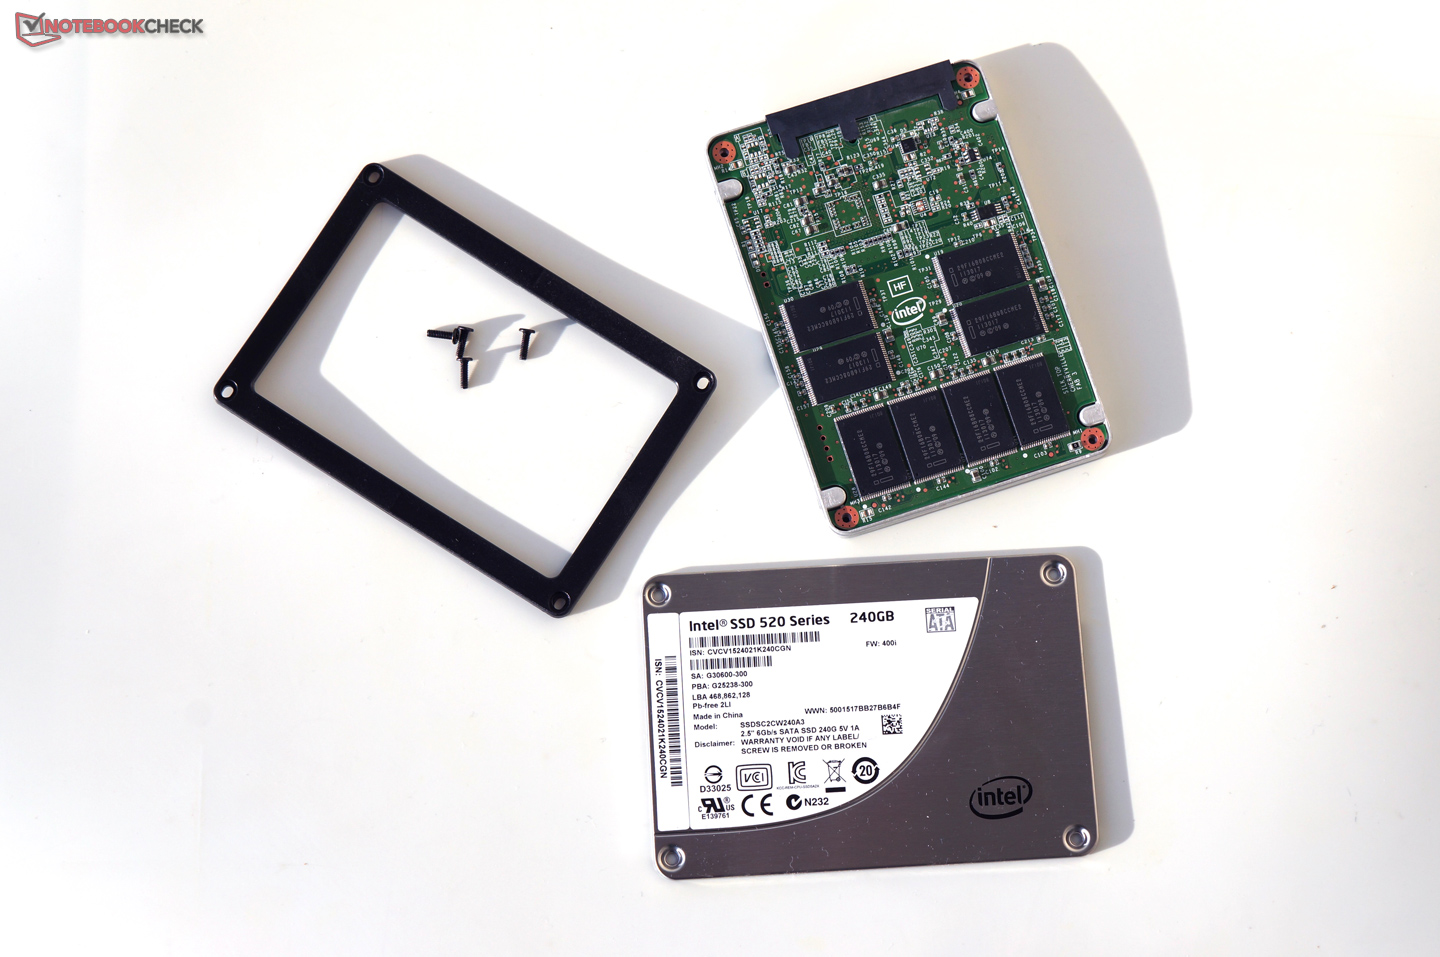
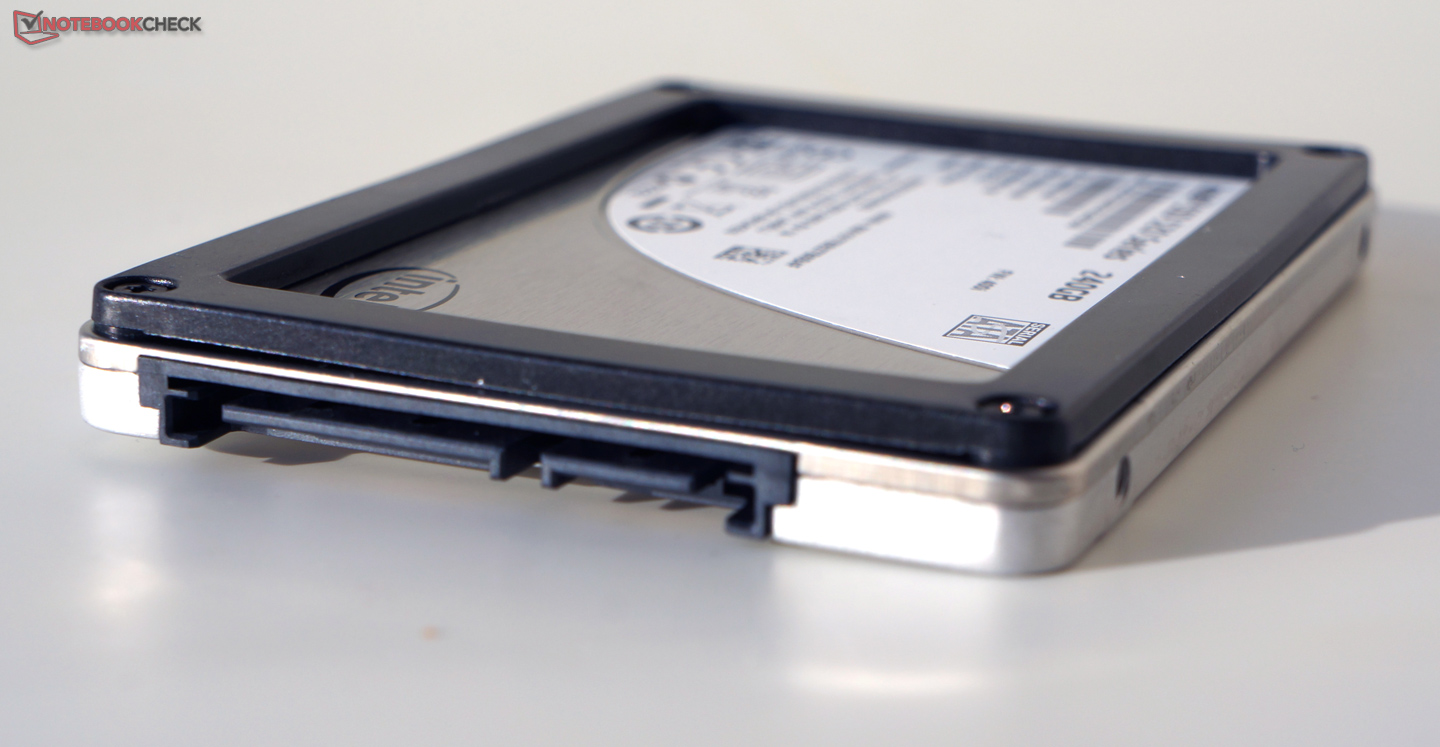
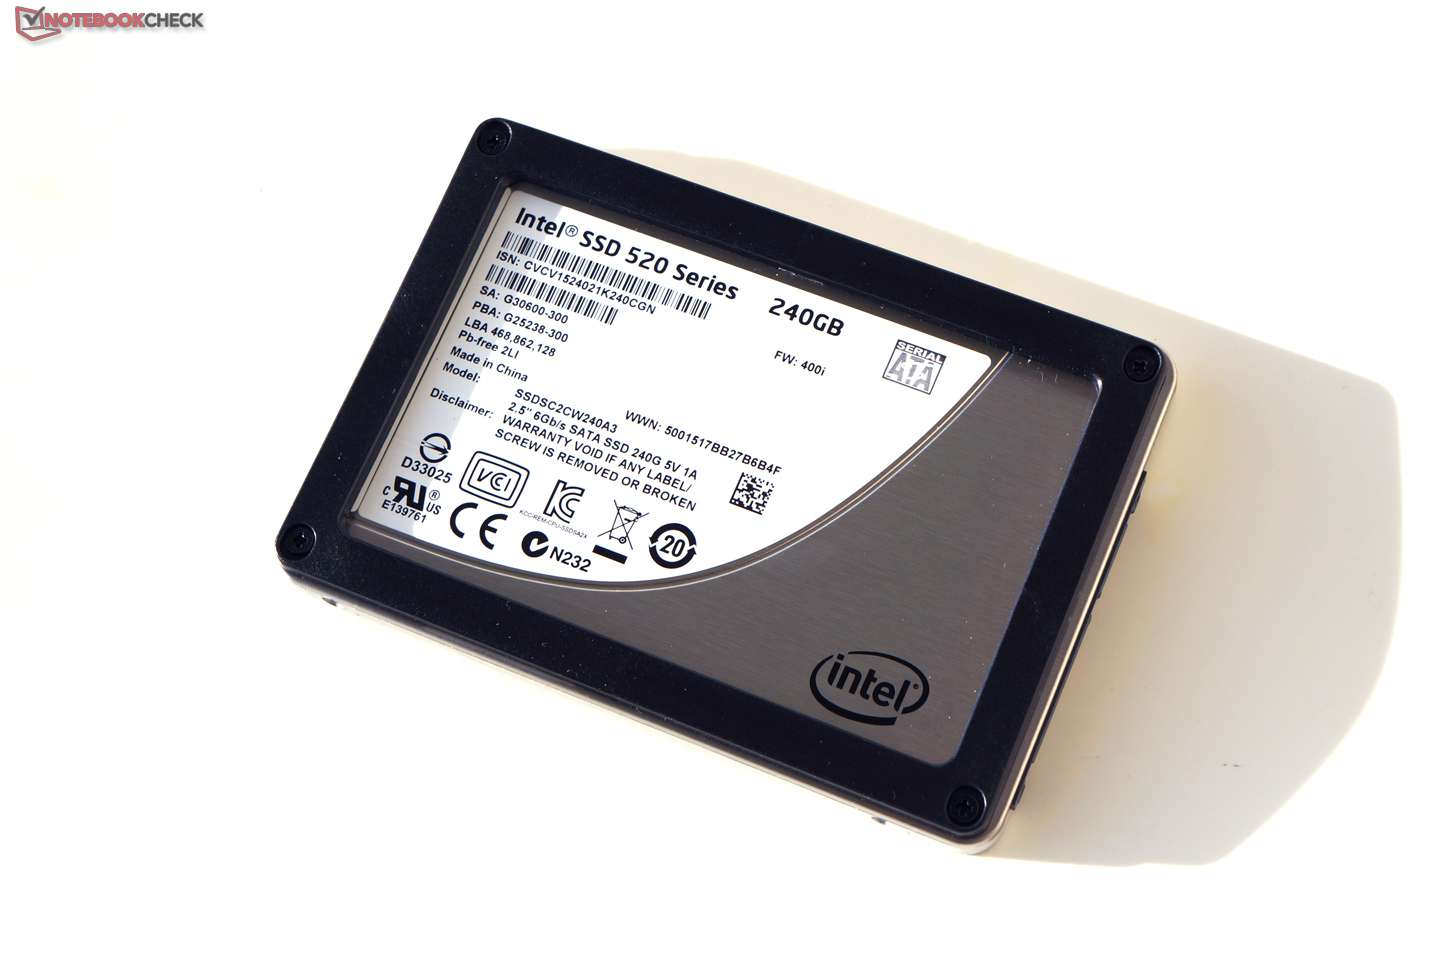
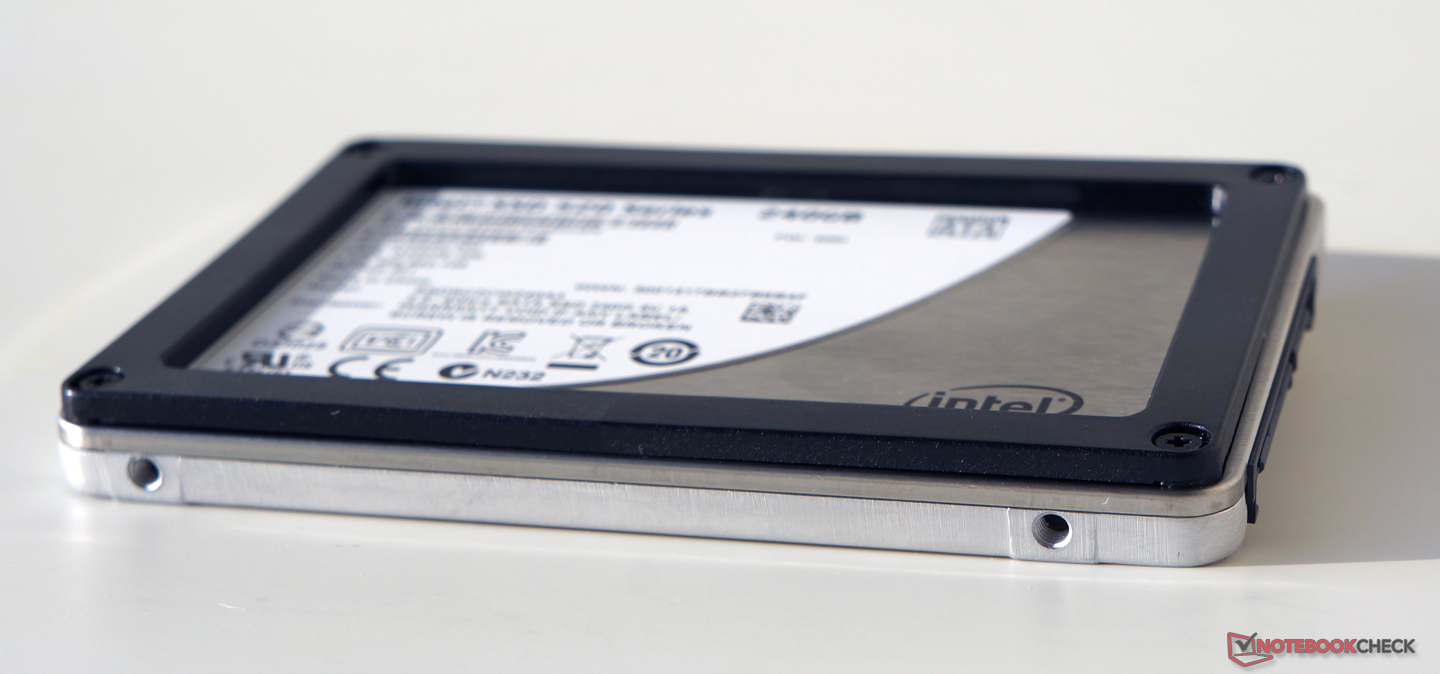
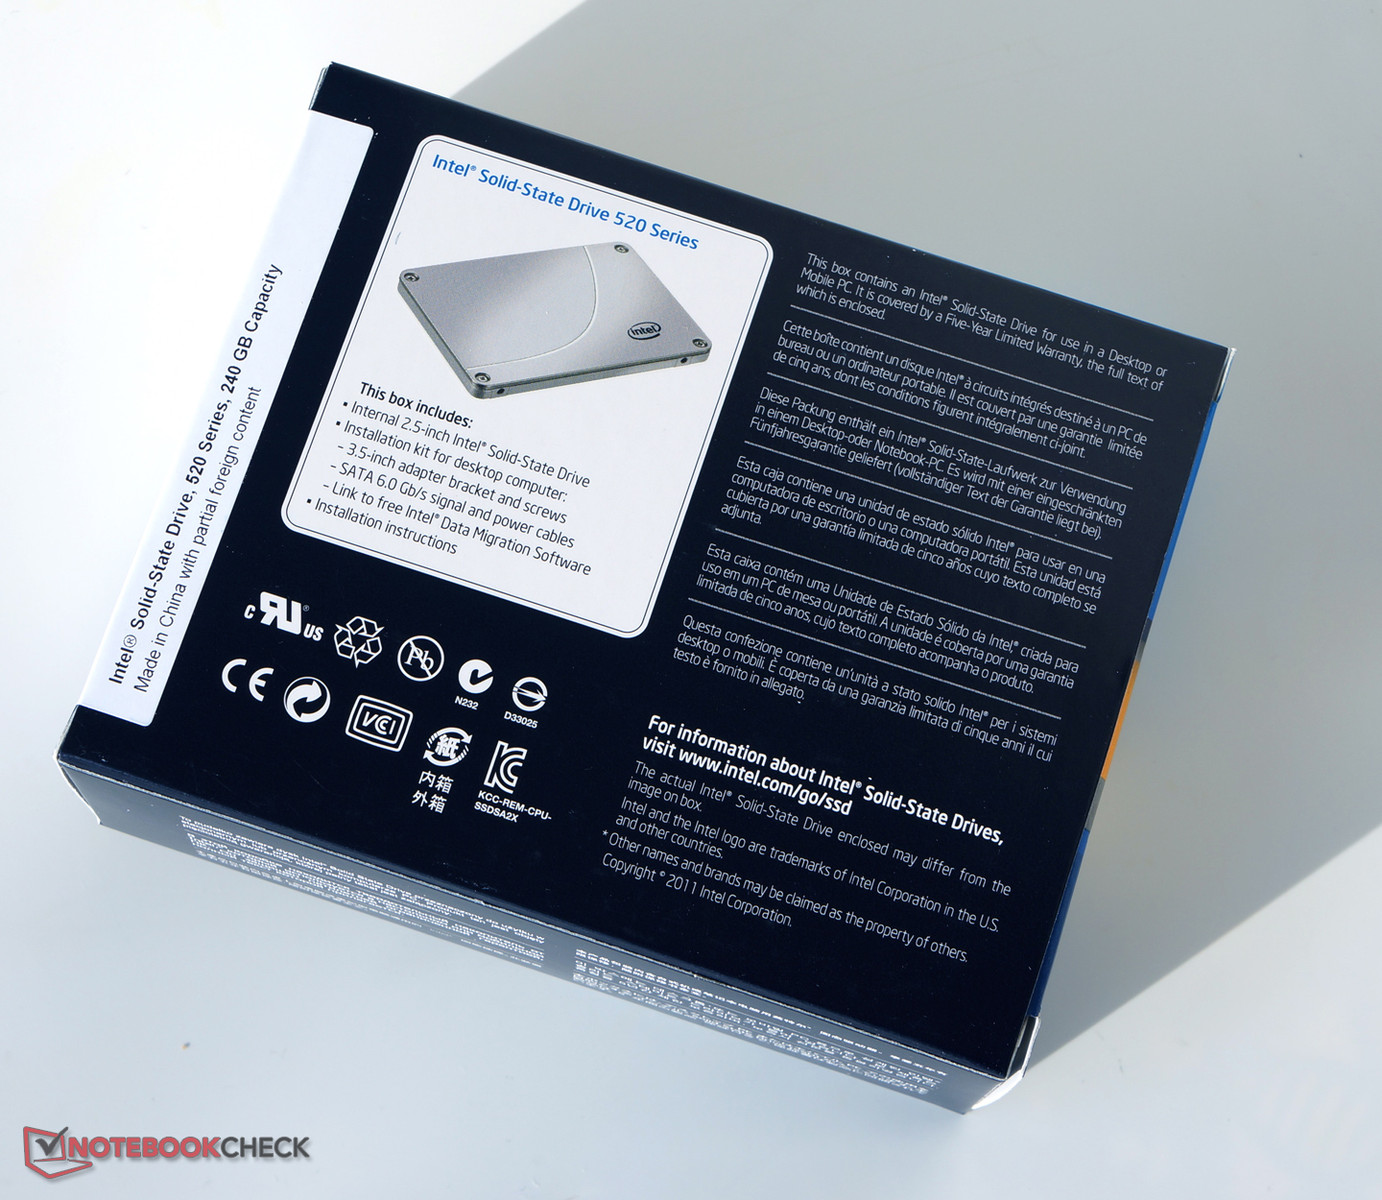
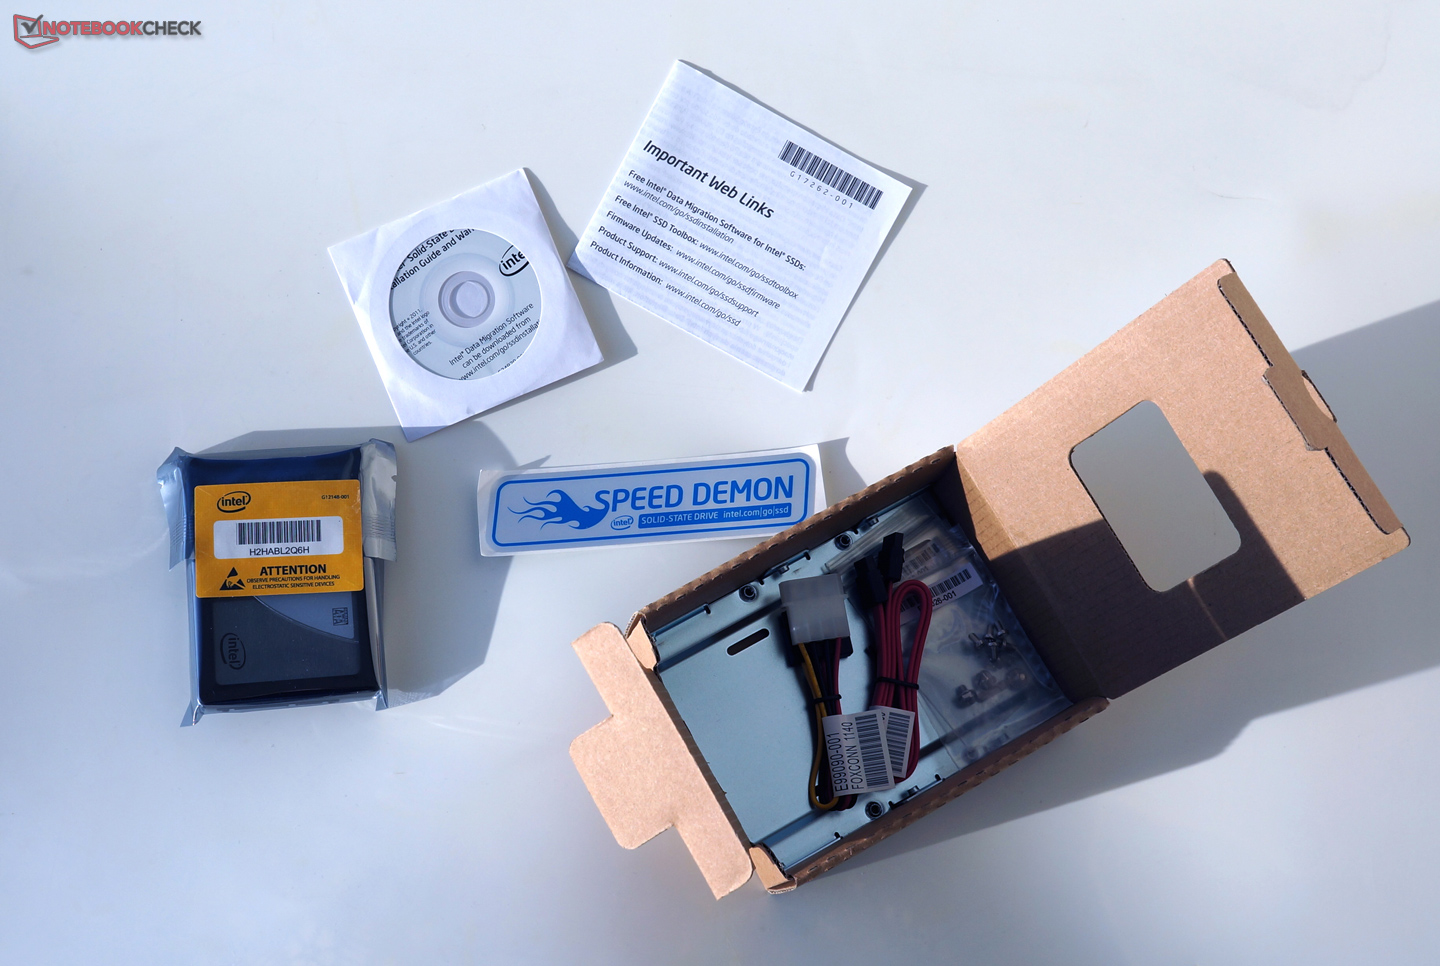
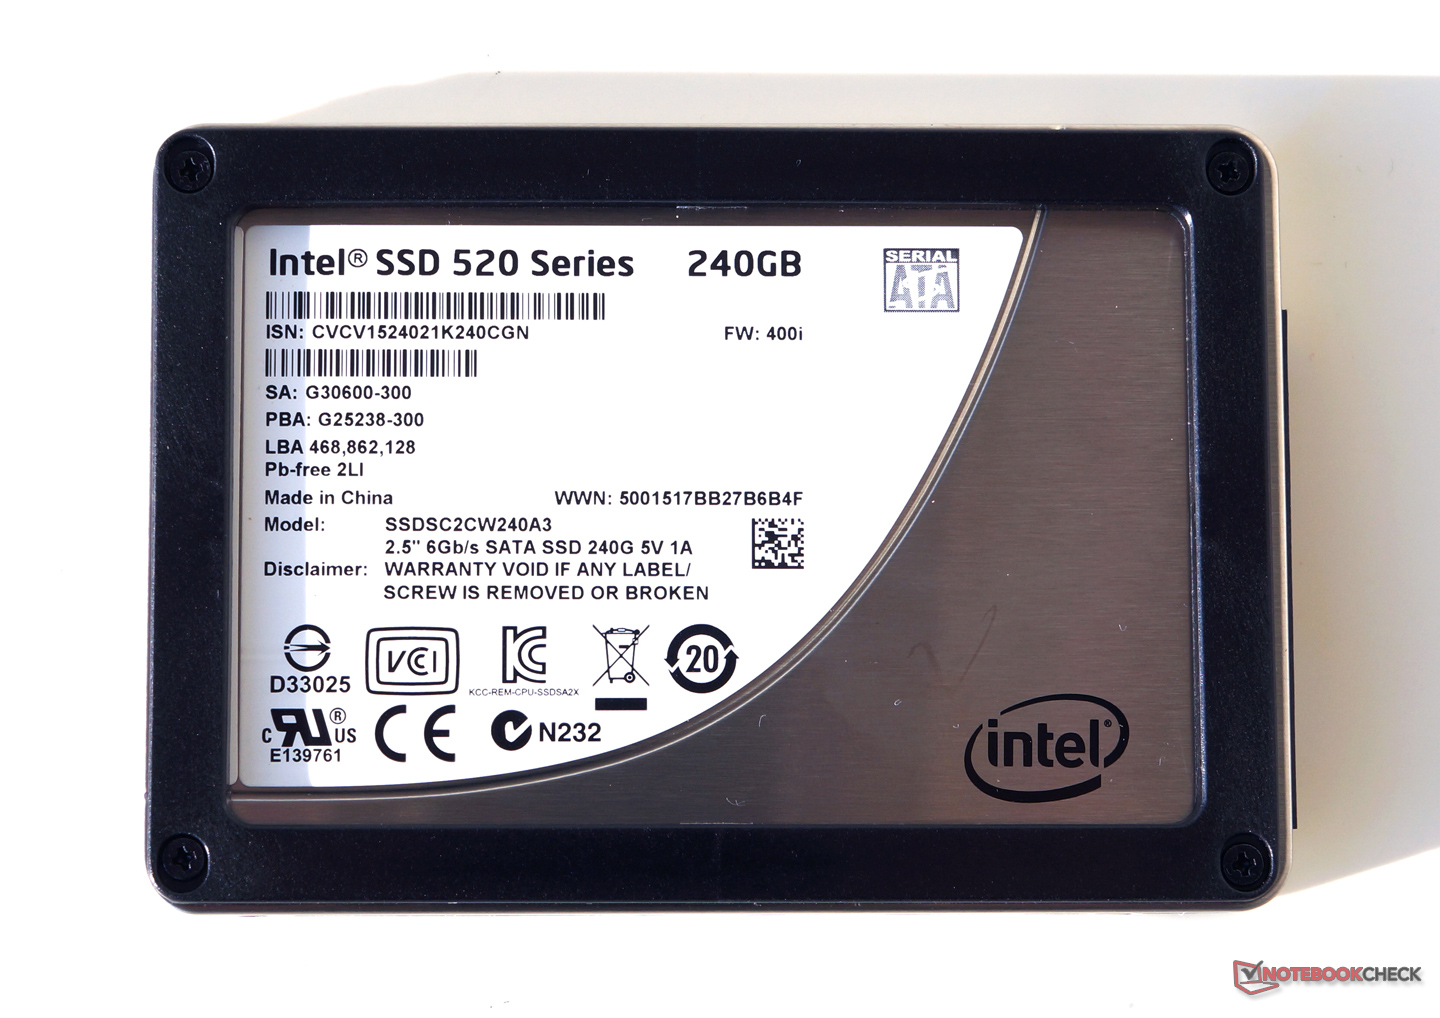
The new SSDs offer a wide range of capacities: 60, 120, 180, 240 and 480 GB. The 120, 180 and 240 GB models are available in the 7 mm format (our test model was 9.5 mm thick with the removable plastic case - similar to the old Intel 320 SSD).
The Intel 520 SSDs have 5 years warranty. Intel seems to believe that the new 520 models are far more reliable than their predecessor (the 510 series - 3 years warranty).
The SSD 510 models are relatively expensive: 149$ (60 GB), 229$ (120 GB), 369$ (180 GB), 509$ (240 GB) and 999$ (480 GB). Buyers will be happy to know that the 120 GB model of the new series is available in some shops at a slightly higher price than an OCZ Vertex 3.
Synthetic Benchmarks
The high-end Intel test model proved its worth in our benchmarks. In the ATTO benchmark, the model placed at the top of our database of previously-tested SSDs. The Vertex 3 (not directly comparable system) can only start to match the performance of the 520 series after 128 KB. The old 510 series can only hold its own in the read test starting at 16 KB.
The sequential read rates of the test model are as good as that of the OCZ Octane, Vertex 3 or the old 510 series. The write rate of the new 520 SSD is trumped by two other SSDs: the Intel 510 series and the OCZ Octane. The old Intel 510 series is around 6-7% faster (very small difference), whereas the OCZ Octane SSD is miles ahead - 18-38% faster.
The 4k performance in all the benchmarks was very good; the test model performed especially well during parallel access (Queue Depth). In fact, in this area, the 520 test model left its competition behind in the dust.
The access times of the test model is not so impressive. This is also the case with other SandForce models. We believe that this is due to automatic compression of data on the SandForce drives. The OCZ Octane and Samsung SSD 470 deliver better results in this area. However, there is no clear indication how this affects everyday performance.
| Intel SSD 520 Series 240GB Desktop GeForce GTX 470, 2600K, Intel SSD 520 Series SSDSC2CW240A | Renice X5 60GB GeForce GT 555M, 2410M, Renice X5 RCM60-PX5M | Intel SSD 510 250GB Desktop GeForce GTX 470, 2600K, Intel SSD 510 Series SSDSC2MH250A2K5 | ADATA S510 120GB Desktop GeForce GTS 450, 2600K, ADATA S510 S510S3-120GM-C | Schenker XMG A701 GeForce GT 540M, 2630QM, OCZ Vertex 3 VTX3-25SAT3-240G | Samsung SSD 470 Desktop GeForce GTX 470, 2600K, Samsung SSD 470 Series MZ-5PA256/EU | |
|---|---|---|---|---|---|---|
| AS SSD | -73% | -34% | -43% | -15% | -30% | |
| Copy Game MB/s (MB/s) | 214 | 68 -68% | 192 -10% | 110.1 -49% | 181 -15% | 160 -25% |
| Copy Program MB/s (MB/s) | 143.9 | 41.9 -71% | 155 8% | 99.6 -31% | 146 1% | 131 -9% |
| Copy ISO MB/s (MB/s) | 368 | 78.8 -79% | 211 -43% | 130 -65% | 176 -52% | 209 -43% |
| Score Total (Points) | 802 | 335 -58% | 405 -50% | 375 -53% | ||
| Score Write (Points) | 339 | 121 -64% | 209 -38% | 135 -60% | ||
| Score Read (Points) | 309 | 142 -54% | 127 -59% | 155 -50% | ||
| Access Time Write * (ms) | 0.212 | 0.438 -107% | 0.089 58% | 0.281 -33% | 0.28 -32% | 0.066 69% |
| Access Time Read * (ms) | 0.126 | 0.203 -61% | 0.203 -61% | 0.151 -20% | 0.082 35% | 0.108 14% |
| 4K-64 Write (MB/s) | 231.8 | 11.16 -95% | 48.7 -79% | 130.6 -44% | 229 -1% | 61.4 -74% |
| 4K-64 Read (MB/s) | 236.2 | 53 -78% | 76.6 -68% | 88.1 -63% | 184 -22% | 113 -52% |
| 4K Write (MB/s) | 72 | 9.12 -87% | 14.3 -80% | 65.2 -9% | 43.9 -39% | 49.1 -32% |
| 4K Read (MB/s) | 24.41 | 15.84 -35% | 18.6 -24% | 18.02 -26% | 16.4 -33% | 16.2 -34% |
| Seq Write (MB/s) | 288.4 | 86.2 -70% | 308 7% | 135.2 -53% | 266.6 -8% | 245 -15% |
| Seq Read (MB/s) | 496.1 | 243.7 -51% | 468 -6% | 204.6 -59% | 485.6 -2% | 251 -49% |
| CrystalDiskMark 3.0 | -68% | -31% | -42% | -10% | -41% | |
| Write 4k QD32 (MB/s) | 266.3 | 14.78 -94% | 50.1 -81% | 139.5 -48% | 183 -31% | 75.3 -72% |
| Read 4k QD32 (MB/s) | 239.9 | 59.8 -75% | 81.3 -66% | 102 -57% | 192 -20% | 130 -46% |
| Write 4k (MB/s) | 91.2 | 9.928 -89% | 46.4 -49% | 81.7 -10% | 83 -9% | 57.2 -37% |
| Read 4k (MB/s) | 29.74 | 19.18 -36% | 20.6 -31% | 28.6 -4% | 26.7 -10% | 17.58 -41% |
| Write 512 (MB/s) | 299.5 | 71.6 -76% | 303 1% | 144 -52% | 292 -3% | 253.7 -15% |
| Read 512 (MB/s) | 441.2 | 220.6 -50% | 335 -24% | 206.6 -53% | 436 -1% | 201.2 -54% |
| Write Seq (MB/s) | 307.8 | 89.4 -71% | 327 6% | 144 -53% | 293 -5% | 257.2 -16% |
| Read Seq (MB/s) | 497.7 | 244.9 -51% | 486 -2% | 213.7 -57% | 478 -4% | 264.3 -47% |
| HD Tune Transfer Rate Average | ||||||
| Transfer Rate Average (MB/s) | 376.2 | 172 -54% | 348 -7% | 357 -5% | 332 -12% | 202.9 -46% |
| Total Average (Program / Settings) | -65% /
-70% | -24% /
-32% | -30% /
-41% | -12% /
-13% | -39% /
-34% |
* ... smaller is better
| Intel SSD 520 Series 240GB Desktop GeForce GTX 470, 2600K, Intel SSD 520 Series SSDSC2CW240A | Renice X5 60GB GeForce GT 555M, 2410M, Renice X5 RCM60-PX5M | Intel SSD 510 250GB Desktop GeForce GTX 470, 2600K, Intel SSD 510 Series SSDSC2MH250A2K5 | ADATA S510 120GB Desktop GeForce GTS 450, 2600K, ADATA S510 S510S3-120GM-C | Schenker XMG A701 GeForce GT 540M, 2630QM, OCZ Vertex 3 VTX3-25SAT3-240G | Samsung SSD 470 Desktop GeForce GTX 470, 2600K, Samsung SSD 470 Series MZ-5PA256/EU | |
|---|---|---|---|---|---|---|
| ATTO Disk Benchmark | -68% | -25% | -18% | -20% | -50% | |
| 8192KB write (KB/s) | 527637 | 89329 -83% | 335544 -36% | 511305 -3% | 521233 -1% | 261888 -50% |
| 4096KB write (KB/s) | 523776 | 89329 -83% | 334846 -36% | 510091 -3% | 526344 0% | 261888 -50% |
| 2048KB write (KB/s) | 527637 | 89478 -83% | 333874 -37% | 506481 -4% | 530242 0% | 261888 -50% |
| 1024KB write (KB/s) | 527637 | 89478 -83% | 334707 -37% | 510091 -3% | 525057 0% | 260616 -51% |
| 512KB write (KB/s) | 527637 | 90534 -83% | 334707 -37% | 505290 -4% | 519971 -1% | 260616 -51% |
| 256KB write (KB/s) | 528689 | 89776 -83% | 335544 -37% | 509807 -4% | 519706 -2% | 260990 -51% |
| 128KB write (KB/s) | 524802 | 90182 -83% | 337127 -36% | 501450 -4% | 512246 -2% | 260990 -50% |
| 64KB write (KB/s) | 512507 | 92052 -82% | 344184 -33% | 487893 -5% | 483727 -6% | 246776 -52% |
| 32KB write (KB/s) | 489443 | 88370 -82% | 345027 -30% | 456572 -7% | 447331 -9% | 223665 -54% |
| 16KB write (KB/s) | 421028 | 89667 -79% | 294165 -30% | 391908 -7% | 336277 -20% | 186998 -56% |
| 8KB write (KB/s) | 389865 | 73464 -81% | 196233 -50% | 285440 -27% | 251896 -35% | 142409 -63% |
| 4KB write (KB/s) | 276959 | 44032 -84% | 122404 -56% | 183933 -34% | 227382 -18% | 97100 -65% |
| 2KB write (KB/s) | 92477 | 24839 -73% | 66394 -28% | 54784 -41% | 44432 -52% | 58880 -36% |
| 1KB write (KB/s) | 46986 | 13180 -72% | 34388 -27% | 27904 -41% | 21705 -54% | 32256 -31% |
| 0.5KB write (KB/s) | 23757 | 6767 -72% | 17576 -26% | 16516 -30% | 11307 -52% | 17280 -27% |
| 8192KB read (KB/s) | 556663 | 262528 -53% | 505290 -9% | 540474 -3% | 552841 -1% | 267899 -52% |
| 4096KB read (KB/s) | 556663 | 263172 -53% | 504104 -9% | 539267 -3% | 554109 0% | 266834 -52% |
| 2048KB read (KB/s) | 556663 | 263172 -53% | 483667 -13% | 540474 -3% | 554109 0% | 267099 -52% |
| 1024KB read (KB/s) | 554109 | 262528 -53% | 504104 -9% | 538066 -3% | 549072 -1% | 267099 -52% |
| 512KB read (KB/s) | 545354 | 262528 -52% | 508882 -7% | 513752 -6% | 534199 -2% | 267099 -51% |
| 256KB read (KB/s) | 529998 | 260990 -51% | 513475 -3% | 496796 -6% | 517196 -2% | 266862 -50% |
| 128KB read (KB/s) | 492676 | 259720 -47% | 500029 1% | 468590 -5% | 465859 -5% | 266862 -46% |
| 64KB read (KB/s) | 486146 | 237420 -51% | 487893 0% | 414888 -15% | 439713 -10% | 251757 -48% |
| 32KB read (KB/s) | 434335 | 226725 -48% | 433254 0% | 362869 -16% | 387082 -11% | 228384 -47% |
| 16KB read (KB/s) | 373701 | 182457 -51% | 346101 -7% | 294895 -21% | 294895 -21% | 188267 -50% |
| 8KB read (KB) | 337950 | 128548 -62% | 232046 -31% | 194684 -42% | 155578 -54% | 141701 -58% |
| 4KB read (KB) | 223854 | 78805 -65% | 145118 -35% | 122814 -45% | 98116 -56% | 91790 -59% |
| 2KB read (KB) | 120356 | 44322 -63% | 80530 -33% | 63172 -48% | 49416 -59% | 55020 -54% |
| 1KB read (KB) | 62208 | 22670 -64% | 42794 -31% | 31920 -49% | 24708 -60% | 30057 -52% |
| 0.5KB read (KB/s) | 30976 | 11207 -64% | 21961 -29% | 15832 -49% | 12288 -60% | 15194 -51% |
Program Performance
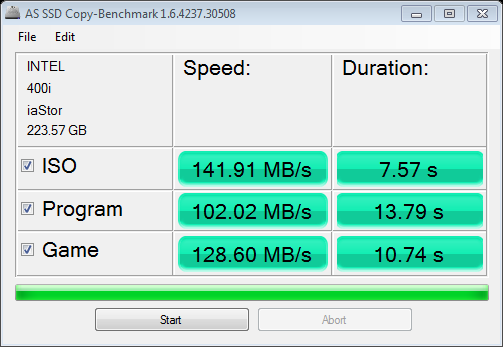
Our first test is the copy benchmark from the AS SSD tool: the Intel SSD copied the test ISO file extremely fast. The test model delivered an impressive 368 MB/s - 40-65% faster than other high-end SSDs. Sadly, the OCZ Octane took the lead in the program and game copy tests.
The new SSD scored noticeably lower in the PCMark 7 program benchmark. The Octane is a mere 2% overall and about 4% slower in the System storage test. The old 510 series is about as fast, whereas the old Samsung 470 SSD is overall 7% slower and 12% slower in the Disk test.
The PCMark Vantage test showed the first signs of degrading in the test model. When Windows 7 was installed on the SSD, the device could score a meager 45,907 points in the HDD test. The Octane scores 46% higher - significantly faster. However, running the HDD test on a freshly formatted 520 SSD increases the score to a respectable 72,999 points.
The measurements from the IOMix and Workstation profiles of the Iometer tool are more reliable: the Intel SSD can reach new highs with a small 10 GB partition. The closest competitor is the Vertex 3, however, as the system of the Vertex 3 is not directly comparable to that of our test model, the Vertex 3 may actually be able to perform faster. On average, the Octane and the SSD 510 series were 41% and 33% slower than the new Intel 520 test model.
The program profile of the h2benchw benchmark also attested to the amazing performance of the new 520 series. The test model scored 194.8 points and thus placed itself at the same level as an Agility 3 SSD (also equipped with a SandForce controller). The old 510 series was 8% slower.
In addition to well-known benchmark, we also tested with a variety of practical tests to measure the everyday performance of the test model. The SSD can boot into Windows 7 in 28 seconds. In comparison the old Samsung 470 SSD can complete the same task in 30 seconds. The new 520 series was a mere 2 seconds faster in this test.
We also measured the time it took for the test model to load Battlefield 3 in single player mode. The SSD required (on average) 19 seconds to reach the intro video. The older Samsung 470 SSD, the Intel 510 series and the Octane also required 19 seconds to reach the intro video. In comparison, a desktop hard disk requires a long 75 seconds (on average) to load the game.
The true potential of the modern SATA 3 SSDs is revealed when copying big files. We copied the game folder of Supreme Commander: Forged Alliance (7.29 GB, 2251 files) in 47 seconds with the Intel 520 test model. This is significantly faster than the old Samsung 470 SSD which required 67 to 167 seconds (depending on the attempt).
| Intel SSD 520 Series 240GB Desktop GeForce GTX 470, 2600K, Intel SSD 520 Series SSDSC2CW240A | Renice X5 60GB GeForce GT 555M, 2410M, Renice X5 RCM60-PX5M | Intel SSD 510 250GB Desktop GeForce GTX 470, 2600K, Intel SSD 510 Series SSDSC2MH250A2K5 | ADATA S510 120GB Desktop GeForce GTS 450, 2600K, ADATA S510 S510S3-120GM-C | Schenker XMG A701 GeForce GT 540M, 2630QM, OCZ Vertex 3 VTX3-25SAT3-240G | Samsung SSD 470 Desktop GeForce GTX 470, 2600K, Samsung SSD 470 Series MZ-5PA256/EU | |
|---|---|---|---|---|---|---|
| PCMark 7 | -1% | -0% | -10% | -7% | ||
| System Storage (Points) | 5216 | 5014 -4% | 5194 0% | 4708 -10% | 4592 -12% | |
| Computation (Points) | 4962 | 4755 -4% | 4736 -5% | |||
| Creativity (Points) | 5310 | 5392 2% | 5412 2% | 5059 -5% | ||
| Entertainment (Points) | 4739 | 4705 -1% | 4638 -2% | |||
| Productivity (Points) | 4808 | 4755 -1% | 4343 -10% | |||
| Lightweight (Points) | 5068 | 5106 1% | 4636 -9% | |||
| Score (Points) | 4941 | 4944 0% | 4760 -4% | |||
| IOMeter | -44% | -33% | -56% | -11% | -74% | |
| Workstation, 3min, 10GB Partition (MB/s) | 165.7 | 92.1 -44% | 109.7 -34% | 69.5 -58% | 150.8 -9% | 33.3 -80% |
| IOMix, 5min, 10GB Partition (MB/s) | 230.2 | 156 -32% | 105 -54% | 201 -13% | 73.1 -68% | |
| Total Average (Program / Settings) | -23% /
-15% | -17% /
-8% | -33% /
-41% | -11% /
-11% | -41% /
-22% |
Data Compression
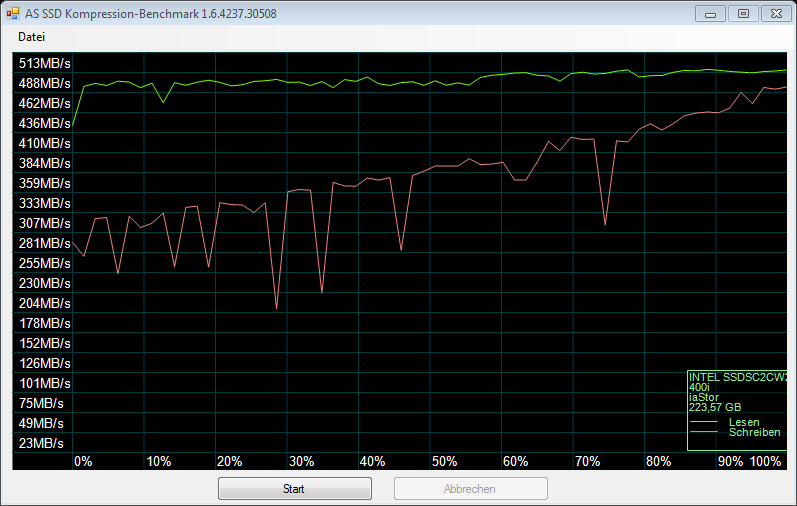
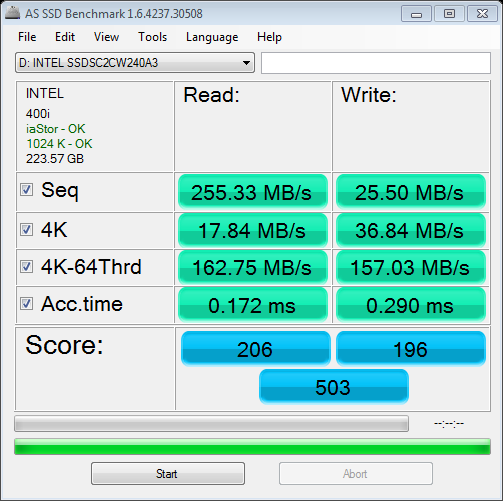
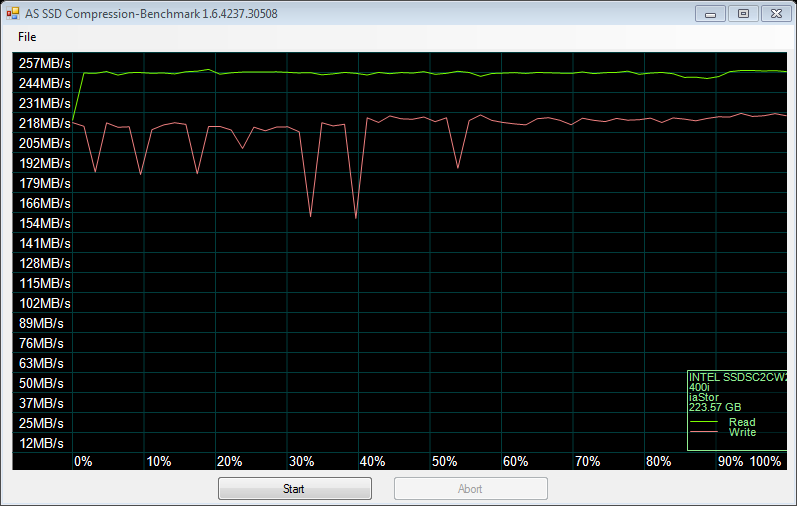
A special feature of the SandForce controller is the automatic compression of data. The better a SSD can compress data, the faster it is. In the AS SSD compression benchmark, one can clearly see the high performance of the SSD. The old Intel SSD 510 (with Marvell controller) reaches similar values in this test. The new SSD 520 reached 300 MB/s (write rate - not compressed data) to 485 MB/s (perfectly compressed data). Intel claims that most files can be compressed around 60%. This means that the test model should deliver write rates of 400 MB/s or more on average.
The read rate rises very slightly - from 480 MB/s to 500 MB/s.
Degrading
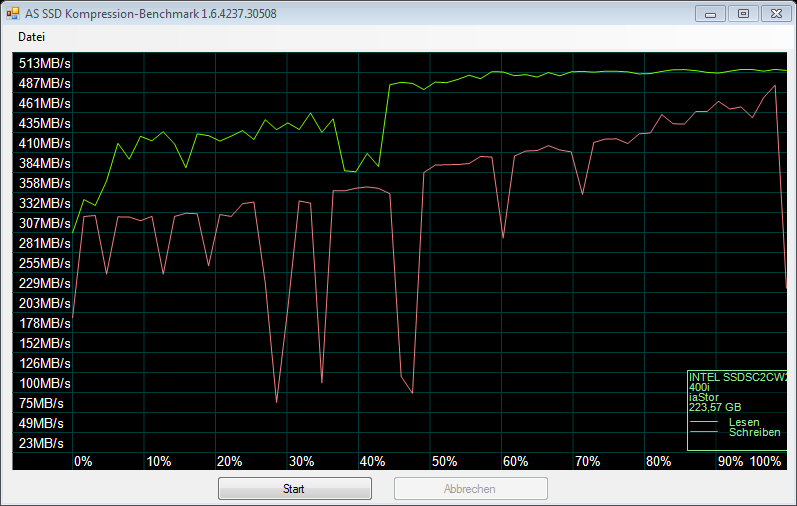
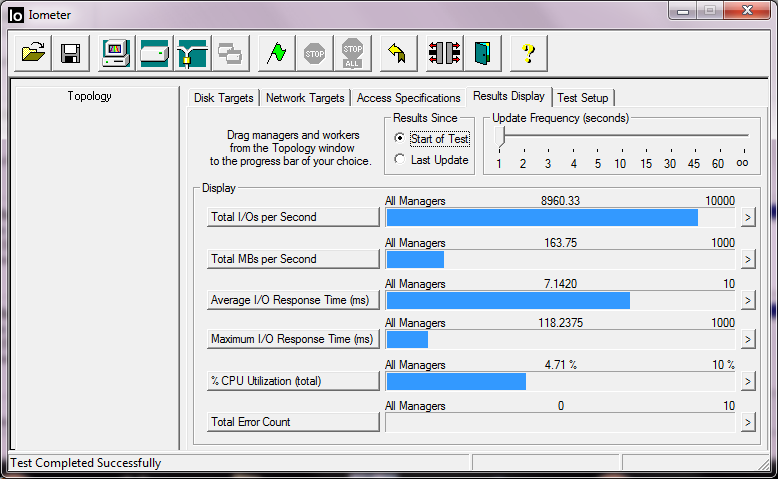
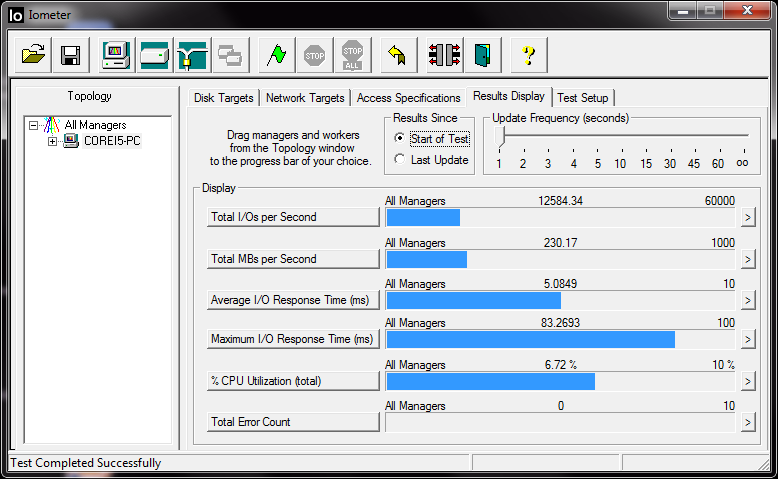
The Intel 520 SSD is well-equipped for heavy use, thanks to "Trim" support and the optimized function of the SSD toolbox, . We strained the SSD with the IOMix profile (Iometer tool) for more than 2 hours. The average transfer rates during the test dropped from 230 MB/s to 163 MB/s. In the first hour, the performance drop to an average of 200 MB/s is not worthy of mention. However, at the end of the test, the transfer rate dropped to 100 MB/s. In the AS SSD compression benchmark, the read performance also dropped significantly (with poorly compressed files) to 300 MB/s.
SATA 2 (3 GB/s) Performance
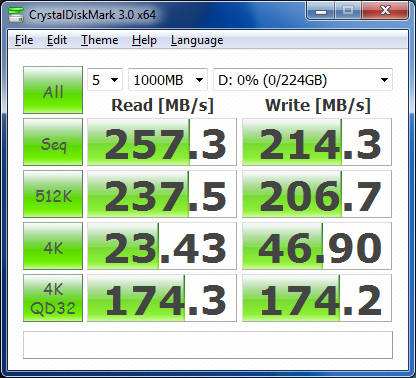
We tested the Intel 520 SSD in a Sandy Bridge laptop. We had to use an adapter to install the SSD in the optical drive slot, and this lead to a significant loss in performance. The drive reached a mere 64% of the performance of a SATA 3 desktop (CrystalDiskMark 3). The loss in performance is obvious as the old Samsung 470 SSD scored higher than the test model. In fact, for older systems we recommend the use of older and cheaper SATA 2 SSDs.
Verdict

The Intel 520 test model (240 GB version) has proved its worth in multiple tests and time and again, it landed in the top tiers of our database. Intel aims to offset the issues of reliability of SandForce-based SSDs by extensively modifying and testing the firmware used by the SandForce controller. The buyer will have to wait a few months to see how effective this procedure really was. As the controller is already relatively mature, we can conclude that most of the major problems have been dealt with.
An upgrade to the new 520 series from the older 510 series can not be recommended. The difference in everyday performance is not tangible. Even a few older SATA 2 SSDs can hold their own in certain tests, such as loading Battlefield 3. However, buyers ready to make the switch from a standard HDD to a high-end SATA 3 SSD will find the Intel 520 SSD a delight.
The Intel 520 series is not cheap. Sadly for Intel, the performance of their new series is not much higher than that of an OCZ Vertex 3. As such, a few shops are selling the 120 GB 520 SSD for a slightly higher price than the Vertex 3, and we believe that they are right in doing so.