AMD Radeon R7 512 Cores (Kaveri Desktop)
The AMD Radeon R7 Graphics width 512 Cores is an integrated GPU in the AMD A10-7850K, A10-7800 and A10 PRO-7850B Kaveri Desktop APUs. It is an integrated GPU without dedicated graphics memory and is based on the GCN 1.1 (or 2.0) architecture of the Hawaii desktop graphics cards (e.g. R9 290). However, it was altered for HSA use in the APU.
In the the top line A10 Kaveri Desktop APUs, the graphics card offers 512 shader cores (8 compute cores) with a maximum core clock of 720 MHz. The similar named AMD Radeon R7 in the A10-7700K, A8-7650K and A8-7600 offers only 384 Shaders but is in games only slightly slower.
It supports DirectX 12 (FL 12_0) in hardware, which is a big advantage over some GPUs from the competition (Intel Haswell e.g. 11.1, Nvidia Kepler and Maxwell v1 11.0).
The gaming performance in our tests was slightly faster than the Intel Iris Pro Graphics 5200 (in the Schenker S413 ). Depending on the game either one of the GPUs lead, but all in all the R7 was faster in two more games (in March 2014). In most cases, the Radeon R7 is sufficient for a resolution of 1366 x 768 pixels and medium settings.
Test system: Asus A88XM-PLUS mainboard, 16 GB DDR3-2133 AMD Gamer memory
Radeon R (Kaveri) Series Codename Kaveri Spectre Architecture GCN Pipelines 512 - unified Core Speed 720 MHz Shared Memory yes API DirectX 12 (FL 12_0), Shader 5.2, OpenGL 4.3 technology 28 nm Features HSA, OpenCL 2.0, DirectCompute 5.0 Date of Announcement 14.01.2014
CPU in Radeon R7 512 Cores (Kaveri Desktop) GPU Base Speed GPU Boost / Turbo AMD A10-7850K 4 x 3700 MHz, 95 W 720 MHz ? MHz
Benchmarks Performance Rating - 3DMark 11 + Fire Strike + Time Spy
0.7 pt (2%)
...
NVIDIA GeForce GTS 450
AMD Radeon R7 512 Cores (Kaveri Desktop)
...
3DMark - 3DMark Time Spy Score
567 Points (2%)
...
AMD Radeon R7 512 Cores (Kaveri Desktop)
Intel UHD Graphics 32EUs (Alder Lake)
...
3DMark - 3DMark Time Spy Graphics
508 Points (1%)
...
AMD Radeon R7 512 Cores (Kaveri Desktop)
Intel UHD Graphics 32EUs (Alder Lake)
...
3DMark - 3DMark Ice Storm Unlimited Graphics
91999 Points (10%)
...
AMD Radeon R7 512 Cores (Kaveri Desktop)
...
3DMark - 3DMark Ice Storm Extreme Graphics
58792 Points (8%)
...
AMD Radeon R7 512 Cores (Kaveri Desktop)
...
3DMark - 3DMark Cloud Gate Score
6770 Points (7%)
...
AMD Radeon R7 512 Cores (Kaveri Desktop)
...
3DMark - 3DMark Cloud Gate Graphics
10341 Points (3%)
...
AMD Radeon R7 512 Cores (Kaveri Desktop)
...
3DMark - 3DMark Fire Strike Standard Score
1477 Points (3%)
...
NVIDIA GeForce GTS 450
AMD Radeon R7 512 Cores (Kaveri Desktop)
...
3DMark - 3DMark Fire Strike Standard Graphics
1616 Points (2%)
...
NVIDIA GeForce GTS 450
AMD Radeon R7 512 Cores (Kaveri Desktop)
...
3DMark - 3DMark Ice Storm Graphics
85679 Points (10%)
...
AMD Radeon R7 512 Cores (Kaveri Desktop)
...
3DMark 11 - 3DM11 Performance Score
2444 Points (3%)
...
AMD Radeon R7 512 Cores (Kaveri Desktop)
NVIDIA GeForce GTX 550 Ti
...
3DMark 11 - 3DM11 Performance GPU
2302 Points (2%)
...
NVIDIA GeForce GTX 550 Ti
AMD Radeon R7 512 Cores (Kaveri Desktop)
...
3DMark Vantage + 3DMark Vantage - 3DM Vant. Perf. GPU no PhysX
7550 Points (4%)
...
ATI Radeon HD 4850
AMD Radeon R7 512 Cores (Kaveri Desktop)
Intel UHD Graphics 32EUs (Alder Lake)
...
3DMark 03 - 3DMark 03 - Standard
29153 Points (15%)
...
AMD Radeon R7 512 Cores (Kaveri Desktop)
...
3DMark 05 - 3DMark 05 - Standard
14908 Points (16%)
...
AMD Radeon R7 512 Cores (Kaveri Desktop)
...
3DMark 06 3DMark 06 - Standard 1280x1024 +
9878 Points (13%)
...
AMD Radeon R7 512 Cores (Kaveri Desktop)
NVIDIA GeForce GT 240 GDDR5
...
Unigine Valley 1.0 - Unigine Valley 1.0 DX
6.9 fps (2%)
...
Intel UHD Graphics 32EUs (Alder Lake)
AMD Radeon R7 512 Cores (Kaveri Desktop)
...
Unigine Heaven 3.0 - Unigine Heaven 3.0 DX 11
19.7 fps (7%)
...
AMD Radeon R7 512 Cores (Kaveri Desktop)
...
Unigine Heaven 3.0 - Unigine Heaven 3.0 OpenGL
17.6 fps (8%)
...
AMD Radeon R7 512 Cores (Kaveri Desktop)
...
Unigine Heaven 2.1 - Heaven 2.1 high
26.8 fps (5%)
...
AMD Radeon R7 512 Cores (Kaveri Desktop)
...
SPECviewperf 12 + SPECviewperf 12 - specvp12 sw-03
28.9 fps (7%)
...
AMD Radeon R7 512 Cores (Kaveri Desktop)
...
specvp12 snx-02 + SPECviewperf 12 - specvp12 snx-02
5.9 fps (1%)
...
AMD Radeon R7 512 Cores (Kaveri Desktop)
...
specvp12 showcase-01 + SPECviewperf 12 - specvp12 showcase-01
9.2 fps (2%)
...
AMD Radeon R7 512 Cores (Kaveri Desktop)
...
specvp12 mediacal-01 + SPECviewperf 12 - specvp12 mediacal-01
4.9 fps (1%)
...
AMD Radeon R7 512 Cores (Kaveri Desktop)
...
specvp12 maya-04 + SPECviewperf 12 - specvp12 maya-04
14.6 fps (4%)
...
AMD Radeon R7 512 Cores (Kaveri Desktop)
...
specvp12 energy-01 + SPECviewperf 12 - specvp12 energy-01
0.3 fps (0%)
...
AMD Radeon R7 512 Cores (Kaveri Desktop)
...
specvp12 creo-01 + SPECviewperf 12 - specvp12 creo-01
14.8 fps (6%)
...
AMD Radeon R7 512 Cores (Kaveri Desktop)
...
specvp12 catia-04 + SPECviewperf 12 - specvp12 catia-04
16.9 fps (3%)
...
AMD Radeon R7 512 Cores (Kaveri Desktop)
...
Cinebench R10 Cinebench R10 Shading (32bit) + Cinebench R10 - Cinebench R10 Shading (32bit)
7410 points (5%)
...
AMD Radeon R7 512 Cores (Kaveri Desktop)
Intel UHD Graphics 32EUs (Alder Lake)
...
Cinebench R11.5 Cinebench R11.5 OpenGL 64 Bit + Cinebench R11.5 - Cinebench R11.5 OpenGL 64 Bit
41 fps (14%)
...
Intel UHD Graphics 32EUs (Alder Lake)
AMD Radeon R7 512 Cores (Kaveri Desktop)
...
Cinebench R15 + Cinebench R15 - Cinebench R15 OpenGL 64 Bit
43.5 fps (3%)
...
AMD Radeon R7 512 Cores (Kaveri Desktop)
...
Cinebench R15 OpenGL Ref. Match 64 Bit + Cinebench R15 - Cinebench R15 OpenGL Ref. Match 64 Bit
98 % (98%)
...
AMD Radeon R7 512 Cores (Kaveri Desktop)
...
GFXBench 3.0 - GFXBench 3.0 Manhattan Offscreen
33.5 fps (2%)
...
AMD Radeon R7 512 Cores (Kaveri Desktop)
...
GFXBench (DX / GLBenchmark) 2.7 + GFXBench (DX / GLBenchmark) 2.7 - GFXBench T-Rex HD Offscreen C24Z16
128 fps (1%)
...
AMD Radeon R7 512 Cores (Kaveri Desktop)
...
LuxMark v2.0 64Bit - LuxMark v2.0 Room GPU
266 Samples/s (1%)
...
AMD Radeon R7 512 Cores (Kaveri Desktop)
Intel UHD Graphics 32EUs (Alder Lake)
...
LuxMark v2.0 64Bit - LuxMark v2.0 Sala GPU
470 Samples/s (1%)
...
AMD Radeon R7 512 Cores (Kaveri Desktop)
...
ComputeMark v2.1 - ComputeMark v2.1 Result
1495 points (2%)
...
AMD Radeon R7 512 Cores (Kaveri Desktop)
...
Power Consumption - Furmark Stress Test Power Consumption - external Monitor *
93.7 Watt (13%)
...
AMD Radeon R7 512 Cores (Kaveri Desktop)
...
Power Consumption - The Witcher 3 Power Consumption - external Monitor *
76.6 Watt (11%)
...
AMD Radeon R7 512 Cores (Kaveri Desktop)
...
Power Consumption - Witcher 3 ultra Power Efficiency - external Monitor
0.1 fps per Watt (6%)
AMD Radeon R7 512 Cores (Kaveri Desktop)
...
- Range of benchmark values for this graphics card
- Average benchmark values for this graphics card
* Smaller numbers mean a higher performance
Game Benchmarks The following benchmarks stem from our benchmarks of review laptops. The performance depends on the used graphics memory, clock rate, processor, system settings, drivers, and operating systems. So the results don't have to be representative for all laptops with this GPU. For detailed information on the benchmark results, click on the fps number.
...
AMD Radeon R7 512 Cores (Kaveri Desktop)
...
AMD Radeon R7 512 Cores (Kaveri Desktop)
...
» With all tested laptops playable in detail settings low.
...
AMD Radeon R7 512 Cores (Kaveri Desktop)
...
» The benchmarks indicate that the game is not playable in the tested settings.
...
AMD Radeon R7 512 Cores (Kaveri Desktop)
...
...
AMD Radeon R7 512 Cores (Kaveri Desktop)
...
» With all tested laptops playable in detail settings low.
Additional Benchmarks
Medium Preset 4xAF TAA 1366x768
25.7 [X] A10-7850K Asus A88-XM-PLUS AMD A10-7850K 3.7GHz
Radeon R7 512 Cores (Kaveri Desktop)
min:
21 fps, max:
32 fps
...
AMD Radeon R7 512 Cores (Kaveri Desktop)
...
» The benchmarks indicate that the game is not playable in the tested settings.
...
AMD Radeon R7 512 Cores (Kaveri Desktop)
...
» The benchmarks indicate that the game is not playable in the tested settings.
...
AMD Radeon R7 512 Cores (Kaveri Desktop)
...
...
AMD Radeon R7 512 Cores (Kaveri Desktop)
...
...
AMD Radeon R7 512 Cores (Kaveri Desktop)
...
» With all tested laptops playable in detail settings med..
...
AMD Radeon R7 512 Cores (Kaveri Desktop)
...
...
AMD Radeon R7 512 Cores (Kaveri Desktop)
...
» With all tested laptops playable in detail settings med..
...
AMD Radeon R7 512 Cores (Kaveri Desktop)
...
...
AMD Radeon R7 512 Cores (Kaveri Desktop)
...
» With all tested laptops playable in detail settings low.
21.8 [X] A10-7850K Asus A88-XM-PLUS DX11
AMD A10-7850K 3.7GHz
Radeon R7 512 Cores (Kaveri Desktop)
min:
6 fps, max:
32 fps
24.9 [X] A10-7850K Asus A88-XM-PLUS DX12
AMD A10-7850K 3.7GHz
Radeon R7 512 Cores (Kaveri Desktop)
min:
17 fps, max:
32 fps
~ 23 fps
+ Compare
- Hide Comparison
...
AMD Radeon R7 512 Cores (Kaveri Desktop)
...
...
AMD Radeon R7 512 Cores (Kaveri Desktop)
...
» The benchmarks indicate that the game is not playable in the tested settings.
...
AMD Radeon R7 512 Cores (Kaveri Desktop)
...
» With all tested laptops playable in detail settings low.
...
AMD Radeon R7 512 Cores (Kaveri Desktop)
...
...
AMD Radeon R7 512 Cores (Kaveri Desktop)
...
...
AMD Radeon R7 512 Cores (Kaveri Desktop)
...
» With all tested laptops playable in detail settings med..
Additional Benchmarks
Medium (Render Scale 100 %) 2xAF FXAA 1920x1080
27.3 [X] A10-7850K Asus A88-XM-PLUS AMD A10-7850K 3.7GHz
Radeon R7 512 Cores (Kaveri Desktop)
min:
21 fps, max:
33 fps
...
AMD Radeon R7 512 Cores (Kaveri Desktop)
...
...
AMD Radeon R7 512 Cores (Kaveri Desktop)
...
» The benchmarks indicate that the game is not playable in the tested settings.
...
AMD Radeon R7 512 Cores (Kaveri Desktop)
...
...
AMD Radeon R7 512 Cores (Kaveri Desktop)
...
» The benchmarks indicate that the game is not playable in the tested settings.
...
AMD Radeon R7 512 Cores (Kaveri Desktop)
...
...
AMD Radeon R7 512 Cores (Kaveri Desktop)
...
» The benchmarks indicate that the game is not playable in the tested settings.
...
AMD Radeon R7 512 Cores (Kaveri Desktop)
...
...
AMD Radeon R7 512 Cores (Kaveri Desktop)
...
...
AMD Radeon R7 512 Cores (Kaveri Desktop)
...
...
AMD Radeon R7 512 Cores (Kaveri Desktop)
...
» With all tested laptops playable in detail settings med..
...
AMD Radeon R7 512 Cores (Kaveri Desktop)
...
...
AMD Radeon R7 512 Cores (Kaveri Desktop)
...
...
AMD Radeon R7 512 Cores (Kaveri Desktop)
...
» The benchmarks indicate that the game is not playable in the tested settings.
...
AMD Radeon R7 512 Cores (Kaveri Desktop)
...
...
AMD Radeon R7 512 Cores (Kaveri Desktop)
...
...
AMD Radeon R7 512 Cores (Kaveri Desktop)
...
» With all tested laptops playable in detail settings low.
...
AMD Radeon R7 512 Cores (Kaveri Desktop)
...
...
AMD Radeon R7 512 Cores (Kaveri Desktop)
...
...
AMD Radeon R7 512 Cores (Kaveri Desktop)
...
» With all tested laptops playable in detail settings high.
...
AMD Radeon R7 512 Cores (Kaveri Desktop)
...
...
AMD Radeon R7 512 Cores (Kaveri Desktop)
...
...
AMD Radeon R7 512 Cores (Kaveri Desktop)
...
» With all tested laptops playable in detail settings med..
...
AMD Radeon R7 512 Cores (Kaveri Desktop)
...
...
AMD Radeon R7 512 Cores (Kaveri Desktop)
...
» With all tested laptops playable in detail settings med..
...
AMD Radeon R7 512 Cores (Kaveri Desktop)
...
...
AMD Radeon R7 512 Cores (Kaveri Desktop)
...
...
Intel UHD Graphics 32EUs (Alder Lake)
AMD Radeon R7 512 Cores (Kaveri Desktop)
...
...
Intel UHD Graphics 32EUs (Alder Lake)
AMD Radeon R7 512 Cores (Kaveri Desktop)
...
» With all tested laptops playable in detail settings med..
...
AMD Radeon R7 512 Cores (Kaveri Desktop)
...
» The benchmarks indicate that the game is not playable in the tested settings.
...
AMD Radeon R7 512 Cores (Kaveri Desktop)
Intel UHD Graphics 32EUs (Alder Lake)
...
...
Intel UHD Graphics 32EUs (Alder Lake)
AMD Radeon R7 512 Cores (Kaveri Desktop)
...
...
AMD Radeon R7 512 Cores (Kaveri Desktop)
...
...
AMD Radeon R7 512 Cores (Kaveri Desktop)
Intel UHD Graphics 32EUs (Alder Lake)
...
» The benchmarks indicate that the game is not playable in the tested settings.
...
AMD Radeon R7 512 Cores (Kaveri Desktop)
...
...
AMD Radeon R7 512 Cores (Kaveri Desktop)
...
...
AMD Radeon R7 512 Cores (Kaveri Desktop)
...
...
AMD Radeon R7 512 Cores (Kaveri Desktop)
...
» With all tested laptops playable in detail settings med..
...
Intel UHD Graphics 32EUs (Alder Lake)
AMD Radeon R7 512 Cores (Kaveri Desktop)
...
...
AMD Radeon R7 512 Cores (Kaveri Desktop)
...
...
AMD Radeon R7 512 Cores (Kaveri Desktop)
...
...
Intel UHD Graphics 32EUs (Alder Lake)
AMD Radeon R7 512 Cores (Kaveri Desktop)
...
» With all tested laptops playable in detail settings med..
...
AMD Radeon R7 512 Cores (Kaveri Desktop)
NVIDIA GeForce GTX 460 768MB
...
...
AMD Radeon R7 512 Cores (Kaveri Desktop)
NVIDIA GeForce GTX 460 768MB
...
...
AMD Radeon R7 512 Cores (Kaveri Desktop)
NVIDIA GeForce GTX 460 768MB
...
...
AMD Radeon R7 512 Cores (Kaveri Desktop)
NVIDIA GeForce GTX 460 768MB
...
» With all tested laptops playable in detail settings low.
...
AMD Radeon R7 512 Cores (Kaveri Desktop)
...
...
AMD Radeon R7 512 Cores (Kaveri Desktop)
...
...
AMD Radeon R7 512 Cores (Kaveri Desktop)
...
» With all tested laptops playable in detail settings low.
...
AMD Radeon R7 512 Cores (Kaveri Desktop)
...
...
AMD Radeon R7 512 Cores (Kaveri Desktop)
...
...
AMD Radeon R7 512 Cores (Kaveri Desktop)
...
...
AMD Radeon R7 512 Cores (Kaveri Desktop)
...
» With all tested laptops playable in detail settings low.
...
AMD Radeon R7 512 Cores (Kaveri Desktop)
NVIDIA GeForce GTX 460 768MB
...
...
AMD Radeon R7 512 Cores (Kaveri Desktop)
...
...
AMD Radeon R7 512 Cores (Kaveri Desktop)
...
» With all tested laptops playable in detail settings low.
...
AMD Radeon R7 512 Cores (Kaveri Desktop)
...
...
AMD Radeon R7 512 Cores (Kaveri Desktop)
...
» The benchmarks indicate that the game is not playable in the tested settings.
...
AMD Radeon R7 512 Cores (Kaveri Desktop)
...
...
AMD Radeon R7 512 Cores (Kaveri Desktop)
...
...
AMD Radeon R7 512 Cores (Kaveri Desktop)
...
AMD Radeon R7 512 Cores (Kaveri Desktop)
...
» With all tested laptops playable in detail settings low.
...
AMD Radeon R7 512 Cores (Kaveri Desktop)
...
...
AMD Radeon R7 512 Cores (Kaveri Desktop)
...
...
AMD Radeon R7 512 Cores (Kaveri Desktop)
...
...
AMD Radeon R7 512 Cores (Kaveri Desktop)
...
» With all tested laptops playable in detail settings low.
...
AMD Radeon R7 512 Cores (Kaveri Desktop)
...
...
AMD Radeon R7 512 Cores (Kaveri Desktop)
...
...
AMD Radeon R7 512 Cores (Kaveri Desktop)
...
» The benchmarks indicate that the game is not playable in the tested settings.
...
AMD Radeon R7 512 Cores (Kaveri Desktop)
...
...
AMD Radeon R7 512 Cores (Kaveri Desktop)
...
...
AMD Radeon R7 512 Cores (Kaveri Desktop)
...
» With all tested laptops playable in detail settings low.
...
AMD Radeon R7 512 Cores (Kaveri Desktop)
...
...
AMD Radeon R7 512 Cores (Kaveri Desktop)
...
...
AMD Radeon R7 512 Cores (Kaveri Desktop)
...
...
AMD Radeon R7 512 Cores (Kaveri Desktop)
...
» With all tested laptops playable in detail settings med..
...
AMD Radeon R7 512 Cores (Kaveri Desktop)
...
...
AMD Radeon R7 512 Cores (Kaveri Desktop)
...
...
AMD Radeon R7 512 Cores (Kaveri Desktop)
...
...
AMD Radeon R7 512 Cores (Kaveri Desktop)
...
» With all tested laptops playable in detail settings low.
...
AMD Radeon R7 512 Cores (Kaveri Desktop)
...
...
AMD Radeon R7 512 Cores (Kaveri Desktop)
...
...
AMD Radeon R7 512 Cores (Kaveri Desktop)
...
» With all tested laptops playable in detail settings high.
...
AMD Radeon R7 512 Cores (Kaveri Desktop)
...
...
AMD Radeon R7 512 Cores (Kaveri Desktop)
...
...
AMD Radeon R7 512 Cores (Kaveri Desktop)
...
...
AMD Radeon R7 512 Cores (Kaveri Desktop)
...
» With all tested laptops playable in detail settings med..
...
AMD Radeon R7 512 Cores (Kaveri Desktop)
...
...
AMD Radeon R7 512 Cores (Kaveri Desktop)
...
...
AMD Radeon R7 512 Cores (Kaveri Desktop)
...
...
AMD Radeon R7 512 Cores (Kaveri Desktop)
...
» With all tested laptops playable in detail settings low.
...
AMD Radeon R7 512 Cores (Kaveri Desktop)
...
...
AMD Radeon R7 512 Cores (Kaveri Desktop)
...
...
AMD Radeon R7 512 Cores (Kaveri Desktop)
...
...
AMD Radeon R7 512 Cores (Kaveri Desktop)
...
» With all tested laptops playable in detail settings high.
...
AMD Radeon R7 512 Cores (Kaveri Desktop)
...
...
AMD Radeon R7 512 Cores (Kaveri Desktop)
...
...
AMD Radeon R7 512 Cores (Kaveri Desktop)
...
» With all tested laptops playable in detail settings low.
...
AMD Radeon R7 512 Cores (Kaveri Desktop)
...
...
AMD Radeon R7 512 Cores (Kaveri Desktop)
...
...
AMD Radeon R7 512 Cores (Kaveri Desktop)
...
» With all tested laptops playable in detail settings med..
...
AMD Radeon R7 512 Cores (Kaveri Desktop)
...
...
AMD Radeon R7 512 Cores (Kaveri Desktop)
...
...
AMD Radeon R7 512 Cores (Kaveri Desktop)
...
...
AMD Radeon R7 512 Cores (Kaveri Desktop)
...
» With all tested laptops playable in detail settings med..
...
AMD Radeon R7 512 Cores (Kaveri Desktop)
...
AMD Radeon R7 512 Cores (Kaveri Desktop)
...
...
AMD Radeon R7 512 Cores (Kaveri Desktop)
...
...
AMD Radeon R7 512 Cores (Kaveri Desktop)
...
» With all tested laptops playable in detail settings high.
...
AMD Radeon R7 512 Cores (Kaveri Desktop)
...
...
AMD Radeon R7 512 Cores (Kaveri Desktop)
...
...
AMD Radeon R7 512 Cores (Kaveri Desktop)
...
...
AMD Radeon R7 512 Cores (Kaveri Desktop)
...
» The benchmarks indicate that the game is not playable in the tested settings.
...
AMD Radeon R7 512 Cores (Kaveri Desktop)
...
...
AMD Radeon R7 512 Cores (Kaveri Desktop)
...
...
AMD Radeon R7 512 Cores (Kaveri Desktop)
...
...
AMD Radeon R7 512 Cores (Kaveri Desktop)
...
» With all tested laptops playable in detail settings low.
...
AMD Radeon R7 512 Cores (Kaveri Desktop)
...
...
AMD Radeon R7 512 Cores (Kaveri Desktop)
...
...
AMD Radeon R7 512 Cores (Kaveri Desktop)
...
...
AMD Radeon R7 512 Cores (Kaveri Desktop)
...
» With all tested laptops playable in detail settings low.
...
AMD Radeon R7 512 Cores (Kaveri Desktop)
...
» With all tested laptops playable in detail settings low.
...
AMD Radeon R7 512 Cores (Kaveri Desktop)
...
...
AMD Radeon R7 512 Cores (Kaveri Desktop)
...
...
AMD Radeon R7 512 Cores (Kaveri Desktop)
...
...
AMD Radeon R7 512 Cores (Kaveri Desktop)
...
» With all tested laptops playable in detail settings med..
...
AMD Radeon R7 512 Cores (Kaveri Desktop)
...
...
AMD Radeon R7 512 Cores (Kaveri Desktop)
...
...
AMD Radeon R7 512 Cores (Kaveri Desktop)
...
...
AMD Radeon R7 512 Cores (Kaveri Desktop)
...
» With all tested laptops playable in detail settings high.
...
AMD Radeon R7 512 Cores (Kaveri Desktop)
...
» With all tested laptops playable in detail settings ultra.
...
AMD Radeon R7 512 Cores (Kaveri Desktop)
...
...
AMD Radeon R7 512 Cores (Kaveri Desktop)
...
...
AMD Radeon R7 512 Cores (Kaveri Desktop)
...
...
AMD Radeon R7 512 Cores (Kaveri Desktop)
...
» With all tested laptops playable in detail settings high.
...
AMD Radeon R7 512 Cores (Kaveri Desktop)
...
» The benchmarks indicate that the game is not playable in the tested settings.
...
AMD Radeon R7 512 Cores (Kaveri Desktop)
NVIDIA GeForce GTS 450
...
...
AMD Radeon R7 512 Cores (Kaveri Desktop)
NVIDIA GeForce GTS 450
...
...
NVIDIA GeForce GTS 450
AMD Radeon R7 512 Cores (Kaveri Desktop)
...
...
NVIDIA GeForce GTS 450
AMD Radeon R7 512 Cores (Kaveri Desktop)
...
» The benchmarks indicate that the game is not playable in the tested settings.
...
AMD Radeon R7 512 Cores (Kaveri Desktop)
...
...
AMD Radeon R7 512 Cores (Kaveri Desktop)
...
...
AMD Radeon R7 512 Cores (Kaveri Desktop)
...
...
AMD Radeon R7 512 Cores (Kaveri Desktop)
...
» With all tested laptops playable in detail settings high.
...
AMD Radeon R7 512 Cores (Kaveri Desktop)
...
...
AMD Radeon R7 512 Cores (Kaveri Desktop)
...
...
AMD Radeon R7 512 Cores (Kaveri Desktop)
...
...
AMD Radeon R7 512 Cores (Kaveri Desktop)
...
» With all tested laptops playable in detail settings low.
...
AMD Radeon R7 512 Cores (Kaveri Desktop)
...
» With all tested laptops playable in detail settings low.
...
AMD Radeon R7 512 Cores (Kaveri Desktop)
...
...
AMD Radeon R7 512 Cores (Kaveri Desktop)
...
...
AMD Radeon R7 512 Cores (Kaveri Desktop)
...
» With all tested laptops playable in detail settings high.
...
AMD Radeon R7 512 Cores (Kaveri Desktop)
...
...
AMD Radeon R7 512 Cores (Kaveri Desktop)
...
...
AMD Radeon R7 512 Cores (Kaveri Desktop)
...
...
AMD Radeon R7 512 Cores (Kaveri Desktop)
...
» With all tested laptops playable in detail settings med..
...
AMD Radeon R7 512 Cores (Kaveri Desktop)
...
...
AMD Radeon R7 512 Cores (Kaveri Desktop)
...
...
AMD Radeon R7 512 Cores (Kaveri Desktop)
...
...
AMD Radeon R7 512 Cores (Kaveri Desktop)
...
» With all tested laptops playable in detail settings low.
...
AMD Radeon R7 512 Cores (Kaveri Desktop)
...
...
AMD Radeon R7 512 Cores (Kaveri Desktop)
...
...
AMD Radeon R7 512 Cores (Kaveri Desktop)
...
...
AMD Radeon R7 512 Cores (Kaveri Desktop)
...
» With all tested laptops playable in detail settings med..
...
AMD Radeon R7 512 Cores (Kaveri Desktop)
...
...
AMD Radeon R7 512 Cores (Kaveri Desktop)
...
...
AMD Radeon R7 512 Cores (Kaveri Desktop)
...
...
AMD Radeon R7 512 Cores (Kaveri Desktop)
...
» With all tested laptops playable in detail settings high.
...
AMD Radeon R7 512 Cores (Kaveri Desktop)
...
...
AMD Radeon R7 512 Cores (Kaveri Desktop)
...
...
AMD Radeon R7 512 Cores (Kaveri Desktop)
...
...
AMD Radeon R7 512 Cores (Kaveri Desktop)
NVIDIA GeForce GTS 450
...
» With all tested laptops playable in detail settings med..
...
AMD Radeon R7 512 Cores (Kaveri Desktop)
...
...
AMD Radeon R7 512 Cores (Kaveri Desktop)
...
...
AMD Radeon R7 512 Cores (Kaveri Desktop)
...
...
AMD Radeon R7 512 Cores (Kaveri Desktop)
NVIDIA GeForce GTS 450
...
» With all tested laptops playable in detail settings med..
...
AMD Radeon R7 512 Cores (Kaveri Desktop)
...
» With all tested laptops playable in detail settings ultra.
...
AMD Radeon R7 512 Cores (Kaveri Desktop)
...
...
AMD Radeon R7 512 Cores (Kaveri Desktop)
...
» With all tested laptops playable in detail settings high.
...
ATI Radeon HD 5850
AMD Radeon R7 512 Cores (Kaveri Desktop)
...
...
AMD Radeon R7 512 Cores (Kaveri Desktop)
...
...
AMD Radeon R7 512 Cores (Kaveri Desktop)
...
...
AMD Radeon R7 512 Cores (Kaveri Desktop)
NVIDIA GeForce GTS 450
...
» With all tested laptops playable in detail settings med..
...
AMD Radeon R7 512 Cores (Kaveri Desktop)
...
...
AMD Radeon R7 512 Cores (Kaveri Desktop)
NVIDIA GeForce GTS 450
...
» With all tested laptops playable in detail settings high.
...
AMD Radeon R7 512 Cores (Kaveri Desktop)
NVIDIA GeForce GTS 450
ATI Radeon HD 4850
...
NVIDIA GeForce GTX 580
...
AMD Radeon R7 512 Cores (Kaveri Desktop)
NVIDIA GeForce GTS 450
...
» With all tested laptops playable in detail settings med..
...
AMD Radeon R7 512 Cores (Kaveri Desktop)
...
» The benchmarks indicate that the game is not playable in the tested settings.
For more games that might be playable and a list of all games and graphics cards visit our Gaming List
v1.26
log 18. 01:55:48
#0 no ids found in url (should be separated by "_") +0s ... 0s
#1 not redirecting to Ajax server +0s ... 0s
#2 did not recreate cache, as it is less than 5 days old! Created at Tue, 16 Apr 2024 05:39:00 +0200 +0.001s ... 0.001s
#3 composed specs +0.042s ... 0.043s
#4 did output specs +0s ... 0.043s
#5 start showIntegratedCPUs +0s ... 0.043s
#6 getting avg benchmarks for device 5444 +0.03s ... 0.073s
#7 got single benchmarks 5444 +0.007s ... 0.08s
#8 got avg benchmarks for devices +0s ... 0.08s
#9 min, max, avg, median took s +0.735s ... 0.814s
#10 before gaming benchmark output +0s ... 0.815s
#11 Got 208 rows for game benchmarks. +0.007s ... 0.822s
#12 composed SQL query for gamebenchmarks +0s ... 0.822s
#13 got data and put it in $dataArray +0.05s ... 0.872s
#14 benchmarks composed for output. +2s ... 2.872s
#15 return log +0.061s ... 2.933s
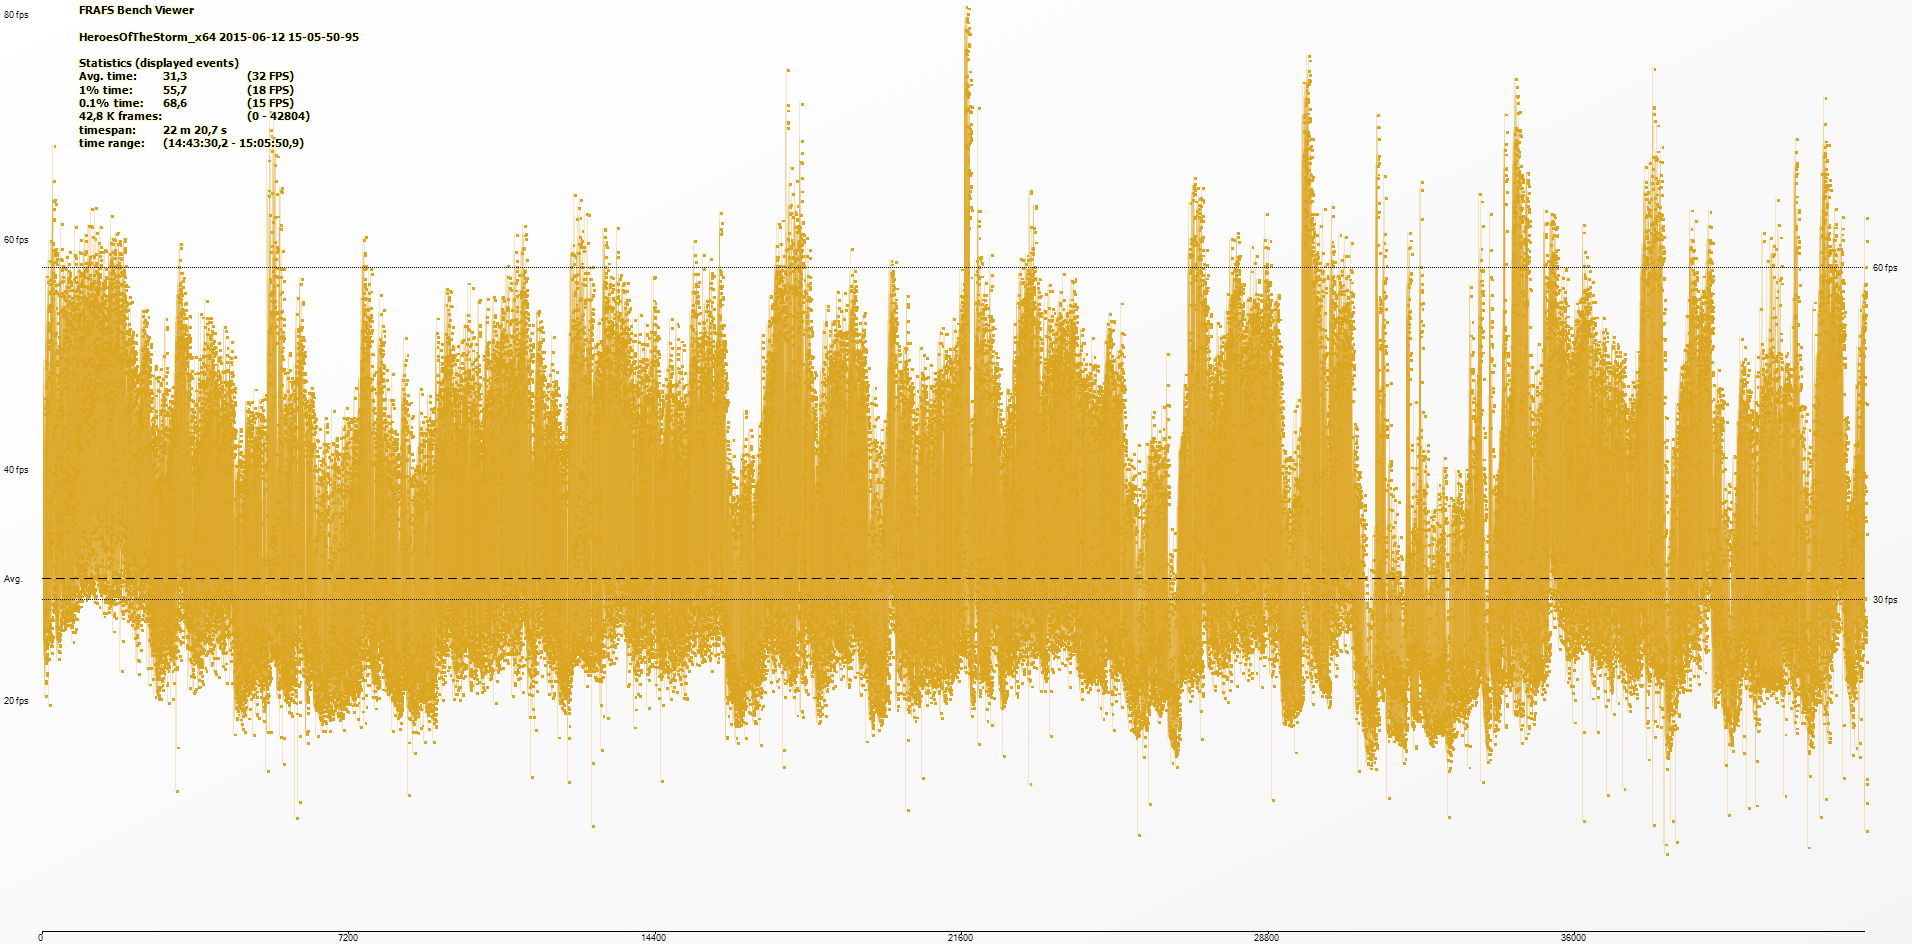
We played a 5 vs 5 in Heroes Of The Storm (v35702) with an average of 31 fps. As only some drops to below 20 fps happened, the gamplay was rather good (altough more fps and reduced details are recommended). Compared to the Intel Iris Pro 5200 with 39 fps, the AMD APU was clearly slower.
No reviews found for this graphics card.
Please share our article, every link counts!
» Comparison of GPUs
» Benchmark List
» Notebook Gaming List
Class 1 Arc A580
Class 2 Arc A380
Class 3 UHD Graphics 32EUs
UHD Graphics 750
Class 4 * Approximate position of the graphics adapter
Working For Notebookcheck
Are you a techie who knows how to translate? Then join our Team!
Details here
Top 10 Laptops Multimedia , Budget Multimedia , Gaming , Budget Gaming , Lightweight Gaming , Business , Budget Office , Workstation , Subnotebooks , Ultrabooks , Chromebooks
under 300 USD/Euros , under 500 USD/Euros , 1,000 USD/Euros , for University Students , Best Displays
Top 10 Smartphones Smartphones , Phablets , ≤6-inch , Camera Smartphones
Klaus Hinum (Update: 2016-01-26)
 Deutsch
 English
 Español
 Français
 Italiano
 Nederlands
 Polski
 Português
 Русский
 Türkçe
 Svenska
 Chinese
 Magyar