Intel HD Graphics 5600
The Intel HD Graphics 5600 (GT2) is an integrated graphics card of the Broadwell generation. It can be found in standard voltage CPUs (47 W) and offers 24 EUs (Execution Units). The clock range may depend on the model it is built into (Core i7-5700HQ : max. 1050 MHz with Turbo Boost).
Architecture and Features
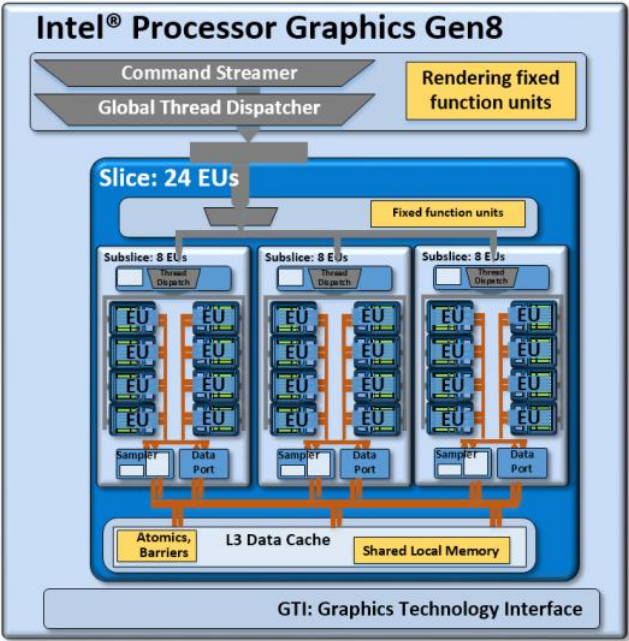
Broadwell features a GPU based on the Intel Gen8 architecture, which has been optimized in various aspects compared to the previous Gen7.5 (Haswell). Inter alia, the shader arrays called "subslice" have been reorganized and now offer 8 Execution Units (EUs) each. Three subslices form a "slice" for a total of 24 EUs. Combined with other improvements such as larger L1 caches and an optimized frontend, the integrated GPU has become faster and more efficient than its predecessor.
The HD Graphics 5600 represents the mid-range version of the Broadwell GPU family and consists of one slice with 24 EUs. Beyond that, there is also a low-end variant (GT1, 12 EUs) as well as higher-end models (GT3/GT3e + eDRAM, 48 EUs).
All Broadwell GPUs support OpenCL 2.0 and DirectX 12 (FL 11_1) . The video engine is now able to decode H.265 using both fixed function hardware as well as available GPU shaders. Up to three displays can be connected via DP 1.2/eDP 1.3 (max. 3840 x 2160 @ 60 Hz) or HDMI 1.4a (max. 3840 x 2160 @ 24 Hz). HDMI 2.0, however, is not supported.
Performance
Thanks to its improved architecture and the additional EUs, the HD Graphics 5600 is about 20 percent faster than the Haswell-based HD 4600 (20 EUs), but still somewhat slower than dedicated low-end GPUs like a GeForce 920M or Radeon R7 M360 . Most games as of 2014/2015 will be playable only in low settings (and sometimes not even that).
Power Consumption
The whole Broadwell chip is specified at 47 W TDP (i7-5700HQ) and therefore best suited for notebooks 14-inches in size and above. We tested the power consumption of the GPU with HWInfo sensors in a Core i7-5600HQ (MSI GP62). Idle on the Windows desktop the HD 5600 needed on average 0.04 Watt. Running World of Warships in high details, 9.6 Watt were used by the graphics card (whole CPU needed 41 Watt). In comparison, when we activated the dedicated GeForce 940M, the GPU part needed 0.4 Watt and the whole CPU 29 Watt.
HD Graphics Series Codename Broadwell GT2 Architecture Gen. 8 Broadwell Pipelines 24 - unified Core Speed 300 - 1050 (Boost) MHz Memory Bus Width 64/128 Bit Shared Memory yes API DirectX 12 (FL 11_1), OpenGL 4.3 technology 14 nm Features QuickSync Date of Announcement 02.06.2015
CPU in HD Graphics 5600 GPU Base Speed GPU Boost / Turbo Intel Core i7-5700HQ 4 x 2700 MHz, 47 W 300 MHz 1050 MHz
Benchmarks Performance Rating - 3DMark 11 + Fire Strike + Time Spy
0.5 pt (1%)
...
...
max:
3DMark - 3DMark Cloud Gate Score
7499 Points (8%)
...
...
max:
3DMark - 3DMark Cloud Gate Graphics
7757 Points (2%)
...
...
max:
3DMark - 3DMark Fire Strike Standard Score
944 Points (2%)
...
...
max:
3DMark - 3DMark Fire Strike Standard Graphics
991 Points (1%)
...
...
max:
3DMark - 3DMark Ice Storm Graphics
79039 Points (9%)
...
...
max:
3DMark 11 - 3DM11 Performance Score
1651 Points (2%)
...
...
max:
3DMark 11 - 3DM11 Performance GPU
1431 Points (1%)
...
...
max:
Cinebench R10 Cinebench R10 Shading (32bit) + Cinebench R10 - Cinebench R10 Shading (32bit)
7445 points (5%)
...
...
Cinebench R11.5 Cinebench R11.5 OpenGL 64 Bit + Cinebench R11.5 - Cinebench R11.5 OpenGL 64 Bit
41.2 fps (14%)
...
...
max:
Cinebench R15 + Cinebench R15 - Cinebench R15 OpenGL 64 Bit
37.9 fps (2%)
...
...
Power Consumption - Furmark Stress Test Power Consumption - external Monitor *
57.8 Watt (8%)
...
...
max:
Power Consumption - The Witcher 3 Power Consumption - external Monitor *
44.6 Watt (6%)
...
...
max:
- Range of benchmark values for this graphics card
- Average benchmark values for this graphics card
* Smaller numbers mean a higher performance
Game Benchmarks The following benchmarks stem from our benchmarks of review laptops. The performance depends on the used graphics memory, clock rate, processor, system settings, drivers, and operating systems. So the results don't have to be representative for all laptops with this GPU. For detailed information on the benchmark results, click on the fps number.
...
max:
» The benchmarks indicate that the game is not playable in the tested settings.
...
...
» The benchmarks indicate that the game is not playable in the tested settings.
...
...
max:
» The benchmarks indicate that the game is not playable in the tested settings.
...
...
max:
...
max:
» With all tested laptops playable in detail settings low.
...
...
...
...
...
...
...
max:
» With all tested laptops playable in detail settings high.
...
...
» With all tested laptops playable in detail settings low.
...
...
...
...
max:
» With all tested laptops playable in detail settings low.
...
...
max:
» The benchmarks indicate that the game is not playable in the tested settings.
...
...
max:
...
max:
» The benchmarks indicate that the game is not playable in the tested settings.
Additional Benchmarks
Medium Preset 4xAF TAA 1366x768
14 [X] MSI GP62 2QD Intel Core i7-5700HQ 2.7GHz
HD Graphics 5600
min:
10 fps, max:
19 fps
...
max:
...
max:
» The benchmarks indicate that the game is not playable in the tested settings.
...
max:
...
...
...
max:
» With all tested laptops playable in detail settings med..
...
...
max:
...
...
max:
...
max:
...
max:
» The benchmarks indicate that the game is not playable in the tested settings.
...
» The benchmarks indicate that the game is not playable in the tested settings.
68 (!) [X] MSI GP62 2QD Intel Core i7-5700HQ 2.7GHz
HD Graphics 5600
min:
50 fps, max:
77 fps
fps
+ Compare
- Hide Comparison
...
...
max:
50.4 (!) [X] MSI GP62 2QD Intel Core i7-5700HQ 2.7GHz
HD Graphics 5600
min:
41 fps, max:
57 fps
fps
+ Compare
- Hide Comparison
...
max:
28.1 (!) [X] MSI GP62 2QD Intel Core i7-5700HQ 2.7GHz
HD Graphics 5600
min:
23 fps, max:
31 fps
fps
+ Compare
- Hide Comparison
...
max:
» With all tested laptops playable in detail settings med..
...
...
...
...
» With all tested laptops playable in detail settings low.
...
» The benchmarks indicate that the game is not playable in the tested settings.
...
...
max:
» The benchmarks indicate that the game is not playable in the tested settings.
...
...
...
...
max:
» The benchmarks indicate that the game is not playable in the tested settings.
Additional Benchmarks
Low Preset 1920x1080
9 [X] MSI GP62 2QD Intel Core i7-5700HQ 2.7GHz
HD Graphics 5600
min:
8 fps, max:
11 fps
...
...
» The benchmarks indicate that the game is not playable in the tested settings.
...
max:
...
max:
...
» The benchmarks indicate that the game is not playable in the tested settings.
...
...
max:
...
...
max:
» The benchmarks indicate that the game is not playable in the tested settings.
...
...
max:
...
...
max:
...
...
» With all tested laptops playable in detail settings high.
...
...
max:
...
...
max:
...
...
max:
...
...
max:
» With all tested laptops playable in detail settings med..
...
...
...
...
...
» The benchmarks indicate that the game is not playable in the tested settings.
...
max:
...
» The benchmarks indicate that the game is not playable in the tested settings.
...
...
...
» The benchmarks indicate that the game is not playable in the tested settings.
...
...
max:
...
...
max:
...
...
max:
...
max:
» The benchmarks indicate that the game is not playable in the tested settings.
...
...
...
...
max:
...
...
...
» With all tested laptops playable in detail settings low.
...
...
...
...
...
...
...
...
» With all tested laptops playable in detail settings low.
...
...
...
...
...
...
» The benchmarks indicate that the game is not playable in the tested settings.
...
...
max:
...
...
max:
...
...
...
max:
» The benchmarks indicate that the game is not playable in the tested settings.
...
...
...
...
...
...
» The benchmarks indicate that the game is not playable in the tested settings.
...
...
...
...
...
...
...
...
...
max:
...
max:
» With all tested laptops playable in detail settings low.
...
...
max:
...
...
...
...
...
...
» With all tested laptops playable in detail settings med..
...
...
...
...
...
...
» The benchmarks indicate that the game is not playable in the tested settings.
...
...
max:
...
...
max:
...
...
max:
...
» With all tested laptops playable in detail settings low.
...
...
...
...
...
...
...
...
» The benchmarks indicate that the game is not playable in the tested settings.
...
...
...
...
max:
...
...
max:
» With all tested laptops playable in detail settings high.
...
max:
...
...
max:
...
...
...
...
max:
» With all tested laptops playable in detail settings med..
...
...
...
...
...
...
max:
...
max:
» With all tested laptops playable in detail settings med..
...
...
max:
...
...
max:
...
max:
...
» The benchmarks indicate that the game is not playable in the tested settings.
...
...
...
...
...
...
...
...
» The benchmarks indicate that the game is not playable in the tested settings.
...
...
max:
...
...
max:
...
...
max:
...
...
max:
» With all tested laptops playable in detail settings low.
...
...
...
...
...
...
...
...
max:
» The benchmarks indicate that the game is not playable in the tested settings.
...
...
...
...
...
...
...
...
max:
» With all tested laptops playable in detail settings low.
...
...
...
...
...
...
...
...
» With all tested laptops playable in detail settings med..
...
...
max:
...
...
max:
...
...
max:
...
...
max:
» The benchmarks indicate that the game is not playable in the tested settings.
For more games that might be playable and a list of all games and graphics cards visit our Gaming List
v1.26
log 18. 01:20:31
#0 no ids found in url (should be separated by "_") +0s ... 0s
#1 not redirecting to Ajax server +0s ... 0s
#2 did not recreate cache, as it is less than 5 days old! Created at Tue, 16 Apr 2024 05:39:00 +0200 +0.001s ... 0.001s
#3 composed specs +0.067s ... 0.068s
#4 did output specs +0s ... 0.068s
#5 start showIntegratedCPUs +0s ... 0.068s
#6 getting avg benchmarks for device 5949 +0.035s ... 0.103s
#7 got single benchmarks 5949 +0.009s ... 0.112s
#8 got avg benchmarks for devices +0s ... 0.112s
#9 min, max, avg, median took s +0.398s ... 0.51s
#10 before gaming benchmark output +0s ... 0.51s
#11 Got 142 rows for game benchmarks. +0.012s ... 0.522s
#12 composed SQL query for gamebenchmarks +0s ... 0.522s
#13 got data and put it in $dataArray +0.04s ... 0.562s
#14 benchmarks composed for output. +1.525s ... 2.087s
#15 return log +0.067s ... 2.154s
No reviews found for this graphics card.
Please share our article, every link counts!
» Comparison of GPUs
» Benchmark List
» Notebook Gaming List
Class 1
Class 2 Radeon PRO W6600M *
Class 3 UHD Graphics 32EUs
UHD Graphics 750
Class 4
Class 5 * Approximate position of the graphics adapter
Working For Notebookcheck
Are you a techie who knows how to translate? Then join our Team!
Details here
Top 10 Laptops Multimedia , Budget Multimedia , Gaming , Budget Gaming , Lightweight Gaming , Business , Budget Office , Workstation , Subnotebooks , Ultrabooks , Chromebooks
under 300 USD/Euros , under 500 USD/Euros , 1,000 USD/Euros , for University Students , Best Displays
Top 10 Smartphones Smartphones , Phablets , ≤6-inch , Camera Smartphones
Klaus Hinum (Update: 2016-01-26)
 Deutsch
 English
 Español
 Français
 Italiano
 Nederlands
 Polski
 Português
 Русский
 Türkçe
 Svenska
 Chinese
 Magyar