Notebook reviews with AMD Radeon HD 8750M graphics card
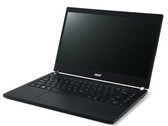
Acer TravelMate P645-MG-74508G75tkk Notebook Review
Beautiful without frills. Acer now offers a premium business notebook with the TravelMate P645. We check if the new Ultrabook flagship can compete with the premium devices from the competition.
Intel Core i7-4500U, AMD Radeon HD 8750M, 14", 1.5 kgReview Update HP EliteBook 850 G1-H5G44ET Notebook
Slowed down. Besides the Core i7 processor and the improved memory equipment, it is the dedicated Radeon HD 8750M in particular that is supposed to justify the considerable price of the top version from the EliteBook 850-series. But can the thin chassis actually handle the additional heat?
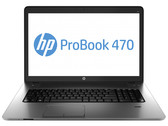
Intel Core i7-4600U, AMD Radeon HD 8750M, 15.6", 2 kgReview Update HP ProBook 470 G1 E9Y75EA Notebook
Now featuring Haswell. HP's ProBook 470 is an office laptop for both the private and professional field. Its price range of approx. 700 Euros (~$959) and the installed hardware also make the device interesting for users who want to replace their desktop PC at home with a 17.3-inch laptop. Our test report reveals whether the laptop is convincing.
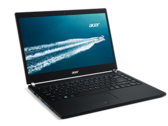
Intel Core i5-4200M, AMD Radeon HD 8750M, 17.3", 2.9 kgReview Acer TravelMate P645-MG-9419 Ultrabook
Ultra-TravelMate. Acer updates their venerable TravelMate-series and adds a 14-inch business Ultrabook to the lineup. Is the 14-inch Haswell-equipped P645 with its dedicated Radeon graphics card and generously-sized SSD a compelling alternative to the established competition?
Intel Core i7-4500U, AMD Radeon HD 8750M, 14", 1.6 kg
Review HP ProBook 470 G0 (H6P56EA) Notebook
Big Business. The new HP ProBook 470 promises professional quality at a bargain price, but what is the catch? Despite a Core-i7 chip, a lot of memory and a dedicated Radeon GPU, this 17-inch notebook is available at prices starting at less than 800 Euros (~$1093).
Intel Core i7-3632QM, AMD Radeon HD 8750M, 17.3", 2.9 kgAcer Aspire V5-552PG-X809: AMD A10-5757M, 15.60", 2.3 kg
Review » Review Acer Aspire V5-552PG-X809 Notebook
Acer Aspire E1-572G-54204G75Mnkk: Intel Core i5-4200U, 15.60", 2.4 kg
Review » Review Acer Aspire E1-572G-54204G75Mnkk Notebook
Dell Inspiron 15-3521-0620: Intel Core i5-3337U, 15.60", 2.4 kg
Review » Review Dell Inspiron 15-3521-0620 Notebook
Samsung 510R5E-S01DE: Intel Core i5-3210M, 15.60", 2 kg
Review » Review Samsung Series 5 510R5E Notebook
Samsung 530U4E-S02DE: Intel Core i5-3337U, 14.00", 1.8 kg
Review » Review Samsung Series 5 530U4E-S02DE Ultrabook
Lenovo G510-59406666: Intel Core i7-4700MQ, 15.60", 2.5 kg
External Review » Lenovo G510-59406666
HP ProBook 650 G1: Intel Core i5-4200M, 15.60", 2.3 kg
External Review » HP ProBook 650 G1
Acer TravelMate P455-MG: Intel Core i5-4200H, 15.60", 2.3 kg
External Review » Acer TravelMate P455-MG
Acer Travelmate Pro TMP645-MG: Intel Core i5-4200U, 14.00", 1.5 kg
External Review » Acer Travelmate Pro TMP645-MG
HP ProBook 470 G1 E9Y75EA: Intel Core i5-4200M, 17.30", 2.9 kg
External Review » HP ProBook 470 G1 E9Y75EA
HP ProBook 455 H0W29EA: AMD A8-4500M, 15.60", 2.3 kg
External Review » HP ProBook 455 H0W29EA
Acer TravelMate P645-MG-9419: Intel Core i7-4500U, 14.00", 1.6 kg
External Review » Acer TravelMate P645-MG-9419
Acer Aspire E1-572G-54204G75Mnkk: Intel Core i5-4200U, 15.60", 2.4 kg
External Review » Acer Aspire E1-572G-54204G75Mnkk
Acer Aspire V5-552G-8632: AMD A8-5557M, 15.60", 2 kg
External Review » Acer Aspire V5-552G-8632
HP EliteBook 850 G1-H5G44ET: Intel Core i7-4600U, 15.60", 2 kg
External Review » HP EliteBook 850 G1-H5G44ET
HP EliteBook 840 G1: Intel Core i7-4600U, 14.00", 1.6 kg
External Review » HP EliteBook 840 G1
Lenovo IdeaPad G510: Intel Core i5-4200M, 15.60", 2.5 kg
External Review » Lenovo IdeaPad G510
Acer TravelMate P255-MG-54204G50Mnkk: Intel Core i5-4200U, 15.60", 2.3 kg
External Review » Acer TravelMate P255-MG-54208G50Mnkk
Acer Aspire V5-552G-X414: AMD A10-5757M, 15.60", 2 kg
External Review » Acer Aspire V5-552G-X414
Lenovo IdeaPad G500s-59381252: Intel Core i7-3612QM, 15.60", 2.6 kg
External Review » Lenovo IdeaPad G500s-59381252
HP ProBook 450-H0U97EA: Intel Core i5-3230M, 15.60", 2.3 kg
External Review » HP ProBook 450-H0U97EA
Samsung 370R5E-S06PL: Intel Pentium 997, 15.60", 2 kg
External Review » Samsung 370R5E-S06PL
Asus N56DY: AMD A8-5550M, 15.60", 2.7 kg
External Review » Asus N56DY
Samsung 510R5E-S01DE: Intel Core i5-3210M, 15.60", 2 kg
External Review » Samsung 510R5E-S01DE
Samsung 300E5E-S01PL: Intel Core i3-3120M, 15.60", 2.2 kg
External Review » Samsung 300E5E-S01PL
Samsung NP370R5V: Intel Core i3-3110M, 15.60", 2 kg
External Review » Samsung NP370R5V
Samsung 530U4E-S02DE: Intel Core i5-3337U, 14.00", 1.8 kg
External Review » Samsung 530U4E-S02DE