Notebookcheck Logo

NVIDIA Quadro M500M

NVIDIA Quadro M500M

The Nvidia Quadro M500M is a DirectX 12 (FL 11_0) and OpenGL 4.5-compatible graphics card for mobile workstations. It is a Maxwell-based GPU built on the GM108 chip with 384 shader cores and manufactured in 28 nm by TSMC. The Quadro M500M is the successor to the Quadro K620M which is also based on the Maxwell GM108 but lists a higher memory bandwidth of 16 vs. 14.4 GB/s. Therefore, it is also similar to the consumer GeForce 930M.

The Quadro series offers certified drivers that are optimized for stability and performance in professional applications like CAD or DCC. OpenGL performance, for example, should be significantly better than with GeForce graphics cards of similar specifications.

Architecture

Compared to Kepler, Maxwell has been optimized in several details to increase power efficiency. Smaller Streaming Multiprocessors (SMM) with only 128 ALUs (Kepler: 192) and an optimized scheduler should lead to better utilization of the shaders. Nvidia promises that a Maxwell SMM with 128 ALUs can offer 90% of the performance of a Kepler SMX with 192 ALUs. GM108 features 3 SMMs and thus 384 shader cores, 24 TMUs and 8 ROPs (64-bit interface).

Another optimization is the massively enlarged L2 cache. The larger size can reduce some of the memory traffic to allow for a relatively narrow memory interface without significantly hurting performance.

GM108 supports DirectX 11.2 (feature level 11.0 only) as well as DirectX 12.

Performance

The performance should be slightly below the Quadro K620M (same chip, but slightly more memory bandwidth) and therefore positioned in the entry-level of dedicated graphics chips. For 3D games the Quadro M500M should be similar to the GeForce 930M. Therefore, only low-demanding games should run fluently.

Features

The feature set should include support for up to four active displays. High-resolution monitors of up to 3840x2160 pixels can be connected using DisplayPort 1.2 or HDMI 1.4a (HDMI 2.0 not supported). HD-Audio codecs, such as Dolby TrueHD and DTS-HD, can be transmitted via bitstream mode through the HDMI port. However, as most laptops will feature Optimus, the integrated GPU will likely have direct control over the display ports and may limit the feature set available by the Nvidia Kepler cards.

Using CUDA or OpenCL, the cores of the Quadro M500M can be used for general calculations.

GM108 integrates the sixth generation of the PureVideo HD video engine (VP6), offering a better decoding performance for H.264 and MPEG-2 videos. Of course, VP6 supports all features of previous generations (4K support, PIP, video encoding via NVENC API).

Power Consumption

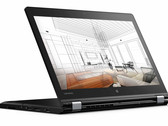
The power consumption of the Quadro M500M (and M600M, K620M) is rated at 30 W. Therefore, the GPU is best suited for laptops 13 - 14-inches in size and above. The M500M also supports Optimus to automatically switch between an integrated graphics card and the Nvidia GPU.

Quadro M Series

Quadro M5500 compare 2048 @ 1.14 - 1.14 GHz256 Bit @ 6606 MHz
Quadro M5000M compare 1536 @ 0.96 - 1.05 GHz256 Bit @ 5000 MHz
Quadro M4000M compare 1280 @ 0.98 - 1.01 GHz256 Bit @ 5012 MHz
Quadro M3000M compare 1024 @ 1.05 GHz256 Bit @ 5000 MHz
Quadro M2200 compare 1024 @ 0.69 - 1.04 GHz128 Bit @ 5508 MHz
Quadro M1200 compare 640 @ 0.99 - 1.15 GHz128 Bit @ 5000 MHz
Quadro M2000M compare 640 @ 1.04 - 1.2 GHz128 Bit @ 5000 MHz
Quadro M1000M compare 512 @ 0.99 - 1.07 GHz128 Bit @ 5000 MHz
Quadro M620 compare 512 @ 1.02 GHz128 Bit @ 5012 MHz
Quadro 5010M compare 384 @ 0.45 GHz256 Bit @ 1300 MHz
Quadro 4000M compare 336 @ 0.48 GHz256 Bit @ 1200 MHz
Quadro M520 compare 384 @ 0.76 - 1.02 GHz64 Bit
Quadro M600M compare 384 @ 0.84 - 0.88 GHz128 Bit @ 5012 MHz
Quadro M500M 384 @ 1.03 - 1.12 GHz64 Bit @ 4004 MHz
Quadro 5000M compare 320 @ 0.41 GHz256 Bit @ 1200 MHz
Quadro 3000M compare 240 @ 0.45 GHz256 Bit @ 625 MHz
Quadro 2000M compare 192 @ 0.55 GHz128 Bit @ 900 MHz
Quadro 1000M compare 96 @ 0.7 GHz128 Bit @ 900 MHz
ArchitectureMaxwell
Pipelines384 - unified
Core Speed1029 - 1124 (Boost) MHz
Memory Speed4004 MHz
Memory Bus Width64 Bit
Memory TypeDDR3
Max. Amount of Memory2048 MB
Shared Memoryno
APIDirectX 12 (FL 11_0), Shader 5.0, OpenGL 4.5
Power Consumption30 Watt
technology28 nm
FeaturesOptimus, PhysX, 3D Vision Pro, nView, Optimus
Notebook Sizelarge
Date of Announcement15.12.2015

Benchmarks

Performance Rating - 3DMark 11 + Fire Strike + Time Spy
0.7 pt (2%)
3DMark - 3DMark Cloud Gate Score
min: 5986     avg: 6299     median: 6359 (7%)     max: 6491 Points
3DMark - 3DMark Fire Strike Standard Score
min: 1387     avg: 1401     median: 1391.5 (2%)     max: 1432 Points
3DMark - 3DMark Fire Strike Standard Graphics
min: 1585     avg: 1596     median: 1594.5 (2%)     max: 1610 Points
3DMark 11 - 3DM11 Performance Score
min: 2350     avg: 2431     median: 2447 (3%)     max: 2478 Points
3DMark 11 - 3DM11 Performance GPU
min: 2222     avg: 2341     median: 2364.5 (2%)     max: 2412 Points
3DMark Vantage
3DM Vant. Perf. total +
3DM Vant. Perf. GPU no PhysX +
3DMark 06 3DMark 06 - Standard 1280x1024 +
3DMark 06
min: 11913     avg: 12378     median: 12377.5 (16%)     max: 12842 Points
SPECviewperf 11
specvp11 snx-01 +
SPECviewperf 11 - specvp11 snx-01
min: 24.74     avg: 26.3     median: 24.8 (15%)     max: 29.41 fps
specvp11 tcvis-02 +
SPECviewperf 11 - specvp11 tcvis-02
min: 25.48     avg: 28.9     median: 25.5 (14%)     max: 35.63 fps
specvp11 sw-02 +
SPECviewperf 11 - specvp11 sw-02
min: 34.95     avg: 36.6     median: 35.1 (27%)     max: 39.63 fps
specvp11 proe-05 +
SPECviewperf 11 - specvp11 proe-05
min: 14.61     avg: 14.8     median: 14.9 (18%)     max: 14.98 fps
specvp11 maya-03 +
SPECviewperf 11 - specvp11 maya-03
min: 42.62     avg: 44.2     median: 43 (32%)     max: 46.88 fps
specvp11 lightwave-01 +
SPECviewperf 11 - specvp11 lightwave-01
min: 38.69     avg: 41.5     median: 38.8 (42%)     max: 46.9 fps
specvp11 ensight-04 +
SPECviewperf 11 - specvp11 ensight-04
min: 16.84     avg: 18.1     median: 16.9 (8%)     max: 20.44 fps
specvp11 catia-03 +
SPECviewperf 11 - specvp11 catia-03
min: 32.55     avg: 34.5     median: 32.7 (17%)     max: 38.08 fps
SPECviewperf 12
specvp12 sw-03 +
specvp12 snx-02 +
specvp12 showcase-01 +
specvp12 mediacal-01 +
specvp12 maya-04 +
specvp12 energy-01 +
specvp12 creo-01 +
specvp12 catia-04 +
Cinebench R10 Cinebench R10 Shading (32bit) +
Cinebench R11.5 Cinebench R11.5 OpenGL 64 Bit +
Cinebench R15
Cinebench R15 OpenGL 64 Bit +
Cinebench R15 - Cinebench R15 OpenGL 64 Bit
min: 34.89     avg: 41.2     median: 40.7 (2%)     max: 48.45 fps
Cinebench R15 OpenGL Ref. Match 64 Bit +
GFXBench (DX / GLBenchmark) 2.7
GFXBench T-Rex HD Offscreen C24Z16 +
- Range of benchmark values for this graphics card
- Average benchmark values for this graphics card
* Smaller numbers mean a higher performance

Game Benchmarks

The following benchmarks stem from our benchmarks of review laptops. The performance depends on the used graphics memory, clock rate, processor, system settings, drivers, and operating systems. So the results don't have to be representative for all laptops with this GPU. For detailed information on the benchmark results, click on the fps number.

Overwatch

Overwatch

2016
low 1280x720
49.1  fps    + Compare
med. 1366x768
28.3  fps    + Compare
high 1920x1080
22.2  fps    + Compare
» With all tested laptops playable in detail settings low.
Additional Benchmarks
Medium (Render Scale 100 %) 2xAF FXAA 1920x1080
67.1
low 1024x768
30.3  fps    + Compare
med. 1366x768
18.6  fps    + Compare
high 1920x1080
10.4  fps    + Compare
» The benchmarks indicate that the game is not playable in the tested settings.
low 1024x768
46.9 65.4 ~ 56 fps    + Compare
med. 1366x768
32.4 38.2 ~ 35 fps    + Compare
high 1920x1080
19.2 20.2 ~ 20 fps    + Compare
ultra 1920x1080
11.9 13.1 ~ 13 fps    + Compare
» With all tested laptops playable in detail settings low.
low 1024x768
35.6  fps    + Compare
med. 1366x768
29.6  fps    + Compare
high 1920x1080
16.2  fps    + Compare
ultra 1920x1080
14.5  fps    + Compare
» With all tested laptops playable in detail settings low.
low 1024x768
56.5  fps    + Compare
med. 1366x768
33.3  fps    + Compare
high 1920x1080
15.2  fps    + Compare
ultra 1920x1080
13  fps    + Compare
» With all tested laptops playable in detail settings low.
low 1280x720
27  fps    + Compare
med. 1366x768
21  fps    + Compare
high 1920x1080
10  fps    + Compare
ultra 1920x1080
7  fps    + Compare
» The benchmarks indicate that the game is not playable in the tested settings.
low 1024x768
29 30.5 ~ 30 fps    + Compare
med. 1366x768
17.9 18.9 ~ 18 fps    + Compare
high 1920x1080
9.9 10.2 ~ 10 fps    + Compare
» The benchmarks indicate that the game is not playable in the tested settings.
low 1024x768
82.6  fps    + Compare
med. 1366x768
32.8  fps    + Compare
high 1920x1080
19.5  fps    + Compare
ultra 1920x1080
12.7  fps    + Compare
» With all tested laptops playable in detail settings low.
Thief

Thief

2014
low 1024x768
33.7 35 ~ 34 fps    + Compare
med. 1366x768
22.9 23.4 ~ 23 fps    + Compare
high 1366x768
18.6 19.1 ~ 19 fps    + Compare
ultra 1920x1080
9.2 9.6 ~ 9 fps    + Compare
» The benchmarks indicate that the game is not playable in the tested settings.
low 1024x768
62.6  fps    + Compare
med. 1366x768
48.1  fps    + Compare
high 1366x768
42.3  fps    + Compare
ultra 1920x1080
10.5  fps    + Compare
» With all tested laptops playable in detail settings high.
low 1024x768
48.9  fps    + Compare
med. 1366x768
38.3  fps    + Compare
high 1366x768
22.9  fps    + Compare
ultra 1920x1080
11.6  fps    + Compare
» With all tested laptops playable in detail settings med..
low 1280x720
89.1 89.9 94.9 ~ 91 fps    + Compare
med. 1366x768
50.1 50.2 54 ~ 51 fps    + Compare
high 1366x768
40.3 40.5 43.8 ~ 42 fps    + Compare
ultra 1920x1080
13.8 13.8 14.7 ~ 14 fps    + Compare
» With all tested laptops playable in detail settings high.
low 1024x768
217.5  fps    + Compare
med. 1366x768
93.6  fps    + Compare
high 1366x768
48.7  fps    + Compare
ultra 1920x1080
24.2  fps    + Compare
» With all tested laptops playable in detail settings high.
low 1024x768
137.8  fps    + Compare
med. 1366x768
62.7  fps    + Compare
high 1366x768
34.4  fps    + Compare
ultra 1920x1080
17.3  fps    + Compare
» With all tested laptops playable in detail settings med..
Mafia 2

Mafia 2

2010
low 800x600
78.5  fps    + Compare
med. 1024x768
57  fps    + Compare
high 1360x768
45.8  fps    + Compare
ultra 1920x1080
27.5  fps    + Compare
» With all tested laptops playable in detail settings high.
lowmed.highultraQHD4K
Overwatch49.128.322.2
Rise of the Tomb Raider30.318.610.4
Rainbow Six Siege56352013
Just Cause 335.629.616.214.5
Star Wars Battlefront56.533.315.213
Batman: Arkham Knight2721107
The Witcher 3301810
Dirt Rally82.632.819.512.7
Thief3423199
Total War: Rome II62.648.142.310.5
Metro: Last Light48.938.322.911.6
BioShock Infinite91514214
StarCraft II: Heart of the Swarm217.593.648.724.2
Tomb Raider137.862.734.417.3
Mafia 278.55745.827.5
< 30 fps
< 60 fps
< 120 fps
≥ 120 fps
1
8
4
2
6
7
2
10
5

12


For more games that might be playable and a list of all games and graphics cards visit our Gaming List

Add one or more devices and compare

In the following list you can select (and also search for) devices that should be added to the comparison. You can select more than one device.

restrict list:

show all (including archived), 2024, 2023
v1.26
log 05. 16:36:52

#0 no ids found in url (should be separated by "_") +0s ... 0s

#1 not redirecting to Ajax server +0s ... 0s

#2 did not recreate cache, as it is less than 5 days old! Created at Mon, 04 Mar 2024 05:34:43 +0100 +0.001s ... 0.001s

#3 composed specs +0.039s ... 0.039s

#4 did output specs +0s ... 0.04s

#5 start showIntegratedCPUs +0s ... 0.04s

#6 getting avg benchmarks for device 7063 +0.028s ... 0.067s

#7 got single benchmarks 7063 +0.013s ... 0.08s

#8 got avg benchmarks for devices +0s ... 0.08s

#9 min, max, avg, median took s +0.716s ... 0.796s

#10 before gaming benchmark output +0s ... 0.796s

#11 Got 76 rows for game benchmarks. +0.007s ... 0.803s

#12 composed SQL query for gamebenchmarks +0s ... 0.803s

#13 got data and put it in $dataArray +0.01s ... 0.813s

#14 benchmarks composed for output. +0.503s ... 1.315s

#15 return log +0.037s ... 1.352s

Please share our article, every link counts!

» Comparison of GPUs
Detailed list of all laptop GPUs sorted by class and performance.

» Benchmark List
Sort and restrict laptop GPUs based on performance in synthetic benchmarks.

» Notebook Gaming List
Playable games for each graphics card and their average FPS results.

Class 1

Class 2

Radeon PRO W6600M *

Class 3

UHD Graphics 32EUs
UHD Graphics 750

Class 4

Class 5

* Approximate position of the graphics adapter