Notebook reviews with NVIDIA GeForce RTX 2070 Super Max-Q graphics card
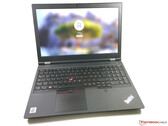
Lenovo ThinkPad T15g Laptop Review: A Gaming ThinkPad or a mobile workstation?
The ThinkPad T15g is a new product for Lenovo. You might think the designation as well as the GeForce RTX 2070 Super Max-Q GPU indicate a gaming device, but it ...
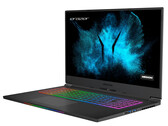
Intel Core i7-10750H | NVIDIA GeForce RTX 2070 Super Max-Q | 15.60" | 2.8 kgMedion Erazer Beast X10 (Tongfang GM7MPHP) in review: Stable, slim, compact gaming laptop with good battery life
The compact Erazer Beast X10 brings all the latest computer games smoothly onto the 17.3-inch matte display (Full HD, IPS, 144 Hz). The gaming laptop scores poi...
Intel Core i7-10750H | NVIDIA GeForce RTX 2070 Super Max-Q | 17.30" | 2.3 kgRazer Blade 15 GeForce RTX 2070 Super Max-Q Review: Same Laptop, But Faster
Not much has changed over last year's Blade 15 from a design perspective, but the new 10th gen 8-core Core i7-10875H will offer noticeable raw performance gains...
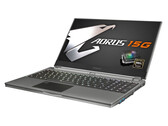
Intel Core i7-10875H | NVIDIA GeForce RTX 2070 Super Max-Q | 15.60" | 2.1 kgAorus 15G XB in review: Successful gaming machine with mechanical keyboard
The Aorus 15G XB brings all modern computer games smoothly onto the matte 15.6-inch screen (240 Hz, Full HD, IGZO). The rest of the equipment is also right: NVM...
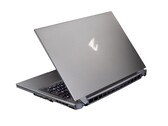
Intel Core i7-10875H | NVIDIA GeForce RTX 2070 Super Max-Q | 15.60" | 2.3 kgAorus 17G XB Laptop Review: The mechanical keyboard rocks
With the Aorus 17G, Gigabyte presents a complete redesign of the 17-inch gaming laptop. The mechanical keyboard is one of the most important newly introduced fe...
Intel Core i7-10875H | NVIDIA GeForce RTX 2070 Super Max-Q | 17.30" | 2.7 kgGigabyte Aero 15 OLED XB-8DE51B0SP: Intel Core i7-10875H, 15.60", 2.2 kg
Review » Gigabyte Aero 15 XB laptop review: Taking the lead with OLED
MSI GS66 Stealth 10SFS: Intel Core i9-10980HK, 15.60", 2.2 kg
Review » MSI GS66 Stealth 10SFS Laptop Review: Visually subdued, acoustically conspicuous
Gigabyte Aero 17 HDR XB: Intel Core i7-10875H, 17.30", 2.7 kg
Review » Gigabyte Aero 17 HDR XB Laptop Review: Super Max-Q at the Start
MSI Creator 15 A10SFS-287: Intel Core i7-10875H, 15.60", 1.9 kg
External Review » MSI Creator 15 A10SFS-287
Asus ROG Zephyrus M15 GU502LW-HN070T: Intel Core i7-10750H, 15.60", 2 kg
External Review » Asus ROG Zephyrus M15 GU502LW-HN070T
HP Omen 15-dh1267ng: Intel Core i7-10750H, 15.60", 2.5 kg
External Review » HP Omen 15-dh1267ng
MSI GS66 Stealth 10SFS-440: Intel Core i7-10875H, 15.60", 2.1 kg
External Review » MSI GS66 Stealth 10SFS-440
Lenovo Legion 7 15IMH05-81YT000TGE: Intel Core i7-10750H, 15.60", 2.3 kg
External Review » Lenovo Legion 7 15IMH05-81YT000TGE
Razer Blade 15 Advanced Edition, i7-10875H, RTX 2070 Super: Intel Core i7-10875H, 15.60", 2.2 kg
External Review » Razer Blade 15 Advanced Edition, i7-10875H, RTX 2070 Super
MSI GS66 Stealth 10SFS: Intel Core i9-10980HK, 15.60", 2.2 kg
External Review » MSI GS66 Stealth 10SFS
HP Omen 15-dh1770ng: Intel Core i7-10750H, 15.60", 2.7 kg
External Review » HP Omen 15-dh1770ng
Acer Predator Triton 500 PT515-52-71K5: Intel Core i7-10750H, 15.60", 2 kg
External Review » Acer Predator Triton 500 PT515-52-71K5
MSI Creator 17 A10SFS-269: Intel Core i7-10875H, 17.30", 2.5 kg
External Review » MSI Creator 17 A10SFS-269
Aorus 15G XB: Intel Core i7-10875H, 15.60", 2.3 kg
External Review » Aorus 15G XB
Alienware m17 R3-RW22J: Intel Core i7-10750H, 17.30", 3 kg
External Review » Alienware m17 R3-RW22J
Acer Predator Triton 500 PT515-52: Intel Core i7-10875H, 15.60", 2.1 kg
External Review » Acer Predator Triton 500 PT515-52
MSI GS75 10SFS-225 Stealth: Intel Core i9-10980HK, 17.30", 2.4 kg
External Review » MSI GS75 10SFS-225 Stealth
Gigabyte Aorus 17G XB: Intel Core i7-10875H, 17.30", 2.7 kg
External Review » Gigabyte Aorus 17G XB
MSI GS66 Stealth 10SFS-064IT: Intel Core i7-10750H, 15.60", 2.1 kg
External Review » MSI GS66 Stealth 10SFS-064IT
Aorus 17G XB: Intel Core i7-10875H, 17.30", 2.7 kg
External Review » Aorus 17G XB
Gigabyte Aero 17 HDR XB: Intel Core i7-10875H, 17.30", 2.7 kg
External Review » Gigabyte Aero 17 HDR XB
Gigabyte Aero 15 OLED XB-8DE51B0SP: Intel Core i7-10875H, 15.60", 2.2 kg
External Review » Gigabyte Aero 15 OLED XB-8DE51B0SP
Lenovo ThinkPad T15g-20UR000GGE: Intel Core i7-10750H, 15.60", 2.8 kg
» Lenovo's mobile workstation T15g appears a bit outdated
Medion Erazer Beast X10 MD61804: Intel Core i7-10750H, 17.30", 2.3 kg
» The Medion Erazer Beast X10 offers plenty of gaming power, a sober look, and a good level of features
Aorus 15G XB: Intel Core i7-10875H, 15.60", 2.3 kg
» The Core i7 processor in the Aorus 15G XB puts the pedal to the metal
Aorus 17G XB: Intel Core i7-10875H, 17.30", 2.7 kg
» Aorus 17G: Mechanical keyboard meets great battery life
Gigabyte Aero 15 OLED XB-8DE51B0SP: Intel Core i7-10875H, 15.60", 2.2 kg
» Podium spot thanks to OLED: Gigabyte Aero 15 XB
MSI GS66 Stealth 10SFS: Intel Core i9-10980HK, 15.60", 2.2 kg
» MSI GS66: Quite loud for a Stealth notebook
Gigabyte Aero 17 HDR XB: Intel Core i7-10875H, 17.30", 2.7 kg
» Gigabyte Aero 17 HDR XB: Versatile High-End Notebook