NVIDIA GeForce GTX 1660 Ti Mobile vs NVIDIA GeForce GTX 1050 Ti Mobile vs NVIDIA GeForce GTX 1650 Mobile
NVIDIA GeForce GTX 1660 Ti Mobile ► remove from comparison
The Nvidia GeForce GTX 1660 Ti for laptops is a mobile graphics card that is based on the Turing architecture (TU116 chip). Compared to the faster RTX 2000 GPUs (e.g. RTX 2060 ), the 1660Ti integrates no Raytracing or Tensor cores. The performance is similar to the old GTX 1070 (laptop) but at a reduced TGP of 80 Watt (versus 115 Watt). Compared to the desktop GTX 1660 Ti, the clock speeds are reduced (3% lower base, 10% lower boost).
In April 2020 Nvidia refreshed the GTX 1660 Ti with the new codename N18E-G0-A1 with similar specs and pin compatible to the refreshed RTX chips (e.g., RTX 2070 Super Mobile ).
The Turing generation did not only introduce raytracing for the RTX cards, but also optimized the architecture of the cores and caches. According to Nvidia the CUDA cores offer now a concurrent execution of floating point and integer operations for increased performance in compute-heavy workloads of modern games. Furthermore, the caches were reworked (new unified memory architecture with twice the cache compared to Pascal). This leads to up to 50% more instructions per clock and a 40% more power efficient usage compared to Pascal.
The power consumption of the 1660Ti for latops is specified at 80 Watt TGP (Total Graphics Power) by Nvidia and therefore 20 Watt higher than the efficient (and slower) Max-Q variant of the 1660 Ti . The TU116 chip is manufactured in 12nm FFN at TSMC.
NVIDIA GeForce GTX 1050 Ti Mobile ► remove from comparison
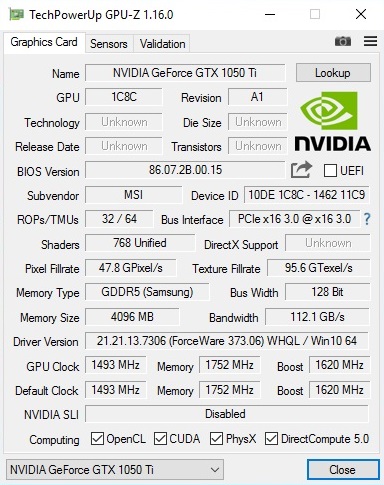
The Nvidia GTX 1050 Ti is a mainstream GPU based on the Pascal architecture and was announced in January 2017. Contrary to the faster models, the GTX 1050 uses the GP107 chip, which is manufactured in a 14 nm process at Samsung.
The notebook version differs a bit in terms of clocks, but is equipped with 768 shader units, just like the desktop model. It is shipped with up to 4 GB GDDR5-VRAM attached via 128-bit interface and a 7 Gbps memory data rate (112 GB/s).
Features
The GP107 chip is manufactured in a 14 nm FinFET process at Samsung and offers a number of new features, including support for DisplayPort 1.4 (ready), HDMI 2.0b, HDR, Simultaneous Multi-Projection (SMP) as well as improved H.265 video de- and encoding (PlayReady 3.0). A full list of improvements and the new Pascal desktop GPUs is available in our dedicated Pascal architecture article .
Performance
The performance of the GeForce GTX 1050 Ti can vary quite a lot depending on the cooling performance of the laptop. It can be just as fast as the desktop model under ideal conditions. The GeForce GTX 965M and the regular GTX 1050 are beaten by around 30%, so the GTX 1050 Ti is comparable to a GTX 970M in general. It is therefore an upper mainstream GPU. Games from 2016 can be played in high settings an the Full HD resolution.
Power Consumption
The power consumption of the GeForce GTX 1050 Ti is roughly on par with the old GTX 965M, which would mean around 70 Watts and (probably due to better selection and optimized parts) therefore slightly lower compared to the desktop counterpart. This means the graphics card will usually be used for powerful multimedia notebooks and entry-level gaming systems with at least 15.4 inches.
NVIDIA GeForce GTX 1650 Mobile ► remove from comparison
The Nvidia GeForce GTX 1650 for laptops is a mobile graphics card that is based on the Turing architecture (TU117 chip). Compared to the faster RTX 2000 GPUs (e.g. RTX 2060 ), the 1650 integrates no Raytracing or Tensor cores. The performance should be slightly faster than the old GeForce GTX 1050 Ti . Compared to the desktop version, the mobile GTX1650 can use all 1024 shaders of the TU117 chip, but there are also versions with 896 shaders.
Starting March 2020, the GTX 1650 Mobile is also available with fast 12 Gbits GDDR6 graphics memory (N18P-G61, 896 shaders) as a refresh.
The Turing generation did not only introduce raytracing for the RTX cards, but also optimized the architecture of the cores and caches. According to Nvidia the CUDA cores offer now a concurrent execution of floating point and integer operations for increased performance in compute-heavy workloads of modern games. Furthermore, the caches were reworked (new unified memory architecture with twice the cache compared to Pascal). This leads to 50% more instructions per clock and a 40% more power efficient usage compared to Pascal.
Compared to the bigger Turing chips (like the TU116 of the GTX 1660 Ti and the RTX lineup), the TU117 does not include the new NVENC encoder but an older one similar to the one used in Pascal and Volta.
The power consumption of the 1650 for laptops is specified at 50 Watt TGP (Total Graphics Power) by Nvidia and therefore 15 Watt higher than the efficient (and slower) Max-Q variant of the 1650 . The TU117 chip is manufactured in 12nm FFN at TSMC.
NVIDIA GeForce GTX 1660 Ti Mobile NVIDIA GeForce GTX 1050 Ti Mobile NVIDIA GeForce GTX 1650 Mobile GeForce GTX 1600 Series Codename N18E-G0 N17P-G1 N18P-G0, N18P-G61 Architecture Turing Pascal Turing Pipelines 1536 - unified 768 - unified 1024 - unified Core Speed 1455 - 1590 (Boost) MHz 1493 - 1620 (Boost) MHz 1380 - 1560 (Boost) MHz Memory Speed 12000 MHz 7000 MHz 12000 effective = 1500 MHz Memory Bus Width 192 Bit 128 Bit 128 Bit Memory Type GDDR6 GDDR5 GDDR5, GDDR6 Max. Amount of Memory 6 GB 4 GB 4 GB Shared Memory no no no API DirectX 12_1, OpenGL 4.6 DirectX 12_1, OpenGL 4.5 DirectX 12_1, OpenGL 4.6 Power Consumption 80 Watt 64 Watt 50 Watt Transistors 6.6 Billion technology 12 nm 14 nm 12 nm Notebook Size medium sized large medium sized Date of Announcement 23.04.2019 03.01.2017 23.04.2019 Link to Manufacturer Page www.nvidia.com www.nvidia.com Features Multi-Projection, G-SYNC, Vulkan, Multi Monitor TMUs 56 ROPs 32 Memory Bandwidth 192 GB/s PCIe 4.0
Benchmarks Performance Rating - 3DMark 11 + Fire Strike + Time Spy - GeForce GTX 1660 Ti Mobile
6.8 pt (20%)
...
NVIDIA GeForce GTX 1660 Ti Mobile
...
max:
Performance Rating - 3DMark 11 + Fire Strike + Time Spy - GeForce GTX 1050 Ti Mobile
3.5 pt (11%)
...
NVIDIA GeForce GTX 1050 Ti Mobile
...
max:
Performance Rating - 3DMark 11 + Fire Strike + Time Spy - GeForce GTX 1650 Mobile
4.2 pt (13%)
...
NVIDIA GeForce GTX 1650 Mobile
...
max:
3DMark - 3DMark Time Spy Score
min: 4946 avg: 5717 median: 5697 (16%) max: 6261 Points
min: 2196 avg: 2451 median: 2450.5 (7%) max: 2659 Points
min: 3080 avg: 3562 median: 3595.5 (10%) max: 3978 Points
GPU TDP ? TDP 30 W TDP 35 W TDP 40 W 100% 84% 78% 85%
3DMark - 3DMark Time Spy Graphics
min: 5335 avg: 5653 median: 5659 (15%) max: 6123 Points
min: 1990 avg: 2309 median: 2326 (6%) max: 2536 Points
min: 2900 avg: 3430 median: 3488 (9%) max: 3700 Points
GPU TDP ? TDP 30 W TDP 35 W TDP 40 W 100% 78% 74% 80%
3DMark - 3DMark Ice Storm Unlimited Graphics
min: 412820 avg: 418846 median: 419800 (48%) max: 424615 Points
min: 263754 avg: 302047 median: 299188 (34%) max: 361459 Points
min: 200727 avg: 325249 median: 364872 (41%) max: 392682 Points
GPU TDP ? TDP 40 W 84% 100%
3DMark - 3DMark Ice Storm Extreme Graphics
min: 129343 avg: 199337 median: 162584 (21%) max: 316086 Points
min: 71804 avg: 128005 median: 123176 (16%) max: 221173 Points
min: 57517 avg: 91494 median: 82623.5 (11%) max: 141041 Points
3DMark - 3DMark Cloud Gate Score
min: 29390 avg: 34346 median: 35118.5 (38%) max: 38136 Points
min: 15924 avg: 22208 median: 22393 (24%) max: 27750 Points
min: 16079 avg: 24781 median: 25707 (27%) max: 30573 Points
GPU TDP ? TDP 40 W 87% 100%
3DMark - 3DMark Cloud Gate Graphics
min: 59839 avg: 94171 median: 97517 (26%) max: 104780 Points
min: 43721 avg: 50013 median: 50514 (13%) max: 53978 Points
min: 38016 avg: 55346 median: 57365 (15%) max: 66073 Points
GPU TDP ? TDP 40 W 100% 92%
3DMark - 3DMark Fire Strike Standard Score
min: 12263 avg: 13237 median: 13140 (23%) max: 14649 Points
min: 6286 avg: 6745 median: 6703.5 (12%) max: 7194 Points
min: 6909 avg: 8152 median: 8081 (14%) max: 9201 Points
GPU TDP ? TDP 30 W TDP 35 W TDP 40 W 100% 87% 84% 88%
3DMark - 3DMark Fire Strike Standard Graphics
min: 14186 avg: 14867 median: 14818 (17%) max: 16488 Points
min: 6792 avg: 7743 median: 7740.5 (9%) max: 8376 Points
min: 7741 avg: 9195 median: 9313 (11%) max: 9810 Points
GPU TDP ? TDP 30 W TDP 35 W TDP 40 W 100% 82% 79% 85%
3DMark - 3DMark Ice Storm Graphics
min: 129020 avg: 194329 median: 163522 (20%) max: 359516 Points
min: 71954 avg: 137009 median: 123774 (15%) max: 245011 Points
min: 60813 avg: 106107 median: 85847 (10%) max: 161091 Points
3DMark - 3DMark Wild Life Unlimited
20519 Points (10%)
3DMark - 3DMark Night Raid
min: 32203 avg: 33044 median: 33043.5 (31%) max: 33884 Points
27315 Points (26%)
3DMark - 3DMark Night Raid Graphics Score
min: 63349 avg: 66325 median: 66325 (26%) max: 69301 Points
38744 Points (15%)
3DMark 11 - 3DM11 Performance Score
min: 15912 avg: 17361 median: 17351 (24%) max: 19342 Points
min: 8426 avg: 9136 median: 9117 (13%) max: 9921 Points
min: 9774 avg: 11678 median: 11788 (16%) max: 13143 Points
GPU TDP ? TDP 30 W TDP 35 W TDP 40 W 100% 97% 88% 96%
3DMark 11 - 3DM11 Performance GPU
min: 18610 avg: 20096 median: 20118.5 (17%) max: 22670 Points
min: 8304 avg: 9591 median: 9615.5 (8%) max: 10402 Points
min: 10885 avg: 12797 median: 13131.5 (11%) max: 13575 Points
GPU TDP ? TDP 30 W TDP 35 W TDP 40 W 100% 85% 81% 84%
3DMark Vantage + NVIDIA GeForce GTX 1660 Ti Mobile 3DMark Vantage - 3DM Vant. Perf. total
49309 Points (14%)
3DM Vant. Perf. total + NVIDIA GeForce GTX 1050 Ti Mobile
30690 Points (9%)
3DM Vant. Perf. total + NVIDIA GeForce GTX 1650 Mobile
min: 27719 avg: 31311 median: 31310.5 (9%) max: 34902 Points
3DM Vant. Perf. GPU no PhysX + NVIDIA GeForce GTX 1660 Ti Mobile 3DMark Vantage - 3DM Vant. Perf. GPU no PhysX
52230 Points (30%)
3DM Vant. Perf. GPU no PhysX + NVIDIA GeForce GTX 1050 Ti Mobile
32349 Points (18%)
3DM Vant. Perf. GPU no PhysX + NVIDIA GeForce GTX 1650 Mobile
min: 28940 avg: 33810 median: 33809.5 (19%) max: 38679 Points
3DMark 05 - 3DMark 05 - Standard
24001 Points (26%)
3DMark 06 3DMark 06 - Standard 1280x1024 + NVIDIA GeForce GTX 1660 Ti Mobile
min: 36563 avg: 37825 median: 38153.5 (50%) max: 38429 Points
3DMark 06 - Standard 1280x1024 + NVIDIA GeForce GTX 1050 Ti Mobile
min: 22498 avg: 28281 median: 27473 (36%) max: 34938 Points
3DMark 06 - Standard 1280x1024 + NVIDIA GeForce GTX 1650 Mobile
min: 23061 avg: 33654 median: 34484.5 (45%) max: 40902 Points
3DMark 06 - Standard 1024x768 + NVIDIA GeForce GTX 1650 Mobile
42416 Points (55%)
Model CPU GPU RAM Value 3DMark 06 - Standard 1024x768 Acer Nitro 5 AN517-41-R3FK R7 5800H GeForce GTX 1650 Mobile 1380 / 1500 MHz 4 GB 16 GB 42416
Unigine Valley 1.0 - Unigine Valley 1.0 DX
40.4 fps (13%)
Unigine Heaven 3.0 - Unigine Heaven 3.0 DX 11
100.6 fps (33%)
Unigine Heaven 3.0 - Unigine Heaven 3.0 OpenGL
97.6 fps (43%)
Unigine Heaven 2.1 - Heaven 2.1 high
120 fps (23%)
Blender - Blender 3.3 Classroom CUDA *
94 Seconds (14%)
Blender - Blender 3.3 Classroom OPTIX *
95 Seconds (35%)
SPECviewperf 11 + NVIDIA GeForce GTX 1050 Ti Mobile SPECviewperf 11 - specvp11 snx-01
min: 9.44 avg: 9.6 median: 9.7 (6%) max: 9.83 fps
specvp11 tcvis-02 + NVIDIA GeForce GTX 1050 Ti Mobile SPECviewperf 11 - specvp11 tcvis-02
min: 2.76 avg: 2.9 median: 2.8 (2%) max: 3 fps
specvp11 sw-02 + NVIDIA GeForce GTX 1050 Ti Mobile SPECviewperf 11 - specvp11 sw-02
min: 16.34 avg: 19.2 median: 20.3 (15%) max: 21.14 fps
specvp11 proe-05 + NVIDIA GeForce GTX 1050 Ti Mobile SPECviewperf 11 - specvp11 proe-05
min: 2.71 avg: 2.8 median: 2.9 (3%) max: 2.91 fps
specvp11 maya-03 + NVIDIA GeForce GTX 1050 Ti Mobile SPECviewperf 11 - specvp11 maya-03
min: 17.59 avg: 20.2 median: 20.6 (16%) max: 22.3 fps
specvp11 lightwave-01 + NVIDIA GeForce GTX 1050 Ti Mobile SPECviewperf 11 - specvp11 lightwave-01
min: 20.4 avg: 21.9 median: 22 (24%) max: 23.13 fps
specvp11 ensight-04 + NVIDIA GeForce GTX 1050 Ti Mobile SPECviewperf 11 - specvp11 ensight-04
min: 46.99 avg: 49.5 median: 47.5 (23%) max: 53.9 fps
specvp11 catia-03 + NVIDIA GeForce GTX 1050 Ti Mobile SPECviewperf 11 - specvp11 catia-03
min: 16.49 avg: 18.3 median: 18.1 (10%) max: 20.23 fps
SPECviewperf 12 + NVIDIA GeForce GTX 1660 Ti Mobile SPECviewperf 12 - specvp12 sw-03
44.7 fps (11%)
specvp12 sw-03 + NVIDIA GeForce GTX 1050 Ti Mobile
min: 33.94 avg: 34.7 median: 34.5 (9%) max: 35.91 fps
specvp12 snx-02 + NVIDIA GeForce GTX 1660 Ti Mobile SPECviewperf 12 - specvp12 snx-02
8.2 fps (1%)
specvp12 snx-02 + NVIDIA GeForce GTX 1050 Ti Mobile
min: 4.8 avg: 5 median: 5 (1%) max: 5.14 fps
specvp12 showcase-01 + NVIDIA GeForce GTX 1660 Ti Mobile SPECviewperf 12 - specvp12 showcase-01
74.4 fps (16%)
specvp12 showcase-01 + NVIDIA GeForce GTX 1050 Ti Mobile
min: 33.64 avg: 34.8 median: 34.3 (7%) max: 36.96 fps
specvp12 mediacal-01 + NVIDIA GeForce GTX 1660 Ti Mobile SPECviewperf 12 - specvp12 mediacal-01
34.5 fps (9%)
specvp12 mediacal-01 + NVIDIA GeForce GTX 1050 Ti Mobile
min: 17.2 avg: 21.1 median: 21.5 (5%) max: 24.31 fps
specvp12 maya-04 + NVIDIA GeForce GTX 1660 Ti Mobile SPECviewperf 12 - specvp12 maya-04
71.5 fps (19%)
specvp12 maya-04 + NVIDIA GeForce GTX 1050 Ti Mobile
min: 57.8 avg: 60.5 median: 60.5 (16%) max: 63.3 fps
specvp12 energy-01 + NVIDIA GeForce GTX 1660 Ti Mobile SPECviewperf 12 - specvp12 energy-01
7.7 fps (7%)
specvp12 energy-01 + NVIDIA GeForce GTX 1050 Ti Mobile
min: 2.33 avg: 3.7 median: 3.9 (3%) max: 4.62 fps
specvp12 creo-01 + NVIDIA GeForce GTX 1660 Ti Mobile SPECviewperf 12 - specvp12 creo-01
38.4 fps (15%)
specvp12 creo-01 + NVIDIA GeForce GTX 1050 Ti Mobile
min: 18.58 avg: 19.2 median: 19.2 (8%) max: 19.55 fps
specvp12 catia-04 + NVIDIA GeForce GTX 1660 Ti Mobile SPECviewperf 12 - specvp12 catia-04
61.5 fps (10%)
specvp12 catia-04 + NVIDIA GeForce GTX 1050 Ti Mobile
min: 29.33 avg: 31.3 median: 31.2 (5%) max: 33.22 fps
specvp12 3dsmax-05 + NVIDIA GeForce GTX 1660 Ti Mobile SPECviewperf 12 - specvp12 3dsmax-05
146.5 fps (26%)
SPECviewperf 13 specvp13 sw-04 + NVIDIA GeForce GTX 1660 Ti Mobile SPECviewperf 13 - specvp13 sw-04
min: 64.8 avg: 65 median: 65 (17%) max: 65.1 fps
specvp13 sw-04 + NVIDIA GeForce GTX 1650 Mobile
54.5 fps (15%)
specvp13 snx-03 + NVIDIA GeForce GTX 1660 Ti Mobile SPECviewperf 13 - specvp13 snx-03
min: 14.49 avg: 14.7 median: 14.7 (2%) max: 14.81 fps
specvp13 snx-03 + NVIDIA GeForce GTX 1650 Mobile
11.8 fps (1%)
specvp13 showcase-02 + NVIDIA GeForce GTX 1660 Ti Mobile SPECviewperf 13 - specvp13 showcase-02
min: 73.8 avg: 74.2 median: 74.2 (16%) max: 74.6 fps
specvp13 showcase-02 + NVIDIA GeForce GTX 1650 Mobile
41.2 fps (9%)
specvp13 medical-02 + NVIDIA GeForce GTX 1660 Ti Mobile SPECviewperf 13 - specvp13 medical-02
min: 38.27 avg: 38.6 median: 38.6 (8%) max: 38.99 fps
specvp13 medical-02 + NVIDIA GeForce GTX 1650 Mobile
28.1 fps (6%)
specvp13 maya-05 + NVIDIA GeForce GTX 1660 Ti Mobile SPECviewperf 13 - specvp13 maya-05
min: 165.2 avg: 166.2 median: 166.2 (19%) max: 167.1 fps
specvp13 maya-05 + NVIDIA GeForce GTX 1650 Mobile
120.4 fps (14%)
specvp13 energy-02 + NVIDIA GeForce GTX 1660 Ti Mobile SPECviewperf 13 - specvp13 energy-02
min: 10.18 avg: 10.5 median: 10.5 (3%) max: 10.81 fps
specvp13 creo-02 + NVIDIA GeForce GTX 1660 Ti Mobile SPECviewperf 13 - specvp13 creo-02
min: 117.1 avg: 118.9 median: 118.9 (17%) max: 120.7 fps
specvp13 creo-02 + NVIDIA GeForce GTX 1650 Mobile
85.6 fps (13%)
specvp13 catia-05 + NVIDIA GeForce GTX 1660 Ti Mobile SPECviewperf 13 - specvp13 catia-05
min: 85.4 avg: 86.4 median: 86.4 (10%) max: 87.4 fps
specvp13 catia-05 + NVIDIA GeForce GTX 1650 Mobile
61.2 fps (7%)
specvp13 3dsmax-06 + NVIDIA GeForce GTX 1660 Ti Mobile SPECviewperf 13 - specvp13 3dsmax-06
min: 138.8 avg: 140.7 median: 140.7 (24%) max: 142.5 fps
specvp13 3dsmax-06 + NVIDIA GeForce GTX 1650 Mobile
103 fps (18%)
Cinebench R10 Cinebench R10 Shading (32bit) + NVIDIA GeForce GTX 1660 Ti Mobile Cinebench R10 - Cinebench R10 Shading (32bit)
min: 4020 avg: 8599 median: 8212 (6%) max: 12878 Points
Cinebench R10 Shading (32bit) + NVIDIA GeForce GTX 1050 Ti Mobile
min: 3770 avg: 6623 median: 6756 (5%) max: 10841 Points
Cinebench R10 Shading (32bit) + NVIDIA GeForce GTX 1650 Mobile
min: 6572 avg: 8609 median: 6821 (5%) max: 14363 Points
Cinebench R11.5 Cinebench R11.5 OpenGL 64 Bit + NVIDIA GeForce GTX 1660 Ti Mobile Cinebench R11.5 - Cinebench R11.5 OpenGL 64 Bit
min: 73.8 avg: 76.5 median: 76.9 (27%) max: 78.3 fps
Cinebench R11.5 OpenGL 64 Bit + NVIDIA GeForce GTX 1050 Ti Mobile
min: 53.7 avg: 66.3 median: 66.9 (23%) max: 82.4 fps
Cinebench R11.5 OpenGL 64 Bit + NVIDIA GeForce GTX 1650 Mobile
min: 69.6 avg: 84.9 median: 88 (30%) max: 94 fps
Cinebench R15 + NVIDIA GeForce GTX 1660 Ti Mobile Cinebench R15 - Cinebench R15 OpenGL 64 Bit
min: 95.5 avg: 122.8 median: 120.6 (7%) max: 148.2 fps
Cinebench R15 OpenGL 64 Bit + NVIDIA GeForce GTX 1050 Ti Mobile
min: 57.3 avg: 99.3 median: 99.7 (6%) max: 131.5 fps
Cinebench R15 OpenGL 64 Bit + NVIDIA GeForce GTX 1650 Mobile
min: 73.3 avg: 108.6 median: 103.6 (6%) max: 160 fps
GPU TDP ? TDP 30 W TDP 35 W TDP 40 W 67% 100% 50% 91%
Cinebench R15 OpenGL Ref. Match 64 Bit + NVIDIA GeForce GTX 1660 Ti Mobile Cinebench R15 - Cinebench R15 OpenGL Ref. Match 64 Bit
min: 99.6 avg: 99.6 median: 99.6 (100%) max: 100 %
Cinebench R15 OpenGL Ref. Match 64 Bit + NVIDIA GeForce GTX 1050 Ti Mobile
99.6 % (100%)
Cinebench R15 OpenGL Ref. Match 64 Bit + NVIDIA GeForce GTX 1650 Mobile
min: 99.6 avg: 99.6 median: 99.6 (100%) max: 100 %
GPU TDP ? TDP 30 W TDP 35 W TDP 40 W 100% 100% 100% 100%
GFXBench - GFXBench 5.0 Aztec Ruins High Tier Offscreen
87.1 fps (16%)
GFXBench - GFXBench 5.0 Aztec Ruins Normal Tier Offscreen
225.5 fps (17%)
GFXBench - GFXBench Car Chase Offscreen
250.7 fps (28%)
min: 170.1 avg: 177.1 median: 177.1 (20%) max: 184.1 fps
GFXBench 3.1 - GFXBench Manhattan ES 3.1 Offscreen
272.9 fps (6%)
GFXBench 3.0 - GFXBench 3.0 Manhattan Offscreen
322.4 fps (19%)
331 fps (19%)
GFXBench (DX / GLBenchmark) 2.7 + NVIDIA GeForce GTX 1650 Mobile GFXBench (DX / GLBenchmark) 2.7 - GFXBench T-Rex HD Offscreen C24Z16
775 fps (6%)
Geekbench 6.2 - Geekbench 6.2 GPU OpenCL
67604 Points (20%)
Geekbench 6.2 - Geekbench 6.2 GPU Vulkan
60065 Points (20%)
LuxMark v2.0 64Bit - LuxMark v2.0 Room GPU
2416 Samples/s (11%)
min: 1292 avg: 1395 median: 1425 (6%) max: 1497 Samples/s
min: 1294 avg: 1479 median: 1478.5 (7%) max: 1663 Samples/s
LuxMark v2.0 64Bit - LuxMark v2.0 Sala GPU
4827 Samples/s (8%)
min: 2529 avg: 2689 median: 2646 (5%) max: 2891 Samples/s
min: 2474 avg: 2873 median: 2872.5 (5%) max: 3271 Samples/s
ComputeMark v2.1 - ComputeMark v2.1 Result
10148 Points (11%)
min: 589 avg: 4397 median: 5380 (6%) max: 5520 Points
min: 6891 avg: 6931 median: 6931 (7%) max: 6971 Points
Power Consumption - Furmark Stress Test Power Consumption - external Monitor *
139 Watt (20%)
min: 100 avg: 101 median: 101 (14%) max: 102 Watt
min: 52.5 avg: 79.8 median: 91 (13%) max: 100 Watt
GPU TDP ? TDP 30 W TDP 35 W TDP 40 W 100% 107% 108% 101%
Power Consumption - The Witcher 3 Power Consumption - external Monitor *
min: 139 avg: 146.5 median: 146.5 (20%) max: 154 Watt
min: 70.1 avg: 86.6 median: 86.6 (12%) max: 103 Watt
min: 55.9 avg: 81 median: 85.8 (12%) max: 94.3 Watt
GPU TDP ? TDP 30 W TDP 40 W 100% 107% 103%
Power Consumption - Witcher 3 Power Consumption *
min: 126 avg: 138.5 median: 134.1 (29%) max: 158.9 Watt
min: 75.3 avg: 99.5 median: 98 (22%) max: 124.4 Watt
min: 57.3 avg: 88.8 median: 90.9 (20%) max: 109 Watt
GPU TDP ? TDP 30 W TDP 35 W TDP 40 W 100% 104% 114% 109%
Power Consumption - Witcher 3 ultra Power Efficiency
min: 0.3247 avg: 0.4 median: 0.4 (39%) max: 0.4546 fps per Watt
min: 0.2122 avg: 0.3 median: 0.3 (25%) max: 0.3889 fps per Watt
min: 0.3111 avg: 0.4 median: 0.4 (37%) max: 0.534 fps per Watt
GPU TDP ? TDP 30 W TDP 35 W TDP 40 W 68% 66% 100% 90%
Power Consumption - Witcher 3 ultra Power Efficiency - external Monitor
min: 0.3591 avg: 0.4 median: 0.4 (31%) max: 0.3899 fps per Watt
min: 0.2476 avg: 0.3 median: 0.3 (26%) max: 0.3738 fps per Watt
min: 0.3991 avg: 0.5 median: 0.4 (35%) max: 0.585 fps per Watt
GPU TDP ? TDP 30 W TDP 40 W 68% 100% 72%
Emissions Witcher 3 Fan Noise + NVIDIA GeForce GTX 1660 Ti Mobile Emissions - Witcher 3 Fan Noise
min: 44 avg: 50.7 median: 50.1 (80%) max: 60.8 dB(A)
Witcher 3 Fan Noise + NVIDIA GeForce GTX 1050 Ti Mobile
min: 36.4 avg: 43.8 median: 44.4 (71%) max: 49 dB(A)
Witcher 3 Fan Noise + NVIDIA GeForce GTX 1650 Mobile
min: 35.2 avg: 44.2 median: 45.7 (73%) max: 52 dB(A)
GPU TDP ? TDP 30 W TDP 40 W 94% 100% 85%
Clock Speed - GPU Clock Witcher 3 ultra
min: 1545 avg: 1661 median: 1650 (65%) max: 1815 MHz
min: 1414 avg: 1667 median: 1696 (67%) max: 1721 MHz
min: 1570 avg: 1685 median: 1680 (66%) max: 1770 MHz
Clock Speed - GPU Clock Speed Furmark
855 MHz (34%)
min: 1444 avg: 1545 median: 1544.5 (61%) max: 1645 MHz
min: 713 avg: 1225 median: 1273 (50%) max: 1689 MHz
Average Benchmarks NVIDIA GeForce GTX 1660 Ti Mobile → 100% n=23 Average Benchmarks NVIDIA GeForce GTX 1050 Ti Mobile → 71% n=23 Average Benchmarks NVIDIA GeForce GTX 1650 Mobile → 76% n=23
- Range of benchmark values for this graphics card
- Average benchmark values for this graphics card
* Smaller numbers mean a higher performance
1 This benchmark is not used for the average calculation
Game Benchmarks The following benchmarks stem from our benchmarks of review laptops. The performance depends on the used graphics memory, clock rate, processor, system settings, drivers, and operating systems. So the results don't have to be representative for all laptops with this GPU. For detailed information on the benchmark results, click on the fps number.
100%
GeForce GTX 1660 Ti Mobile:
79 [X] Lenovo Legion 5 15IMH05H 81Y600D7GE Intel Core i5-10300H 2.5GHz
GeForce GTX 1660 Ti Mobile
min:
30 fps, max:
142 fps
fps
100%
GeForce GTX 1660 Ti Mobile:
71 [X] Lenovo Legion 5 15IMH05H 81Y600D7GE Intel Core i5-10300H 2.5GHz
GeForce GTX 1660 Ti Mobile
min:
44 fps, max:
115 fps
fps
100%
GeForce GTX 1660 Ti Mobile:
55 [X] Lenovo Legion 5 15IMH05H 81Y600D7GE Intel Core i5-10300H 2.5GHz
GeForce GTX 1660 Ti Mobile
min:
36 fps, max:
102 fps
fps
100%
GeForce GTX 1660 Ti Mobile:
48 [X] Lenovo Legion 5 15IMH05H 81Y600D7GE Intel Core i5-10300H 2.5GHz
GeForce GTX 1660 Ti Mobile
min:
31 fps, max:
84 fps
fps
100%
GeForce GTX 1660 Ti Mobile:
49.5 [X] Lenovo Legion 5 15IMH05H 81Y600D7GE Intel Core i5-10300H 2.5GHz
GeForce GTX 1660 Ti Mobile
min:
22.7 fps, P0.1:
28.1 fps, P1:
33.6 fps, max:
101.7 fps
fps
52%
GeForce GTX 1650 Mobile:
25.5 [X] Lenovo ThinkBook 15p G2 ITH 21B1000WGE Intel Core i5-11400H 2.7GHz
GeForce GTX 1650 Mobile
min:
17.2 fps, P0.1:
17.4 fps, P1:
18 fps, max:
44.1 fps
fps
100%
GeForce GTX 1660 Ti Mobile:
41.2 [X] Lenovo Legion 5 15IMH05H 81Y600D7GE Intel Core i5-10300H 2.5GHz
GeForce GTX 1660 Ti Mobile
min:
19.3 fps, P0.1:
21.5 fps, P1:
29.5 fps, max:
81.8 fps
fps
56%
GeForce GTX 1650 Mobile:
23 [X] Lenovo ThinkBook 15p G2 ITH 21B1000WGE Intel Core i5-11400H 2.7GHz
GeForce GTX 1650 Mobile
min:
16 fps, P0.1:
16.1 fps, P1:
16.7 fps, max:
40.5 fps
fps
100%
GeForce GTX 1660 Ti Mobile:
34.2 [X] Lenovo Legion 5 15IMH05H 81Y600D7GE Intel Core i5-10300H 2.5GHz
GeForce GTX 1660 Ti Mobile
min:
20.5 fps, P0.1:
21 fps, P1:
22.9 fps, max:
128.4 fps
fps
44%
GeForce GTX 1650 Mobile:
15.1 [X] Lenovo ThinkBook 15p G2 ITH 21B1000WGE Intel Core i5-11400H 2.7GHz
GeForce GTX 1650 Mobile
min:
9.45 fps, P0.1:
9.46 fps, P1:
9.59 fps, max:
28.3 fps
fps
100%
GeForce GTX 1660 Ti Mobile:
26.9 [X] Lenovo Legion 5 15IMH05H 81Y600D7GE Intel Core i5-10300H 2.5GHz
GeForce GTX 1660 Ti Mobile
min:
12.9 fps, P0.1:
14.4 fps, P1:
16.1 fps, max:
71 fps
fps
45%
GeForce GTX 1650 Mobile:
12.1 [X] Lenovo ThinkBook 15p G2 ITH 21B1000WGE Intel Core i5-11400H 2.7GHz
GeForce GTX 1650 Mobile
min:
6.89 fps, P0.1:
6.96 fps, P1:
7.21 fps, max:
22.9 fps
fps
100%
GeForce GTX 1660 Ti Mobile:
80.5 [X] Lenovo Legion 5 15IMH05H 81Y600D7GE Intel Core i5-10300H 2.5GHz
GeForce GTX 1660 Ti Mobile
min:
1.215 fps, P0.1:
15.9 fps, P1:
56.3 fps, max:
147.6 fps
fps
63%
GeForce GTX 1650 Mobile:
50.6 [X] Lenovo ThinkBook 15p G2 ITH 21B1000WGE Intel Core i5-11400H 2.7GHz
GeForce GTX 1650 Mobile
min:
6.87 fps, P0.1:
24.1 fps, P1:
41.6 fps, max:
96.8 fps
fps
100%
GeForce GTX 1660 Ti Mobile:
69.9 [X] Lenovo Legion 5 15IMH05H 81Y600D7GE Intel Core i5-10300H 2.5GHz
GeForce GTX 1660 Ti Mobile
min:
29.3 fps, P0.1:
36.7 fps, P1:
48.4 fps, max:
120.4 fps
fps
63%
GeForce GTX 1650 Mobile:
43.8 [X] Lenovo ThinkBook 15p G2 ITH 21B1000WGE Intel Core i5-11400H 2.7GHz
GeForce GTX 1650 Mobile
min:
18.4 fps, P0.1:
24 fps, P1:
35.6 fps, max:
100.8 fps
fps
100%
GeForce GTX 1660 Ti Mobile:
55.3 [X] Lenovo Legion 5 15IMH05H 81Y600D7GE Intel Core i5-10300H 2.5GHz
GeForce GTX 1660 Ti Mobile
min:
24.7 fps, P0.1:
25.9 fps, P1:
35.7 fps, max:
98 fps
fps
61%
GeForce GTX 1650 Mobile:
33.6 [X] Lenovo ThinkBook 15p G2 ITH 21B1000WGE Intel Core i5-11400H 2.7GHz
GeForce GTX 1650 Mobile
min:
14.4 fps, P0.1:
23.7 fps, P1:
27.3 fps, max:
68.3 fps
fps
100%
GeForce GTX 1660 Ti Mobile:
50.7 [X] Lenovo Legion 5 15IMH05H 81Y600D7GE Intel Core i5-10300H 2.5GHz
GeForce GTX 1660 Ti Mobile
min:
21.1 fps, P0.1:
23.5 fps, P1:
28.4 fps, max:
111 fps
fps
61%
GeForce GTX 1650 Mobile:
31 [X] Lenovo ThinkBook 15p G2 ITH 21B1000WGE Intel Core i5-11400H 2.7GHz
GeForce GTX 1650 Mobile
min:
13.7 fps, P0.1:
14.8 fps, P1:
24.9 fps, max:
91.4 fps
fps
100%
GeForce GTX 1660 Ti Mobile:
302 [X] Lenovo Legion 5 15IMH05H 81Y600D7GE Intel Core i5-10300H 2.5GHz
GeForce GTX 1660 Ti Mobile
min:
13.8 fps, P0.1:
91.9 fps, P1:
203 fps, max:
478 fps
fps
96%
GeForce GTX 1650 Mobile:
291 [X] Lenovo ThinkBook 15p G2 ITH 21B1000WGE Intel Core i5-11400H 2.7GHz
GeForce GTX 1650 Mobile
min:
15.6 fps, P0.1:
100.8 fps, P1:
183.1 fps, max:
468 fps
fps
100%
GeForce GTX 1660 Ti Mobile:
291 [X] Lenovo Legion 5 15IMH05H 81Y600D7GE Intel Core i5-10300H 2.5GHz
GeForce GTX 1660 Ti Mobile
min:
12.9 fps, P0.1:
118 fps, P1:
178.6 fps, max:
469 fps
fps
73%
GeForce GTX 1650 Mobile:
211 [X] Lenovo ThinkBook 15p G2 ITH 21B1000WGE Intel Core i5-11400H 2.7GHz
GeForce GTX 1650 Mobile
min:
14.9 fps, P0.1:
99.1 fps, P1:
149.9 fps, max:
361 fps
fps
100%
GeForce GTX 1660 Ti Mobile:
283 [X] Lenovo Legion 5 15IMH05H 81Y600D7GE Intel Core i5-10300H 2.5GHz
GeForce GTX 1660 Ti Mobile
min:
13.4 fps, P0.1:
97.9 fps, P1:
174.3 fps, max:
434 fps
fps
69%
GeForce GTX 1650 Mobile:
196.6 [X] Lenovo ThinkBook 15p G2 ITH 21B1000WGE Intel Core i5-11400H 2.7GHz
GeForce GTX 1650 Mobile
min:
15.1 fps, P0.1:
105.3 fps, P1:
152.9 fps, max:
324 fps
fps
100%
GeForce GTX 1660 Ti Mobile:
143 [X] Lenovo Legion 5 15IMH05H 81Y600D7GE Intel Core i5-10300H 2.5GHz
GeForce GTX 1660 Ti Mobile
min:
19.1 fps, P0.1:
83.2 fps, P1:
98.6 fps, max:
239 fps
fps
58%
GeForce GTX 1650 Mobile:
83.5 [X] Lenovo ThinkBook 15p G2 ITH 21B1000WGE Intel Core i5-11400H 2.7GHz
GeForce GTX 1650 Mobile
min:
23.2 fps, P0.1:
28.8 fps, P1:
47.1 fps, max:
137.3 fps
fps
100%
GeForce GTX 1660 Ti Mobile:
105.6 [X] Lenovo Legion 5 15IMH05H 81Y600D7GE Intel Core i5-10300H 2.5GHz
GeForce GTX 1660 Ti Mobile
min:
32.8 fps, P0.1:
46.6 fps, P1:
61 fps, max:
173.5 fps
fps
68%
GeForce GTX 1650 Mobile:
71.3 [X] Lenovo ThinkBook 15p G2 ITH 21B1000WGE Intel Core i5-11400H 2.7GHz
GeForce GTX 1650 Mobile
min:
11.6 fps, P0.1:
21.1 fps, P1:
33.4 fps, max:
127.5 fps
fps
100%
GeForce GTX 1660 Ti Mobile:
101.4 [X] Lenovo Legion 5 15IMH05H 81Y600D7GE Intel Core i5-10300H 2.5GHz
GeForce GTX 1660 Ti Mobile
min:
24.2 fps, P0.1:
45.1 fps, P1:
61.8 fps, max:
170 fps
fps
63%
GeForce GTX 1650 Mobile:
63.5 [X] Lenovo ThinkBook 15p G2 ITH 21B1000WGE Intel Core i5-11400H 2.7GHz
GeForce GTX 1650 Mobile
min:
19.2 fps, P0.1:
19.6 fps, P1:
28.3 fps, max:
114.5 fps
fps
100%
GeForce GTX 1660 Ti Mobile:
74.4 [X] Lenovo Legion 5 15IMH05H 81Y600D7GE Intel Core i5-10300H 2.5GHz
GeForce GTX 1660 Ti Mobile
min:
21.3 fps, P0.1:
31.7 fps, P1:
44.1 fps, max:
140.6 fps
fps
56%
GeForce GTX 1650 Mobile:
41.3 [X] Lenovo ThinkBook 15p G2 ITH 21B1000WGE Intel Core i5-11400H 2.7GHz
GeForce GTX 1650 Mobile
min:
16.4 fps, P0.1:
16.8 fps, P1:
23.7 fps, max:
128.2 fps
fps
100%
GeForce GTX 1660 Ti Mobile:
136.3 [X] Lenovo Legion 5 15IMH05H 81Y600D7GE Intel Core i5-10300H 2.5GHz
GeForce GTX 1660 Ti Mobile
min:
30.6 fps, P0.1:
62.6 fps, P1:
82.1 fps, max:
225 fps
fps
74%
GeForce GTX 1650 Mobile:
100.2 [X] Lenovo ThinkBook 15p G2 ITH 21B1000WGE Intel Core i5-11400H 2.7GHz
GeForce GTX 1650 Mobile
min:
62.4 fps, P0.1:
64 fps, P1:
70.3 fps, max:
149.6 fps
fps
100%
GeForce GTX 1660 Ti Mobile:
112.2 [X] Lenovo Legion 5 15IMH05H 81Y600D7GE Intel Core i5-10300H 2.5GHz
GeForce GTX 1660 Ti Mobile
min:
61.5 fps, P0.1:
68.7 fps, P1:
80 fps, max:
169.6 fps
fps
63%
GeForce GTX 1650 Mobile:
70.4 [X] Lenovo ThinkBook 15p G2 ITH 21B1000WGE Intel Core i5-11400H 2.7GHz
GeForce GTX 1650 Mobile
min:
39.8 fps, P0.1:
48.2 fps, P1:
51.4 fps, max:
104.5 fps
fps
100%
GeForce GTX 1660 Ti Mobile:
98.6 [X] Lenovo Legion 5 15IMH05H 81Y600D7GE Intel Core i5-10300H 2.5GHz
GeForce GTX 1660 Ti Mobile
min:
57.6 fps, P0.1:
63.4 fps, P1:
72.3 fps, max:
148.1 fps
fps
61%
GeForce GTX 1650 Mobile:
60.4 [X] Lenovo ThinkBook 15p G2 ITH 21B1000WGE Intel Core i5-11400H 2.7GHz
GeForce GTX 1650 Mobile
min:
38.2 fps, P0.1:
39.3 fps, P1:
44.7 fps, max:
86.5 fps
fps
100%
GeForce GTX 1660 Ti Mobile:
72.3 [X] Lenovo Legion 5 15IMH05H 81Y600D7GE Intel Core i5-10300H 2.5GHz
GeForce GTX 1660 Ti Mobile
min:
38.2 fps, P0.1:
50.6 fps, P1:
53.9 fps, max:
142.7 fps
fps
60%
GeForce GTX 1650 Mobile:
43.3 [X] Lenovo ThinkBook 15p G2 ITH 21B1000WGE Intel Core i5-11400H 2.7GHz
GeForce GTX 1650 Mobile
min:
31.7 fps, P0.1:
32 fps, P1:
33.3 fps, max:
57.3 fps
fps
100%
GeForce GTX 1660 Ti Mobile:
40 [X] Lenovo Legion 5 15IMH05H 81Y600D7GE Intel Core i5-10300H 2.5GHz
GeForce GTX 1660 Ti Mobile
min:
29 fps, max:
51 fps
fps
55%
GeForce GTX 1650 Mobile:
22 [X] Lenovo ThinkBook 15p G2 ITH 21B1000WGE Intel Core i5-11400H 2.7GHz
GeForce GTX 1650 Mobile
min:
10 fps, max:
28 fps
fps
100%
GeForce GTX 1660 Ti Mobile:
36 [X] Lenovo Legion 5 15IMH05H 81Y600D7GE Intel Core i5-10300H 2.5GHz
GeForce GTX 1660 Ti Mobile
min:
24 fps, max:
45 fps
fps
53%
GeForce GTX 1650 Mobile:
19 [X] Lenovo ThinkBook 15p G2 ITH 21B1000WGE Intel Core i5-11400H 2.7GHz
GeForce GTX 1650 Mobile
min:
8 fps, max:
26 fps
fps
100%
GeForce GTX 1660 Ti Mobile:
28 [X] Lenovo Legion 5 15IMH05H 81Y600D7GE Intel Core i5-10300H 2.5GHz
GeForce GTX 1660 Ti Mobile
min:
21 fps, max:
37 fps
fps
46%
GeForce GTX 1650 Mobile:
13 [X] Lenovo ThinkBook 15p G2 ITH 21B1000WGE Intel Core i5-11400H 2.7GHz
GeForce GTX 1650 Mobile
min:
6 fps, max:
21 fps
fps
100%
GeForce GTX 1660 Ti Mobile:
20 [X] Lenovo Legion 5 15IMH05H 81Y600D7GE Intel Core i5-10300H 2.5GHz
GeForce GTX 1660 Ti Mobile
min:
15 fps, max:
28 fps
fps
100%
GeForce GTX 1660 Ti Mobile:
84 [X] Lenovo Legion 5 15IMH05H 81Y600D7GE Intel Core i5-10300H 2.5GHz
GeForce GTX 1660 Ti Mobile
P1:
45 fps
fps
67%
GeForce GTX 1650 Mobile:
56 [X] Lenovo ThinkBook 15p G2 ITH 21B1000WGE Intel Core i5-11400H 2.7GHz
GeForce GTX 1650 Mobile
min:
40 fps
fps
100%
GeForce GTX 1660 Ti Mobile:
75 [X] Lenovo Legion 5 15IMH05H 81Y600D7GE Intel Core i5-10300H 2.5GHz
GeForce GTX 1660 Ti Mobile
P1:
40 fps
fps
67%
GeForce GTX 1650 Mobile:
50 [X] Lenovo ThinkBook 15p G2 ITH 21B1000WGE Intel Core i5-11400H 2.7GHz
GeForce GTX 1650 Mobile
min:
37 fps
fps
100%
GeForce GTX 1660 Ti Mobile:
57 [X] Lenovo Legion 5 15IMH05H 81Y600D7GE Intel Core i5-10300H 2.5GHz
GeForce GTX 1660 Ti Mobile
P1:
35 fps
fps
65%
GeForce GTX 1650 Mobile:
37 [X] Lenovo ThinkBook 15p G2 ITH 21B1000WGE Intel Core i5-11400H 2.7GHz
GeForce GTX 1650 Mobile
min:
26 fps
fps
100%
GeForce GTX 1660 Ti Mobile:
53 [X] Lenovo Legion 5 15IMH05H 81Y600D7GE Intel Core i5-10300H 2.5GHz
GeForce GTX 1660 Ti Mobile
P1:
32 fps
fps
51%
GeForce GTX 1650 Mobile:
27 [X] Lenovo ThinkBook 15p G2 ITH 21B1000WGE Intel Core i5-11400H 2.7GHz
GeForce GTX 1650 Mobile
min:
18 fps
fps
100%
GeForce GTX 1660 Ti Mobile:
77.9 [X] Lenovo Legion 5 15IMH05H 81Y600D7GE Intel Core i5-10300H 2.5GHz
GeForce GTX 1660 Ti Mobile
min:
41.7 fps, P0.1:
43.1 fps, P1:
45.9 fps, max:
183.6 fps
fps
65%
GeForce GTX 1650 Mobile:
50.5 [X] Lenovo ThinkBook 15p G2 ITH 21B1000WGE Intel Core i5-11400H 2.7GHz
GeForce GTX 1650 Mobile
min:
6.47 fps, P0.1:
8.92 fps, P1:
28.4 fps, max:
155.5 fps
fps
100%
GeForce GTX 1660 Ti Mobile:
56.8 [X] Lenovo Legion 5 15IMH05H 81Y600D7GE Intel Core i5-10300H 2.5GHz
GeForce GTX 1660 Ti Mobile
min:
23.8 fps, P0.1:
39.4 fps, P1:
47.7 fps, max:
104.7 fps
fps
72%
GeForce GTX 1650 Mobile:
40.8 [X] Lenovo ThinkBook 15p G2 ITH 21B1000WGE Intel Core i5-11400H 2.7GHz
GeForce GTX 1650 Mobile
min:
4.35 fps, P0.1:
15.1 fps, P1:
34.9 fps, max:
89.5 fps
fps
100%
GeForce GTX 1660 Ti Mobile:
51.8 [X] Lenovo Legion 5 15IMH05H 81Y600D7GE Intel Core i5-10300H 2.5GHz
GeForce GTX 1660 Ti Mobile
min:
32.4 fps, P0.1:
37.1 fps, P1:
43.3 fps, max:
84.5 fps
fps
51%
GeForce GTX 1650 Mobile:
26.4 [X] Lenovo ThinkBook 15p G2 ITH 21B1000WGE Intel Core i5-11400H 2.7GHz
GeForce GTX 1650 Mobile
min:
9.41 fps, P0.1:
14.1 fps, P1:
22.1 fps, max:
69.7 fps
fps
100%
GeForce GTX 1660 Ti Mobile:
46.9 [X] Lenovo Legion 5 15IMH05H 81Y600D7GE Intel Core i5-10300H 2.5GHz
GeForce GTX 1660 Ti Mobile
min:
8.69 fps, P0.1:
25.2 fps, P1:
36.2 fps, max:
81.8 fps
fps
38%
GeForce GTX 1650 Mobile:
17.8 [X] Lenovo ThinkBook 15p G2 ITH 21B1000WGE Intel Core i5-11400H 2.7GHz
GeForce GTX 1650 Mobile
min:
13.2 fps, P0.1:
14.5 fps, P1:
15.8 fps, max:
22.1 fps
fps
100%
GeForce GTX 1660 Ti Mobile:
38.3 [X] Lenovo Legion 5 15IMH05H 81Y600D7GE Intel Core i5-10300H 2.5GHz
GeForce GTX 1660 Ti Mobile
min:
18.1 fps, P0.1:
18.5 fps, P1:
24.7 fps, max:
88.3 fps
fps
62%
GeForce GTX 1650 Mobile:
23.6 [X] Lenovo ThinkBook 15p G2 ITH 21B1000WGE Intel Core i5-11400H 2.7GHz
GeForce GTX 1650 Mobile
min:
19.1 fps, P0.1:
19.2 fps, P1:
20.3 fps, max:
28.9 fps
fps
100%
GeForce GTX 1660 Ti Mobile:
31.2 [X] Lenovo Legion 5 15IMH05H 81Y600D7GE Intel Core i5-10300H 2.5GHz
GeForce GTX 1660 Ti Mobile
min:
15.5 fps, P0.1:
15.6 fps, P1:
17.9 fps, max:
82.6 fps
fps
68%
GeForce GTX 1650 Mobile:
21.1 [X] Lenovo ThinkBook 15p G2 ITH 21B1000WGE Intel Core i5-11400H 2.7GHz
GeForce GTX 1650 Mobile
min:
17 fps, P0.1:
17.1 fps, P1:
18.7 fps, max:
27 fps
fps
100%
GeForce GTX 1660 Ti Mobile:
29.5 [X] Lenovo Legion 5 15IMH05H 81Y600D7GE Intel Core i5-10300H 2.5GHz
GeForce GTX 1660 Ti Mobile
min:
14.7 fps, P0.1:
15.4 fps, P1:
18.7 fps, max:
88.3 fps
fps
63%
GeForce GTX 1650 Mobile:
18.5 [X] Lenovo ThinkBook 15p G2 ITH 21B1000WGE Intel Core i5-11400H 2.7GHz
GeForce GTX 1650 Mobile
min:
14.3 fps, P0.1:
14.5 fps, P1:
16 fps, max:
22.2 fps
fps
100%
GeForce GTX 1660 Ti Mobile:
51 [X] Lenovo Legion 5 15IMH05H 81Y600D7GE Intel Core i5-10300H 2.5GHz
GeForce GTX 1660 Ti Mobile
min:
18.6 fps, P0.1:
22.7 fps, P1:
37.5 fps, max:
98.8 fps
fps
61%
GeForce GTX 1650 Mobile:
31 [X] Lenovo ThinkBook 15p G2 ITH 21B1000WGE Intel Core i5-11400H 2.7GHz
GeForce GTX 1650 Mobile
min:
16.4 fps, P0.1:
17.6 fps, P1:
24.1 fps, max:
74.2 fps
fps
100%
GeForce GTX 1660 Ti Mobile:
41.3 [X] Lenovo Legion 5 15IMH05H 81Y600D7GE Intel Core i5-10300H 2.5GHz
GeForce GTX 1660 Ti Mobile
min:
31 fps, P0.1:
31.3 fps, P1:
32.9 fps, max:
61.2 fps
fps
62%
GeForce GTX 1650 Mobile:
25.4 [X] Lenovo ThinkBook 15p G2 ITH 21B1000WGE Intel Core i5-11400H 2.7GHz
GeForce GTX 1650 Mobile
min:
19.1 fps, P0.1:
19.7 fps, P1:
21 fps, max:
34.8 fps
fps
100%
GeForce GTX 1660 Ti Mobile:
30.3 [X] Lenovo Legion 5 15IMH05H 81Y600D7GE Intel Core i5-10300H 2.5GHz
GeForce GTX 1660 Ti Mobile
min:
23.1 fps, P0.1:
23.2 fps, P1:
24.8 fps, max:
44.1 fps
fps
60%
GeForce GTX 1650 Mobile:
18.3 [X] Lenovo ThinkBook 15p G2 ITH 21B1000WGE Intel Core i5-11400H 2.7GHz
GeForce GTX 1650 Mobile
min:
10.7 fps, P0.1:
11.9 fps, P1:
15.6 fps, max:
37.6 fps
fps
100%
GeForce GTX 1660 Ti Mobile:
20.2 [X] Lenovo Legion 5 15IMH05H 81Y600D7GE Intel Core i5-10300H 2.5GHz
GeForce GTX 1660 Ti Mobile
min:
16.4 fps, P0.1:
16.6 fps, P1:
17.2 fps, max:
25.3 fps
fps
59%
GeForce GTX 1650 Mobile:
12 [X] Lenovo ThinkBook 15p G2 ITH 21B1000WGE Intel Core i5-11400H 2.7GHz
GeForce GTX 1650 Mobile
min:
7.66 fps, P0.1:
8.32 fps, P1:
10.3 fps, max:
19.7 fps
fps
100%
GeForce GTX 1660 Ti Mobile:
183.5 [X] Lenovo Legion 5 15IMH05H 81Y600D7GE Intel Core i5-10300H 2.5GHz
GeForce GTX 1660 Ti Mobile
fps
79%
GeForce GTX 1650 Mobile:
144.4 [X] Lenovo ThinkBook 15p G2 ITH 21B1000WGE Intel Core i5-11400H 2.7GHz
GeForce GTX 1650 Mobile
fps
100%
GeForce GTX 1660 Ti Mobile:
127.2 [X] Lenovo Legion 5 15IMH05H 81Y600D7GE Intel Core i5-10300H 2.5GHz
GeForce GTX 1660 Ti Mobile
fps
73%
GeForce GTX 1650 Mobile:
93.1 [X] Lenovo ThinkBook 15p G2 ITH 21B1000WGE Intel Core i5-11400H 2.7GHz
GeForce GTX 1650 Mobile
fps
100%
GeForce GTX 1660 Ti Mobile:
82.4 [X] Lenovo Legion 5 15IMH05H 81Y600D7GE Intel Core i5-10300H 2.5GHz
GeForce GTX 1660 Ti Mobile
fps
65%
GeForce GTX 1650 Mobile:
53.3 [X] Lenovo ThinkBook 15p G2 ITH 21B1000WGE Intel Core i5-11400H 2.7GHz
GeForce GTX 1650 Mobile
fps
100%
GeForce GTX 1660 Ti Mobile:
66.3 [X] Lenovo Legion 5 15IMH05H 81Y600D7GE Intel Core i5-10300H 2.5GHz
GeForce GTX 1660 Ti Mobile
fps
63%
GeForce GTX 1650 Mobile:
41.6 [X] Lenovo ThinkBook 15p G2 ITH 21B1000WGE Intel Core i5-11400H 2.7GHz
GeForce GTX 1650 Mobile
fps
100%
GeForce GTX 1660 Ti Mobile:
76 [X] Lenovo Legion 5 15IMH05H 81Y600D7GE Intel Core i5-10300H 2.5GHz
GeForce GTX 1660 Ti Mobile
min:
36 fps, max:
150 fps
fps
64%
GeForce GTX 1650 Mobile:
49 [X] Lenovo ThinkBook 15p G2 ITH 21B1000WGE Intel Core i5-11400H 2.7GHz
GeForce GTX 1650 Mobile
min:
30 fps, max:
63 fps
fps
100%
GeForce GTX 1660 Ti Mobile:
70 [X] Lenovo Legion 5 15IMH05H 81Y600D7GE Intel Core i5-10300H 2.5GHz
GeForce GTX 1660 Ti Mobile
min:
27 fps, P0.1:
33 fps, P1:
51 fps, max:
151 fps
fps
66%
GeForce GTX 1650 Mobile:
46 [X] Lenovo ThinkBook 15p G2 ITH 21B1000WGE Intel Core i5-11400H 2.7GHz
GeForce GTX 1650 Mobile
min:
26 fps, max:
83 fps
fps
100%
GeForce GTX 1660 Ti Mobile:
66 [X] Lenovo Legion 5 15IMH05H 81Y600D7GE Intel Core i5-10300H 2.5GHz
GeForce GTX 1660 Ti Mobile
min:
25 fps, max:
119 fps
fps
42%
GeForce GTX 1650 Mobile:
28 [X] Lenovo ThinkBook 15p G2 ITH 21B1000WGE Intel Core i5-11400H 2.7GHz
GeForce GTX 1650 Mobile
min:
3 fps, max:
80 fps
fps
100%
GeForce GTX 1660 Ti Mobile:
50 [X] Lenovo Legion 5 15IMH05H 81Y600D7GE Intel Core i5-10300H 2.5GHz
GeForce GTX 1660 Ti Mobile
min:
9 fps, max:
122 fps
fps
36%
GeForce GTX 1650 Mobile:
18 [X] Lenovo ThinkBook 15p G2 ITH 21B1000WGE Intel Core i5-11400H 2.7GHz
GeForce GTX 1650 Mobile
min:
3 fps, max:
67 fps
fps
100%
GeForce GTX 1660 Ti Mobile:
93.9 [X] Lenovo Legion 5 15IMH05H 81Y600D7GE Intel Core i5-10300H 2.5GHz
GeForce GTX 1660 Ti Mobile
min:
32 fps, P0.1:
43.3 fps, P1:
48.3 fps, max:
160 fps
fps
62%
GeForce GTX 1650 Mobile:
58 [X] Lenovo ThinkBook 15p G2 ITH 21B1000WGE Intel Core i5-11400H 2.7GHz
GeForce GTX 1650 Mobile
min:
7.1 fps, P0.1:
32.4 fps, P1:
44.5 fps, max:
130.6 fps
fps
100%
GeForce GTX 1660 Ti Mobile:
146.7 [X] Lenovo Legion 5 15IMH05H 81Y600D7GE Intel Core i5-10300H 2.5GHz
GeForce GTX 1660 Ti Mobile
min:
62.9 fps, P0.1:
69.6 fps, P1:
76.1 fps, max:
363 fps
fps
89%
GeForce GTX 1650 Mobile:
130.6 [X] Lenovo ThinkBook 15p G2 ITH 21B1000WGE Intel Core i5-11400H 2.7GHz
GeForce GTX 1650 Mobile
min:
61.6 fps, P0.1:
62.5 fps, P1:
66.7 fps, max:
359 fps
fps
100%
GeForce GTX 1660 Ti Mobile:
132.6 [X] Lenovo Legion 5 15IMH05H 81Y600D7GE Intel Core i5-10300H 2.5GHz
GeForce GTX 1660 Ti Mobile
min:
64.1 fps, P0.1:
65.4 fps, P1:
68.3 fps, max:
338 fps
fps
85%
GeForce GTX 1650 Mobile:
113.2 [X] Lenovo ThinkBook 15p G2 ITH 21B1000WGE Intel Core i5-11400H 2.7GHz
GeForce GTX 1650 Mobile
min:
57.2 fps, P0.1:
60 fps, P1:
67.9 fps, max:
315 fps
fps
100%
GeForce GTX 1660 Ti Mobile:
104.4 [X] Lenovo Legion 5 15IMH05H 81Y600D7GE Intel Core i5-10300H 2.5GHz
GeForce GTX 1660 Ti Mobile
min:
56 fps, P0.1:
57.7 fps, P1:
61.5 fps, max:
292 fps
fps
76%
GeForce GTX 1650 Mobile:
79.5 [X] Lenovo ThinkBook 15p G2 ITH 21B1000WGE Intel Core i5-11400H 2.7GHz
GeForce GTX 1650 Mobile
min:
26.8 fps, P0.1:
27.6 fps, P1:
35.8 fps, max:
307 fps
fps
100%
GeForce GTX 1660 Ti Mobile:
98.2 [X] Lenovo Legion 5 15IMH05H 81Y600D7GE Intel Core i5-10300H 2.5GHz
GeForce GTX 1660 Ti Mobile
min:
36.8 fps, P0.1:
44.9 fps, P1:
57.9 fps, max:
321 fps
fps
56%
GeForce GTX 1650 Mobile:
55.4 [X] Lenovo ThinkBook 15p G2 ITH 21B1000WGE Intel Core i5-11400H 2.7GHz
GeForce GTX 1650 Mobile
min:
12 fps, P0.1:
17.9 fps, P1:
26.1 fps, max:
511 fps
fps
100%
GeForce GTX 1660 Ti Mobile:
73.3 [X] Lenovo Legion 5 15IMH05H 81Y600D7GE 2.02
Intel Core i5-10300H 2.5GHz
GeForce GTX 1660 Ti Mobile
min:
41 fps, max:
106.9 fps
fps
56%
GeForce GTX 1650 Mobile:
41 [X] Lenovo ThinkBook 15p G2 ITH 21B1000WGE 2.02
Intel Core i5-11400H 2.7GHz
GeForce GTX 1650 Mobile
min:
15.4 fps, max:
66.1 fps
fps
100%
GeForce GTX 1660 Ti Mobile:
57.4 [X] Lenovo Legion 5 15IMH05H 81Y600D7GE 2.02
Intel Core i5-10300H 2.5GHz
GeForce GTX 1660 Ti Mobile
min:
45.2 fps, max:
78.5 fps
fps
56%
GeForce GTX 1650 Mobile:
32.2 [X] Lenovo ThinkBook 15p G2 ITH 21B1000WGE 2.02
Intel Core i5-11400H 2.7GHz
GeForce GTX 1650 Mobile
min:
22.1 fps, max:
42.9 fps
fps
100%
GeForce GTX 1660 Ti Mobile:
49.1 [X] Lenovo Legion 5 15IMH05H 81Y600D7GE 2.02
Intel Core i5-10300H 2.5GHz
GeForce GTX 1660 Ti Mobile
min:
29.6 fps, max:
87.9 fps
fps
55%
GeForce GTX 1650 Mobile:
27 [X] Lenovo ThinkBook 15p G2 ITH 21B1000WGE 2.02
Intel Core i5-11400H 2.7GHz
GeForce GTX 1650 Mobile
min:
10.7 fps, max:
80.9 fps
fps
100%
GeForce GTX 1660 Ti Mobile:
41.7 [X] Lenovo Legion 5 15IMH05H 81Y600D7GE 2.02
Intel Core i5-10300H 2.5GHz
GeForce GTX 1660 Ti Mobile
min:
32.3 fps, max:
64.4 fps
fps
54%
GeForce GTX 1650 Mobile:
22.5 [X] Lenovo ThinkBook 15p G2 ITH 21B1000WGE 2.02
Intel Core i5-11400H 2.7GHz
GeForce GTX 1650 Mobile
min:
8.38 fps, max:
41.8 fps
fps
100%
GeForce GTX 1660 Ti Mobile:
103.3 [X] Lenovo Legion 5 15IMH05H 81Y600D7GE Intel Core i5-10300H 2.5GHz
GeForce GTX 1660 Ti Mobile
min:
18.7 fps, P0.1:
49.1 fps, P1:
62.4 fps, max:
244 fps
fps
61%
GeForce GTX 1650 Mobile:
62.8 [X] Lenovo ThinkBook 15p G2 ITH 21B1000WGE Intel Core i5-11400H 2.7GHz
GeForce GTX 1650 Mobile
min:
28.9 fps, P0.1:
30.8 fps, P1:
35.5 fps, max:
187.1 fps
fps
100%
GeForce GTX 1660 Ti Mobile:
89.5 [X] Lenovo Legion 5 15IMH05H 81Y600D7GE Intel Core i5-10300H 2.5GHz
GeForce GTX 1660 Ti Mobile
min:
43.5 fps, P0.1:
49.2 fps, P1:
55.9 fps, max:
206 fps
fps
62%
GeForce GTX 1650 Mobile:
55.2 [X] Lenovo ThinkBook 15p G2 ITH 21B1000WGE Intel Core i5-11400H 2.7GHz
GeForce GTX 1650 Mobile
min:
26.9 fps, P0.1:
28.7 fps, P1:
31.1 fps, max:
167.6 fps
fps
100%
GeForce GTX 1660 Ti Mobile:
76.8 [X] Lenovo Legion 5 15IMH05H 81Y600D7GE Intel Core i5-10300H 2.5GHz
GeForce GTX 1660 Ti Mobile
min:
37.5 fps, P0.1:
42.8 fps, P1:
46.7 fps, max:
187 fps
fps
61%
GeForce GTX 1650 Mobile:
46.6 [X] Lenovo ThinkBook 15p G2 ITH 21B1000WGE Intel Core i5-11400H 2.7GHz
GeForce GTX 1650 Mobile
min:
23.6 fps, P0.1:
24.4 fps, P1:
25 fps, max:
150.8 fps
fps
100%
GeForce GTX 1660 Ti Mobile:
68.2 [X] Lenovo Legion 5 15IMH05H 81Y600D7GE Intel Core i5-10300H 2.5GHz
GeForce GTX 1660 Ti Mobile
min:
35.4 fps, P0.1:
37.3 fps, P1:
41.5 fps, max:
164.9 fps
fps
61%
GeForce GTX 1650 Mobile:
41.5 [X] Lenovo ThinkBook 15p G2 ITH 21B1000WGE Intel Core i5-11400H 2.7GHz
GeForce GTX 1650 Mobile
min:
19.9 fps, P0.1:
20.7 fps, P1:
22.4 fps, max:
144.7 fps
fps
100%
GeForce GTX 1660 Ti Mobile:
59 [X] Lenovo Legion 5 15IMH05H 81Y600D7GE Intel Core i5-10300H 2.5GHz
GeForce GTX 1660 Ti Mobile
min:
56 fps, max:
60 fps
fps
78%
GeForce GTX 1650 Mobile:
46 [X] Lenovo ThinkBook 15p G2 ITH 21B1000WGE Intel Core i5-11400H 2.7GHz
GeForce GTX 1650 Mobile
min:
38 fps, max:
58 fps
fps
100%
GeForce GTX 1660 Ti Mobile:
59 [X] Lenovo Legion 5 15IMH05H 81Y600D7GE Intel Core i5-10300H 2.5GHz
GeForce GTX 1660 Ti Mobile
min:
56 fps, max:
60 fps
fps
69%
GeForce GTX 1650 Mobile:
41 [X] Lenovo ThinkBook 15p G2 ITH 21B1000WGE Intel Core i5-11400H 2.7GHz
GeForce GTX 1650 Mobile
min:
36 fps, max:
50 fps
fps
100%
GeForce GTX 1660 Ti Mobile:
52 [X] Lenovo Legion 5 15IMH05H 81Y600D7GE Intel Core i5-10300H 2.5GHz
GeForce GTX 1660 Ti Mobile
min:
44 fps, max:
60 fps
fps
63%
GeForce GTX 1650 Mobile:
33 [X] Lenovo ThinkBook 15p G2 ITH 21B1000WGE Intel Core i5-11400H 2.7GHz
GeForce GTX 1650 Mobile
min:
28 fps, max:
43 fps
fps
100%
GeForce GTX 1660 Ti Mobile:
46 [X] Lenovo Legion 5 15IMH05H 81Y600D7GE Intel Core i5-10300H 2.5GHz
GeForce GTX 1660 Ti Mobile
min:
39 fps, max:
54 fps
fps
61%
GeForce GTX 1650 Mobile:
28 [X] Lenovo ThinkBook 15p G2 ITH 21B1000WGE Intel Core i5-11400H 2.7GHz
GeForce GTX 1650 Mobile
min:
24 fps, max:
38 fps
fps
100%
GeForce GTX 1660 Ti Mobile:
44.7 [X] Lenovo Legion 5 15IMH05H 81Y600D7GE Intel Core i5-10300H 2.5GHz
GeForce GTX 1660 Ti Mobile
min:
17 fps, P0.1:
18 fps, P1:
20.1 fps, max:
117.8 fps
fps
63%
GeForce GTX 1650 Mobile:
28.3 [X] Lenovo ThinkBook 15p G2 ITH 21B1000WGE Intel Core i5-11400H 2.7GHz
GeForce GTX 1650 Mobile
min:
23 fps, P0.1:
23.1 fps, P1:
23.9 fps, max:
44 fps
fps
100%
GeForce GTX 1660 Ti Mobile:
37.5 [X] Lenovo Legion 5 15IMH05H 81Y600D7GE Intel Core i5-10300H 2.5GHz
GeForce GTX 1660 Ti Mobile
min:
17.5 fps, P0.1:
17.5 fps, P1:
18.2 fps, max:
107.9 fps
fps
61%
GeForce GTX 1650 Mobile:
23 [X] Lenovo ThinkBook 15p G2 ITH 21B1000WGE Intel Core i5-11400H 2.7GHz
GeForce GTX 1650 Mobile
min:
19 fps, P0.1:
19.2 fps, P1:
19.6 fps, max:
35 fps
fps
100%
GeForce GTX 1660 Ti Mobile:
29.6 [X] Lenovo Legion 5 15IMH05H 81Y600D7GE Intel Core i5-10300H 2.5GHz
GeForce GTX 1660 Ti Mobile
min:
14.4 fps, P0.1:
15 fps, P1:
20 fps, max:
86.5 fps
fps
61%
GeForce GTX 1650 Mobile:
18.2 [X] Lenovo ThinkBook 15p G2 ITH 21B1000WGE Intel Core i5-11400H 2.7GHz
GeForce GTX 1650 Mobile
min:
15.2 fps, P0.1:
15.2 fps, P1:
15.4 fps, max:
27.6 fps
fps
100%
GeForce GTX 1660 Ti Mobile:
26.3 [X] Lenovo Legion 5 15IMH05H 81Y600D7GE Intel Core i5-10300H 2.5GHz
GeForce GTX 1660 Ti Mobile
min:
13.3 fps, P0.1:
13.7 fps, P1:
17.5 fps, max:
87.7 fps
fps
60%
GeForce GTX 1650 Mobile:
15.9 [X] Lenovo ThinkBook 15p G2 ITH 21B1000WGE Intel Core i5-11400H 2.7GHz
GeForce GTX 1650 Mobile
min:
13 fps, P0.1:
13 fps, P1:
13.3 fps, max:
23.6 fps
fps
100%
GeForce GTX 1660 Ti Mobile:
69.3 [X] Lenovo Legion 5 15IMH05H 81Y600D7GE Intel Core i5-10300H 2.5GHz
GeForce GTX 1660 Ti Mobile
min:
41.8 fps, P0.1:
45 fps, P1:
50.1 fps, max:
114.7 fps
fps
93%
GeForce GTX 1650 Mobile:
64.5 [X] Lenovo ThinkBook 15p G2 ITH 21B1000WGE Intel Core i5-11400H 2.7GHz
GeForce GTX 1650 Mobile
min:
18.6 fps, P0.1:
42.1 fps, P1:
46.7 fps, max:
104.9 fps
fps
100%
GeForce GTX 1660 Ti Mobile:
67.5 [X] Lenovo Legion 5 15IMH05H 81Y600D7GE Intel Core i5-10300H 2.5GHz
GeForce GTX 1660 Ti Mobile
min:
41.4 fps, P0.1:
41.6 fps, P1:
45.5 fps, max:
107.6 fps
fps
81%
GeForce GTX 1650 Mobile:
54.4 [X] Lenovo ThinkBook 15p G2 ITH 21B1000WGE Intel Core i5-11400H 2.7GHz
GeForce GTX 1650 Mobile
min:
32.7 fps, P0.1:
39.5 fps, P1:
44.1 fps, max:
73.7 fps
fps
100%
GeForce GTX 1660 Ti Mobile:
64.2 [X] Lenovo Legion 5 15IMH05H 81Y600D7GE Intel Core i5-10300H 2.5GHz
GeForce GTX 1660 Ti Mobile
min:
41.1 fps, P0.1:
42.1 fps, P1:
47.8 fps, max:
98.8 fps
fps
65%
GeForce GTX 1650 Mobile:
41.7 [X] Lenovo ThinkBook 15p G2 ITH 21B1000WGE Intel Core i5-11400H 2.7GHz
GeForce GTX 1650 Mobile
min:
1.084 fps, P0.1:
1.3 fps, P1:
32.8 fps, max:
69.8 fps
fps
100%
GeForce GTX 1660 Ti Mobile:
60.4 [X] Lenovo Legion 5 15IMH05H 81Y600D7GE Intel Core i5-10300H 2.5GHz
GeForce GTX 1660 Ti Mobile
min:
37.9 fps, P0.1:
42.3 fps, P1:
48.1 fps, max:
81.6 fps
fps
35%
GeForce GTX 1650 Mobile:
21.3 [X] Lenovo ThinkBook 15p G2 ITH 21B1000WGE Intel Core i5-11400H 2.7GHz
GeForce GTX 1650 Mobile
min:
2.89 fps, P0.1:
5.58 fps, P1:
16.3 fps, max:
57.6 fps
fps
100%
GeForce GTX 1660 Ti Mobile:
51.6 [X] Lenovo Legion 5 15IMH05H 81Y600D7GE Intel Core i5-10300H 2.5GHz
GeForce GTX 1660 Ti Mobile
min:
17 fps, P0.1:
21.5 fps, P1:
29.1 fps, max:
110.9 fps
fps
53%
GeForce GTX 1650 Mobile:
27.4 [X] Lenovo ThinkBook 15p G2 ITH 21B1000WGE Intel Core i5-11400H 2.7GHz
GeForce GTX 1650 Mobile
min:
2.64 fps, P0.1:
2.72 fps, P1:
11.6 fps, max:
87.2 fps
fps
100%
GeForce GTX 1660 Ti Mobile:
44.4 [X] Lenovo Legion 5 15IMH05H 81Y600D7GE Intel Core i5-10300H 2.5GHz
GeForce GTX 1660 Ti Mobile
min:
18.3 fps, P0.1:
19 fps, P1:
25 fps, max:
92.2 fps
fps
58%
GeForce GTX 1650 Mobile:
25.6 [X] Lenovo ThinkBook 15p G2 ITH 21B1000WGE Intel Core i5-11400H 2.7GHz
GeForce GTX 1650 Mobile
min:
2.82 fps, P0.1:
2.93 fps, P1:
14.8 fps, max:
77.9 fps
fps
100%
GeForce GTX 1660 Ti Mobile:
37.8 [X] Lenovo Legion 5 15IMH05H 81Y600D7GE Intel Core i5-10300H 2.5GHz
GeForce GTX 1660 Ti Mobile
min:
15.4 fps, P0.1:
16.9 fps, P1:
22.1 fps, max:
106.1 fps
fps
59%
GeForce GTX 1650 Mobile:
22.4 [X] Lenovo ThinkBook 15p G2 ITH 21B1000WGE Intel Core i5-11400H 2.7GHz
GeForce GTX 1650 Mobile
min:
3.88 fps, P0.1:
4.91 fps, P1:
9.14 fps, max:
79.3 fps
fps
100%
GeForce GTX 1660 Ti Mobile:
85.2 [X] Lenovo Legion 5 15IMH05H 81Y600D7GE Intel Core i5-10300H 2.5GHz
GeForce GTX 1660 Ti Mobile
min:
66 fps, P0.1:
66.6 fps, P1:
68.9 fps, max:
125 fps
fps
63%
GeForce GTX 1650 Mobile:
53.3 [X] Lenovo ThinkBook 15p G2 ITH 21B1000WGE Intel Core i5-11400H 2.7GHz
GeForce GTX 1650 Mobile
min:
42.1 fps, P0.1:
42.7 fps, P1:
44.7 fps, max:
67.1 fps
fps
100%
GeForce GTX 1660 Ti Mobile:
80.5 [X] Lenovo Legion 5 15IMH05H 81Y600D7GE Intel Core i5-10300H 2.5GHz
GeForce GTX 1660 Ti Mobile
min:
35 fps, P0.1:
55.4 fps, P1:
64.7 fps, max:
115.1 fps
fps
62%
GeForce GTX 1650 Mobile:
49.7 [X] Lenovo ThinkBook 15p G2 ITH 21B1000WGE Intel Core i5-11400H 2.7GHz
GeForce GTX 1650 Mobile
min:
38.7 fps, P0.1:
39.7 fps, P1:
40.8 fps, max:
58.7 fps
fps
100%
GeForce GTX 1660 Ti Mobile:
73.9 [X] Lenovo Legion 5 15IMH05H 81Y600D7GE Intel Core i5-10300H 2.5GHz
GeForce GTX 1660 Ti Mobile
min:
55.5 fps, P0.1:
57.7 fps, P1:
61.5 fps, max:
98.3 fps
fps
64%
GeForce GTX 1650 Mobile:
47.2 [X] Lenovo ThinkBook 15p G2 ITH 21B1000WGE Intel Core i5-11400H 2.7GHz
GeForce GTX 1650 Mobile
min:
38.2 fps, P0.1:
38.2 fps, P1:
39.5 fps, max:
55.8 fps
fps
100%
GeForce GTX 1660 Ti Mobile:
62.3 [X] Lenovo Legion 5 15IMH05H 81Y600D7GE Intel Core i5-10300H 2.5GHz
GeForce GTX 1660 Ti Mobile
min:
49.7 fps, P0.1:
50.9 fps, P1:
53.1 fps, max:
84.1 fps
fps
46%
GeForce GTX 1650 Mobile:
28.8 [X] Lenovo ThinkBook 15p G2 ITH 21B1000WGE Intel Core i5-11400H 2.7GHz
GeForce GTX 1650 Mobile
min:
3.2 fps, P0.1:
4.86 fps, P1:
23.1 fps, max:
38.4 fps
fps
100%
GeForce GTX 1660 Ti Mobile:
81.6 [X] Lenovo Legion 5 15IMH05H 81Y600D7GE Intel Core i5-10300H 2.5GHz
GeForce GTX 1660 Ti Mobile
min:
22.7 fps, P0.1:
49.9 fps, P1:
63.2 fps, max:
145.8 fps
fps
60%
GeForce GTX 1650 Mobile:
49 [X] Lenovo ThinkBook 15p G2 ITH 21B1000WGE Intel Core i5-11400H 2.7GHz
GeForce GTX 1650 Mobile
min:
28.4 fps, P0.1:
33.7 fps, P1:
40.6 fps, max:
123.5 fps
fps
100%
GeForce GTX 1660 Ti Mobile:
63.2 [X] Lenovo Legion 5 15IMH05H 81Y600D7GE Intel Core i5-10300H 2.5GHz
GeForce GTX 1660 Ti Mobile
min:
38.2 fps, P0.1:
43.8 fps, P1:
52.4 fps, max:
90.1 fps
fps
59%
GeForce GTX 1650 Mobile:
37.6 [X] Lenovo ThinkBook 15p G2 ITH 21B1000WGE Intel Core i5-11400H 2.7GHz
GeForce GTX 1650 Mobile
min:
25.1 fps, P0.1:
29.3 fps, P1:
32.2 fps, max:
57.5 fps
fps
100%
GeForce GTX 1660 Ti Mobile:
54.1 [X] Lenovo Legion 5 15IMH05H 81Y600D7GE Intel Core i5-10300H 2.5GHz
GeForce GTX 1660 Ti Mobile
min:
40.4 fps, P0.1:
42.1 fps, P1:
46 fps, max:
88 fps
fps
61%
GeForce GTX 1650 Mobile:
33.2 [X] Lenovo ThinkBook 15p G2 ITH 21B1000WGE Intel Core i5-11400H 2.7GHz
GeForce GTX 1650 Mobile
min:
28 fps, P0.1:
28.2 fps, P1:
29.3 fps, max:
44.3 fps
fps
100%
GeForce GTX 1660 Ti Mobile:
53.6 [X] Lenovo Legion 5 15IMH05H 81Y600D7GE Intel Core i5-10300H 2.5GHz
GeForce GTX 1660 Ti Mobile
min:
41 fps, P0.1:
42.5 fps, P1:
44.8 fps, max:
74.9 fps
fps
60%
GeForce GTX 1650 Mobile:
32.1 [X] Lenovo ThinkBook 15p G2 ITH 21B1000WGE Intel Core i5-11400H 2.7GHz
GeForce GTX 1650 Mobile
min:
27.1 fps, P0.1:
27.5 fps, P1:
28.4 fps, max:
45.5 fps
fps
100%
GeForce GTX 1660 Ti Mobile:
58 [X] Lenovo Legion 5 15IMH05H 81Y600D7GE Intel Core i5-10300H 2.5GHz
GeForce GTX 1660 Ti Mobile
min:
32.2 fps, P0.1:
43.1 fps, P1:
46 fps, max:
81.1 fps
fps
48%
GeForce GTX 1650 Mobile:
27.6 [X] Lenovo ThinkBook 15p G2 ITH 21B1000WGE Intel Core i5-11400H 2.7GHz
GeForce GTX 1650 Mobile
min:
18.5 fps, P0.1:
19.5 fps, P1:
20.3 fps, max:
44.3 fps
fps
100%
GeForce GTX 1660 Ti Mobile:
49.6 [X] Lenovo Legion 5 15IMH05H 81Y600D7GE Intel Core i5-10300H 2.5GHz
GeForce GTX 1660 Ti Mobile
min:
39.5 fps, P0.1:
39.7 fps, P1:
41.3 fps, max:
63.8 fps
fps
42%
GeForce GTX 1650 Mobile:
20.8 [X] Lenovo ThinkBook 15p G2 ITH 21B1000WGE Intel Core i5-11400H 2.7GHz
GeForce GTX 1650 Mobile
min:
15 fps, P0.1:
15 fps, P1:
15.3 fps, max:
31.6 fps
fps
100%
GeForce GTX 1660 Ti Mobile:
40.3 [X] Lenovo Legion 5 15IMH05H 81Y600D7GE Intel Core i5-10300H 2.5GHz
GeForce GTX 1660 Ti Mobile
min:
27.1 fps, P0.1:
27.2 fps, P1:
28.4 fps, max:
57.5 fps
fps
37%
GeForce GTX 1650 Mobile:
15.1 [X] Lenovo ThinkBook 15p G2 ITH 21B1000WGE Intel Core i5-11400H 2.7GHz
GeForce GTX 1650 Mobile
min:
9.65 fps, P0.1:
9.65 fps, P1:
9.74 fps, max:
25.3 fps
fps
100%
GeForce GTX 1660 Ti Mobile:
36.3 [X] Lenovo Legion 5 15IMH05H 81Y600D7GE Intel Core i5-10300H 2.5GHz
GeForce GTX 1660 Ti Mobile
min:
22.6 fps, P0.1:
24.9 fps, P1:
25.8 fps, max:
46.5 fps
fps
36%
GeForce GTX 1650 Mobile:
12.9 [X] Lenovo ThinkBook 15p G2 ITH 21B1000WGE Intel Core i5-11400H 2.7GHz
GeForce GTX 1650 Mobile
min:
8.39 fps, P0.1:
8.43 fps, P1:
8.64 fps, max:
21.6 fps
fps
100%
GeForce GTX 1660 Ti Mobile:
158.4 [X] Lenovo Legion 5 15IMH05H 81Y600D7GE 1070925
Intel Core i5-10300H 2.5GHz
GeForce GTX 1660 Ti Mobile
min:
136 fps, P1:
100 fps, max:
177 fps
fps
69%
GeForce GTX 1650 Mobile:
109.8 [X] Lenovo ThinkBook 15p G2 ITH 21B1000WGE 1070925
Intel Core i5-11400H 2.7GHz
GeForce GTX 1650 Mobile
min:
93 fps, P1:
89 fps, max:
128 fps
fps
100%
GeForce GTX 1660 Ti Mobile:
149.4 [X] Lenovo Legion 5 15IMH05H 81Y600D7GE 1070925
Intel Core i5-10300H 2.5GHz
GeForce GTX 1660 Ti Mobile
min:
122 fps, P1:
96 fps, max:
164 fps
fps
66%
GeForce GTX 1650 Mobile:
98.4 [X] Lenovo ThinkBook 15p G2 ITH 21B1000WGE 1070925
Intel Core i5-11400H 2.7GHz
GeForce GTX 1650 Mobile
min:
86 fps, P1:
82 fps, max:
114 fps
fps
100%
GeForce GTX 1660 Ti Mobile:
108.5 [X] Lenovo Legion 5 15IMH05H 81Y600D7GE 1070925
Intel Core i5-10300H 2.5GHz
GeForce GTX 1660 Ti Mobile
min:
92 fps, P1:
82 fps, max:
121 fps
fps
61%
GeForce GTX 1650 Mobile:
65.7 [X] Lenovo ThinkBook 15p G2 ITH 21B1000WGE 1070925
Intel Core i5-11400H 2.7GHz
GeForce GTX 1650 Mobile
min:
44 fps, P1:
55 fps, max:
74 fps
fps
100%
GeForce GTX 1660 Ti Mobile:
80.1 [X] Lenovo Legion 5 15IMH05H 81Y600D7GE 1070925
Intel Core i5-10300H 2.5GHz
GeForce GTX 1660 Ti Mobile
min:
63 fps, P1:
66 fps, max:
92 fps
fps
48%
GeForce GTX 1650 Mobile:
38.4 [X] Lenovo ThinkBook 15p G2 ITH 21B1000WGE 1070925
Intel Core i5-11400H 2.7GHz
GeForce GTX 1650 Mobile
min:
22 fps, P1:
30 fps, max:
49 fps
fps
100%
GeForce GTX 1660 Ti Mobile:
148.4 [X] Lenovo Legion 5 15IMH05H 81Y600D7GE Intel Core i5-10300H 2.5GHz
GeForce GTX 1660 Ti Mobile
min:
43 fps, P0.1:
81.3 fps, P1:
102.6 fps, max:
256 fps
fps
62%
GeForce GTX 1650 Mobile:
91.3 [X] Lenovo ThinkBook 15p G2 ITH 21B1000WGE Intel Core i5-11400H 2.7GHz
GeForce GTX 1650 Mobile
min:
48 fps, P0.1:
51.1 fps, P1:
63.9 fps, max:
191.5 fps
fps
100%
GeForce GTX 1660 Ti Mobile:
129.4 [X] Lenovo Legion 5 15IMH05H 81Y600D7GE Intel Core i5-10300H 2.5GHz
GeForce GTX 1660 Ti Mobile
min:
30.1 fps, P0.1:
55.8 fps, P1:
82.6 fps, max:
234 fps
fps
61%
GeForce GTX 1650 Mobile:
78.5 [X] Lenovo ThinkBook 15p G2 ITH 21B1000WGE Intel Core i5-11400H 2.7GHz
GeForce GTX 1650 Mobile
min:
31.1 fps, P0.1:
36.1 fps, P1:
55.7 fps, max:
190 fps
fps
100%
GeForce GTX 1660 Ti Mobile:
112.8 [X] Lenovo Legion 5 15IMH05H 81Y600D7GE Intel Core i5-10300H 2.5GHz
GeForce GTX 1660 Ti Mobile
min:
38.3 fps, P0.1:
50 fps, P1:
68.9 fps, max:
273 fps
fps
64%
GeForce GTX 1650 Mobile:
72.1 [X] Lenovo ThinkBook 15p G2 ITH 21B1000WGE Intel Core i5-11400H 2.7GHz
GeForce GTX 1650 Mobile
min:
22.3 fps, P0.1:
27.4 fps, P1:
49.9 fps, max:
206 fps
fps
100%
GeForce GTX 1660 Ti Mobile:
94.3 [X] Lenovo Legion 5 15IMH05H 81Y600D7GE Intel Core i5-10300H 2.5GHz
GeForce GTX 1660 Ti Mobile
min:
11.6 fps, P0.1:
18.2 fps, P1:
40.7 fps, max:
244 fps
fps
62%
GeForce GTX 1650 Mobile:
58.5 [X] Lenovo ThinkBook 15p G2 ITH 21B1000WGE Intel Core i5-11400H 2.7GHz
GeForce GTX 1650 Mobile
min:
12.8 fps, P0.1:
16.5 fps, P1:
33.7 fps, max:
217 fps
fps
100%
GeForce GTX 1660 Ti Mobile:
48.2 [X] Lenovo Legion 5 15IMH05H 81Y600D7GE Intel Core i5-10300H 2.5GHz
GeForce GTX 1660 Ti Mobile
min:
26 fps, P0.1:
28 fps, P1:
33.1 fps, max:
134.8 fps
fps
60%
GeForce GTX 1650 Mobile:
28.8 [X] Lenovo ThinkBook 15p G2 ITH 21B1000WGE Intel Core i5-11400H 2.7GHz
GeForce GTX 1650 Mobile
min:
12.5 fps, P0.1:
15 fps, P1:
19.5 fps, max:
106.1 fps
fps
100%
GeForce GTX 1660 Ti Mobile:
41.5 [X] Lenovo Legion 5 15IMH05H 81Y600D7GE Intel Core i5-10300H 2.5GHz
GeForce GTX 1660 Ti Mobile
min:
20.3 fps, P0.1:
21.4 fps, P1:
27.1 fps, max:
133.2 fps
fps
57%
GeForce GTX 1650 Mobile:
23.6 [X] Lenovo ThinkBook 15p G2 ITH 21B1000WGE Intel Core i5-11400H 2.7GHz
GeForce GTX 1650 Mobile
min:
11.6 fps, P0.1:
12 fps, P1:
14.6 fps, max:
84 fps
fps
100%
GeForce GTX 1660 Ti Mobile:
39.2 [X] Lenovo Legion 5 15IMH05H 81Y600D7GE Intel Core i5-10300H 2.5GHz
GeForce GTX 1660 Ti Mobile
min:
19.9 fps, P0.1:
21 fps, P1:
26.8 fps, max:
96.4 fps
fps
57%
GeForce GTX 1650 Mobile:
22.4 [X] Lenovo ThinkBook 15p G2 ITH 21B1000WGE Intel Core i5-11400H 2.7GHz
GeForce GTX 1650 Mobile
min:
11.7 fps, P0.1:
12.2 fps, P1:
13.3 fps, max:
89.1 fps
fps
100%
GeForce GTX 1660 Ti Mobile:
37 [X] Lenovo Legion 5 15IMH05H 81Y600D7GE Intel Core i5-10300H 2.5GHz
GeForce GTX 1660 Ti Mobile
min:
16.1 fps, P0.1:
18.1 fps, P1:
24.5 fps, max:
99.9 fps
fps
57%
GeForce GTX 1650 Mobile:
21.1 [X] Lenovo ThinkBook 15p G2 ITH 21B1000WGE Intel Core i5-11400H 2.7GHz
GeForce GTX 1650 Mobile
min:
10.1 fps, P0.1:
10.7 fps, P1:
13.3 fps, max:
105.1 fps
fps
100%
GeForce GTX 1660 Ti Mobile:
134.3 [X] Lenovo Legion 5 15IMH05H 81Y600D7GE Intel Core i5-10300H 2.5GHz
GeForce GTX 1660 Ti Mobile
min:
44.5 fps, P0.1:
57.2 fps, P1:
86.8 fps, max:
233 fps
fps
69%
GeForce GTX 1650 Mobile:
92.4 [X] Lenovo ThinkBook 15p G2 ITH 21B1000WGE Intel Core i5-11400H 2.7GHz
GeForce GTX 1650 Mobile
min:
50.9 fps, P0.1:
51.6 fps, P1:
55.4 fps, max:
192.7 fps
fps
100%
GeForce GTX 1660 Ti Mobile:
119.1 [X] Lenovo Legion 5 15IMH05H 81Y600D7GE Intel Core i5-10300H 2.5GHz
GeForce GTX 1660 Ti Mobile
min:
41.2 fps, P0.1:
58.7 fps, P1:
76.1 fps, max:
227 fps
fps
63%
GeForce GTX 1650 Mobile:
75.3 [X] Lenovo ThinkBook 15p G2 ITH 21B1000WGE Intel Core i5-11400H 2.7GHz
GeForce GTX 1650 Mobile
min:
12.9 fps, P0.1:
14.4 fps, P1:
40.3 fps, max:
199.4 fps
fps
100%
GeForce GTX 1660 Ti Mobile:
86.1 [X] Lenovo Legion 5 15IMH05H 81Y600D7GE Intel Core i5-10300H 2.5GHz
GeForce GTX 1660 Ti Mobile
min:
49.4 fps, P0.1:
52.9 fps, P1:
57.6 fps, max:
199.4 fps
fps
58%
GeForce GTX 1650 Mobile:
49.7 [X] Lenovo ThinkBook 15p G2 ITH 21B1000WGE Intel Core i5-11400H 2.7GHz
GeForce GTX 1650 Mobile
min:
10.9 fps, P0.1:
15.8 fps, P1:
25.5 fps, max:
184.7 fps
fps
100%
GeForce GTX 1660 Ti Mobile:
63.9 [X] Lenovo Legion 5 15IMH05H 81Y600D7GE Intel Core i5-10300H 2.5GHz
GeForce GTX 1660 Ti Mobile
min:
8.89 fps, P0.1:
14.7 fps, P1:
37 fps, max:
164.3 fps
fps
61%
GeForce GTX 1650 Mobile:
38.8 [X] Lenovo ThinkBook 15p G2 ITH 21B1000WGE Intel Core i5-11400H 2.7GHz
GeForce GTX 1650 Mobile
min:
12.5 fps, P0.1:
14.5 fps, P1:
20.4 fps, max:
134.4 fps
fps
100%
GeForce GTX 1660 Ti Mobile:
59.6 [X] Lenovo Legion 5 15IMH05H 81Y600D7GE Intel Core i5-10300H 2.5GHz
GeForce GTX 1660 Ti Mobile
min:
18.1 fps, P0.1:
25.8 fps, P1:
35.5 fps, max:
206 fps
fps
58%
GeForce GTX 1650 Mobile:
34.5 [X] Lenovo ThinkBook 15p G2 ITH 21B1000WGE Intel Core i5-11400H 2.7GHz
GeForce GTX 1650 Mobile
min:
26.4 fps, P0.1:
27.2 fps, P1:
27.8 fps, max:
61.4 fps
fps
100%
GeForce GTX 1660 Ti Mobile:
48.4 [X] Lenovo Legion 5 15IMH05H 81Y600D7GE Intel Core i5-10300H 2.5GHz
GeForce GTX 1660 Ti Mobile
min:
22 fps, P0.1:
22.5 fps, P1:
28.5 fps, max:
184 fps
fps
54%
GeForce GTX 1650 Mobile:
25.9 [X] Lenovo ThinkBook 15p G2 ITH 21B1000WGE Intel Core i5-11400H 2.7GHz
GeForce GTX 1650 Mobile
min:
18.5 fps, P0.1:
20.4 fps, P1:
21.6 fps, max:
40 fps
fps
100%
GeForce GTX 1660 Ti Mobile:
42.2 [X] Lenovo Legion 5 15IMH05H 81Y600D7GE Intel Core i5-10300H 2.5GHz
GeForce GTX 1660 Ti Mobile
min:
20.3 fps, P0.1:
21.7 fps, P1:
24.2 fps, max:
138.3 fps
fps
46%
GeForce GTX 1650 Mobile:
19.3 [X] Lenovo ThinkBook 15p G2 ITH 21B1000WGE Intel Core i5-11400H 2.7GHz
GeForce GTX 1650 Mobile
min:
3.14 fps, P0.1:
4.39 fps, P1:
15 fps, max:
28.8 fps
fps
100%
GeForce GTX 1660 Ti Mobile:
31.6 [X] Lenovo Legion 5 15IMH05H 81Y600D7GE Intel Core i5-10300H 2.5GHz
GeForce GTX 1660 Ti Mobile
min:
7.8 fps, P0.1:
8.52 fps, P1:
20.7 fps, max:
94.3 fps
fps
100%
GeForce GTX 1660 Ti Mobile:
75.1 [X] Lenovo Legion 5 15IMH05H 81Y600D7GE Intel Core i5-10300H 2.5GHz
GeForce GTX 1660 Ti Mobile
min:
3 fps, P0.1:
8.71 fps, P1:
63.5 fps, max:
124.8 fps
fps
61%
GeForce GTX 1650 Mobile:
46.1 [X] Lenovo ThinkBook 15p G2 ITH 21B1000WGE Intel Core i5-11400H 2.7GHz
GeForce GTX 1650 Mobile
min:
15.1 fps, P0.1:
23 fps, P1:
35.8 fps, max:
82.6 fps
fps
100%
GeForce GTX 1660 Ti Mobile:
56.1 [X] Lenovo Legion 5 15IMH05H 81Y600D7GE Intel Core i5-10300H 2.5GHz
GeForce GTX 1660 Ti Mobile
min:
4.91 fps, P0.1:
14.3 fps, P1:
45.3 fps, max:
100.9 fps
fps
58%
GeForce GTX 1650 Mobile:
32.6 [X] Lenovo ThinkBook 15p G2 ITH 21B1000WGE Intel Core i5-11400H 2.7GHz
GeForce GTX 1650 Mobile
min:
16.8 fps, P0.1:
20.5 fps, P1:
25.3 fps, max:
51.5 fps
fps
100%
GeForce GTX 1660 Ti Mobile:
49.7 [X] Lenovo Legion 5 15IMH05H 81Y600D7GE Intel Core i5-10300H 2.5GHz
GeForce GTX 1660 Ti Mobile
min:
18.6 fps, P0.1:
28.8 fps, P1:
39.8 fps, max:
87.5 fps
fps
58%
GeForce GTX 1650 Mobile:
28.6 [X] Lenovo ThinkBook 15p G2 ITH 21B1000WGE Intel Core i5-11400H 2.7GHz
GeForce GTX 1650 Mobile
min:
6.73 fps, P0.1:
11.4 fps, P1:
22.5 fps, max:
46.7 fps
fps
100%
GeForce GTX 1660 Ti Mobile:
43.6 [X] Lenovo Legion 5 15IMH05H 81Y600D7GE Intel Core i5-10300H 2.5GHz
GeForce GTX 1660 Ti Mobile
min:
22.8 fps, P0.1:
26.2 fps, P1:
29.9 fps, max:
68.7 fps
fps
31%
GeForce GTX 1650 Mobile:
13.7 [X] Lenovo ThinkBook 15p G2 ITH 21B1000WGE Intel Core i5-11400H 2.7GHz
GeForce GTX 1650 Mobile
min:
7.74 fps, P0.1:
7.89 fps, P1:
9.5 fps, max:
24.1 fps
fps
100%
GeForce GTX 1660 Ti Mobile:
98.5 [X] Lenovo Legion 5 15IMH05H 81Y600D7GE Intel Core i5-10300H 2.5GHz
GeForce GTX 1660 Ti Mobile
P0.1:
35 fpsP1:
52.8 fps
fps
66%
GeForce GTX 1650 Mobile:
65.4 [X] Lenovo ThinkBook 15p G2 ITH 21B1000WGE Intel Core i5-11400H 2.7GHz
GeForce GTX 1650 Mobile
P0.1:
36.5 fpsP1:
44.3 fps
fps
100%
GeForce GTX 1660 Ti Mobile:
89.1 [X] Lenovo Legion 5 15IMH05H 81Y600D7GE Intel Core i5-10300H 2.5GHz
GeForce GTX 1660 Ti Mobile
P0.1:
34 fpsP1:
50.5 fps
fps
64%
GeForce GTX 1650 Mobile:
57.4 [X] Lenovo ThinkBook 15p G2 ITH 21B1000WGE Intel Core i5-11400H 2.7GHz
GeForce GTX 1650 Mobile
P0.1:
33.6 fpsP1:
40.3 fps
fps
100%
GeForce GTX 1660 Ti Mobile:
52.3 [X] Lenovo Legion 5 15IMH05H 81Y600D7GE Intel Core i5-10300H 2.5GHz
GeForce GTX 1660 Ti Mobile
P0.1:
22.1 fpsP1:
32.3 fps
fps
85%
GeForce GTX 1650 Mobile:
44.6 [X] Lenovo ThinkBook 15p G2 ITH 21B1000WGE Intel Core i5-11400H 2.7GHz
GeForce GTX 1650 Mobile
P0.1:
25.9 fpsP1:
32.1 fps
fps
100%
GeForce GTX 1660 Ti Mobile:
52.7 [X] Lenovo Legion 5 15IMH05H 81Y600D7GE Intel Core i5-10300H 2.5GHz
GeForce GTX 1660 Ti Mobile
P0.1:
27.5 fpsP1:
35.2 fps
fps
86%
GeForce GTX 1650 Mobile:
45.3 [X] Lenovo ThinkBook 15p G2 ITH 21B1000WGE Intel Core i5-11400H 2.7GHz
GeForce GTX 1650 Mobile
P0.1:
33.2 fpsP1:
36.4 fps
fps
100%
GeForce GTX 1660 Ti Mobile:
72.9 [X] Lenovo Legion 5 15IMH05H 81Y600D7GE Intel Core i5-10300H 2.5GHz
GeForce GTX 1660 Ti Mobile
min:
28 fps, P0.1:
38.6 fps, P1:
59.3 fps, max:
95.3 fps
fps
73%
GeForce GTX 1650 Mobile:
53 [X] Lenovo ThinkBook 15p G2 ITH 21B1000WGE Intel Core i5-11400H 2.7GHz
GeForce GTX 1650 Mobile
min:
9.74 fps, P0.1:
27.1 fps, P1:
31.8 fps, max:
92 fps
fps
100%
GeForce GTX 1660 Ti Mobile:
55.8 [X] Lenovo Legion 5 15IMH05H 81Y600D7GE Intel Core i5-10300H 2.5GHz
GeForce GTX 1660 Ti Mobile
min:
23.3 fps, P0.1:
33.1 fps, P1:
40.9 fps, max:
94 fps
fps
58%
GeForce GTX 1650 Mobile:
32.3 [X] Lenovo ThinkBook 15p G2 ITH 21B1000WGE Intel Core i5-11400H 2.7GHz
GeForce GTX 1650 Mobile
min:
5.99 fps, P0.1:
8.88 fps, P1:
16.9 fps, max:
87.4 fps
fps
100%
GeForce GTX 1660 Ti Mobile:
55 [X] Lenovo Legion 5 15IMH05H 81Y600D7GE Intel Core i5-10300H 2.5GHz
GeForce GTX 1660 Ti Mobile
min:
32.5 fps, P0.1:
35.6 fps, P1:
39.1 fps, max:
96.8 fps
fps
57%
GeForce GTX 1650 Mobile:
31.5 [X] Lenovo ThinkBook 15p G2 ITH 21B1000WGE Intel Core i5-11400H 2.7GHz
GeForce GTX 1650 Mobile
min:
8.21 fps, P0.1:
9.87 fps, P1:
22 fps, max:
53.8 fps
fps
100%
GeForce GTX 1660 Ti Mobile:
54 [X] Lenovo Legion 5 15IMH05H 81Y600D7GE Intel Core i5-10300H 2.5GHz
GeForce GTX 1660 Ti Mobile
min:
25.6 fps, P0.1:
31.3 fps, P1:
37.8 fps, max:
91.1 fps
fps
56%
GeForce GTX 1650 Mobile:
30.1 [X] Lenovo ThinkBook 15p G2 ITH 21B1000WGE Intel Core i5-11400H 2.7GHz
GeForce GTX 1650 Mobile
min:
16 fps, P0.1:
16.3 fps, P1:
21.8 fps, max:
47.4 fps
fps
100%
GeForce GTX 1660 Ti Mobile:
109 [X] Lenovo Legion 5 15IMH05H 81Y600D7GE Intel Core i5-10300H 2.5GHz
GeForce GTX 1660 Ti Mobile
min:
26.6 fps, P0.1:
66.2 fps, P1:
88.8 fps, max:
162.6 fps
fps
63%
GeForce GTX 1650 Mobile:
68.7 [X] Lenovo ThinkBook 15p G2 ITH 21B1000WGE Intel Core i5-11400H 2.7GHz
GeForce GTX 1650 Mobile
min:
46.1 fps, P0.1:
53.9 fps, P1:
59.5 fps, max:
93.3 fps
fps
100%
GeForce GTX 1660 Ti Mobile:
81.4 [X] Lenovo Legion 5 15IMH05H 81Y600D7GE Intel Core i5-10300H 2.5GHz
GeForce GTX 1660 Ti Mobile
min:
25.1 fps, P0.1:
59.6 fps, P1:
67.7 fps, max:
123.3 fps
fps
62%
GeForce GTX 1650 Mobile:
50.5 [X] Lenovo ThinkBook 15p G2 ITH 21B1000WGE Intel Core i5-11400H 2.7GHz
GeForce GTX 1650 Mobile
min:
38.3 fps, P0.1:
40.1 fps, P1:
43.3 fps, max:
66.7 fps
fps
100%
GeForce GTX 1660 Ti Mobile:
49.6 [X] Lenovo Legion 5 15IMH05H 81Y600D7GE Intel Core i5-10300H 2.5GHz
GeForce GTX 1660 Ti Mobile
min:
30.9 fps, P0.1:
32.2 fps, P1:
43 fps, max:
88.8 fps
fps
61%
GeForce GTX 1650 Mobile:
30.3 [X] Lenovo ThinkBook 15p G2 ITH 21B1000WGE Intel Core i5-11400H 2.7GHz
GeForce GTX 1650 Mobile
min:
21.4 fps, P0.1:
24.7 fps, P1:
26.3 fps, max:
43.8 fps
fps
100%
GeForce GTX 1660 Ti Mobile:
38 [X] Lenovo Legion 5 15IMH05H 81Y600D7GE Intel Core i5-10300H 2.5GHz
GeForce GTX 1660 Ti Mobile
min:
19.1 fps, P0.1:
21.5 fps, P1:
33.6 fps, max:
83.8 fps
fps
61%
GeForce GTX 1650 Mobile:
23 [X] Lenovo ThinkBook 15p G2 ITH 21B1000WGE Intel Core i5-11400H 2.7GHz
GeForce GTX 1650 Mobile
min:
19.3 fps, P0.1:
20.2 fps, P1:
20.7 fps, max:
27.5 fps
fps
100%
GeForce GTX 1660 Ti Mobile:
62 [X] Lenovo Legion 5 15IMH05H 81Y600D7GE Intel Core i5-10300H 2.5GHz
GeForce GTX 1660 Ti Mobile
min:
30 fps, max:
106 fps
fps
63%
GeForce GTX 1650 Mobile:
39 [X] Lenovo ThinkBook 15p G2 ITH 21B1000WGE Intel Core i5-11400H 2.7GHz
GeForce GTX 1650 Mobile
min:
19 fps, max:
63 fps
fps
100%
GeForce GTX 1660 Ti Mobile:
59 [X] Lenovo Legion 5 15IMH05H 81Y600D7GE Intel Core i5-10300H 2.5GHz
GeForce GTX 1660 Ti Mobile
min:
35 fps, max:
130 fps
fps
63%
GeForce GTX 1650 Mobile:
37 [X] Lenovo ThinkBook 15p G2 ITH 21B1000WGE Intel Core i5-11400H 2.7GHz
GeForce GTX 1650 Mobile
min:
18 fps, max:
84 fps
fps
100%
GeForce GTX 1660 Ti Mobile:
52 [X] Lenovo Legion 5 15IMH05H 81Y600D7GE Intel Core i5-10300H 2.5GHz
GeForce GTX 1660 Ti Mobile
min:
26 fps, max:
102 fps
fps
63%
GeForce GTX 1650 Mobile:
33 [X] Lenovo ThinkBook 15p G2 ITH 21B1000WGE Intel Core i5-11400H 2.7GHz
GeForce GTX 1650 Mobile
min:
16 fps, max:
75 fps
fps
100%
GeForce GTX 1660 Ti Mobile:
44 [X] Lenovo Legion 5 15IMH05H 81Y600D7GE Intel Core i5-10300H 2.5GHz
GeForce GTX 1660 Ti Mobile
min:
17 fps, max:
85 fps
fps
52%
GeForce GTX 1650 Mobile:
23 [X] Lenovo ThinkBook 15p G2 ITH 21B1000WGE Intel Core i5-11400H 2.7GHz
GeForce GTX 1650 Mobile
min:
10 fps, max:
37 fps
fps
100%
GeForce GTX 1660 Ti Mobile:
73.8 [X] Lenovo Legion 5 15IMH05H 81Y600D7GE Intel Core i5-10300H 2.5GHz
GeForce GTX 1660 Ti Mobile
min:
30.9 fps, P0.1:
37 fps, P1:
47.3 fps, max:
119.9 fps
fps
69%
GeForce GTX 1650 Mobile:
51.2 [X] Lenovo ThinkBook 15p G2 ITH 21B1000WGE Intel Core i5-11400H 2.7GHz
GeForce GTX 1650 Mobile
min:
27.3 fps, P0.1:
29.6 fps, P1:
38 fps, max:
77.4 fps
fps
100%
GeForce GTX 1660 Ti Mobile:
62.1 [X] Lenovo Legion 5 15IMH05H 81Y600D7GE Intel Core i5-10300H 2.5GHz
GeForce GTX 1660 Ti Mobile
min:
25.4 fps, P0.1:
26.3 fps, P1:
33.2 fps, max:
101.8 fps
fps
60%
GeForce GTX 1650 Mobile:
37.5 [X] Lenovo ThinkBook 15p G2 ITH 21B1000WGE Intel Core i5-11400H 2.7GHz
GeForce GTX 1650 Mobile
min:
7.18 fps, P0.1:
16.9 fps, P1:
27.2 fps, max:
75.5 fps
fps
100%
GeForce GTX 1660 Ti Mobile:
47.6 [X] Lenovo Legion 5 15IMH05H 81Y600D7GE Intel Core i5-10300H 2.5GHz
GeForce GTX 1660 Ti Mobile
min:
19 fps, P0.1:
20.6 fps, P1:
23.1 fps, max:
91.6 fps
fps
60%
GeForce GTX 1650 Mobile:
28.5 [X] Lenovo ThinkBook 15p G2 ITH 21B1000WGE Intel Core i5-11400H 2.7GHz
GeForce GTX 1650 Mobile
min:
14.6 fps, P0.1:
15.8 fps, P1:
20.3 fps, max:
73.1 fps
fps
100%
GeForce GTX 1660 Ti Mobile:
35.4 [X] Lenovo Legion 5 15IMH05H 81Y600D7GE Intel Core i5-10300H 2.5GHz
GeForce GTX 1660 Ti Mobile
min:
15.7 fps, P0.1:
16 fps, P1:
18 fps, max:
83.1 fps
fps
52%
GeForce GTX 1650 Mobile:
18.4 [X] Lenovo ThinkBook 15p G2 ITH 21B1000WGE Intel Core i5-11400H 2.7GHz
GeForce GTX 1650 Mobile
min:
8.25 fps, P0.1:
8.39 fps, P1:
11.1 fps, max:
47.4 fps
fps
100%
GeForce GTX 1660 Ti Mobile:
50.7 [X] Lenovo Legion 5 15IMH05H 81Y600D7GE Intel Core i5-10300H 2.5GHz
GeForce GTX 1660 Ti Mobile
min:
18.8 fps, P0.1:
19.8 fps, P1:
23.8 fps, max:
137.1 fps
fps
62%
GeForce GTX 1650 Mobile:
31.3 [X] Lenovo ThinkBook 15p G2 ITH 21B1000WGE Intel Core i5-11400H 2.7GHz
GeForce GTX 1650 Mobile
min:
7.3 fps, P0.1:
9.97 fps, P1:
22.4 fps, max:
79.3 fps
fps
100%
GeForce GTX 1660 Ti Mobile:
47.1 [X] Lenovo Legion 5 15IMH05H 81Y600D7GE Intel Core i5-10300H 2.5GHz
GeForce GTX 1660 Ti Mobile
min:
16.8 fps, P0.1:
17.8 fps, P1:
21.8 fps, max:
126.6 fps
fps
54%
GeForce GTX 1650 Mobile:
25.6 [X] Lenovo ThinkBook 15p G2 ITH 21B1000WGE Intel Core i5-11400H 2.7GHz
GeForce GTX 1650 Mobile
min:
12.5 fps, P0.1:
14.2 fps, P1:
19.1 fps, max:
65.7 fps
fps
100%
GeForce GTX 1660 Ti Mobile:
40.4 [X] Lenovo Legion 5 15IMH05H 81Y600D7GE Intel Core i5-10300H 2.5GHz
GeForce GTX 1660 Ti Mobile
min:
16.2 fps, P0.1:
16.8 fps, P1:
19.2 fps, max:
119.2 fps
fps
54%
GeForce GTX 1650 Mobile:
21.8 [X] Lenovo ThinkBook 15p G2 ITH 21B1000WGE Intel Core i5-11400H 2.7GHz
GeForce GTX 1650 Mobile
min:
11.3 fps, P0.1:
11.8 fps, P1:
15.2 fps, max:
52.6 fps
fps
100%
GeForce GTX 1660 Ti Mobile:
39.8 [X] Lenovo Legion 5 15IMH05H 81Y600D7GE Intel Core i5-10300H 2.5GHz
GeForce GTX 1660 Ti Mobile
min:
14.2 fps, P0.1:
15.2 fps, P1:
17.6 fps, max:
109.5 fps
fps
38%
GeForce GTX 1650 Mobile:
15 [X] Lenovo ThinkBook 15p G2 ITH 21B1000WGE Intel Core i5-11400H 2.7GHz
GeForce GTX 1650 Mobile
min:
11.1 fps, P0.1:
11.2 fps, P1:
11.8 fps, max:
20.8 fps
fps
100%
GeForce GTX 1660 Ti Mobile:
134 [X] Lenovo Legion 5 15IMH05H 81Y600D7GE Intel Core i5-10300H 2.5GHz
GeForce GTX 1660 Ti Mobile
min:
7.6 fps, P0.1:
55 fps, P1:
94.6 fps, max:
211 fps
fps
59%
GeForce GTX 1650 Mobile:
79.4 [X] Lenovo ThinkBook 15p G2 ITH 21B1000WGE Intel Core i5-11400H 2.7GHz
GeForce GTX 1650 Mobile
min:
8.99 fps, P0.1:
49.6 fps, P1:
61.5 fps, max:
177.9 fps
fps
100%
GeForce GTX 1660 Ti Mobile:
101.4 [X] Lenovo Legion 5 15IMH05H 81Y600D7GE Intel Core i5-10300H 2.5GHz
GeForce GTX 1660 Ti Mobile
min:
7.53 fps, P0.1:
38.8 fps, P1:
46.1 fps, max:
187.6 fps
fps
58%
GeForce GTX 1650 Mobile:
58.7 [X] Lenovo ThinkBook 15p G2 ITH 21B1000WGE Intel Core i5-11400H 2.7GHz
GeForce GTX 1650 Mobile
min:
8.97 fps, P0.1:
38.4 fps, P1:
47.9 fps, max:
154.8 fps
fps
100%
GeForce GTX 1660 Ti Mobile:
43.2 [X] Lenovo Legion 5 15IMH05H 81Y600D7GE Intel Core i5-10300H 2.5GHz
GeForce GTX 1660 Ti Mobile
min:
8.62 fps, P0.1:
18.7 fps, P1:
27.1 fps, max:
128.8 fps
fps
49%
GeForce GTX 1650 Mobile:
19.6 [X] Lenovo ThinkBook 15p G2 ITH 21B1000WGE Intel Core i5-11400H 2.7GHz
GeForce GTX 1650 Mobile
min:
12.5 fps, P0.1:
15.7 fps, P1:
16.8 fps, max:
54.3 fps
22.9 [X] Lenovo ThinkBook 15p G2 ITH 21B1000WGE Intel Core i5-11400H 2.7GHz
GeForce GTX 1650 Mobile
min:
10.9 fps, P0.1:
17.8 fps, P1:
20 fps, max:
81.8 fps
~ 21 fps
100%
GeForce GTX 1660 Ti Mobile:
37 [X] Lenovo Legion 5 15IMH05H 81Y600D7GE Intel Core i5-10300H 2.5GHz
GeForce GTX 1660 Ti Mobile
min:
9.07 fps, P0.1:
17.3 fps, P1:
25.6 fps, max:
123 fps
fps
100%
GeForce GTX 1660 Ti Mobile:
143.6 [X] Lenovo Legion 5 15IMH05H 81Y600D7GE Intel Core i5-10300H 2.5GHz
GeForce GTX 1660 Ti Mobile
min:
8.13 fps, P0.1:
54.3 fps, P1:
89.6 fps, max:
259 fps
fps
77%
GeForce GTX 1650 Mobile:
111.2 [X] Lenovo ThinkBook 15p G2 ITH 21B1000WGE Intel Core i5-11400H 2.7GHz
GeForce GTX 1650 Mobile
min:
36.9 fps, P0.1:
43.6 fps, P1:
60.5 fps, max:
225 fps
fps
100%
GeForce GTX 1660 Ti Mobile:
95.8 [X] Lenovo Legion 5 15IMH05H 81Y600D7GE Intel Core i5-10300H 2.5GHz
GeForce GTX 1660 Ti Mobile
min:
39.8 fps, P0.1:
46 fps, P1:
58 fps, max:
232 fps
fps
63%
GeForce GTX 1650 Mobile:
60.7 [X] Lenovo ThinkBook 15p G2 ITH 21B1000WGE Intel Core i5-11400H 2.7GHz
GeForce GTX 1650 Mobile
fps
100%
GeForce GTX 1660 Ti Mobile:
77.7 [X] Lenovo Legion 5 15IMH05H 81Y600D7GE Intel Core i5-10300H 2.5GHz
GeForce GTX 1660 Ti Mobile
min:
29.1 fps, P0.1:
31.1 fps, P1:
40.1 fps, max:
208 fps
fps
63%
GeForce GTX 1650 Mobile:
48.7 [X] Lenovo ThinkBook 15p G2 ITH 21B1000WGE Intel Core i5-11400H 2.7GHz
GeForce GTX 1650 Mobile
min:
20.6 fps, P0.1:
22.7 fps, P1:
28.4 fps, max:
182.2 fps
fps
100%
GeForce GTX 1660 Ti Mobile:
61.2 [X] Lenovo Legion 5 15IMH05H 81Y600D7GE Intel Core i5-10300H 2.5GHz
GeForce GTX 1660 Ti Mobile
min:
24.9 fps, P0.1:
27.1 fps, P1:
33.7 fps, max:
180.3 fps
fps
65%
GeForce GTX 1650 Mobile:
39.9 [X] Lenovo ThinkBook 15p G2 ITH 21B1000WGE Intel Core i5-11400H 2.7GHz
GeForce GTX 1650 Mobile
min:
14.7 fps, P0.1:
15 fps, P1:
19.4 fps, max:
166.2 fps
fps
100%
GeForce GTX 1660 Ti Mobile:
81.3 [X] Lenovo Legion 5 15IMH05H 81Y600D7GE Intel Core i5-10300H 2.5GHz
GeForce GTX 1660 Ti Mobile
fps
65%
GeForce GTX 1650 Mobile:
52.7 [X] Lenovo ThinkBook 15p G2 ITH 21B1000WGE Intel Core i5-11400H 2.7GHz
GeForce GTX 1650 Mobile
fps
100%
GeForce GTX 1660 Ti Mobile:
81.6 [X] Lenovo Legion 5 15IMH05H 81Y600D7GE Intel Core i5-10300H 2.5GHz
GeForce GTX 1660 Ti Mobile
fps
65%
GeForce GTX 1650 Mobile:
53.1 [X] Lenovo ThinkBook 15p G2 ITH 21B1000WGE Intel Core i5-11400H 2.7GHz
GeForce GTX 1650 Mobile
fps
100%
GeForce GTX 1660 Ti Mobile:
81 [X] Lenovo Legion 5 15IMH05H 81Y600D7GE Intel Core i5-10300H 2.5GHz
GeForce GTX 1660 Ti Mobile
fps
65%
GeForce GTX 1650 Mobile:
53 [X] Lenovo ThinkBook 15p G2 ITH 21B1000WGE Intel Core i5-11400H 2.7GHz
GeForce GTX 1650 Mobile
fps
100%
GeForce GTX 1660 Ti Mobile:
81.4 [X] Lenovo Legion 5 15IMH05H 81Y600D7GE Intel Core i5-10300H 2.5GHz
GeForce GTX 1660 Ti Mobile
fps
65%
GeForce GTX 1650 Mobile:
53.2 [X] Lenovo ThinkBook 15p G2 ITH 21B1000WGE Intel Core i5-11400H 2.7GHz
GeForce GTX 1650 Mobile
fps
100%
GeForce GTX 1660 Ti Mobile:
92.7 [X] Lenovo Legion 5 15IMH05H 81Y600D7GE Intel Core i5-10300H 2.5GHz
GeForce GTX 1660 Ti Mobile
min:
40.2 fps, P0.1:
57.6 fps, P1:
66.8 fps, max:
158.9 fps
fps
64%
GeForce GTX 1650 Mobile:
59.5 [X] Lenovo ThinkBook 15p G2 ITH 21B1000WGE Intel Core i5-11400H 2.7GHz
GeForce GTX 1650 Mobile
min:
30.3 fps, P0.1:
43 fps, P1:
46.2 fps, max:
94.4 fps
fps
100%
GeForce GTX 1660 Ti Mobile:
83.8 [X] Lenovo Legion 5 15IMH05H 81Y600D7GE Intel Core i5-10300H 2.5GHz
GeForce GTX 1660 Ti Mobile
min:
37.7 fps, P0.1:
54.3 fps, P1:
63.7 fps, max:
124.1 fps
fps
63%
GeForce GTX 1650 Mobile:
53 [X] Lenovo ThinkBook 15p G2 ITH 21B1000WGE Intel Core i5-11400H 2.7GHz
GeForce GTX 1650 Mobile
min:
10 fps, P0.1:
39.9 fps, P1:
43.8 fps, max:
89.1 fps
fps
100%
GeForce GTX 1660 Ti Mobile:
67 [X] Lenovo Legion 5 15IMH05H 81Y600D7GE Intel Core i5-10300H 2.5GHz
GeForce GTX 1660 Ti Mobile
min:
5.32 fps, P0.1:
34.6 fps, P1:
49.3 fps, max:
253 fps
fps
49%
GeForce GTX 1650 Mobile:
33 [X] Lenovo ThinkBook 15p G2 ITH 21B1000WGE Intel Core i5-11400H 2.7GHz
GeForce GTX 1650 Mobile
min:
2.18 fps, P0.1:
6.69 fps, P1:
23 fps, max:
86 fps
fps
100%
GeForce GTX 1660 Ti Mobile:
57 [X] Lenovo Legion 5 15IMH05H 81Y600D7GE Intel Core i5-10300H 2.5GHz
GeForce GTX 1660 Ti Mobile
min:
16.9 fps, P0.1:
29.8 fps, P1:
40.5 fps, max:
86.3 fps
fps
39%
GeForce GTX 1650 Mobile:
22.2 [X] Lenovo ThinkBook 15p G2 ITH 21B1000WGE Intel Core i5-11400H 2.7GHz
GeForce GTX 1650 Mobile
min:
1.739 fps, P0.1:
11.4 fps, P1:
16.7 fps, max:
71.6 fps
fps
100%
GeForce GTX 1660 Ti Mobile:
81.7 [X] Lenovo Legion 5 15IMH05H 81Y600D7GE Intel Core i5-10300H 2.5GHz
GeForce GTX 1660 Ti Mobile
min:
54.4 fps, P0.1:
56.8 fps, P1:
65.7 fps, max:
127.8 fps
fps
70%
GeForce GTX 1650 Mobile:
57.4 [X] Lenovo ThinkBook 15p G2 ITH 21B1000WGE Intel Core i5-11400H 2.7GHz
GeForce GTX 1650 Mobile
min:
46.4 fps, P0.1:
47 fps, P1:
49.5 fps, max:
76.6 fps
fps
100%
GeForce GTX 1660 Ti Mobile:
80.8 [X] Lenovo Legion 5 15IMH05H 81Y600D7GE Intel Core i5-10300H 2.5GHz
GeForce GTX 1660 Ti Mobile
min:
43.9 fps, P0.1:
47.5 fps, P1:
60.4 fps, max:
155.7 fps
fps
50%
GeForce GTX 1650 Mobile:
40.6 [X] Lenovo ThinkBook 15p G2 ITH 21B1000WGE Intel Core i5-11400H 2.7GHz
GeForce GTX 1650 Mobile
min:
17 fps, P0.1:
17.1 fps, P1:
31 fps, max:
69.2 fps
fps
100%
GeForce GTX 1660 Ti Mobile:
75.6 [X] Lenovo Legion 5 15IMH05H 81Y600D7GE Intel Core i5-10300H 2.5GHz
GeForce GTX 1660 Ti Mobile
min:
50.9 fps, P0.1:
54.3 fps, P1:
60.1 fps, max:
102.1 fps
fps
45%
GeForce GTX 1650 Mobile:
34.1 [X] Lenovo ThinkBook 15p G2 ITH 21B1000WGE Intel Core i5-11400H 2.7GHz
GeForce GTX 1650 Mobile
min:
25.3 fps, P0.1:
25.4 fps, P1:
26.8 fps, max:
57.4 fps
fps
100%
GeForce GTX 1660 Ti Mobile:
67.2 [X] Lenovo Legion 5 15IMH05H 81Y600D7GE Intel Core i5-10300H 2.5GHz
GeForce GTX 1660 Ti Mobile
min:
41 fps, P0.1:
42.5 fps, P1:
52.2 fps, max:
116.7 fps
fps
44%
GeForce GTX 1650 Mobile:
29.4 [X] Lenovo ThinkBook 15p G2 ITH 21B1000WGE Intel Core i5-11400H 2.7GHz
GeForce GTX 1650 Mobile
min:
21.6 fps, P0.1:
21.8 fps, P1:
23.4 fps, max:
47.9 fps
fps
100%
GeForce GTX 1660 Ti Mobile:
57.6 [X] Lenovo Legion 5 15IMH05H 81Y600D7GE Intel Core i5-10300H 2.5GHz
GeForce GTX 1660 Ti Mobile
min:
41.9 fps, P0.1:
43.1 fps, P1:
47.2 fps, max:
67 fps
fps
68%
GeForce GTX 1650 Mobile:
38.9 [X] Lenovo ThinkBook 15p G2 ITH 21B1000WGE Intel Core i5-11400H 2.7GHz
GeForce GTX 1650 Mobile
min:
34.8 fps, P0.1:
34.8 fps, P1:
35.7 fps, max:
44.1 fps
fps
100%
GeForce GTX 1660 Ti Mobile:
54.6 [X] Lenovo Legion 5 15IMH05H 81Y600D7GE Intel Core i5-10300H 2.5GHz
GeForce GTX 1660 Ti Mobile
min:
15.9 fps, P0.1:
16.9 fps, P1:
32.8 fps, max:
137.4 fps
fps
54%
GeForce GTX 1650 Mobile:
29.3 [X] Lenovo ThinkBook 15p G2 ITH 21B1000WGE Intel Core i5-11400H 2.7GHz
GeForce GTX 1650 Mobile
min:
24.4 fps, P0.1:
25.4 fps, P1:
26.8 fps, max:
31.6 fps
fps
100%
GeForce GTX 1660 Ti Mobile:
50.7 [X] Lenovo Legion 5 15IMH05H 81Y600D7GE Intel Core i5-10300H 2.5GHz
GeForce GTX 1660 Ti Mobile
min:
28.5 fps, P0.1:
29.8 fps, P1:
33.1 fps, max:
58.6 fps
fps
34%
GeForce GTX 1650 Mobile:
17.2 [X] Lenovo ThinkBook 15p G2 ITH 21B1000WGE Intel Core i5-11400H 2.7GHz
GeForce GTX 1650 Mobile
min:
15.4 fps, P0.1:
15.4 fps, P1:
15.6 fps, max:
19.6 fps
fps
100%
GeForce GTX 1660 Ti Mobile:
47.4 [X] Lenovo Legion 5 15IMH05H 81Y600D7GE Intel Core i5-10300H 2.5GHz
GeForce GTX 1660 Ti Mobile
min:
26.4 fps, P0.1:
26.6 fps, P1:
33.4 fps, max:
54.1 fps
fps
35%
GeForce GTX 1650 Mobile:
16.4 [X] Lenovo ThinkBook 15p G2 ITH 21B1000WGE Intel Core i5-11400H 2.7GHz
GeForce GTX 1650 Mobile
min:
9.31 fps, P0.1:
10.1 fps, P1:
14.1 fps, max:
64.2 fps
fps
GeForce GTX 1650 Mobile:
38.5 [X] Lenovo ThinkBook 15p G2 ITH 21B1000WGE Intel Core i5-11400H 2.7GHz
GeForce GTX 1650 Mobile
min:
22.9 fps, P0.1:
25.2 fps, P1:
31.4 fps, max:
86.2 fps
fps
100%
GeForce GTX 1660 Ti Mobile:
53.8 [X] Lenovo Legion 5 15IMH05H 81Y600D7GE Intel Core i5-10300H 2.5GHz
GeForce GTX 1660 Ti Mobile
min:
22.9 fps, P0.1:
25 fps, P1:
43.3 fps, max:
114.7 fps
fps
57%
GeForce GTX 1650 Mobile:
30.6 [X] Lenovo ThinkBook 15p G2 ITH 21B1000WGE Intel Core i5-11400H 2.7GHz
GeForce GTX 1650 Mobile
min:
22.1 fps, P0.1:
22.6 fps, P1:
25.4 fps, max:
43 fps
fps
100%
GeForce GTX 1660 Ti Mobile:
44.6 [X] Lenovo Legion 5 15IMH05H 81Y600D7GE Intel Core i5-10300H 2.5GHz
GeForce GTX 1660 Ti Mobile
min:
20.1 fps, P0.1:
24.4 fps, P1:
36.3 fps, max:
96.9 fps
fps
59%
GeForce GTX 1650 Mobile:
26.1 [X] Lenovo ThinkBook 15p G2 ITH 21B1000WGE Intel Core i5-11400H 2.7GHz
GeForce GTX 1650 Mobile
min:
19.3 fps, P0.1:
19.5 fps, P1:
21.5 fps, max:
34.6 fps
fps
100%
GeForce GTX 1660 Ti Mobile:
38 [X] Lenovo Legion 5 15IMH05H 81Y600D7GE Intel Core i5-10300H 2.5GHz
GeForce GTX 1660 Ti Mobile
min:
28.1 fps, P0.1:
28.6 fps, P1:
31.2 fps, max:
51.5 fps
fps
58%
GeForce GTX 1650 Mobile:
22.1 [X] Lenovo ThinkBook 15p G2 ITH 21B1000WGE Intel Core i5-11400H 2.7GHz
GeForce GTX 1650 Mobile
min:
15.7 fps, P0.1:
16.5 fps, P1:
17.8 fps, max:
32.4 fps
fps
100%
GeForce GTX 1660 Ti Mobile:
95.6 [X] Lenovo Legion 5 15IMH05H 81Y600D7GE Intel Core i5-10300H 2.5GHz
GeForce GTX 1660 Ti Mobile
min:
37.9 fps, P0.1:
43.8 fps, P1:
48.1 fps, max:
175 fps
fps
100%
GeForce GTX 1660 Ti Mobile:
91.7 [X] Lenovo Legion 5 15IMH05H 81Y600D7GE Intel Core i5-10300H 2.5GHz
GeForce GTX 1660 Ti Mobile
min:
9.78 fps, P0.1:
40.9 fps, P1:
61.4 fps, max:
187.2 fps
fps
46%
GeForce GTX 1050 Ti Mobile:
42.4 [X] MSI GE72 7RE Intel Core i7-7700HQ 2.8GHz
GeForce GTX 1050 Ti Mobile
min:
19 fps, P0.1:
20.8 fps, P1:
35.6 fps, max:
113 fps
fps
62%
GeForce GTX 1650 Mobile:
57 [X] Lenovo ThinkBook 15p G2 ITH 21B1000WGE Intel Core i5-11400H 2.7GHz
GeForce GTX 1650 Mobile
min:
26.5 fps, P0.1:
31.1 fps, P1:
48 fps, max:
123.8 fps
fps
100%
GeForce GTX 1660 Ti Mobile:
69 [X] Lenovo Legion 5 15IMH05H 81Y600D7GE Intel Core i5-10300H 2.5GHz
GeForce GTX 1660 Ti Mobile
min:
28.1 fps, P0.1:
36.9 fps, P1:
50.9 fps, max:
151.1 fps
fps
45%
GeForce GTX 1050 Ti Mobile:
30.8 [X] MSI GE72 7RE Intel Core i7-7700HQ 2.8GHz
GeForce GTX 1050 Ti Mobile
min:
14.5 fps, P0.1:
17 fps, P1:
23.2 fps, max:
99.1 fps
fps
60%
GeForce GTX 1650 Mobile:
41.6 [X] Lenovo ThinkBook 15p G2 ITH 21B1000WGE Intel Core i5-11400H 2.7GHz
GeForce GTX 1650 Mobile
min:
19.3 fps, P0.1:
22.5 fps, P1:
33.3 fps, max:
107 fps
fps
100%
GeForce GTX 1660 Ti Mobile:
56.2 [X] Lenovo Legion 5 15IMH05H 81Y600D7GE Intel Core i5-10300H 2.5GHz
GeForce GTX 1660 Ti Mobile
min:
11.8 fps, P0.1:
27.9 fps, P1:
40.3 fps, max:
106.3 fps
fps
42%
GeForce GTX 1050 Ti Mobile:
23.5 [X] MSI GE72 7RE Intel Core i7-7700HQ 2.8GHz
GeForce GTX 1050 Ti Mobile
min:
4.65 fps, P0.1:
10.8 fps, P1:
17.7 fps, max:
58.9 fps
fps
61%
GeForce GTX 1650 Mobile:
34.3 [X] Lenovo ThinkBook 15p G2 ITH 21B1000WGE Intel Core i5-11400H 2.7GHz
GeForce GTX 1650 Mobile
min:
11.9 fps, P0.1:
14.5 fps, P1:
27 fps, max:
90.8 fps
fps
100%
GeForce GTX 1660 Ti Mobile:
42.8 [X] Lenovo Legion 5 15IMH05H 81Y600D7GE Intel Core i5-10300H 2.5GHz
GeForce GTX 1660 Ti Mobile
min:
17.6 fps, P0.1:
19.8 fps, P1:
28.6 fps, max:
149 fps
fps
34%
GeForce GTX 1050 Ti Mobile:
14.4 [X] MSI GE72 7RE Intel Core i7-7700HQ 2.8GHz
GeForce GTX 1050 Ti Mobile
min:
7.38 fps, P0.1:
7.53 fps, P1:
8.51 fps, max:
22.5 fps
fps
59%
GeForce GTX 1650 Mobile:
25.3 [X] Lenovo ThinkBook 15p G2 ITH 21B1000WGE Intel Core i5-11400H 2.7GHz
GeForce GTX 1650 Mobile
min:
12.3 fps, P0.1:
12.4 fps, P1:
15.9 fps, max:
76.2 fps
fps
100%
GeForce GTX 1660 Ti Mobile:
160.5 [X] Lenovo Legion 5 15IMH05H 81Y600D7GE 959964
Intel Core i5-10300H 2.5GHz
GeForce GTX 1660 Ti Mobile
min:
138 fps, P1:
95 fps, max:
186 fps
fps
49%
GeForce GTX 1050 Ti Mobile:
78 [X] MSI GE72 7RE Intel Core i7-7700HQ 2.8GHz
GeForce GTX 1050 Ti Mobile
fps
72%
GeForce GTX 1650 Mobile:
116 [X] Lenovo ThinkBook 15p G2 ITH 21B1000WGE 959964
Intel Core i5-11400H 2.7GHz
GeForce GTX 1650 Mobile
min:
94 fps, P1:
84 fps, max:
134 fps
fps
100%
GeForce GTX 1660 Ti Mobile:
148.3 [X] Lenovo Legion 5 15IMH05H 81Y600D7GE 959964
Intel Core i5-10300H 2.5GHz
GeForce GTX 1660 Ti Mobile
min:
125 fps, P1:
86 fps, max:
165 fps
fps
45%
GeForce GTX 1050 Ti Mobile:
67 [X] MSI GE72 7RE Intel Core i7-7700HQ 2.8GHz
GeForce GTX 1050 Ti Mobile
fps
71%
GeForce GTX 1650 Mobile:
105.2 [X] Lenovo ThinkBook 15p G2 ITH 21B1000WGE 959964
Intel Core i5-11400H 2.7GHz
GeForce GTX 1650 Mobile
min:
88 fps, P1:
78 fps, max:
124 fps
fps
100%
GeForce GTX 1660 Ti Mobile:
117.2 [X] Lenovo Legion 5 15IMH05H 81Y600D7GE 959964
Intel Core i5-10300H 2.5GHz
GeForce GTX 1660 Ti Mobile
min:
102 fps, P1:
74 fps, max:
135 fps
fps
41%
GeForce GTX 1050 Ti Mobile:
48 [X] MSI GE72 7RE Intel Core i7-7700HQ 2.8GHz
GeForce GTX 1050 Ti Mobile
fps
63%
GeForce GTX 1650 Mobile:
74.2 [X] Lenovo ThinkBook 15p G2 ITH 21B1000WGE 959964
Intel Core i5-11400H 2.7GHz
GeForce GTX 1650 Mobile
min:
63 fps, P1:
61 fps, max:
85 fps
fps
100%
GeForce GTX 1660 Ti Mobile:
90.9 [X] Lenovo Legion 5 15IMH05H 81Y600D7GE 959964
Intel Core i5-10300H 2.5GHz
GeForce GTX 1660 Ti Mobile
min:
78 fps, P1:
62 fps, max:
106 fps
fps
41%
GeForce GTX 1050 Ti Mobile:
37 [X] MSI GE72 7RE Intel Core i7-7700HQ 2.8GHz
GeForce GTX 1050 Ti Mobile
fps
59%
GeForce GTX 1650 Mobile:
53.2 [X] Lenovo ThinkBook 15p G2 ITH 21B1000WGE 959964
Intel Core i5-11400H 2.7GHz
GeForce GTX 1650 Mobile
min:
44 fps, P1:
43 fps, max:
63 fps
fps
GeForce GTX 1050 Ti Mobile:
104.7 [X] MSI GE72 7RE Intel Core i7-7700HQ 2.8GHz
GeForce GTX 1050 Ti Mobile
min:
16.2 fps, P0.1:
54.8 fps, P1:
79.1 fps, max:
173.9 fps
fps
GeForce GTX 1650 Mobile:
120.7 [X] Lenovo ThinkBook 15p G2 ITH 21B1000WGE Intel Core i5-11400H 2.7GHz
GeForce GTX 1650 Mobile
min:
25.1 fps, P0.1:
44.7 fps, P1:
80.3 fps, max:
244 fps
fps
100%
GeForce GTX 1660 Ti Mobile:
133.2 [X] MSI GP65 Leopard 9SD Intel Core i7-9750H 2.6GHz
GeForce GTX 1660 Ti Mobile
min:
61.3 fps, P0.1:
87.8 fps, P1:
101.1 fps, max:
230 fps
fps
49%
GeForce GTX 1050 Ti Mobile:
65.8 [X] MSI GE72 7RE Intel Core i7-7700HQ 2.8GHz
GeForce GTX 1050 Ti Mobile
min:
19.4 fps, P0.1:
20.9 fps, P1:
51.9 fps, max:
108.7 fps
fps
69%
GeForce GTX 1650 Mobile:
91.5 [X] Lenovo ThinkBook 15p G2 ITH 21B1000WGE Intel Core i5-11400H 2.7GHz
GeForce GTX 1650 Mobile
min:
20.6 fps, P0.1:
36.4 fps, P1:
63.1 fps, max:
199.2 fps
fps
100%
GeForce GTX 1660 Ti Mobile:
123.8 [X] MSI GP65 Leopard 9SD Intel Core i7-9750H 2.6GHz
GeForce GTX 1660 Ti Mobile
min:
80.9 fps, P0.1:
83 fps, P1:
94.7 fps, max:
253 fps
fps
47%
GeForce GTX 1050 Ti Mobile:
58.2 [X] MSI GE72 7RE Intel Core i7-7700HQ 2.8GHz
GeForce GTX 1050 Ti Mobile
min:
19 fps, P0.1:
21.7 fps, P1:
46.8 fps, max:
106.5 fps
fps
62%
GeForce GTX 1650 Mobile:
77.3 [X] Lenovo ThinkBook 15p G2 ITH 21B1000WGE Intel Core i5-11400H 2.7GHz
GeForce GTX 1650 Mobile
min:
40.3 fps, P0.1:
50.3 fps, P1:
59.9 fps, max:
129.4 fps
fps
100%
GeForce GTX 1660 Ti Mobile:
118.8 [X] MSI GP65 Leopard 9SD Intel Core i7-9750H 2.6GHz
GeForce GTX 1660 Ti Mobile
min:
49.6 fps, P0.1:
74.3 fps, P1:
90.7 fps, max:
214 fps
fps
37%
GeForce GTX 1050 Ti Mobile:
43.8 [X] MSI GE72 7RE Intel Core i7-7700HQ 2.8GHz
GeForce GTX 1050 Ti Mobile
min:
16.6 fps, P0.1:
17.4 fps, P1:
22.1 fps, max:
99.4 fps
fps
59%
GeForce GTX 1650 Mobile:
70 [X] Lenovo ThinkBook 15p G2 ITH 21B1000WGE Intel Core i5-11400H 2.7GHz
GeForce GTX 1650 Mobile
min:
9.97 fps, P0.1:
48.4 fps, P1:
55 fps, max:
108.4 fps
fps
100%
GeForce GTX 1660 Ti Mobile:
74 [X] MSI GP65 Leopard 9SD Intel Core i7-9750H 2.6GHz
GeForce GTX 1660 Ti Mobile
min:
19.8 fps, P0.1:
44.3 fps, P1:
55.4 fps, max:
244 fps
fps
100%
GeForce GTX 1660 Ti Mobile:
35.6 [X] MSI GP65 Leopard 9SD Intel Core i7-9750H 2.6GHz
GeForce GTX 1660 Ti Mobile
min:
7.88 fps, P0.1:
16.2 fps, P1:
28.8 fps, max:
138.6 fps
fps
100%
GeForce GTX 1660 Ti Mobile:
96.9 [X] MSI GP65 Leopard 9SD Intel Core i7-9750H 2.6GHz
GeForce GTX 1660 Ti Mobile
min:
28.3 fps, P0.1:
40.7 fps, P1:
62.2 fps, max:
182.2 fps
fps
36%
GeForce GTX 1050 Ti Mobile:
34.7 [X] MSI GE72 7RE Intel Core i7-7700HQ 2.8GHz
GeForce GTX 1050 Ti Mobile
min:
15.5 fps, P0.1:
20.1 fps, P1:
21.7 fps, max:
95.1 fps
fps
68%
GeForce GTX 1650 Mobile:
65.8 [X] Lenovo ThinkBook 15p G2 ITH 21B1000WGE Intel Core i5-11400H 2.7GHz
GeForce GTX 1650 Mobile
min:
4.66 fps, P0.1:
35.3 fps, P1:
39.9 fps, max:
166.6 fps
fps
100%
GeForce GTX 1660 Ti Mobile:
90.2 [X] MSI GP65 Leopard 9SD Intel Core i7-9750H 2.6GHz
GeForce GTX 1660 Ti Mobile
min:
23.6 fps, P0.1:
40.8 fps, P1:
59.4 fps, max:
171.4 fps
fps
38%
GeForce GTX 1050 Ti Mobile:
34.3 [X] MSI GE72 7RE Intel Core i7-7700HQ 2.8GHz
GeForce GTX 1050 Ti Mobile
min:
17.7 fps, P0.1:
18.6 fps, P1:
20.2 fps, max:
92.4 fps
fps
59%
GeForce GTX 1650 Mobile:
53.6 [X] Lenovo ThinkBook 15p G2 ITH 21B1000WGE Intel Core i5-11400H 2.7GHz
GeForce GTX 1650 Mobile
min:
26.1 fps, P0.1:
27.3 fps, P1:
31.6 fps, max:
155.4 fps
fps
100%
GeForce GTX 1660 Ti Mobile:
88.6 [X] MSI GP65 Leopard 9SD Intel Core i7-9750H 2.6GHz
GeForce GTX 1660 Ti Mobile
min:
21.6 fps, P0.1:
33.5 fps, P1:
57.9 fps, max:
171.1 fps
fps
38%
GeForce GTX 1050 Ti Mobile:
33.3 [X] MSI GE72 7RE Intel Core i7-7700HQ 2.8GHz
GeForce GTX 1050 Ti Mobile
min:
16 fps, P0.1:
17.6 fps, P1:
20.2 fps, max:
95.4 fps
fps
60%
GeForce GTX 1650 Mobile:
53 [X] Lenovo ThinkBook 15p G2 ITH 21B1000WGE Intel Core i5-11400H 2.7GHz
GeForce GTX 1650 Mobile
min:
7.87 fps, P0.1:
29.2 fps, P1:
31.3 fps, max:
156.1 fps
fps
100%
GeForce GTX 1660 Ti Mobile:
88.4 [X] MSI GP65 Leopard 9SD Intel Core i7-9750H 2.6GHz
GeForce GTX 1660 Ti Mobile
min:
24 fps, P0.1:
31.8 fps, P1:
56.9 fps, max:
167 fps
fps
37%
GeForce GTX 1050 Ti Mobile:
33 [X] MSI GE72 7RE Intel Core i7-7700HQ 2.8GHz
GeForce GTX 1050 Ti Mobile
min:
17.5 fps, P0.1:
17.9 fps, P1:
20 fps, max:
90.3 fps
fps
59%
GeForce GTX 1650 Mobile:
52.2 [X] Lenovo ThinkBook 15p G2 ITH 21B1000WGE Intel Core i5-11400H 2.7GHz
GeForce GTX 1650 Mobile
min:
6.64 fps, P0.1:
21.4 fps, P1:
31.3 fps, max:
147.6 fps
fps
100%
GeForce GTX 1660 Ti Mobile:
51 [X] MSI GP65 Leopard 9SD Intel Core i7-9750H 2.6GHz
GeForce GTX 1660 Ti Mobile
min:
19.9 fps, P0.1:
25.3 fps, P1:
29.8 fps, max:
159.5 fps
fps
100%
GeForce GTX 1660 Ti Mobile:
23.6 [X] MSI GP65 Leopard 9SD Intel Core i7-9750H 2.6GHz
GeForce GTX 1660 Ti Mobile
min:
10.6 fps, P0.1:
11.5 fps, P1:
12.3 fps, max:
154.5 fps
fps
100%
GeForce GTX 1660 Ti Mobile:
117 [X] MSI GP65 Leopard 9SD Intel Core i7-9750H 2.6GHz
GeForce GTX 1660 Ti Mobile
fps
43%
GeForce GTX 1050 Ti Mobile:
49.8 [X] MSI GE72 7RE Intel Core i7-7700HQ 2.8GHz
GeForce GTX 1050 Ti Mobile
fps
100%
GeForce GTX 1660 Ti Mobile:
99.7 [X] MSI GP65 Leopard 9SD Intel Core i7-9750H 2.6GHz
GeForce GTX 1660 Ti Mobile
fps
37%
GeForce GTX 1050 Ti Mobile:
36.4 [X] MSI GE72 7RE Intel Core i7-7700HQ 2.8GHz
GeForce GTX 1050 Ti Mobile
fps
100%
GeForce GTX 1660 Ti Mobile:
67.3 [X] MSI GP65 Leopard 9SD Intel Core i7-9750H 2.6GHz
GeForce GTX 1660 Ti Mobile
fps
36%
GeForce GTX 1050 Ti Mobile:
24.1 [X] MSI GE72 7RE Intel Core i7-7700HQ 2.8GHz
GeForce GTX 1050 Ti Mobile
fps
100%
GeForce GTX 1660 Ti Mobile:
51.7 [X] MSI GP65 Leopard 9SD Intel Core i7-9750H 2.6GHz
GeForce GTX 1660 Ti Mobile
fps
34%
GeForce GTX 1050 Ti Mobile:
17.7 [X] MSI GE72 7RE Intel Core i7-7700HQ 2.8GHz
GeForce GTX 1050 Ti Mobile
fps
100%
GeForce GTX 1660 Ti Mobile:
34.5 [X] MSI GP65 Leopard 9SD Intel Core i7-9750H 2.6GHz
GeForce GTX 1660 Ti Mobile
fps
100%
GeForce GTX 1660 Ti Mobile:
85.7 [X] MSI GP65 Leopard 9SD Intel Core i7-9750H 2.6GHz
GeForce GTX 1660 Ti Mobile
min:
55 fps
fps
35%
GeForce GTX 1050 Ti Mobile:
30.4 [X] MSI GE72 7RE Intel Core i7-7700HQ 2.8GHz
GeForce GTX 1050 Ti Mobile
fps
60%
GeForce GTX 1650 Mobile:
51.8 [X] MSI GL75 Intel Core i7-10750H 2.6GHz
GeForce GTX 1650 Mobile
min:
35 fps
fps
100%
GeForce GTX 1660 Ti Mobile:
67.8 [X] MSI GP65 Leopard 9SD Intel Core i7-9750H 2.6GHz
GeForce GTX 1660 Ti Mobile
min:
46 fps
fps
36%
GeForce GTX 1050 Ti Mobile:
24.6 [X] MSI GE72 7RE Intel Core i7-7700HQ 2.8GHz
GeForce GTX 1050 Ti Mobile
fps
61%
GeForce GTX 1650 Mobile:
41.3 [X] MSI GL75 Intel Core i7-10750H 2.6GHz
GeForce GTX 1650 Mobile
min:
30 fps
fps
100%
GeForce GTX 1660 Ti Mobile:
53.9 [X] MSI GP65 Leopard 9SD Intel Core i7-9750H 2.6GHz
GeForce GTX 1660 Ti Mobile
min:
41 fps
fps
32%
GeForce GTX 1050 Ti Mobile:
17.2 [X] MSI GE72 7RE Intel Core i7-7700HQ 2.8GHz
GeForce GTX 1050 Ti Mobile
fps
59%
GeForce GTX 1650 Mobile:
32 [X] MSI GL75 Intel Core i7-10750H 2.6GHz
GeForce GTX 1650 Mobile
min:
24 fps
fps
100%
GeForce GTX 1660 Ti Mobile:
51.7 [X] MSI GP65 Leopard 9SD Intel Core i7-9750H 2.6GHz
GeForce GTX 1660 Ti Mobile
min:
37 fps
fps
58%
GeForce GTX 1650 Mobile:
30 [X] MSI GL75 Intel Core i7-10750H 2.6GHz
GeForce GTX 1650 Mobile
min:
24 fps
fps
100%
GeForce GTX 1660 Ti Mobile:
25 [X] MSI GP65 Leopard 9SD Intel Core i7-9750H 2.6GHz
GeForce GTX 1660 Ti Mobile
min:
16 fps
fps
60%
GeForce GTX 1650 Mobile:
14.9 [X] MSI GL75 Intel Core i7-10750H 2.6GHz
GeForce GTX 1650 Mobile
min:
10 fps
fps
100%
GeForce GTX 1660 Ti Mobile:
10.3 [X] MSI GP65 Leopard 9SD Intel Core i7-9750H 2.6GHz
GeForce GTX 1660 Ti Mobile
min:
7 fps
fps
52%
GeForce GTX 1650 Mobile:
5.4 [X] MSI GL75 Intel Core i7-10750H 2.6GHz
GeForce GTX 1650 Mobile
min:
3 fps
fps
GeForce GTX 1050 Ti Mobile:
34.3 [X] MSI GE72 7RE Intel Core i7-7700HQ 2.8GHz
GeForce GTX 1050 Ti Mobile
min:
19.8 fps, P0.1:
20 fps, P1:
27.5 fps, max:
86.3 fps
fps
GeForce GTX 1650 Mobile:
50.4 [X] MSI GL75 Intel Core i7-10750H 2.6GHz
GeForce GTX 1650 Mobile
min:
24.6 fps, P0.1:
25.1 fps, P1:
27.9 fps, max:
118 fps
fps
100%
GeForce GTX 1660 Ti Mobile:
61.2 [X] MSI GP65 Leopard 9SD Intel Core i7-9750H 2.6GHz
GeForce GTX 1660 Ti Mobile
min:
19.7 fps, P0.1:
28.4 fps, P1:
38.7 fps, max:
83.2 fps
fps
45%
GeForce GTX 1050 Ti Mobile:
27.6 [X] MSI GE72 7RE Intel Core i7-7700HQ 2.8GHz
GeForce GTX 1050 Ti Mobile
min:
15.9 fps, P0.1:
17.1 fps, P1:
22.3 fps, max:
39.4 fps
fps
71%
GeForce GTX 1650 Mobile:
43.4 [X] MSI GL75 Intel Core i7-10750H 2.6GHz
GeForce GTX 1650 Mobile
min:
9.59 fps, P0.1:
23 fps, P1:
28.2 fps, max:
80.9 fps
fps
100%
GeForce GTX 1660 Ti Mobile:
53 [X] MSI GP65 Leopard 9SD Intel Core i7-9750H 2.6GHz
GeForce GTX 1660 Ti Mobile
min:
21.2 fps, P0.1:
24.3 fps, P1:
36.4 fps, max:
72.9 fps
fps
39%
GeForce GTX 1050 Ti Mobile:
20.9 [X] MSI GE72 7RE Intel Core i7-7700HQ 2.8GHz
GeForce GTX 1050 Ti Mobile
min:
11.8 fps, P0.1:
13.6 fps, P1:
17.1 fps, max:
42.2 fps
fps
70%
GeForce GTX 1650 Mobile:
37.1 [X] MSI GL75 Intel Core i7-10750H 2.6GHz
GeForce GTX 1650 Mobile
min:
24.8 fps, P0.1:
27 fps, P1:
30.4 fps, max:
74.4 fps
fps
100%
GeForce GTX 1660 Ti Mobile:
48.4 [X] MSI GP65 Leopard 9SD Intel Core i7-9750H 2.6GHz
GeForce GTX 1660 Ti Mobile
min:
29.4 fps, P0.1:
32 fps, P1:
36.2 fps, max:
67.3 fps
fps
18%
GeForce GTX 1050 Ti Mobile:
8.6 [X] MSI GE72 7RE Intel Core i7-7700HQ 2.8GHz
GeForce GTX 1050 Ti Mobile
min:
4.66 fps, P0.1:
4.74 fps, P1:
5.57 fps, max:
46.9 fps
fps
68%
GeForce GTX 1650 Mobile:
32.8 [X] MSI GL75 Intel Core i7-10750H 2.6GHz
GeForce GTX 1650 Mobile
min:
7.69 fps, P0.1:
14.4 fps, P1:
24.4 fps, max:
64.4 fps
fps
100%
GeForce GTX 1660 Ti Mobile:
33.8 [X] MSI GP65 Leopard 9SD Intel Core i7-9750H 2.6GHz
GeForce GTX 1660 Ti Mobile
min:
22.8 fps, P0.1:
23.5 fps, P1:
27.7 fps, max:
60.2 fps
fps
100%
GeForce GTX 1660 Ti Mobile:
17.7 [X] MSI GP65 Leopard 9SD Intel Core i7-9750H 2.6GHz
GeForce GTX 1660 Ti Mobile
min:
14.1 fps, P0.1:
14.5 fps, P1:
15.2 fps, max:
22.1 fps
fps
GeForce GTX 1050 Ti Mobile:
61.9 [X] MSI GE72 7RE Intel Core i7-7700HQ 2.8GHz
GeForce GTX 1050 Ti Mobile
fps
GeForce GTX 1650 Mobile:
131 [X] MSI GL75 Intel Core i7-10750H 2.6GHz
GeForce GTX 1650 Mobile
min:
105 fps
fps
100%
GeForce GTX 1660 Ti Mobile:
139 [X] MSI GP65 Leopard 9SD Intel Core i7-9750H 2.6GHz
GeForce GTX 1660 Ti Mobile
min:
110 fps
fps
33%
GeForce GTX 1050 Ti Mobile:
46.3 [X] MSI GE72 7RE Intel Core i7-7700HQ 2.8GHz
GeForce GTX 1050 Ti Mobile
fps
66%
GeForce GTX 1650 Mobile:
92.2 [X] MSI GL75 Intel Core i7-10750H 2.6GHz
GeForce GTX 1650 Mobile
min:
77 fps
fps
100%
GeForce GTX 1660 Ti Mobile:
118 [X] MSI GP65 Leopard 9SD Intel Core i7-9750H 2.6GHz
GeForce GTX 1660 Ti Mobile
min:
93 fps
fps
36%
GeForce GTX 1050 Ti Mobile:
42.1 [X] MSI GE72 7RE Intel Core i7-7700HQ 2.8GHz
GeForce GTX 1050 Ti Mobile
fps
65%
GeForce GTX 1650 Mobile:
76.4 [X] MSI GL75 Intel Core i7-10750H 2.6GHz
GeForce GTX 1650 Mobile
min:
60 fps
fps
100%
GeForce GTX 1660 Ti Mobile:
79.1 [X] MSI GP65 Leopard 9SD Intel Core i7-9750H 2.6GHz
GeForce GTX 1660 Ti Mobile
min:
57 fps
fps
38%
GeForce GTX 1050 Ti Mobile:
30.1 [X] MSI GE72 7RE Intel Core i7-7700HQ 2.8GHz
GeForce GTX 1050 Ti Mobile
fps
67%
GeForce GTX 1650 Mobile:
53.2 [X] MSI GL75 Intel Core i7-10750H 2.6GHz
GeForce GTX 1650 Mobile
min:
39 fps
fps
100%
GeForce GTX 1660 Ti Mobile:
60.1 [X] MSI GP65 Leopard 9SD Intel Core i7-9750H 2.6GHz
GeForce GTX 1660 Ti Mobile
min:
47 fps
fps
100%
GeForce GTX 1660 Ti Mobile:
35.8 [X] MSI GP65 Leopard 9SD Intel Core i7-9750H 2.6GHz
GeForce GTX 1660 Ti Mobile
min:
29 fps
fps
GeForce GTX 1050 Ti Mobile:
35.7 [X] MSI GE72 7RE Intel Core i7-7700HQ 2.8GHz
GeForce GTX 1050 Ti Mobile
fps
GeForce GTX 1650 Mobile:
58.3 [X] MSI GL75 Intel Core i7-10750H 2.6GHz
GeForce GTX 1650 Mobile
min:
26 fps, P0.1:
30 fps, P1:
38.5 fps, max:
77.3 fps
fps
100%
GeForce GTX 1660 Ti Mobile:
58 [X] MSI GP65 Leopard 9SD Intel Core i7-9750H 2.6GHz
GeForce GTX 1660 Ti Mobile
min:
27.3 fps, P0.1:
30.4 fps, P1:
37 fps, max:
77.1 fps
fps
54%
GeForce GTX 1050 Ti Mobile:
31.4 [X] MSI GE72 7RE Intel Core i7-7700HQ 2.8GHz
GeForce GTX 1050 Ti Mobile
fps
96%
GeForce GTX 1650 Mobile:
55.6 [X] MSI GL75 Intel Core i7-10750H 2.6GHz
GeForce GTX 1650 Mobile
min:
19.9 fps, P0.1:
32.5 fps, P1:
37 fps, max:
72.4 fps
fps
100%
GeForce GTX 1660 Ti Mobile:
57.3 [X] MSI GP65 Leopard 9SD Intel Core i7-9750H 2.6GHz
GeForce GTX 1660 Ti Mobile
min:
29.9 fps, P0.1:
31.1 fps, P1:
36 fps, max:
77.1 fps
fps
45%
GeForce GTX 1050 Ti Mobile:
25.9 [X] MSI GE72 7RE Intel Core i7-7700HQ 2.8GHz
GeForce GTX 1050 Ti Mobile
fps
88%
GeForce GTX 1650 Mobile:
50.5 [X] MSI GL75 Intel Core i7-10750H 2.6GHz
GeForce GTX 1650 Mobile
min:
23.6 fps, P0.1:
23.7 fps, P1:
33.8 fps, max:
72 fps
fps
100%
GeForce GTX 1660 Ti Mobile:
56.9 [X] MSI GP65 Leopard 9SD Intel Core i7-9750H 2.6GHz
GeForce GTX 1660 Ti Mobile
min:
26.7 fps, P0.1:
28.4 fps, P1:
33.6 fps, max:
75.6 fps
fps
76%
GeForce GTX 1650 Mobile:
43.1 [X] MSI GL75 Intel Core i7-10750H 2.6GHz
GeForce GTX 1650 Mobile
min:
21.6 fps, P0.1:
22.3 fps, P1:
30.1 fps, max:
68 fps
fps
100%
GeForce GTX 1660 Ti Mobile:
47.9 [X] MSI GP65 Leopard 9SD Intel Core i7-9750H 2.6GHz
GeForce GTX 1660 Ti Mobile
min:
11.3 fps, P0.1:
26.7 fps, P1:
32.1 fps, max:
72.4 fps
fps
66%
GeForce GTX 1650 Mobile:
31.4 [X] MSI GL75 Intel Core i7-10750H 2.6GHz
GeForce GTX 1650 Mobile
min:
15.8 fps, P0.1:
17.5 fps, P1:
22.3 fps, max:
56.6 fps
fps
100%
GeForce GTX 1660 Ti Mobile:
27.6 [X] MSI GP65 Leopard 9SD Intel Core i7-9750H 2.6GHz
GeForce GTX 1660 Ti Mobile
min:
17.1 fps, P0.1:
17.2 fps, P1:
20.1 fps, max:
67.8 fps
fps
63%
GeForce GTX 1650 Mobile:
17.3 [X] MSI GL75 Intel Core i7-10750H 2.6GHz
GeForce GTX 1650 Mobile
min:
7.92 fps, P0.1:
8.21 fps, P1:
9.75 fps, max:
54.7 fps
fps
100%
GeForce GTX 1660 Ti Mobile:
59.4 [X] MSI GP65 Leopard 9SD Intel Core i7-9750H 2.6GHz
GeForce GTX 1660 Ti Mobile
min:
40 fps, P0.1:
47.5 fps, P1:
54.4 fps, max:
67.8 fps
fps
46%
GeForce GTX 1050 Ti Mobile:
27.5 [X] MSI GE72 7RE Intel Core i7-7700HQ 2.8GHz
GeForce GTX 1050 Ti Mobile
min:
22.6 fps, P0.1:
23.1 fps, P1:
24.3 fps, max:
35.9 fps
fps
63%
GeForce GTX 1650 Mobile:
37.6 [X] MSI GL75 Intel Core i7-10750H 2.6GHz
GeForce GTX 1650 Mobile
min:
29.9 fps, P0.1:
30.5 fps, P1:
32.3 fps, max:
44.3 fps
fps
100%
GeForce GTX 1660 Ti Mobile:
47 [X] MSI GP65 Leopard 9SD Intel Core i7-9750H 2.6GHz
GeForce GTX 1660 Ti Mobile
min:
29.5 fps, P0.1:
42.3 fps, P1:
43.3 fps, max:
52.4 fps
fps
46%
GeForce GTX 1050 Ti Mobile:
21.5 [X] MSI GE72 7RE Intel Core i7-7700HQ 2.8GHz
GeForce GTX 1050 Ti Mobile
min:
19 fps, P0.1:
19.1 fps, P1:
19.4 fps, max:
25.5 fps
fps
61%
GeForce GTX 1650 Mobile:
28.7 [X] MSI GL75 Intel Core i7-10750H 2.6GHz
GeForce GTX 1650 Mobile
min:
21 fps, P0.1:
22.7 fps, P1:
24.5 fps, max:
33.6 fps
fps
100%
GeForce GTX 1660 Ti Mobile:
40.1 [X] MSI GP65 Leopard 9SD Intel Core i7-9750H 2.6GHz
GeForce GTX 1660 Ti Mobile
min:
28.4 fps, P0.1:
34.3 fps, P1:
37 fps, max:
45.5 fps
fps
43%
GeForce GTX 1050 Ti Mobile:
17.4 [X] MSI GE72 7RE Intel Core i7-7700HQ 2.8GHz
GeForce GTX 1050 Ti Mobile
min:
15.6 fps, P0.1:
15.6 fps, P1:
16 fps, max:
20.4 fps
fps
59%
GeForce GTX 1650 Mobile:
23.8 [X] MSI GL75 Intel Core i7-10750H 2.6GHz
GeForce GTX 1650 Mobile
min:
20.3 fps, P0.1:
20.3 fps, P1:
20.7 fps, max:
27.7 fps
fps
100%
GeForce GTX 1660 Ti Mobile:
26.5 [X] MSI GP65 Leopard 9SD Intel Core i7-9750H 2.6GHz
GeForce GTX 1660 Ti Mobile
min:
20.3 fps, P0.1:
21.3 fps, P1:
24.1 fps, max:
29.9 fps
fps
100%
GeForce GTX 1660 Ti Mobile:
13 [X] MSI GP65 Leopard 9SD Intel Core i7-9750H 2.6GHz
GeForce GTX 1660 Ti Mobile
min:
11.3 fps, P0.1:
11.4 fps, P1:
11.5 fps, max:
15 fps
fps
GeForce GTX 1050 Ti Mobile:
61 [X] MSI GE72 7RE Intel Core i7-7700HQ 2.8GHz
GeForce GTX 1050 Ti Mobile
fps
GeForce GTX 1650 Mobile:
79 [X] MSI GL75 Intel Core i7-10750H 2.6GHz
GeForce GTX 1650 Mobile
min:
56 fps
fps
100%
GeForce GTX 1660 Ti Mobile:
116 [X] MSI GP65 Leopard 9SD Intel Core i7-9750H 2.6GHz
GeForce GTX 1660 Ti Mobile
min:
87 fps
fps
40%
GeForce GTX 1050 Ti Mobile:
46 [X] MSI GE72 7RE Intel Core i7-7700HQ 2.8GHz
GeForce GTX 1050 Ti Mobile
fps
62%
GeForce GTX 1650 Mobile:
72 [X] MSI GL75 Intel Core i7-10750H 2.6GHz
GeForce GTX 1650 Mobile
min:
53 fps
fps
100%
GeForce GTX 1660 Ti Mobile:
105 [X] MSI GP65 Leopard 9SD Intel Core i7-9750H 2.6GHz
GeForce GTX 1660 Ti Mobile
min:
80 fps
fps
40%
GeForce GTX 1050 Ti Mobile:
42 [X] MSI GE72 7RE Intel Core i7-7700HQ 2.8GHz
GeForce GTX 1050 Ti Mobile
fps
66%
GeForce GTX 1650 Mobile:
69 [X] MSI GL75 Intel Core i7-10750H 2.6GHz
GeForce GTX 1650 Mobile
min:
49 fps
fps
100%
GeForce GTX 1660 Ti Mobile:
85 [X] MSI GP65 Leopard 9SD Intel Core i7-9750H 2.6GHz
GeForce GTX 1660 Ti Mobile
min:
47 fps
fps
32%
GeForce GTX 1050 Ti Mobile:
27 [X] MSI GE72 7RE Intel Core i7-7700HQ 2.8GHz
GeForce GTX 1050 Ti Mobile
fps
62%
GeForce GTX 1650 Mobile:
53 [X] MSI GL75 Intel Core i7-10750H 2.6GHz
GeForce GTX 1650 Mobile
min:
29 fps
fps
100%
GeForce GTX 1660 Ti Mobile:
54 [X] MSI GP65 Leopard 9SD Intel Core i7-9750H 2.6GHz
GeForce GTX 1660 Ti Mobile
min:
28 fps
fps
100%
GeForce GTX 1660 Ti Mobile:
26 [X] MSI GP65 Leopard 9SD Intel Core i7-9750H 2.6GHz
GeForce GTX 1660 Ti Mobile
min:
11 fps
fps
GeForce GTX 1050 Ti Mobile:
35.6 [X] MSI GE72 7RE Intel Core i7-7700HQ 2.8GHz
GeForce GTX 1050 Ti Mobile
min:
24 fps, P0.1:
25.6 fps, P1:
30.6 fps, max:
46.3 fps
fps
GeForce GTX 1650 Mobile:
40.8 52.5 [X] MSI GL75 Intel Core i7-10750H 2.6GHz
GeForce GTX 1650 Mobile
min:
37.9 fps, P0.1:
40 fps, P1:
46.2 fps, max:
83.9 fps
~ 47 fps
100%
GeForce GTX 1660 Ti Mobile:
66.2 [X] MSI GP65 Leopard 9SD Intel Core i7-9750H 2.6GHz
GeForce GTX 1660 Ti Mobile
min:
40.3 fps, P0.1:
47.3 fps, P1:
51.5 fps, max:
116 fps
fps
43%
GeForce GTX 1050 Ti Mobile:
28.3 [X] MSI GE72 7RE Intel Core i7-7700HQ 2.8GHz
GeForce GTX 1050 Ti Mobile
min:
12.6 fps, P0.1:
12.6 fps, P1:
18.3 fps, max:
37.9 fps
fps
57%
GeForce GTX 1650 Mobile:
33.9 42.8 [X] MSI GL75 Intel Core i7-10750H 2.6GHz
GeForce GTX 1650 Mobile
min:
32.4 fps, P0.1:
36.2 fps, P1:
37.4 fps, max:
56.8 fps
~ 38 fps
100%
GeForce GTX 1660 Ti Mobile:
52.4 [X] MSI GP65 Leopard 9SD Intel Core i7-9750H 2.6GHz
GeForce GTX 1660 Ti Mobile
min:
36.7 fps, P0.1:
38 fps, P1:
42.8 fps, max:
76.5 fps
fps
22%
GeForce GTX 1050 Ti Mobile:
11.7 [X] MSI GE72 7RE Intel Core i7-7700HQ 2.8GHz
GeForce GTX 1050 Ti Mobile
min:
6.67 fps, P0.1:
6.68 fps, P1:
7.68 fps, max:
15.4 fps
fps
61%
GeForce GTX 1650 Mobile:
29.7 33.6 [X] MSI GL75 Intel Core i7-10750H 2.6GHz
GeForce GTX 1650 Mobile
min:
26.8 fps, P0.1:
27.8 fps, P1:
29.1 fps, max:
41.8 fps
~ 32 fps
100%
GeForce GTX 1660 Ti Mobile:
35 [X] MSI GP65 Leopard 9SD Intel Core i7-9750H 2.6GHz
GeForce GTX 1660 Ti Mobile
min:
27.8 fps, P0.1:
28.4 fps, P1:
28.9 fps, max:
48.3 fps
fps
20%
GeForce GTX 1050 Ti Mobile:
7.1 [X] MSI GE72 7RE Intel Core i7-7700HQ 2.8GHz
GeForce GTX 1050 Ti Mobile
min:
4.98 fps, P0.1:
4.98 fps, P1:
5.24 fps, max:
9.68 fps
fps
57%
GeForce GTX 1650 Mobile:
18.5 22.2 [X] MSI GL75 Intel Core i7-10750H 2.6GHz
GeForce GTX 1650 Mobile
min:
11.9 fps, P0.1:
12.8 fps, P1:
15.7 fps, max:
29.8 fps
~ 20 fps
100%
GeForce GTX 1660 Ti Mobile:
28.3 [X] MSI GP65 Leopard 9SD Intel Core i7-9750H 2.6GHz
GeForce GTX 1660 Ti Mobile
min:
21.3 fps, P0.1:
22.3 fps, P1:
23.4 fps, max:
38.2 fps
fps
100%
GeForce GTX 1660 Ti Mobile:
18.4 [X] MSI GP65 Leopard 9SD Intel Core i7-9750H 2.6GHz
GeForce GTX 1660 Ti Mobile
min:
15.6 fps, P0.1:
15.7 fps, P1:
16.3 fps, max:
23.3 fps
fps
GeForce GTX 1650 Mobile:
101 [X] MSI GL75 Intel Core i7-10750H 2.6GHz
GeForce GTX 1650 Mobile
min:
52.2 fps, P0.1:
59.9 fps, P1:
72.4 fps, max:
213 fps
fps
100%
GeForce GTX 1660 Ti Mobile:
83.1 [X] MSI GP65 Leopard 9SD Intel Core i7-9750H 2.6GHz
GeForce GTX 1660 Ti Mobile
min:
47.1 fps, P0.1:
51.2 fps, P1:
60.7 fps, max:
232 fps
fps
73%
GeForce GTX 1050 Ti Mobile:
60.9 [X] MSI GE72 7RE Intel Core i7-7700HQ 2.8GHz
GeForce GTX 1050 Ti Mobile
min:
25.9 fps, P0.1:
32.1 fps, P1:
40.6 fps, max:
126 fps
fps
68%
GeForce GTX 1650 Mobile:
56.1 [X] MSI GL75 Intel Core i7-10750H 2.6GHz
GeForce GTX 1650 Mobile
min:
37.7 fps, P0.1:
41.3 fps, P1:
44.1 fps, max:
131 fps
fps
100%
GeForce GTX 1660 Ti Mobile:
70.3 [X] MSI GP65 Leopard 9SD Intel Core i7-9750H 2.6GHz
GeForce GTX 1660 Ti Mobile
min:
40.6 fps, P0.1:
43.1 fps, P1:
50.7 fps, max:
162 fps
fps
58%
GeForce GTX 1650 Mobile:
40.6 [X] MSI GL75 Intel Core i7-10750H 2.6GHz
GeForce GTX 1650 Mobile
min:
23.1 fps, P0.1:
23.7 fps, P1:
28.7 fps, max:
88.7 fps
fps
100%
GeForce GTX 1660 Ti Mobile:
66.1 [X] MSI GP65 Leopard 9SD Intel Core i7-9750H 2.6GHz
GeForce GTX 1660 Ti Mobile
min:
24.4 fps, P0.1:
32.3 fps, P1:
50.3 fps, max:
165 fps
fps
63%
GeForce GTX 1050 Ti Mobile:
41.6 [X] MSI GE72 7RE Intel Core i7-7700HQ 2.8GHz
GeForce GTX 1050 Ti Mobile
min:
18.8 fps, P0.1:
23.8 fps, P1:
29.1 fps, max:
83.8 fps
fps
54%
GeForce GTX 1650 Mobile:
36 [X] MSI GL75 Intel Core i7-10750H 2.6GHz
GeForce GTX 1650 Mobile
min:
16.3 fps, P0.1:
19 fps, P1:
25 fps, max:
64.8 fps
fps
100%
GeForce GTX 1660 Ti Mobile:
43.4 [X] MSI GP65 Leopard 9SD Intel Core i7-9750H 2.6GHz
GeForce GTX 1660 Ti Mobile
min:
27.6 fps, P0.1:
30.1 fps, P1:
33 fps, max:
75.7 fps
fps
100%
GeForce GTX 1660 Ti Mobile:
19.7 [X] MSI GP65 Leopard 9SD Intel Core i7-9750H 2.6GHz
GeForce GTX 1660 Ti Mobile
min:
14.3 fps, P0.1:
14.7 fps, P1:
15.7 fps, max:
28.3 fps
fps
GeForce GTX 1050 Ti Mobile:
118 [X] MSI GE72 7RE Intel Core i7-7700HQ 2.8GHz
GeForce GTX 1050 Ti Mobile
min:
15.3 fps, P0.1:
23.7 fps, P1:
85.3 fps, max:
153 fps
fps
GeForce GTX 1650 Mobile:
163 [X] MSI GL75 Intel Core i7-10750H 2.6GHz
GeForce GTX 1650 Mobile
min:
2.81 fps, P0.1:
16.3 fps, P1:
40.5 fps, max:
219 fps
fps
100%
GeForce GTX 1660 Ti Mobile:
148 [X] MSI GP65 Leopard 9SD Intel Core i7-9750H 2.6GHz
GeForce GTX 1660 Ti Mobile
min:
5.86 fps, P0.1:
17.4 fps, P1:
32.2 fps, max:
205 fps
fps
42%
GeForce GTX 1050 Ti Mobile:
62.7 [X] MSI GE72 7RE Intel Core i7-7700HQ 2.8GHz
GeForce GTX 1050 Ti Mobile
min:
10.4 fps, P0.1:
12.9 fps, P1:
18.1 fps, max:
113 fps
fps
70%
GeForce GTX 1650 Mobile:
104 [X] MSI GL75 Intel Core i7-10750H 2.6GHz
GeForce GTX 1650 Mobile
min:
6.48 fps, P0.1:
16.3 fps, P1:
22.9 fps, max:
165 fps
fps
100%
GeForce GTX 1660 Ti Mobile:
121 [X] MSI GP65 Leopard 9SD Intel Core i7-9750H 2.6GHz
GeForce GTX 1660 Ti Mobile
min:
14 fps, P0.1:
24.6 fps, P1:
59 fps, max:
169 fps
fps
38%
GeForce GTX 1050 Ti Mobile:
46.4 [X] MSI GE72 7RE Intel Core i7-7700HQ 2.8GHz
GeForce GTX 1050 Ti Mobile
min:
8.67 fps, P0.1:
10.5 fps, P1:
15.9 fps, max:
88.1 fps
fps
64%
GeForce GTX 1650 Mobile:
77 [X] MSI GL75 Intel Core i7-10750H 2.6GHz
GeForce GTX 1650 Mobile
min:
14.7 fps, P0.1:
32.2 fps, P1:
57.6 fps, max:
128 fps
fps
100%
GeForce GTX 1660 Ti Mobile:
98.9 [X] MSI GP65 Leopard 9SD Intel Core i7-9750H 2.6GHz
GeForce GTX 1660 Ti Mobile
min:
18.3 fps, P0.1:
24.4 fps, P1:
48.4 fps, max:
162 fps
fps
29%
GeForce GTX 1050 Ti Mobile:
28.3 [X] MSI GE72 7RE Intel Core i7-7700HQ 2.8GHz
GeForce GTX 1050 Ti Mobile
min:
10.3 fps, P0.1:
10.5 fps, P1:
15.1 fps, max:
74.3 fps
fps
63%
GeForce GTX 1650 Mobile:
61.9 [X] MSI GL75 Intel Core i7-10750H 2.6GHz
GeForce GTX 1650 Mobile
min:
11.8 fps, P0.1:
35.4 fps, P1:
47.4 fps, max:
119 fps
fps
100%
GeForce GTX 1660 Ti Mobile:
72.6 [X] MSI GP65 Leopard 9SD Intel Core i7-9750H 2.6GHz
GeForce GTX 1660 Ti Mobile
min:
15.5 fps, P0.1:
18.2 fps, P1:
39.4 fps, max:
141 fps
fps
62%
GeForce GTX 1650 Mobile:
45 [X] MSI GL75 Intel Core i7-10750H 2.6GHz
GeForce GTX 1650 Mobile
min:
16.2 fps, P0.1:
23.7 fps, P1:
35.7 fps, max:
111 fps
fps
100%
GeForce GTX 1660 Ti Mobile:
42.4 [X] MSI GP65 Leopard 9SD Intel Core i7-9750H 2.6GHz
GeForce GTX 1660 Ti Mobile
min:
9.05 fps, P0.1:
11.4 fps, P1:
15.3 fps, max:
141 fps
fps
62%
GeForce GTX 1650 Mobile:
26.1 [X] MSI GL75 Intel Core i7-10750H 2.6GHz
GeForce GTX 1650 Mobile
min:
7.19 fps, P0.1:
7.87 fps, P1:
12.1 fps, max:
114 fps
fps
GeForce GTX 1050 Ti Mobile:
63.2 [X] MSI GE72 7RE Intel Core i7-7700HQ 2.8GHz
GeForce GTX 1050 Ti Mobile
min:
2.6 fps, P0.1:
14 fps, P1:
22.6 fps, max:
97.9 fps
fps
GeForce GTX 1650 Mobile:
102 [X] MSI GL75 Intel Core i7-10750H 2.6GHz
GeForce GTX 1650 Mobile
min:
4.38 fps, P0.1:
12.6 fps, P1:
71.3 fps, max:
142 fps
fps
100%
GeForce GTX 1660 Ti Mobile:
82.7 [X] MSI GP65 Leopard 9SD Intel Core i7-9750H 2.6GHz
GeForce GTX 1660 Ti Mobile
min:
15 fps, P0.1:
41.8 fps, P1:
54.3 fps, max:
133 fps
fps
38%
GeForce GTX 1050 Ti Mobile:
31.2 [X] MSI GE72 7RE Intel Core i7-7700HQ 2.8GHz
GeForce GTX 1050 Ti Mobile
min:
12.9 fps, P0.1:
13.3 fps, P1:
15.5 fps, max:
65.7 fps
fps
65%
GeForce GTX 1650 Mobile:
53.8 [X] MSI GL75 Intel Core i7-10750H 2.6GHz
GeForce GTX 1650 Mobile
min:
5.99 fps, P0.1:
10.2 fps, P1:
39.7 fps, max:
114 fps
fps
100%
GeForce GTX 1660 Ti Mobile:
70.8 [X] MSI GP65 Leopard 9SD Intel Core i7-9750H 2.6GHz
GeForce GTX 1660 Ti Mobile
min:
14.5 fps, P0.1:
19.3 fps, P1:
50.3 fps, max:
122 fps
fps
18%
GeForce GTX 1050 Ti Mobile:
12.6 [X] MSI GE72 7RE Intel Core i7-7700HQ 2.8GHz
GeForce GTX 1050 Ti Mobile
min:
6.31 fps, P0.1:
6.38 fps, P1:
7.48 fps, max:
49 fps
fps
62%
GeForce GTX 1650 Mobile:
43.9 [X] MSI GL75 Intel Core i7-10750H 2.6GHz
GeForce GTX 1650 Mobile
min:
7.61 fps, P0.1:
10.3 fps, P1:
34.1 fps, max:
94.2 fps
fps
100%
GeForce GTX 1660 Ti Mobile:
58 [X] MSI GP65 Leopard 9SD Intel Core i7-9750H 2.6GHz
GeForce GTX 1660 Ti Mobile
min:
2.16 fps, P0.1:
3.14 fps, P1:
18.9 fps, max:
116 fps
fps
17%
GeForce GTX 1650 Mobile:
9.9 [X] MSI GL75 Intel Core i7-10750H 2.6GHz
GeForce GTX 1650 Mobile
min:
6.35 fps, P0.1:
6.37 fps, P1:
6.75 fps, max:
16.8 fps
fps
100%
GeForce GTX 1660 Ti Mobile:
29.8 [X] MSI GP65 Leopard 9SD Intel Core i7-9750H 2.6GHz
GeForce GTX 1660 Ti Mobile
min:
6.65 fps, P0.1:
9.97 fps, P1:
12.2 fps, max:
83.1 fps
fps
14%
GeForce GTX 1650 Mobile:
4.2 [X] MSI GL75 Intel Core i7-10750H 2.6GHz
GeForce GTX 1650 Mobile
min:
3.33 fps, P0.1:
3.33 fps, P1:
3.39 fps, max:
7.16 fps
fps
100%
GeForce GTX 1660 Ti Mobile:
4.3 [X] MSI GP65 Leopard 9SD Intel Core i7-9750H 2.6GHz
GeForce GTX 1660 Ti Mobile
min:
3.15 fps, P0.1:
3.16 fps, P1:
3.32 fps, max:
6.34 fps
fps
GeForce GTX 1050 Ti Mobile:
93 [X] MSI GE72 7RE Intel Core i7-7700HQ 2.8GHz
GeForce GTX 1050 Ti Mobile
fps
100%
GeForce GTX 1660 Ti Mobile:
100 [X] MSI GP65 Leopard 9SD Intel Core i7-9750H 2.6GHz
GeForce GTX 1660 Ti Mobile
fps
45%
GeForce GTX 1050 Ti Mobile:
45 [X] MSI GE72 7RE Intel Core i7-7700HQ 2.8GHz
GeForce GTX 1050 Ti Mobile
fps
68%
GeForce GTX 1650 Mobile:
68 [X] MSI GL75 Intel Core i7-10750H 2.6GHz
GeForce GTX 1650 Mobile
fps
100%
GeForce GTX 1660 Ti Mobile:
90 [X] MSI GP65 Leopard 9SD Intel Core i7-9750H 2.6GHz
GeForce GTX 1660 Ti Mobile
fps
40%
GeForce GTX 1050 Ti Mobile:
36 [X] MSI GE72 7RE Intel Core i7-7700HQ 2.8GHz
GeForce GTX 1050 Ti Mobile
fps
67%
GeForce GTX 1650 Mobile:
60 [X] MSI GL75 Intel Core i7-10750H 2.6GHz
GeForce GTX 1650 Mobile
fps
100%
GeForce GTX 1660 Ti Mobile:
44 [X] MSI GP65 Leopard 9SD Intel Core i7-9750H 2.6GHz
GeForce GTX 1660 Ti Mobile
fps
39%
GeForce GTX 1050 Ti Mobile:
17 [X] MSI GE72 7RE Intel Core i7-7700HQ 2.8GHz
GeForce GTX 1050 Ti Mobile
fps
50%
GeForce GTX 1650 Mobile:
22 [X] MSI GL75 Intel Core i7-10750H 2.6GHz
GeForce GTX 1650 Mobile
fps
100%
GeForce GTX 1660 Ti Mobile:
36 [X] MSI GP65 Leopard 9SD Intel Core i7-9750H 2.6GHz
GeForce GTX 1660 Ti Mobile
fps
50%
GeForce GTX 1650 Mobile:
18 [X] MSI GL75 Intel Core i7-10750H 2.6GHz
GeForce GTX 1650 Mobile
fps
100%
GeForce GTX 1660 Ti Mobile:
24 [X] MSI GP65 Leopard 9SD Intel Core i7-9750H 2.6GHz
GeForce GTX 1660 Ti Mobile
fps
50%
GeForce GTX 1650 Mobile:
12 [X] MSI GL75 Intel Core i7-10750H 2.6GHz
GeForce GTX 1650 Mobile
fps
GeForce GTX 1050 Ti Mobile:
50.8 [X] MSI GE72 7RE Intel Core i7-7700HQ 2.8GHz
GeForce GTX 1050 Ti Mobile
min:
34.6 fps, P0.1:
37.9 fps, P1:
41.9 fps, max:
185 fps
fps
100%
GeForce GTX 1660 Ti Mobile:
72.9 [X] MSI GP65 Leopard 9SD Intel Core i7-9750H 2.6GHz
GeForce GTX 1660 Ti Mobile
min:
24.3 fps, P0.1:
25.1 fps, P1:
27.1 fps, max:
359 fps
fps
48%
GeForce GTX 1050 Ti Mobile:
35.1 [X] MSI GE72 7RE Intel Core i7-7700HQ 2.8GHz
GeForce GTX 1050 Ti Mobile
min:
27.6 fps, P0.1:
27.7 fps, P1:
29.4 fps, max:
54.2 fps
fps
82%
GeForce GTX 1650 Mobile:
59.8 [X] MSI GL75 Intel Core i7-10750H 2.6GHz
GeForce GTX 1650 Mobile
min:
40.1 fps, P0.1:
46.7 fps, P1:
50 fps, max:
122 fps
fps
100%
GeForce GTX 1660 Ti Mobile:
59.7 [X] MSI GP65 Leopard 9SD Intel Core i7-9750H 2.6GHz
GeForce GTX 1660 Ti Mobile
min:
24.3 fps, P0.1:
26 fps, P1:
30.1 fps, max:
223 fps
fps
40%
GeForce GTX 1050 Ti Mobile:
23.6 [X] MSI GE72 7RE Intel Core i7-7700HQ 2.8GHz
GeForce GTX 1050 Ti Mobile
min:
17.8 fps, P0.1:
19.6 fps, P1:
20 fps, max:
36.3 fps
fps
57%
GeForce GTX 1650 Mobile:
33.9 [X] MSI GL75 Intel Core i7-10750H 2.6GHz
GeForce GTX 1650 Mobile
min:
22.9 fps, P0.1:
23.5 fps, P1:
24.7 fps, max:
83.3 fps
fps
100%
GeForce GTX 1660 Ti Mobile:
55.8 [X] MSI GP65 Leopard 9SD Intel Core i7-9750H 2.6GHz
GeForce GTX 1660 Ti Mobile
min:
23.6 fps, P0.1:
25.1 fps, P1:
30 fps, max:
118 fps
fps
5%
GeForce GTX 1050 Ti Mobile:
2.9 [X] MSI GE72 7RE Intel Core i7-7700HQ 2.8GHz
GeForce GTX 1050 Ti Mobile
min:
2.33 fps, P0.1:
2.33 fps, P1:
2.34 fps, max:
3.52 fps
fps
60%
GeForce GTX 1650 Mobile:
33.4 [X] MSI GL75 Intel Core i7-10750H 2.6GHz
GeForce GTX 1650 Mobile
min:
19 fps, P0.1:
23.1 fps, P1:
24.9 fps, max:
53 fps
fps
100%
GeForce GTX 1660 Ti Mobile:
42.2 [X] MSI GP65 Leopard 9SD Intel Core i7-9750H 2.6GHz
GeForce GTX 1660 Ti Mobile
min:
24.8 fps, P0.1:
27.4 fps, P1:
32.1 fps, max:
145 fps
fps
55%
GeForce GTX 1650 Mobile:
23.3 [X] MSI GL75 Intel Core i7-10750H 2.6GHz
GeForce GTX 1650 Mobile
min:
16.8 fps, P0.1:
17.2 fps, P1:
17.5 fps, max:
37.4 fps
fps
100%
GeForce GTX 1660 Ti Mobile:
22 [X] MSI GP65 Leopard 9SD Intel Core i7-9750H 2.6GHz
GeForce GTX 1660 Ti Mobile
min:
14.6 fps, P0.1:
15.7 fps, P1:
17.3 fps, max:
37.8 fps
fps
57%
GeForce GTX 1650 Mobile:
12.6 [X] MSI GL75 Intel Core i7-10750H 2.6GHz
GeForce GTX 1650 Mobile
min:
5.13 fps, P0.1:
5.29 fps, P1:
9.71 fps, max:
234 fps
fps
GeForce GTX 1050 Ti Mobile:
81 [X] MSI GE72 7RE Intel Core i7-7700HQ 2.8GHz
GeForce GTX 1050 Ti Mobile
min:
66 fps, max:
110 fps
fps
100%
GeForce GTX 1660 Ti Mobile:
69 [X] MSI GP65 Leopard 9SD Intel Core i7-9750H 2.6GHz
GeForce GTX 1660 Ti Mobile
min:
58 fps
fps
57%
GeForce GTX 1050 Ti Mobile:
39 [X] MSI GE72 7RE Intel Core i7-7700HQ 2.8GHz
GeForce GTX 1050 Ti Mobile
min:
32 fps, max:
51 fps
fps
87%
GeForce GTX 1650 Mobile:
60 [X] MSI GL75 Intel Core i7-10750H 2.6GHz
GeForce GTX 1650 Mobile
min:
49 fps
fps
100%
GeForce GTX 1660 Ti Mobile:
55 [X] MSI GP65 Leopard 9SD Intel Core i7-9750H 2.6GHz
GeForce GTX 1660 Ti Mobile
min:
47 fps
fps
53%
GeForce GTX 1050 Ti Mobile:
29 [X] MSI GE72 7RE Intel Core i7-7700HQ 2.8GHz
GeForce GTX 1050 Ti Mobile
min:
25 fps, max:
37 fps
fps
84%
GeForce GTX 1650 Mobile:
46 [X] MSI GL75 Intel Core i7-10750H 2.6GHz
GeForce GTX 1650 Mobile
min:
36 fps
fps
100%
GeForce GTX 1660 Ti Mobile:
50 [X] MSI GP65 Leopard 9SD Intel Core i7-9750H 2.6GHz
GeForce GTX 1660 Ti Mobile
min:
40 fps
fps
16%
GeForce GTX 1050 Ti Mobile:
8 [X] MSI GE72 7RE Intel Core i7-7700HQ 2.8GHz
GeForce GTX 1050 Ti Mobile
min:
5 fps, max:
13 fps
fps
78%
GeForce GTX 1650 Mobile:
39 [X] MSI GL75 Intel Core i7-10750H 2.6GHz
GeForce GTX 1650 Mobile
min:
30 fps
fps
100%
GeForce GTX 1660 Ti Mobile:
35 [X] MSI GP65 Leopard 9SD Intel Core i7-9750H 2.6GHz
GeForce GTX 1660 Ti Mobile
min:
28 fps
fps
71%
GeForce GTX 1650 Mobile:
25 [X] MSI GL75 Intel Core i7-10750H 2.6GHz
GeForce GTX 1650 Mobile
min:
19 fps
fps
100%
GeForce GTX 1660 Ti Mobile:
20 [X] MSI GP65 Leopard 9SD Intel Core i7-9750H 2.6GHz
GeForce GTX 1660 Ti Mobile
min:
18 fps
fps
40%
GeForce GTX 1650 Mobile:
8 [X] MSI GL75 Intel Core i7-10750H 2.6GHz
GeForce GTX 1650 Mobile
min:
6 fps
fps
GeForce GTX 1050 Ti Mobile:
0 (!) [X] MSI GE72 7RE Intel Core i7-7700HQ 2.8GHz
GeForce GTX 1050 Ti Mobile
fps
100%
GeForce GTX 1660 Ti Mobile:
74 [X] MSI GP65 Leopard 9SD Intel Core i7-9750H 2.6GHz
GeForce GTX 1660 Ti Mobile
min:
55 fps
fps
65%
GeForce GTX 1650 Mobile:
48 [X] MSI GL75 Intel Core i7-10750H 2.6GHz
GeForce GTX 1650 Mobile
min:
8 fps
fps
100%
GeForce GTX 1660 Ti Mobile:
72 [X] MSI GP65 Leopard 9SD Intel Core i7-9750H 2.6GHz
GeForce GTX 1660 Ti Mobile
min:
45 fps
fps
64%
GeForce GTX 1650 Mobile:
46 [X] MSI GL75 Intel Core i7-10750H 2.6GHz
GeForce GTX 1650 Mobile
min:
9 fps
fps
100%
GeForce GTX 1660 Ti Mobile:
70 [X] MSI GP65 Leopard 9SD Intel Core i7-9750H 2.6GHz
GeForce GTX 1660 Ti Mobile
min:
48 fps
fps
63%
GeForce GTX 1650 Mobile:
44 [X] MSI GL75 Intel Core i7-10750H 2.6GHz
GeForce GTX 1650 Mobile
min:
31 fps
fps
100%
GeForce GTX 1660 Ti Mobile:
51 [X] MSI GP65 Leopard 9SD Intel Core i7-9750H 2.6GHz
GeForce GTX 1660 Ti Mobile
min:
38 fps
fps
61%
GeForce GTX 1650 Mobile:
31 [X] MSI GL75 Intel Core i7-10750H 2.6GHz
GeForce GTX 1650 Mobile
min:
23 fps
fps
100%
GeForce GTX 1660 Ti Mobile:
26 [X] MSI GP65 Leopard 9SD Intel Core i7-9750H 2.6GHz
GeForce GTX 1660 Ti Mobile
min:
8 fps
fps
23%
GeForce GTX 1650 Mobile:
6 [X] MSI GL75 Intel Core i7-10750H 2.6GHz
GeForce GTX 1650 Mobile
min:
1 fps
fps
100%
GeForce GTX 1660 Ti Mobile:
146 [X] MSI GP65 Leopard 9SD Intel Core i7-9750H 2.6GHz
GeForce GTX 1660 Ti Mobile
min:
57.2 fps, P0.1:
75.2 fps, P1:
97.6 fps, max:
328 fps
fps
66%
GeForce GTX 1650 Mobile:
96 [X] MSI GL75 Intel Core i7-10750H 2.6GHz
GeForce GTX 1650 Mobile
min:
31.8 fps, P0.1:
51 fps, P1:
57.2 fps, max:
286 fps
fps
100%
GeForce GTX 1660 Ti Mobile:
126 [X] MSI GP65 Leopard 9SD Intel Core i7-9750H 2.6GHz
GeForce GTX 1660 Ti Mobile
min:
57.9 fps, P0.1:
70.9 fps, P1:
83.4 fps, max:
264 fps
fps
65%
GeForce GTX 1650 Mobile:
82.3 [X] MSI GL75 Intel Core i7-10750H 2.6GHz
GeForce GTX 1650 Mobile
min:
41.8 fps, P0.1:
44.8 fps, P1:
49.4 fps, max:
247 fps
fps
100%
GeForce GTX 1660 Ti Mobile:
115 [X] MSI GP65 Leopard 9SD Intel Core i7-9750H 2.6GHz
GeForce GTX 1660 Ti Mobile
min:
63.4 fps, P0.1:
64.9 fps, P1:
73.4 fps, max:
330 fps
fps
65%
GeForce GTX 1650 Mobile:
75 [X] MSI GL75 Intel Core i7-10750H 2.6GHz
GeForce GTX 1650 Mobile
min:
38.7 fps, P0.1:
40.3 fps, P1:
43.8 fps, max:
240 fps
fps
100%
GeForce GTX 1660 Ti Mobile:
74.3 [X] MSI GP65 Leopard 9SD Intel Core i7-9750H 2.6GHz
GeForce GTX 1660 Ti Mobile
min:
25.1 fps, P0.1:
26.4 fps, P1:
34.4 fps, max:
282 fps
fps
66%
GeForce GTX 1650 Mobile:
49.1 [X] MSI GL75 Intel Core i7-10750H 2.6GHz
GeForce GTX 1650 Mobile
min:
23.9 fps, P0.1:
24.2 fps, P1:
26.2 fps, max:
248 fps
fps
100%
GeForce GTX 1660 Ti Mobile:
37.4 [X] MSI GP65 Leopard 9SD Intel Core i7-9750H 2.6GHz
GeForce GTX 1660 Ti Mobile
min:
19.3 fps, P0.1:
19.5 fps, P1:
20.1 fps, max:
221 fps
fps
62%
GeForce GTX 1650 Mobile:
23.3 [X] MSI GL75 Intel Core i7-10750H 2.6GHz
GeForce GTX 1650 Mobile
min:
11.3 fps, P0.1:
11.5 fps, P1:
12.3 fps, max:
179 fps
fps
GeForce GTX 1050 Ti Mobile:
67 [X] MSI GE72 7RE Intel Core i7-7700HQ 2.8GHz
GeForce GTX 1050 Ti Mobile
min:
56 fps, max:
78 fps
fps
GeForce GTX 1650 Mobile:
68.5 fps
100%
GeForce GTX 1660 Ti Mobile:
89 [X] MSI GP65 Leopard 9SD Intel Core i7-9750H 2.6GHz
GeForce GTX 1660 Ti Mobile
min:
52 fps
fps
40%
GeForce GTX 1050 Ti Mobile:
36 [X] MSI GE72 7RE Intel Core i7-7700HQ 2.8GHz
GeForce GTX 1050 Ti Mobile
min:
32 fps, max:
43 fps
fps
65%
GeForce GTX 1650 Mobile:
53.2 63 [X] MSI GL75 Intel Core i7-10750H 2.6GHz
GeForce GTX 1650 Mobile
min:
41 fps
~ 58 fps
100%
GeForce GTX 1660 Ti Mobile:
78 [X] MSI GP65 Leopard 9SD Intel Core i7-9750H 2.6GHz
GeForce GTX 1660 Ti Mobile
min:
46 fps
fps
37%
GeForce GTX 1050 Ti Mobile:
29 [X] MSI GE72 7RE Intel Core i7-7700HQ 2.8GHz
GeForce GTX 1050 Ti Mobile
min:
25 fps, max:
33 fps
fps
64%
GeForce GTX 1650 Mobile:
46.7 54 [X] MSI GL75 Intel Core i7-10750H 2.6GHz
GeForce GTX 1650 Mobile
min:
31 fps
~ 50 fps
100%
GeForce GTX 1660 Ti Mobile:
68 [X] MSI GP65 Leopard 9SD Intel Core i7-9750H 2.6GHz
GeForce GTX 1660 Ti Mobile
min:
41 fps
fps
29%
GeForce GTX 1050 Ti Mobile:
20 [X] MSI GE72 7RE Intel Core i7-7700HQ 2.8GHz
GeForce GTX 1050 Ti Mobile
min:
18 fps, max:
22 fps
fps
65%
GeForce GTX 1650 Mobile:
41.1 46 [X] MSI GL75 Intel Core i7-10750H 2.6GHz
GeForce GTX 1650 Mobile
min:
42 fps
~ 44 fps
100%
GeForce GTX 1660 Ti Mobile:
48 [X] MSI GP65 Leopard 9SD Intel Core i7-9750H 2.6GHz
GeForce GTX 1660 Ti Mobile
min:
33 fps
fps
63%
GeForce GTX 1650 Mobile:
30 [X] MSI GL75 Intel Core i7-10750H 2.6GHz
GeForce GTX 1650 Mobile
min:
17 fps
fps
100%
GeForce GTX 1660 Ti Mobile:
87.6 [X] MSI GP65 Leopard 9SD Intel Core i7-9750H 2.6GHz
GeForce GTX 1660 Ti Mobile
min:
29.1 fps, P0.1:
42.5 fps, P1:
53.7 fps, max:
209 fps
fps
36%
GeForce GTX 1050 Ti Mobile:
31.7 [X] MSI GE72 7RE Intel Core i7-7700HQ 2.8GHz
GeForce GTX 1050 Ti Mobile
min:
15.6 fps, P0.1:
18.6 fps, P1:
21 fps, max:
48.8 fps
fps
84%
GeForce GTX 1650 Mobile:
73.2 [X] MSI GL75 Intel Core i7-10750H 2.6GHz
GeForce GTX 1650 Mobile
min:
31.4 fps, P0.1:
41.7 fps, P1:
59.2 fps, max:
129 fps
fps
100%
GeForce GTX 1660 Ti Mobile:
82.6 [X] MSI GP65 Leopard 9SD Intel Core i7-9750H 2.6GHz
GeForce GTX 1660 Ti Mobile
min:
29.9 fps, P0.1:
40.8 fps, P1:
50.9 fps, max:
186 fps
fps
35%
GeForce GTX 1050 Ti Mobile:
29.2 [X] MSI GE72 7RE Intel Core i7-7700HQ 2.8GHz
GeForce GTX 1050 Ti Mobile
min:
16.2 fps, P0.1:
17.6 fps, P1:
18.7 fps, max:
40.4 fps
fps
77%
GeForce GTX 1650 Mobile:
63.4 [X] MSI GL75 Intel Core i7-10750H 2.6GHz
GeForce GTX 1650 Mobile
min:
34.3 fps, P0.1:
39.9 fps, P1:
51.5 fps, max:
86.7 fps
fps
100%
GeForce GTX 1660 Ti Mobile:
65.5 [X] MSI GP65 Leopard 9SD Intel Core i7-9750H 2.6GHz
GeForce GTX 1660 Ti Mobile
min:
23.6 fps, P0.1:
39.9 fps, P1:
44.2 fps, max:
105 fps
fps
64%
GeForce GTX 1650 Mobile:
42 [X] MSI GL75 Intel Core i7-10750H 2.6GHz
GeForce GTX 1650 Mobile
min:
23.1 fps, P0.1:
30.9 fps, P1:
37.4 fps, max:
59.4 fps
fps
100%
GeForce GTX 1660 Ti Mobile:
34.9 [X] MSI GP65 Leopard 9SD Intel Core i7-9750H 2.6GHz
GeForce GTX 1660 Ti Mobile
min:
11.4 fps, P0.1:
25.3 fps, P1:
27.6 fps, max:
55.3 fps
fps
100%
GeForce GTX 1660 Ti Mobile:
224 [X] MSI GP65 Leopard 9SD Intel Core i7-9750H 2.6GHz
GeForce GTX 1660 Ti Mobile
min:
17.8 fps, P0.1:
105 fps, P1:
161 fps, max:
311 fps
fps
74%
GeForce GTX 1650 Mobile:
166 [X] MSI GL75 Intel Core i7-10750H 2.6GHz
GeForce GTX 1650 Mobile
min:
56 fps, P0.1:
90.3 fps, P1:
103 fps, max:
290 fps
fps
100%
GeForce GTX 1660 Ti Mobile:
215 [X] MSI GP65 Leopard 9SD Intel Core i7-9750H 2.6GHz
GeForce GTX 1660 Ti Mobile
min:
84.5 fps, P0.1:
128 fps, P1:
155 fps, max:
296 fps
fps
75%
GeForce GTX 1650 Mobile:
161 [X] MSI GL75 Intel Core i7-10750H 2.6GHz
GeForce GTX 1650 Mobile
min:
77 fps, P0.1:
87.4 fps, P1:
96.4 fps, max:
287 fps
fps
100%
GeForce GTX 1660 Ti Mobile:
214 [X] MSI GP65 Leopard 9SD Intel Core i7-9750H 2.6GHz
GeForce GTX 1660 Ti Mobile
min:
25.8 fps, P0.1:
107 fps, P1:
155 fps, max:
299 fps
fps
67%
GeForce GTX 1650 Mobile:
143 [X] MSI GL75 Intel Core i7-10750H 2.6GHz
GeForce GTX 1650 Mobile
min:
23.5 fps, P0.1:
74.7 fps, P1:
83.3 fps, max:
265 fps
fps
100%
GeForce GTX 1660 Ti Mobile:
203 [X] MSI GP65 Leopard 9SD Intel Core i7-9750H 2.6GHz
GeForce GTX 1660 Ti Mobile
min:
70.9 fps, P0.1:
104 fps, P1:
143 fps, max:
285 fps
fps
57%
GeForce GTX 1650 Mobile:
116 [X] MSI GL75 Intel Core i7-10750H 2.6GHz
GeForce GTX 1650 Mobile
min:
12.6 fps, P0.1:
66 fps, P1:
73 fps, max:
241 fps
fps
100%
GeForce GTX 1660 Ti Mobile:
135 [X] MSI GP65 Leopard 9SD Intel Core i7-9750H 2.6GHz
GeForce GTX 1660 Ti Mobile
min:
64.3 fps, P0.1:
83.1 fps, P1:
107 fps, max:
261 fps
fps
56%
GeForce GTX 1650 Mobile:
75.8 [X] MSI GL75 Intel Core i7-10750H 2.6GHz
GeForce GTX 1650 Mobile
min:
43 fps, P0.1:
49.1 fps, P1:
52.9 fps, max:
206 fps
fps
100%
GeForce GTX 1660 Ti Mobile:
57.9 [X] MSI GP65 Leopard 9SD Intel Core i7-9750H 2.6GHz
GeForce GTX 1660 Ti Mobile
min:
19.5 fps, P0.1:
23 fps, P1:
29.2 fps, max:
148 fps
fps
77%
GeForce GTX 1650 Mobile:
44.4 [X] MSI GL75 Intel Core i7-10750H 2.6GHz
GeForce GTX 1650 Mobile
min:
14.8 fps, P0.1:
20.6 fps, P1:
23.6 fps, max:
110 fps
fps
100%
GeForce GTX 1660 Ti Mobile:
55.9 [X] MSI GP65 Leopard 9SD Intel Core i7-9750H 2.6GHz
GeForce GTX 1660 Ti Mobile
min:
16.5 fps, P0.1:
24 fps, P1:
30.5 fps, max:
122 fps
fps
75%
GeForce GTX 1650 Mobile:
41.9 [X] MSI GL75 Intel Core i7-10750H 2.6GHz
GeForce GTX 1650 Mobile
min:
15.6 fps, P0.1:
16.3 fps, P1:
22.2 fps, max:
91.1 fps
fps
100%
GeForce GTX 1660 Ti Mobile:
50 [X] MSI GP65 Leopard 9SD Intel Core i7-9750H 2.6GHz
GeForce GTX 1660 Ti Mobile
min:
18.6 fps, P0.1:
19.9 fps, P1:
24.8 fps, max:
128 fps
fps
61%
GeForce GTX 1650 Mobile:
30.6 [X] MSI GL75 Intel Core i7-10750H 2.6GHz
GeForce GTX 1650 Mobile
min:
9.86 fps, P0.1:
12.8 fps, P1:
19.9 fps, max:
67.2 fps
fps
100%
GeForce GTX 1660 Ti Mobile:
38 [X] MSI GP65 Leopard 9SD Intel Core i7-9750H 2.6GHz
GeForce GTX 1660 Ti Mobile
min:
18.7 fps, P0.1:
20.3 fps, P1:
23.7 fps, max:
104 fps
fps
48%
GeForce GTX 1650 Mobile:
18.1 [X] MSI GL75 Intel Core i7-10750H 2.6GHz
GeForce GTX 1650 Mobile
min:
5.5 fps, P0.1:
9.59 fps, P1:
12.9 fps, max:
30.8 fps
fps
100%
GeForce GTX 1660 Ti Mobile:
17.8 [X] MSI GP65 Leopard 9SD Intel Core i7-9750H 2.6GHz
GeForce GTX 1660 Ti Mobile
min:
5.09 fps, P0.1:
8.67 fps, P1:
12.3 fps, max:
44.5 fps
fps
58%
GeForce GTX 1650 Mobile:
10.4 [X] MSI GL75 Intel Core i7-10750H 2.6GHz
GeForce GTX 1650 Mobile
min:
7.09 fps, P0.1:
7.24 fps, P1:
7.93 fps, max:
14.9 fps
fps
GeForce GTX 1050 Ti Mobile:
36.8 [X] MSI GE72 7RE Intel Core i7-7700HQ 2.8GHz
GeForce GTX 1050 Ti Mobile
min:
2.95 fps, P0.1:
12.9 fps, P1:
25.4 fps, max:
71.7 fps
fps
100%
GeForce GTX 1660 Ti Mobile:
81.5 [X] MSI GP65 Leopard 9SD Intel Core i7-9750H 2.6GHz
GeForce GTX 1660 Ti Mobile
min:
18.5 fps, P0.1:
60.4 fps, P1:
68.3 fps, max:
162 fps
fps
29%
GeForce GTX 1050 Ti Mobile:
23.6 [X] MSI GE72 7RE Intel Core i7-7700HQ 2.8GHz
GeForce GTX 1050 Ti Mobile
min:
8.02 fps, P0.1:
8.7 fps, P1:
12.4 fps, max:
33.5 fps
fps
63%
GeForce GTX 1650 Mobile:
51.2 [X] MSI GL75 Intel Core i7-10750H 2.6GHz
GeForce GTX 1650 Mobile
min:
17.5 fps, P0.1:
26.3 fps, P1:
39.7 fps, max:
94.7 fps
fps
100%
GeForce GTX 1660 Ti Mobile:
65.6 [X] MSI GP65 Leopard 9SD Intel Core i7-9750H 2.6GHz
GeForce GTX 1660 Ti Mobile
min:
26.1 fps, P0.1:
49.4 fps, P1:
52.6 fps, max:
91.2 fps
fps
32%
GeForce GTX 1050 Ti Mobile:
20.7 [X] MSI GE72 7RE Intel Core i7-7700HQ 2.8GHz
GeForce GTX 1050 Ti Mobile
min:
9.45 fps, P0.1:
9.58 fps, P1:
11.9 fps, max:
30.4 fps
fps
57%
GeForce GTX 1650 Mobile:
37.3 [X] MSI GL75 Intel Core i7-10750H 2.6GHz
GeForce GTX 1650 Mobile
min:
15.1 fps, P0.1:
15.6 fps, P1:
27.3 fps, max:
50.9 fps
fps
100%
GeForce GTX 1660 Ti Mobile:
57.4 [X] MSI GP65 Leopard 9SD Intel Core i7-9750H 2.6GHz
GeForce GTX 1660 Ti Mobile
min:
25.9 fps, P0.1:
43.3 fps, P1:
45.9 fps, max:
79.1 fps
fps
29%
GeForce GTX 1050 Ti Mobile:
16.8 [X] MSI GE72 7RE Intel Core i7-7700HQ 2.8GHz
GeForce GTX 1050 Ti Mobile
min:
8.58 fps, P0.1:
8.65 fps, P1:
11.7 fps, max:
24.2 fps
fps
60%
GeForce GTX 1650 Mobile:
34.3 [X] MSI GL75 Intel Core i7-10750H 2.6GHz
GeForce GTX 1650 Mobile
min:
14.9 fps, P0.1:
19.9 fps, P1:
27.2 fps, max:
85.9 fps
fps
100%
GeForce GTX 1660 Ti Mobile:
40.1 [X] MSI GP65 Leopard 9SD Intel Core i7-9750H 2.6GHz
GeForce GTX 1660 Ti Mobile
min:
21.2 fps, P0.1:
33.7 fps, P1:
34.7 fps, max:
50.2 fps
fps
55%
GeForce GTX 1650 Mobile:
22.1 [X] MSI GL75 Intel Core i7-10750H 2.6GHz
GeForce GTX 1650 Mobile
min:
12.3 fps, P0.1:
14.9 fps, P1:
17.9 fps, max:
40.6 fps
fps
100%
GeForce GTX 1660 Ti Mobile:
21 [X] MSI GP65 Leopard 9SD Intel Core i7-9750H 2.6GHz
GeForce GTX 1660 Ti Mobile
min:
13.7 fps, P0.1:
16.5 fps, P1:
18.8 fps, max:
25.6 fps
fps
39%
GeForce GTX 1650 Mobile:
8.1 [X] MSI GL75 Intel Core i7-10750H 2.6GHz
GeForce GTX 1650 Mobile
min:
6.26 fps, P0.1:
6.48 fps, P1:
7.11 fps, max:
10.6 fps
fps
GeForce GTX 1650 Mobile:
148 fps
100%
GeForce GTX 1660 Ti Mobile:
149 [X] MSI GP65 Leopard 9SD Intel Core i7-9750H 2.6GHz
GeForce GTX 1660 Ti Mobile
min:
126 fps
fps
68%
GeForce GTX 1650 Mobile:
93 104 109 [X] MSI GL75 Intel Core i7-10750H 2.6GHz
GeForce GTX 1650 Mobile
min:
95 fps
~ 102 fps
100%
GeForce GTX 1660 Ti Mobile:
120 [X] MSI GP65 Leopard 9SD Intel Core i7-9750H 2.6GHz
GeForce GTX 1660 Ti Mobile
min:
106 fps
fps
72%
GeForce GTX 1650 Mobile:
77 89.7 90 [X] MSI GL75 Intel Core i7-10750H 2.6GHz
GeForce GTX 1650 Mobile
min:
79 fps
~ 86 fps
GeForce GTX 1650 Mobile:
58 fps
100%
GeForce GTX 1660 Ti Mobile:
135 [X] MSI GP65 Leopard 9SD Intel Core i7-9750H 2.6GHz
GeForce GTX 1660 Ti Mobile
min:
63.8 fps, P0.1:
89.4 fps, P1:
100 fps, max:
161 fps
fps
87%
GeForce GTX 1650 Mobile:
118 [X] MSI GL75 Intel Core i7-10750H 2.6GHz
GeForce GTX 1650 Mobile
min:
60.7 fps, P0.1:
81.6 fps, P1:
87.9 fps, max:
136 fps
fps
100%
GeForce GTX 1660 Ti Mobile:
134 [X] MSI GP65 Leopard 9SD Intel Core i7-9750H 2.6GHz
GeForce GTX 1660 Ti Mobile
min:
55.4 fps, P0.1:
89.9 fps, P1:
98.5 fps, max:
156 fps
fps
80%
GeForce GTX 1650 Mobile:
107 [X] MSI GL75 Intel Core i7-10750H 2.6GHz
GeForce GTX 1650 Mobile
min:
73.9 fps, P0.1:
76 fps, P1:
80.4 fps, max:
124 fps
fps
100%
GeForce GTX 1660 Ti Mobile:
117 [X] MSI GP65 Leopard 9SD Intel Core i7-9750H 2.6GHz
GeForce GTX 1660 Ti Mobile
min:
32.4 fps, P0.1:
51.3 fps, P1:
80.8 fps, max:
139 fps
fps
70%
GeForce GTX 1650 Mobile:
82.4 [X] MSI GL75 Intel Core i7-10750H 2.6GHz
GeForce GTX 1650 Mobile
min:
56.5 fps, P0.1:
60.4 fps, P1:
65.1 fps, max:
94.8 fps
fps
100%
GeForce GTX 1660 Ti Mobile:
68.2 [X] MSI GP65 Leopard 9SD Intel Core i7-9750H 2.6GHz
GeForce GTX 1660 Ti Mobile
min:
18.9 fps, P0.1:
24.2 fps, P1:
28.5 fps, max:
87.5 fps
fps
74%
GeForce GTX 1650 Mobile:
50.4 [X] MSI GL75 Intel Core i7-10750H 2.6GHz
GeForce GTX 1650 Mobile
min:
38.9 fps, P0.1:
39.6 fps, P1:
41.2 fps, max:
58 fps
fps
100%
GeForce GTX 1660 Ti Mobile:
95 [X] MSI GP65 Leopard 9SD Intel Core i7-9750H 2.6GHz
GeForce GTX 1660 Ti Mobile
min:
33.6 fps, P0.1:
47 fps, P1:
61.2 fps, max:
230 fps
fps
67%
GeForce GTX 1650 Mobile:
63.8 [X] MSI GL75 Intel Core i7-10750H 2.6GHz
GeForce GTX 1650 Mobile
min:
30.7 fps, P0.1:
34.5 fps, P1:
45.2 fps, max:
163 fps
fps
100%
GeForce GTX 1660 Ti Mobile:
83.3 [X] MSI GP65 Leopard 9SD Intel Core i7-9750H 2.6GHz
GeForce GTX 1660 Ti Mobile
min:
35.3 fps, P0.1:
43.8 fps, P1:
56.9 fps, max:
208 fps
fps
67%
GeForce GTX 1650 Mobile:
55.5 [X] MSI GL75 Intel Core i7-10750H 2.6GHz
GeForce GTX 1650 Mobile
min:
21.8 fps, P0.1:
33.5 fps, P1:
41.6 fps, max:
114 fps
fps
100%
GeForce GTX 1660 Ti Mobile:
60.7 [X] MSI GP65 Leopard 9SD Intel Core i7-9750H 2.6GHz
GeForce GTX 1660 Ti Mobile
min:
19.1 fps, P0.1:
31.4 fps, P1:
42.9 fps, max:
128 fps
fps
66%
GeForce GTX 1650 Mobile:
40.1 [X] MSI GL75 Intel Core i7-10750H 2.6GHz
GeForce GTX 1650 Mobile
min:
15.1 fps, P0.1:
24.9 fps, P1:
31.6 fps, max:
80.6 fps
fps
100%
GeForce GTX 1660 Ti Mobile:
43.4 [X] MSI GP65 Leopard 9SD Intel Core i7-9750H 2.6GHz
GeForce GTX 1660 Ti Mobile
min:
25.5 fps, P0.1:
27.6 fps, P1:
32.4 fps, max:
93 fps
fps
65%
GeForce GTX 1650 Mobile:
28.3 [X] MSI GL75 Intel Core i7-10750H 2.6GHz
GeForce GTX 1650 Mobile
min:
20 fps, P0.1:
20.3 fps, P1:
23.4 fps, max:
63.8 fps
fps
100%
GeForce GTX 1660 Ti Mobile:
24.1 [X] MSI GP65 Leopard 9SD Intel Core i7-9750H 2.6GHz
GeForce GTX 1660 Ti Mobile
min:
17.2 fps, P0.1:
17.4 fps, P1:
19.9 fps, max:
37.2 fps
fps
65%
GeForce GTX 1650 Mobile:
15.6 [X] MSI GL75 Intel Core i7-10750H 2.6GHz
GeForce GTX 1650 Mobile
min:
9.39 fps, P0.1:
12 fps, P1:
14 fps, max:
32 fps
fps
100%
GeForce GTX 1660 Ti Mobile:
115 [X] MSI GP65 Leopard 9SD Intel Core i7-9750H 2.6GHz
GeForce GTX 1660 Ti Mobile
min:
24.7 fps, P0.1:
29.6 fps, P1:
63.7 fps, max:
356 fps
fps
92%
GeForce GTX 1650 Mobile:
106 [X] MSI GL75 Intel Core i7-10750H 2.6GHz
GeForce GTX 1650 Mobile
min:
20.6 fps, P0.1:
37 fps, P1:
55.3 fps, max:
271 fps
fps
100%
GeForce GTX 1660 Ti Mobile:
110 [X] MSI GP65 Leopard 9SD Intel Core i7-9750H 2.6GHz
GeForce GTX 1660 Ti Mobile
min:
15.8 fps, P0.1:
35.6 fps, P1:
62.3 fps, max:
288 fps
fps
82%
GeForce GTX 1650 Mobile:
90.3 [X] MSI GL75 Intel Core i7-10750H 2.6GHz
GeForce GTX 1650 Mobile
min:
22.7 fps, P0.1:
43.5 fps, P1:
51.1 fps, max:
259 fps
fps
100%
GeForce GTX 1660 Ti Mobile:
96.2 [X] MSI GP65 Leopard 9SD Intel Core i7-9750H 2.6GHz
GeForce GTX 1660 Ti Mobile
min:
23.1 fps, P0.1:
30.8 fps, P1:
60.3 fps, max:
272 fps
fps
70%
GeForce GTX 1650 Mobile:
67.5 [X] MSI GL75 Intel Core i7-10750H 2.6GHz
GeForce GTX 1650 Mobile
min:
22.3 fps, P0.1:
27.7 fps, P1:
49.5 fps, max:
225 fps
fps
100%
GeForce GTX 1660 Ti Mobile:
53.6 [X] MSI GP65 Leopard 9SD Intel Core i7-9750H 2.6GHz
GeForce GTX 1660 Ti Mobile
min:
31.8 fps, P0.1:
35.3 fps, P1:
44 fps, max:
110 fps
fps
63%
GeForce GTX 1650 Mobile:
33.7 [X] MSI GL75 Intel Core i7-10750H 2.6GHz
GeForce GTX 1650 Mobile
min:
27.4 fps, P0.1:
27.5 fps, P1:
28.7 fps, max:
62.9 fps
fps
100%
GeForce GTX 1660 Ti Mobile:
105 [X] MSI GP65 Leopard 9SD Intel Core i7-9750H 2.6GHz
GeForce GTX 1660 Ti Mobile
min:
69.1 fps, P0.1:
71.5 fps, P1:
78.6 fps, max:
144 fps
fps
68%
GeForce GTX 1650 Mobile:
71.4 [X] MSI GL75 Intel Core i7-10750H 2.6GHz
GeForce GTX 1650 Mobile
min:
49.3 fps, P0.1:
56.6 fps, P1:
57.8 fps, max:
92.1 fps
fps
100%
GeForce GTX 1660 Ti Mobile:
99 [X] MSI GP65 Leopard 9SD Intel Core i7-9750H 2.6GHz
GeForce GTX 1660 Ti Mobile
min:
42 fps, P0.1:
73.4 fps, P1:
83.1 fps, max:
140 fps
fps
65%
GeForce GTX 1650 Mobile:
64.1 [X] MSI GL75 Intel Core i7-10750H 2.6GHz
GeForce GTX 1650 Mobile
min:
44.1 fps, P0.1:
51 fps, P1:
52.4 fps, max:
86.7 fps
fps
100%
GeForce GTX 1660 Ti Mobile:
86.4 [X] MSI GP65 Leopard 9SD Intel Core i7-9750H 2.6GHz
GeForce GTX 1660 Ti Mobile
min:
42.7 fps, P0.1:
69.5 fps, P1:
71.1 fps, max:
131 fps
fps
60%
GeForce GTX 1650 Mobile:
52 [X] MSI GL75 Intel Core i7-10750H 2.6GHz
GeForce GTX 1650 Mobile
min:
16.2 fps, P0.1:
30.1 fps, P1:
44.8 fps, max:
69 fps
fps
100%
GeForce GTX 1660 Ti Mobile:
52.4 [X] MSI GP65 Leopard 9SD Intel Core i7-9750H 2.6GHz
GeForce GTX 1660 Ti Mobile
min:
23.4 fps, P0.1:
24.7 fps, P1:
27 fps, max:
81 fps
fps
50%
GeForce GTX 1650 Mobile:
26.3 [X] MSI GL75 Intel Core i7-10750H 2.6GHz
GeForce GTX 1650 Mobile
min:
19.5 fps, P0.1:
20.9 fps, P1:
21.5 fps, max:
33.4 fps
fps
100%
GeForce GTX 1660 Ti Mobile:
28.6 [X] MSI GP65 Leopard 9SD Intel Core i7-9750H 2.6GHz
GeForce GTX 1660 Ti Mobile
min:
23.4 fps, P0.1:
24 fps, P1:
24.8 fps, max:
39.3 fps
fps
48%
GeForce GTX 1650 Mobile:
13.8 [X] MSI GL75 Intel Core i7-10750H 2.6GHz
GeForce GTX 1650 Mobile
min:
8.67 fps, P0.1:
10.3 fps, P1:
12.1 fps, max:
17.1 fps
fps
100%
GeForce GTX 1660 Ti Mobile:
98.9 [X] MSI GP65 Leopard 9SD Intel Core i7-9750H 2.6GHz
GeForce GTX 1660 Ti Mobile
min:
9.02 fps, P0.1:
25.1 fps, P1:
38 fps, max:
209 fps
fps
68%
GeForce GTX 1650 Mobile:
66.8 [X] MSI GL75 Intel Core i7-10750H 2.6GHz
GeForce GTX 1650 Mobile
min:
11.1 fps, P0.1:
14.3 fps, P1:
23.1 fps, max:
152 fps
fps
100%
GeForce GTX 1660 Ti Mobile:
83.7 [X] MSI GP65 Leopard 9SD Intel Core i7-9750H 2.6GHz
GeForce GTX 1660 Ti Mobile
min:
26.4 fps, P0.1:
29.7 fps, P1:
38.8 fps, max:
179 fps
fps
64%
GeForce GTX 1650 Mobile:
53.6 [X] MSI GL75 Intel Core i7-10750H 2.6GHz
GeForce GTX 1650 Mobile
min:
11.9 fps, P0.1:
14.9 fps, P1:
30.3 fps, max:
128 fps
fps
100%
GeForce GTX 1660 Ti Mobile:
71.7 [X] MSI GP65 Leopard 9SD Intel Core i7-9750H 2.6GHz
GeForce GTX 1660 Ti Mobile
min:
23.1 fps, P0.1:
27.3 fps, P1:
35.6 fps, max:
153 fps
fps
60%
GeForce GTX 1650 Mobile:
43.1 [X] MSI GL75 Intel Core i7-10750H 2.6GHz
GeForce GTX 1650 Mobile
min:
5.11 fps, P0.1:
6.35 fps, P1:
13.9 fps, max:
157 fps
fps
100%
GeForce GTX 1660 Ti Mobile:
46.6 [X] MSI GP65 Leopard 9SD Intel Core i7-9750H 2.6GHz
GeForce GTX 1660 Ti Mobile
min:
10.2 fps, P0.1:
13.3 fps, P1:
25.4 fps, max:
147 fps
fps
68%
GeForce GTX 1650 Mobile:
31.6 [X] MSI GL75 Intel Core i7-10750H 2.6GHz
GeForce GTX 1650 Mobile
min:
8.21 fps, P0.1:
8.68 fps, P1:
13.1 fps, max:
139 fps
fps
100%
GeForce GTX 1660 Ti Mobile:
31.7 [X] MSI GP65 Leopard 9SD Intel Core i7-9750H 2.6GHz
GeForce GTX 1660 Ti Mobile
min:
7 fps, P0.1:
7.07 fps, P1:
9.78 fps, max:
132 fps
fps
74%
GeForce GTX 1650 Mobile:
23.4 [X] MSI GL75 Intel Core i7-10750H 2.6GHz
GeForce GTX 1650 Mobile
min:
8.29 fps, P0.1:
9.51 fps, P1:
13.9 fps, max:
71.9 fps
fps
GeForce GTX 1050 Ti Mobile:
98 [X] MSI GE72 7RE Intel Core i7-7700HQ 2.8GHz
GeForce GTX 1050 Ti Mobile
fps
GeForce GTX 1650 Mobile:
153.4 fps
100%
GeForce GTX 1660 Ti Mobile:
116 [X] MSI GP65 Leopard 9SD Intel Core i7-9750H 2.6GHz
GeForce GTX 1660 Ti Mobile
min:
64 fps
fps
41%
GeForce GTX 1050 Ti Mobile:
48 [X] MSI GE72 7RE Intel Core i7-7700HQ 2.8GHz
GeForce GTX 1050 Ti Mobile
fps
59%
GeForce GTX 1650 Mobile:
63.5 75.1 [X] MSI GL75 Intel Core i7-10750H 2.6GHz
GeForce GTX 1650 Mobile
min:
50 fps
~ 69 fps
100%
GeForce GTX 1660 Ti Mobile:
99.3 [X] MSI GP65 Leopard 9SD Intel Core i7-9750H 2.6GHz
GeForce GTX 1660 Ti Mobile
min:
59 fps
fps
40%
GeForce GTX 1050 Ti Mobile:
40 [X] MSI GE72 7RE Intel Core i7-7700HQ 2.8GHz
GeForce GTX 1050 Ti Mobile
fps
60%
GeForce GTX 1650 Mobile:
55.3 64 [X] MSI GL75 Intel Core i7-10750H 2.6GHz
GeForce GTX 1650 Mobile
min:
16 fps
~ 60 fps
100%
GeForce GTX 1660 Ti Mobile:
91 [X] MSI GP65 Leopard 9SD Intel Core i7-9750H 2.6GHz
GeForce GTX 1660 Ti Mobile
min:
50 fps
fps
40%
GeForce GTX 1050 Ti Mobile:
36 [X] MSI GE72 7RE Intel Core i7-7700HQ 2.8GHz
GeForce GTX 1050 Ti Mobile
fps
59%
GeForce GTX 1650 Mobile:
50.2 58.3 [X] MSI GL75 Intel Core i7-10750H 2.6GHz
GeForce GTX 1650 Mobile
min:
38 fps
~ 54 fps
100%
GeForce GTX 1660 Ti Mobile:
59.2 [X] MSI GP65 Leopard 9SD Intel Core i7-9750H 2.6GHz
GeForce GTX 1660 Ti Mobile
min:
45 fps
fps
62%
GeForce GTX 1650 Mobile:
36.5 [X] MSI GL75 Intel Core i7-10750H 2.6GHz
GeForce GTX 1650 Mobile
min:
26 fps
fps
100%
GeForce GTX 1660 Ti Mobile:
31.2 [X] MSI GP65 Leopard 9SD Intel Core i7-9750H 2.6GHz
GeForce GTX 1660 Ti Mobile
min:
21 fps
fps
62%
GeForce GTX 1650 Mobile:
19.3 [X] MSI GL75 Intel Core i7-10750H 2.6GHz
GeForce GTX 1650 Mobile
min:
13 fps
fps
GeForce GTX 1050 Ti Mobile:
42.9 [X] MSI GE72 7RE Intel Core i7-7700HQ 2.8GHz
GeForce GTX 1050 Ti Mobile
min:
14.4 fps, P0.1:
32.5 fps, P1:
35.7 fps, max:
63.4 fps
fps
GeForce GTX 1650 Mobile:
37.8 54 ~ 46 fps
100%
GeForce GTX 1660 Ti Mobile:
57.3 [X] MSI GP65 Leopard 9SD Intel Core i7-9750H 2.6GHz
GeForce GTX 1660 Ti Mobile
min:
16.2 fps, P0.1:
45.4 fps, P1:
49.9 fps, max:
97.9 fps
fps
37%
GeForce GTX 1050 Ti Mobile:
21.2 [X] MSI GE72 7RE Intel Core i7-7700HQ 2.8GHz
GeForce GTX 1050 Ti Mobile
min:
12.3 fps, P0.1:
14.4 fps, P1:
18.4 fps, max:
62.6 fps
fps
49%
GeForce GTX 1650 Mobile:
24.4 28.5 32.4 [X] MSI GL75 Intel Core i7-10750H 2.6GHz
GeForce GTX 1650 Mobile
min:
18 fps, P0.1:
25.5 fps, P1:
27.3 fps, max:
77.4 fps
~ 28 fps
100%
GeForce GTX 1660 Ti Mobile:
46.6 [X] MSI GP65 Leopard 9SD Intel Core i7-9750H 2.6GHz
GeForce GTX 1660 Ti Mobile
min:
15.5 fps, P0.1:
35.7 fps, P1:
41.3 fps, max:
87.9 fps
fps
52%
GeForce GTX 1650 Mobile:
20.5 23.6 26.6 [X] MSI GL75 Intel Core i7-10750H 2.6GHz
GeForce GTX 1650 Mobile
min:
17.7 fps, P0.1:
21.1 fps, P1:
23 fps, max:
57.6 fps
~ 24 fps
100%
GeForce GTX 1660 Ti Mobile:
39.1 [X] MSI GP65 Leopard 9SD Intel Core i7-9750H 2.6GHz
GeForce GTX 1660 Ti Mobile
min:
15.9 fps, P0.1:
30.8 fps, P1:
34 fps, max:
69.4 fps
fps
51%
GeForce GTX 1650 Mobile:
17.6 19 22.6 [X] MSI GL75 Intel Core i7-10750H 2.6GHz
GeForce GTX 1650 Mobile
min:
11.1 fps, P0.1:
11.7 fps, P1:
19.2 fps, max:
56.2 fps
~ 20 fps
100%
GeForce GTX 1660 Ti Mobile:
24 [X] MSI GP65 Leopard 9SD Intel Core i7-9750H 2.6GHz
GeForce GTX 1660 Ti Mobile
min:
16.7 fps, P0.1:
19.1 fps, P1:
21.6 fps, max:
63.6 fps
fps
59%
GeForce GTX 1650 Mobile:
14.1 [X] MSI GL75 Intel Core i7-10750H 2.6GHz
GeForce GTX 1650 Mobile
min:
10.7 fps, P0.1:
11.6 fps, P1:
12.6 fps, max:
16.9 fps
fps
100%
GeForce GTX 1660 Ti Mobile:
10.3 [X] MSI GP65 Leopard 9SD Intel Core i7-9750H 2.6GHz
GeForce GTX 1660 Ti Mobile
min:
7.61 fps, P0.1:
8.06 fps, P1:
8.54 fps, max:
13.4 fps
fps
56%
GeForce GTX 1650 Mobile:
5.8 [X] MSI GL75 Intel Core i7-10750H 2.6GHz
GeForce GTX 1650 Mobile
min:
3.03 fps, P0.1:
3.07 fps, P1:
4.35 fps, max:
54.4 fps
fps
GeForce GTX 1050 Ti Mobile:
79 [X] MSI GE72 7RE Intel Core i7-7700HQ 2.8GHz
GeForce GTX 1050 Ti Mobile
min:
19 fps, max:
132 fps
fps
GeForce GTX 1650 Mobile:
60 85 ~ 73 fps
100%
GeForce GTX 1660 Ti Mobile:
73 [X] MSI GP65 Leopard 9SD Intel Core i7-9750H 2.6GHz
GeForce GTX 1660 Ti Mobile
min:
33 fps
fps
45%
GeForce GTX 1050 Ti Mobile:
33 [X] MSI GE72 7RE Intel Core i7-7700HQ 2.8GHz
GeForce GTX 1050 Ti Mobile
min:
14 fps, max:
108 fps
fps
70%
GeForce GTX 1650 Mobile:
42 50 60 [X] MSI GL75 Intel Core i7-10750H 2.6GHz
GeForce GTX 1650 Mobile
min:
19 fps
~ 51 fps
100%
GeForce GTX 1660 Ti Mobile:
59 [X] MSI GP65 Leopard 9SD Intel Core i7-9750H 2.6GHz
GeForce GTX 1660 Ti Mobile
min:
26 fps
fps
39%
GeForce GTX 1050 Ti Mobile:
23 [X] MSI GE72 7RE Intel Core i7-7700HQ 2.8GHz
GeForce GTX 1050 Ti Mobile
min:
15 fps, max:
96 fps
fps
59%
GeForce GTX 1650 Mobile:
25 37 [X] MSI GL75 Intel Core i7-10750H 2.6GHz
GeForce GTX 1650 Mobile
min:
17 fps
42 ~ 35 fps
100%
GeForce GTX 1660 Ti Mobile:
55 [X] MSI GP65 Leopard 9SD Intel Core i7-9750H 2.6GHz
GeForce GTX 1660 Ti Mobile
min:
26 fps
fps
40%
GeForce GTX 1050 Ti Mobile:
22 [X] MSI GE72 7RE Intel Core i7-7700HQ 2.8GHz
GeForce GTX 1050 Ti Mobile
min:
12 fps, max:
41 fps
fps
53%
GeForce GTX 1650 Mobile:
16 36 [X] MSI GL75 Intel Core i7-10750H 2.6GHz
GeForce GTX 1650 Mobile
min:
12 fps
36 ~ 29 fps
100%
GeForce GTX 1660 Ti Mobile:
43 [X] MSI GP65 Leopard 9SD Intel Core i7-9750H 2.6GHz
GeForce GTX 1660 Ti Mobile
min:
22 fps
fps
53%
GeForce GTX 1650 Mobile:
23 [X] MSI GL75 Intel Core i7-10750H 2.6GHz
GeForce GTX 1650 Mobile
min:
12 fps
fps
100%
GeForce GTX 1660 Ti Mobile:
25 [X] MSI GP65 Leopard 9SD Intel Core i7-9750H 2.6GHz
GeForce GTX 1660 Ti Mobile
min:
14 fps
fps
56%
GeForce GTX 1650 Mobile:
14 [X] MSI GL75 Intel Core i7-10750H 2.6GHz
GeForce GTX 1650 Mobile
min:
8 fps
fps
GeForce GTX 1050 Ti Mobile:
82.6 [X] MSI GE72 7RE Intel Core i7-7700HQ 2.8GHz
GeForce GTX 1050 Ti Mobile
min:
43.4 fps, P0.1:
46.4 fps, P1:
54.4 fps, max:
112 fps
fps
GeForce GTX 1650 Mobile:
57.1 fps
100%
GeForce GTX 1660 Ti Mobile:
76.7 [X] MSI GP65 Leopard 9SD Intel Core i7-9750H 2.6GHz
GeForce GTX 1660 Ti Mobile
min:
40.8 fps, P0.1:
42.9 fps, P1:
49.1 fps, max:
147 fps
fps
45%
GeForce GTX 1050 Ti Mobile:
34.7 [X] MSI GE72 7RE Intel Core i7-7700HQ 2.8GHz
GeForce GTX 1050 Ti Mobile
min:
21.8 fps, P0.1:
23 fps, P1:
24.4 fps, max:
60.1 fps
fps
61%
GeForce GTX 1650 Mobile:
45.2 49.3 [X] MSI GL75 Intel Core i7-10750H 2.6GHz
GeForce GTX 1650 Mobile
min:
30.8 fps, P0.1:
31.6 fps, P1:
35.5 fps, max:
88.8 fps
~ 47 fps
100%
GeForce GTX 1660 Ti Mobile:
74.2 [X] MSI GP65 Leopard 9SD Intel Core i7-9750H 2.6GHz
GeForce GTX 1660 Ti Mobile
min:
41.5 fps, P0.1:
45 fps, P1:
48.2 fps, max:
148 fps
fps
45%
GeForce GTX 1050 Ti Mobile:
33.3 [X] MSI GE72 7RE Intel Core i7-7700HQ 2.8GHz
GeForce GTX 1050 Ti Mobile
min:
19.2 fps, P0.1:
20 fps, P1:
23 fps, max:
60.1 fps
fps
57%
GeForce GTX 1650 Mobile:
38 46.9 [X] MSI GL75 Intel Core i7-10750H 2.6GHz
GeForce GTX 1650 Mobile
min:
32.7 fps, P0.1:
33.2 fps, P1:
34.4 fps, max:
74.3 fps
~ 42 fps
100%
GeForce GTX 1660 Ti Mobile:
62.9 [X] MSI GP65 Leopard 9SD Intel Core i7-9750H 2.6GHz
GeForce GTX 1660 Ti Mobile
min:
32.1 fps, P0.1:
36.1 fps, P1:
39.4 fps, max:
137 fps
fps
48%
GeForce GTX 1050 Ti Mobile:
30.1 [X] MSI GE72 7RE Intel Core i7-7700HQ 2.8GHz
GeForce GTX 1050 Ti Mobile
min:
18.8 fps, P0.1:
19 fps, P1:
20.1 fps, max:
55.9 fps
fps
59%
GeForce GTX 1650 Mobile:
35 39.8 [X] MSI GL75 Intel Core i7-10750H 2.6GHz
GeForce GTX 1650 Mobile
min:
23.2 fps, P0.1:
23.5 fps, P1:
25.1 fps, max:
78.6 fps
~ 37 fps
100%
GeForce GTX 1660 Ti Mobile:
41.2 [X] MSI GP65 Leopard 9SD Intel Core i7-9750H 2.6GHz
GeForce GTX 1660 Ti Mobile
min:
23.9 fps, P0.1:
26 fps, P1:
27.3 fps, max:
122 fps
fps
63%
GeForce GTX 1650 Mobile:
25.8 [X] MSI GL75 Intel Core i7-10750H 2.6GHz
GeForce GTX 1650 Mobile
min:
17.7 fps, P0.1:
17.8 fps, P1:
18.3 fps, max:
40.9 fps
fps
100%
GeForce GTX 1660 Ti Mobile:
20.4 [X] MSI GP65 Leopard 9SD Intel Core i7-9750H 2.6GHz
GeForce GTX 1660 Ti Mobile
min:
11.6 fps, P0.1:
11.6 fps, P1:
12 fps, max:
68.4 fps
fps
63%
GeForce GTX 1650 Mobile:
12.8 [X] MSI GL75 Intel Core i7-10750H 2.6GHz
GeForce GTX 1650 Mobile
min:
8.32 fps, P0.1:
8.34 fps, P1:
8.52 fps, max:
22.4 fps
fps
GeForce GTX 1050 Ti Mobile:
77.3 [X] MSI GE72 7RE Intel Core i7-7700HQ 2.8GHz
GeForce GTX 1050 Ti Mobile
min:
36.1 fps, P0.1:
43.2 fps, P1:
51.8 fps, max:
191 fps
fps
GeForce GTX 1650 Mobile:
61 109 [X] MSI GP75 Leopard 9SC Intel Core i7-9750H 2.6GHz
GeForce GTX 1650 Mobile
min:
48.1 fps, P0.1:
62.8 fps, P1:
80.6 fps, max:
334 fps
~ 85 fps
100%
GeForce GTX 1660 Ti Mobile:
82.7 [X] MSI GP65 Leopard 9SD Intel Core i7-9750H 2.6GHz
GeForce GTX 1660 Ti Mobile
min:
42.9 fps, P0.1:
49.5 fps, P1:
62.2 fps, max:
257 fps
fps
33%
GeForce GTX 1050 Ti Mobile:
27.5 [X] MSI GE72 7RE Intel Core i7-7700HQ 2.8GHz
GeForce GTX 1050 Ti Mobile
min:
20.5 fps, P0.1:
21.5 fps, P1:
22.4 fps, max:
43.6 fps
fps
56%
GeForce GTX 1650 Mobile:
45.9 46.3 [X] MSI GP75 Leopard 9SC Intel Core i7-9750H 2.6GHz
GeForce GTX 1650 Mobile
min:
32.1 fps, P0.1:
33.6 fps, P1:
37.2 fps, max:
80.3 fps
~ 46 fps
100%
GeForce GTX 1660 Ti Mobile:
67.7 [X] MSI GP65 Leopard 9SD Intel Core i7-9750H 2.6GHz
GeForce GTX 1660 Ti Mobile
min:
24.3 fps, P0.1:
44.4 fps, P1:
51.6 fps, max:
224 fps
fps
33%
GeForce GTX 1050 Ti Mobile:
22.4 [X] MSI GE72 7RE Intel Core i7-7700HQ 2.8GHz
GeForce GTX 1050 Ti Mobile
min:
17.3 fps, P0.1:
17.4 fps, P1:
18.1 fps, max:
31.4 fps
fps
47%
GeForce GTX 1650 Mobile:
25.4 37.6 [X] MSI GP75 Leopard 9SC Intel Core i7-9750H 2.6GHz
GeForce GTX 1650 Mobile
min:
27.2 fps, P0.1:
29.1 fps, P1:
30.2 fps, max:
66.1 fps
~ 32 fps
100%
GeForce GTX 1660 Ti Mobile:
60.3 [X] MSI GP65 Leopard 9SD Intel Core i7-9750H 2.6GHz
GeForce GTX 1660 Ti Mobile
min:
30.4 fps, P0.1:
41 fps, P1:
47.2 fps, max:
183 fps
fps
30%
GeForce GTX 1050 Ti Mobile:
18 [X] MSI GE72 7RE Intel Core i7-7700HQ 2.8GHz
GeForce GTX 1050 Ti Mobile
min:
11.5 fps, P0.1:
11.9 fps, P1:
12.9 fps, max:
27.2 fps
fps
41%
GeForce GTX 1650 Mobile:
19.7 31 [X] MSI GP75 Leopard 9SC Intel Core i7-9750H 2.6GHz
GeForce GTX 1650 Mobile
min:
23 fps, P0.1:
23.7 fps, P1:
24.8 fps, max:
48.4 fps
~ 25 fps
100%
GeForce GTX 1660 Ti Mobile:
39.6 [X] MSI GP65 Leopard 9SD Intel Core i7-9750H 2.6GHz
GeForce GTX 1660 Ti Mobile
min:
25.7 fps, P0.1:
29.2 fps, P1:
31 fps, max:
86.2 fps
fps
53%
GeForce GTX 1650 Mobile:
20.8 [X] MSI GP75 Leopard 9SC Intel Core i7-9750H 2.6GHz
GeForce GTX 1650 Mobile
min:
16 fps, P0.1:
16.1 fps, P1:
17 fps, max:
29.3 fps
fps
100%
GeForce GTX 1660 Ti Mobile:
19.8 [X] MSI GP65 Leopard 9SD Intel Core i7-9750H 2.6GHz
GeForce GTX 1660 Ti Mobile
min:
14.9 fps, P0.1:
14.9 fps, P1:
15.5 fps, max:
24.3 fps
fps
49%
GeForce GTX 1650 Mobile:
9.6 [X] MSI GP75 Leopard 9SC Intel Core i7-9750H 2.6GHz
GeForce GTX 1650 Mobile
min:
7.82 fps, P0.1:
7.88 fps, P1:
8.17 fps, max:
12.3 fps
fps
GeForce GTX 1050 Ti Mobile:
33 [X] MSI GE72 7RE Intel Core i7-7700HQ 2.8GHz
GeForce GTX 1050 Ti Mobile
P0.1:
5 fpsP1:
fps
fps
GeForce GTX 1650 Mobile:
64 68 ~ 66 fps
100%
GeForce GTX 1660 Ti Mobile:
66 [X] MSI GP65 Leopard 9SD Intel Core i7-9750H 2.6GHz
GeForce GTX 1660 Ti Mobile
P0.1:
32 fpsP1:
fps
fps
29%
GeForce GTX 1050 Ti Mobile:
19 [X] MSI GE72 7RE Intel Core i7-7700HQ 2.8GHz
GeForce GTX 1050 Ti Mobile
P0.1:
11 fpsP1:
fps
fps
64%
GeForce GTX 1650 Mobile:
41 42 ~ 42 fps
100%
GeForce GTX 1660 Ti Mobile:
49 [X] MSI GP65 Leopard 9SD Intel Core i7-9750H 2.6GHz
GeForce GTX 1660 Ti Mobile
P0.1:
7 fpsP1:
fps
fps
31%
GeForce GTX 1050 Ti Mobile:
15 [X] MSI GE72 7RE Intel Core i7-7700HQ 2.8GHz
GeForce GTX 1050 Ti Mobile
P0.1:
8 fpsP1:
fps
fps
49%
GeForce GTX 1650 Mobile:
21 27 ~ 24 fps
100%
GeForce GTX 1660 Ti Mobile:
42 [X] MSI GP65 Leopard 9SD Intel Core i7-9750H 2.6GHz
GeForce GTX 1660 Ti Mobile
P0.1:
24 fpsP1:
fps
fps
31%
GeForce GTX 1050 Ti Mobile:
13 [X] MSI GE72 7RE Intel Core i7-7700HQ 2.8GHz
GeForce GTX 1050 Ti Mobile
P0.1:
9 fpsP1:
fps
fps
19%
GeForce GTX 1650 Mobile:
5 10 ~ 8 fps
100%
GeForce GTX 1660 Ti Mobile:
32 [X] MSI GP65 Leopard 9SD Intel Core i7-9750H 2.6GHz
GeForce GTX 1660 Ti Mobile
P0.1:
13 fpsP1:
fps
fps
100%
GeForce GTX 1660 Ti Mobile:
13 [X] MSI GP65 Leopard 9SD Intel Core i7-9750H 2.6GHz
GeForce GTX 1660 Ti Mobile
P0.1:
9 fpsP1:
fps
fps
GeForce GTX 1050 Ti Mobile:
68.5 [X] MSI GE72 7RE Intel Core i7-7700HQ 2.8GHz
GeForce GTX 1050 Ti Mobile
min:
43.6 fps, P0.1:
48.5 fps, P1:
58.4 fps, max:
101.5 fps
fps
GeForce GTX 1650 Mobile:
90.7 92.5 [X] MSI GP75 Leopard 9SC Intel Core i7-9750H 2.6GHz
GeForce GTX 1650 Mobile
min:
59.1 fps, P0.1:
62.4 fps, P1:
75.9 fps, max:
122 fps
95.4 ~ 93 fps
100%
GeForce GTX 1660 Ti Mobile:
74.5 [X] MSI GP65 Leopard 9SD Intel Core i7-9750H 2.6GHz
GeForce GTX 1660 Ti Mobile
min:
41.6 fps, P0.1:
60.1 fps, P1:
63.6 fps, max:
129 fps
fps
37%
GeForce GTX 1050 Ti Mobile:
27.2 [X] MSI GE72 7RE Intel Core i7-7700HQ 2.8GHz
GeForce GTX 1050 Ti Mobile
min:
16 fps, P0.1:
17.2 fps, P1:
23.4 fps, max:
32.2 fps
fps
62%
GeForce GTX 1650 Mobile:
44.4 [X] MSI GP75 Leopard 9SC Intel Core i7-9750H 2.6GHz
GeForce GTX 1650 Mobile
min:
24.9 fps, P0.1:
27.6 fps, P1:
36.5 fps, max:
131.4 fps
46.6 46.8 ~ 46 fps
100%
GeForce GTX 1660 Ti Mobile:
56.4 [X] MSI GP65 Leopard 9SD Intel Core i7-9750H 2.6GHz
GeForce GTX 1660 Ti Mobile
min:
27.4 fps, P0.1:
42.7 fps, P1:
46.8 fps, max:
73.9 fps
fps
34%
GeForce GTX 1050 Ti Mobile:
19.1 [X] MSI GE72 7RE Intel Core i7-7700HQ 2.8GHz
GeForce GTX 1050 Ti Mobile
min:
13.3 fps, P0.1:
13.5 fps, P1:
14.2 fps, max:
23.1 fps
fps
64%
GeForce GTX 1650 Mobile:
35.4 [X] MSI GP75 Leopard 9SC Intel Core i7-9750H 2.6GHz
GeForce GTX 1650 Mobile
min:
25.1 fps, P0.1:
27 fps, P1:
30.2 fps, max:
44 fps
36.3 36.3 ~ 36 fps
100%
GeForce GTX 1660 Ti Mobile:
32.5 [X] MSI GP65 Leopard 9SD Intel Core i7-9750H 2.6GHz
GeForce GTX 1660 Ti Mobile
min:
24.7 fps, P0.1:
25.3 fps, P1:
26.6 fps, max:
44.4 fps
fps
19%
GeForce GTX 1050 Ti Mobile:
6.2 [X] MSI GE72 7RE Intel Core i7-7700HQ 2.8GHz
GeForce GTX 1050 Ti Mobile
min:
3 fps, P0.1:
3.1 fps, P1:
3.2 fps, max:
9.6 fps
fps
71%
GeForce GTX 1650 Mobile:
16.6 [X] MSI GP75 Leopard 9SC Intel Core i7-9750H 2.6GHz
GeForce GTX 1650 Mobile
min:
12 fps, P0.1:
12.5 fps, P1:
13.1 fps, max:
21.9 fps
22.2 29.4 ~ 23 fps
100%
GeForce GTX 1660 Ti Mobile:
28 [X] MSI GP65 Leopard 9SD Intel Core i7-9750H 2.6GHz
GeForce GTX 1660 Ti Mobile
min:
19.5 fps, P0.1:
22 fps, P1:
23.5 fps, max:
34.9 fps
fps
49%
GeForce GTX 1650 Mobile:
13.8 [X] MSI GP75 Leopard 9SC Intel Core i7-9750H 2.6GHz
GeForce GTX 1650 Mobile
min:
4.6 fps, P0.1:
10.5 fps, P1:
11.3 fps, max:
90.2 fps
fps
100%
GeForce GTX 1660 Ti Mobile:
20.4 [X] MSI GP65 Leopard 9SD Intel Core i7-9750H 2.6GHz
GeForce GTX 1660 Ti Mobile
min:
12.8 fps, P0.1:
15.2 fps, P1:
17.4 fps, max:
24 fps
fps
GeForce GTX 1050 Ti Mobile:
55.8 [X] MSI GE72 7RE Intel Core i7-7700HQ 2.8GHz
GeForce GTX 1050 Ti Mobile
min:
29.45 fps, P1:
40.63 fps, max:
93.46 fps
fps
GeForce GTX 1650 Mobile:
54 80.4 91.2 [X] MSI GP75 Leopard 9SC Intel Core i7-9750H 2.6GHz
GeForce GTX 1650 Mobile
min:
36.42 fps, P1:
64.22 fps, max:
140.12 fps
~ 75 fps
100%
GeForce GTX 1660 Ti Mobile:
81.5 [X] MSI GP65 Leopard 9SD Intel Core i7-9750H 2.6GHz
GeForce GTX 1660 Ti Mobile
min:
35.98 fps, P1:
59.37 fps, max:
126.86 fps
fps
40%
GeForce GTX 1050 Ti Mobile:
32.2 [X] MSI GE72 7RE Intel Core i7-7700HQ 2.8GHz
GeForce GTX 1050 Ti Mobile
min:
20.75 fps, P1:
25.03 fps, max:
51.45 fps
fps
61%
GeForce GTX 1650 Mobile:
47 48 53.8 [X] MSI GP75 Leopard 9SC Intel Core i7-9750H 2.6GHz
GeForce GTX 1650 Mobile
min:
26.13 fps, P1:
39.24 fps, max:
112.04 fps
~ 50 fps
100%
GeForce GTX 1660 Ti Mobile:
70.9 [X] MSI GP65 Leopard 9SD Intel Core i7-9750H 2.6GHz
GeForce GTX 1660 Ti Mobile
min:
34.22 fps, P1:
53.45 fps, max:
102.77 fps
fps
38%
GeForce GTX 1050 Ti Mobile:
27 [X] MSI GE72 7RE Intel Core i7-7700HQ 2.8GHz
GeForce GTX 1050 Ti Mobile
min:
19.18 fps, P1:
20.9 fps, max:
37.79 fps
fps
59%
GeForce GTX 1650 Mobile:
39 41.6 45.3 [X] MSI GP75 Leopard 9SC Intel Core i7-9750H 2.6GHz
GeForce GTX 1650 Mobile
min:
20.4 fps, P1:
34.72 fps, max:
82.35 fps
~ 42 fps
100%
GeForce GTX 1660 Ti Mobile:
33.1 [X] MSI GP65 Leopard 9SD Intel Core i7-9750H 2.6GHz
GeForce GTX 1660 Ti Mobile
min:
16.78 fps, P1:
21.15 fps, max:
70.99 fps
fps
45%
GeForce GTX 1050 Ti Mobile:
14.8 [X] MSI GE72 7RE Intel Core i7-7700HQ 2.8GHz
GeForce GTX 1050 Ti Mobile
min:
11.22 fps, P1:
11.97 fps, max:
19.95 fps
fps
48%
GeForce GTX 1650 Mobile:
14 17.4 [X] MSI GP75 Leopard 9SC Intel Core i7-9750H 2.6GHz
GeForce GTX 1650 Mobile
min:
2.15 fps, P1:
6.93 fps, max:
86.34 fps
18 ~ 16 fps
100%
GeForce GTX 1660 Ti Mobile:
23.2 [X] MSI GP65 Leopard 9SD Intel Core i7-9750H 2.6GHz
GeForce GTX 1660 Ti Mobile
min:
12.77 fps, P1:
14.75 fps, max:
34.15 fps
fps
53%
GeForce GTX 1650 Mobile:
12.3 [X] MSI GP75 Leopard 9SC Intel Core i7-9750H 2.6GHz
GeForce GTX 1650 Mobile
min:
1.29 fps, P1:
3.91 fps, max:
80.23 fps
fps
100%
GeForce GTX 1660 Ti Mobile:
13 [X] MSI GP65 Leopard 9SD Intel Core i7-9750H 2.6GHz
GeForce GTX 1660 Ti Mobile
min:
6.8 fps, P1:
8.59 fps, max:
57.97 fps
fps
100%
GeForce GTX 1660 Ti Mobile:
227 [X] MSI GP65 Leopard 9SD 1.5.4.5
Intel Core i7-9750H 2.6GHz
GeForce GTX 1660 Ti Mobile
min:
7.88 fps, P1:
171 fps, max:
304 fps
fps
76%
GeForce GTX 1050 Ti Mobile:
173 [X] MSI GE72 7RE 1.5.4.5
Intel Core i7-7700HQ 2.8GHz
GeForce GTX 1050 Ti Mobile
min:
92.8 fps, P1:
123 fps, max:
248 fps
fps
80%
GeForce GTX 1650 Mobile:
153.2 211 [X] MSI GP75 Leopard 9SC Intel Core i7-9750H 2.6GHz
GeForce GTX 1650 Mobile
min:
14 fps, P1:
152 fps, max:
278 fps
~ 182 fps
100%
GeForce GTX 1660 Ti Mobile:
225 [X] MSI GP65 Leopard 9SD 1.5.4.5
Intel Core i7-9750H 2.6GHz
GeForce GTX 1660 Ti Mobile
min:
14.6 fps, P1:
168 fps, max:
301 fps
fps
66%
GeForce GTX 1050 Ti Mobile:
149 [X] MSI GE72 7RE 1.5.4.5
Intel Core i7-7700HQ 2.8GHz
GeForce GTX 1050 Ti Mobile
min:
77 fps, P1:
94.3 fps, max:
237 fps
fps
65%
GeForce GTX 1650 Mobile:
125.8 167 [X] MSI GP75 Leopard 9SC Intel Core i7-9750H 2.6GHz
GeForce GTX 1650 Mobile
min:
18.3 fps, P1:
109 fps, max:
290 fps
~ 146 fps
100%
GeForce GTX 1660 Ti Mobile:
214 [X] MSI GP65 Leopard 9SD 1.5.4.5
Intel Core i7-9750H 2.6GHz
GeForce GTX 1660 Ti Mobile
min:
67.7 fps, P1:
159 fps, max:
289 fps
fps
66%
GeForce GTX 1050 Ti Mobile:
142 [X] MSI GE72 7RE 1.5.4.5
Intel Core i7-7700HQ 2.8GHz
GeForce GTX 1050 Ti Mobile
min:
57 fps, P1:
89 fps, max:
220 fps
fps
66%
GeForce GTX 1650 Mobile:
120.4 161 [X] MSI GP75 Leopard 9SC Intel Core i7-9750H 2.6GHz
GeForce GTX 1650 Mobile
min:
92 fps, P1:
107 fps, max:
270 fps
~ 141 fps
100%
GeForce GTX 1660 Ti Mobile:
209 [X] MSI GP65 Leopard 9SD 1.5.4.5
Intel Core i7-9750H 2.6GHz
GeForce GTX 1660 Ti Mobile
min:
15.7 fps, P1:
157 fps, max:
280 fps
fps
61%
GeForce GTX 1050 Ti Mobile:
127 [X] MSI GE72 7RE 1.5.4.5
Intel Core i7-7700HQ 2.8GHz
GeForce GTX 1050 Ti Mobile
min:
38 fps, P1:
82.5 fps, max:
219 fps
fps
63%
GeForce GTX 1650 Mobile:
113.1 149 [X] MSI GP75 Leopard 9SC Intel Core i7-9750H 2.6GHz
GeForce GTX 1650 Mobile
min:
71.3 fps, P1:
99.9 fps, max:
256 fps
~ 131 fps
100%
GeForce GTX 1660 Ti Mobile:
203 [X] MSI GP65 Leopard 9SD 1.5.4.5
Intel Core i7-9750H 2.6GHz
GeForce GTX 1660 Ti Mobile
min:
21.7 fps, P1:
150 fps, max:
274 fps
fps
49%
GeForce GTX 1050 Ti Mobile:
99.9 [X] MSI GE72 7RE 1.5.4.5
Intel Core i7-7700HQ 2.8GHz
GeForce GTX 1050 Ti Mobile
min:
40.8 fps, P1:
71.6 fps, max:
194 fps
fps
57%
GeForce GTX 1650 Mobile:
115 [X] MSI GP75 Leopard 9SC Intel Core i7-9750H 2.6GHz
GeForce GTX 1650 Mobile
min:
15.6 fps, P1:
76.9 fps, max:
231 fps
fps
100%
GeForce GTX 1660 Ti Mobile:
136 [X] MSI GP65 Leopard 9SD 1.5.4.5
Intel Core i7-9750H 2.6GHz
GeForce GTX 1660 Ti Mobile
min:
60.7 fps, P1:
110 fps, max:
229 fps
fps
43%
GeForce GTX 1050 Ti Mobile:
58.8 [X] MSI GE72 7RE 1.5.4.5
Intel Core i7-7700HQ 2.8GHz
GeForce GTX 1050 Ti Mobile
min:
21.5 fps, P1:
43.6 fps, max:
177 fps
fps
57%
GeForce GTX 1650 Mobile:
77.2 [X] MSI GP75 Leopard 9SC Intel Core i7-9750H 2.6GHz
GeForce GTX 1650 Mobile
min:
30.7 fps, P1:
36.8 fps, max:
261 fps
fps
100%
GeForce GTX 1660 Ti Mobile:
237 [X] MSI GP65 Leopard 9SD 1.5.4.5
Intel Core i7-9750H 2.6GHz
GeForce GTX 1660 Ti Mobile
min:
42 fps, P1:
155 fps, max:
349 fps
fps
83%
GeForce GTX 1050 Ti Mobile:
196 [X] MSI GE72 7RE 1.5.4.5
Intel Core i7-7700HQ 2.8GHz
GeForce GTX 1050 Ti Mobile
min:
31.7 fps, P1:
134 fps, max:
285 fps
fps
61%
GeForce GTX 1650 Mobile:
108 179.1 ~ 144 fps
100%
GeForce GTX 1660 Ti Mobile:
219 [X] MSI GP65 Leopard 9SD 1.5.4.5
Intel Core i7-9750H 2.6GHz
GeForce GTX 1660 Ti Mobile
min:
68.1 fps, P1:
164 fps, max:
365 fps
fps
47%
GeForce GTX 1050 Ti Mobile:
102 [X] MSI GE72 7RE 1.5.4.5
Intel Core i7-7700HQ 2.8GHz
GeForce GTX 1050 Ti Mobile
min:
58.6 fps, P1:
80.6 fps, max:
236 fps
fps
49%
GeForce GTX 1650 Mobile:
93 122.6 ~ 108 fps
100%
GeForce GTX 1660 Ti Mobile:
159 185 [X] MSI GP65 Leopard 9SD 1.5.4.5
Intel Core i7-9750H 2.6GHz
GeForce GTX 1660 Ti Mobile
min:
81.1 fps, P1:
147 fps, max:
313 fps
~ 172 fps
50%
GeForce GTX 1050 Ti Mobile:
85.3 [X] MSI GE72 7RE 1.5.4.5
Intel Core i7-7700HQ 2.8GHz
GeForce GTX 1050 Ti Mobile
min:
49.7 fps, P1:
68.4 fps, max:
231 fps
fps
58%
GeForce GTX 1650 Mobile:
89 108.7 ~ 99 fps
100%
GeForce GTX 1660 Ti Mobile:
156 168 [X] MSI GP65 Leopard 9SD 1.5.4.5
Intel Core i7-9750H 2.6GHz
GeForce GTX 1660 Ti Mobile
min:
106 fps, P1:
134 fps, max:
262 fps
~ 162 fps
38%
GeForce GTX 1050 Ti Mobile:
60.8 [X] MSI GE72 7RE 1.5.4.5
Intel Core i7-7700HQ 2.8GHz
GeForce GTX 1050 Ti Mobile
min:
31.5 fps, P1:
50 fps, max:
218 fps
fps
56%
GeForce GTX 1650 Mobile:
80.8 100 ~ 90 fps
100%
GeForce GTX 1660 Ti Mobile:
107 [X] MSI GP65 Leopard 9SD 1.5.4.5
Intel Core i7-9750H 2.6GHz
GeForce GTX 1660 Ti Mobile
min:
73.1 fps, P1:
83.5 fps, max:
152 fps
fps
37%
GeForce GTX 1050 Ti Mobile:
40 [X] MSI GE72 7RE 1.5.4.5
Intel Core i7-7700HQ 2.8GHz
GeForce GTX 1050 Ti Mobile
min:
26.6 fps, P1:
32.1 fps, max:
117 fps
fps
100%
GeForce GTX 1660 Ti Mobile:
59.1 [X] MSI GP65 Leopard 9SD 1.5.4.5
Intel Core i7-9750H 2.6GHz
GeForce GTX 1660 Ti Mobile
min:
48.1 fps, P1:
51.4 fps, max:
72.4 fps
fps
30%
GeForce GTX 1050 Ti Mobile:
17.9 [X] MSI GE72 7RE 1.5.4.5
Intel Core i7-7700HQ 2.8GHz
GeForce GTX 1050 Ti Mobile
min:
7.47 fps, P1:
14.6 fps, max:
21.2 fps
fps
100%
GeForce GTX 1660 Ti Mobile:
119 [X] MSI GP65 Leopard 9SD 1.5.4.5
Intel Core i7-9750H 2.6GHz
GeForce GTX 1660 Ti Mobile
min:
50.1 fps, P1:
80 fps, max:
237 fps
fps
65%
GeForce GTX 1050 Ti Mobile:
76.8 [X] MSI GE72 7RE 1.5.4.5
Intel Core i7-7700HQ 2.8GHz
GeForce GTX 1050 Ti Mobile
min:
37.2 fps, P1:
50.3 fps, max:
154 fps
fps
71%
GeForce GTX 1650 Mobile:
66.2 103 [X] MSI GP75 Leopard 9SC 1.5.4.5
Intel Core i7-9750H 2.6GHz
GeForce GTX 1650 Mobile
min:
53.3 fps, P1:
71.5 fps, max:
180 fps
~ 85 fps
100%
GeForce GTX 1660 Ti Mobile:
77 [X] MSI GP65 Leopard 9SD 1.5.4.5
Intel Core i7-9750H 2.6GHz
GeForce GTX 1660 Ti Mobile
min:
43.6 fps, P1:
53.9 fps, max:
176 fps
fps
47%
GeForce GTX 1050 Ti Mobile:
36 [X] MSI GE72 7RE 1.5.4.5
Intel Core i7-7700HQ 2.8GHz
GeForce GTX 1050 Ti Mobile
min:
26.3 fps, P1:
29.8 fps, max:
66.5 fps
fps
61%
GeForce GTX 1650 Mobile:
46.1 [X] MSI GP75 Leopard 9SC 1.5.4.5
Intel Core i7-9750H 2.6GHz
GeForce GTX 1650 Mobile
min:
27.2 fps, P1:
36.3 fps, max:
95.8 fps
47.1 ~ 47 fps
100%
GeForce GTX 1660 Ti Mobile:
66.8 70 [X] MSI GP65 Leopard 9SD 1.5.4.5
Intel Core i7-9750H 2.6GHz
GeForce GTX 1660 Ti Mobile
min:
40.5 fps, P1:
52 fps, max:
145 fps
~ 68 fps
49%
GeForce GTX 1050 Ti Mobile:
33 [X] MSI GE72 7RE 1.5.4.5
Intel Core i7-7700HQ 2.8GHz
GeForce GTX 1050 Ti Mobile
min:
23.9 fps, P1:
26.9 fps, max:
58.7 fps
fps
65%
GeForce GTX 1650 Mobile:
43.3 44.9 [X] MSI GP75 Leopard 9SC 1.5.4.5
Intel Core i7-9750H 2.6GHz
GeForce GTX 1650 Mobile
min:
17.4 fps, P1:
38.3 fps, max:
120 fps
~ 44 fps
100%
GeForce GTX 1660 Ti Mobile:
46.6 [X] MSI GP65 Leopard 9SD 1.5.4.5
Intel Core i7-9750H 2.6GHz
GeForce GTX 1660 Ti Mobile
min:
31 fps, P1:
38.1 fps, max:
97.1 fps
fps
46%
GeForce GTX 1050 Ti Mobile:
21.4 [X] MSI GE72 7RE 1.5.4.5
Intel Core i7-7700HQ 2.8GHz
GeForce GTX 1050 Ti Mobile
min:
13.4 fps, P1:
17.6 fps, max:
58.9 fps
fps
62%
GeForce GTX 1650 Mobile:
29 [X] MSI GP75 Leopard 9SC 1.5.4.5
Intel Core i7-9750H 2.6GHz
GeForce GTX 1650 Mobile
min:
22.2 fps, P1:
25.8 fps, max:
37.3 fps
fps
100%
GeForce GTX 1660 Ti Mobile:
23.7 [X] MSI GP65 Leopard 9SD 1.5.4.5
Intel Core i7-9750H 2.6GHz
GeForce GTX 1660 Ti Mobile
min:
19.7 fps, P1:
21.3 fps, max:
28 fps
fps
29%
GeForce GTX 1050 Ti Mobile:
7 [X] MSI GE72 7RE 1.5.4.5
Intel Core i7-7700HQ 2.8GHz
GeForce GTX 1050 Ti Mobile
min:
6.01 fps, P1:
6.22 fps, max:
8.15 fps
fps
62%
GeForce GTX 1650 Mobile:
14.6 [X] MSI GP75 Leopard 9SC 1.5.4.5
Intel Core i7-9750H 2.6GHz
GeForce GTX 1650 Mobile
min:
13.2 fps, P1:
13.5 fps, max:
16.2 fps
fps
100%
GeForce GTX 1660 Ti Mobile:
103 [X] MSI GP65 Leopard 9SD Intel Core i7-9750H 2.6GHz
GeForce GTX 1660 Ti Mobile
min:
6.08 fps, P1:
56.4 fps, max:
204 fps
fps
115%
GeForce GTX 1050 Ti Mobile:
118 [X] MSI GE72 7RE Intel Core i7-7700HQ 2.8GHz
GeForce GTX 1050 Ti Mobile
min:
27.1 fps, P1:
76.2 fps, max:
233 fps
fps
104%
GeForce GTX 1650 Mobile:
99.3 115 [X] MSI GP75 Leopard 9SC Intel Core i7-9750H 2.6GHz
GeForce GTX 1650 Mobile
min:
10.4 fps, P1:
75.3 fps, max:
195 fps
~ 107 fps
100%
GeForce GTX 1660 Ti Mobile:
69 [X] MSI GP65 Leopard 9SD Intel Core i7-9750H 2.6GHz
GeForce GTX 1660 Ti Mobile
min:
2.36 fps, P1:
30.3 fps, max:
135 fps
fps
46%
GeForce GTX 1050 Ti Mobile:
31.4 [X] MSI GE72 7RE Intel Core i7-7700HQ 2.8GHz
GeForce GTX 1050 Ti Mobile
min:
9.01 fps, P1:
21.8 fps, max:
81.2 fps
fps
75%
GeForce GTX 1650 Mobile:
48.4 56.1 [X] MSI GP75 Leopard 9SC Intel Core i7-9750H 2.6GHz
GeForce GTX 1650 Mobile
min:
9.2 fps, P1:
38.6 fps, max:
118 fps
~ 52 fps
100%
GeForce GTX 1660 Ti Mobile:
67.1 68.3 [X] MSI GP65 Leopard 9SD Intel Core i7-9750H 2.6GHz
GeForce GTX 1660 Ti Mobile
min:
12.2 fps, P1:
39.6 fps, max:
115 fps
~ 68 fps
33%
GeForce GTX 1050 Ti Mobile:
22.2 [X] MSI GE72 7RE Intel Core i7-7700HQ 2.8GHz
GeForce GTX 1050 Ti Mobile
min:
1.078 fps, P1:
6.04 fps, max:
96.5 fps
fps
63%
GeForce GTX 1650 Mobile:
40.6 45.1 [X] MSI GP75 Leopard 9SC Intel Core i7-9750H 2.6GHz
GeForce GTX 1650 Mobile
min:
13.7 fps, P1:
24.6 fps, max:
92.9 fps
~ 43 fps
100%
GeForce GTX 1660 Ti Mobile:
51.5 [X] MSI GP65 Leopard 9SD Intel Core i7-9750H 2.6GHz
GeForce GTX 1660 Ti Mobile
min:
2.47 fps, P1:
22.7 fps, max:
94.3 fps
52.3 ~ 52 fps
19%
GeForce GTX 1050 Ti Mobile:
9.7 [X] MSI GE72 7RE Intel Core i7-7700HQ 2.8GHz
GeForce GTX 1050 Ti Mobile
min:
0.726 fps, P1:
2.34 fps, max:
66.8 fps
fps
50%
GeForce GTX 1650 Mobile:
24.4 [X] MSI GP75 Leopard 9SC Intel Core i7-9750H 2.6GHz
GeForce GTX 1650 Mobile
min:
0.824 fps, P1:
6.85 fps, max:
110 fps
27.8 ~ 26 fps
100%
GeForce GTX 1660 Ti Mobile:
39.6 [X] MSI GP65 Leopard 9SD Intel Core i7-9750H 2.6GHz
GeForce GTX 1660 Ti Mobile
min:
11.4 fps, P1:
24.1 fps, max:
84.2 fps
fps
21%
GeForce GTX 1050 Ti Mobile:
8.3 [X] MSI GE72 7RE Intel Core i7-7700HQ 2.8GHz
GeForce GTX 1050 Ti Mobile
min:
1.025 fps, P1:
2.83 fps, max:
64.1 fps
fps
55%
GeForce GTX 1650 Mobile:
21.7 [X] MSI GP75 Leopard 9SC Intel Core i7-9750H 2.6GHz
GeForce GTX 1650 Mobile
min:
1.313 fps, P1:
10.4 fps, max:
83.8 fps
fps
GeForce GTX 1650 Mobile:
110 fps
100%
GeForce GTX 1660 Ti Mobile:
99.5 [X] MSI GP65 Leopard 9SD Intel Core i7-9750H 2.6GHz
GeForce GTX 1660 Ti Mobile
min:
22.3 fps, P0.1:
22.7 fps, P1:
24.8 fps, max:
309 fps
fps
60%
GeForce GTX 1650 Mobile:
58 62.8 [X] MSI GL75 Intel Core i7-10750H 2.6GHz
GeForce GTX 1650 Mobile
min:
13.7 fps, P0.1:
14.3 fps, P1:
15.8 fps, max:
295 fps
~ 60 fps
100%
GeForce GTX 1660 Ti Mobile:
55.1 [X] MSI GP65 Leopard 9SD Intel Core i7-9750H 2.6GHz
GeForce GTX 1660 Ti Mobile
min:
17.3 fps, P0.1:
34.8 fps, P1:
40.9 fps, max:
140 fps
fps
60%
GeForce GTX 1650 Mobile:
31.1 35.1 [X] MSI GL75 Intel Core i7-10750H 2.6GHz
GeForce GTX 1650 Mobile
min:
24.2 fps, P0.1:
26 fps, P1:
28.4 fps, max:
64.6 fps
~ 33 fps
100%
GeForce GTX 1660 Ti Mobile:
41.7 [X] MSI GP65 Leopard 9SD Intel Core i7-9750H 2.6GHz
GeForce GTX 1660 Ti Mobile
min:
28.8 fps, P0.1:
32.2 fps, P1:
33.9 fps, max:
67 fps
fps
60%
GeForce GTX 1650 Mobile:
23.3 25.9 [X] MSI GL75 Intel Core i7-10750H 2.6GHz
GeForce GTX 1650 Mobile
min:
11.4 fps, P0.1:
14.3 fps, P1:
21.1 fps, max:
71.4 fps
~ 25 fps
100%
GeForce GTX 1660 Ti Mobile:
22.5 [X] MSI GP65 Leopard 9SD Intel Core i7-9750H 2.6GHz
GeForce GTX 1660 Ti Mobile
min:
18.1 fps, P0.1:
18.3 fps, P1:
19.1 fps, max:
29.7 fps
fps
82%
GeForce GTX 1650 Mobile:
18.4 [X] MSI GL75 Intel Core i7-10750H 2.6GHz
GeForce GTX 1650 Mobile
min:
5.87 fps, P0.1:
7.41 fps, P1:
15.2 fps, max:
23.2 fps
fps
100%
GeForce GTX 1660 Ti Mobile:
13.4 [X] MSI GP65 Leopard 9SD Intel Core i7-9750H 2.6GHz
GeForce GTX 1660 Ti Mobile
min:
6.47 fps, P0.1:
7.01 fps, P1:
10.6 fps, max:
18.1 fps
fps
75%
GeForce GTX 1650 Mobile:
10.1 [X] MSI GL75 Intel Core i7-10750H 2.6GHz
GeForce GTX 1650 Mobile
min:
8.05 fps, P0.1:
8.14 fps, P1:
8.4 fps, max:
12.6 fps
fps
100%
GeForce GTX 1660 Ti Mobile:
72.7 [X] MSI GP65 Leopard 9SD 1.5.4.5
Intel Core i7-9750H 2.6GHz
GeForce GTX 1660 Ti Mobile
min:
6.72 fps, P1:
47.834 fps, max:
97.1 fps
fps
62%
GeForce GTX 1050 Ti Mobile:
44.8 [X] MSI GE72 7RE 1.5.4.5
Intel Core i7-7700HQ 2.8GHz
GeForce GTX 1050 Ti Mobile
min:
6.14 fps, P1:
33.436 fps, max:
57.8 fps
fps
76%
GeForce GTX 1650 Mobile:
50.4 59 [X] MSI GP75 Leopard 9SC 1.5.4.5
Intel Core i7-9750H 2.6GHz
GeForce GTX 1650 Mobile
min:
5.56 fps, P1:
40.93 fps, max:
69.9 fps
~ 55 fps
100%
GeForce GTX 1660 Ti Mobile:
56.9 [X] MSI GP65 Leopard 9SD 1.5.4.5
Intel Core i7-9750H 2.6GHz
GeForce GTX 1660 Ti Mobile
min:
6.31 fps, P1:
41.2 fps, max:
74.9 fps
fps
46%
GeForce GTX 1050 Ti Mobile:
26.2 [X] MSI GE72 7RE 1.5.4.5
Intel Core i7-7700HQ 2.8GHz
GeForce GTX 1050 Ti Mobile
min:
8.94 fps, P1:
18.3 fps, max:
41.8 fps
fps
67%
GeForce GTX 1650 Mobile:
35.9 39.1 [X] MSI GP75 Leopard 9SC 1.5.4.5
Intel Core i7-9750H 2.6GHz
GeForce GTX 1650 Mobile
min:
7.48 fps, P1:
30.503 fps, max:
64.4 fps
~ 38 fps
100%
GeForce GTX 1660 Ti Mobile:
39.4 41.3 [X] MSI GP65 Leopard 9SD 1.5.4.5
Intel Core i7-9750H 2.6GHz
GeForce GTX 1660 Ti Mobile
min:
7.43 fps, P1:
32.4 fps, max:
57.9 fps
~ 40 fps
43%
GeForce GTX 1050 Ti Mobile:
17.3 [X] MSI GE72 7RE 1.5.4.5
Intel Core i7-7700HQ 2.8GHz
GeForce GTX 1050 Ti Mobile
min:
8.28 fps, P1:
12.122 fps, max:
31.2 fps
fps
68%
GeForce GTX 1650 Mobile:
25.5 27.6 [X] MSI GP75 Leopard 9SC 1.5.4.5
Intel Core i7-9750H 2.6GHz
GeForce GTX 1650 Mobile
min:
10.2 fps, P1:
22.43 fps, max:
50.5 fps
~ 27 fps
100%
GeForce GTX 1660 Ti Mobile:
26.8 28.2 [X] MSI GP65 Leopard 9SD 1.5.4.5
Intel Core i7-9750H 2.6GHz
GeForce GTX 1660 Ti Mobile
min:
10.7 fps, P1:
22.251 fps, max:
44.8 fps
~ 28 fps
30%
GeForce GTX 1050 Ti Mobile:
8.4 [X] MSI GE72 7RE 1.5.4.5
Intel Core i7-7700HQ 2.8GHz
GeForce GTX 1050 Ti Mobile
min:
5.57 fps, P1:
5.831 fps, max:
19 fps
fps
64%
GeForce GTX 1650 Mobile:
17.5 17.7 [X] MSI GP75 Leopard 9SC 1.5.4.5
Intel Core i7-9750H 2.6GHz
GeForce GTX 1650 Mobile
min:
8.51 fps, P1:
12.446 fps, max:
39.5 fps
~ 18 fps
100%
GeForce GTX 1660 Ti Mobile:
20.6 [X] MSI GP65 Leopard 9SD 1.5.4.5
Intel Core i7-9750H 2.6GHz
GeForce GTX 1660 Ti Mobile
min:
13.8 fps, P1:
16.678 fps, max:
38.4 fps
fps
24%
GeForce GTX 1050 Ti Mobile:
5 [X] MSI GE72 7RE Intel Core i7-7700HQ 2.8GHz
GeForce GTX 1050 Ti Mobile
fps
64%
GeForce GTX 1650 Mobile:
13.2 [X] MSI GP75 Leopard 9SC 1.5.4.5
Intel Core i7-9750H 2.6GHz
GeForce GTX 1650 Mobile
min:
2.1 fps, P1:
8.598 fps, max:
41.2 fps
fps
100%
GeForce GTX 1660 Ti Mobile:
11.6 [X] MSI GP65 Leopard 9SD 1.5.4.5
Intel Core i7-9750H 2.6GHz
GeForce GTX 1660 Ti Mobile
min:
7.82 fps, P1:
9.45 fps, max:
25.7 fps
fps
15%
GeForce GTX 1050 Ti Mobile:
1.8 [X] MSI GE72 7RE 1.5.4.5
Intel Core i7-7700HQ 2.8GHz
GeForce GTX 1050 Ti Mobile
min:
1.538 fps, P1:
1.56076 fps, max:
2.16 fps
fps
43%
GeForce GTX 1650 Mobile:
5 [X] MSI GP75 Leopard 9SC 1.5.4.5
Intel Core i7-9750H 2.6GHz
GeForce GTX 1650 Mobile
min:
1.959 fps, P1:
2.2382 fps, max:
22.5 fps
fps
100%
GeForce GTX 1660 Ti Mobile:
125 [X] MSI GP65 Leopard 9SD Intel Core i7-9750H 2.6GHz
GeForce GTX 1660 Ti Mobile
min:
32 fps
fps
52%
GeForce GTX 1050 Ti Mobile:
65 [X] MSI GE72 7RE Intel Core i7-7700HQ 2.8GHz
GeForce GTX 1050 Ti Mobile
min:
1 fps
fps
70%
GeForce GTX 1650 Mobile:
81 [X] MSI GP75 Leopard 9SC Intel Core i7-9750H 2.6GHz
GeForce GTX 1650 Mobile
84 95 ~ 87 fps
100%
GeForce GTX 1660 Ti Mobile:
83 [X] MSI GP65 Leopard 9SD Intel Core i7-9750H 2.6GHz
GeForce GTX 1660 Ti Mobile
min:
30 fps
fps
46%
GeForce GTX 1050 Ti Mobile:
38 [X] MSI GE72 7RE Intel Core i7-7700HQ 2.8GHz
GeForce GTX 1050 Ti Mobile
min:
10 fps
fps
64%
GeForce GTX 1650 Mobile:
52 52 [X] Acer Nitro 5 AN517-41-R3FK AMD Ryzen 7 5800H 3.2GHz
GeForce GTX 1650 Mobile
54 [X] MSI GP75 Leopard 9SC Intel Core i7-9750H 2.6GHz
GeForce GTX 1650 Mobile
min:
3 fps
54 ~ 53 fps
100%
GeForce GTX 1660 Ti Mobile:
70 [X] MSI GP65 Leopard 9SD Intel Core i7-9750H 2.6GHz
GeForce GTX 1660 Ti Mobile
min:
22 fps
75 ~ 73 fps
42%
GeForce GTX 1050 Ti Mobile:
31 [X] MSI GE72 7RE Intel Core i7-7700HQ 2.8GHz
GeForce GTX 1050 Ti Mobile
min:
13 fps
fps
60%
GeForce GTX 1650 Mobile:
41 [X] Acer Nitro 5 AN517-41-R3FK AMD Ryzen 7 5800H 3.2GHz
GeForce GTX 1650 Mobile
44 45 46 [X] MSI GP75 Leopard 9SC Intel Core i7-9750H 2.6GHz
GeForce GTX 1650 Mobile
min:
18 fps
~ 44 fps
100%
GeForce GTX 1660 Ti Mobile:
55 [X] MSI GP65 Leopard 9SD Intel Core i7-9750H 2.6GHz
GeForce GTX 1660 Ti Mobile
min:
22 fps
58 ~ 57 fps
42%
GeForce GTX 1050 Ti Mobile:
24 [X] MSI GE72 7RE Intel Core i7-7700HQ 2.8GHz
GeForce GTX 1050 Ti Mobile
min:
9 fps
fps
61%
GeForce GTX 1650 Mobile:
34 [X] MSI GP75 Leopard 9SC Intel Core i7-9750H 2.6GHz
GeForce GTX 1650 Mobile
34 34 39 [X] Acer Nitro 5 AN517-41-R3FK AMD Ryzen 7 5800H 3.2GHz
GeForce GTX 1650 Mobile
~ 35 fps
100%
GeForce GTX 1660 Ti Mobile:
43 [X] MSI GP65 Leopard 9SD Intel Core i7-9750H 2.6GHz
GeForce GTX 1660 Ti Mobile
min:
10 fps
fps
40%
GeForce GTX 1050 Ti Mobile:
17 [X] MSI GE72 7RE Intel Core i7-7700HQ 2.8GHz
GeForce GTX 1050 Ti Mobile
min:
8 fps
fps
56%
GeForce GTX 1650 Mobile:
24 [X] MSI GP75 Leopard 9SC Intel Core i7-9750H 2.6GHz
GeForce GTX 1650 Mobile
min:
2 fps
fps
100%
GeForce GTX 1660 Ti Mobile:
23 [X] MSI GP65 Leopard 9SD Intel Core i7-9750H 2.6GHz
GeForce GTX 1660 Ti Mobile
min:
14 fps
fps
26%
GeForce GTX 1050 Ti Mobile:
6 [X] MSI GE72 7RE Intel Core i7-7700HQ 2.8GHz
GeForce GTX 1050 Ti Mobile
min:
2 fps
fps
65%
GeForce GTX 1650 Mobile:
15 [X] MSI GP75 Leopard 9SC Intel Core i7-9750H 2.6GHz
GeForce GTX 1650 Mobile
min:
4 fps
fps
100%
GeForce GTX 1660 Ti Mobile:
151 [X] MSI GP65 Leopard 9SD Intel Core i7-9750H 2.6GHz
GeForce GTX 1660 Ti Mobile
min:
108 fps
fps
49%
GeForce GTX 1050 Ti Mobile:
74.4 [X] MSI GE72 7RE Intel Core i7-7700HQ 2.8GHz
GeForce GTX 1050 Ti Mobile
min:
49 fps
fps
70%
GeForce GTX 1650 Mobile:
100.8 104.9 105.6 111 [X] MSI GP75 Leopard 9SC Intel Core i7-9750H 2.6GHz
GeForce GTX 1650 Mobile
min:
84 fps
~ 106 fps
100%
GeForce GTX 1660 Ti Mobile:
99.4 [X] MSI GP65 Leopard 9SD Intel Core i7-9750H 2.6GHz
GeForce GTX 1660 Ti Mobile
min:
78 fps
fps
39%
GeForce GTX 1050 Ti Mobile:
38.9 [X] MSI GE72 7RE Intel Core i7-7700HQ 2.8GHz
GeForce GTX 1050 Ti Mobile
min:
26 fps
fps
64%
GeForce GTX 1650 Mobile:
62.8 64 64.2 [X] MSI GP75 Leopard 9SC Intel Core i7-9750H 2.6GHz
GeForce GTX 1650 Mobile
min:
50 fps
64.2 ~ 64 fps
100%
GeForce GTX 1660 Ti Mobile:
88.3 92.1 [X] MSI GP65 Leopard 9SD Intel Core i7-9750H 2.6GHz
GeForce GTX 1660 Ti Mobile
min:
75 fps
~ 90 fps
40%
GeForce GTX 1050 Ti Mobile:
35.8 [X] MSI GE72 7RE Intel Core i7-7700HQ 2.8GHz
GeForce GTX 1050 Ti Mobile
min:
23 fps
fps
66%
GeForce GTX 1650 Mobile:
57.3 58.8 [X] MSI GP75 Leopard 9SC Intel Core i7-9750H 2.6GHz
GeForce GTX 1650 Mobile
min:
49 fps
59.5 60.4 ~ 59 fps
100%
GeForce GTX 1660 Ti Mobile:
85.5 89 [X] MSI GP65 Leopard 9SD Intel Core i7-9750H 2.6GHz
GeForce GTX 1660 Ti Mobile
min:
68 fps
~ 87 fps
40%
GeForce GTX 1050 Ti Mobile:
35.2 [X] MSI GE72 7RE Intel Core i7-7700HQ 2.8GHz
GeForce GTX 1050 Ti Mobile
min:
11 fps
fps
66%
GeForce GTX 1650 Mobile:
56.5 57.3 [X] MSI GP75 Leopard 9SC Intel Core i7-9750H 2.6GHz
GeForce GTX 1650 Mobile
min:
45 fps
57.6 57.8 ~ 57 fps
100%
GeForce GTX 1660 Ti Mobile:
59.9 [X] MSI GP65 Leopard 9SD Intel Core i7-9750H 2.6GHz
GeForce GTX 1660 Ti Mobile
min:
42 fps
fps
34%
GeForce GTX 1050 Ti Mobile:
20.6 [X] MSI GE72 7RE Intel Core i7-7700HQ 2.8GHz
GeForce GTX 1050 Ti Mobile
min:
7 fps
fps
60%
GeForce GTX 1650 Mobile:
36 [X] MSI GP75 Leopard 9SC Intel Core i7-9750H 2.6GHz
GeForce GTX 1650 Mobile
min:
25 fps
fps
100%
GeForce GTX 1660 Ti Mobile:
31.5 [X] MSI GP65 Leopard 9SD Intel Core i7-9750H 2.6GHz
GeForce GTX 1660 Ti Mobile
min:
24 fps
fps
39%
GeForce GTX 1050 Ti Mobile:
12.3 [X] MSI GE72 7RE Intel Core i7-7700HQ 2.8GHz
GeForce GTX 1050 Ti Mobile
min:
6 fps
fps
57%
GeForce GTX 1650 Mobile:
17.8 [X] MSI GP75 Leopard 9SC Intel Core i7-9750H 2.6GHz
GeForce GTX 1650 Mobile
min:
13 fps
fps
100%
GeForce GTX 1660 Ti Mobile:
227 [X] MSI GP65 Leopard 9SD Intel Core i7-9750H 2.6GHz
GeForce GTX 1660 Ti Mobile
min:
190 fps
fps
72%
GeForce GTX 1050 Ti Mobile:
164 [X] MSI GE72 7RE Intel Core i7-7700HQ 2.8GHz
GeForce GTX 1050 Ti Mobile
min:
145 fps
fps
80%
GeForce GTX 1650 Mobile:
156 178 182 [X] Nexoc GH5 515IG Intel Core i5-10300H 2.5GHz
GeForce GTX 1650 Mobile
min:
169 fps, max:
197 fps
185 208 [X] MSI GP75 Leopard 9SC Intel Core i7-9750H 2.6GHz
GeForce GTX 1650 Mobile
min:
187 fps
~ 182 fps
100%
GeForce GTX 1660 Ti Mobile:
143 [X] MSI GP65 Leopard 9SD Intel Core i7-9750H 2.6GHz
GeForce GTX 1660 Ti Mobile
min:
130 fps
fps
57%
GeForce GTX 1050 Ti Mobile:
82 [X] MSI GE72 7RE Intel Core i7-7700HQ 2.8GHz
GeForce GTX 1050 Ti Mobile
min:
71 fps
fps
71%
GeForce GTX 1650 Mobile:
86.5 100 104 [X] Nexoc GH5 515IG Intel Core i5-10300H 2.5GHz
GeForce GTX 1650 Mobile
min:
91 fps, max:
115 fps
104 114 [X] MSI GP75 Leopard 9SC Intel Core i7-9750H 2.6GHz
GeForce GTX 1650 Mobile
min:
101 fps
~ 102 fps
100%
GeForce GTX 1660 Ti Mobile:
122 126 [X] MSI GP65 Leopard 9SD Intel Core i7-9750H 2.6GHz
GeForce GTX 1660 Ti Mobile
min:
114 fps
~ 124 fps
51%
GeForce GTX 1050 Ti Mobile:
63 [X] MSI GE72 7RE Intel Core i7-7700HQ 2.8GHz
GeForce GTX 1050 Ti Mobile
min:
54 fps
fps
65%
GeForce GTX 1650 Mobile:
68.7 80 81 [X] Nexoc GH5 515IG Intel Core i5-10300H 2.5GHz
GeForce GTX 1650 Mobile
min:
71 fps, max:
93 fps
83 91 [X] MSI GP75 Leopard 9SC Intel Core i7-9750H 2.6GHz
GeForce GTX 1650 Mobile
min:
79 fps
~ 81 fps
100%
GeForce GTX 1660 Ti Mobile:
87 92 [X] MSI GP65 Leopard 9SD Intel Core i7-9750H 2.6GHz
GeForce GTX 1660 Ti Mobile
min:
75 fps
~ 90 fps
43%
GeForce GTX 1050 Ti Mobile:
39 [X] MSI GE72 7RE Intel Core i7-7700HQ 2.8GHz
GeForce GTX 1050 Ti Mobile
min:
30 fps
fps
63%
GeForce GTX 1650 Mobile:
48.3 57 [X] Nexoc GH5 515IG Intel Core i5-10300H 2.5GHz
GeForce GTX 1650 Mobile
min:
46 fps, max:
66 fps
57 58 63 [X] MSI GP75 Leopard 9SC Intel Core i7-9750H 2.6GHz
GeForce GTX 1650 Mobile
min:
51 fps
~ 57 fps
100%
GeForce GTX 1660 Ti Mobile:
65 [X] MSI GP65 Leopard 9SD Intel Core i7-9750H 2.6GHz
GeForce GTX 1660 Ti Mobile
min:
54 fps
fps
40%
GeForce GTX 1050 Ti Mobile:
26 [X] MSI GE72 7RE Intel Core i7-7700HQ 2.8GHz
GeForce GTX 1050 Ti Mobile
min:
21 fps
fps
68%
GeForce GTX 1650 Mobile:
44 [X] MSI GP75 Leopard 9SC Intel Core i7-9750H 2.6GHz
GeForce GTX 1650 Mobile
min:
36 fps
fps
100%
GeForce GTX 1660 Ti Mobile:
37 [X] MSI GP65 Leopard 9SD Intel Core i7-9750H 2.6GHz
GeForce GTX 1660 Ti Mobile
min:
31 fps
fps
32%
GeForce GTX 1050 Ti Mobile:
12 [X] MSI GE72 7RE Intel Core i7-7700HQ 2.8GHz
GeForce GTX 1050 Ti Mobile
min:
10 fps
fps
62%
GeForce GTX 1650 Mobile:
23 [X] MSI GP75 Leopard 9SC Intel Core i7-9750H 2.6GHz
GeForce GTX 1650 Mobile
min:
20 fps
fps
100%
GeForce GTX 1660 Ti Mobile:
249 [X] MSI GP65 Leopard 9SD Intel Core i7-9750H 2.6GHz
GeForce GTX 1660 Ti Mobile
min:
171 fps
fps
77%
GeForce GTX 1050 Ti Mobile:
191 [X] MSI GE72 7RE Intel Core i7-7700HQ 2.8GHz
GeForce GTX 1050 Ti Mobile
min:
144 fps
fps
68%
GeForce GTX 1650 Mobile:
126 214 [X] MSI GP75 Leopard 9SC Intel Core i7-9750H 2.6GHz
GeForce GTX 1650 Mobile
min:
206 fps
~ 170 fps
100%
GeForce GTX 1660 Ti Mobile:
209 [X] MSI GP65 Leopard 9SD Intel Core i7-9750H 2.6GHz
GeForce GTX 1660 Ti Mobile
min:
168 fps
fps
82%
GeForce GTX 1050 Ti Mobile:
172 [X] MSI GE72 7RE Intel Core i7-7700HQ 2.8GHz
GeForce GTX 1050 Ti Mobile
min:
131 fps
fps
78%
GeForce GTX 1650 Mobile:
125 202 [X] MSI GP75 Leopard 9SC Intel Core i7-9750H 2.6GHz
GeForce GTX 1650 Mobile
min:
171 fps
~ 164 fps
100%
GeForce GTX 1660 Ti Mobile:
207 [X] MSI GP65 Leopard 9SD Intel Core i7-9750H 2.6GHz
GeForce GTX 1660 Ti Mobile
min:
164 fps
fps
81%
GeForce GTX 1050 Ti Mobile:
167 [X] MSI GE72 7RE Intel Core i7-7700HQ 2.8GHz
GeForce GTX 1050 Ti Mobile
min:
128 fps
fps
71%
GeForce GTX 1650 Mobile:
105 191 [X] MSI GP75 Leopard 9SC Intel Core i7-9750H 2.6GHz
GeForce GTX 1650 Mobile
min:
165 fps
~ 148 fps
100%
GeForce GTX 1660 Ti Mobile:
197 [X] MSI GP65 Leopard 9SD Intel Core i7-9750H 2.6GHz
GeForce GTX 1660 Ti Mobile
min:
162 fps
fps
65%
GeForce GTX 1050 Ti Mobile:
129 [X] MSI GE72 7RE Intel Core i7-7700HQ 2.8GHz
GeForce GTX 1050 Ti Mobile
min:
112 fps
fps
81%
GeForce GTX 1650 Mobile:
159 [X] MSI GP75 Leopard 9SC Intel Core i7-9750H 2.6GHz
GeForce GTX 1650 Mobile
min:
140 fps
fps
100%
GeForce GTX 1660 Ti Mobile:
152 [X] MSI GP65 Leopard 9SD Intel Core i7-9750H 2.6GHz
GeForce GTX 1660 Ti Mobile
min:
132 fps
fps
52%
GeForce GTX 1050 Ti Mobile:
79 [X] MSI GE72 7RE Intel Core i7-7700HQ 2.8GHz
GeForce GTX 1050 Ti Mobile
min:
62 fps
fps
59%
GeForce GTX 1650 Mobile:
90 [X] MSI GP75 Leopard 9SC Intel Core i7-9750H 2.6GHz
GeForce GTX 1650 Mobile
min:
83 fps
fps
100%
GeForce GTX 1660 Ti Mobile:
262 [X] MSI GP65 Leopard 9SD Intel Core i7-9750H 2.6GHz
GeForce GTX 1660 Ti Mobile
fps
71%
GeForce GTX 1050 Ti Mobile:
185 [X] MSI GE72 7RE Intel Core i7-7700HQ 2.8GHz
GeForce GTX 1050 Ti Mobile
fps
81%
GeForce GTX 1650 Mobile:
161.6 191.1 230.8 260 [X] MSI GP75 Leopard 9SC Intel Core i7-9750H 2.6GHz
GeForce GTX 1650 Mobile
~ 211 fps
100%
GeForce GTX 1660 Ti Mobile:
159 [X] MSI GP65 Leopard 9SD Intel Core i7-9750H 2.6GHz
GeForce GTX 1660 Ti Mobile
fps
47%
GeForce GTX 1050 Ti Mobile:
74.7 [X] MSI GE72 7RE Intel Core i7-7700HQ 2.8GHz
GeForce GTX 1050 Ti Mobile
fps
60%
GeForce GTX 1650 Mobile:
89.7 94 98.2 [X] MSI GP75 Leopard 9SC Intel Core i7-9750H 2.6GHz
GeForce GTX 1650 Mobile
100.4 ~ 96 fps
100%
GeForce GTX 1660 Ti Mobile:
90.2 101 [X] MSI GP65 Leopard 9SD Intel Core i7-9750H 2.6GHz
GeForce GTX 1660 Ti Mobile
~ 96 fps
51%
GeForce GTX 1050 Ti Mobile:
48.5 [X] MSI GE72 7RE Intel Core i7-7700HQ 2.8GHz
GeForce GTX 1050 Ti Mobile
fps
68%
GeForce GTX 1650 Mobile:
61 64.7 [X] MSI GP75 Leopard 9SC Intel Core i7-9750H 2.6GHz
GeForce GTX 1650 Mobile
65.2 66.4 66.4 ~ 65 fps
100%
GeForce GTX 1660 Ti Mobile:
63.6 70.1 [X] MSI GP65 Leopard 9SD Intel Core i7-9750H 2.6GHz
GeForce GTX 1660 Ti Mobile
~ 67 fps
54%
GeForce GTX 1050 Ti Mobile:
36.2 [X] MSI GE72 7RE Intel Core i7-7700HQ 2.8GHz
GeForce GTX 1050 Ti Mobile
fps
67%
GeForce GTX 1650 Mobile:
41.9 43.6 45.4 [X] Nexoc GH5 515IG Leistungsmodus
Intel Core i5-10300H 2.5GHz
GeForce GTX 1650 Mobile
46.9 [X] MSI GP75 Leopard 9SC Intel Core i7-9750H 2.6GHz
GeForce GTX 1650 Mobile
48.3 ~ 45 fps
100%
GeForce GTX 1660 Ti Mobile:
44.9 [X] MSI GP65 Leopard 9SD Intel Core i7-9750H 2.6GHz
GeForce GTX 1660 Ti Mobile
fps
50%
GeForce GTX 1050 Ti Mobile:
22.4 [X] MSI GE72 7RE Intel Core i7-7700HQ 2.8GHz
GeForce GTX 1050 Ti Mobile
fps
67%
GeForce GTX 1650 Mobile:
29.9 [X] MSI GP75 Leopard 9SC Intel Core i7-9750H 2.6GHz
GeForce GTX 1650 Mobile
fps
100%
GeForce GTX 1660 Ti Mobile:
21.8 [X] MSI GP65 Leopard 9SD Intel Core i7-9750H 2.6GHz
GeForce GTX 1660 Ti Mobile
fps
67%
GeForce GTX 1650 Mobile:
14.6 [X] MSI GP75 Leopard 9SC Intel Core i7-9750H 2.6GHz
GeForce GTX 1650 Mobile
fps
100%
GeForce GTX 1660 Ti Mobile:
197 [X] MSI GP65 Leopard 9SD Intel Core i7-9750H 2.6GHz
GeForce GTX 1660 Ti Mobile
min:
86 fps
fps
39%
GeForce GTX 1050 Ti Mobile:
76.6 [X] MSI GE72 7RE Intel Core i7-7700HQ 2.8GHz
GeForce GTX 1050 Ti Mobile
min:
46 fps
fps
100%
GeForce GTX 1660 Ti Mobile:
148 [X] MSI GP65 Leopard 9SD Intel Core i7-9750H 2.6GHz
GeForce GTX 1660 Ti Mobile
min:
85 fps
fps
100%
GeForce GTX 1660 Ti Mobile:
133 [X] MSI GP65 Leopard 9SD Intel Core i7-9750H 2.6GHz
GeForce GTX 1660 Ti Mobile
min:
80 fps
fps
100%
GeForce GTX 1660 Ti Mobile:
120 129 [X] MSI GP65 Leopard 9SD Intel Core i7-9750H 2.6GHz
GeForce GTX 1660 Ti Mobile
min:
78 fps
~ 125 fps
100%
GeForce GTX 1660 Ti Mobile:
80.9 [X] MSI GP65 Leopard 9SD Intel Core i7-9750H 2.6GHz
GeForce GTX 1660 Ti Mobile
min:
51 fps
fps
100%
GeForce GTX 1660 Ti Mobile:
38.8 [X] MSI GP65 Leopard 9SD Intel Core i7-9750H 2.6GHz
GeForce GTX 1660 Ti Mobile
min:
30 fps
fps
100%
GeForce GTX 1660 Ti Mobile:
166 [X] MSI GP65 Leopard 9SD Intel Core i7-9750H 2.6GHz
GeForce GTX 1660 Ti Mobile
min:
149 fps
fps
64%
GeForce GTX 1050 Ti Mobile:
107 [X] MSI GE72 7RE Intel Core i7-7700HQ 2.8GHz
GeForce GTX 1050 Ti Mobile
min:
98 fps
fps
89%
GeForce GTX 1650 Mobile:
144.4 152 [X] MSI GP75 Leopard 9SC Intel Core i7-9750H 2.6GHz
GeForce GTX 1650 Mobile
min:
141 fps
~ 148 fps
100%
GeForce GTX 1660 Ti Mobile:
89.3 [X] MSI GP65 Leopard 9SD Intel Core i7-9750H 2.6GHz
GeForce GTX 1660 Ti Mobile
min:
82 fps
fps
48%
GeForce GTX 1050 Ti Mobile:
42.7 [X] MSI GE72 7RE Intel Core i7-7700HQ 2.8GHz
GeForce GTX 1050 Ti Mobile
min:
40 fps
fps
64%
GeForce GTX 1650 Mobile:
56.8 57.9 [X] MSI GP75 Leopard 9SC Intel Core i7-9750H 2.6GHz
GeForce GTX 1650 Mobile
min:
45 fps
~ 57 fps
100%
GeForce GTX 1660 Ti Mobile:
69.1 73.5 [X] MSI GP65 Leopard 9SD Intel Core i7-9750H 2.6GHz
GeForce GTX 1660 Ti Mobile
min:
69 fps
~ 71 fps
48%
GeForce GTX 1050 Ti Mobile:
34.3 [X] MSI GE72 7RE Intel Core i7-7700HQ 2.8GHz
GeForce GTX 1050 Ti Mobile
min:
31 fps
fps
66%
GeForce GTX 1650 Mobile:
46.4 48.3 [X] MSI GP75 Leopard 9SC Intel Core i7-9750H 2.6GHz
GeForce GTX 1650 Mobile
min:
43 fps
~ 47 fps
100%
GeForce GTX 1660 Ti Mobile:
47.4 [X] MSI GP65 Leopard 9SD Intel Core i7-9750H 2.6GHz
GeForce GTX 1660 Ti Mobile
min:
42 fps
fps
42%
GeForce GTX 1050 Ti Mobile:
19.9 [X] MSI GE72 7RE Intel Core i7-7700HQ 2.8GHz
GeForce GTX 1050 Ti Mobile
min:
18 fps
fps
57%
GeForce GTX 1650 Mobile:
27.1 [X] MSI GP75 Leopard 9SC Intel Core i7-9750H 2.6GHz
GeForce GTX 1650 Mobile
min:
22 fps
fps
100%
GeForce GTX 1660 Ti Mobile:
21.2 [X] MSI GP65 Leopard 9SD Intel Core i7-9750H 2.6GHz
GeForce GTX 1660 Ti Mobile
min:
20 fps
fps
50%
GeForce GTX 1050 Ti Mobile:
10.6 [X] MSI GE72 7RE Intel Core i7-7700HQ 2.8GHz
GeForce GTX 1050 Ti Mobile
min:
9 fps
fps
59%
GeForce GTX 1650 Mobile:
12.5 [X] MSI GP75 Leopard 9SC Intel Core i7-9750H 2.6GHz
GeForce GTX 1650 Mobile
min:
11 fps
fps
100%
GeForce GTX 1660 Ti Mobile:
121 [X] MSI GP65 Leopard 9SD Intel Core i7-9750H 2.6GHz
GeForce GTX 1660 Ti Mobile
min:
119 fps
fps
98%
GeForce GTX 1050 Ti Mobile:
118 [X] MSI GE72 7RE Intel Core i7-7700HQ 2.8GHz
GeForce GTX 1050 Ti Mobile
min:
103 fps
fps
100%
GeForce GTX 1650 Mobile:
121 [X] MSI GP75 Leopard 9SC Intel Core i7-9750H 2.6GHz
GeForce GTX 1650 Mobile
min:
118 fps
121.2 ~ 121 fps
100%
GeForce GTX 1660 Ti Mobile:
117 [X] MSI GP65 Leopard 9SD Intel Core i7-9750H 2.6GHz
GeForce GTX 1660 Ti Mobile
min:
96 fps
fps
48%
GeForce GTX 1050 Ti Mobile:
56.7 [X] MSI GE72 7RE Intel Core i7-7700HQ 2.8GHz
GeForce GTX 1050 Ti Mobile
min:
48 fps
fps
68%
GeForce GTX 1650 Mobile:
78.6 82 [X] MSI GP75 Leopard 9SC Intel Core i7-9750H 2.6GHz
GeForce GTX 1650 Mobile
min:
70 fps
~ 80 fps
100%
GeForce GTX 1660 Ti Mobile:
97.8 [X] MSI GP65 Leopard 9SD Intel Core i7-9750H 2.6GHz
GeForce GTX 1660 Ti Mobile
min:
85 fps
fps
46%
GeForce GTX 1050 Ti Mobile:
45.1 [X] MSI GE72 7RE Intel Core i7-7700HQ 2.8GHz
GeForce GTX 1050 Ti Mobile
min:
38 fps
fps
64%
GeForce GTX 1650 Mobile:
58.4 [X] MSI GP75 Leopard 9SC Intel Core i7-9750H 2.6GHz
GeForce GTX 1650 Mobile
min:
46 fps
67.9 ~ 63 fps
100%
GeForce GTX 1660 Ti Mobile:
90 [X] MSI GP65 Leopard 9SD Intel Core i7-9750H 2.6GHz
GeForce GTX 1660 Ti Mobile
min:
81 fps
fps
46%
GeForce GTX 1050 Ti Mobile:
41.3 [X] MSI GE72 7RE Intel Core i7-7700HQ 2.8GHz
GeForce GTX 1050 Ti Mobile
min:
27 fps
fps
60%
GeForce GTX 1650 Mobile:
45.8 [X] MSI GP75 Leopard 9SC Intel Core i7-9750H 2.6GHz
GeForce GTX 1650 Mobile
min:
36 fps
62.2 ~ 54 fps
100%
GeForce GTX 1660 Ti Mobile:
51.5 [X] MSI GP65 Leopard 9SD Intel Core i7-9750H 2.6GHz
GeForce GTX 1660 Ti Mobile
min:
47 fps
fps
51%
GeForce GTX 1050 Ti Mobile:
26.1 [X] MSI GE72 7RE Intel Core i7-7700HQ 2.8GHz
GeForce GTX 1050 Ti Mobile
min:
18 fps
fps
64%
GeForce GTX 1650 Mobile:
32.9 [X] MSI GP75 Leopard 9SC Intel Core i7-9750H 2.6GHz
GeForce GTX 1650 Mobile
min:
29 fps
fps
100%
GeForce GTX 1660 Ti Mobile:
26.2 [X] MSI GP65 Leopard 9SD Intel Core i7-9750H 2.6GHz
GeForce GTX 1660 Ti Mobile
min:
25 fps
fps
28%
GeForce GTX 1050 Ti Mobile:
7.4 [X] MSI GE72 7RE Intel Core i7-7700HQ 2.8GHz
GeForce GTX 1050 Ti Mobile
min:
4 fps
fps
60%
GeForce GTX 1650 Mobile:
15.7 [X] MSI GP75 Leopard 9SC Intel Core i7-9750H 2.6GHz
GeForce GTX 1650 Mobile
min:
13 fps
fps
100%
GeForce GTX 1660 Ti Mobile:
103 [X] MSI GP65 Leopard 9SD Intel Core i7-9750H 2.6GHz
GeForce GTX 1660 Ti Mobile
min:
23 fps
fps
44%
GeForce GTX 1050 Ti Mobile:
45.4 [X] MSI GE72 7RE Intel Core i7-7700HQ 2.8GHz
GeForce GTX 1050 Ti Mobile
min:
18 fps
fps
77%
GeForce GTX 1650 Mobile:
63.4 [X] MSI GP75 Leopard 9SC Intel Core i7-9750H 2.6GHz
GeForce GTX 1650 Mobile
min:
13 fps
93.6 ~ 79 fps
100%
GeForce GTX 1660 Ti Mobile:
75.3 78.6 [X] MSI GP65 Leopard 9SD Intel Core i7-9750H 2.6GHz
GeForce GTX 1660 Ti Mobile
min:
27 fps
~ 77 fps
43%
GeForce GTX 1050 Ti Mobile:
32.8 [X] MSI GE72 7RE Intel Core i7-7700HQ 2.8GHz
GeForce GTX 1050 Ti Mobile
min:
13 fps
fps
62%
GeForce GTX 1650 Mobile:
45.8 [X] MSI GP75 Leopard 9SC Intel Core i7-9750H 2.6GHz
GeForce GTX 1650 Mobile
min:
23 fps
50.8 ~ 48 fps
100%
GeForce GTX 1660 Ti Mobile:
50.5 52.1 [X] MSI GP65 Leopard 9SD Intel Core i7-9750H 2.6GHz
GeForce GTX 1660 Ti Mobile
min:
18 fps
~ 51 fps
65%
GeForce GTX 1650 Mobile:
32.1 [X] MSI GP75 Leopard 9SC Intel Core i7-9750H 2.6GHz
GeForce GTX 1650 Mobile
min:
15 fps
33.1 ~ 33 fps
100%
GeForce GTX 1660 Ti Mobile:
31.2 32 [X] MSI GP65 Leopard 9SD Intel Core i7-9750H 2.6GHz
GeForce GTX 1660 Ti Mobile
min:
17 fps
~ 32 fps
66%
GeForce GTX 1650 Mobile:
21.2 [X] MSI GP75 Leopard 9SC Intel Core i7-9750H 2.6GHz
GeForce GTX 1650 Mobile
min:
12 fps
21.2 ~ 21 fps
100%
GeForce GTX 1660 Ti Mobile:
25.6 [X] MSI GP65 Leopard 9SD Intel Core i7-9750H 2.6GHz
GeForce GTX 1660 Ti Mobile
min:
8 fps
fps
100%
GeForce GTX 1660 Ti Mobile:
17.3 [X] MSI GP65 Leopard 9SD Intel Core i7-9750H 2.6GHz
GeForce GTX 1660 Ti Mobile
min:
5 fps
fps
100%
GeForce GTX 1660 Ti Mobile:
94.7 104 [X] MSI GP65 Leopard 9SD Intel Core i7-9750H 2.6GHz
GeForce GTX 1660 Ti Mobile
min:
66 fps
~ 99 fps
61%
GeForce GTX 1050 Ti Mobile:
59.9 [X] MSI GE72 7RE Intel Core i7-7700HQ 2.8GHz
GeForce GTX 1050 Ti Mobile
min:
46 fps
fps
74%
GeForce GTX 1650 Mobile:
69.6 71.2 [X] MSI GP75 Leopard 9SC Intel Core i7-9750H 2.6GHz
GeForce GTX 1650 Mobile
min:
60 fps
78.3 ~ 73 fps
100%
GeForce GTX 1660 Ti Mobile:
84.9 91.4 [X] MSI GP65 Leopard 9SD Intel Core i7-9750H 2.6GHz
GeForce GTX 1660 Ti Mobile
min:
62 fps
~ 88 fps
54%
GeForce GTX 1050 Ti Mobile:
47.2 [X] MSI GE72 7RE Intel Core i7-7700HQ 2.8GHz
GeForce GTX 1050 Ti Mobile
min:
39 fps
fps
70%
GeForce GTX 1650 Mobile:
59.8 61.1 64 [X] MSI GP75 Leopard 9SC Intel Core i7-9750H 2.6GHz
GeForce GTX 1650 Mobile
min:
55 fps
~ 62 fps
100%
GeForce GTX 1660 Ti Mobile:
77.7 82.9 [X] MSI GP65 Leopard 9SD Intel Core i7-9750H 2.6GHz
GeForce GTX 1660 Ti Mobile
min:
61 fps
~ 80 fps
50%
GeForce GTX 1050 Ti Mobile:
40.2 [X] MSI GE72 7RE Intel Core i7-7700HQ 2.8GHz
GeForce GTX 1050 Ti Mobile
min:
33 fps
fps
66%
GeForce GTX 1650 Mobile:
51.8 52.1 54.5 [X] MSI GP75 Leopard 9SC Intel Core i7-9750H 2.6GHz
GeForce GTX 1650 Mobile
min:
47 fps
~ 53 fps
100%
GeForce GTX 1660 Ti Mobile:
56 [X] MSI GP65 Leopard 9SD Intel Core i7-9750H 2.6GHz
GeForce GTX 1660 Ti Mobile
min:
51 fps
fps
46%
GeForce GTX 1050 Ti Mobile:
25.6 [X] MSI GE72 7RE Intel Core i7-7700HQ 2.8GHz
GeForce GTX 1050 Ti Mobile
min:
22 fps
fps
59%
GeForce GTX 1650 Mobile:
33.3 [X] MSI GP75 Leopard 9SC Intel Core i7-9750H 2.6GHz
GeForce GTX 1650 Mobile
min:
25 fps
fps
100%
GeForce GTX 1660 Ti Mobile:
27.1 [X] MSI GP65 Leopard 9SD Intel Core i7-9750H 2.6GHz
GeForce GTX 1660 Ti Mobile
min:
24 fps
fps
43%
GeForce GTX 1050 Ti Mobile:
11.6 [X] MSI GE72 7RE Intel Core i7-7700HQ 2.8GHz
GeForce GTX 1050 Ti Mobile
min:
10 fps
fps
62%
GeForce GTX 1650 Mobile:
16.9 [X] MSI GP75 Leopard 9SC Intel Core i7-9750H 2.6GHz
GeForce GTX 1650 Mobile
min:
15 fps
fps
100%
GeForce GTX 1660 Ti Mobile:
99 [X] MSI GP65 Leopard 9SD Intel Core i7-9750H 2.6GHz
GeForce GTX 1660 Ti Mobile
min:
87 fps
fps
82%
GeForce GTX 1050 Ti Mobile:
81.4 [X] MSI GE72 7RE Intel Core i7-7700HQ 2.8GHz
GeForce GTX 1050 Ti Mobile
min:
63 fps
fps
88%
GeForce GTX 1650 Mobile:
75.6 98 [X] MSI GP75 Leopard 9SC Intel Core i7-9750H 2.6GHz
GeForce GTX 1650 Mobile
min:
86 fps
~ 87 fps
100%
GeForce GTX 1660 Ti Mobile:
87.9 93 [X] MSI GP65 Leopard 9SD Intel Core i7-9750H 2.6GHz
GeForce GTX 1660 Ti Mobile
min:
81 fps
~ 90 fps
52%
GeForce GTX 1050 Ti Mobile:
46.8 [X] MSI GE72 7RE Intel Core i7-7700HQ 2.8GHz
GeForce GTX 1050 Ti Mobile
min:
41 fps
fps
69%
GeForce GTX 1650 Mobile:
57.8 66.3 [X] MSI GP75 Leopard 9SC Intel Core i7-9750H 2.6GHz
GeForce GTX 1650 Mobile
min:
54 fps
~ 62 fps
100%
GeForce GTX 1660 Ti Mobile:
79.7 86.2 [X] MSI GP65 Leopard 9SD Intel Core i7-9750H 2.6GHz
GeForce GTX 1660 Ti Mobile
min:
73 fps
~ 83 fps
51%
GeForce GTX 1050 Ti Mobile:
42.1 [X] MSI GE72 7RE Intel Core i7-7700HQ 2.8GHz
GeForce GTX 1050 Ti Mobile
min:
36 fps
fps
66%
GeForce GTX 1650 Mobile:
51 59.9 [X] MSI GP75 Leopard 9SC Intel Core i7-9750H 2.6GHz
GeForce GTX 1650 Mobile
min:
52 fps
~ 55 fps
100%
GeForce GTX 1660 Ti Mobile:
67.4 70.3 [X] MSI GP65 Leopard 9SD Intel Core i7-9750H 2.6GHz
GeForce GTX 1660 Ti Mobile
min:
61 fps
~ 69 fps
53%
GeForce GTX 1050 Ti Mobile:
36.3 [X] MSI GE72 7RE Intel Core i7-7700HQ 2.8GHz
GeForce GTX 1050 Ti Mobile
min:
29 fps
fps
70%
GeForce GTX 1650 Mobile:
46.3 [X] MSI GP75 Leopard 9SC Intel Core i7-9750H 2.6GHz
GeForce GTX 1650 Mobile
min:
40 fps
48.7 ~ 48 fps
100%
GeForce GTX 1660 Ti Mobile:
50.3 [X] MSI GP65 Leopard 9SD Intel Core i7-9750H 2.6GHz
GeForce GTX 1660 Ti Mobile
min:
42 fps
fps
43%
GeForce GTX 1050 Ti Mobile:
21.4 [X] MSI GE72 7RE Intel Core i7-7700HQ 2.8GHz
GeForce GTX 1050 Ti Mobile
min:
15 fps
fps
64%
GeForce GTX 1650 Mobile:
32.2 [X] MSI GP75 Leopard 9SC Intel Core i7-9750H 2.6GHz
GeForce GTX 1650 Mobile
min:
26 fps
fps
100%
GeForce GTX 1660 Ti Mobile:
27 [X] MSI GP65 Leopard 9SD Intel Core i7-9750H 2.6GHz
GeForce GTX 1660 Ti Mobile
min:
22 fps
fps
22%
GeForce GTX 1050 Ti Mobile:
6 [X] MSI GE72 7RE Intel Core i7-7700HQ 2.8GHz
GeForce GTX 1050 Ti Mobile
min:
3 fps
fps
63%
GeForce GTX 1650 Mobile:
17 [X] MSI GP75 Leopard 9SC Intel Core i7-9750H 2.6GHz
GeForce GTX 1650 Mobile
min:
14 fps
fps
100%
GeForce GTX 1660 Ti Mobile:
179 [X] MSI GP65 Leopard 9SD Intel Core i7-9750H 2.6GHz
GeForce GTX 1660 Ti Mobile
min:
125 fps
fps
46%
GeForce GTX 1050 Ti Mobile:
82.3 [X] MSI GE72 7RE Intel Core i7-7700HQ 2.8GHz
GeForce GTX 1050 Ti Mobile
min:
63 fps
fps
58%
GeForce GTX 1650 Mobile:
97.5 98.3 99.6 121 [X] MSI GP75 Leopard 9SC Intel Core i7-9750H 2.6GHz
GeForce GTX 1650 Mobile
min:
96 fps
~ 104 fps
100%
GeForce GTX 1660 Ti Mobile:
99 109 [X] MSI GP65 Leopard 9SD Intel Core i7-9750H 2.6GHz
GeForce GTX 1660 Ti Mobile
min:
82 fps
~ 104 fps
46%
GeForce GTX 1050 Ti Mobile:
47.4 [X] MSI GE72 7RE Intel Core i7-7700HQ 2.8GHz
GeForce GTX 1050 Ti Mobile
min:
39 fps
fps
62%
GeForce GTX 1650 Mobile:
58.1 61.5 64.3 70.1 [X] MSI GP75 Leopard 9SC Intel Core i7-9750H 2.6GHz
GeForce GTX 1650 Mobile
min:
58 fps
~ 64 fps
100%
GeForce GTX 1660 Ti Mobile:
88.1 103 [X] MSI GP65 Leopard 9SD Intel Core i7-9750H 2.6GHz
GeForce GTX 1660 Ti Mobile
min:
75 fps
~ 96 fps
38%
GeForce GTX 1050 Ti Mobile:
36 [X] MSI GE72 7RE Intel Core i7-7700HQ 2.8GHz
GeForce GTX 1050 Ti Mobile
min:
28 fps
fps
58%
GeForce GTX 1650 Mobile:
51.1 51.4 53.3 66.5 [X] MSI GP75 Leopard 9SC Intel Core i7-9750H 2.6GHz
GeForce GTX 1650 Mobile
min:
53 fps
~ 56 fps
100%
GeForce GTX 1660 Ti Mobile:
71.9 84.1 [X] MSI GP65 Leopard 9SD Intel Core i7-9750H 2.6GHz
GeForce GTX 1660 Ti Mobile
min:
64 fps
~ 78 fps
39%
GeForce GTX 1050 Ti Mobile:
30.6 [X] MSI GE72 7RE Intel Core i7-7700HQ 2.8GHz
GeForce GTX 1050 Ti Mobile
min:
24 fps
fps
60%
GeForce GTX 1650 Mobile:
43.3 44.6 45.4 53.5 [X] MSI GP75 Leopard 9SC Intel Core i7-9750H 2.6GHz
GeForce GTX 1650 Mobile
min:
44 fps
~ 47 fps
100%
GeForce GTX 1660 Ti Mobile:
58.8 [X] MSI GP65 Leopard 9SD Intel Core i7-9750H 2.6GHz
GeForce GTX 1660 Ti Mobile
min:
47 fps
fps
36%
GeForce GTX 1050 Ti Mobile:
21.2 [X] MSI GE72 7RE Intel Core i7-7700HQ 2.8GHz
GeForce GTX 1050 Ti Mobile
min:
16 fps
fps
64%
GeForce GTX 1650 Mobile:
37.6 [X] MSI GP75 Leopard 9SC Intel Core i7-9750H 2.6GHz
GeForce GTX 1650 Mobile
min:
31 fps
fps
100%
GeForce GTX 1660 Ti Mobile:
32.8 [X] MSI GP65 Leopard 9SD Intel Core i7-9750H 2.6GHz
GeForce GTX 1660 Ti Mobile
min:
27 fps
fps
13%
GeForce GTX 1050 Ti Mobile:
4.3 [X] MSI GE72 7RE Intel Core i7-7700HQ 2.8GHz
GeForce GTX 1050 Ti Mobile
min:
3 fps
fps
20%
GeForce GTX 1650 Mobile:
6.7 [X] MSI GP75 Leopard 9SC Intel Core i7-9750H 2.6GHz
GeForce GTX 1650 Mobile
min:
6 fps
fps
100%
GeForce GTX 1660 Ti Mobile:
192 [X] MSI GP65 Leopard 9SD Intel Core i7-9750H 2.6GHz
GeForce GTX 1660 Ti Mobile
min:
154 fps
fps
58%
GeForce GTX 1050 Ti Mobile:
111 [X] MSI GE72 7RE Intel Core i7-7700HQ 2.8GHz
GeForce GTX 1050 Ti Mobile
min:
85 fps
fps
67%
GeForce GTX 1650 Mobile:
98.2 123 166 [X] MSI GP75 Leopard 9SC Intel Core i7-9750H 2.6GHz
GeForce GTX 1650 Mobile
min:
128 fps
~ 129 fps
100%
GeForce GTX 1660 Ti Mobile:
116 [X] MSI GP65 Leopard 9SD Intel Core i7-9750H 2.6GHz
GeForce GTX 1660 Ti Mobile
min:
95 fps
119 ~ 118 fps
35%
GeForce GTX 1050 Ti Mobile:
41.5 [X] MSI GE72 7RE Intel Core i7-7700HQ 2.8GHz
GeForce GTX 1050 Ti Mobile
min:
25 fps
fps
63%
GeForce GTX 1650 Mobile:
67.3 76.2 77.3 [X] MSI GP75 Leopard 9SC Intel Core i7-9750H 2.6GHz
GeForce GTX 1650 Mobile
min:
63 fps
~ 74 fps
100%
GeForce GTX 1660 Ti Mobile:
90.5 94.3 [X] MSI GP65 Leopard 9SD Intel Core i7-9750H 2.6GHz
GeForce GTX 1660 Ti Mobile
min:
75 fps
~ 92 fps
37%
GeForce GTX 1050 Ti Mobile:
33.9 [X] MSI GE72 7RE Intel Core i7-7700HQ 2.8GHz
GeForce GTX 1050 Ti Mobile
min:
22 fps
fps
64%
GeForce GTX 1650 Mobile:
51.7 59.7 64.4 [X] MSI GP75 Leopard 9SC Intel Core i7-9750H 2.6GHz
GeForce GTX 1650 Mobile
min:
53 fps
~ 59 fps
100%
GeForce GTX 1660 Ti Mobile:
61.7 64.1 [X] MSI GP65 Leopard 9SD Intel Core i7-9750H 2.6GHz
GeForce GTX 1660 Ti Mobile
min:
53 fps
~ 63 fps
37%
GeForce GTX 1050 Ti Mobile:
23 [X] MSI GE72 7RE Intel Core i7-7700HQ 2.8GHz
GeForce GTX 1050 Ti Mobile
min:
14 fps
fps
63%
GeForce GTX 1650 Mobile:
34.3 41.3 44.4 [X] MSI GP75 Leopard 9SC Intel Core i7-9750H 2.6GHz
GeForce GTX 1650 Mobile
min:
37 fps
~ 40 fps
100%
GeForce GTX 1660 Ti Mobile:
51.3 [X] MSI GP65 Leopard 9SD Intel Core i7-9750H 2.6GHz
GeForce GTX 1660 Ti Mobile
min:
43 fps
fps
33%
GeForce GTX 1050 Ti Mobile:
16.8 [X] MSI GE72 7RE Intel Core i7-7700HQ 2.8GHz
GeForce GTX 1050 Ti Mobile
min:
10 fps
fps
51%
GeForce GTX 1650 Mobile:
26 [X] MSI GP75 Leopard 9SC Intel Core i7-9750H 2.6GHz
GeForce GTX 1650 Mobile
min:
16 fps
fps
100%
GeForce GTX 1660 Ti Mobile:
31.2 [X] MSI GP65 Leopard 9SD Intel Core i7-9750H 2.6GHz
GeForce GTX 1660 Ti Mobile
min:
27 fps
fps
25%
GeForce GTX 1050 Ti Mobile:
7.9 [X] MSI GE72 7RE Intel Core i7-7700HQ 2.8GHz
GeForce GTX 1050 Ti Mobile
min:
4 fps
fps
45%
GeForce GTX 1650 Mobile:
13.5 15 [X] MSI GP75 Leopard 9SC Intel Core i7-9750H 2.6GHz
GeForce GTX 1650 Mobile
min:
9 fps
~ 14 fps
100%
GeForce GTX 1660 Ti Mobile:
119 [X] MSI GP65 Leopard 9SD Intel Core i7-9750H 2.6GHz
GeForce GTX 1660 Ti Mobile
min:
60 fps
fps
66%
GeForce GTX 1050 Ti Mobile:
78 [X] MSI GE72 7RE Intel Core i7-7700HQ 2.8GHz
GeForce GTX 1050 Ti Mobile
min:
58 fps
fps
76%
GeForce GTX 1650 Mobile:
85 94 [X] MSI GP75 Leopard 9SC Intel Core i7-9750H 2.6GHz
GeForce GTX 1650 Mobile
min:
59 fps
~ 90 fps
100%
GeForce GTX 1660 Ti Mobile:
79 84 [X] MSI GP65 Leopard 9SD Intel Core i7-9750H 2.6GHz
GeForce GTX 1660 Ti Mobile
min:
52 fps
~ 82 fps
49%
GeForce GTX 1050 Ti Mobile:
40 [X] MSI GE72 7RE Intel Core i7-7700HQ 2.8GHz
GeForce GTX 1050 Ti Mobile
min:
32 fps
fps
62%
GeForce GTX 1650 Mobile:
48 54 [X] MSI GP75 Leopard 9SC Intel Core i7-9750H 2.6GHz
GeForce GTX 1650 Mobile
min:
40 fps
~ 51 fps
100%
GeForce GTX 1660 Ti Mobile:
70 76 [X] MSI GP65 Leopard 9SD Intel Core i7-9750H 2.6GHz
GeForce GTX 1660 Ti Mobile
min:
44 fps
~ 73 fps
48%
GeForce GTX 1050 Ti Mobile:
35 [X] MSI GE72 7RE Intel Core i7-7700HQ 2.8GHz
GeForce GTX 1050 Ti Mobile
min:
29 fps
fps
64%
GeForce GTX 1650 Mobile:
44 49 [X] MSI GP75 Leopard 9SC Intel Core i7-9750H 2.6GHz
GeForce GTX 1650 Mobile
min:
35 fps
~ 47 fps
100%
GeForce GTX 1660 Ti Mobile:
51 55 [X] MSI GP65 Leopard 9SD Intel Core i7-9750H 2.6GHz
GeForce GTX 1660 Ti Mobile
min:
30 fps
~ 53 fps
45%
GeForce GTX 1050 Ti Mobile:
24 [X] MSI GE72 7RE Intel Core i7-7700HQ 2.8GHz
GeForce GTX 1050 Ti Mobile
min:
19 fps
fps
64%
GeForce GTX 1650 Mobile:
30 37 [X] MSI GP75 Leopard 9SC Intel Core i7-9750H 2.6GHz
GeForce GTX 1650 Mobile
min:
24 fps
~ 34 fps
100%
GeForce GTX 1660 Ti Mobile:
38 [X] MSI GP65 Leopard 9SD Intel Core i7-9750H 2.6GHz
GeForce GTX 1660 Ti Mobile
min:
29 fps
fps
29%
GeForce GTX 1050 Ti Mobile:
11 [X] MSI GE72 7RE Intel Core i7-7700HQ 2.8GHz
GeForce GTX 1050 Ti Mobile
min:
6 fps
fps
100%
GeForce GTX 1660 Ti Mobile:
19 [X] MSI GP65 Leopard 9SD Intel Core i7-9750H 2.6GHz
GeForce GTX 1660 Ti Mobile
min:
15 fps
fps
21%
GeForce GTX 1050 Ti Mobile:
4 [X] MSI GE72 7RE Intel Core i7-7700HQ 2.8GHz
GeForce GTX 1050 Ti Mobile
min:
3 fps
fps
100%
GeForce GTX 1660 Ti Mobile:
255 [X] MSI GP65 Leopard 9SD Intel Core i7-9750H 2.6GHz
GeForce GTX 1660 Ti Mobile
min:
208 fps
fps
75%
GeForce GTX 1050 Ti Mobile:
192 [X] MSI GE72 7RE Intel Core i7-7700HQ 2.8GHz
GeForce GTX 1050 Ti Mobile
min:
147 fps
fps
80%
GeForce GTX 1650 Mobile:
188 218 [X] MSI GP75 Leopard 9SC Intel Core i7-9750H 2.6GHz
GeForce GTX 1650 Mobile
min:
175 fps
~ 203 fps
100%
GeForce GTX 1660 Ti Mobile:
192 249 [X] MSI GP65 Leopard 9SD Intel Core i7-9750H 2.6GHz
GeForce GTX 1660 Ti Mobile
min:
204 fps
~ 221 fps
75%
GeForce GTX 1050 Ti Mobile:
166 [X] MSI GE72 7RE Intel Core i7-7700HQ 2.8GHz
GeForce GTX 1050 Ti Mobile
min:
120 fps
fps
76%
GeForce GTX 1650 Mobile:
154 179 [X] MSI GP75 Leopard 9SC Intel Core i7-9750H 2.6GHz
GeForce GTX 1650 Mobile
min:
130 fps
~ 167 fps
100%
GeForce GTX 1660 Ti Mobile:
181 241 [X] MSI GP65 Leopard 9SD Intel Core i7-9750H 2.6GHz
GeForce GTX 1660 Ti Mobile
min:
197 fps
~ 211 fps
73%
GeForce GTX 1050 Ti Mobile:
154 [X] MSI GE72 7RE Intel Core i7-7700HQ 2.8GHz
GeForce GTX 1050 Ti Mobile
min:
112 fps
fps
76%
GeForce GTX 1650 Mobile:
148 174 [X] MSI GP75 Leopard 9SC Intel Core i7-9750H 2.6GHz
GeForce GTX 1650 Mobile
min:
128 fps
~ 161 fps
100%
GeForce GTX 1660 Ti Mobile:
179 237 [X] MSI GP65 Leopard 9SD Intel Core i7-9750H 2.6GHz
GeForce GTX 1660 Ti Mobile
min:
195 fps
~ 208 fps
67%
GeForce GTX 1050 Ti Mobile:
140 [X] MSI GE72 7RE Intel Core i7-7700HQ 2.8GHz
GeForce GTX 1050 Ti Mobile
min:
106 fps
fps
71%
GeForce GTX 1650 Mobile:
137 159 [X] MSI GP75 Leopard 9SC Intel Core i7-9750H 2.6GHz
GeForce GTX 1650 Mobile
min:
112 fps
~ 148 fps
100%
GeForce GTX 1660 Ti Mobile:
219 [X] MSI GP65 Leopard 9SD Intel Core i7-9750H 2.6GHz
GeForce GTX 1660 Ti Mobile
min:
175 fps
fps
49%
GeForce GTX 1050 Ti Mobile:
108 [X] MSI GE72 7RE Intel Core i7-7700HQ 2.8GHz
GeForce GTX 1050 Ti Mobile
min:
87 fps
fps
58%
GeForce GTX 1650 Mobile:
128 [X] MSI GP75 Leopard 9SC Intel Core i7-9750H 2.6GHz
GeForce GTX 1650 Mobile
min:
93 fps
fps
100%
GeForce GTX 1660 Ti Mobile:
138 [X] MSI GP65 Leopard 9SD Intel Core i7-9750H 2.6GHz
GeForce GTX 1660 Ti Mobile
min:
120 fps
fps
41%
GeForce GTX 1050 Ti Mobile:
56.9 [X] MSI GE72 7RE Intel Core i7-7700HQ 2.8GHz
GeForce GTX 1050 Ti Mobile
min:
48 fps
fps
61%
GeForce GTX 1650 Mobile:
84.4 [X] MSI GP75 Leopard 9SC Intel Core i7-9750H 2.6GHz
GeForce GTX 1650 Mobile
min:
72 fps
fps
100%
GeForce GTX 1660 Ti Mobile:
107.9 131 [X] MSI GP65 Leopard 9SD Intel Core i7-9750H 2.6GHz
GeForce GTX 1660 Ti Mobile
~ 119 fps
77%
GeForce GTX 1050 Ti Mobile:
91.2 [X] MSI GE72 7RE Intel Core i7-7700HQ 2.8GHz
GeForce GTX 1050 Ti Mobile
fps
87%
GeForce GTX 1650 Mobile:
80.9 98.9 102.8 115.7 124 [X] MSI GP75 Leopard 9SC Intel Core i7-9750H 2.6GHz
GeForce GTX 1650 Mobile
~ 104 fps
100%
GeForce GTX 1660 Ti Mobile:
87.5 91.7 96 [X] MSI GP65 Leopard 9SD Intel Core i7-9750H 2.6GHz
GeForce GTX 1660 Ti Mobile
~ 92 fps
48%
GeForce GTX 1050 Ti Mobile:
44.6 [X] MSI GE72 7RE Intel Core i7-7700HQ 2.8GHz
GeForce GTX 1050 Ti Mobile
fps
64%
GeForce GTX 1650 Mobile:
50.5 58.3 60.1 63.1 64.3 [X] MSI GP75 Leopard 9SC Intel Core i7-9750H 2.6GHz
GeForce GTX 1650 Mobile
~ 59 fps
100%
GeForce GTX 1660 Ti Mobile:
61.7 61.7 64.2 [X] MSI GP65 Leopard 9SD Intel Core i7-9750H 2.6GHz
GeForce GTX 1660 Ti Mobile
~ 63 fps
45%
GeForce GTX 1050 Ti Mobile:
28.1 [X] MSI GE72 7RE Intel Core i7-7700HQ 2.8GHz
GeForce GTX 1050 Ti Mobile
fps
62%
GeForce GTX 1650 Mobile:
35.7 39 39.2 40.9 41 [X] MSI GP75 Leopard 9SC Intel Core i7-9750H 2.6GHz
GeForce GTX 1650 Mobile
~ 39 fps
100%
GeForce GTX 1660 Ti Mobile:
46.6 47.8 48.6 [X] MSI GP65 Leopard 9SD Intel Core i7-9750H 2.6GHz
GeForce GTX 1660 Ti Mobile
~ 48 fps
42%
GeForce GTX 1050 Ti Mobile:
20.1 [X] MSI GE72 7RE Intel Core i7-7700HQ 2.8GHz
GeForce GTX 1050 Ti Mobile
fps
65%
GeForce GTX 1650 Mobile:
29 29.5 30.7 [X] MSI GP75 Leopard 9SC Intel Core i7-9750H 2.6GHz
GeForce GTX 1650 Mobile
30.8 34.6 ~ 31 fps
100%
GeForce GTX 1660 Ti Mobile:
32.1 [X] MSI GP65 Leopard 9SD Intel Core i7-9750H 2.6GHz
GeForce GTX 1660 Ti Mobile
fps
46%
GeForce GTX 1050 Ti Mobile:
14.9 [X] MSI GE72 7RE Intel Core i7-7700HQ 2.8GHz
GeForce GTX 1050 Ti Mobile
fps
57%
GeForce GTX 1650 Mobile:
18.3 [X] MSI GP75 Leopard 9SC Intel Core i7-9750H 2.6GHz
GeForce GTX 1650 Mobile
fps
100%
GeForce GTX 1660 Ti Mobile:
11.8 [X] MSI GP65 Leopard 9SD Intel Core i7-9750H 2.6GHz
GeForce GTX 1660 Ti Mobile
fps
25%
GeForce GTX 1050 Ti Mobile:
3 [X] MSI GE72 7RE Intel Core i7-7700HQ 2.8GHz
GeForce GTX 1050 Ti Mobile
fps
53%
GeForce GTX 1650 Mobile:
6.3 [X] MSI GP75 Leopard 9SC Intel Core i7-9750H 2.6GHz
GeForce GTX 1650 Mobile
fps
100%
GeForce GTX 1660 Ti Mobile:
210 [X] MSI GP65 Leopard 9SD Intel Core i7-9750H 2.6GHz
GeForce GTX 1660 Ti Mobile
min:
190 fps
fps
45%
GeForce GTX 1050 Ti Mobile:
95 [X] MSI GE72 7RE Intel Core i7-7700HQ 2.8GHz
GeForce GTX 1050 Ti Mobile
min:
84 fps
fps
65%
GeForce GTX 1650 Mobile:
126.7 129 138.5 143 [X] MSI GP75 Leopard 9SC Intel Core i7-9750H 2.6GHz
GeForce GTX 1650 Mobile
min:
127 fps
143.3 ~ 136 fps
100%
GeForce GTX 1660 Ti Mobile:
69.2 72.3 [X] MSI GP65 Leopard 9SD Intel Core i7-9750H 2.6GHz
GeForce GTX 1660 Ti Mobile
min:
63 fps
~ 71 fps
43%
GeForce GTX 1050 Ti Mobile:
30.2 [X] MSI GE72 7RE Intel Core i7-7700HQ 2.8GHz
GeForce GTX 1050 Ti Mobile
min:
26 fps
fps
63%
GeForce GTX 1650 Mobile:
44.2 45.2 45.5 45.7 [X] MSI GP75 Leopard 9SC Intel Core i7-9750H 2.6GHz
GeForce GTX 1650 Mobile
min:
39 fps
46 ~ 45 fps
100%
GeForce GTX 1660 Ti Mobile:
50.7 52.8 [X] MSI GP65 Leopard 9SD Intel Core i7-9750H 2.6GHz
GeForce GTX 1660 Ti Mobile
min:
45 fps
~ 52 fps
42%
GeForce GTX 1050 Ti Mobile:
21.9 [X] MSI GE72 7RE Intel Core i7-7700HQ 2.8GHz
GeForce GTX 1050 Ti Mobile
min:
18 fps
fps
63%
GeForce GTX 1650 Mobile:
32.1 33.2 33.4 [X] MSI GP75 Leopard 9SC Intel Core i7-9750H 2.6GHz
GeForce GTX 1650 Mobile
min:
28 fps
33.4 33.5 ~ 33 fps
100%
GeForce GTX 1660 Ti Mobile:
33.1 [X] MSI GP65 Leopard 9SD Intel Core i7-9750H 2.6GHz
GeForce GTX 1660 Ti Mobile
min:
28 fps
fps
36%
GeForce GTX 1050 Ti Mobile:
11.8 [X] MSI GE72 7RE Intel Core i7-7700HQ 2.8GHz
GeForce GTX 1050 Ti Mobile
min:
9 fps
fps
62%
GeForce GTX 1650 Mobile:
20.6 [X] MSI GP75 Leopard 9SC Intel Core i7-9750H 2.6GHz
GeForce GTX 1650 Mobile
min:
17 fps
fps
100%
GeForce GTX 1660 Ti Mobile:
15.1 [X] MSI GP65 Leopard 9SD Intel Core i7-9750H 2.6GHz
GeForce GTX 1660 Ti Mobile
min:
13 fps
fps
22%
GeForce GTX 1050 Ti Mobile:
3.3 [X] MSI GE72 7RE Intel Core i7-7700HQ 2.8GHz
GeForce GTX 1050 Ti Mobile
min:
2 fps
fps
65%
GeForce GTX 1650 Mobile:
9.8 [X] MSI GP75 Leopard 9SC Intel Core i7-9750H 2.6GHz
GeForce GTX 1650 Mobile
min:
8 fps
fps
100%
GeForce GTX 1660 Ti Mobile:
181 193 [X] SCHENKER XMG Core 17 Overboost-Profil
Intel Core i7-9750H 2.6GHz
GeForce GTX 1660 Ti Mobile
210 230 [X] MSI GP65 Leopard 9SD Intel Core i7-9750H 2.6GHz
GeForce GTX 1660 Ti Mobile
min:
180 fps
~ 204 fps
81%
GeForce GTX 1050 Ti Mobile:
165 [X] MSI GE72 7RE Intel Core i7-7700HQ 2.8GHz
GeForce GTX 1050 Ti Mobile
min:
131 fps
fps
75%
GeForce GTX 1650 Mobile:
111 128 163 [X] HP Omen 15-dc1020ng Dual-Channel-Modus
Intel Core i5-9300H 2.4GHz
GeForce GTX 1650 Mobile
172 194 [X] MSI GP75 Leopard 9SC Intel Core i7-9750H 2.6GHz
GeForce GTX 1650 Mobile
min:
147 fps
~ 154 fps
100%
GeForce GTX 1660 Ti Mobile:
141 [X] SCHENKER XMG Core 17 Overboost-Profil
Intel Core i7-9750H 2.6GHz
GeForce GTX 1660 Ti Mobile
144 154 157 [X] MSI GP65 Leopard 9SD Intel Core i7-9750H 2.6GHz
GeForce GTX 1660 Ti Mobile
min:
136 fps
~ 149 fps
49%
GeForce GTX 1050 Ti Mobile:
73 [X] MSI GE72 7RE Intel Core i7-7700HQ 2.8GHz
GeForce GTX 1050 Ti Mobile
min:
61 fps
fps
67%
GeForce GTX 1650 Mobile:
84 97 102 107 [X] MSI GP75 Leopard 9SC Intel Core i7-9750H 2.6GHz
GeForce GTX 1650 Mobile
min:
86 fps
111 [X] HP Omen 15-dc1020ng Dual-Channel-Modus
Intel Core i5-9300H 2.4GHz
GeForce GTX 1650 Mobile
~ 100 fps
100%
GeForce GTX 1660 Ti Mobile:
121 [X] SCHENKER XMG Core 17 Overboost-Profil
Intel Core i7-9750H 2.6GHz
GeForce GTX 1660 Ti Mobile
122 131 141 [X] MSI GP65 Leopard 9SD Intel Core i7-9750H 2.6GHz
GeForce GTX 1660 Ti Mobile
min:
128 fps
~ 129 fps
49%
GeForce GTX 1050 Ti Mobile:
63 [X] MSI GE72 7RE Intel Core i7-7700HQ 2.8GHz
GeForce GTX 1050 Ti Mobile
min:
49 fps
fps
63%
GeForce GTX 1650 Mobile:
70 74 84 [X] MSI GP75 Leopard 9SC Intel Core i7-9750H 2.6GHz
GeForce GTX 1650 Mobile
min:
74 fps
85 92 [X] HP Omen 15-dc1020ng Dual-Channel-Modus
Intel Core i5-9300H 2.4GHz
GeForce GTX 1650 Mobile
~ 81 fps
100%
GeForce GTX 1660 Ti Mobile:
91 92 93 [X] MSI GP65 Leopard 9SD Intel Core i7-9750H 2.6GHz
GeForce GTX 1660 Ti Mobile
min:
83 fps
99 [X] SCHENKER XMG Core 17 Overboost-Profil
Intel Core i7-9750H 2.6GHz
GeForce GTX 1660 Ti Mobile
~ 94 fps
40%
GeForce GTX 1050 Ti Mobile:
38 [X] MSI GE72 7RE Intel Core i7-7700HQ 2.8GHz
GeForce GTX 1050 Ti Mobile
min:
28 fps
fps
65%
GeForce GTX 1650 Mobile:
59 59 60 63 [X] HP Omen 15-dc1020ng Dual-Channel-Modus
Intel Core i5-9300H 2.4GHz
GeForce GTX 1650 Mobile
65 [X] MSI GP75 Leopard 9SC Intel Core i7-9750H 2.6GHz
GeForce GTX 1650 Mobile
min:
60 fps
~ 61 fps
100%
GeForce GTX 1660 Ti Mobile:
68 [X] MSI GP65 Leopard 9SD Intel Core i7-9750H 2.6GHz
GeForce GTX 1660 Ti Mobile
min:
54 fps
fps
37%
GeForce GTX 1050 Ti Mobile:
25 [X] MSI GE72 7RE Intel Core i7-7700HQ 2.8GHz
GeForce GTX 1050 Ti Mobile
min:
20 fps
fps
66%
GeForce GTX 1650 Mobile:
45 [X] MSI GP75 Leopard 9SC Intel Core i7-9750H 2.6GHz
GeForce GTX 1650 Mobile
min:
35 fps
fps
100%
GeForce GTX 1660 Ti Mobile:
43 [X] MSI GP65 Leopard 9SD Intel Core i7-9750H 2.6GHz
GeForce GTX 1660 Ti Mobile
min:
40 fps
fps
33%
GeForce GTX 1050 Ti Mobile:
14 [X] MSI GE72 7RE Intel Core i7-7700HQ 2.8GHz
GeForce GTX 1050 Ti Mobile
min:
11 fps
fps
63%
GeForce GTX 1650 Mobile:
27 [X] MSI GP75 Leopard 9SC Intel Core i7-9750H 2.6GHz
GeForce GTX 1650 Mobile
min:
18 fps
fps
100%
GeForce GTX 1660 Ti Mobile:
202.9 fps
100%
GeForce GTX 1660 Ti Mobile:
101.5 fps
100%
GeForce GTX 1660 Ti Mobile:
63.9 fps
100%
GeForce GTX 1660 Ti Mobile:
46.1 fps
100%
GeForce GTX 1660 Ti Mobile:
162.7 175.1 ~ 169 fps
45%
GeForce GTX 1050 Ti Mobile:
76.7 [X] MSI GE72 7RE Intel Core i7-7700HQ 2.8GHz
GeForce GTX 1050 Ti Mobile
min:
67 fps
fps
70%
GeForce GTX 1650 Mobile:
117 117 123.1 [X] HP Omen 15-dc1020ng Dual-Channel-Modus
Intel Core i5-9300H 2.4GHz
GeForce GTX 1650 Mobile
~ 119 fps
100%
GeForce GTX 1660 Ti Mobile:
81.6 83.3 ~ 82 fps
45%
GeForce GTX 1050 Ti Mobile:
36.7 [X] MSI GE72 7RE Intel Core i7-7700HQ 2.8GHz
GeForce GTX 1050 Ti Mobile
min:
33 fps
fps
84%
GeForce GTX 1650 Mobile:
54.5 55.8 [X] HP Omen 15-dc1020ng Dual-Channel-Modus
Intel Core i5-9300H 2.4GHz
GeForce GTX 1650 Mobile
97 ~ 69 fps
100%
GeForce GTX 1660 Ti Mobile:
69.5 69.9 ~ 70 fps
45%
GeForce GTX 1050 Ti Mobile:
31.8 [X] MSI GE72 7RE Intel Core i7-7700HQ 2.8GHz
GeForce GTX 1050 Ti Mobile
min:
29 fps
fps
80%
GeForce GTX 1650 Mobile:
46 47.2 [X] HP Omen 15-dc1020ng Dual-Channel-Modus
Intel Core i5-9300H 2.4GHz
GeForce GTX 1650 Mobile
74 ~ 56 fps
100%
GeForce GTX 1660 Ti Mobile:
67.9 68.8 ~ 68 fps
42%
GeForce GTX 1050 Ti Mobile:
28.8 [X] MSI GE72 7RE Intel Core i7-7700HQ 2.8GHz
GeForce GTX 1050 Ti Mobile
min:
26 fps
fps
75%
GeForce GTX 1650 Mobile:
45.1 46.4 [X] HP Omen 15-dc1020ng Dual-Channel-Modus
Intel Core i5-9300H 2.4GHz
GeForce GTX 1650 Mobile
60 ~ 51 fps
GeForce GTX 1050 Ti Mobile:
18.1 [X] MSI GE72 7RE Intel Core i7-7700HQ 2.8GHz
GeForce GTX 1050 Ti Mobile
min:
16 fps
fps
100%
GeForce GTX 1660 Ti Mobile:
94.6 fps
76%
GeForce GTX 1050 Ti Mobile:
72 [X] MSI GE72 7RE Intel Core i7-7700HQ 2.8GHz
GeForce GTX 1050 Ti Mobile
min:
66 fps
fps
63%
GeForce GTX 1650 Mobile:
49.2 53.8 63.1 [X] Asus TUF FX705DT-AU068T Dual-Channel
AMD Ryzen 5 3550H 2.1GHz
GeForce GTX 1650 Mobile
74.9 ~ 60 fps
100%
GeForce GTX 1660 Ti Mobile:
89.6 105 [X] Schenker Compact 15 Intel Core i7-9750H 2.6GHz
GeForce GTX 1660 Ti Mobile
min:
89 fps
~ 97 fps
59%
GeForce GTX 1050 Ti Mobile:
57 [X] MSI GE72 7RE Intel Core i7-7700HQ 2.8GHz
GeForce GTX 1050 Ti Mobile
min:
53 fps
fps
59%
GeForce GTX 1650 Mobile:
43.3 45.2 60.8 [X] Asus TUF FX705DT-AU068T Dual-Channel
AMD Ryzen 5 3550H 2.1GHz
GeForce GTX 1650 Mobile
64.5 69.8 [X] Acer Nitro 5 Intel Core i5-9300H 2.4GHz
GeForce GTX 1650 Mobile
min:
60 fps
~ 57 fps
100%
GeForce GTX 1660 Ti Mobile:
69.2 70.4 [X] Schenker Compact 15 Intel Core i7-9750H 2.6GHz
GeForce GTX 1660 Ti Mobile
min:
62 fps
75.9 ~ 72 fps
55%
GeForce GTX 1050 Ti Mobile:
39.4 [X] MSI GE72 7RE Intel Core i7-7700HQ 2.8GHz
GeForce GTX 1050 Ti Mobile
min:
35 fps
fps
56%
GeForce GTX 1650 Mobile:
34 38 40.1 42.4 [X] Asus TUF FX705DT-AU068T Dual-Channel
AMD Ryzen 5 3550H 2.1GHz
GeForce GTX 1650 Mobile
44.7 [X] Acer Nitro 5 Intel Core i5-9300H 2.4GHz
GeForce GTX 1650 Mobile
min:
42 fps
~ 40 fps
100%
GeForce GTX 1660 Ti Mobile:
31.1 [X] Schenker Compact 15 Intel Core i7-9750H 2.6GHz
GeForce GTX 1660 Ti Mobile
min:
28 fps
35.9 39.6 54 ~ 40 fps
44%
GeForce GTX 1050 Ti Mobile:
17.4 [X] MSI GE72 7RE Intel Core i7-7700HQ 2.8GHz
GeForce GTX 1050 Ti Mobile
min:
15 fps
fps
50%
GeForce GTX 1650 Mobile:
17.4 19.2 [X] Acer Nitro 5 Intel Core i5-9300H 2.4GHz
GeForce GTX 1650 Mobile
min:
16 fps
19.4 21.7 22.7 [X] Asus TUF FX705DT-AU068T Dual-Channel
AMD Ryzen 5 3550H 2.1GHz
GeForce GTX 1650 Mobile
~ 20 fps
100%
GeForce GTX 1660 Ti Mobile:
22.2 [X] Schenker Compact 15 Intel Core i7-9750H 2.6GHz
GeForce GTX 1660 Ti Mobile
min:
20 fps
fps
55%
GeForce GTX 1050 Ti Mobile:
12.3 [X] MSI GE72 7RE Intel Core i7-7700HQ 2.8GHz
GeForce GTX 1050 Ti Mobile
min:
9 fps
fps
62%
GeForce GTX 1650 Mobile:
13.8 [X] Acer Nitro 5 Intel Core i5-9300H 2.4GHz
GeForce GTX 1650 Mobile
min:
11 fps
fps
100%
GeForce GTX 1660 Ti Mobile:
13.4 [X] Schenker Compact 15 Intel Core i7-9750H 2.6GHz
GeForce GTX 1660 Ti Mobile
min:
10 fps
fps
34%
GeForce GTX 1050 Ti Mobile:
4.5 [X] MSI GE72 7RE Intel Core i7-7700HQ 2.8GHz
GeForce GTX 1050 Ti Mobile
min:
2 fps
fps
62%
GeForce GTX 1650 Mobile:
8.3 [X] Acer Nitro 5 Intel Core i5-9300H 2.4GHz
GeForce GTX 1650 Mobile
min:
5 fps
fps
GeForce GTX 1050 Ti Mobile:
106 [X] MSI GE72 7RE Intel Core i7-7700HQ 2.8GHz
GeForce GTX 1050 Ti Mobile
fps
GeForce GTX 1650 Mobile:
81 114 ~ 98 fps
100%
GeForce GTX 1660 Ti Mobile:
98 104 [X] Schenker Compact 15 Intel Core i7-9750H 2.6GHz
GeForce GTX 1660 Ti Mobile
~ 101 fps
46%
GeForce GTX 1050 Ti Mobile:
46 [X] MSI GE72 7RE Intel Core i7-7700HQ 2.8GHz
GeForce GTX 1050 Ti Mobile
fps
63%
GeForce GTX 1650 Mobile:
54 63 74 [X] Acer Nitro 5 Intel Core i5-9300H 2.4GHz
GeForce GTX 1650 Mobile
~ 64 fps
100%
GeForce GTX 1660 Ti Mobile:
78 81 [X] Schenker Compact 15 Intel Core i7-9750H 2.6GHz
GeForce GTX 1660 Ti Mobile
~ 80 fps
44%
GeForce GTX 1050 Ti Mobile:
35 [X] MSI GE72 7RE Intel Core i7-7700HQ 2.8GHz
GeForce GTX 1050 Ti Mobile
fps
64%
GeForce GTX 1650 Mobile:
46 50 57 [X] Acer Nitro 5 Intel Core i5-9300H 2.4GHz
GeForce GTX 1650 Mobile
~ 51 fps
100%
GeForce GTX 1660 Ti Mobile:
57 63 [X] Schenker Compact 15 Intel Core i7-9750H 2.6GHz
GeForce GTX 1660 Ti Mobile
~ 60 fps
43%
GeForce GTX 1050 Ti Mobile:
26 [X] MSI GE72 7RE Intel Core i7-7700HQ 2.8GHz
GeForce GTX 1050 Ti Mobile
fps
63%
GeForce GTX 1650 Mobile:
35 37 43 [X] Acer Nitro 5 Intel Core i5-9300H 2.4GHz
GeForce GTX 1650 Mobile
~ 38 fps
100%
GeForce GTX 1660 Ti Mobile:
43 [X] Schenker Compact 15 Intel Core i7-9750H 2.6GHz
GeForce GTX 1660 Ti Mobile
fps
35%
GeForce GTX 1050 Ti Mobile:
15 [X] MSI GE72 7RE Intel Core i7-7700HQ 2.8GHz
GeForce GTX 1050 Ti Mobile
fps
67%
GeForce GTX 1650 Mobile:
29 [X] Acer Nitro 5 Intel Core i5-9300H 2.4GHz
GeForce GTX 1650 Mobile
fps
100%
GeForce GTX 1660 Ti Mobile:
23 [X] Schenker Compact 15 Intel Core i7-9750H 2.6GHz
GeForce GTX 1660 Ti Mobile
fps
26%
GeForce GTX 1050 Ti Mobile:
6 [X] MSI GE72 7RE Intel Core i7-7700HQ 2.8GHz
GeForce GTX 1050 Ti Mobile
fps
61%
GeForce GTX 1650 Mobile:
14 [X] Acer Nitro 5 Intel Core i5-9300H 2.4GHz
GeForce GTX 1650 Mobile
fps
GeForce GTX 1050 Ti Mobile:
127 [X] MSI GE72 7RE Intel Core i7-7700HQ 2.8GHz
GeForce GTX 1050 Ti Mobile
min:
117 fps
fps
GeForce GTX 1650 Mobile:
145.7 203 ~ 174 fps
100%
GeForce GTX 1660 Ti Mobile:
138 [X] Schenker Compact 15 Intel Core i7-9750H 2.6GHz
GeForce GTX 1660 Ti Mobile
min:
122 fps
144 ~ 141 fps
43%
GeForce GTX 1050 Ti Mobile:
60.4 [X] MSI GE72 7RE Intel Core i7-7700HQ 2.8GHz
GeForce GTX 1050 Ti Mobile
min:
51 fps
fps
64%
GeForce GTX 1650 Mobile:
81.4 89.3 99.8 [X] Acer Nitro 5 Intel Core i5-9300H 2.4GHz
GeForce GTX 1650 Mobile
min:
90 fps
~ 90 fps
100%
GeForce GTX 1660 Ti Mobile:
107 [X] Schenker Compact 15 Intel Core i7-9750H 2.6GHz
GeForce GTX 1660 Ti Mobile
min:
85 fps
123 ~ 115 fps
39%
GeForce GTX 1050 Ti Mobile:
44.5 [X] MSI GE72 7RE Intel Core i7-7700HQ 2.8GHz
GeForce GTX 1050 Ti Mobile
min:
40 fps
fps
63%
GeForce GTX 1650 Mobile:
68.9 71 77.1 [X] Acer Nitro 5 Intel Core i5-9300H 2.4GHz
GeForce GTX 1650 Mobile
min:
66 fps
~ 72 fps
100%
GeForce GTX 1660 Ti Mobile:
62.3 [X] Schenker Compact 15 Intel Core i7-9750H 2.6GHz
GeForce GTX 1660 Ti Mobile
min:
52 fps
65.6 ~ 64 fps
40%
GeForce GTX 1050 Ti Mobile:
25.7 [X] MSI GE72 7RE Intel Core i7-7700HQ 2.8GHz
GeForce GTX 1050 Ti Mobile
min:
18 fps
fps
67%
GeForce GTX 1650 Mobile:
41.8 42.1 44.1 [X] Acer Nitro 5 Intel Core i5-9300H 2.4GHz
GeForce GTX 1650 Mobile
min:
38 fps
~ 43 fps
100%
GeForce GTX 1660 Ti Mobile:
46.4 [X] Schenker Compact 15 Intel Core i7-9750H 2.6GHz
GeForce GTX 1660 Ti Mobile
min:
40 fps
fps
43%
GeForce GTX 1050 Ti Mobile:
19.9 [X] MSI GE72 7RE Intel Core i7-7700HQ 2.8GHz
GeForce GTX 1050 Ti Mobile
min:
16 fps
fps
69%
GeForce GTX 1650 Mobile:
31.9 [X] Acer Nitro 5 Intel Core i5-9300H 2.4GHz
GeForce GTX 1650 Mobile
min:
28 fps
fps
GeForce GTX 1050 Ti Mobile:
72.6 [X] MSI GE72 7RE Intel Core i7-7700HQ 2.8GHz
GeForce GTX 1050 Ti Mobile
min:
57 fps
fps
GeForce GTX 1650 Mobile:
43.9 62.7 ~ 53 fps
100%
GeForce GTX 1660 Ti Mobile:
75.2 88.2 [X] Schenker Compact 15 Intel Core i7-9750H 2.6GHz
GeForce GTX 1660 Ti Mobile
min:
66 fps
~ 82 fps
47%
GeForce GTX 1050 Ti Mobile:
38.9 [X] MSI GE72 7RE Intel Core i7-7700HQ 2.8GHz
GeForce GTX 1050 Ti Mobile
min:
30 fps
fps
61%
GeForce GTX 1650 Mobile:
33.4 56.8 61 [X] Acer Nitro 5 Intel Core i5-9300H 2.4GHz
GeForce GTX 1650 Mobile
min:
51 fps
~ 50 fps
100%
GeForce GTX 1660 Ti Mobile:
73.2 76.8 [X] Schenker Compact 15 Intel Core i7-9750H 2.6GHz
GeForce GTX 1660 Ti Mobile
min:
61 fps
~ 75 fps
44%
GeForce GTX 1050 Ti Mobile:
32.7 [X] MSI GE72 7RE Intel Core i7-7700HQ 2.8GHz
GeForce GTX 1050 Ti Mobile
min:
27 fps
fps
60%
GeForce GTX 1650 Mobile:
34.2 47.3 53.6 [X] Acer Nitro 5 Intel Core i5-9300H 2.4GHz
GeForce GTX 1650 Mobile
min:
43 fps
~ 45 fps
100%
GeForce GTX 1660 Ti Mobile:
71 71.8 [X] Schenker Compact 15 Intel Core i7-9750H 2.6GHz
GeForce GTX 1660 Ti Mobile
min:
59 fps
~ 71 fps
40%
GeForce GTX 1050 Ti Mobile:
28.2 [X] MSI GE72 7RE Intel Core i7-7700HQ 2.8GHz
GeForce GTX 1050 Ti Mobile
min:
23 fps
fps
56%
GeForce GTX 1650 Mobile:
29.1 44.9 46.2 [X] Acer Nitro 5 Intel Core i5-9300H 2.4GHz
GeForce GTX 1650 Mobile
min:
39 fps
~ 40 fps
100%
GeForce GTX 1660 Ti Mobile:
49.6 [X] Schenker Compact 15 Intel Core i7-9750H 2.6GHz
GeForce GTX 1660 Ti Mobile
min:
44 fps
fps
35%
GeForce GTX 1050 Ti Mobile:
17.3 [X] MSI GE72 7RE Intel Core i7-7700HQ 2.8GHz
GeForce GTX 1050 Ti Mobile
min:
12 fps
fps
64%
GeForce GTX 1650 Mobile:
31.5 [X] Acer Nitro 5 Intel Core i5-9300H 2.4GHz
GeForce GTX 1650 Mobile
min:
28 fps
fps
100%
GeForce GTX 1660 Ti Mobile:
26.6 [X] Schenker Compact 15 Intel Core i7-9750H 2.6GHz
GeForce GTX 1660 Ti Mobile
min:
24 fps
fps
24%
GeForce GTX 1050 Ti Mobile:
6.5 [X] MSI GE72 7RE Intel Core i7-7700HQ 2.8GHz
GeForce GTX 1050 Ti Mobile
min:
3 fps
fps
62%
GeForce GTX 1650 Mobile:
16.5 [X] Acer Nitro 5 Intel Core i5-9300H 2.4GHz
GeForce GTX 1650 Mobile
min:
14 fps
fps
100%
GeForce GTX 1660 Ti Mobile:
104 105 106 [X] SCHENKER XMG Core 17 Overboost-Profil
Intel Core i7-9750H 2.6GHz
GeForce GTX 1660 Ti Mobile
106 106 109 ~ 106 fps
78%
GeForce GTX 1050 Ti Mobile:
83 [X] MSI GE72 7RE Intel Core i7-7700HQ 2.8GHz
GeForce GTX 1050 Ti Mobile
min:
60 fps
fps
68%
GeForce GTX 1650 Mobile:
59 60 73 [X] Asus TUF FX705DT-AU068T Dual-Channel
AMD Ryzen 5 3550H 2.1GHz
GeForce GTX 1650 Mobile
95 [X] HP Omen 15-dc1020ng Dual-Channel-Modus
Intel Core i5-9300H 2.4GHz
GeForce GTX 1650 Mobile
~ 72 fps
100%
GeForce GTX 1660 Ti Mobile:
83 [X] SCHENKER XMG Core 17 Overboost-Profil
Intel Core i7-9750H 2.6GHz
GeForce GTX 1660 Ti Mobile
86 87 88 90 90 94 [X] Schenker Compact 15 Intel Core i7-9750H 2.6GHz
GeForce GTX 1660 Ti Mobile
min:
79 fps
~ 88 fps
52%
GeForce GTX 1050 Ti Mobile:
46 [X] MSI GE72 7RE Intel Core i7-7700HQ 2.8GHz
GeForce GTX 1050 Ti Mobile
min:
37 fps
fps
64%
GeForce GTX 1650 Mobile:
47 53 55 [X] Asus TUF FX705DT-AU068T Dual-Channel
AMD Ryzen 5 3550H 2.1GHz
GeForce GTX 1650 Mobile
63 [X] HP Omen 15-dc1020ng Dual-Channel-Modus
Intel Core i5-9300H 2.4GHz
GeForce GTX 1650 Mobile
64 [X] Acer Nitro 5 Intel Core i5-9300H 2.4GHz
GeForce GTX 1650 Mobile
min:
54 fps
~ 56 fps
100%
GeForce GTX 1660 Ti Mobile:
79 [X] SCHENKER XMG Core 17 Overboost-Profil
Intel Core i7-9750H 2.6GHz
GeForce GTX 1660 Ti Mobile
83 83 85 86 86 89 [X] Schenker Compact 15 Intel Core i7-9750H 2.6GHz
GeForce GTX 1660 Ti Mobile
min:
69 fps
~ 84 fps
50%
GeForce GTX 1050 Ti Mobile:
42 [X] MSI GE72 7RE Intel Core i7-7700HQ 2.8GHz
GeForce GTX 1050 Ti Mobile
min:
33 fps
fps
65%
GeForce GTX 1650 Mobile:
44 52 53 [X] Asus TUF FX705DT-AU068T Dual-Channel
AMD Ryzen 5 3550H 2.1GHz
GeForce GTX 1650 Mobile
57 60 [X] HP Omen 15-dc1020ng Dual-Channel-Modus
Intel Core i5-9300H 2.4GHz
GeForce GTX 1650 Mobile
61 [X] Acer Nitro 5 Intel Core i5-9300H 2.4GHz
GeForce GTX 1650 Mobile
min:
50 fps
~ 55 fps
100%
GeForce GTX 1660 Ti Mobile:
73 [X] SCHENKER XMG Core 17 Overboost-Profil
Intel Core i7-9750H 2.6GHz
GeForce GTX 1660 Ti Mobile
74 75 76 78 78 81 [X] Schenker Compact 15 Intel Core i7-9750H 2.6GHz
GeForce GTX 1660 Ti Mobile
min:
66 fps
~ 76 fps
50%
GeForce GTX 1050 Ti Mobile:
38 [X] MSI GE72 7RE Intel Core i7-7700HQ 2.8GHz
GeForce GTX 1050 Ti Mobile
min:
28 fps
fps
66%
GeForce GTX 1650 Mobile:
40 47 48 [X] Asus TUF FX705DT-AU068T Dual-Channel
AMD Ryzen 5 3550H 2.1GHz
GeForce GTX 1650 Mobile
53 55 [X] HP Omen 15-dc1020ng Dual-Channel-Modus
Intel Core i5-9300H 2.4GHz
GeForce GTX 1650 Mobile
56 [X] Acer Nitro 5 Intel Core i5-9300H 2.4GHz
GeForce GTX 1650 Mobile
min:
44 fps
~ 50 fps
100%
GeForce GTX 1660 Ti Mobile:
60 [X] Schenker Compact 15 Intel Core i7-9750H 2.6GHz
GeForce GTX 1660 Ti Mobile
min:
49 fps
60 ~ 60 fps
45%
GeForce GTX 1050 Ti Mobile:
27 [X] MSI GE72 7RE Intel Core i7-7700HQ 2.8GHz
GeForce GTX 1050 Ti Mobile
min:
21 fps
fps
65%
GeForce GTX 1650 Mobile:
39 [X] Acer Nitro 5 Intel Core i5-9300H 2.4GHz
GeForce GTX 1650 Mobile
min:
32 fps
fps
100%
GeForce GTX 1660 Ti Mobile:
31 [X] Schenker Compact 15 Intel Core i7-9750H 2.6GHz
GeForce GTX 1660 Ti Mobile
min:
26 fps
32 ~ 32 fps
41%
GeForce GTX 1050 Ti Mobile:
13 [X] MSI GE72 7RE Intel Core i7-7700HQ 2.8GHz
GeForce GTX 1050 Ti Mobile
min:
10 fps
fps
59%
GeForce GTX 1650 Mobile:
19 [X] Acer Nitro 5 Intel Core i5-9300H 2.4GHz
GeForce GTX 1650 Mobile
min:
15 fps
fps
31%
GeForce GTX 1050 Ti Mobile:
38 [X] MSI GE72 7RE Intel Core i7-7700HQ 2.8GHz
GeForce GTX 1050 Ti Mobile
min:
17 fps
fps
100%
GeForce GTX 1660 Ti Mobile:
64 [X] Schenker Compact 15 Intel Core i7-9750H 2.6GHz
GeForce GTX 1660 Ti Mobile
min:
32 fps
64.1 72.5 73.7 ~ 69 fps
34%
GeForce GTX 1050 Ti Mobile:
23.7 [X] MSI GE72 7RE Intel Core i7-7700HQ 2.8GHz
GeForce GTX 1050 Ti Mobile
min:
11 fps
fps
62%
GeForce GTX 1650 Mobile:
40.5 41 42.5 [X] Acer Nitro 5 Intel Core i5-9300H 2.4GHz
GeForce GTX 1650 Mobile
min:
23 fps
46.1 ~ 43 fps
100%
GeForce GTX 1660 Ti Mobile:
47.2 [X] Schenker Compact 15 Intel Core i7-9750H 2.6GHz
GeForce GTX 1660 Ti Mobile
min:
24 fps
48.7 54.4 54.9 ~ 51 fps
36%
GeForce GTX 1050 Ti Mobile:
18.5 [X] MSI GE72 7RE Intel Core i7-7700HQ 2.8GHz
GeForce GTX 1050 Ti Mobile
min:
9 fps
fps
63%
GeForce GTX 1650 Mobile:
30.4 30.8 31.4 [X] Acer Nitro 5 Intel Core i5-9300H 2.4GHz
GeForce GTX 1650 Mobile
min:
18 fps
34.2 ~ 32 fps
100%
GeForce GTX 1660 Ti Mobile:
38.2 [X] Schenker Compact 15 Intel Core i7-9750H 2.6GHz
GeForce GTX 1660 Ti Mobile
min:
21 fps
39.6 42.6 43.1 ~ 41 fps
37%
GeForce GTX 1050 Ti Mobile:
15.3 [X] MSI GE72 7RE Intel Core i7-7700HQ 2.8GHz
GeForce GTX 1050 Ti Mobile
min:
7 fps
fps
63%
GeForce GTX 1650 Mobile:
24.9 25.1 25.9 [X] Acer Nitro 5 Intel Core i5-9300H 2.4GHz
GeForce GTX 1650 Mobile
min:
15 fps
26.6 ~ 26 fps
100%
GeForce GTX 1660 Ti Mobile:
29.5 [X] Schenker Compact 15 Intel Core i7-9750H 2.6GHz
GeForce GTX 1660 Ti Mobile
min:
17 fps
fps
40%
GeForce GTX 1050 Ti Mobile:
11.9 [X] MSI GE72 7RE Intel Core i7-7700HQ 2.8GHz
GeForce GTX 1050 Ti Mobile
min:
6 fps
fps
66%
GeForce GTX 1650 Mobile:
19.6 [X] Acer Nitro 5 Intel Core i5-9300H 2.4GHz
GeForce GTX 1650 Mobile
min:
12 fps
fps
100%
GeForce GTX 1660 Ti Mobile:
18.5 [X] Schenker Compact 15 Intel Core i7-9750H 2.6GHz
GeForce GTX 1660 Ti Mobile
min:
12 fps
fps
40%
GeForce GTX 1050 Ti Mobile:
7.4 [X] MSI GE72 7RE Intel Core i7-7700HQ 2.8GHz
GeForce GTX 1050 Ti Mobile
min:
3 fps
fps
64%
GeForce GTX 1650 Mobile:
11.8 [X] Acer Nitro 5 Intel Core i5-9300H 2.4GHz
GeForce GTX 1650 Mobile
min:
8 fps
fps
GeForce GTX 1050 Ti Mobile:
117 [X] MSI GE72 7RE Intel Core i7-7700HQ 2.8GHz
GeForce GTX 1050 Ti Mobile
min:
104 fps
fps
GeForce GTX 1650 Mobile:
144 144 ~ 144 fps
100%
GeForce GTX 1660 Ti Mobile:
120 [X] Schenker Compact 15 Intel Core i7-9750H 2.6GHz
GeForce GTX 1660 Ti Mobile
min:
110 fps
131 ~ 126 fps
42%
GeForce GTX 1050 Ti Mobile:
52.3 [X] MSI GE72 7RE Intel Core i7-7700HQ 2.8GHz
GeForce GTX 1050 Ti Mobile
min:
46 fps
fps
68%
GeForce GTX 1650 Mobile:
80.3 [X] Acer Nitro 5 Intel Core i5-9300H 2.4GHz
GeForce GTX 1650 Mobile
min:
73 fps
81.7 95.1 ~ 86 fps
100%
GeForce GTX 1660 Ti Mobile:
102 [X] Schenker Compact 15 Intel Core i7-9750H 2.6GHz
GeForce GTX 1660 Ti Mobile
min:
94 fps
108 ~ 105 fps
41%
GeForce GTX 1050 Ti Mobile:
43.3 [X] MSI GE72 7RE Intel Core i7-7700HQ 2.8GHz
GeForce GTX 1050 Ti Mobile
min:
38 fps
fps
66%
GeForce GTX 1650 Mobile:
66.5 68.3 [X] Acer Nitro 5 Intel Core i5-9300H 2.4GHz
GeForce GTX 1650 Mobile
min:
62 fps
71.9 ~ 69 fps
100%
GeForce GTX 1660 Ti Mobile:
98.6 [X] Schenker Compact 15 Intel Core i7-9750H 2.6GHz
GeForce GTX 1660 Ti Mobile
min:
90 fps
107 ~ 103 fps
40%
GeForce GTX 1050 Ti Mobile:
41 [X] MSI GE72 7RE Intel Core i7-7700HQ 2.8GHz
GeForce GTX 1050 Ti Mobile
min:
35 fps
fps
66%
GeForce GTX 1650 Mobile:
65.4 67.4 [X] Acer Nitro 5 Intel Core i5-9300H 2.4GHz
GeForce GTX 1650 Mobile
min:
61 fps
71.7 ~ 68 fps
100%
GeForce GTX 1660 Ti Mobile:
72.2 [X] Schenker Compact 15 Intel Core i7-9750H 2.6GHz
GeForce GTX 1660 Ti Mobile
min:
64 fps
fps
37%
GeForce GTX 1050 Ti Mobile:
26.7 [X] MSI GE72 7RE Intel Core i7-7700HQ 2.8GHz
GeForce GTX 1050 Ti Mobile
min:
19 fps
fps
66%
GeForce GTX 1650 Mobile:
47.8 [X] Acer Nitro 5 Intel Core i5-9300H 2.4GHz
GeForce GTX 1650 Mobile
min:
42 fps
fps
100%
GeForce GTX 1660 Ti Mobile:
41.3 [X] Schenker Compact 15 Intel Core i7-9750H 2.6GHz
GeForce GTX 1660 Ti Mobile
min:
36 fps
fps
33%
GeForce GTX 1050 Ti Mobile:
13.7 [X] MSI GE72 7RE Intel Core i7-7700HQ 2.8GHz
GeForce GTX 1050 Ti Mobile
min:
11 fps
fps
64%
GeForce GTX 1650 Mobile:
26.4 [X] Acer Nitro 5 Intel Core i5-9300H 2.4GHz
GeForce GTX 1650 Mobile
min:
23 fps
fps
GeForce GTX 1050 Ti Mobile:
65.6 78 [X] MSI GE72 7RE Intel Core i7-7700HQ 2.8GHz
GeForce GTX 1050 Ti Mobile
min:
71 fps
83.1 ~ 76 fps
100%
GeForce GTX 1660 Ti Mobile:
102 [X] Schenker Compact 15 Intel Core i7-9750H 2.6GHz
GeForce GTX 1660 Ti Mobile
min:
93 fps
fps
47%
GeForce GTX 1050 Ti Mobile:
40.9 50.3 [X] MSI GE72 7RE Intel Core i7-7700HQ 2.8GHz
GeForce GTX 1050 Ti Mobile
min:
45 fps
54 ~ 48 fps
77%
GeForce GTX 1650 Mobile:
78.5 [X] Acer Nitro 5 Intel Core i5-9300H 2.4GHz
GeForce GTX 1650 Mobile
min:
71 fps
fps
100%
GeForce GTX 1660 Ti Mobile:
73.1 [X] Schenker Compact 15 Intel Core i7-9750H 2.6GHz
GeForce GTX 1660 Ti Mobile
min:
68 fps
fps
53%
GeForce GTX 1050 Ti Mobile:
34.6 40.1 [X] MSI GE72 7RE Intel Core i7-7700HQ 2.8GHz
GeForce GTX 1050 Ti Mobile
min:
37 fps
42.5 ~ 39 fps
76%
GeForce GTX 1650 Mobile:
55.5 [X] Acer Nitro 5 Intel Core i5-9300H 2.4GHz
GeForce GTX 1650 Mobile
min:
51 fps
fps
100%
GeForce GTX 1660 Ti Mobile:
67.6 [X] Schenker Compact 15 Intel Core i7-9750H 2.6GHz
GeForce GTX 1660 Ti Mobile
min:
62 fps
fps
53%
GeForce GTX 1050 Ti Mobile:
33.2 35.5 [X] MSI GE72 7RE Intel Core i7-7700HQ 2.8GHz
GeForce GTX 1050 Ti Mobile
min:
30 fps
39.9 ~ 36 fps
77%
GeForce GTX 1650 Mobile:
51.8 [X] Acer Nitro 5 Intel Core i5-9300H 2.4GHz
GeForce GTX 1650 Mobile
min:
47 fps
fps
100%
GeForce GTX 1660 Ti Mobile:
46.4 [X] Schenker Compact 15 Intel Core i7-9750H 2.6GHz
GeForce GTX 1660 Ti Mobile
min:
43 fps
fps
52%
GeForce GTX 1050 Ti Mobile:
24.1 [X] MSI GE72 7RE Intel Core i7-7700HQ 2.8GHz
GeForce GTX 1050 Ti Mobile
min:
22 fps
fps
74%
GeForce GTX 1650 Mobile:
34.3 [X] Acer Nitro 5 Intel Core i5-9300H 2.4GHz
GeForce GTX 1650 Mobile
min:
32 fps
fps
100%
GeForce GTX 1660 Ti Mobile:
25 [X] Schenker Compact 15 Intel Core i7-9750H 2.6GHz
GeForce GTX 1660 Ti Mobile
min:
23 fps
fps
46%
GeForce GTX 1050 Ti Mobile:
11.6 [X] MSI GE72 7RE Intel Core i7-7700HQ 2.8GHz
GeForce GTX 1050 Ti Mobile
min:
8 fps
fps
70%
GeForce GTX 1650 Mobile:
17.4 [X] Acer Nitro 5 Intel Core i5-9300H 2.4GHz
GeForce GTX 1650 Mobile
min:
16 fps
fps
GeForce GTX 1050 Ti Mobile:
116.6 121 157 [X] MSI GE72 7RE Intel Core i7-7700HQ 2.8GHz
GeForce GTX 1050 Ti Mobile
min:
92 fps
167.3 ~ 140 fps
GeForce GTX 1650 Mobile:
96.8 fps
100%
GeForce GTX 1660 Ti Mobile:
82.7 [X] Schenker Compact 15 Intel Core i7-9750H 2.6GHz
GeForce GTX 1660 Ti Mobile
min:
71 fps
fps
80%
GeForce GTX 1050 Ti Mobile:
60.2 65.8 [X] MSI GE72 7RE Intel Core i7-7700HQ 2.8GHz
GeForce GTX 1050 Ti Mobile
min:
49 fps
66.4 70.4 ~ 66 fps
89%
GeForce GTX 1650 Mobile:
64.8 82.3 [X] Acer Nitro 5 Intel Core i5-9300H 2.4GHz
GeForce GTX 1650 Mobile
min:
71 fps
~ 74 fps
100%
GeForce GTX 1660 Ti Mobile:
75.1 [X] Schenker Compact 15 Intel Core i7-9750H 2.6GHz
GeForce GTX 1660 Ti Mobile
min:
66 fps
fps
68%
GeForce GTX 1050 Ti Mobile:
44.7 52 [X] MSI GE72 7RE Intel Core i7-7700HQ 2.8GHz
GeForce GTX 1050 Ti Mobile
min:
41 fps
53 55.3 ~ 51 fps
81%
GeForce GTX 1650 Mobile:
57.4 64.6 [X] Acer Nitro 5 Intel Core i5-9300H 2.4GHz
GeForce GTX 1650 Mobile
min:
57 fps
~ 61 fps
100%
GeForce GTX 1660 Ti Mobile:
72.3 [X] Schenker Compact 15 Intel Core i7-9750H 2.6GHz
GeForce GTX 1660 Ti Mobile
min:
64 fps
fps
59%
GeForce GTX 1050 Ti Mobile:
38.9 44.3 [X] MSI GE72 7RE Intel Core i7-7700HQ 2.8GHz
GeForce GTX 1050 Ti Mobile
min:
38 fps
44.4 46.3 ~ 43 fps
76%
GeForce GTX 1650 Mobile:
52.3 56.7 [X] Acer Nitro 5 Intel Core i5-9300H 2.4GHz
GeForce GTX 1650 Mobile
min:
47 fps
~ 55 fps
100%
GeForce GTX 1660 Ti Mobile:
54.7 [X] Schenker Compact 15 Intel Core i7-9750H 2.6GHz
GeForce GTX 1660 Ti Mobile
min:
48 fps
fps
54%
GeForce GTX 1050 Ti Mobile:
29.4 [X] MSI GE72 7RE Intel Core i7-7700HQ 2.8GHz
GeForce GTX 1050 Ti Mobile
min:
25 fps
fps
64%
GeForce GTX 1650 Mobile:
35.2 [X] Acer Nitro 5 Intel Core i5-9300H 2.4GHz
GeForce GTX 1650 Mobile
min:
31 fps
fps
100%
GeForce GTX 1660 Ti Mobile:
20.5 [X] Schenker Compact 15 Intel Core i7-9750H 2.6GHz
GeForce GTX 1660 Ti Mobile
min:
18 fps
fps
73%
GeForce GTX 1050 Ti Mobile:
15 [X] MSI GE72 7RE Intel Core i7-7700HQ 2.8GHz
GeForce GTX 1050 Ti Mobile
min:
13 fps
fps
54%
GeForce GTX 1650 Mobile:
11.1 [X] Acer Nitro 5 Intel Core i5-9300H 2.4GHz
GeForce GTX 1650 Mobile
min:
9 fps
fps
GeForce GTX 1050 Ti Mobile:
65.8 118.6 ~ 92 fps
GeForce GTX 1650 Mobile:
75.3 83.7 ~ 80 fps
100%
GeForce GTX 1660 Ti Mobile:
111 [X] Schenker Compact 15 Intel Core i7-9750H 2.6GHz
GeForce GTX 1660 Ti Mobile
min:
82 fps
fps
53%
GeForce GTX 1050 Ti Mobile:
53.2 64.4 ~ 59 fps
59%
GeForce GTX 1650 Mobile:
54.2 60.4 84.4 [X] Acer Nitro 5 Intel Core i5-9300H 2.4GHz
GeForce GTX 1650 Mobile
min:
64 fps
~ 66 fps
100%
GeForce GTX 1660 Ti Mobile:
101 [X] Schenker Compact 15 Intel Core i7-9750H 2.6GHz
GeForce GTX 1660 Ti Mobile
min:
74 fps
104 ~ 103 fps
48%
GeForce GTX 1050 Ti Mobile:
44.5 53.3 ~ 49 fps
58%
GeForce GTX 1650 Mobile:
51.3 57.7 59.6 59.7 71.5 [X] Acer Nitro 5 Intel Core i5-9300H 2.4GHz
GeForce GTX 1650 Mobile
min:
56 fps
~ 60 fps
100%
GeForce GTX 1660 Ti Mobile:
93.2 [X] Schenker Compact 15 Intel Core i7-9750H 2.6GHz
GeForce GTX 1660 Ti Mobile
min:
73 fps
95.7 ~ 94 fps
48%
GeForce GTX 1050 Ti Mobile:
39.5 42.4 [X] MSI GE72 7RE Intel Core i7-7700HQ 2.8GHz
GeForce GTX 1050 Ti Mobile
min:
31 fps
52 ~ 45 fps
60%
GeForce GTX 1650 Mobile:
44.3 54.3 58.5 58.5 64.8 [X] Acer Nitro 5 Intel Core i5-9300H 2.4GHz
GeForce GTX 1650 Mobile
min:
51 fps
~ 56 fps
100%
GeForce GTX 1660 Ti Mobile:
68.7 [X] Schenker Compact 15 Intel Core i7-9750H 2.6GHz
GeForce GTX 1660 Ti Mobile
min:
54 fps
fps
42%
GeForce GTX 1050 Ti Mobile:
28.6 [X] MSI GE72 7RE Intel Core i7-7700HQ 2.8GHz
GeForce GTX 1050 Ti Mobile
min:
20 fps
fps
69%
GeForce GTX 1650 Mobile:
47.3 [X] Acer Nitro 5 Intel Core i5-9300H 2.4GHz
GeForce GTX 1650 Mobile
min:
37 fps
fps
100%
GeForce GTX 1660 Ti Mobile:
38.3 [X] Schenker Compact 15 Intel Core i7-9750H 2.6GHz
GeForce GTX 1660 Ti Mobile
min:
30 fps
fps
64%
GeForce GTX 1650 Mobile:
24.6 [X] Acer Nitro 5 Intel Core i5-9300H 2.4GHz
GeForce GTX 1650 Mobile
min:
17 fps
fps
GeForce GTX 1050 Ti Mobile:
161 [X] MSI GE72 7RE Intel Core i7-7700HQ 2.8GHz
GeForce GTX 1050 Ti Mobile
min:
146 fps
163.1 ~ 162 fps
100%
GeForce GTX 1660 Ti Mobile:
182 [X] Schenker Compact 15 Intel Core i7-9750H 2.6GHz
GeForce GTX 1660 Ti Mobile
min:
159 fps
fps
66%
GeForce GTX 1050 Ti Mobile:
118 [X] MSI GE72 7RE Intel Core i7-7700HQ 2.8GHz
GeForce GTX 1050 Ti Mobile
min:
109 fps
124.8 ~ 121 fps
86%
GeForce GTX 1650 Mobile:
157 [X] Acer Nitro 5 Intel Core i5-9300H 2.4GHz
GeForce GTX 1650 Mobile
min:
142 fps
fps
100%
GeForce GTX 1660 Ti Mobile:
145 [X] Schenker Compact 15 Intel Core i7-9750H 2.6GHz
GeForce GTX 1660 Ti Mobile
min:
126 fps
fps
54%
GeForce GTX 1050 Ti Mobile:
77.3 [X] MSI GE72 7RE Intel Core i7-7700HQ 2.8GHz
GeForce GTX 1050 Ti Mobile
min:
68 fps
79.1 ~ 78 fps
68%
GeForce GTX 1650 Mobile:
98.4 [X] Acer Nitro 5 Intel Core i5-9300H 2.4GHz
GeForce GTX 1650 Mobile
min:
83 fps
fps
100%
GeForce GTX 1660 Ti Mobile:
113 [X] Schenker Compact 15 Intel Core i7-9750H 2.6GHz
GeForce GTX 1660 Ti Mobile
min:
91 fps
fps
53%
GeForce GTX 1050 Ti Mobile:
59.3 [X] MSI GE72 7RE Intel Core i7-7700HQ 2.8GHz
GeForce GTX 1050 Ti Mobile
min:
50 fps
60.1 ~ 60 fps
66%
GeForce GTX 1650 Mobile:
74.3 [X] Acer Nitro 5 Intel Core i5-9300H 2.4GHz
GeForce GTX 1650 Mobile
min:
58 fps
fps
100%
GeForce GTX 1660 Ti Mobile:
77.8 [X] Schenker Compact 15 Intel Core i7-9750H 2.6GHz
GeForce GTX 1660 Ti Mobile
min:
62 fps
fps
50%
GeForce GTX 1050 Ti Mobile:
38.9 [X] MSI GE72 7RE Intel Core i7-7700HQ 2.8GHz
GeForce GTX 1050 Ti Mobile
min:
32 fps
fps
61%
GeForce GTX 1650 Mobile:
47.6 [X] Acer Nitro 5 Intel Core i5-9300H 2.4GHz
GeForce GTX 1650 Mobile
min:
28 fps
fps
100%
GeForce GTX 1660 Ti Mobile:
41.1 [X] Schenker Compact 15 Intel Core i7-9750H 2.6GHz
GeForce GTX 1660 Ti Mobile
min:
32 fps
fps
GeForce GTX 1050 Ti Mobile:
60 fps
GeForce GTX 1050 Ti Mobile:
50.3 fps
GeForce GTX 1050 Ti Mobile:
44.1 48.4 [X] MSI GE72 7RE-046 Intel Core i7-7700HQ 2.8GHz
GeForce GTX 1050 Ti Mobile
min:
32 fps, max:
57 fps
~ 46 fps
GeForce GTX 1050 Ti Mobile:
43.1 45.3 [X] MSI GE72 7RE-046 Intel Core i7-7700HQ 2.8GHz
GeForce GTX 1050 Ti Mobile
min:
33 fps, max:
52 fps
~ 44 fps
100%
GeForce GTX 1660 Ti Mobile:
89 [X] Schenker Compact 15 Intel Core i7-9750H 2.6GHz
GeForce GTX 1660 Ti Mobile
min:
73 fps
fps
49%
GeForce GTX 1050 Ti Mobile:
39 [X] MSI GE72 7RE-046 Intel Core i7-7700HQ 2.8GHz
GeForce GTX 1050 Ti Mobile
min:
29 fps, max:
49 fps
43.1 49.4 ~ 44 fps
75%
GeForce GTX 1650 Mobile:
66.4 [X] Acer Nitro 5 Intel Core i5-9300H 2.4GHz
GeForce GTX 1650 Mobile
min:
50 fps
fps
100%
GeForce GTX 1660 Ti Mobile:
82.2 [X] Schenker Compact 15 Intel Core i7-9750H 2.6GHz
GeForce GTX 1660 Ti Mobile
min:
68 fps
fps
73%
GeForce GTX 1650 Mobile:
60.1 [X] Acer Nitro 5 Intel Core i5-9300H 2.4GHz
GeForce GTX 1650 Mobile
min:
45 fps
fps
100%
GeForce GTX 1660 Ti Mobile:
78.1 [X] Schenker Compact 15 Intel Core i7-9750H 2.6GHz
GeForce GTX 1660 Ti Mobile
min:
59 fps
fps
72%
GeForce GTX 1650 Mobile:
55.9 [X] Acer Nitro 5 Intel Core i5-9300H 2.4GHz
GeForce GTX 1650 Mobile
min:
44 fps
fps
100%
GeForce GTX 1660 Ti Mobile:
54.5 [X] Schenker Compact 15 Intel Core i7-9750H 2.6GHz
GeForce GTX 1660 Ti Mobile
min:
45 fps
fps
68%
GeForce GTX 1650 Mobile:
36.9 [X] Acer Nitro 5 Intel Core i5-9300H 2.4GHz
GeForce GTX 1650 Mobile
min:
31 fps
fps
100%
GeForce GTX 1660 Ti Mobile:
26.6 [X] Schenker Compact 15 Intel Core i7-9750H 2.6GHz
GeForce GTX 1660 Ti Mobile
min:
22 fps
fps
65%
GeForce GTX 1650 Mobile:
17.4 [X] Acer Nitro 5 Intel Core i5-9300H 2.4GHz
GeForce GTX 1650 Mobile
min:
14 fps
fps
GeForce GTX 1650 Mobile:
121.6 fps
100%
GeForce GTX 1660 Ti Mobile:
129 [X] Schenker Compact 15 Intel Core i7-9750H 2.6GHz
GeForce GTX 1660 Ti Mobile
min:
87 fps
fps
38%
GeForce GTX 1050 Ti Mobile:
45.4 [X] Medion Erazer P6705-MD61131 Intel Core i7-8750H 2.2GHz
GeForce GTX 1050 Ti Mobile
47.6 48.4 52.9 ~ 49 fps
63%
GeForce GTX 1650 Mobile:
78.4 83.2 [X] Acer Nitro 5 Intel Core i5-9300H 2.4GHz
GeForce GTX 1650 Mobile
min:
62 fps
~ 81 fps
100%
GeForce GTX 1660 Ti Mobile:
112 [X] Schenker Compact 15 Intel Core i7-9750H 2.6GHz
GeForce GTX 1660 Ti Mobile
min:
84 fps
fps
42%
GeForce GTX 1050 Ti Mobile:
40.7 [X] Medion Erazer P6705-MD61131 Intel Core i7-8750H 2.2GHz
GeForce GTX 1050 Ti Mobile
47.5 52.3 ~ 47 fps
64%
GeForce GTX 1650 Mobile:
71.6 [X] Acer Nitro 5 Intel Core i5-9300H 2.4GHz
GeForce GTX 1650 Mobile
min:
53 fps
72.6 ~ 72 fps
100%
GeForce GTX 1660 Ti Mobile:
105 [X] Schenker Compact 15 Intel Core i7-9750H 2.6GHz
GeForce GTX 1660 Ti Mobile
min:
79 fps
fps
39%
GeForce GTX 1050 Ti Mobile:
35.5 [X] MSI GE72 7RE-046 Intel Core i7-7700HQ 2.8GHz
GeForce GTX 1050 Ti Mobile
min:
26 fps, max:
45 fps
37.7 [X] Medion Erazer P6705-MD61131 Intel Core i7-8750H 2.2GHz
GeForce GTX 1050 Ti Mobile
44 47.7 ~ 41 fps
65%
GeForce GTX 1650 Mobile:
67.8 [X] Acer Nitro 5 Intel Core i5-9300H 2.4GHz
GeForce GTX 1650 Mobile
min:
50 fps
68.8 ~ 68 fps
100%
GeForce GTX 1660 Ti Mobile:
66 [X] Schenker Compact 15 Intel Core i7-9750H 2.6GHz
GeForce GTX 1660 Ti Mobile
min:
50 fps
fps
65%
GeForce GTX 1650 Mobile:
43.1 [X] Acer Nitro 5 Intel Core i5-9300H 2.4GHz
GeForce GTX 1650 Mobile
min:
33 fps
fps
100%
GeForce GTX 1660 Ti Mobile:
30.8 [X] Schenker Compact 15 Intel Core i7-9750H 2.6GHz
GeForce GTX 1660 Ti Mobile
min:
22 fps
fps
33%
GeForce GTX 1050 Ti Mobile:
10.2 [X] MSI GE72 7RE-046 Intel Core i7-7700HQ 2.8GHz
GeForce GTX 1050 Ti Mobile
min:
5 fps, max:
15 fps
fps
67%
GeForce GTX 1650 Mobile:
20.5 [X] Acer Nitro 5 Intel Core i5-9300H 2.4GHz
GeForce GTX 1650 Mobile
min:
14 fps
fps
GeForce GTX 1050 Ti Mobile:
57 75 77 [X] MSI GE72 7RE-046 Intel Core i7-7700HQ 2.8GHz
GeForce GTX 1050 Ti Mobile
min:
27 fps, max:
130 fps
~ 70 fps
GeForce GTX 1650 Mobile:
45 61 [X] Asus TUF FX705DT-AU068T Dual-Channel
AMD Ryzen 5 3550H 2.1GHz
GeForce GTX 1650 Mobile
71 ~ 59 fps
100%
GeForce GTX 1660 Ti Mobile:
80 [X] Schenker Compact 15 Intel Core i7-9750H 2.6GHz
GeForce GTX 1660 Ti Mobile
min:
37 fps
fps
55%
GeForce GTX 1050 Ti Mobile:
39 [X] Medion Erazer P6705-MD61131 Intel Core i7-8750H 2.2GHz
GeForce GTX 1050 Ti Mobile
41 [X] MSI GE72 7RE-046 Intel Core i7-7700HQ 2.8GHz
GeForce GTX 1050 Ti Mobile
min:
25 fps, max:
63 fps
44 51 ~ 44 fps
68%
GeForce GTX 1650 Mobile:
38 54 [X] Asus TUF FX705DT-AU068T Dual-Channel
AMD Ryzen 5 3550H 2.1GHz
GeForce GTX 1650 Mobile
56 66 [X] Acer Nitro 5 Intel Core i5-9300H 2.4GHz
GeForce GTX 1650 Mobile
min:
35 fps
~ 54 fps
100%
GeForce GTX 1660 Ti Mobile:
69 [X] Schenker Compact 15 Intel Core i7-9750H 2.6GHz
GeForce GTX 1660 Ti Mobile
min:
25 fps
fps
55%
GeForce GTX 1050 Ti Mobile:
31 [X] MSI GE72 7RE-046 Intel Core i7-7700HQ 2.8GHz
GeForce GTX 1050 Ti Mobile
min:
18 fps, max:
47 fps
34 [X] Medion Erazer P6705-MD61131 Intel Core i7-8750H 2.2GHz
GeForce GTX 1050 Ti Mobile
40 45 ~ 38 fps
67%
GeForce GTX 1650 Mobile:
35 47 [X] Asus TUF FX705DT-AU068T Dual-Channel
AMD Ryzen 5 3550H 2.1GHz
GeForce GTX 1650 Mobile
48 53 [X] Acer Nitro 5 Intel Core i5-9300H 2.4GHz
GeForce GTX 1650 Mobile
min:
28 fps
~ 46 fps
100%
GeForce GTX 1660 Ti Mobile:
47 [X] Schenker Compact 15 Intel Core i7-9750H 2.6GHz
GeForce GTX 1660 Ti Mobile
min:
23 fps
59 [X] presample NVIDIA GeForce GTX 1660 Ti (Laptop) GeForce GTX 1660 Ti Mobile
~ 53 fps
45%
GeForce GTX 1050 Ti Mobile:
17 [X] MSI GE72 7RE-046 Intel Core i7-7700HQ 2.8GHz
GeForce GTX 1050 Ti Mobile
min:
7 fps, max:
88 fps
19 [X] Medion Erazer P6705-MD61131 Intel Core i7-8750H 2.2GHz
GeForce GTX 1050 Ti Mobile
27 34 ~ 24 fps
58%
GeForce GTX 1650 Mobile:
22 28 [X] Asus TUF FX705DT-AU068T Dual-Channel
AMD Ryzen 5 3550H 2.1GHz
GeForce GTX 1650 Mobile
30 34 [X] Acer Nitro 5 Intel Core i5-9300H 2.4GHz
GeForce GTX 1650 Mobile
min:
21 fps
43 [X] presample NVIDIA GeForce GTX 1650 (Laptop) GeForce GTX 1650 Mobile
~ 31 fps
100%
GeForce GTX 1660 Ti Mobile:
36 [X] Schenker Compact 15 Intel Core i7-9750H 2.6GHz
GeForce GTX 1660 Ti Mobile
min:
21 fps
fps
61%
GeForce GTX 1650 Mobile:
22 [X] Acer Nitro 5 Intel Core i5-9300H 2.4GHz
GeForce GTX 1650 Mobile
min:
14 fps
fps
100%
GeForce GTX 1660 Ti Mobile:
22 [X] Schenker Compact 15 Intel Core i7-9750H 2.6GHz
GeForce GTX 1660 Ti Mobile
min:
14 fps
fps
55%
GeForce GTX 1650 Mobile:
12 [X] Acer Nitro 5 Intel Core i5-9300H 2.4GHz
GeForce GTX 1650 Mobile
min:
7 fps
fps
100%
GeForce GTX 1660 Ti Mobile:
161 fps
76%
GeForce GTX 1050 Ti Mobile:
122 [X] MSI GE72 7RE-046 Intel Core i7-7700HQ 2.8GHz
GeForce GTX 1050 Ti Mobile
min:
115 fps, max:
162 fps
fps
60%
GeForce GTX 1650 Mobile:
84 110 ~ 97 fps
100%
GeForce GTX 1660 Ti Mobile:
134 fps
46%
GeForce GTX 1050 Ti Mobile:
61 [X] Medion Erazer P6705-MD61131 Intel Core i7-8750H 2.2GHz
GeForce GTX 1050 Ti Mobile
62 [X] MSI GE72 7RE-046 Intel Core i7-7700HQ 2.8GHz
GeForce GTX 1050 Ti Mobile
min:
52 fps, max:
78 fps
~ 62 fps
61%
GeForce GTX 1650 Mobile:
64 100 ~ 82 fps
100%
GeForce GTX 1660 Ti Mobile:
125 fps
46%
GeForce GTX 1050 Ti Mobile:
55 [X] MSI GE72 7RE-046 Intel Core i7-7700HQ 2.8GHz
GeForce GTX 1050 Ti Mobile
min:
45 fps, max:
65 fps
58 [X] Medion Erazer P6705-MD61131 Intel Core i7-8750H 2.2GHz
GeForce GTX 1050 Ti Mobile
~ 57 fps
64%
GeForce GTX 1650 Mobile:
65 95 ~ 80 fps
100%
GeForce GTX 1660 Ti Mobile:
99 fps
43%
GeForce GTX 1050 Ti Mobile:
40 [X] MSI GE72 7RE-046 Intel Core i7-7700HQ 2.8GHz
GeForce GTX 1050 Ti Mobile
min:
17 fps, max:
52 fps
46 [X] Medion Erazer P6705-MD61131 Intel Core i7-8750H 2.2GHz
GeForce GTX 1050 Ti Mobile
~ 43 fps
63%
GeForce GTX 1650 Mobile:
48 75 ~ 62 fps
GeForce GTX 1050 Ti Mobile:
192 [X] MSI GE72 7RE-046 Intel Core i7-7700HQ 2.8GHz
GeForce GTX 1050 Ti Mobile
min:
171 fps, max:
214 fps
fps
GeForce GTX 1650 Mobile:
104 [X] Asus TUF FX505DT AMD Ryzen 7 3750H 2.3GHz
GeForce GTX 1650 Mobile
min:
46 fps, P1:
47.2 fps, max:
126 fps
fps
100%
GeForce GTX 1660 Ti Mobile:
304 [X] Schenker Compact 15 Intel Core i7-9750H 2.6GHz
GeForce GTX 1660 Ti Mobile
min:
283 fps
fps
48%
GeForce GTX 1050 Ti Mobile:
121 [X] Medion Erazer P6705-MD61131 Intel Core i7-8750H 2.2GHz
GeForce GTX 1050 Ti Mobile
169 [X] MSI GE72 7RE-046 Intel Core i7-7700HQ 2.8GHz
GeForce GTX 1050 Ti Mobile
min:
139 fps, max:
186 fps
~ 145 fps
55%
GeForce GTX 1650 Mobile:
97 [X] Asus TUF FX505DT AMD Ryzen 7 3750H 2.3GHz
GeForce GTX 1650 Mobile
min:
47 fps, P1:
47.72 fps, max:
109 fps
234 [X] Acer Nitro 5 Intel Core i5-9300H 2.4GHz
GeForce GTX 1650 Mobile
min:
217 fps
~ 166 fps
100%
GeForce GTX 1660 Ti Mobile:
256 [X] Schenker Compact 15 Intel Core i7-9750H 2.6GHz
GeForce GTX 1660 Ti Mobile
min:
237 fps
fps
53%
GeForce GTX 1050 Ti Mobile:
115 [X] Medion Erazer P6705-MD61131 Intel Core i7-8750H 2.2GHz
GeForce GTX 1050 Ti Mobile
157 [X] MSI GE72 7RE-046 Intel Core i7-7700HQ 2.8GHz
GeForce GTX 1050 Ti Mobile
min:
125 fps, max:
181 fps
~ 136 fps
58%
GeForce GTX 1650 Mobile:
94 [X] Asus TUF FX505DT AMD Ryzen 7 3750H 2.3GHz
GeForce GTX 1650 Mobile
min:
88 fps, P1:
88.67 fps, max:
102 fps
201 [X] Acer Nitro 5 Intel Core i5-9300H 2.4GHz
GeForce GTX 1650 Mobile
min:
174 fps
~ 148 fps
100%
GeForce GTX 1660 Ti Mobile:
248 [X] Schenker Compact 15 Intel Core i7-9750H 2.6GHz
GeForce GTX 1660 Ti Mobile
min:
235 fps
fps
53%
GeForce GTX 1050 Ti Mobile:
113 [X] Medion Erazer P6705-MD61131 Intel Core i7-8750H 2.2GHz
GeForce GTX 1050 Ti Mobile
150 [X] MSI GE72 7RE-046 Intel Core i7-7700HQ 2.8GHz
GeForce GTX 1050 Ti Mobile
min:
116 fps, max:
177 fps
~ 132 fps
55%
GeForce GTX 1650 Mobile:
89 [X] Asus TUF FX505DT AMD Ryzen 7 3750H 2.3GHz
GeForce GTX 1650 Mobile
min:
47 fps, P1:
47 fps, max:
101 fps
183 [X] Acer Nitro 5 Intel Core i5-9300H 2.4GHz
GeForce GTX 1650 Mobile
min:
164 fps
~ 136 fps
100%
GeForce GTX 1660 Ti Mobile:
182 [X] Schenker Compact 15 Intel Core i7-9750H 2.6GHz
GeForce GTX 1660 Ti Mobile
min:
170 fps
fps
54%
GeForce GTX 1650 Mobile:
71 [X] Asus TUF FX505DT AMD Ryzen 7 3750H 2.3GHz
GeForce GTX 1650 Mobile
min:
44 fps, P1:
44 fps, max:
83 fps
127 [X] Acer Nitro 5 Intel Core i5-9300H 2.4GHz
GeForce GTX 1650 Mobile
min:
105 fps
~ 99 fps
100%
GeForce GTX 1660 Ti Mobile:
106 [X] Schenker Compact 15 Intel Core i7-9750H 2.6GHz
GeForce GTX 1660 Ti Mobile
min:
102 fps
fps
48%
GeForce GTX 1050 Ti Mobile:
51.3 [X] MSI GE72 7RE-046 Intel Core i7-7700HQ 2.8GHz
GeForce GTX 1050 Ti Mobile
min:
41 fps, max:
62 fps
fps
65%
GeForce GTX 1650 Mobile:
69.4 [X] Acer Nitro 5 Intel Core i5-9300H 2.4GHz
GeForce GTX 1650 Mobile
min:
67 fps
fps
70%
GeForce GTX 1050 Ti Mobile:
63 95 97 [X] MSI GE72 7RE-046 Intel Core i7-7700HQ 2.8GHz
GeForce GTX 1050 Ti Mobile
min:
79 fps, max:
175 fps
~ 85 fps
100%
GeForce GTX 1660 Ti Mobile:
68 79 [X] Schenker Compact 15 Intel Core i7-9750H 2.6GHz
GeForce GTX 1660 Ti Mobile
min:
53 fps
81 83 87 90 93 ~ 83 fps
47%
GeForce GTX 1050 Ti Mobile:
38 [X] MSI GE72 7RE-046 Intel Core i7-7700HQ 2.8GHz
GeForce GTX 1050 Ti Mobile
min:
30 fps, max:
63 fps
38 [X] Medion Erazer P6705-MD61131 Intel Core i7-8750H 2.2GHz
GeForce GTX 1050 Ti Mobile
39 42 ~ 39 fps
69%
GeForce GTX 1650 Mobile:
42 48 [X] Asus TUF FX505DT AMD Ryzen 7 3750H 2.3GHz
GeForce GTX 1650 Mobile
52 54 57 [X] Acer Nitro 5 Intel Core i5-9300H 2.4GHz
GeForce GTX 1650 Mobile
min:
35 fps
57 57 59 60 61 61 62 62 63 ~ 57 fps
100%
GeForce GTX 1660 Ti Mobile:
67 72 73 [X] Schenker Compact 15 Intel Core i7-9750H 2.6GHz
GeForce GTX 1660 Ti Mobile
min:
50 fps
75 79 81 82 83 ~ 77 fps
45%
GeForce GTX 1050 Ti Mobile:
31 [X] MSI GE72 7RE-046 Intel Core i7-7700HQ 2.8GHz
GeForce GTX 1050 Ti Mobile
min:
25 fps, max:
54 fps
35 [X] Medion Erazer P6705-MD61131 Intel Core i7-8750H 2.2GHz
GeForce GTX 1050 Ti Mobile
36 37 ~ 35 fps
64%
GeForce GTX 1650 Mobile:
38 44 [X] Asus TUF FX505DT AMD Ryzen 7 3750H 2.3GHz
GeForce GTX 1650 Mobile
45 46 48 48 49 51 51 51 51 52 [X] Acer Nitro 5 Intel Core i5-9300H 2.4GHz
GeForce GTX 1650 Mobile
min:
31 fps
52 52 53 ~ 49 fps
100%
GeForce GTX 1660 Ti Mobile:
62 64 65 [X] Schenker Compact 15 Intel Core i7-9750H 2.6GHz
GeForce GTX 1660 Ti Mobile
min:
43 fps
67 70 73 73 73 ~ 68 fps
43%
GeForce GTX 1050 Ti Mobile:
25 [X] MSI GE72 7RE-046 Intel Core i7-7700HQ 2.8GHz
GeForce GTX 1050 Ti Mobile
min:
19 fps, max:
48 fps
30 [X] Medion Erazer P6705-MD61131 Intel Core i7-8750H 2.2GHz
GeForce GTX 1050 Ti Mobile
31 31 ~ 29 fps
63%
GeForce GTX 1650 Mobile:
34 39 41 42 [X] Lenovo Yoga Creator 7 15IMH05 82DS000VGE Hoechstleistung
Intel Core i7-10750H 2.6GHz
GeForce GTX 1650 Mobile
43 43 44 44 44 45 45 45 46 [X] Acer Nitro 5 Intel Core i5-9300H 2.4GHz
GeForce GTX 1650 Mobile
min:
18 fps
46 [X] Nexoc GH5 515IG Leistungsmodus
Intel Core i5-10300H 2.5GHz
GeForce GTX 1650 Mobile
47 ~ 43 fps
100%
GeForce GTX 1660 Ti Mobile:
46 [X] Schenker Compact 15 Intel Core i7-9750H 2.6GHz
GeForce GTX 1660 Ti Mobile
min:
25 fps
fps
37%
GeForce GTX 1050 Ti Mobile:
17 [X] MSI GE72 7RE-046 Intel Core i7-7700HQ 2.8GHz
GeForce GTX 1050 Ti Mobile
min:
13 fps, max:
30 fps
fps
65%
GeForce GTX 1650 Mobile:
30 [X] Acer Nitro 5 Intel Core i5-9300H 2.4GHz
GeForce GTX 1650 Mobile
min:
15 fps
fps
100%
GeForce GTX 1660 Ti Mobile:
24 [X] Schenker Compact 15 Intel Core i7-9750H 2.6GHz
GeForce GTX 1660 Ti Mobile
min:
11 fps
fps
33%
GeForce GTX 1050 Ti Mobile:
8 [X] MSI GE72 7RE-046 Intel Core i7-7700HQ 2.8GHz
GeForce GTX 1050 Ti Mobile
min:
6 fps, max:
13 fps
fps
63%
GeForce GTX 1650 Mobile:
14 15 [X] Acer Nitro 5 Intel Core i5-9300H 2.4GHz
GeForce GTX 1650 Mobile
min:
7 fps
~ 15 fps
100%
GeForce GTX 1660 Ti Mobile:
292 [X] HP Omen 15-ek0456ng 1.47.22.14 D3D12
Intel Core i5-10300H 2.5GHz
GeForce GTX 1660 Ti Mobile
min:
73.9 fps, P1:
235 fps, max:
452 fps
311 ~ 302 fps
100%
GeForce GTX 1660 Ti Mobile:
144 [X] HP Omen 15-ek0456ng 1.47.22.14 D3D12
Intel Core i5-10300H 2.5GHz
GeForce GTX 1660 Ti Mobile
min:
105 fps, P1:
126 fps, max:
218 fps
150 ~ 147 fps
100%
GeForce GTX 1660 Ti Mobile:
114 [X] HP Omen 15-ek0456ng 1.47.22.14 D3D12
Intel Core i5-10300H 2.5GHz
GeForce GTX 1660 Ti Mobile
min:
57.7 fps, P1:
89.3 fps, max:
209 fps
122 ~ 118 fps
100%
GeForce GTX 1660 Ti Mobile:
97.4 [X] HP Omen 15-ek0456ng 1.47.22.14 D3D12
Intel Core i5-10300H 2.5GHz
GeForce GTX 1660 Ti Mobile
min:
46.3 fps, P1:
76.9 fps, max:
192 fps
104 ~ 101 fps
GeForce GTX 1050 Ti Mobile:
146 [X] MSI GE72 7RE-046 Intel Core i7-7700HQ 2.8GHz
GeForce GTX 1050 Ti Mobile
min:
122 fps, max:
165 fps
146 ~ 146 fps
100%
GeForce GTX 1660 Ti Mobile:
155 [X] Schenker Compact 15 Intel Core i7-9750H 2.6GHz
GeForce GTX 1660 Ti Mobile
min:
131 fps
fps
51%
GeForce GTX 1050 Ti Mobile:
71 [X] Medion Erazer P6705-MD61131 Intel Core i7-8750H 2.2GHz
GeForce GTX 1050 Ti Mobile
81 [X] MSI GE72 7RE-046 Intel Core i7-7700HQ 2.8GHz
GeForce GTX 1050 Ti Mobile
min:
72 fps, max:
90 fps
86 ~ 79 fps
75%
GeForce GTX 1650 Mobile:
117 [X] Acer Nitro 5 Intel Core i5-9300H 2.4GHz
GeForce GTX 1650 Mobile
min:
101 fps
fps
100%
GeForce GTX 1660 Ti Mobile:
126 [X] Schenker Compact 15 Intel Core i7-9750H 2.6GHz
GeForce GTX 1660 Ti Mobile
min:
112 fps
fps
48%
GeForce GTX 1050 Ti Mobile:
56 [X] Medion Erazer P6705-MD61131 Intel Core i7-8750H 2.2GHz
GeForce GTX 1050 Ti Mobile
62 [X] MSI GE72 7RE-046 Intel Core i7-7700HQ 2.8GHz
GeForce GTX 1050 Ti Mobile
min:
44 fps, max:
66 fps
63 ~ 60 fps
72%
GeForce GTX 1650 Mobile:
91 [X] Acer Nitro 5 Intel Core i5-9300H 2.4GHz
GeForce GTX 1650 Mobile
min:
69 fps
fps
100%
GeForce GTX 1660 Ti Mobile:
80 [X] Schenker Compact 15 Intel Core i7-9750H 2.6GHz
GeForce GTX 1660 Ti Mobile
min:
67 fps
fps
46%
GeForce GTX 1050 Ti Mobile:
35 [X] Medion Erazer P6705-MD61131 Intel Core i7-8750H 2.2GHz
GeForce GTX 1050 Ti Mobile
37 [X] MSI GE72 7RE-046 Intel Core i7-7700HQ 2.8GHz
GeForce GTX 1050 Ti Mobile
min:
33 fps, max:
41 fps
39 ~ 37 fps
73%
GeForce GTX 1650 Mobile:
58 [X] Acer Nitro 5 Intel Core i5-9300H 2.4GHz
GeForce GTX 1650 Mobile
min:
49 fps
fps
100%
GeForce GTX 1660 Ti Mobile:
65 [X] Schenker Compact 15 Intel Core i7-9750H 2.6GHz
GeForce GTX 1660 Ti Mobile
min:
57 fps
fps
43%
GeForce GTX 1050 Ti Mobile:
28 [X] MSI GE72 7RE-046 Intel Core i7-7700HQ 2.8GHz
GeForce GTX 1050 Ti Mobile
min:
25 fps, max:
30 fps
fps
69%
GeForce GTX 1650 Mobile:
45 [X] Acer Nitro 5 Intel Core i5-9300H 2.4GHz
GeForce GTX 1650 Mobile
min:
38 fps
fps
100%
GeForce GTX 1660 Ti Mobile:
38 [X] Schenker Compact 15 Intel Core i7-9750H 2.6GHz
GeForce GTX 1660 Ti Mobile
min:
35 fps
fps
39%
GeForce GTX 1050 Ti Mobile:
15 [X] MSI GE72 7RE-046 Intel Core i7-7700HQ 2.8GHz
GeForce GTX 1050 Ti Mobile
min:
13 fps, max:
16 fps
fps
66%
GeForce GTX 1650 Mobile:
25 [X] Acer Nitro 5 Intel Core i5-9300H 2.4GHz
GeForce GTX 1650 Mobile
min:
16 fps
fps
GeForce GTX 1050 Ti Mobile:
93 [X] MSI GE72 7RE-046 Intel Core i7-7700HQ 2.8GHz
GeForce GTX 1050 Ti Mobile
min:
80 fps, max:
103 fps
fps
100%
GeForce GTX 1660 Ti Mobile:
94.2 [X] Schenker Compact 15 Intel Core i7-9750H 2.6GHz
GeForce GTX 1660 Ti Mobile
min:
79 fps
fps
42%
GeForce GTX 1050 Ti Mobile:
38.2 [X] Medion Erazer P6705-MD61131 Intel Core i7-8750H 2.2GHz
GeForce GTX 1050 Ti Mobile
41.2 [X] MSI GE72 7RE-046 Intel Core i7-7700HQ 2.8GHz
GeForce GTX 1050 Ti Mobile
min:
36 fps, max:
48 fps
~ 40 fps
63%
GeForce GTX 1650 Mobile:
59.5 [X] Acer Nitro 5 Intel Core i5-9300H 2.4GHz
GeForce GTX 1650 Mobile
min:
48 fps
fps
100%
GeForce GTX 1660 Ti Mobile:
82.4 [X] Schenker Compact 15 Intel Core i7-9750H 2.6GHz
GeForce GTX 1660 Ti Mobile
min:
66 fps
fps
41%
GeForce GTX 1050 Ti Mobile:
32.7 [X] Medion Erazer P6705-MD61131 Intel Core i7-8750H 2.2GHz
GeForce GTX 1050 Ti Mobile
35.5 [X] MSI GE72 7RE-046 Intel Core i7-7700HQ 2.8GHz
GeForce GTX 1050 Ti Mobile
min:
28 fps, max:
46 fps
~ 34 fps
62%
GeForce GTX 1650 Mobile:
51.3 [X] Acer Nitro 5 Intel Core i5-9300H 2.4GHz
GeForce GTX 1650 Mobile
min:
41 fps
fps
100%
GeForce GTX 1660 Ti Mobile:
65.1 [X] Schenker Compact 15 Intel Core i7-9750H 2.6GHz
GeForce GTX 1660 Ti Mobile
min:
53 fps
fps
41%
GeForce GTX 1050 Ti Mobile:
25.2 [X] Medion Erazer P6705-MD61131 Intel Core i7-8750H 2.2GHz
GeForce GTX 1050 Ti Mobile
27.9 [X] MSI GE72 7RE-046 Intel Core i7-7700HQ 2.8GHz
GeForce GTX 1050 Ti Mobile
min:
22 fps, max:
36 fps
~ 27 fps
63%
GeForce GTX 1650 Mobile:
40.9 [X] Acer Nitro 5 Intel Core i5-9300H 2.4GHz
GeForce GTX 1650 Mobile
min:
33 fps
fps
100%
GeForce GTX 1660 Ti Mobile:
40.7 [X] Schenker Compact 15 Intel Core i7-9750H 2.6GHz
GeForce GTX 1660 Ti Mobile
min:
34 fps
fps
61%
GeForce GTX 1650 Mobile:
24.7 [X] Acer Nitro 5 Intel Core i5-9300H 2.4GHz
GeForce GTX 1650 Mobile
min:
20 fps
fps
100%
GeForce GTX 1660 Ti Mobile:
19.7 [X] Schenker Compact 15 Intel Core i7-9750H 2.6GHz
GeForce GTX 1660 Ti Mobile
min:
17 fps
fps
59%
GeForce GTX 1650 Mobile:
11.7 [X] Acer Nitro 5 Intel Core i5-9300H 2.4GHz
GeForce GTX 1650 Mobile
min:
8 fps
fps
GeForce GTX 1050 Ti Mobile:
60 fps
100%
GeForce GTX 1660 Ti Mobile:
60 [X] Schenker Compact 15 Intel Core i7-9750H 2.6GHz
GeForce GTX 1660 Ti Mobile
min:
59 fps
fps
85%
GeForce GTX 1050 Ti Mobile:
50.8 fps
100%
GeForce GTX 1650 Mobile:
60 [X] Acer Nitro 5 Intel Core i5-9300H 2.4GHz
GeForce GTX 1650 Mobile
min:
59 fps
fps
100%
GeForce GTX 1660 Ti Mobile:
60 [X] Schenker Compact 15 Intel Core i7-9750H 2.6GHz
GeForce GTX 1660 Ti Mobile
min:
59 fps
fps
100%
GeForce GTX 1650 Mobile:
60 [X] Acer Nitro 5 Intel Core i5-9300H 2.4GHz
GeForce GTX 1650 Mobile
min:
58 fps
fps
100%
GeForce GTX 1660 Ti Mobile:
59.9 [X] Schenker Compact 15 Intel Core i7-9750H 2.6GHz
GeForce GTX 1660 Ti Mobile
min:
54 fps
fps
90%
GeForce GTX 1650 Mobile:
53.7 [X] Acer Nitro 5 Intel Core i5-9300H 2.4GHz
GeForce GTX 1650 Mobile
min:
49 fps
fps
100%
GeForce GTX 1660 Ti Mobile:
48.6 [X] Schenker Compact 15 Intel Core i7-9750H 2.6GHz
GeForce GTX 1660 Ti Mobile
min:
44 fps
fps
59%
GeForce GTX 1050 Ti Mobile:
28.7 fps
72%
GeForce GTX 1650 Mobile:
35.2 [X] Acer Nitro 5 Intel Core i5-9300H 2.4GHz
GeForce GTX 1650 Mobile
min:
32 fps
fps
100%
GeForce GTX 1660 Ti Mobile:
24.1 [X] Schenker Compact 15 Intel Core i7-9750H 2.6GHz
GeForce GTX 1660 Ti Mobile
min:
21 fps
fps
59%
GeForce GTX 1050 Ti Mobile:
14.2 fps
72%
GeForce GTX 1650 Mobile:
17.4 [X] Acer Nitro 5 Intel Core i5-9300H 2.4GHz
GeForce GTX 1650 Mobile
min:
16 fps
fps
71%
GeForce GTX 1050 Ti Mobile:
74 81 95 [X] MSI GE72 7RE-046 Intel Core i7-7700HQ 2.8GHz
GeForce GTX 1050 Ti Mobile
min:
78 fps, max:
104 fps
~ 83 fps
69%
GeForce GTX 1650 Mobile:
54 [X] Asus TUF FX505DT AMD Ryzen 7 3750H 2.3GHz
GeForce GTX 1650 Mobile
min:
33 fps, max:
67 fps
64 74 83 [X] Asus TUF FX705DT-AU068T Dual-Channel
AMD Ryzen 5 3550H 2.1GHz
GeForce GTX 1650 Mobile
97 115 ~ 81 fps
100%
GeForce GTX 1660 Ti Mobile:
90 92 93 97 ~ 93 fps
51%
GeForce GTX 1050 Ti Mobile:
46 47 [X] MSI GE72 7RE-046 Intel Core i7-7700HQ 2.8GHz
GeForce GTX 1050 Ti Mobile
min:
41 fps, max:
60 fps
48 ~ 47 fps
61%
GeForce GTX 1650 Mobile:
48 51 [X] Asus TUF FX505DT AMD Ryzen 7 3750H 2.3GHz
GeForce GTX 1650 Mobile
min:
36 fps, max:
63 fps
59 60 [X] Asus TUF FX705DT-AU068T Dual-Channel
AMD Ryzen 5 3550H 2.1GHz
GeForce GTX 1650 Mobile
60 66 ~ 57 fps
100%
GeForce GTX 1660 Ti Mobile:
84 88 90 90 ~ 88 fps
50%
GeForce GTX 1050 Ti Mobile:
42 43 [X] MSI GE72 7RE-046 Intel Core i7-7700HQ 2.8GHz
GeForce GTX 1050 Ti Mobile
min:
36 fps, max:
56 fps
44 45 45 ~ 44 fps
60%
GeForce GTX 1650 Mobile:
48 [X] Asus TUF FX505DT AMD Ryzen 7 3750H 2.3GHz
GeForce GTX 1650 Mobile
min:
37 fps, max:
60 fps
49 49 54 56 [X] Asus TUF FX705DT-AU068T Dual-Channel
AMD Ryzen 5 3550H 2.1GHz
GeForce GTX 1650 Mobile
57 61 ~ 53 fps
100%
GeForce GTX 1660 Ti Mobile:
82 83 83 85 87 ~ 84 fps
48%
GeForce GTX 1050 Ti Mobile:
39 [X] MSI GE72 7RE-046 Intel Core i7-7700HQ 2.8GHz
GeForce GTX 1050 Ti Mobile
min:
33 fps, max:
51 fps
39 40 42 42 ~ 40 fps
61%
GeForce GTX 1650 Mobile:
44 45 [X] Asus TUF FX505DT AMD Ryzen 7 3750H 2.3GHz
GeForce GTX 1650 Mobile
min:
35 fps, max:
57 fps
46 50 53 [X] Asus TUF FX705DT-AU068T Dual-Channel
AMD Ryzen 5 3550H 2.1GHz
GeForce GTX 1650 Mobile
54 57 57 57 [X] Acer Nitro 5 AN517-41-R3FK AMD Ryzen 7 5800H 3.2GHz
GeForce GTX 1650 Mobile
~ 51 fps
100%
GeForce GTX 1660 Ti Mobile:
60 fps
43%
GeForce GTX 1050 Ti Mobile:
25 [X] MSI GE72 7RE-046 Intel Core i7-7700HQ 2.8GHz
GeForce GTX 1050 Ti Mobile
min:
21 fps, max:
33 fps
27 ~ 26 fps
58%
GeForce GTX 1650 Mobile:
35 [X] Asus TUF FX505DT AMD Ryzen 7 3750H 2.3GHz
GeForce GTX 1650 Mobile
min:
29 fps, max:
42 fps
fps
100%
GeForce GTX 1660 Ti Mobile:
31 fps
39%
GeForce GTX 1050 Ti Mobile:
12 [X] MSI GE72 7RE-046 Intel Core i7-7700HQ 2.8GHz
GeForce GTX 1050 Ti Mobile
min:
10 fps, max:
15 fps
fps
58%
GeForce GTX 1650 Mobile:
18 [X] Asus TUF FX505DT AMD Ryzen 7 3750H 2.3GHz
GeForce GTX 1650 Mobile
min:
8 fps, max:
22 fps
fps
100%
GeForce GTX 1660 Ti Mobile:
559 fps
100%
GeForce GTX 1660 Ti Mobile:
247.6 fps
100%
GeForce GTX 1660 Ti Mobile:
119.3 fps
61%
GeForce GTX 1650 Mobile:
69.5 77 ~ 73 fps
84%
GeForce GTX 1650 Mobile:
56.9 59.3 61.1 72 73 75.6 [X] Lenovo Yoga Creator 7 15IMH05 82DS000VGE Akkusparmodus
Intel Core i7-10750H 2.6GHz
GeForce GTX 1650 Mobile
75.7 78 82.8 84.8 [X] HP Omen 15-dc1020ng Dual-Channel-Modus
Intel Core i5-9300H 2.4GHz
GeForce GTX 1650 Mobile
90 93.7 95.1 [X] Acer Nitro 5 AN517-41-R3FK AMD Ryzen 7 5800H 3.2GHz
GeForce GTX 1650 Mobile
95.2 97 100 [X] Lenovo Yoga Creator 7 15IMH05 82DS000VGE Hoechstleistung
Intel Core i7-10750H 2.6GHz
GeForce GTX 1650 Mobile
107 [X] MSI GP75 Leopard 9SC Intel Core i7-9750H 2.6GHz
GeForce GTX 1650 Mobile
107 [X] Acer Nitro 5 AN517-41-R3FK AMD Ryzen 7 5800H 3.2GHz
GeForce GTX 1650 Mobile
~ 84 fps
81%
GeForce GTX 1650 Mobile:
50.5 54.4 54.8 61 61.8 62 65.1 66.7 [X] Lenovo Yoga Creator 7 15IMH05 82DS000VGE Akkusparmodus
Intel Core i7-10750H 2.6GHz
GeForce GTX 1650 Mobile
68 73.2 [X] HP Omen 15-dc1020ng Dual-Channel-Modus
Intel Core i5-9300H 2.4GHz
GeForce GTX 1650 Mobile
74.1 79.6 80.4 [X] Acer Nitro 5 AN517-41-R3FK AMD Ryzen 7 5800H 3.2GHz
GeForce GTX 1650 Mobile
83.3 84.6 85.4 [X] Lenovo Yoga Creator 7 15IMH05 82DS000VGE Hoechstleistung
Intel Core i7-10750H 2.6GHz
GeForce GTX 1650 Mobile
92.8 [X] MSI GP75 Leopard 9SC Intel Core i7-9750H 2.6GHz
GeForce GTX 1650 Mobile
93.6 [X] Acer Nitro 5 AN517-41-R3FK AMD Ryzen 7 5800H 3.2GHz
GeForce GTX 1650 Mobile
~ 72 fps
83%
GeForce GTX 1650 Mobile:
44.5 49.3 49.4 52.9 54.1 55 57.4 58 [X] Lenovo Yoga Creator 7 15IMH05 82DS000VGE Akkusparmodus
Intel Core i7-10750H 2.6GHz
GeForce GTX 1650 Mobile
59.2 64.7 [X] HP Omen 15-dc1020ng Dual-Channel-Modus
Intel Core i5-9300H 2.4GHz
GeForce GTX 1650 Mobile
64.8 67.1 67.8 68.6 [X] Acer Nitro 5 AN517-41-R3FK AMD Ryzen 7 5800H 3.2GHz
GeForce GTX 1650 Mobile
70 71.6 [X] Lenovo Yoga Creator 7 15IMH05 82DS000VGE Hoechstleistung
Intel Core i7-10750H 2.6GHz
GeForce GTX 1650 Mobile
75.5 [X] Acer Nitro 5 AN517-41-R3FK AMD Ryzen 7 5800H 3.2GHz
GeForce GTX 1650 Mobile
77.3 [X] MSI GP75 Leopard 9SC Intel Core i7-9750H 2.6GHz
GeForce GTX 1650 Mobile
~ 62 fps
GeForce GTX 1050 Ti Mobile:
33.8 45.3 ~ 40 fps
GeForce GTX 1650 Mobile:
76.1 [X] Acer Nitro 5 AN517-41-R3FK AMD Ryzen 7 5800H 3.2GHz
GeForce GTX 1650 Mobile
fps
GeForce GTX 1050 Ti Mobile:
107 [X] MSI GE72 7RE-046 Intel Core i7-7700HQ 2.8GHz
GeForce GTX 1050 Ti Mobile
min:
84 fps, max:
122 fps
fps
100%
GeForce GTX 1660 Ti Mobile:
97.8 [X] Schenker Compact 15 Intel Core i7-9750H 2.6GHz
GeForce GTX 1660 Ti Mobile
min:
82 fps
fps
51%
GeForce GTX 1050 Ti Mobile:
49.5 [X] MSI GE72 7RE-046 Intel Core i7-7700HQ 2.8GHz
GeForce GTX 1050 Ti Mobile
min:
42 fps, max:
55 fps
fps
68%
GeForce GTX 1650 Mobile:
66.2 [X] Acer Nitro 5 Intel Core i5-9300H 2.4GHz
GeForce GTX 1650 Mobile
min:
53 fps
fps
100%
GeForce GTX 1660 Ti Mobile:
76.8 [X] Schenker Compact 15 Intel Core i7-9750H 2.6GHz
GeForce GTX 1660 Ti Mobile
min:
61 fps
fps
69%
GeForce GTX 1650 Mobile:
53 [X] Acer Nitro 5 Intel Core i5-9300H 2.4GHz
GeForce GTX 1650 Mobile
min:
44 fps
fps
100%
GeForce GTX 1660 Ti Mobile:
57.2 [X] Schenker Compact 15 Intel Core i7-9750H 2.6GHz
GeForce GTX 1660 Ti Mobile
min:
45 fps
fps
69%
GeForce GTX 1650 Mobile:
39.7 [X] Acer Nitro 5 Intel Core i5-9300H 2.4GHz
GeForce GTX 1650 Mobile
min:
32 fps
fps
100%
GeForce GTX 1660 Ti Mobile:
36.4 [X] Schenker Compact 15 Intel Core i7-9750H 2.6GHz
GeForce GTX 1660 Ti Mobile
min:
30 fps
fps
47%
GeForce GTX 1050 Ti Mobile:
16.9 [X] MSI GE72 7RE-046 Intel Core i7-7700HQ 2.8GHz
GeForce GTX 1050 Ti Mobile
min:
13 fps, max:
20 fps
17.9 ~ 17 fps
68%
GeForce GTX 1650 Mobile:
24.6 [X] Acer Nitro 5 Intel Core i5-9300H 2.4GHz
GeForce GTX 1650 Mobile
min:
21 fps
fps
100%
GeForce GTX 1660 Ti Mobile:
18.3 [X] Schenker Compact 15 Intel Core i7-9750H 2.6GHz
GeForce GTX 1660 Ti Mobile
min:
16 fps
fps
33%
GeForce GTX 1050 Ti Mobile:
6 [X] MSI GE72 7RE-046 Intel Core i7-7700HQ 2.8GHz
GeForce GTX 1050 Ti Mobile
min:
3 fps, max:
9 fps
fps
63%
GeForce GTX 1650 Mobile:
11.6 [X] Acer Nitro 5 Intel Core i5-9300H 2.4GHz
GeForce GTX 1650 Mobile
min:
10 fps
fps
51%
GeForce GTX 1050 Ti Mobile:
57.6 74 [X] MSI GE72 7RE-046 Intel Core i7-7700HQ 2.8GHz
GeForce GTX 1050 Ti Mobile
min:
54 fps, max:
94 fps
~ 66 fps
100%
GeForce GTX 1660 Ti Mobile:
78.1 79.9 80.5 [X] Schenker Compact 15 Intel Core i7-9750H 2.6GHz
GeForce GTX 1660 Ti Mobile
min:
36 fps
81.4 87.6 ~ 82 fps
61%
GeForce GTX 1650 Mobile:
47.7 49.1 50.2 51.2 [X] Acer Nitro 5 Intel Core i5-9300H 2.4GHz
GeForce GTX 1650 Mobile
min:
12 fps
52.4 ~ 50 fps
100%
GeForce GTX 1660 Ti Mobile:
55.4 57.2 58.7 [X] Schenker Compact 15 Intel Core i7-9750H 2.6GHz
GeForce GTX 1660 Ti Mobile
min:
34 fps
59.9 63.9 ~ 59 fps
59%
GeForce GTX 1650 Mobile:
31.8 33.6 35.4 35.9 37.2 [X] Acer Nitro 5 Intel Core i5-9300H 2.4GHz
GeForce GTX 1650 Mobile
min:
10 fps
37.6 ~ 35 fps
GeForce GTX 1650 Mobile:
22.9 26.6 ~ 25 fps
100%
GeForce GTX 1660 Ti Mobile:
24 [X] Schenker Compact 15 Intel Core i7-9750H 2.6GHz
GeForce GTX 1660 Ti Mobile
min:
16 fps
fps
58%
GeForce GTX 1650 Mobile:
12.5 13.8 [X] Acer Nitro 5 Intel Core i5-9300H 2.4GHz
GeForce GTX 1650 Mobile
min:
5 fps
15.5 [X] Acer Nitro 5 AN517-41-R3FK 1.3
AMD Ryzen 7 5800H 3.2GHz
GeForce GTX 1650 Mobile
~ 14 fps
100%
GeForce GTX 1660 Ti Mobile:
107 [X] MSI GP65 Leopard 9SD Intel Core i7-9750H 2.6GHz
GeForce GTX 1660 Ti Mobile
min:
95 fps
fps
68%
GeForce GTX 1650 Mobile:
72.3 [X] MSI GP75 Leopard 9SC Intel Core i7-9750H 2.6GHz
GeForce GTX 1650 Mobile
min:
51 fps
fps
100%
GeForce GTX 1660 Ti Mobile:
69.3 [X] MSI GP65 Leopard 9SD Intel Core i7-9750H 2.6GHz
GeForce GTX 1660 Ti Mobile
min:
66 fps
fps
46%
GeForce GTX 1050 Ti Mobile:
28.8 [X] MSI GE72 7RE-046 Intel Core i7-7700HQ 2.8GHz
GeForce GTX 1050 Ti Mobile
min:
25 fps, max:
33 fps
34.8 ~ 32 fps
64%
GeForce GTX 1650 Mobile:
44.1 [X] MSI GP75 Leopard 9SC Intel Core i7-9750H 2.6GHz
GeForce GTX 1650 Mobile
min:
40 fps
fps
GeForce GTX 1050 Ti Mobile:
8.8 [X] MSI GE72 7RE-046 Intel Core i7-7700HQ 2.8GHz
GeForce GTX 1050 Ti Mobile
min:
7 fps, max:
10 fps
fps
GeForce GTX 1050 Ti Mobile:
135 [X] MSI GE72 7RE-046 Intel Core i7-7700HQ 2.8GHz
GeForce GTX 1050 Ti Mobile
min:
104 fps, max:
162 fps
fps
100%
GeForce GTX 1660 Ti Mobile:
110 [X] Schenker Compact 15 Intel Core i7-9750H 2.6GHz
GeForce GTX 1660 Ti Mobile
min:
103 fps
fps
68%
GeForce GTX 1050 Ti Mobile:
75 [X] MSI GE72 7RE-046 Intel Core i7-7700HQ 2.8GHz
GeForce GTX 1050 Ti Mobile
min:
61 fps, max:
83 fps
fps
69%
GeForce GTX 1650 Mobile:
75.7 [X] Acer Nitro 5 Intel Core i5-9300H 2.4GHz
GeForce GTX 1650 Mobile
min:
69 fps
fps
100%
GeForce GTX 1660 Ti Mobile:
95.4 [X] Schenker Compact 15 Intel Core i7-9750H 2.6GHz
GeForce GTX 1660 Ti Mobile
min:
90 fps
fps
61%
GeForce GTX 1050 Ti Mobile:
50.3 58.3 65 [X] MSI GE72 7RE-046 Intel Core i7-7700HQ 2.8GHz
GeForce GTX 1050 Ti Mobile
min:
58 fps, max:
72 fps
~ 58 fps
69%
GeForce GTX 1650 Mobile:
66.2 [X] Acer Nitro 5 Intel Core i5-9300H 2.4GHz
GeForce GTX 1650 Mobile
min:
60 fps
fps
100%
GeForce GTX 1660 Ti Mobile:
82.8 [X] Schenker Compact 15 Intel Core i7-9750H 2.6GHz
GeForce GTX 1660 Ti Mobile
min:
75 fps
fps
51%
GeForce GTX 1050 Ti Mobile:
40.8 41.4 43 [X] MSI GE72 7RE-046 Intel Core i7-7700HQ 2.8GHz
GeForce GTX 1050 Ti Mobile
min:
40 fps, max:
46 fps
~ 42 fps
69%
GeForce GTX 1650 Mobile:
56.8 [X] Acer Nitro 5 Intel Core i5-9300H 2.4GHz
GeForce GTX 1650 Mobile
min:
51 fps
fps
100%
GeForce GTX 1660 Ti Mobile:
54.7 [X] Schenker Compact 15 Intel Core i7-9750H 2.6GHz
GeForce GTX 1660 Ti Mobile
min:
51 fps
fps
42%
GeForce GTX 1050 Ti Mobile:
19.5 [X] MSI GE72 7RE-046 Intel Core i7-7700HQ 2.8GHz
GeForce GTX 1050 Ti Mobile
min:
12 fps, max:
27 fps
26 ~ 23 fps
65%
GeForce GTX 1650 Mobile:
35.6 [X] Acer Nitro 5 Intel Core i5-9300H 2.4GHz
GeForce GTX 1650 Mobile
min:
31 fps
fps
100%
GeForce GTX 1660 Ti Mobile:
27.1 [X] Schenker Compact 15 Intel Core i7-9750H 2.6GHz
GeForce GTX 1660 Ti Mobile
min:
19 fps
fps
21%
GeForce GTX 1050 Ti Mobile:
5.7 [X] MSI GE72 7RE-046 Intel Core i7-7700HQ 2.8GHz
GeForce GTX 1050 Ti Mobile
min:
3 fps, max:
9 fps
fps
39%
GeForce GTX 1650 Mobile:
10.5 [X] Acer Nitro 5 Intel Core i5-9300H 2.4GHz
GeForce GTX 1650 Mobile
min:
8 fps
fps
GeForce GTX 1050 Ti Mobile:
115 [X] MSI GE72 7RE-046 Intel Core i7-7700HQ 2.8GHz
GeForce GTX 1050 Ti Mobile
min:
85 fps, max:
169 fps
fps
100%
GeForce GTX 1660 Ti Mobile:
127 [X] Schenker Compact 15 Intel Core i7-9750H 2.6GHz
GeForce GTX 1660 Ti Mobile
min:
89 fps
fps
52%
GeForce GTX 1050 Ti Mobile:
66 [X] MSI GE72 7RE-046 Intel Core i7-7700HQ 2.8GHz
GeForce GTX 1050 Ti Mobile
min:
37 fps, max:
85 fps
fps
73%
GeForce GTX 1650 Mobile:
92.1 [X] Acer Nitro 5 Intel Core i5-9300H 2.4GHz
GeForce GTX 1650 Mobile
min:
62 fps
fps
100%
GeForce GTX 1660 Ti Mobile:
113 [X] Schenker Compact 15 Intel Core i7-9750H 2.6GHz
GeForce GTX 1660 Ti Mobile
min:
79 fps
fps
69%
GeForce GTX 1650 Mobile:
77.6 [X] Acer Nitro 5 Intel Core i5-9300H 2.4GHz
GeForce GTX 1650 Mobile
min:
53 fps
fps
100%
GeForce GTX 1660 Ti Mobile:
106 [X] Schenker Compact 15 Intel Core i7-9750H 2.6GHz
GeForce GTX 1660 Ti Mobile
min:
72 fps
fps
70%
GeForce GTX 1650 Mobile:
74 [X] Acer Nitro 5 Intel Core i5-9300H 2.4GHz
GeForce GTX 1650 Mobile
min:
51 fps
fps
100%
GeForce GTX 1660 Ti Mobile:
72.7 [X] Schenker Compact 15 Intel Core i7-9750H 2.6GHz
GeForce GTX 1660 Ti Mobile
min:
50 fps
fps
44%
GeForce GTX 1050 Ti Mobile:
30.3 [X] MSI GE72 7RE-046 Intel Core i7-7700HQ 2.8GHz
GeForce GTX 1050 Ti Mobile
min:
18 fps, max:
37 fps
34 ~ 32 fps
65%
GeForce GTX 1650 Mobile:
47.5 [X] Acer Nitro 5 Intel Core i5-9300H 2.4GHz
GeForce GTX 1650 Mobile
min:
33 fps
fps
100%
GeForce GTX 1660 Ti Mobile:
37.1 [X] Schenker Compact 15 Intel Core i7-9750H 2.6GHz
GeForce GTX 1660 Ti Mobile
min:
26 fps
fps
26%
GeForce GTX 1050 Ti Mobile:
9.7 [X] MSI GE72 7RE-046 Intel Core i7-7700HQ 2.8GHz
GeForce GTX 1050 Ti Mobile
min:
6 fps, max:
13 fps
fps
63%
GeForce GTX 1650 Mobile:
23.4 [X] Acer Nitro 5 Intel Core i5-9300H 2.4GHz
GeForce GTX 1650 Mobile
min:
16 fps
fps
GeForce GTX 1050 Ti Mobile:
191 [X] MSI GE72 7RE-046 Intel Core i7-7700HQ 2.8GHz
GeForce GTX 1050 Ti Mobile
min:
130 fps, max:
268 fps
fps
GeForce GTX 1050 Ti Mobile:
129 fps
GeForce GTX 1050 Ti Mobile:
63.4 67.8 [X] MSI GE72 7RE-046 Intel Core i7-7700HQ 2.8GHz
GeForce GTX 1050 Ti Mobile
min:
53 fps, max:
81 fps
69 ~ 67 fps
GeForce GTX 1050 Ti Mobile:
30.8 [X] MSI GE72 7RE-046 Intel Core i7-7700HQ 2.8GHz
GeForce GTX 1050 Ti Mobile
min:
19 fps, max:
39 fps
39.9 ~ 35 fps
GeForce GTX 1050 Ti Mobile:
18.9 [X] MSI GE72 7RE-046 Intel Core i7-7700HQ 2.8GHz
GeForce GTX 1050 Ti Mobile
min:
12 fps, max:
24 fps
fps
GeForce GTX 1050 Ti Mobile:
44.3 52.5 ~ 48 fps
GeForce GTX 1050 Ti Mobile:
23.2 fps
GeForce GTX 1050 Ti Mobile:
49 77 [X] MSI GE72 7RE-046 Intel Core i7-7700HQ 2.8GHz
GeForce GTX 1050 Ti Mobile
min:
31 fps, max:
116 fps
~ 63 fps
GeForce GTX 1050 Ti Mobile:
42 45 [X] MSI GE72 7RE-046 Intel Core i7-7700HQ 2.8GHz
GeForce GTX 1050 Ti Mobile
min:
14 fps, max:
72 fps
~ 44 fps
GeForce GTX 1050 Ti Mobile:
38 [X] MSI GE72 7RE-046 Intel Core i7-7700HQ 2.8GHz
GeForce GTX 1050 Ti Mobile
min:
22 fps, max:
58 fps
39 43 ~ 40 fps
GeForce GTX 1050 Ti Mobile:
28 [X] MSI GE72 7RE-046 Intel Core i7-7700HQ 2.8GHz
GeForce GTX 1050 Ti Mobile
min:
14 fps, max:
42 fps
33 36 ~ 32 fps
GeForce GTX 1050 Ti Mobile:
20 26 ~ 23 fps
GeForce GTX 1050 Ti Mobile:
4 fps
GeForce GTX 1050 Ti Mobile:
116 fps
GeForce GTX 1650 Mobile:
85.4 fps
GeForce GTX 1050 Ti Mobile:
65.5 fps
GeForce GTX 1650 Mobile:
75.1 fps
GeForce GTX 1650 Mobile:
72.7 fps
GeForce GTX 1650 Mobile:
62.4 fps
GeForce GTX 1050 Ti Mobile:
26.1 fps
GeForce GTX 1050 Ti Mobile:
17.8 [X] MSI GE72 7RE-046 Intel Core i7-7700HQ 2.8GHz
GeForce GTX 1050 Ti Mobile
min:
16 fps, max:
20 fps
fps
GeForce GTX 1050 Ti Mobile:
102 [X] MSI GE72 7RE-046 Intel Core i7-7700HQ 2.8GHz
GeForce GTX 1050 Ti Mobile
min:
92 fps, max:
114 fps
fps
100%
GeForce GTX 1660 Ti Mobile:
113 [X] Schenker Compact 15 Intel Core i7-9750H 2.6GHz
GeForce GTX 1660 Ti Mobile
min:
107 fps
fps
46%
GeForce GTX 1050 Ti Mobile:
52.2 [X] MSI GE72 7RE-046 Intel Core i7-7700HQ 2.8GHz
GeForce GTX 1050 Ti Mobile
min:
48 fps, max:
58 fps
fps
67%
GeForce GTX 1650 Mobile:
75.6 [X] Acer Nitro 5 Intel Core i5-9300H 2.4GHz
GeForce GTX 1650 Mobile
min:
70 fps
fps
100%
GeForce GTX 1660 Ti Mobile:
90 [X] Schenker Compact 15 Intel Core i7-9750H 2.6GHz
GeForce GTX 1660 Ti Mobile
min:
85 fps
fps
65%
GeForce GTX 1650 Mobile:
58.8 [X] Acer Nitro 5 Intel Core i5-9300H 2.4GHz
GeForce GTX 1650 Mobile
min:
54 fps
fps
100%
GeForce GTX 1660 Ti Mobile:
70.4 [X] Schenker Compact 15 Intel Core i7-9750H 2.6GHz
GeForce GTX 1660 Ti Mobile
min:
65 fps
fps
47%
GeForce GTX 1050 Ti Mobile:
31 [X] MSI GE72 7RE-046 Intel Core i7-7700HQ 2.8GHz
GeForce GTX 1050 Ti Mobile
min:
25 fps, max:
35 fps
32.7 34.3 ~ 33 fps
64%
GeForce GTX 1650 Mobile:
45.2 [X] Acer Nitro 5 Intel Core i5-9300H 2.4GHz
GeForce GTX 1650 Mobile
min:
41 fps
fps
100%
GeForce GTX 1660 Ti Mobile:
45.7 [X] Schenker Compact 15 Intel Core i7-9750H 2.6GHz
GeForce GTX 1660 Ti Mobile
min:
43 fps
fps
46%
GeForce GTX 1050 Ti Mobile:
19.6 [X] MSI GE72 7RE-046 Intel Core i7-7700HQ 2.8GHz
GeForce GTX 1050 Ti Mobile
min:
17 fps, max:
22 fps
21.8 ~ 21 fps
63%
GeForce GTX 1650 Mobile:
28.8 [X] Acer Nitro 5 Intel Core i5-9300H 2.4GHz
GeForce GTX 1650 Mobile
min:
26 fps
fps
100%
GeForce GTX 1660 Ti Mobile:
23.8 [X] Schenker Compact 15 Intel Core i7-9750H 2.6GHz
GeForce GTX 1660 Ti Mobile
min:
22 fps
fps
28%
GeForce GTX 1050 Ti Mobile:
6.6 [X] MSI GE72 7RE-046 Intel Core i7-7700HQ 2.8GHz
GeForce GTX 1050 Ti Mobile
min:
5 fps, max:
8 fps
fps
61%
GeForce GTX 1650 Mobile:
14.6 [X] Acer Nitro 5 Intel Core i5-9300H 2.4GHz
GeForce GTX 1650 Mobile
min:
13 fps
fps
GeForce GTX 1050 Ti Mobile:
61.8 [X] MSI GE72 7RE-046 Intel Core i7-7700HQ 2.8GHz
GeForce GTX 1050 Ti Mobile
min:
54 fps, max:
70 fps
fps
GeForce GTX 1050 Ti Mobile:
36.1 [X] MSI GE72 7RE-046 Intel Core i7-7700HQ 2.8GHz
GeForce GTX 1050 Ti Mobile
min:
23 fps, max:
40 fps
fps
GeForce GTX 1050 Ti Mobile:
30.7 30.7 31 [X] MSI GE72 7RE-046 Intel Core i7-7700HQ 2.8GHz
GeForce GTX 1050 Ti Mobile
min:
27 fps, max:
34 fps
~ 31 fps
GeForce GTX 1050 Ti Mobile:
2 fps
GeForce GTX 1050 Ti Mobile:
95 121 [X] MSI GE72 7RE-046 Intel Core i7-7700HQ 2.8GHz
GeForce GTX 1050 Ti Mobile
min:
54 fps, max:
148 fps
~ 108 fps
100%
GeForce GTX 1660 Ti Mobile:
121 [X] Schenker Compact 15 Intel Core i7-9750H 2.6GHz
GeForce GTX 1660 Ti Mobile
min:
32 fps
fps
50%
GeForce GTX 1050 Ti Mobile:
57 60 62 [X] MSI GE72 7RE-046 Intel Core i7-7700HQ 2.8GHz
GeForce GTX 1050 Ti Mobile
min:
36 fps, max:
97 fps
~ 60 fps
63%
GeForce GTX 1650 Mobile:
76 [X] Acer Nitro 5 Intel Core i5-9300H 2.4GHz
GeForce GTX 1650 Mobile
fps
100%
GeForce GTX 1660 Ti Mobile:
89 [X] Schenker Compact 15 Intel Core i7-9750H 2.6GHz
GeForce GTX 1660 Ti Mobile
min:
31 fps
fps
49%
GeForce GTX 1050 Ti Mobile:
43 [X] MSI GE72 7RE-046 Intel Core i7-7700HQ 2.8GHz
GeForce GTX 1050 Ti Mobile
min:
11 fps, max:
63 fps
43 44 44 ~ 44 fps
64%
GeForce GTX 1650 Mobile:
57 [X] Acer Nitro 5 Intel Core i5-9300H 2.4GHz
GeForce GTX 1650 Mobile
fps
100%
GeForce GTX 1660 Ti Mobile:
69 [X] Schenker Compact 15 Intel Core i7-9750H 2.6GHz
GeForce GTX 1660 Ti Mobile
min:
29 fps
fps
48%
GeForce GTX 1050 Ti Mobile:
29 [X] MSI GE72 7RE-046 Intel Core i7-7700HQ 2.8GHz
GeForce GTX 1050 Ti Mobile
min:
5 fps, max:
77 fps
33 33 37 ~ 33 fps
62%
GeForce GTX 1650 Mobile:
43 [X] Acer Nitro 5 Intel Core i5-9300H 2.4GHz
GeForce GTX 1650 Mobile
fps
100%
GeForce GTX 1660 Ti Mobile:
28 [X] Schenker Compact 15 Intel Core i7-9750H 2.6GHz
GeForce GTX 1660 Ti Mobile
min:
19 fps
fps
43%
GeForce GTX 1050 Ti Mobile:
12 [X] MSI GE72 7RE-046 Intel Core i7-7700HQ 2.8GHz
GeForce GTX 1050 Ti Mobile
min:
3 fps, max:
67 fps
fps
64%
GeForce GTX 1650 Mobile:
18 [X] Acer Nitro 5 Intel Core i5-9300H 2.4GHz
GeForce GTX 1650 Mobile
fps
GeForce GTX 1050 Ti Mobile:
293 fps
GeForce GTX 1050 Ti Mobile:
232.4 fps
GeForce GTX 1050 Ti Mobile:
188.6 205 ~ 197 fps
GeForce GTX 1050 Ti Mobile:
149 [X] MSI GE72 7RE-046 Intel Core i7-7700HQ 2.8GHz
GeForce GTX 1050 Ti Mobile
min:
111 fps, max:
159 fps
156.8 194 ~ 167 fps
GeForce GTX 1050 Ti Mobile:
62.3 [X] MSI GE72 7RE-046 Intel Core i7-7700HQ 2.8GHz
GeForce GTX 1050 Ti Mobile
min:
49 fps, max:
67 fps
fps
GeForce GTX 1050 Ti Mobile:
89 [X] MSI GE72 7RE-046 Intel Core i7-7700HQ 2.8GHz
GeForce GTX 1050 Ti Mobile
min:
55 fps, max:
99 fps
94.9 ~ 92 fps
GeForce GTX 1050 Ti Mobile:
31.3 31.6 [X] MSI GE72 7RE-046 Intel Core i7-7700HQ 2.8GHz
GeForce GTX 1050 Ti Mobile
min:
30 fps, max:
33 fps
~ 31 fps
GeForce GTX 1050 Ti Mobile:
21.8 [X] MSI GE72 7RE-046 Intel Core i7-7700HQ 2.8GHz
GeForce GTX 1050 Ti Mobile
min:
20 fps, max:
23 fps
22.7 ~ 22 fps
GeForce GTX 1050 Ti Mobile:
14.6 fps
GeForce GTX 1050 Ti Mobile:
178 184 ~ 181 fps
GeForce GTX 1050 Ti Mobile:
90 91 ~ 91 fps
GeForce GTX 1050 Ti Mobile:
66 [X] MSI GE72 7RE-046 Intel Core i7-7700HQ 2.8GHz
GeForce GTX 1050 Ti Mobile
min:
53 fps, max:
74 fps
70 71 ~ 69 fps
GeForce GTX 1050 Ti Mobile:
40 [X] MSI GE72 7RE-046 Intel Core i7-7700HQ 2.8GHz
GeForce GTX 1050 Ti Mobile
min:
36 fps, max:
43 fps
44 44 ~ 43 fps
GeForce GTX 1050 Ti Mobile:
16 [X] MSI GE72 7RE-046 Intel Core i7-7700HQ 2.8GHz
GeForce GTX 1050 Ti Mobile
min:
14 fps, max:
18 fps
fps
GeForce GTX 1050 Ti Mobile:
126 fps
GeForce GTX 1050 Ti Mobile:
54.1 [X] MSI GE72 7RE-046 Intel Core i7-7700HQ 2.8GHz
GeForce GTX 1050 Ti Mobile
min:
44 fps, max:
63 fps
58.8 ~ 56 fps
100%
GeForce GTX 1660 Ti Mobile:
109 [X] MSI GP65 Leopard 9SD Intel Core i7-9750H 2.6GHz
GeForce GTX 1660 Ti Mobile
min:
89 fps
fps
36%
GeForce GTX 1050 Ti Mobile:
35.9 41.4 ~ 39 fps
65%
GeForce GTX 1650 Mobile:
70.7 [X] MSI GP75 Leopard 9SC Intel Core i7-9750H 2.6GHz
GeForce GTX 1650 Mobile
min:
57 fps
fps
GeForce GTX 1650 Mobile:
92 fps
GeForce GTX 1650 Mobile:
85 fps
GeForce GTX 1650 Mobile:
77 fps
GeForce GTX 1050 Ti Mobile:
105 fps
GeForce GTX 1650 Mobile:
75 fps
GeForce GTX 1050 Ti Mobile:
74.4 fps
GeForce GTX 1050 Ti Mobile:
249.9 fps
GeForce GTX 1050 Ti Mobile:
114.5 fps
GeForce GTX 1050 Ti Mobile:
59.6 74.2 [X] MSI GE72 7RE-046 Intel Core i7-7700HQ 2.8GHz
GeForce GTX 1050 Ti Mobile
min:
53 fps, max:
87 fps
~ 67 fps
GeForce GTX 1050 Ti Mobile:
36.1 39.2 [X] MSI GE72 7RE-046 Intel Core i7-7700HQ 2.8GHz
GeForce GTX 1050 Ti Mobile
min:
34 fps, max:
49 fps
41 ~ 39 fps
100%
GeForce GTX 1660 Ti Mobile:
248 fps
100%
GeForce GTX 1050 Ti Mobile:
247.6 fps
100%
GeForce GTX 1660 Ti Mobile:
247 249 [X] Schenker Compact 15 Intel Core i7-9750H 2.6GHz
GeForce GTX 1660 Ti Mobile
min:
203 fps
~ 248 fps
72%
GeForce GTX 1050 Ti Mobile:
178.5 fps
76%
GeForce GTX 1650 Mobile:
152.5 162.5 188.7 198.5 204 229 [X] Acer Nitro 5 Intel Core i5-9300H 2.4GHz
GeForce GTX 1650 Mobile
min:
185 fps
~ 189 fps
100%
GeForce GTX 1660 Ti Mobile:
209 [X] Schenker Compact 15 Intel Core i7-9750H 2.6GHz
GeForce GTX 1660 Ti Mobile
min:
174 fps
221 ~ 215 fps
63%
GeForce GTX 1650 Mobile:
96.4 127.5 136 137.2 150 [X] Acer Nitro 5 Intel Core i5-9300H 2.4GHz
GeForce GTX 1650 Mobile
min:
124 fps
162.2 ~ 135 fps
100%
GeForce GTX 1660 Ti Mobile:
89.9 [X] Schenker Compact 15 Intel Core i7-9750H 2.6GHz
GeForce GTX 1660 Ti Mobile
min:
76 fps
fps
68%
GeForce GTX 1050 Ti Mobile:
61 [X] MSI GE72 7RE-046 Intel Core i7-7700HQ 2.8GHz
GeForce GTX 1050 Ti Mobile
min:
52 fps, max:
76 fps
fps
52%
GeForce GTX 1650 Mobile:
41.1 53.1 [X] Acer Nitro 5 Intel Core i5-9300H 2.4GHz
GeForce GTX 1650 Mobile
min:
45 fps
~ 47 fps
100%
GeForce GTX 1660 Ti Mobile:
144 [X] Schenker Compact 15 Intel Core i7-9750H 2.6GHz
GeForce GTX 1660 Ti Mobile
min:
133 fps
fps
88%
GeForce GTX 1650 Mobile:
127 [X] Acer Nitro 5 Intel Core i5-9300H 2.4GHz
GeForce GTX 1650 Mobile
min:
90 fps
fps
100%
GeForce GTX 1660 Ti Mobile:
143 [X] Schenker Compact 15 Intel Core i7-9750H 2.6GHz
GeForce GTX 1660 Ti Mobile
min:
126 fps
fps
72%
GeForce GTX 1650 Mobile:
103 [X] Acer Nitro 5 Intel Core i5-9300H 2.4GHz
GeForce GTX 1650 Mobile
min:
87 fps
fps
100%
GeForce GTX 1660 Ti Mobile:
127 [X] Schenker Compact 15 Intel Core i7-9750H 2.6GHz
GeForce GTX 1660 Ti Mobile
min:
101 fps
fps
67%
GeForce GTX 1650 Mobile:
84.7 [X] Acer Nitro 5 Intel Core i5-9300H 2.4GHz
GeForce GTX 1650 Mobile
min:
66 fps
fps
100%
GeForce GTX 1660 Ti Mobile:
44.1 [X] Schenker Compact 15 Intel Core i7-9750H 2.6GHz
GeForce GTX 1660 Ti Mobile
min:
36 fps
fps
66%
GeForce GTX 1650 Mobile:
29 [X] Acer Nitro 5 Intel Core i5-9300H 2.4GHz
GeForce GTX 1650 Mobile
min:
25 fps
fps
GeForce GTX 1050 Ti Mobile:
92.8 112 [X] MSI GE72 7RE-046 Intel Core i7-7700HQ 2.8GHz
GeForce GTX 1050 Ti Mobile
min:
62 fps, max:
207 fps
~ 102 fps
GeForce GTX 1050 Ti Mobile:
45.8 46.6 [X] MSI GE72 7RE-046 Intel Core i7-7700HQ 2.8GHz
GeForce GTX 1050 Ti Mobile
min:
35 fps, max:
70 fps
~ 46 fps
GeForce GTX 1050 Ti Mobile:
29.5 29.8 [X] MSI GE72 7RE-046 Intel Core i7-7700HQ 2.8GHz
GeForce GTX 1050 Ti Mobile
min:
23 fps, max:
45 fps
~ 30 fps
GeForce GTX 1050 Ti Mobile:
25.5 25.8 [X] MSI GE72 7RE-046 Intel Core i7-7700HQ 2.8GHz
GeForce GTX 1050 Ti Mobile
min:
20 fps, max:
38 fps
~ 26 fps
GeForce GTX 1050 Ti Mobile:
0 (!) [X] MSI GE72 7RE-046 Intel Core i7-7700HQ 2.8GHz
GeForce GTX 1050 Ti Mobile
fps
GeForce GTX 1050 Ti Mobile:
65.5 105 [X] MSI GE72 7RE-046 Intel Core i7-7700HQ 2.8GHz
GeForce GTX 1050 Ti Mobile
min:
88 fps, max:
135 fps
~ 85 fps
GeForce GTX 1050 Ti Mobile:
50.2 [X] MSI GE72 7RE-046 Intel Core i7-7700HQ 2.8GHz
GeForce GTX 1050 Ti Mobile
min:
42 fps, max:
68 fps
52.5 ~ 51 fps
GeForce GTX 1050 Ti Mobile:
27.9 [X] MSI GE72 7RE-046 Intel Core i7-7700HQ 2.8GHz
GeForce GTX 1050 Ti Mobile
min:
23 fps, max:
41 fps
35.8 ~ 32 fps
GeForce GTX 1050 Ti Mobile:
23 [X] MSI GE72 7RE-046 Intel Core i7-7700HQ 2.8GHz
GeForce GTX 1050 Ti Mobile
min:
18 fps, max:
34 fps
31.4 ~ 27 fps
100%
GeForce GTX 1660 Ti Mobile:
150.6 fps
66%
GeForce GTX 1050 Ti Mobile:
90.4 99.3 106 [X] MSI GE72 7RE-046 Intel Core i7-7700HQ 2.8GHz
GeForce GTX 1050 Ti Mobile
min:
88 fps, max:
118 fps
~ 99 fps
100%
GeForce GTX 1660 Ti Mobile:
84.7 [X] Schenker Compact 15 Intel Core i7-9750H 2.6GHz
GeForce GTX 1660 Ti Mobile
min:
71 fps
88.7 ~ 87 fps
72%
GeForce GTX 1650 Mobile:
62.8 [X] Acer Nitro 5 Intel Core i5-9300H 2.4GHz
GeForce GTX 1650 Mobile
min:
52 fps
fps
100%
GeForce GTX 1660 Ti Mobile:
78.5 [X] Schenker Compact 15 Intel Core i7-9750H 2.6GHz
GeForce GTX 1660 Ti Mobile
min:
67 fps
82.6 ~ 81 fps
71%
GeForce GTX 1650 Mobile:
57.3 [X] Acer Nitro 5 Intel Core i5-9300H 2.4GHz
GeForce GTX 1650 Mobile
min:
47 fps
fps
100%
GeForce GTX 1660 Ti Mobile:
45.4 [X] Schenker Compact 15 Intel Core i7-9750H 2.6GHz
GeForce GTX 1660 Ti Mobile
min:
36 fps
47.8 ~ 47 fps
66%
GeForce GTX 1650 Mobile:
31.2 [X] Acer Nitro 5 Intel Core i5-9300H 2.4GHz
GeForce GTX 1650 Mobile
min:
27 fps
fps
100%
GeForce GTX 1660 Ti Mobile:
28.9 [X] Schenker Compact 15 Intel Core i7-9750H 2.6GHz
GeForce GTX 1660 Ti Mobile
min:
22 fps
fps
62%
GeForce GTX 1650 Mobile:
17.9 [X] Acer Nitro 5 Intel Core i5-9300H 2.4GHz
GeForce GTX 1650 Mobile
min:
14 fps
fps
100%
GeForce GTX 1660 Ti Mobile:
237.2 245.1 ~ 241 fps
65%
GeForce GTX 1050 Ti Mobile:
152.6 159.8 ~ 156 fps
100%
GeForce GTX 1660 Ti Mobile:
126 [X] Schenker Compact 15 Intel Core i7-9750H 2.6GHz
GeForce GTX 1660 Ti Mobile
min:
96 fps
126.1 128.6 ~ 127 fps
49%
GeForce GTX 1050 Ti Mobile:
44.8 65.5 65.8 [X] Nexoc G739 Intel Core i7-7700HQ 2.8GHz
GeForce GTX 1050 Ti Mobile
66.2 (!) [X] MSI GE72 7RE-046 Intel Core i7-7700HQ 2.8GHz
GeForce GTX 1050 Ti Mobile
min:
53 fps, max:
83 fps
69.9 ~ 62 fps
64%
GeForce GTX 1650 Mobile:
81.5 [X] Acer Nitro 5 Intel Core i5-9300H 2.4GHz
GeForce GTX 1650 Mobile
min:
61 fps
fps
100%
GeForce GTX 1660 Ti Mobile:
120 [X] Schenker Compact 15 Intel Core i7-9750H 2.6GHz
GeForce GTX 1660 Ti Mobile
min:
90 fps
120.4 121.5 ~ 121 fps
64%
GeForce GTX 1650 Mobile:
77.4 [X] Acer Nitro 5 Intel Core i5-9300H 2.4GHz
GeForce GTX 1650 Mobile
min:
54 fps
fps
100%
GeForce GTX 1660 Ti Mobile:
92.6 [X] Schenker Compact 15 Intel Core i7-9750H 2.6GHz
GeForce GTX 1660 Ti Mobile
min:
64 fps
92.6 93.1 ~ 93 fps
65%
GeForce GTX 1650 Mobile:
60.1 [X] Acer Nitro 5 Intel Core i5-9300H 2.4GHz
GeForce GTX 1650 Mobile
min:
40 fps
fps
100%
GeForce GTX 1660 Ti Mobile:
37.8 [X] Schenker Compact 15 Intel Core i7-9750H 2.6GHz
GeForce GTX 1660 Ti Mobile
min:
28 fps
fps
62%
GeForce GTX 1650 Mobile:
23.6 [X] Acer Nitro 5 Intel Core i5-9300H 2.4GHz
GeForce GTX 1650 Mobile
min:
17 fps
fps
100%
GeForce GTX 1660 Ti Mobile:
281 [X] Schenker Compact 15 Intel Core i7-9750H 2.6GHz
GeForce GTX 1660 Ti Mobile
min:
238 fps
fps
44%
GeForce GTX 1050 Ti Mobile:
121.9 126.8 ~ 124 fps
63%
GeForce GTX 1650 Mobile:
176 [X] Acer Nitro 5 Intel Core i5-9300H 2.4GHz
GeForce GTX 1650 Mobile
min:
145 fps
fps
100%
GeForce GTX 1660 Ti Mobile:
147 [X] Schenker Compact 15 Intel Core i7-9750H 2.6GHz
GeForce GTX 1660 Ti Mobile
min:
125 fps
fps
64%
GeForce GTX 1650 Mobile:
94.8 [X] Acer Nitro 5 Intel Core i5-9300H 2.4GHz
GeForce GTX 1650 Mobile
min:
79 fps
fps
100%
GeForce GTX 1660 Ti Mobile:
122 [X] Schenker Compact 15 Intel Core i7-9750H 2.6GHz
GeForce GTX 1660 Ti Mobile
min:
105 fps
fps
65%
GeForce GTX 1650 Mobile:
78.8 [X] Acer Nitro 5 Intel Core i5-9300H 2.4GHz
GeForce GTX 1650 Mobile
min:
68 fps
fps
100%
GeForce GTX 1660 Ti Mobile:
41.1 [X] Schenker Compact 15 Intel Core i7-9750H 2.6GHz
GeForce GTX 1660 Ti Mobile
min:
34 fps
fps
62%
GeForce GTX 1650 Mobile:
25.5 [X] Acer Nitro 5 Intel Core i5-9300H 2.4GHz
GeForce GTX 1650 Mobile
min:
18 fps
fps
GeForce GTX 1050 Ti Mobile:
82.5 fps
GeForce GTX 1050 Ti Mobile:
74.3 fps
GeForce GTX 1050 Ti Mobile:
14.4 fps
GeForce GTX 1050 Ti Mobile:
87.9 fps
GeForce GTX 1050 Ti Mobile:
72.2 fps
100%
GeForce GTX 1660 Ti Mobile:
100 [X] Schenker Compact 15 Intel Core i7-9750H 2.6GHz
GeForce GTX 1660 Ti Mobile
min:
77 fps
fps
47%
GeForce GTX 1050 Ti Mobile:
46.3 47 48.7 ~ 47 fps
68%
GeForce GTX 1650 Mobile:
67.5 [X] Acer Nitro 5 Intel Core i5-9300H 2.4GHz
GeForce GTX 1650 Mobile
min:
55 fps
fps
100%
GeForce GTX 1660 Ti Mobile:
84.5 [X] Schenker Compact 15 Intel Core i7-9750H 2.6GHz
GeForce GTX 1660 Ti Mobile
min:
64 fps
fps
64%
GeForce GTX 1650 Mobile:
53.8 [X] Acer Nitro 5 Intel Core i5-9300H 2.4GHz
GeForce GTX 1650 Mobile
min:
41 fps
fps
100%
GeForce GTX 1660 Ti Mobile:
41.4 [X] Schenker Compact 15 Intel Core i7-9750H 2.6GHz
GeForce GTX 1660 Ti Mobile
min:
36 fps
fps
44%
GeForce GTX 1050 Ti Mobile:
18.2 fps
63%
GeForce GTX 1650 Mobile:
26 [X] Acer Nitro 5 Intel Core i5-9300H 2.4GHz
GeForce GTX 1650 Mobile
min:
21 fps
fps
GeForce GTX 1050 Ti Mobile:
113.8 fps
GeForce GTX 1050 Ti Mobile:
102 fps
GeForce GTX 1050 Ti Mobile:
67.4 67.8 ~ 68 fps
GeForce GTX 1050 Ti Mobile:
58.8 59 ~ 59 fps
GeForce GTX 1050 Ti Mobile:
27.4 fps
GeForce GTX 1050 Ti Mobile:
18.7 fps
GeForce GTX 1050 Ti Mobile:
169.8 fps
GeForce GTX 1050 Ti Mobile:
148.5 fps
GeForce GTX 1050 Ti Mobile:
114 116 117 ~ 116 fps
GeForce GTX 1050 Ti Mobile:
59.7 fps
GeForce GTX 1650 Mobile:
74.5 [X] Acer Nitro 5 AN517-41-R3FK AMD Ryzen 7 5800H 3.2GHz
GeForce GTX 1650 Mobile
min:
68 fps, max:
78 fps
fps
GeForce GTX 1650 Mobile:
71.1 [X] Acer Nitro 5 AN517-41-R3FK AMD Ryzen 7 5800H 3.2GHz
GeForce GTX 1650 Mobile
min:
62 fps, max:
76 fps
fps
GeForce GTX 1050 Ti Mobile:
19.8 fps
GeForce GTX 1050 Ti Mobile:
70.2 127.2 ~ 99 fps
GeForce GTX 1650 Mobile:
111.4 fps
GeForce GTX 1050 Ti Mobile:
50.1 102.2 ~ 76 fps
GeForce GTX 1650 Mobile:
83 fps
GeForce GTX 1050 Ti Mobile:
41.8 58.6 ~ 50 fps
GeForce GTX 1650 Mobile:
59.4 fps
GeForce GTX 1050 Ti Mobile:
42.4 48 ~ 45 fps
GeForce GTX 1650 Mobile:
53.7 fps
GeForce GTX 1050 Ti Mobile:
61.3 fps
GeForce GTX 1050 Ti Mobile:
44 [X] Asus GL553VE-FY022T PL Intel Core i7-7700HQ 2.8GHz
GeForce GTX 1050 Ti Mobile
44.3 50.7 [X] Saelic Veni G422 G7TPK4 Intel Core i7-7700HQ 2.8GHz
GeForce GTX 1050 Ti Mobile
~ 46 fps
GeForce GTX 1050 Ti Mobile:
28.6 28.7 31 32.5 [X] Asus GL553VE-FY022T PL Intel Core i7-7700HQ 2.8GHz
GeForce GTX 1050 Ti Mobile
34.7 [X] Saelic Veni G422 G7TPK4 Intel Core i7-7700HQ 2.8GHz
GeForce GTX 1050 Ti Mobile
~ 31 fps
GeForce GTX 1050 Ti Mobile:
9.8 fps
GeForce GTX 1050 Ti Mobile:
160 fps
GeForce GTX 1050 Ti Mobile:
155 fps
GeForce GTX 1050 Ti Mobile:
123 130 ~ 127 fps
GeForce GTX 1050 Ti Mobile:
120.4 128 ~ 124 fps
GeForce GTX 1050 Ti Mobile:
66.1 fps
GeForce GTX 1050 Ti Mobile:
99 fps
GeForce GTX 1050 Ti Mobile:
74.7 fps
100%
GeForce GTX 1660 Ti Mobile:
79.4 [X] Schenker Compact 15 Intel Core i7-9750H 2.6GHz
GeForce GTX 1660 Ti Mobile
min:
63 fps
fps
49%
GeForce GTX 1050 Ti Mobile:
38 38.3 39.8 ~ 39 fps
67%
GeForce GTX 1650 Mobile:
53.3 [X] Acer Nitro 5 Intel Core i5-9300H 2.4GHz
GeForce GTX 1650 Mobile
min:
44 fps
fps
100%
GeForce GTX 1660 Ti Mobile:
44 [X] Schenker Compact 15 Intel Core i7-9750H 2.6GHz
GeForce GTX 1660 Ti Mobile
min:
34 fps
fps
45%
GeForce GTX 1050 Ti Mobile:
19 19.7 20.3 ~ 20 fps
63%
GeForce GTX 1650 Mobile:
27.5 [X] Acer Nitro 5 Intel Core i5-9300H 2.4GHz
GeForce GTX 1650 Mobile
min:
22 fps
fps
100%
GeForce GTX 1660 Ti Mobile:
26.6 [X] Schenker Compact 15 Intel Core i7-9750H 2.6GHz
GeForce GTX 1660 Ti Mobile
min:
22 fps
fps
46%
GeForce GTX 1050 Ti Mobile:
12.3 fps
64%
GeForce GTX 1650 Mobile:
17 [X] Acer Nitro 5 Intel Core i5-9300H 2.4GHz
GeForce GTX 1650 Mobile
min:
14 fps
fps
GeForce GTX 1050 Ti Mobile:
44.6 fps
GeForce GTX 1050 Ti Mobile:
22 fps
GeForce GTX 1050 Ti Mobile:
18.1 fps
100%
GeForce GTX 1660 Ti Mobile:
101 [X] Schenker Compact 15 Intel Core i7-9750H 2.6GHz
GeForce GTX 1660 Ti Mobile
min:
96 fps
fps
68%
GeForce GTX 1650 Mobile:
68.6 [X] Acer Nitro 5 Intel Core i5-9300H 2.4GHz
GeForce GTX 1650 Mobile
min:
64 fps
fps
100%
GeForce GTX 1660 Ti Mobile:
92.4 [X] Schenker Compact 15 Intel Core i7-9750H 2.6GHz
GeForce GTX 1660 Ti Mobile
min:
82 fps
fps
66%
GeForce GTX 1650 Mobile:
61.1 [X] Acer Nitro 5 Intel Core i5-9300H 2.4GHz
GeForce GTX 1650 Mobile
min:
55 fps
fps
100%
GeForce GTX 1660 Ti Mobile:
33.7 [X] Schenker Compact 15 Intel Core i7-9750H 2.6GHz
GeForce GTX 1660 Ti Mobile
min:
31 fps
fps
48%
GeForce GTX 1050 Ti Mobile:
16.2 fps
64%
GeForce GTX 1650 Mobile:
21.5 [X] Acer Nitro 5 Intel Core i5-9300H 2.4GHz
GeForce GTX 1650 Mobile
min:
20 fps
fps
GeForce GTX 1650 Mobile:
165.2 fps
100%
GeForce GTX 1660 Ti Mobile:
225 [X] Schenker Compact 15 Intel Core i7-9750H 2.6GHz
GeForce GTX 1660 Ti Mobile
min:
182 fps
fps
62%
GeForce GTX 1650 Mobile:
133.2 147 [X] Acer Nitro 5 Intel Core i5-9300H 2.4GHz
GeForce GTX 1650 Mobile
min:
121 fps
~ 140 fps
100%
GeForce GTX 1660 Ti Mobile:
133 [X] Schenker Compact 15 Intel Core i7-9750H 2.6GHz
GeForce GTX 1660 Ti Mobile
min:
111 fps
fps
50%
GeForce GTX 1050 Ti Mobile:
58.7 71 [X] MSI GE72 7RE-046 Intel Core i7-7700HQ 2.8GHz
GeForce GTX 1050 Ti Mobile
min:
59 fps, max:
85 fps
71 ~ 67 fps
63%
GeForce GTX 1650 Mobile:
82.3 [X] Acer Nitro 5 Intel Core i5-9300H 2.4GHz
GeForce GTX 1650 Mobile
min:
64 fps
86.4 ~ 84 fps
100%
GeForce GTX 1660 Ti Mobile:
75.3 [X] Schenker Compact 15 Intel Core i7-9750H 2.6GHz
GeForce GTX 1660 Ti Mobile
min:
62 fps
fps
46%
GeForce GTX 1050 Ti Mobile:
31.4 38.3 ~ 35 fps
63%
GeForce GTX 1650 Mobile:
47.1 [X] Acer Nitro 5 Intel Core i5-9300H 2.4GHz
GeForce GTX 1650 Mobile
min:
40 fps
fps
GeForce GTX 1050 Ti Mobile:
117 fps
GeForce GTX 1050 Ti Mobile:
105.3 fps
100%
GeForce GTX 1660 Ti Mobile:
144 [X] Schenker Compact 15 Intel Core i7-9750H 2.6GHz
GeForce GTX 1660 Ti Mobile
min:
121 fps
fps
48%
GeForce GTX 1050 Ti Mobile:
68.3 69.1 ~ 69 fps
76%
GeForce GTX 1650 Mobile:
109 [X] Acer Nitro 5 Intel Core i5-9300H 2.4GHz
GeForce GTX 1650 Mobile
min:
88 fps
fps
100%
GeForce GTX 1660 Ti Mobile:
136 [X] Schenker Compact 15 Intel Core i7-9750H 2.6GHz
GeForce GTX 1660 Ti Mobile
min:
109 fps
fps
74%
GeForce GTX 1650 Mobile:
101 [X] Acer Nitro 5 Intel Core i5-9300H 2.4GHz
GeForce GTX 1650 Mobile
min:
83 fps
fps
100%
GeForce GTX 1660 Ti Mobile:
49.5 [X] Schenker Compact 15 Intel Core i7-9750H 2.6GHz
GeForce GTX 1660 Ti Mobile
min:
43 fps
fps
43%
GeForce GTX 1050 Ti Mobile:
21.2 fps
70%
GeForce GTX 1650 Mobile:
34.5 [X] Acer Nitro 5 Intel Core i5-9300H 2.4GHz
GeForce GTX 1650 Mobile
min:
30 fps
fps
GeForce GTX 1650 Mobile:
46.4 fps
GeForce GTX 1650 Mobile:
40 40.6 ~ 40 fps
GeForce GTX 1650 Mobile:
36 36.5 ~ 36 fps
GeForce GTX 1050 Ti Mobile:
60.4 fps
GeForce GTX 1050 Ti Mobile:
46.4 fps
GeForce GTX 1050 Ti Mobile:
21.3 fps
GeForce GTX 1050 Ti Mobile:
38.4 42 ~ 40 fps
GeForce GTX 1050 Ti Mobile:
36.6 41 ~ 39 fps
GeForce GTX 1050 Ti Mobile:
16.3 fps
GeForce GTX 1050 Ti Mobile:
147 fps
GeForce GTX 1050 Ti Mobile:
0 (!) 60.3 ~ 30 fps
GeForce GTX 1050 Ti Mobile:
16.6 fps
GeForce GTX 1050 Ti Mobile:
53 fps
GeForce GTX 1050 Ti Mobile:
40 fps
GeForce GTX 1050 Ti Mobile:
17 fps
GeForce GTX 1050 Ti Mobile:
37.7 fps
GeForce GTX 1050 Ti Mobile:
19 fps
GeForce GTX 1050 Ti Mobile:
10.3 fps
100%
GeForce GTX 1660 Ti Mobile:
118 156 232 ~ 169 fps
100%
GeForce GTX 1660 Ti Mobile:
116 164 166 ~ 149 fps
69%
GeForce GTX 1650 Mobile:
102.8 fps
100%
GeForce GTX 1660 Ti Mobile:
86 97.8 100 ~ 95 fps
64%
GeForce GTX 1650 Mobile:
57.8 64.4 ~ 61 fps
100%
GeForce GTX 1660 Ti Mobile:
74 81 87.4 ~ 81 fps
63%
GeForce GTX 1650 Mobile:
47.3 54.4 ~ 51 fps
100%
GeForce GTX 1660 Ti Mobile:
38 fps
42%
GeForce GTX 1050 Ti Mobile:
14.1 17.6 ~ 16 fps
53%
GeForce GTX 1650 Mobile:
20.2 fps
GeForce GTX 1050 Ti Mobile:
95.9 fps
GeForce GTX 1050 Ti Mobile:
92 fps
100%
GeForce GTX 1660 Ti Mobile:
201 [X] Schenker Compact 15 Intel Core i7-9750H 2.6GHz
GeForce GTX 1660 Ti Mobile
min:
122 fps
fps
77%
GeForce GTX 1650 Mobile:
154 [X] Acer Nitro 5 Intel Core i5-9300H 2.4GHz
GeForce GTX 1650 Mobile
min:
104 fps
fps
100%
GeForce GTX 1660 Ti Mobile:
175 [X] Schenker Compact 15 Intel Core i7-9750H 2.6GHz
GeForce GTX 1660 Ti Mobile
min:
105 fps
fps
74%
GeForce GTX 1650 Mobile:
130 [X] Acer Nitro 5 Intel Core i5-9300H 2.4GHz
GeForce GTX 1650 Mobile
min:
95 fps
fps
100%
GeForce GTX 1660 Ti Mobile:
73.3 [X] Schenker Compact 15 Intel Core i7-9750H 2.6GHz
GeForce GTX 1660 Ti Mobile
min:
43 fps
fps
39%
GeForce GTX 1050 Ti Mobile:
28.4 fps
69%
GeForce GTX 1650 Mobile:
50.3 [X] Acer Nitro 5 Intel Core i5-9300H 2.4GHz
GeForce GTX 1650 Mobile
min:
40 fps
fps
GeForce GTX 1050 Ti Mobile:
58.9 fps
GeForce GTX 1050 Ti Mobile:
52.7 fps
GeForce GTX 1050 Ti Mobile:
22.1 fps
GeForce GTX 1050 Ti Mobile:
72.4 fps
GeForce GTX 1050 Ti Mobile:
62.7 fps
GeForce GTX 1050 Ti Mobile:
22.4 fps
GeForce GTX 1050 Ti Mobile:
47.8 fps
GeForce GTX 1050 Ti Mobile:
23.5 fps
GeForce GTX 1050 Ti Mobile:
17.1 fps
GeForce GTX 1050 Ti Mobile:
108.5 fps
GeForce GTX 1050 Ti Mobile:
96.5 fps
GeForce GTX 1050 Ti Mobile:
54 56 ~ 55 fps
GeForce GTX 1050 Ti Mobile:
18.5 fps
GeForce GTX 1050 Ti Mobile:
63.7 fps
GeForce GTX 1050 Ti Mobile:
20.6 fps
GeForce GTX 1050 Ti Mobile:
24 fps
100%
GeForce GTX 1660 Ti Mobile:
220.1 fps
57%
GeForce GTX 1650 Mobile:
124.7 fps
100%
GeForce GTX 1660 Ti Mobile:
179.7 fps
59%
GeForce GTX 1650 Mobile:
105.9 fps
100%
GeForce GTX 1660 Ti Mobile:
148.2 fps
57%
GeForce GTX 1650 Mobile:
84.6 fps
100%
GeForce GTX 1660 Ti Mobile:
141.1 fps
60%
GeForce GTX 1650 Mobile:
84.2 fps
GeForce GTX 1050 Ti Mobile:
60 fps
GeForce GTX 1050 Ti Mobile:
60 fps
GeForce GTX 1050 Ti Mobile:
60 fps
GeForce GTX 1050 Ti Mobile:
60 fps
GeForce GTX 1050 Ti Mobile:
89.7 fps
GeForce GTX 1050 Ti Mobile:
82.7 fps
GeForce GTX 1050 Ti Mobile:
28.6 fps
93%
GeForce GTX 1050 Ti Mobile:
113 139 ~ 126 fps
89%
GeForce GTX 1650 Mobile:
75.8 84.1 [X] Asus TUF FX705DT-AU068T Dual-Channel
AMD Ryzen 5 3550H 2.1GHz
GeForce GTX 1650 Mobile
94.2 99.4 111 112 [X] LG Ultra 17U70N Intel Core i5-10210U 1.6GHz
GeForce GTX 1650 Mobile
min:
95.3 fps, max:
-1 fps
114 114 117 121 122.2 [X] HP Omen 15-dc1020ng Dual-Channel-Modus
Intel Core i5-9300H 2.4GHz
GeForce GTX 1650 Mobile
128 132 133.9 134 [X] Lenovo Yoga Creator 7 15IMH05 82DS000VGE Akkusparmodus
Intel Core i7-10750H 2.6GHz
GeForce GTX 1650 Mobile
min:
116.5 fps, max:
-1 fps
138 [X] Acer Nitro 5 AN517-41-R3FK AMD Ryzen 7 5800H 3.2GHz
GeForce GTX 1650 Mobile
min:
110.9 fps, max:
-1 fps
144 [X] Acer Nitro 5 AN517-41-R3FK AMD Ryzen 7 5800H 3.2GHz
GeForce GTX 1650 Mobile
min:
127.8 fps, max:
-1 fps
145 [X] MSI GP75 Leopard 9SC Intel Core i7-9750H 2.6GHz
GeForce GTX 1650 Mobile
min:
127.9 fps
146 148 [X] Lenovo Yoga Creator 7 15IMH05 82DS000VGE Hoechstleistung
Intel Core i7-10750H 2.6GHz
GeForce GTX 1650 Mobile
min:
128.3 fps, max:
-1 fps
~ 121 fps
85%
GeForce GTX 1050 Ti Mobile:
104 112.1 ~ 108 fps
86%
GeForce GTX 1650 Mobile:
69.1 78.2 [X] Asus TUF FX705DT-AU068T Dual-Channel
AMD Ryzen 5 3550H 2.1GHz
GeForce GTX 1650 Mobile
90.6 90.8 96.9 97 97.6 [X] LG Ultra 17U70N Intel Core i5-10210U 1.6GHz
GeForce GTX 1650 Mobile
min:
84.9 fps, max:
-1 fps
103 104 104.1 [X] HP Omen 15-dc1020ng Dual-Channel-Modus
Intel Core i5-9300H 2.4GHz
GeForce GTX 1650 Mobile
109 112 [X] Lenovo Yoga Creator 7 15IMH05 82DS000VGE Akkusparmodus
Intel Core i7-10750H 2.6GHz
GeForce GTX 1650 Mobile
min:
95.9 fps, max:
-1 fps
121.5 122 127 [X] Acer Nitro 5 AN517-41-R3FK AMD Ryzen 7 5800H 3.2GHz
GeForce GTX 1650 Mobile
min:
112.5 fps, max:
-1 fps
128 131 [X] Acer Nitro 5 AN517-41-R3FK AMD Ryzen 7 5800H 3.2GHz
GeForce GTX 1650 Mobile
min:
115 fps, max:
-1 fps
132 [X] MSI GP75 Leopard 9SC Intel Core i7-9750H 2.6GHz
GeForce GTX 1650 Mobile
min:
115.9 fps
132 [X] Lenovo Yoga Creator 7 15IMH05 82DS000VGE Hoechstleistung
Intel Core i7-10750H 2.6GHz
GeForce GTX 1650 Mobile
min:
115.3 fps, max:
-1 fps
136 ~ 109 fps
77%
GeForce GTX 1050 Ti Mobile:
89 94 ~ 92 fps
83%
GeForce GTX 1650 Mobile:
63.3 73.9 [X] Asus TUF FX705DT-AU068T Dual-Channel
AMD Ryzen 5 3550H 2.1GHz
GeForce GTX 1650 Mobile
79 82.2 84.9 87.5 89 92.9 [X] LG Ultra 17U70N Intel Core i5-10210U 1.6GHz
GeForce GTX 1650 Mobile
min:
79.9 fps, max:
-1 fps
93.7 94 98.5 [X] HP Omen 15-dc1020ng Dual-Channel-Modus
Intel Core i5-9300H 2.4GHz
GeForce GTX 1650 Mobile
103 [X] Lenovo Yoga Creator 7 15IMH05 82DS000VGE Akkusparmodus
Intel Core i7-10750H 2.6GHz
GeForce GTX 1650 Mobile
min:
89.6 fps, max:
-1 fps
112 112 113 [X] Acer Nitro 5 AN517-41-R3FK AMD Ryzen 7 5800H 3.2GHz
GeForce GTX 1650 Mobile
min:
99.4 fps, max:
-1 fps
113.2 121 121 [X] Lenovo Yoga Creator 7 15IMH05 82DS000VGE Hoechstleistung
Intel Core i7-10750H 2.6GHz
GeForce GTX 1650 Mobile
min:
105 fps, max:
-1 fps
123 [X] Acer Nitro 5 AN517-41-R3FK AMD Ryzen 7 5800H 3.2GHz
GeForce GTX 1650 Mobile
min:
108.6 fps, max:
-1 fps
127 [X] MSI GP75 Leopard 9SC Intel Core i7-9750H 2.6GHz
GeForce GTX 1650 Mobile
min:
113.1 fps
~ 99 fps
75%
GeForce GTX 1050 Ti Mobile:
84 88 ~ 86 fps
82%
GeForce GTX 1650 Mobile:
58.5 68.9 [X] Asus TUF FX705DT-AU068T Dual-Channel
AMD Ryzen 5 3550H 2.1GHz
GeForce GTX 1650 Mobile
73 78.4 80.8 82 85.9 87.5 88.2 [X] LG Ultra 17U70N Intel Core i5-10210U 1.6GHz
GeForce GTX 1650 Mobile
min:
75.4 fps, max:
-1 fps
89 89.9 [X] HP Omen 15-dc1020ng Dual-Channel-Modus
Intel Core i5-9300H 2.4GHz
GeForce GTX 1650 Mobile
95.7 [X] Lenovo Yoga Creator 7 15IMH05 82DS000VGE Akkusparmodus
Intel Core i7-10750H 2.6GHz
GeForce GTX 1650 Mobile
min:
83.1 fps, max:
-1 fps
106 107.5 108 [X] Acer Nitro 5 AN517-41-R3FK AMD Ryzen 7 5800H 3.2GHz
GeForce GTX 1650 Mobile
min:
95.1 fps, max:
-1 fps
108 110 111 [X] Lenovo Yoga Creator 7 15IMH05 82DS000VGE Hoechstleistung
Intel Core i7-10750H 2.6GHz
GeForce GTX 1650 Mobile
min:
92.9 fps, max:
-1 fps
117 [X] Acer Nitro 5 AN517-41-R3FK AMD Ryzen 7 5800H 3.2GHz
GeForce GTX 1650 Mobile
min:
102.4 fps, max:
-1 fps
119 [X] MSI GP75 Leopard 9SC Intel Core i7-9750H 2.6GHz
GeForce GTX 1650 Mobile
min:
104.5 fps
~ 93 fps
100%
GeForce GTX 1660 Ti Mobile:
85 fps
56%
GeForce GTX 1650 Mobile:
43.6 45 56.4 [X] Acer Nitro 5 AN517-41-R3FK AMD Ryzen 7 5800H 3.2GHz
GeForce GTX 1650 Mobile
min:
52.9 fps, max:
-1 fps
~ 48 fps
GeForce GTX 1050 Ti Mobile:
96 113 ~ 105 fps
GeForce GTX 1650 Mobile:
88 90 131 ~ 103 fps
GeForce GTX 1050 Ti Mobile:
60 [X] Asus GL553VE-FY022T PL Intel Core i7-7700HQ 2.8GHz
GeForce GTX 1050 Ti Mobile
87 95 101 105 [X] Saelic Veni G422 G7TPK4 Intel Core i7-7700HQ 2.8GHz
GeForce GTX 1050 Ti Mobile
~ 90 fps
GeForce GTX 1650 Mobile:
86 91 ~ 89 fps
GeForce GTX 1050 Ti Mobile:
33 [X] Asus GL553VE-FY022T PL Intel Core i7-7700HQ 2.8GHz
GeForce GTX 1050 Ti Mobile
50 58 60 64 65 [X] Saelic Veni G422 G7TPK4 Intel Core i7-7700HQ 2.8GHz
GeForce GTX 1050 Ti Mobile
~ 55 fps
GeForce GTX 1650 Mobile:
67 68 81 ~ 72 fps
GeForce GTX 1050 Ti Mobile:
23 [X] Asus GL553VE-FY022T PL Intel Core i7-7700HQ 2.8GHz
GeForce GTX 1050 Ti Mobile
29 36 37 41 41 41 [X] Saelic Veni G422 G7TPK4 Intel Core i7-7700HQ 2.8GHz
GeForce GTX 1050 Ti Mobile
~ 35 fps
GeForce GTX 1650 Mobile:
44 45 51 ~ 47 fps
GeForce GTX 1050 Ti Mobile:
15 19 ~ 17 fps
59%
GeForce GTX 1650 Mobile:
45 53.6 54.3 55.4 57 [X] LG Ultra 17U70N Intel Core i5-10210U 1.6GHz
GeForce GTX 1650 Mobile
min:
54 fps, max:
61 fps
57.3 [X] Asus TUF FX505DT AMD Ryzen 7 3750H 2.3GHz
GeForce GTX 1650 Mobile
min:
47 fps, P1:
47.78 fps, max:
63 fps
57.5 58 59.1 59.8 60.3 [X] Asus TUF FX705DT-AU068T Dual-Channel
AMD Ryzen 5 3550H 2.1GHz
GeForce GTX 1650 Mobile
61.1 61.4 [X] Acer Nitro 5 AN515-54-78TL Intel Core i7-9750H 2.6GHz
GeForce GTX 1650 Mobile
61.8 62.2 62.5 [X] Acer Nitro 5 Intel Core i5-9300H 2.4GHz
GeForce GTX 1650 Mobile
min:
53 fps
62.5 62.5 62.7 64.8 65.3 65.9 66 67.2 67.6 68.5 [X] Acer Nitro 5 AN517-41-R3FK AMD Ryzen 7 5800H 3.2GHz
GeForce GTX 1650 Mobile
min:
60 fps, max:
77 fps
68.9 69.5 70.4 ~ 62 fps
64%
GeForce GTX 1650 Mobile:
29.9 30 32.1 32.7 33.1 [X] Asus TUF FX505DT AMD Ryzen 7 3750H 2.3GHz
GeForce GTX 1650 Mobile
min:
26 fps, P1:
26.4 fps, max:
38 fps
33.1 [X] LG Ultra 17U70N Intel Core i5-10210U 1.6GHz
GeForce GTX 1650 Mobile
min:
30 fps, max:
37 fps
33.3 34 [X] presample NVIDIA GeForce GTX 1650 (Laptop) GeForce GTX 1650 Mobile
34.2 [X] Asus TUF FX705DT-AU068T Dual-Channel
AMD Ryzen 5 3550H 2.1GHz
GeForce GTX 1650 Mobile
34.2 34.4 34.5 35.3 35.4 35.5 [X] Acer Nitro 5 Intel Core i5-9300H 2.4GHz
GeForce GTX 1650 Mobile
min:
28 fps
35.6 [X] Acer Nitro 5 AN515-54-78TL Intel Core i7-9750H 2.6GHz
GeForce GTX 1650 Mobile
36 36.2 36.2 36.3 [X] Nexoc GH5 515IG Leistungsmodus
Intel Core i5-10300H 2.5GHz
GeForce GTX 1650 Mobile
37 37.4 37.6 37.7 37.7 38.1 38.5 38.8 39 [X] Acer Nitro 5 AN517-41-R3FK AMD Ryzen 7 5800H 3.2GHz
GeForce GTX 1650 Mobile
min:
33 fps, max:
44 fps
39.8 40.3 ~ 36 fps
100%
GeForce GTX 1660 Ti Mobile:
32.9 36.9 [X] Schenker Compact 15 Intel Core i7-9750H 2.6GHz
GeForce GTX 1660 Ti Mobile
min:
31 fps
~ 35 fps
49%
GeForce GTX 1050 Ti Mobile:
15.8 17.6 ~ 17 fps
60%
GeForce GTX 1650 Mobile:
19.6 21.9 [X] Acer Nitro 5 Intel Core i5-9300H 2.4GHz
GeForce GTX 1650 Mobile
min:
19 fps
~ 21 fps
GeForce GTX 1050 Ti Mobile:
93.4 fps
GeForce GTX 1050 Ti Mobile:
65.7 fps
GeForce GTX 1050 Ti Mobile:
57.8 fps
100%
GeForce GTX 1660 Ti Mobile:
152.7 176 [X] MSI GP65 Leopard 9SD Intel Core i7-9750H 2.6GHz
GeForce GTX 1660 Ti Mobile
min:
2.66 fps, P1:
125 fps, max:
283 fps
178 [X] MSI GF75 Thin 10SDR Intel Core i7-10750H 2.6GHz
GeForce GTX 1660 Ti Mobile
min:
3.2 fps, P1:
143 fps, max:
292 fps
178 ~ 171 fps
84%
GeForce GTX 1050 Ti Mobile:
135 150.1 ~ 143 fps
76%
GeForce GTX 1650 Mobile:
99.1 101.6 [X] Asus TUF FX505DT AMD Ryzen 7 3750H 2.3GHz
GeForce GTX 1650 Mobile
108 [X] SCHENKER XMG Core 14 Intel Core i5-1135G7 2.4GHz
GeForce GTX 1650 Mobile
min:
40.5 fps, P1:
66.7 fps, max:
177 fps
123 171 178 [X] MSI GP75 Leopard 9SC Intel Core i7-9750H 2.6GHz
GeForce GTX 1650 Mobile
min:
4.08 fps, P1:
143 fps, max:
271 fps
~ 130 fps
100%
GeForce GTX 1660 Ti Mobile:
142.5 164 [X] HP Omen 15-ek0456ng Intel Core i5-10300H 2.5GHz
GeForce GTX 1660 Ti Mobile
min:
4.76 fps, P1:
100 fps, max:
364 fps
168 [X] MSI GP65 Leopard 9SD Intel Core i7-9750H 2.6GHz
GeForce GTX 1660 Ti Mobile
min:
5.38 fps, P1:
100 fps, max:
294 fps
170 [X] MSI GF75 Thin 10SDR Intel Core i7-10750H 2.6GHz
GeForce GTX 1660 Ti Mobile
min:
5.47 fps, P1:
111 fps, max:
276 fps
171 ~ 163 fps
80%
GeForce GTX 1050 Ti Mobile:
118.8 141 ~ 130 fps
75%
GeForce GTX 1650 Mobile:
91.6 [X] Asus TUF FX505DT AMD Ryzen 7 3750H 2.3GHz
GeForce GTX 1650 Mobile
93.6 95.1 [X] SCHENKER XMG Core 14 Intel Core i5-1135G7 2.4GHz
GeForce GTX 1650 Mobile
min:
31.9 fps, P1:
43.5 fps, max:
163 fps
162 170 [X] MSI GP75 Leopard 9SC Intel Core i7-9750H 2.6GHz
GeForce GTX 1650 Mobile
min:
5.25 fps, P1:
125 fps, max:
295 fps
~ 122 fps
100%
GeForce GTX 1660 Ti Mobile:
123.7 133 [X] HP Omen 15-ek0456ng Intel Core i5-10300H 2.5GHz
GeForce GTX 1660 Ti Mobile
min:
9.4 fps, P1:
90.9 fps, max:
234 fps
137 [X] MSI GP65 Leopard 9SD Intel Core i7-9750H 2.6GHz
GeForce GTX 1660 Ti Mobile
min:
5.6 fps, P1:
83.3 fps, max:
280 fps
139 [X] MSI GF75 Thin 10SDR Intel Core i7-10750H 2.6GHz
GeForce GTX 1660 Ti Mobile
min:
22.5 fps, P1:
90.9 fps, max:
281 fps
140 ~ 135 fps
53%
GeForce GTX 1050 Ti Mobile:
60.3 84.3 ~ 72 fps
59%
GeForce GTX 1650 Mobile:
67.7 68 [X] Asus TUF FX505DT AMD Ryzen 7 3750H 2.3GHz
GeForce GTX 1650 Mobile
68 83.7 91.7 102 [X] MSI GP75 Leopard 9SC Intel Core i7-9750H 2.6GHz
GeForce GTX 1650 Mobile
min:
32.7 fps, P1:
71.4 fps, max:
264 fps
~ 80 fps
100%
GeForce GTX 1660 Ti Mobile:
68.1 71.8 [X] HP Omen 15-ek0456ng Intel Core i5-10300H 2.5GHz
GeForce GTX 1660 Ti Mobile
min:
5.95 fps, P1:
43.5 fps, max:
141 fps
73.8 [X] MSI GF75 Thin 10SDR Intel Core i7-10750H 2.6GHz
GeForce GTX 1660 Ti Mobile
min:
17.5 fps, P1:
47.6 fps, max:
142 fps
74.1 [X] MSI GP65 Leopard 9SD Intel Core i7-9750H 2.6GHz
GeForce GTX 1660 Ti Mobile
min:
22.2 fps, P1:
47.6 fps, max:
147 fps
76 ~ 73 fps
51%
GeForce GTX 1050 Ti Mobile:
36.1 37.4 ~ 37 fps
59%
GeForce GTX 1650 Mobile:
38.1 [X] SCHENKER XMG Core 14 Intel Core i5-1135G7 2.4GHz
GeForce GTX 1650 Mobile
min:
3.65 fps, P1:
24.4 fps, max:
70.2 fps
38.2 40.7 [X] Asus TUF FX505DT AMD Ryzen 7 3750H 2.3GHz
GeForce GTX 1650 Mobile
44.9 45.9 51.1 [X] MSI GP75 Leopard 9SC Intel Core i7-9750H 2.6GHz
GeForce GTX 1650 Mobile
min:
7.76 fps, P1:
34.5 fps, max:
90.3 fps
~ 43 fps
GeForce GTX 1050 Ti Mobile:
88.6 fps
GeForce GTX 1050 Ti Mobile:
82 fps
GeForce GTX 1050 Ti Mobile:
54 fps
GeForce GTX 1050 Ti Mobile:
38.5 fps
GeForce GTX 1050 Ti Mobile:
238.3 fps
GeForce GTX 1050 Ti Mobile:
215.4 fps
GeForce GTX 1050 Ti Mobile:
122.4 fps
GeForce GTX 1050 Ti Mobile:
80.9 fps
GeForce GTX 1650 Mobile:
136 fps
GeForce GTX 1050 Ti Mobile:
115.7 123 ~ 119 fps
GeForce GTX 1650 Mobile:
123.1 fps
GeForce GTX 1050 Ti Mobile:
73.1 117.5 ~ 95 fps
GeForce GTX 1650 Mobile:
84.2 fps
GeForce GTX 1050 Ti Mobile:
57.7 89.2 ~ 73 fps
GeForce GTX 1650 Mobile:
69.3 fps
GeForce GTX 1050 Ti Mobile:
116.8 [X] Saelic Veni G522 Intel Core i5-7300HQ 2.5GHz
GeForce GTX 1050 Ti Mobile
fps
GeForce GTX 1050 Ti Mobile:
87 [X] Saelic Veni G522 Intel Core i5-7300HQ 2.5GHz
GeForce GTX 1050 Ti Mobile
fps
GeForce GTX 1050 Ti Mobile:
66 77.5 ~ 72 fps
GeForce GTX 1050 Ti Mobile:
66.4 69.4 94.2 [X] Asus GL553VE-FY022T PL Intel Core i7-7700HQ 2.8GHz
GeForce GTX 1050 Ti Mobile
96.7 [X] Saelic Veni G422 G7TPK4 Intel Core i7-7700HQ 2.8GHz
GeForce GTX 1050 Ti Mobile
~ 82 fps
GeForce GTX 1050 Ti Mobile:
65.3 68.9 87.4 [X] Asus GL553VE-FY022T PL Intel Core i7-7700HQ 2.8GHz
GeForce GTX 1050 Ti Mobile
89 [X] Saelic Veni G422 G7TPK4 Intel Core i7-7700HQ 2.8GHz
GeForce GTX 1050 Ti Mobile
~ 78 fps
GeForce GTX 1050 Ti Mobile:
49.8 50 50.3 51.6 [X] Asus GL553VE-FY022T PL Intel Core i7-7700HQ 2.8GHz
GeForce GTX 1050 Ti Mobile
55.2 [X] Saelic Veni G422 G7TPK4 Intel Core i7-7700HQ 2.8GHz
GeForce GTX 1050 Ti Mobile
~ 51 fps
GeForce GTX 1050 Ti Mobile:
145.7 146 ~ 146 fps
GeForce GTX 1050 Ti Mobile:
71 71.3 ~ 71 fps
GeForce GTX 1050 Ti Mobile:
229.5 [X] Asus GL553VE-FY022T PL Intel Core i7-7700HQ 2.8GHz
GeForce GTX 1050 Ti Mobile
233.4 [X] Saelic Veni G422 G7TPK4 Intel Core i7-7700HQ 2.8GHz
GeForce GTX 1050 Ti Mobile
~ 231 fps
GeForce GTX 1050 Ti Mobile:
185.5 [X] Asus GL553VE-FY022T PL Intel Core i7-7700HQ 2.8GHz
GeForce GTX 1050 Ti Mobile
187.4 [X] Saelic Veni G422 G7TPK4 Intel Core i7-7700HQ 2.8GHz
GeForce GTX 1050 Ti Mobile
~ 186 fps
GeForce GTX 1050 Ti Mobile:
47.9 [X] Asus GL553VE-FY022T PL Intel Core i7-7700HQ 2.8GHz
GeForce GTX 1050 Ti Mobile
49.9 [X] Saelic Veni G422 G7TPK4 Intel Core i7-7700HQ 2.8GHz
GeForce GTX 1050 Ti Mobile
~ 49 fps
GeForce GTX 1050 Ti Mobile:
65 fps
GeForce GTX 1050 Ti Mobile:
113 115 ~ 114 fps
GeForce GTX 1050 Ti Mobile:
106 108 ~ 107 fps
GeForce GTX 1050 Ti Mobile:
87 98 ~ 93 fps
GeForce GTX 1050 Ti Mobile:
47 49 59 ~ 52 fps
GeForce GTX 1650 Mobile:
200.8 fps
GeForce GTX 1650 Mobile:
182.6 fps
GeForce GTX 1650 Mobile:
162.1 fps
GeForce GTX 1050 Ti Mobile:
124 fps
GeForce GTX 1650 Mobile:
130 fps
GeForce GTX 1050 Ti Mobile:
228 fps
GeForce GTX 1650 Mobile:
139.5 fps
GeForce GTX 1050 Ti Mobile:
196 fps
GeForce GTX 1650 Mobile:
123.7 fps
GeForce GTX 1050 Ti Mobile:
190.5 fps
GeForce GTX 1650 Mobile:
122.9 fps
GeForce GTX 1050 Ti Mobile:
165.6 fps
GeForce GTX 1650 Mobile:
103.3 fps
GeForce GTX 1050 Ti Mobile:
388.5 fps
GeForce GTX 1650 Mobile:
267.9 fps
GeForce GTX 1050 Ti Mobile:
178 fps
GeForce GTX 1650 Mobile:
125 fps
GeForce GTX 1050 Ti Mobile:
168.6 fps
GeForce GTX 1650 Mobile:
123.7 fps
GeForce GTX 1050 Ti Mobile:
125.5 fps
GeForce GTX 1650 Mobile:
102.2 fps
Average Gaming NVIDIA GeForce GTX 1660 Ti Mobile → 100% Average Gaming 30-70 fps → 100%
Average Gaming NVIDIA GeForce GTX 1050 Ti Mobile → 47% Average Gaming 30-70 fps → 47%
Average Gaming NVIDIA GeForce GTX 1650 Mobile → 64% Average Gaming 30-70 fps → 65%
For more games that might be playable and a list of all games and graphics cards visit our Gaming List
v1.26
log 09. 01:19:44
#0 checking url part for id 9641 +0s ... 0s
#1 checking url part for id 7346 +0s ... 0s
#2 checking url part for id 9828 +0s ... 0s
#3 not redirecting to Ajax server +0s ... 0s
#4 did not recreate cache, as it is less than 5 days old! Created at Tue, 07 May 2024 05:40:33 +0200 +0.001s ... 0.001s
#5 composed specs +0.179s ... 0.18s
#6 did output specs +0s ... 0.18s
#7 start showIntegratedCPUs +0s ... 0.18s
#8 getting avg benchmarks for device 9641 +0.076s ... 0.256s
#9 got single benchmarks 9641 +0.155s ... 0.41s
#10 getting avg benchmarks for device 7346 +0.022s ... 0.432s
#11 got single benchmarks 7346 +0.21s ... 0.642s
#12 getting avg benchmarks for device 9828 +0.018s ... 0.66s
#13 got single benchmarks 9828 +0.219s ... 0.879s
#14 got avg benchmarks for devices +0s ... 0.879s
#15 min, max, avg, median took s +0.863s ... 1.742s
#16 before gaming benchmark output +0s ... 1.742s
#17 Got 3951 rows for game benchmarks. +0.446s ... 2.188s
#18 composed SQL query for gamebenchmarks +0s ... 2.188s
#19 got data and put it in $dataArray +0.168s ... 2.356s
#20 benchmarks composed for output. +0.477s ... 2.833s
#21 calculated avg scores. +0s ... 2.833s
#22 return log +0.01s ... 2.843s
Please share our article, every link counts!
Redaktion, 2017-09- 8 (Update: 2023-07- 1)
 Deutsch
 English
 Español
 Français
 Italiano
 Nederlands
 Polski
 Português
 Русский
 Türkçe
 Svenska
 Chinese
 Magyar