Notebook reviews with NVIDIA GeForce RTX 3050 6GB Laptop GPU graphics card
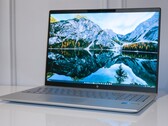
Asus V16 V3607V laptop review: GeForce RTX graphics without breaking the bank
As long as you know where the cut corners are, the Asus V16 can be a solid jack-of-all-trades solution that performs well enough for most home, office, or class...
Intel Core 7 240H | NVIDIA GeForce RTX 3050 6GB Laptop GPU | 16.00" | 2 kgHP Pavilion Plus 16 Review: Premium multimedia laptop that could have benefitted from an RTX 4050
HP aims to tap into the burgeoning entry-level creator market with the Pavilion Plus 16. The Pavilion Plus 16 is among the few laptops to feature the RTX 3050 6...
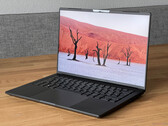
Intel Core i7-13700H | NVIDIA GeForce RTX 3050 6GB Laptop GPU | 16.00" | 1.9 kgSchenker Vision 14 M23 review - The magnesium ultrabook now with a GeForce RTX 3050 6 GB
Schenker offers its Vision 14 with the GeForce RTX 3050 Refresh, featuring more graphics memory. All-in-all, its performance has remained almost the same and it...
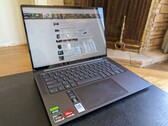
Intel Core i7-13700H | NVIDIA GeForce RTX 3050 6GB Laptop GPU | 14.00" | 1.3 kgNew CPU name, old CPU performance: Lenovo Slim 7 Pro Ryzen 7 7735HS laptop review
The Slim Pro 7 is a versatile multimedia solution with H-series CPUs and GeForce RTX graphics. The latest model is one of the first to ship with the Ryzen 7 773...
AMD Ryzen 7 7735HS | NVIDIA GeForce RTX 3050 6GB Laptop GPU | 14.50" | 1.6 kgAsus V16 V3607V: Intel Core 7 240H, 16.00", 2 kg
External Review » Asus V16 V3607V
Lenovo LOQ 15 ARP9: unknown, 15.60", 2.4 kg
External Review » Lenovo LOQ 15 ARP9
HP Victus 16-r1000TX: Intel Core i5-14450HX, 16.10", 2.3 kg
External Review » HP Victus 16-r1000TX
Lenovo Yoga Pro 7 14AHP9: AMD Ryzen 7 8845HS, 14.50", 1.5 kg
External Review » Lenovo Yoga Pro 7 14AHP9
Lenovo LOQ 15IAX9I, RTX 3050: Intel Core i5-12450HX, 15.60", 2.4 kg
External Review » Lenovo LOQ 15IAX9I, RTX 3050
MSI Katana 15 B13UDXK: Intel Core i7-13620H, 15.60", 2.3 kg
External Review » MSI Katana 15 B13UDXK
Acer Aspire Lite 15 AL15-52: Intel Core i5-12450H, 15.60", 2 kg
External Review » Acer Aspire Lite 15 AL15-52
Acer Aspire Lite 15 AL15G-52: Intel Core i5-12450H, 15.60", 2 kg
External Review » Acer ALG AL15G-52
MSI Katana 17 B12UDXK: Intel Core i5-12450H, 17.30", 2.6 kg
External Review » MSI Katana 17 B12UDXK
Acer Nitro V 15 ANV15-41: AMD Ryzen 5 7535HS, 15.60", 2.1 kg
External Review » Acer Nitro V 15 ANV15-41
MSI Prestige 14 AI Studio C1UDXG: , 14.00", 1.7 kg
External Review » MSI Prestige 14 AI Studio C1UDXG
Infinix GT Book 16, RTX 3050: Intel Core i5-12450H, 16.00", 2 kg
External Review » Infinix GT Book 16, RTX 3050
Acer Nitro V16 ANV16-41, RTX 3050: AMD Ryzen 7 8845HS, 16.00", 2.5 kg
External Review » Acer Nitro V16 ANV16-41, RTX 3050
HP Pavilion Plus 16-ab0456tx: Intel Core i7-13700H, 16.00", 1.9 kg
External Review » HP Pavilion Plus 16-ab0456tx
Asus Vivobook Pro 15 OLED Q533: Intel Core Ultra 7 155H, 15.60", 1.9 kg
External Review » Asus Vivobook Pro 15 OLED Q533
Lenovo IdeaPad Pro 5 14IRH8, i5-13500H: Intel Core i5-13500H, 14.00", 1.5 kg
External Review » Lenovo IdeaPad Pro 5 14IRH8, i5-13500H
MSI Thin 15 B12UC: Intel Core i7-12650H, 15.60", 1.9 kg
External Review » MSI Thin 15 B12UC
Lenovo LOQ 15IRH8, i5-13450HX RTX 3050: Intel Core i5-13450HX, 15.60", 2.4 kg
External Review » Lenovo LOQ 15IRH8, i5-13450HX RTX 3050
Lenovo IdeaPad Pro 5 14IRH8: Intel Core i7-13700H, 14.00", 1.5 kg
External Review » Lenovo IdeaPad Pro 5 14IRH8
Acer Nitro V 15 ANV15-51, RTX 3050: Intel Core i5-13420H, 15.60", 2.1 kg
External Review » Acer Nitro V 15 ANV15-51, RTX 3050
HP Pavilion Plus 16-ab0000: Intel Core i7-13700H, 16.00", 1.9 kg
External Review » HP Pavilion Plus 16-ab0000
Acer Nitro 16 AN16-51, i7-13700H RTX 3050: Intel Core i7-13700H, 16.00", 2.7 kg
External Review » Acer Nitro 16 AN16-51, i7-13700H RTX 3050
MSI Bravo 15 C7UDX: AMD Ryzen 7 7735HS, 15.60", 2.3 kg
External Review » MSI Bravo 15 C7UDX
Lenovo LOQ 15IRH8, i5-13500H RTX 3050: Intel Core i5-13500H, 15.60", 2.4 kg
External Review » Lenovo LOQ 15IRH8, i5-13500H RTX 3050
Lenovo Yoga Pro 7 14ARP G8, R5 7535HS RTX 3050: AMD Ryzen 5 7535HS, 14.50", 1.6 kg
External Review » Lenovo Yoga Pro 7 14ARP G8, R5 7535HS RTX 3050
Lenovo Slim Pro 7 14ARP8: AMD Ryzen 7 7735HS, 14.50", 1.6 kg
External Review » Lenovo Slim Pro 7 14ARP8
Gigabyte G5 KE: Intel Core i5-12500H, 15.60", 2 kg
External Review » Gigabyte G5 KE
Asus V16 V3607V: Intel Core 7 240H, 16.00", 2 kg
» New Asus V16 offers good value for under $1000, but its all-plastic case is a turn off
Lenovo Slim Pro 7 14ARP8: AMD Ryzen 7 7735HS, 14.50", 1.6 kg
» GeForce RTX 3050 vs. GTX 1660 Ti: Two GPUs for two different purposes