

Intel Iris Xe Graphics G7 80EUs vs AMD Radeon RX Vega 8 (Ryzen 4000/5000)
Intel Iris Xe Graphics G7 80EUs
► remove from comparisonThe Intel Xe Graphics G7 80EUs (Tiger-Lake U GPU with 80 EUs) is a integrated graphics card in the mid range Tiger-Lake U CPUs (15 - 28 Watt, e.g. Core i5 11th Gen CPUs). It is using the new Xe architecture (Gen12) and should be announced later in 2020.
The performance depends on the TDP settings of the laptop and the used cooling. First informations show that the chip can be configured at 15 and 28 Watt TDP default (as the Ice Lake-U chips) and the performance should be around a dedicated GeForce MX330 in 3DMark benchmarks. For gaming we are expecting a bit worse performance due to the missing dedicated graphics memory and driver support. Compared to the older Iris Plus G4 in Ice Lake chips, the Tiger Lake GPU should be nearly twice as fast. Benchmarks with various laptops show that the 80EU version lacks about 18% behind the faster 96EU version and on par with the MX330. Compared to AMD iGPUs, the G7 80EU positions itself around the Vega 7 and Vega 8 chips (see chart below for details).
Therefore, the iGPU is still only for lowest graphical settings and low resolutions in demanding games. Some modern games like Days Gone or Cyberpunk wont run over 30 fps in minimum settings (see below).
The Tiger Lake SoCs and therefore the integrated GPU are manufactured in the modern 10nm+ (10nm Superfin) process (improved 10nm process) at Intel and therefore should offer a very good efficiency.
AMD Radeon RX Vega 8 (Ryzen 4000/5000)
► remove from comparison
The AMD Radeon RX Vega 8 is an integrated GPU for notebooks. It is used for the Ryzen 7 APUs of the Renoir generation (Ryzen 4000 Mobile) and Cezanne (Ryzen 5000 Mobile). The GPU is based on the Vega architecture (5th generation GCN) and has 8 CUs (= 512 of the 704 shaders) clocked at up to 1,750 MHz (Ryzen 7 4800U) or 2,100 MHz (Ryzen 9 5980HX). The performance depends on the configured TDP (12-25 W at launch), the clocks, the cooling, and the memory configuration). The GPU should benefit from fast dual-channel DDR4-3200 RAM (contrary to DDR4-2133 single-channel, which is also possible). Compared to the similar Radeon RX Vega 8 in the Raven Ridge generation (Ryzen 2000 Mobile), the GPU is clocked significantly higher (1.750 versus 1.100 MHz Boost, +59%).
The Vega architecture offers some improvements over the Polaris generation and now supports DirectX 12 Feature Level 12_1. More information is available in our dedicated article about the Raven Ridge architecture.
The performance is clearly faster than the old RX Vega 8 thanks to the higher clock speed and faster main memory (if used). Still it is positioned in the entry level (compared to dedicated graphics cards) and only suited for low demanding games.
Thanks to the modern 7nm process and clever power-saving features, the power consumption is comparatively low (according to AMD), so the graphics card can also be used for slim and light notebooks.
| Intel Iris Xe Graphics G7 80EUs | AMD Radeon RX Vega 8 (Ryzen 4000/5000) | ||||||||||||||||||||||||||||||||||||||||
| RX Vega 4000/5000 Series |
|
| |||||||||||||||||||||||||||||||||||||||
| Codename | Tiger Lake Xe | Vega | |||||||||||||||||||||||||||||||||||||||
| Architecture | Gen. 11 Ice Lake | Vega | |||||||||||||||||||||||||||||||||||||||
| Pipelines | 80 - unified | 512 - unified | |||||||||||||||||||||||||||||||||||||||
| Core Speed | 400 - 1350 (Boost) MHz | 2100 (Boost) MHz | |||||||||||||||||||||||||||||||||||||||
| Shared Memory | yes | no | |||||||||||||||||||||||||||||||||||||||
| API | DirectX 12_1, OpenGL 4.6 | DirectX 12_1 | |||||||||||||||||||||||||||||||||||||||
| Power Consumption | 28 Watt | 15 Watt | |||||||||||||||||||||||||||||||||||||||
| technology | 10 nm | 7 nm | |||||||||||||||||||||||||||||||||||||||
| Features | QuickSync | Tiled Rasterization, Shared Memory (up to Dual-Channel DDR4-2400) | |||||||||||||||||||||||||||||||||||||||
| Date of Announcement | 15.08.2020 | 07.01.2020 |
|
| ||||||||||||||||||||||||||||||||||||||||||||||||||||||||||||||||||||||||||||||||||||||||||||||||||||||||||||||||||||||||||||||||||||||||||||||||||||||||||||||||||||||||||||||||||||||||||||||||||||||||||||
Benchmarks
| Model | CPU | GPU | RAM | Value |
|---|---|---|---|---|
| Acer Aspire Go AG15-51P-56UR DX12 | i5-1334U | Iris Xe G7 80EUs | 16 GB | 141 |
| Acer Aspire Go AG15-51P-56UR Vulkan | i5-1334U | Iris Xe G7 80EUs | 16 GB | 169 |
| Model | CPU | GPU | RAM | Value |
|---|---|---|---|---|
| Acer Aspire Go AG15-51P-56UR DX12 | i5-1334U | Iris Xe G7 80EUs | 16 GB | 1019 |
| Acer Aspire Go AG15-51P-56UR Vulkan | i5-1334U | Iris Xe G7 80EUs | 16 GB | 1184 |
| Xiaomi RedmiBook 14 2025 | Core 5 220H 43 W / 32 W | Iris Xe G7 80EUs 1500 MHz | 32 GB | 1201 |
| Model | CPU | GPU | RAM | Value |
|---|---|---|---|---|
| Acer Extensa 15 EX215-54-5103 | i5-1135G7 64 W / 28 W | Iris Xe G7 80EUs 1300 MHz | 8 GB | 5244 |
| Acer TravelMate P4 TMP414-51-59MR | i5-1135G7 64 W / 28 W | Iris Xe G7 80EUs 1300 MHz | 8 GB | 5420 |
| Lenovo ThinkPad L14 G4 21H1003DGE | i5-1335U 45 W / 15 W | Iris Xe G7 80EUs | 16 GB | 6428 |
| Lenovo Yoga Slim 7 14ITL05 82A300CNGE | i5-1135G7 36 W / 25 W | Iris Xe G7 80EUs 1300 / 2000 MHz | 8 GB | 7252 |
| Lenovo IdeaPad Gaming Chromebook 16 | i5-1235U | Iris Xe G7 80EUs | 8 GB | 8289 |
| Acer TravelMate P4 TMP414-51-59MR Dual-Channel | i5-1135G7 | Iris Xe G7 80EUs 1300 / 1200 MHz | 16 GB | 9325 |
| HP Pavilion x360 14-dy0157ng | i5-1135G7 51 W / 20 W | Iris Xe G7 80EUs 1300 / 2000 MHz | 16 GB | 9925 |
| HP Pavilion x360 15-er0155ng | i5-1135G7 51 W / 20 W | Iris Xe G7 80EUs 1300 MHz | 16 GB | 9969 |
| Microsoft Surface Pro 7 Plus | i5-1135G7 60 W / 30 W | Iris Xe G7 80EUs 1300 MHz | 16 GB | 11404 |
| Model | CPU | GPU | RAM | Value |
|---|---|---|---|---|
| Asus VivoBook S15 D533UA | R7 5700U 35 W / 28 W | Vega 8 1900 / 1333 MHz 0.5 GB | 16 GB | 6287 |
| Lenovo Yoga Slim 7 Pro 14ACH5 | R9 5900HX 35 W / 25 W | Vega 8 ? / 1600 MHz 2 GB | 16 GB | 7896 |
| Prime Computer Primestation Pulsar | R7 PRO 5750G 45 W / 45 W | Vega 8 ? / 1600 MHz 8 GB | 32 GB | 8622 |
| Lenovo Legion 7 16ACHg6 | R9 5900HX | Vega 8 2100 / 1600 MHz 4 GB | 32 GB | 8818 |
| AMD Ryzen 7 5700G | R7 5700G 65 W / 65 W | Vega 8 65 W \ MHz 4 GB | 32 GB | 9830 |
| GPU TDP ? | TDP 65 W |
|---|---|
| 82% | 100% |
| Model | CPU | GPU | RAM | Value |
|---|---|---|---|---|
| Lenovo ThinkPad E14 G5-21JSS05C00 | R7 7730U 30 W / 30 W | Vega 8 | 24 GB | 1953 |
| Lenovo ThinkPad E16 G1-21JUS08X00 | R7 7730U 25 W / 30 W | Vega 8 | 24 GB | 2048 |
| Asus VivoBook 15 OLED M513UA-L1282W | R7 5700U 36 W / 25 W | Vega 8 1900 / 1600 MHz 0.5 GB | 16 GB | 2089 |
| Schenker VIA 15 Pro M22 | R7 5700U 40 W / 35 W | Vega 8 | 32 GB | 2345 |
| Lenovo Yoga Slim 7 Pro 14ACH5 | R9 5900HX 35 W / 25 W | Vega 8 ? / 1600 MHz 2 GB | 16 GB | 2374 |
| Lenovo IdeaPad Flex 5 16ABR G8 | R7 7730U 48 W / 25 W | Vega 8 ? / 2133 MHz | 16 GB | 2389 |
| Prime Computer Primestation Pulsar | R7 PRO 5750G 45 W / 45 W | Vega 8 ? / 1600 MHz 8 GB | 32 GB | 2553 |
| Lenovo Legion 7 16ACHg6 | R9 5900HX | Vega 8 2100 / 1600 MHz 4 GB | 32 GB | 2679 |
| AMD Ryzen 7 5700G | R7 5700G 65 W / 65 W | Vega 8 65 W \ MHz 4 GB | 32 GB | 2913 |
| GPU TDP ? | TDP 65 W |
|---|---|
| 83% | 100% |
| GPU TDP ? | TDP 11 W | TDP 28 W |
|---|---|---|
| 80% | 100% | 96% |
| GPU TDP ? | TDP 11 W | TDP 15 W | TDP 28 W | TDP 65 W |
|---|---|---|---|---|
| 74% | 93% | 78% | 89% | 100% |
| GPU TDP ? | TDP 11 W | TDP 28 W |
|---|---|---|
| 81% | 100% | 100% |
| GPU TDP ? | TDP 11 W | TDP 15 W | TDP 28 W | TDP 65 W |
|---|---|---|---|---|
| 74% | 93% | 77% | 93% | 100% |
| GPU TDP ? | TDP 65 W |
|---|---|
| 61% | 100% |
| GPU TDP ? | TDP 11 W | TDP 28 W |
|---|---|---|
| 88% | 100% | 100% |
| GPU TDP ? | TDP 11 W | TDP 15 W | TDP 28 W | TDP 65 W |
|---|---|---|---|---|
| 74% | 83% | 79% | 84% | 100% |
| GPU TDP ? | TDP 11 W | TDP 28 W |
|---|---|---|
| 87% | 98% | 100% |
| GPU TDP ? | TDP 11 W | TDP 15 W | TDP 28 W | TDP 65 W |
|---|---|---|---|---|
| 74% | 85% | 80% | 87% | 100% |
| Model | CPU | GPU | RAM | Value |
|---|---|---|---|---|
| NiPoGi AM06 Pro | R7 5700U | Vega 8 | 16 GB | 142583 |
| Lenovo Yoga Slim 7-14ARE | R7 4800U | Vega 8 1750 / 2133 MHz 0.5 GB | 16 GB | 186037 |
| Asus VivoBook 15 OLED M513UA-L1282W | R7 5700U 36 W / 25 W | Vega 8 1900 / 1600 MHz 0.5 GB | 16 GB | 194561 |
| Asus VivoBook S15 D533UA | R7 5700U 35 W / 28 W | Vega 8 1900 / 1333 MHz 0.5 GB | 16 GB | 195744 |
Asus ZenBook 13 OLED UM325UA  | R7 5700U | Vega 8 | 0 GB | 198052 |
| Minisforum HM90 | R9 4900H 45 W / 35 W | Vega 8 | 16 GB | 202409 |
| Asus ZenBook 13 UM325S | R7 5800U 30 W / 25 W | Vega 8 | 16 GB | 266666 |
| Minisforum EliteMini B550 | R7 5700G 77 W / 72 W | Vega 8 ? / 1600 MHz 0.5 GB | 16 GB | 287286 |
| Aoostar WTR Pro, R7 5825U | R7 5825U 30 W / 15 W | Vega 8 | 16 GB | 295865 |
| Prime Computer Primestation Pulsar | R7 PRO 5750G 45 W / 45 W | Vega 8 ? / 1600 MHz 8 GB | 32 GB | 299071 |
| Lenovo Yoga Slim 7 Pro 14ACH5 | R9 5900HX 35 W / 25 W | Vega 8 ? / 1600 MHz 2 GB | 16 GB | 299534 |
| Minisforum EliteMini HX90 | R9 5900HX 54 W / 54 W | Vega 8 | 16 GB | 300466 |
| Morefine S500+ | R9 5900HX 35 W / 54 W | Vega 8 | 32 GB | 302584 |
| Geekom A5 | R7 5800H 54 W / 35 W | Vega 8 | 32 GB | 309367 |
| Geekom AS 5 | R9 5900HX 54 W / 35 W | Vega 8 | 32 GB | 313891 |
| Lenovo Legion 7 16ACHg6 | R9 5900HX | Vega 8 2100 / 1600 MHz 4 GB | 32 GB | 321196 |
| AMD Ryzen 7 5700G | R7 5700G 65 W / 65 W | Vega 8 65 W \ MHz 4 GB | 32 GB | 335708 |
| GPU TDP ? | TDP 65 W |
|---|---|
| 64% | 100% |
| GPU TDP ? | TDP 65 W |
|---|---|
| 56% | 100% |
| GPU TDP ? | TDP 11 W |
|---|---|
| 88% | 100% |
| Model | CPU | GPU | RAM | Value |
|---|---|---|---|---|
| Dell Inspiron 15 5515-H8P8F | R7 5700U 27 W / 11 W | Vega 8 1900 / 1200 MHz 0.5 GB | 8 GB | 13147 |
| Acer Aspire 5 A515-45-R4R1 | R7 5700U 27 W / 16 W | Vega 8 ? / 1200 MHz 0.5 GB | 8 GB | 13219 |
| NiPoGi AM06 Pro | R7 5700U | Vega 8 | 16 GB | 14912 |
| Thinkeagle VigoBook G7 | R7 5700U 13 W / 10 W | Vega 8 ? / 1600 MHz 0.5 GB | 16 GB | 14996 |
| Lenovo ThinkPad L15 Gen 4 21H70021GE | R7 PRO 7730U 40 W / 31 W | Vega 8 2000 / 1600 MHz 1 GB | 16 GB | 15779 |
| Ninkear A15 Plus (16+512) | R7 5700U 30 W / 15 W | Vega 8 | 16 GB | 16817 |
| HP EliteBook 645 G9, Ryzen 7 5825U | R7 5825U | Vega 8 ? / 1600 MHz 0.5 GB | 16 GB | 17361 |
| HP ProBook x360 435 G8 R7-5800U | R7 5800U 27 W / 22 W | Vega 8 ? / 1333 MHz | 16 GB | 18062 |
| Asus ZenBook Flip 14 UN5401QA-KN085W | R7 5800H @4.5 GHz 54 W / 45 W | Vega 8 2000 / 2100 MHz 0.5 GB | 16 GB | 18460 |
| Asus VivoBook 15 OLED M513UA-L1282W Flüstermodus | R7 5700U | Vega 8 | 16 GB | 19527 |
| GMK NucBox M5 | R7 5700U 15 W / 15 W | Vega 8 1750 / 1600 MHz | 32 GB | 19551 |
| Microsoft Surface Laptop 4 15 AMD TFF_00028 | R7 4980U 44 W / 23 W | Vega 8 | 16 GB | 19575 |
| GPD Win Max 2021 | R7 4800U 22 W / 20 W | Vega 8 ? / 1333 MHz 2 GB | 16 GB | 20095 |
| Asus ZenBook 13 OLED UM325UA | R7 5700U | Vega 8 | 0 GB | 20162 |
| Dell Inspiron 14 7400 7415 2-in-1 | R7 5700U 30 W / 25 W | Vega 8 ? / 1333 MHz 0.5 GB | 16 GB | 20246 |
| Asus VivoBook 15 OLED M513UA-L1282W Leistungsmodus | R7 5700U | Vega 8 | 16 GB | 20348 |
| Lenovo Yoga 6 13ALC6 | R7 5700U 22.5 W / 27 W | Vega 8 ? / 1600 MHz 0.5 GB | 16 GB | 21275 |
| Minisforum HM90 | R9 4900H 45 W / 35 W | Vega 8 | 16 GB | 21321 |
| Asus VivoBook 15 OLED M513UA-L1282W | R7 5700U 36 W / 25 W | Vega 8 1900 / 1600 MHz 0.5 GB | 16 GB | 21511 |
| Lenovo ThinkPad E15 G3-20YG003UGE | R7 5700U 30 W / 25 W | Vega 8 | 16 GB | 21645 |
| Asus ZenBook 14 UM425U | R7 5700U | Vega 8 ? / 1867 MHz 0.5 GB | 8 GB | 21698 |
| Lenovo IdeaPad Flex 5 14ALC05 82HU002YUS | R7 5700U | Vega 8 ? / 1333 MHz 0.5 GB | 16 GB | 21838 |
| HP Pavilion Aero 13 be0097nr | R7 5800U 30 W / 25 W | Vega 8 1333 MHz 0.5 GB | 16 GB | 21893 |
| Beelink SER4 | R7 4800U 25 W / 25 W | Vega 8 ? / 1600 MHz 0.5 GB | 32 GB | 22021 |
| Asus ZenBook 13 UM325S | R7 5800U 30 W / 25 W | Vega 8 | 16 GB | 22283 |
| Lenovo ThinkPad E14 G4 21EB0041GE | R7 5825U 30 W / 30 W | Vega 8 2000 / 1600 MHz | 16 GB | 22639 |
| Lenovo ThinkBook 13s G3 20YA0005GE | R7 5800U 30 W / 25 W | Vega 8 ? / 2133 MHz | 16 GB | 22949 |
| HP Envy x360 15-eu0097nr | R7 5700U 48 W / 37 W | Vega 8 ? / 1333 MHz 0.5 GB | 16 GB | 22950 |
| Lenovo Yoga Slim 7-14ARE | R7 4800U | Vega 8 1750 / 2133 MHz 0.5 GB | 16 GB | 22962 |
| Lenovo ThinkPad T14s G2 20XGS01100 | R7 PRO 5850U 30 W / 22 W | Vega 8 | 32 GB | 23045 |
| Minisforum EliteMini B550 | R7 5700G 77 W / 72 W | Vega 8 ? / 1600 MHz 0.5 GB | 16 GB | 23054 |
| Asus ZenBook 14X UM5401QA-KN162 | R7 5800H | Vega 8 ? / 2133 MHz 0.5 GB | 16 GB | 23278 |
| Aoostar WTR Pro, R7 5825U | R7 5825U 30 W / 15 W | Vega 8 | 16 GB | 23651 |
| Prime Computer Primestation Pulsar | R7 PRO 5750G 45 W / 45 W | Vega 8 ? / 1600 MHz 8 GB | 32 GB | 24461 |
| HP Envy x360 15-ey0023dx | R7 5825U 48 W / 37 W | Vega 8 ? / 1600 MHz 0.5 GB | 12 GB | 24486 |
| Lenovo Yoga 6 13 83B2001SGE | R7 7730U 30 W / 25 W | Vega 8 | 16 GB | 24556 |
| Lenovo ThinkPad L15 Gen 4 21H70021GE Dual-Channel-Mode | R7 PRO 7730U 40 W / 31 W | Vega 8 2000 / 1600 MHz 1 GB | 16 GB | 24792 |
| Asus ZenBook Flip 14 UN5401QA-KN085W | R7 5800H 60 W / 45 W | Vega 8 15 W ? / 2133 MHz 0.5 GB | 16 GB | 25141 |
| Minisforum EliteMini HX90 | R9 5900HX 54 W / 54 W | Vega 8 | 16 GB | 25447 |
| Lenovo Yoga Slim 7 Pro 14ACH5 | R9 5900HX 35 W / 25 W | Vega 8 ? / 1600 MHz 2 GB | 16 GB | 25549 |
| LG UltraPC 14 14U70Q-G.AA79G | R7 5825U 25 W / 10 W | Vega 8 ? / 2133 MHz 0.5 GB | 16 GB | 25781 |
| Huawei MateBook 16 R7 5800H | R7 5800H 65 W / 54 W | Vega 8 | 16 GB | 25813 |
| HP Envy x360 15-fh0077ng | R7 7730U 48 W / 37 W | Vega 8 1200 / 2000 MHz 0.5 GB | 15.6 GB | 26027 |
| Geekom AS 5 | R9 5900HX 54 W / 35 W | Vega 8 | 32 GB | 27070 |
| Geekom A5 | R7 5800H 54 W / 35 W | Vega 8 | 32 GB | 27089 |
| Morefine S500+ | R9 5900HX 35 W / 54 W | Vega 8 | 32 GB | 27318 |
| Lenovo Legion 7 16ACHg6 | R9 5900HX | Vega 8 2100 / 1600 MHz 4 GB | 32 GB | 28638 |
| Beelink GTR5 | R9 5900HX 52 W / 46 W | Vega 8 ? / 1600 MHz 0.5 GB | 32 GB | 28723 |
| AMD Ryzen 7 5700G | R7 5700G 65 W / 65 W | Vega 8 65 W \ MHz 4 GB | 32 GB | 30291 |
| GPU TDP ? | TDP 11 W | TDP 15 W | TDP 65 W |
|---|---|---|---|
| 60% | 62% | 83% | 100% |
| GPU TDP ? | TDP 11 W |
|---|---|
| 71% | 100% |
| Model | CPU | GPU | RAM | Value |
|---|---|---|---|---|
| Dell Inspiron 15 5515-H8P8F | R7 5700U 27 W / 11 W | Vega 8 1900 / 1200 MHz 0.5 GB | 8 GB | 13941 |
| Acer Aspire 5 A515-45-R4R1 | R7 5700U 27 W / 16 W | Vega 8 ? / 1200 MHz 0.5 GB | 8 GB | 15477 |
| NiPoGi AM06 Pro | R7 5700U | Vega 8 | 16 GB | 16603 |
| Thinkeagle VigoBook G7 | R7 5700U 13 W / 10 W | Vega 8 ? / 1600 MHz 0.5 GB | 16 GB | 16765 |
| Lenovo ThinkPad L15 Gen 4 21H70021GE | R7 PRO 7730U 40 W / 31 W | Vega 8 2000 / 1600 MHz 1 GB | 16 GB | 17283 |
| Ninkear A15 Plus (16+512) | R7 5700U 30 W / 15 W | Vega 8 | 16 GB | 18416 |
| HP EliteBook 645 G9, Ryzen 7 5825U | R7 5825U | Vega 8 ? / 1600 MHz 0.5 GB | 16 GB | 18755 |
| HP ProBook x360 435 G8 R7-5800U | R7 5800U 27 W / 22 W | Vega 8 ? / 1333 MHz | 16 GB | 19683 |
| Minisforum HM90 | R9 4900H 45 W / 35 W | Vega 8 | 16 GB | 23739 |
| Dell Inspiron 14 7400 7415 2-in-1 | R7 5700U 30 W / 25 W | Vega 8 ? / 1333 MHz 0.5 GB | 16 GB | 24267 |
| GMK NucBox M5 | R7 5700U 15 W / 15 W | Vega 8 1750 / 1600 MHz | 32 GB | 25003 |
| Asus VivoBook 15 OLED M513UA-L1282W Flüstermodus | R7 5700U | Vega 8 | 16 GB | 25525 |
| Lenovo IdeaPad Flex 5 14ALC05 82HU002YUS | R7 5700U | Vega 8 ? / 1333 MHz 0.5 GB | 16 GB | 25553 |
| GPD Win Max 2021 | R7 4800U 22 W / 20 W | Vega 8 ? / 1333 MHz 2 GB | 16 GB | 25572 |
| Asus VivoBook 15 OLED M513UA-L1282W Leistungsmodus | R7 5700U | Vega 8 | 16 GB | 25620 |
| Lenovo ThinkPad E15 G3-20YG003UGE | R7 5700U 30 W / 25 W | Vega 8 | 16 GB | 25687 |
| Asus VivoBook 15 OLED M513UA-L1282W | R7 5700U 36 W / 25 W | Vega 8 1900 / 1600 MHz 0.5 GB | 16 GB | 25802 |
| Asus ZenBook 13 OLED UM325UA | R7 5700U | Vega 8 | 0 GB | 25954 |
| Lenovo Yoga 6 13ALC6 | R7 5700U 22.5 W / 27 W | Vega 8 ? / 1600 MHz 0.5 GB | 16 GB | 26080 |
| Asus ZenBook 14 UM425U | R7 5700U | Vega 8 ? / 1867 MHz 0.5 GB | 8 GB | 26102 |
| Minisforum EliteMini B550 | R7 5700G 77 W / 72 W | Vega 8 ? / 1600 MHz 0.5 GB | 16 GB | 26183 |
| Asus ZenBook 14X UM5401QA-KN162 | R7 5800H | Vega 8 ? / 2133 MHz 0.5 GB | 16 GB | 26290 |
| Microsoft Surface Laptop 4 15 AMD TFF_00028 | R7 4980U 44 W / 23 W | Vega 8 | 16 GB | 26642 |
| Lenovo ThinkPad E14 G4 21EB0041GE | R7 5825U 30 W / 30 W | Vega 8 2000 / 1600 MHz | 16 GB | 26679 |
| HP Pavilion Aero 13 be0097nr | R7 5800U 30 W / 25 W | Vega 8 1333 MHz 0.5 GB | 16 GB | 27008 |
| Lenovo Yoga Slim 7-14ARE | R7 4800U | Vega 8 1750 / 2133 MHz 0.5 GB | 16 GB | 27160 |
| Beelink SER4 | R7 4800U 25 W / 25 W | Vega 8 ? / 1600 MHz 0.5 GB | 32 GB | 27339 |
| Asus ZenBook Flip 14 UN5401QA-KN085W | R7 5800H @4.5 GHz 54 W / 45 W | Vega 8 2000 / 2100 MHz 0.5 GB | 16 GB | 27980 |
| Prime Computer Primestation Pulsar | R7 PRO 5750G 45 W / 45 W | Vega 8 ? / 1600 MHz 8 GB | 32 GB | 28036 |
| Lenovo ThinkBook 13s G3 20YA0005GE | R7 5800U 30 W / 25 W | Vega 8 ? / 2133 MHz | 16 GB | 28311 |
| Asus ZenBook 13 UM325S | R7 5800U 30 W / 25 W | Vega 8 | 16 GB | 28491 |
| HP Envy x360 15-ey0023dx | R7 5825U 48 W / 37 W | Vega 8 ? / 1600 MHz 0.5 GB | 12 GB | 28636 |
| Lenovo ThinkPad T14s G2 20XGS01100 | R7 PRO 5850U 30 W / 22 W | Vega 8 | 32 GB | 28661 |
| HP Envy x360 15-eu0097nr | R7 5700U 48 W / 37 W | Vega 8 ? / 1333 MHz 0.5 GB | 16 GB | 28738 |
| Minisforum EliteMini HX90 | R9 5900HX 54 W / 54 W | Vega 8 | 16 GB | 28915 |
| Aoostar WTR Pro, R7 5825U | R7 5825U 30 W / 15 W | Vega 8 | 16 GB | 28946 |
| Lenovo ThinkPad L15 Gen 4 21H70021GE Dual-Channel-Mode | R7 PRO 7730U 40 W / 31 W | Vega 8 2000 / 1600 MHz 1 GB | 16 GB | 29403 |
| Lenovo Yoga Slim 7 Pro 14ACH5 | R9 5900HX 35 W / 25 W | Vega 8 ? / 1600 MHz 2 GB | 16 GB | 29751 |
| Asus ZenBook Flip 14 UN5401QA-KN085W | R7 5800H 60 W / 45 W | Vega 8 15 W ? / 2133 MHz 0.5 GB | 16 GB | 29785 |
| Huawei MateBook 16 R7 5800H | R7 5800H 65 W / 54 W | Vega 8 | 16 GB | 29795 |
| Lenovo Yoga 6 13 83B2001SGE | R7 7730U 30 W / 25 W | Vega 8 | 16 GB | 30501 |
| HP Envy x360 15-fh0077ng | R7 7730U 48 W / 37 W | Vega 8 1200 / 2000 MHz 0.5 GB | 15.6 GB | 31139 |
| Geekom AS 5 | R9 5900HX 54 W / 35 W | Vega 8 | 32 GB | 31638 |
| LG UltraPC 14 14U70Q-G.AA79G | R7 5825U 25 W / 10 W | Vega 8 ? / 2133 MHz 0.5 GB | 16 GB | 31921 |
| Geekom A5 | R7 5800H 54 W / 35 W | Vega 8 | 32 GB | 32875 |
| Morefine S500+ | R9 5900HX 35 W / 54 W | Vega 8 | 32 GB | 32899 |
| Lenovo Legion 7 16ACHg6 | R9 5900HX | Vega 8 2100 / 1600 MHz 4 GB | 32 GB | 33672 |
| Beelink GTR5 | R9 5900HX 52 W / 46 W | Vega 8 ? / 1600 MHz 0.5 GB | 32 GB | 34507 |
| AMD Ryzen 7 5700G | R7 5700G 65 W / 65 W | Vega 8 65 W \ MHz 4 GB | 32 GB | 36134 |
| GPU TDP ? | TDP 11 W | TDP 15 W | TDP 65 W |
|---|---|---|---|
| 65% | 85% | 82% | 100% |
| Model | CPU | GPU | RAM | Value |
|---|---|---|---|---|
| Ninkear A15 Plus (16+512) | R7 5700U 30 W / 15 W | Vega 8 | 16 GB | 10185 |
| Asus VivoBook S15 D533UA | R7 5700U 35 W / 28 W | Vega 8 1900 / 1333 MHz 0.5 GB | 16 GB | 13199 |
| Asus ZenBook 13 OLED UM325UA | R7 5700U | Vega 8 | 0 GB | 13484 |
| Asus VivoBook 15 OLED M513UA-L1282W | R7 5700U 36 W / 25 W | Vega 8 1900 / 1600 MHz 0.5 GB | 16 GB | 13691 |
| Prime Computer Primestation Pulsar | R7 PRO 5750G 45 W / 45 W | Vega 8 ? / 1600 MHz 8 GB | 32 GB | 15417 |
| Lenovo Yoga Slim 7 Pro 14ACH5 | R9 5900HX 35 W / 25 W | Vega 8 ? / 1600 MHz 2 GB | 16 GB | 15542 |
| Geekom A5 | R7 5800H 54 W / 35 W | Vega 8 | 32 GB | 16735 |
| Lenovo Legion 7 16ACHg6 | R9 5900HX | Vega 8 2100 / 1600 MHz 4 GB | 32 GB | 17709 |
| AMD Ryzen 7 5700G | R7 5700G 65 W / 65 W | Vega 8 65 W \ MHz 4 GB | 32 GB | 18629 |
| GPU TDP ? | TDP 65 W |
|---|---|
| 73% | 100% |
| Model | CPU | GPU | RAM | Value |
|---|---|---|---|---|
| Ninkear A15 Plus (16+512) | R7 5700U 30 W / 15 W | Vega 8 | 16 GB | 10113 |
| Asus VivoBook S15 D533UA | R7 5700U 35 W / 28 W | Vega 8 1900 / 1333 MHz 0.5 GB | 16 GB | 13637 |
| Asus VivoBook 15 OLED M513UA-L1282W | R7 5700U 36 W / 25 W | Vega 8 1900 / 1600 MHz 0.5 GB | 16 GB | 14383 |
| Asus ZenBook 13 OLED UM325UA | R7 5700U | Vega 8 | 0 GB | 14905 |
| Prime Computer Primestation Pulsar | R7 PRO 5750G 45 W / 45 W | Vega 8 ? / 1600 MHz 8 GB | 32 GB | 16117 |
| Lenovo Yoga Slim 7 Pro 14ACH5 | R9 5900HX 35 W / 25 W | Vega 8 ? / 1600 MHz 2 GB | 16 GB | 16372 |
| Geekom A5 | R7 5800H 54 W / 35 W | Vega 8 | 32 GB | 17580 |
| Lenovo Legion 7 16ACHg6 | R9 5900HX | Vega 8 2100 / 1600 MHz 4 GB | 32 GB | 18765 |
| AMD Ryzen 7 5700G | R7 5700G 65 W / 65 W | Vega 8 65 W \ MHz 4 GB | 32 GB | 19703 |
| GPU TDP ? | TDP 65 W |
|---|---|
| 76% | 100% |
| GPU TDP ? | TDP 11 W | TDP 28 W |
|---|---|---|
| 85% | 98% | 100% |
| GPU TDP ? | TDP 11 W | TDP 15 W | TDP 28 W | TDP 65 W |
|---|---|---|---|---|
| 70% | 78% | 81% | 80% | 100% |
| GPU TDP ? | TDP 11 W | TDP 28 W |
|---|---|---|
| 87% | 99% | 100% |
| GPU TDP ? | TDP 11 W | TDP 15 W | TDP 28 W | TDP 65 W |
|---|---|---|---|---|
| 71% | 78% | 84% | 79% | 100% |
3DM Vant. Perf. total + Intel Iris Xe Graphics G7 80EUs
| Model | CPU | GPU | RAM | Value |
|---|---|---|---|---|
| Intel NUC Pro Chassis_i5_1145G7 | i5-1145G7 64 W / 28 W | Iris Xe G7 80EUs | 8 GB | 20679 |
| Intel NUC Pro Chassis_i5_1245U | i5-1245U | Iris Xe G7 80EUs | 16 GB | 21729 |
| Minisforum Venus Series NPB5 | i5-13500H 95 W / 45 W | Iris Xe G7 80EUs 1450 MHz | 16 GB | 26656 |
| Model | CPU | GPU | RAM | Value |
|---|---|---|---|---|
| NiPoGi AM06 Pro | R7 5700U | Vega 8 | 16 GB | 13611 |
| Minisforum HM90 | R9 4900H 45 W / 35 W | Vega 8 | 16 GB | 19152 |
| Lenovo Yoga Slim 7-14ARE | R7 4800U | Vega 8 1750 / 2133 MHz 0.5 GB | 16 GB | 20018 |
| Aoostar WTR Pro, R7 5825U | R7 5825U 30 W / 15 W | Vega 8 | 16 GB | 20313 |
| Minisforum EliteMini B550 | R7 5700G 77 W / 72 W | Vega 8 ? / 1600 MHz 0.5 GB | 16 GB | 20882 |
| Minisforum EliteMini HX90 | R9 5900HX 54 W / 54 W | Vega 8 | 16 GB | 21716 |
| Geekom AS 5 | R9 5900HX 54 W / 35 W | Vega 8 | 32 GB | 23140 |
| Geekom A5 | R7 5800H 54 W / 35 W | Vega 8 | 32 GB | 23176 |
| Prime Computer Primestation Pulsar | R7 PRO 5750G 45 W / 45 W | Vega 8 ? / 1600 MHz 8 GB | 32 GB | 23214 |
| Morefine S500+ | R9 5900HX 35 W / 54 W | Vega 8 | 32 GB | 23277 |
| Model | CPU | GPU | RAM | Value |
|---|---|---|---|---|
| Intel NUC Pro Chassis_i5_1245U | i5-1245U | Iris Xe G7 80EUs | 16 GB | 18551 |
| Intel NUC Pro Chassis_i5_1145G7 | i5-1145G7 64 W / 28 W | Iris Xe G7 80EUs | 8 GB | 18628 |
| Minisforum Venus Series NPB5 | i5-13500H 95 W / 45 W | Iris Xe G7 80EUs 1450 MHz | 16 GB | 22211 |
| Model | CPU | GPU | RAM | Value |
|---|---|---|---|---|
| NiPoGi AM06 Pro | R7 5700U | Vega 8 | 16 GB | 11067 |
| Minisforum HM90 | R9 4900H 45 W / 35 W | Vega 8 | 16 GB | 15576 |
| Lenovo Yoga Slim 7-14ARE | R7 4800U | Vega 8 1750 / 2133 MHz 0.5 GB | 16 GB | 16657 |
| Aoostar WTR Pro, R7 5825U | R7 5825U 30 W / 15 W | Vega 8 | 16 GB | 16707 |
| Minisforum EliteMini B550 | R7 5700G 77 W / 72 W | Vega 8 ? / 1600 MHz 0.5 GB | 16 GB | 16942 |
| Minisforum EliteMini HX90 | R9 5900HX 54 W / 54 W | Vega 8 | 16 GB | 17562 |
| Geekom AS 5 | R9 5900HX 54 W / 35 W | Vega 8 | 32 GB | 19026 |
| Prime Computer Primestation Pulsar | R7 PRO 5750G 45 W / 45 W | Vega 8 ? / 1600 MHz 8 GB | 32 GB | 19037 |
| Morefine S500+ | R9 5900HX 35 W / 54 W | Vega 8 | 32 GB | 19162 |
| Geekom A5 | R7 5800H 54 W / 35 W | Vega 8 | 32 GB | 19216 |
| Model | CPU | GPU | RAM | Value |
|---|---|---|---|---|
| Intel NUC Pro Chassis_i5_1145G7 | i5-1145G7 64 W / 28 W | Iris Xe G7 80EUs | 8 GB | 34227 |
| Intel NUC Pro Chassis_i5_1245U | i5-1245U | Iris Xe G7 80EUs | 16 GB | 37064 |
| Minisforum Venus Series NPB5 | i5-13500H 95 W / 45 W | Iris Xe G7 80EUs 1450 MHz | 16 GB | 45907 |
| Model | CPU | GPU | RAM | Value |
|---|---|---|---|---|
| NiPoGi AM06 Pro | R7 5700U | Vega 8 | 16 GB | 21791 |
| Minisforum HM90 | R9 4900H 45 W / 35 W | Vega 8 | 16 GB | 30964 |
| Morefine S500+ | R9 5900HX 35 W / 54 W | Vega 8 | 32 GB | 35488 |
| Aoostar WTR Pro, R7 5825U | R7 5825U 30 W / 15 W | Vega 8 | 16 GB | 37638 |
| Minisforum EliteMini B550 | R7 5700G 77 W / 72 W | Vega 8 ? / 1600 MHz 0.5 GB | 16 GB | 40632 |
| Minisforum EliteMini HX90 | R9 5900HX 54 W / 54 W | Vega 8 | 16 GB | 41727 |
| Geekom A5 | R7 5800H 54 W / 35 W | Vega 8 | 32 GB | 46183 |
| Model | CPU | GPU | RAM | Value | |
|---|---|---|---|---|---|
| 3DMark 06 - Standard 1280x1024 | |||||
| Dell XPS 13 9315, i5-1230U (3DMark 06 - Standard 1280x1024) | i5-1230U 29 W / 14 W | Iris Xe G7 80EUs | 8 GB | 15617 | |
| Acer Spin 3 SP313-51N-56YV (3DMark 06 - Standard 1280x1024) | i5-1135G7 64 W / 28 W | Iris Xe G7 80EUs 1300 / 2000 MHz | 16 GB | 23181 | |
| Dell Latitude 7420 JW6MH (3DMark 06 - Standard 1280x1024) | i5-1145G7 45 W / 14 W | Iris Xe G7 80EUs | 16 GB | 23871 | |
| Intel NUC Pro Chassis_i5_1145G7 (3DMark 06 - Standard 1280x1024) | i5-1145G7 64 W / 28 W | Iris Xe G7 80EUs | 8 GB | 25371 | |
| Intel NUC Pro Chassis_i5_1245U (3DMark 06 - Standard 1280x1024) | i5-1245U | Iris Xe G7 80EUs | 16 GB | 26011 | |
| Huawei MateBook 14 (2024) (3DMark 06 - Standard 1280x1024) | i5-1240P 66 W / 35 W | Iris Xe G7 80EUs 1300 / 1867 MHz | 16 GB | 26411 | |
| Samsung Galaxy Book3 Pro 16 (3DMark 06 - Standard 1280x1024) | i5-1340P 64 W / 40 W | Iris Xe G7 80EUs 1450 MHz | 8 GB | 28300 | |
| Xiaomi RedmiBook 14 2025 (3DMark 06 - Standard 1280x1024) | Core 5 220H 43 W / 32 W | Iris Xe G7 80EUs 1500 MHz | 32 GB | 30078 | |
| Minisforum Venus Series NPB5 (3DMark 06 - Standard 1280x1024) | i5-13500H 95 W / 45 W | Iris Xe G7 80EUs 1450 MHz | 16 GB | 34471 | |
| Model | CPU | GPU | RAM | Value | |
|---|---|---|---|---|---|
| 3DMark 06 - Standard 1280x1024 | |||||
| NiPoGi AM06 Pro (3DMark 06 - Standard 1280x1024) | R7 5700U | Vega 8 | 16 GB | 14473 | |
| Lenovo ThinkPad L15 Gen 4 21H70021GE (3DMark 06 - Standard 1280x1024) | R7 PRO 7730U 40 W / 31 W | Vega 8 2000 / 1600 MHz 1 GB | 16 GB | 14729 | |
| Lenovo ThinkPad T14s G2 20XGS01100 (3DMark 06 - Standard 1280x1024) | R7 PRO 5850U 30 W / 22 W | Vega 8 | 32 GB | 22663 | |
| Lenovo Yoga Slim 7-14ARE (3DMark 06 - Standard 1280x1024) | R7 4800U | Vega 8 1750 / 2133 MHz 0.5 GB | 16 GB | 22966 | |
| Lenovo Yoga 6 13 83B2001SGE (3DMark 06 - Standard 1280x1024) | R7 7730U 30 W / 25 W | Vega 8 | 16 GB | 23639 | |
| Minisforum EliteMini B550 (3DMark 06 - Standard 1280x1024) | R7 5700G 77 W / 72 W | Vega 8 ? / 1600 MHz 0.5 GB | 16 GB | 25069 | |
| Minisforum EliteMini HX90 (3DMark 06 - Standard 1280x1024) | R9 5900HX 54 W / 54 W | Vega 8 | 16 GB | 25886 | |
| LG UltraPC 14 14U70Q-G.AA79G (3DMark 06 - Standard 1280x1024) | R7 5825U 25 W / 10 W | Vega 8 ? / 2133 MHz 0.5 GB | 16 GB | 25949 | |
| Aoostar WTR Pro, R7 5825U (3DMark 06 - Standard 1280x1024) | R7 5825U 30 W / 15 W | Vega 8 | 16 GB | 26174 | |
| Morefine S500+ (3DMark 06 - Standard 1280x1024) | R9 5900HX 35 W / 54 W | Vega 8 | 32 GB | 29215 | |
| Geekom AS 5 (3DMark 06 - Standard 1280x1024) | R9 5900HX 54 W / 35 W | Vega 8 | 32 GB | 29311 | |
| Geekom A5 (3DMark 06 - Standard 1280x1024) | R7 5800H 54 W / 35 W | Vega 8 | 32 GB | 29357 | |
| AMD Ryzen 7 5700G (3DMark 06 - Standard 1280x1024) | R7 5700G 65 W / 65 W | Vega 8 65 W \ MHz 4 GB | 32 GB | 33790 | |
| GPU TDP ? | TDP 65 W |
|---|---|
| 74% | 100% |
| Model | CPU | GPU | RAM | Value | |
|---|---|---|---|---|---|
| 3DMark 06 - Standard 1366x768 | |||||
| Minisforum HM90 (3DMark 06 - Standard 1366x768) | R9 4900H 45 W / 35 W | Vega 8 | 16 GB | 34940 | |
| Model | CPU | GPU | RAM | Value |
|---|---|---|---|---|
| Intel NUC Pro Chassis_i5_1145G7 | i5-1145G7 64 W / 28 W | Iris Xe G7 80EUs | 8 GB | 14.6 |
| Intel NUC Pro Chassis_i5_1245U | i5-1245U | Iris Xe G7 80EUs | 16 GB | 14.9 |
| Minisforum Venus Series NPB5 | i5-13500H 95 W / 45 W | Iris Xe G7 80EUs 1450 MHz | 16 GB | 17 |
| Microsoft Surface Pro 7 Plus | i5-1135G7 60 W / 30 W | Iris Xe G7 80EUs 1300 MHz | 16 GB | 17.4 |
| Model | CPU | GPU | RAM | Value |
|---|---|---|---|---|
| NiPoGi AM06 Pro | R7 5700U | Vega 8 | 16 GB | 6.8 |
| Minisforum HM90 | R9 4900H 45 W / 35 W | Vega 8 | 16 GB | 10 |
| Minisforum EliteMini B550 | R7 5700G 77 W / 72 W | Vega 8 ? / 1600 MHz 0.5 GB | 16 GB | 10.6 |
| Minisforum EliteMini HX90 | R9 5900HX 54 W / 54 W | Vega 8 | 16 GB | 11.6 |
| Aoostar WTR Pro, R7 5825U | R7 5825U 30 W / 15 W | Vega 8 | 16 GB | 11.8 |
| Prime Computer Primestation Pulsar | R7 PRO 5750G 45 W / 45 W | Vega 8 ? / 1600 MHz 8 GB | 32 GB | 13.5 |
| Geekom AS 5 | R9 5900HX 54 W / 35 W | Vega 8 | 32 GB | 14.1 |
| Morefine S500+ | R9 5900HX 35 W / 54 W | Vega 8 | 32 GB | 14.2 |
| Geekom A5 | R7 5800H 54 W / 35 W | Vega 8 | 32 GB | 14.2 |
| AMD Ryzen 7 5700G | R7 5700G 65 W / 65 W | Vega 8 65 W \ MHz 4 GB | 32 GB | 16.4 |
| GPU TDP ? | TDP 65 W |
|---|---|
| 80% | 100% |
| Model | CPU | GPU | RAM | Value |
|---|---|---|---|---|
| Microsoft Surface Pro 7 Plus | i5-1135G7 60 W / 30 W | Iris Xe G7 80EUs 1300 MHz | 16 GB | 43.8 |
| Model | CPU | GPU | RAM | Value |
|---|---|---|---|---|
| Microsoft Surface Pro 7 Plus | i5-1135G7 60 W / 30 W | Iris Xe G7 80EUs 1300 MHz | 16 GB | 57.3 |
| Model | CPU | GPU | RAM | Value |
|---|---|---|---|---|
| Microsoft Surface Pro 7 Plus | i5-1135G7 60 W / 30 W | Iris Xe G7 80EUs 1300 MHz | 16 GB | 63.2 |
| Model | CPU | GPU | RAM | Value |
|---|---|---|---|---|
| Geekom A5 3.3.3 | R7 5800H 54 W / 35 W | Vega 8 | 32 GB | 477 |
| Geekom AS 5 3.3.3 | R9 5900HX 54 W / 35 W | Vega 8 | 32 GB | 524 |
| Asus ZenBook 14 UM3402Y 3.3.3 | R7 7730U 42 W / 30 W | Vega 8 2000 / 2133 MHz 0.5 GB | 16 GB | 603 |
| HP Envy x360 15-fh0077ng 3.3.3 | R7 7730U 48 W / 37 W | Vega 8 1200 / 2000 MHz 0.5 GB | 15.6 GB | 607 |
| Lenovo IdeaPad Flex 5 16ABR G8 3.3.3 | R7 7730U 48 W / 25 W | Vega 8 ? / 2133 MHz | 16 GB | 612 |
| Lenovo Yoga 6 13 83B2001SGE 3.3.0 | R7 7730U 30 W / 25 W | Vega 8 | 16 GB | 634 |
| Lenovo ThinkPad E14 G5-21JSS05C00 3.3.3 | R7 7730U 30 W / 30 W | Vega 8 | 24 GB | 691 |
| Lenovo ThinkPad E16 G1-21JUS08X00 3.3.3 | R7 7730U 25 W / 30 W | Vega 8 | 24 GB | 697 |
| HP Envy x360 15-ey0023dx 3.3.0 | R7 5825U 48 W / 37 W | Vega 8 ? / 1600 MHz 0.5 GB | 12 GB | 755 |
| Lenovo ThinkPad E14 G4 21EB0041GE 3.3.3 | R7 5825U 30 W / 30 W | Vega 8 2000 / 1600 MHz | 16 GB | 763 |
| HP EliteBook 645 G9, Ryzen 7 5825U 3.3.3 | R7 5825U | Vega 8 ? / 1600 MHz 0.5 GB | 16 GB | 927 |
| Lenovo ThinkPad L15 Gen 4 21H70021GE 3.3.3 | R7 PRO 7730U 40 W / 31 W | Vega 8 2000 / 1600 MHz 1 GB | 16 GB | 1133 |
specvp12 sw-03 + Intel Iris Xe Graphics G7 80EUs
| Model | CPU | GPU | RAM | Value |
|---|---|---|---|---|
| Minisforum Venus Series NPB5 | i5-13500H 95 W / 45 W | Iris Xe G7 80EUs 1450 MHz | 16 GB | 46.1 |
| Model | CPU | GPU | RAM | Value |
|---|---|---|---|---|
| Minisforum HM90 | R9 4900H 45 W / 35 W | Vega 8 | 16 GB | 49.3 |
| Minisforum EliteMini B550 | R7 5700G 77 W / 72 W | Vega 8 ? / 1600 MHz 0.5 GB | 16 GB | 59.4 |
| Prime Computer Primestation Pulsar | R7 PRO 5750G 45 W / 45 W | Vega 8 ? / 1600 MHz 8 GB | 32 GB | 60.7 |
| Minisforum EliteMini HX90 | R9 5900HX 54 W / 54 W | Vega 8 | 16 GB | 61.8 |
| Geekom AS 5 | R9 5900HX 54 W / 35 W | Vega 8 | 32 GB | 64.4 |
| Morefine S500+ | R9 5900HX 35 W / 54 W | Vega 8 | 32 GB | 64.5 |
| Geekom A5 | R7 5800H 54 W / 35 W | Vega 8 | 32 GB | 68.3 |
| AMD Ryzen 7 5700G | R7 5700G 65 W / 65 W | Vega 8 65 W \ MHz 4 GB | 32 GB | 71.1 |
| GPU TDP ? | TDP 65 W |
|---|---|
| 83% | 100% |
| Model | CPU | GPU | RAM | Value |
|---|---|---|---|---|
| Minisforum Venus Series NPB5 | i5-13500H 95 W / 45 W | Iris Xe G7 80EUs 1450 MHz | 16 GB | 3.81 |
| Model | CPU | GPU | RAM | Value |
|---|---|---|---|---|
| Minisforum HM90 | R9 4900H 45 W / 35 W | Vega 8 | 16 GB | 16.4 |
| Minisforum EliteMini B550 | R7 5700G 77 W / 72 W | Vega 8 ? / 1600 MHz 0.5 GB | 16 GB | 18.6 |
| Minisforum EliteMini HX90 | R9 5900HX 54 W / 54 W | Vega 8 | 16 GB | 20.1 |
| Prime Computer Primestation Pulsar | R7 PRO 5750G 45 W / 45 W | Vega 8 ? / 1600 MHz 8 GB | 32 GB | 20.9 |
| Morefine S500+ | R9 5900HX 35 W / 54 W | Vega 8 | 32 GB | 21.1 |
| Geekom AS 5 | R9 5900HX 54 W / 35 W | Vega 8 | 32 GB | 21.8 |
| AMD Ryzen 7 5700G | R7 5700G 65 W / 65 W | Vega 8 65 W \ MHz 4 GB | 32 GB | 22.2 |
| Geekom A5 | R7 5800H 54 W / 35 W | Vega 8 | 32 GB | 43.1 |
| GPU TDP ? | TDP 65 W |
|---|---|
| 93% | 100% |
| Model | CPU | GPU | RAM | Value |
|---|---|---|---|---|
| Minisforum Venus Series NPB5 | i5-13500H 95 W / 45 W | Iris Xe G7 80EUs 1450 MHz | 16 GB | 20.4 |
| Model | CPU | GPU | RAM | Value |
|---|---|---|---|---|
| Minisforum HM90 | R9 4900H 45 W / 35 W | Vega 8 | 16 GB | 13.3 |
| Minisforum EliteMini B550 | R7 5700G 77 W / 72 W | Vega 8 ? / 1600 MHz 0.5 GB | 16 GB | 13.7 |
| Minisforum EliteMini HX90 | R9 5900HX 54 W / 54 W | Vega 8 | 16 GB | 14.4 |
| Morefine S500+ | R9 5900HX 35 W / 54 W | Vega 8 | 32 GB | 17.4 |
| Geekom AS 5 | R9 5900HX 54 W / 35 W | Vega 8 | 32 GB | 17.4 |
| Prime Computer Primestation Pulsar | R7 PRO 5750G 45 W / 45 W | Vega 8 ? / 1600 MHz 8 GB | 32 GB | 17.5 |
| Geekom A5 | R7 5800H 54 W / 35 W | Vega 8 | 32 GB | 21.7 |
| AMD Ryzen 7 5700G | R7 5700G 65 W / 65 W | Vega 8 65 W \ MHz 4 GB | 32 GB | 22 |
| GPU TDP ? | TDP 65 W |
|---|---|
| 77% | 100% |
| Model | CPU | GPU | RAM | Value |
|---|---|---|---|---|
| Minisforum Venus Series NPB5 | i5-13500H 95 W / 45 W | Iris Xe G7 80EUs 1450 MHz | 16 GB | 8.44 |
| Model | CPU | GPU | RAM | Value |
|---|---|---|---|---|
| Minisforum HM90 | R9 4900H 45 W / 35 W | Vega 8 | 16 GB | 11.7 |
| Minisforum EliteMini HX90 | R9 5900HX 54 W / 54 W | Vega 8 | 16 GB | 12.2 |
| Minisforum EliteMini B550 | R7 5700G 77 W / 72 W | Vega 8 ? / 1600 MHz 0.5 GB | 16 GB | 12.4 |
| Prime Computer Primestation Pulsar | R7 PRO 5750G 45 W / 45 W | Vega 8 ? / 1600 MHz 8 GB | 32 GB | 14.7 |
| Morefine S500+ | R9 5900HX 35 W / 54 W | Vega 8 | 32 GB | 14.8 |
| AMD Ryzen 7 5700G | R7 5700G 65 W / 65 W | Vega 8 65 W \ MHz 4 GB | 32 GB | 15.3 |
| Geekom AS 5 | R9 5900HX 54 W / 35 W | Vega 8 | 32 GB | 16.5 |
| Geekom A5 | R7 5800H 54 W / 35 W | Vega 8 | 32 GB | 18.2 |
| GPU TDP ? | TDP 65 W |
|---|---|
| 89% | 100% |
| Model | CPU | GPU | RAM | Value |
|---|---|---|---|---|
| Minisforum Venus Series NPB5 | i5-13500H 95 W / 45 W | Iris Xe G7 80EUs 1450 MHz | 16 GB | 35.9 |
| Model | CPU | GPU | RAM | Value |
|---|---|---|---|---|
| Minisforum HM90 | R9 4900H 45 W / 35 W | Vega 8 | 16 GB | 26.6 |
| Minisforum EliteMini B550 | R7 5700G 77 W / 72 W | Vega 8 ? / 1600 MHz 0.5 GB | 16 GB | 30 |
| Minisforum EliteMini HX90 | R9 5900HX 54 W / 54 W | Vega 8 | 16 GB | 31 |
| Prime Computer Primestation Pulsar | R7 PRO 5750G 45 W / 45 W | Vega 8 ? / 1600 MHz 8 GB | 32 GB | 36.4 |
| Geekom AS 5 | R9 5900HX 54 W / 35 W | Vega 8 | 32 GB | 36.7 |
| Morefine S500+ | R9 5900HX 35 W / 54 W | Vega 8 | 32 GB | 36.8 |
| Geekom A5 | R7 5800H 54 W / 35 W | Vega 8 | 32 GB | 40.3 |
| AMD Ryzen 7 5700G | R7 5700G 65 W / 65 W | Vega 8 65 W \ MHz 4 GB | 32 GB | 43.5 |
| GPU TDP ? | TDP 65 W |
|---|---|
| 79% | 100% |
| Model | CPU | GPU | RAM | Value |
|---|---|---|---|---|
| Minisforum Venus Series NPB5 | i5-13500H 95 W / 45 W | Iris Xe G7 80EUs 1450 MHz | 16 GB | 0.35 |
| Model | CPU | GPU | RAM | Value |
|---|---|---|---|---|
| Minisforum HM90 | R9 4900H 45 W / 35 W | Vega 8 | 16 GB | 0.5 |
| Minisforum EliteMini HX90 | R9 5900HX 54 W / 54 W | Vega 8 | 16 GB | 0.52 |
| Minisforum EliteMini B550 | R7 5700G 77 W / 72 W | Vega 8 ? / 1600 MHz 0.5 GB | 16 GB | 0.53 |
| Geekom AS 5 | R9 5900HX 54 W / 35 W | Vega 8 | 32 GB | 0.71 |
| Morefine S500+ | R9 5900HX 35 W / 54 W | Vega 8 | 32 GB | 2.19 |
| Prime Computer Primestation Pulsar | R7 PRO 5750G 45 W / 45 W | Vega 8 ? / 1600 MHz 8 GB | 32 GB | 2.28 |
| AMD Ryzen 7 5700G | R7 5700G 65 W / 65 W | Vega 8 65 W \ MHz 4 GB | 32 GB | 2.68 |
| GPU TDP ? | TDP 65 W |
|---|---|
| 38% | 100% |
| Model | CPU | GPU | RAM | Value |
|---|---|---|---|---|
| Minisforum Venus Series NPB5 | i5-13500H 95 W / 45 W | Iris Xe G7 80EUs 1450 MHz | 16 GB | 23.4 |
| Model | CPU | GPU | RAM | Value |
|---|---|---|---|---|
| Minisforum HM90 | R9 4900H 45 W / 35 W | Vega 8 | 16 GB | 29.9 |
| Minisforum EliteMini B550 | R7 5700G 77 W / 72 W | Vega 8 ? / 1600 MHz 0.5 GB | 16 GB | 34.6 |
| Minisforum EliteMini HX90 | R9 5900HX 54 W / 54 W | Vega 8 | 16 GB | 35.9 |
| Prime Computer Primestation Pulsar | R7 PRO 5750G 45 W / 45 W | Vega 8 ? / 1600 MHz 8 GB | 32 GB | 36.1 |
| Geekom A5 | R7 5800H 54 W / 35 W | Vega 8 | 32 GB | 36.3 |
| Morefine S500+ | R9 5900HX 35 W / 54 W | Vega 8 | 32 GB | 37.2 |
| Geekom AS 5 | R9 5900HX 54 W / 35 W | Vega 8 | 32 GB | 37.8 |
| AMD Ryzen 7 5700G | R7 5700G 65 W / 65 W | Vega 8 65 W \ MHz 4 GB | 32 GB | 42.4 |
| GPU TDP ? | TDP 65 W |
|---|---|
| 80% | 100% |
| Model | CPU | GPU | RAM | Value |
|---|---|---|---|---|
| Minisforum Venus Series NPB5 | i5-13500H 95 W / 45 W | Iris Xe G7 80EUs 1450 MHz | 16 GB | 31 |
| Model | CPU | GPU | RAM | Value |
|---|---|---|---|---|
| Minisforum HM90 | R9 4900H 45 W / 35 W | Vega 8 | 16 GB | 32.7 |
| Minisforum EliteMini B550 | R7 5700G 77 W / 72 W | Vega 8 ? / 1600 MHz 0.5 GB | 16 GB | 34.4 |
| Minisforum EliteMini HX90 | R9 5900HX 54 W / 54 W | Vega 8 | 16 GB | 37.7 |
| Morefine S500+ | R9 5900HX 35 W / 54 W | Vega 8 | 32 GB | 41.2 |
| Prime Computer Primestation Pulsar | R7 PRO 5750G 45 W / 45 W | Vega 8 ? / 1600 MHz 8 GB | 32 GB | 42.3 |
| Geekom AS 5 | R9 5900HX 54 W / 35 W | Vega 8 | 32 GB | 42.8 |
| Geekom A5 | R7 5800H 54 W / 35 W | Vega 8 | 32 GB | 44.2 |
| AMD Ryzen 7 5700G | R7 5700G 65 W / 65 W | Vega 8 65 W \ MHz 4 GB | 32 GB | 48 |
| GPU TDP ? | TDP 65 W |
|---|---|
| 80% | 100% |
| Model | CPU | GPU | RAM | Value |
|---|---|---|---|---|
| Minisforum Venus Series NPB5 | i5-13500H 95 W / 45 W | Iris Xe G7 80EUs 1450 MHz | 16 GB | 41.5 |
| Model | CPU | GPU | RAM | Value |
|---|---|---|---|---|
| Minisforum HM90 | R9 4900H 45 W / 35 W | Vega 8 | 16 GB | 37.4 |
| Minisforum EliteMini B550 | R7 5700G 77 W / 72 W | Vega 8 ? / 1600 MHz 0.5 GB | 16 GB | 40.8 |
| Minisforum EliteMini HX90 | R9 5900HX 54 W / 54 W | Vega 8 | 16 GB | 43.7 |
| Prime Computer Primestation Pulsar | R7 PRO 5750G 45 W / 45 W | Vega 8 ? / 1600 MHz 8 GB | 32 GB | 46.9 |
| Morefine S500+ | R9 5900HX 35 W / 54 W | Vega 8 | 32 GB | 47.5 |
| Geekom AS 5 | R9 5900HX 54 W / 35 W | Vega 8 | 32 GB | 48.8 |
| Geekom A5 | R7 5800H 54 W / 35 W | Vega 8 | 32 GB | 51.7 |
| AMD Ryzen 7 5700G | R7 5700G 65 W / 65 W | Vega 8 65 W \ MHz 4 GB | 32 GB | 53 |
| GPU TDP ? | TDP 65 W |
|---|---|
| 85% | 100% |
| Model | CPU | GPU | RAM | Value |
|---|---|---|---|---|
| Minisforum Venus Series NPB5 | i5-13500H 95 W / 45 W | Iris Xe G7 80EUs 1450 MHz | 16 GB | 56 |
| Model | CPU | GPU | RAM | Value |
|---|---|---|---|---|
| Minisforum HM90 | R9 4900H 45 W / 35 W | Vega 8 | 16 GB | 57.4 |
| Lenovo ThinkPad P14s G2 AMD | R7 PRO 5850U 26 W / 24 W | Vega 8 | 32 GB | 63.3 |
| Minisforum EliteMini B550 | R7 5700G 77 W / 72 W | Vega 8 ? / 1600 MHz 0.5 GB | 16 GB | 67.7 |
| Minisforum EliteMini HX90 | R9 5900HX 54 W / 54 W | Vega 8 | 16 GB | 69.6 |
| Prime Computer Primestation Pulsar | R7 PRO 5750G 45 W / 45 W | Vega 8 ? / 1600 MHz 8 GB | 32 GB | 70.2 |
| Morefine S500+ | R9 5900HX 35 W / 54 W | Vega 8 | 32 GB | 71.7 |
| Geekom AS 5 | R9 5900HX 54 W / 35 W | Vega 8 | 32 GB | 72.4 |
| Geekom A5 | R7 5800H 54 W / 35 W | Vega 8 | 32 GB | 72.4 |
| AMD Ryzen 7 5700G | R7 5700G 65 W / 65 W | Vega 8 65 W \ MHz 4 GB | 32 GB | 79.4 |
| GPU TDP ? | TDP 65 W |
|---|---|
| 84% | 100% |
| Model | CPU | GPU | RAM | Value |
|---|---|---|---|---|
| Minisforum Venus Series NPB5 | i5-13500H 95 W / 45 W | Iris Xe G7 80EUs 1450 MHz | 16 GB | 6.83 |
| Model | CPU | GPU | RAM | Value |
|---|---|---|---|---|
| Minisforum HM90 | R9 4900H 45 W / 35 W | Vega 8 | 16 GB | 29.6 |
| Minisforum EliteMini B550 | R7 5700G 77 W / 72 W | Vega 8 ? / 1600 MHz 0.5 GB | 16 GB | 33.6 |
| Minisforum EliteMini HX90 | R9 5900HX 54 W / 54 W | Vega 8 | 16 GB | 36.3 |
| Prime Computer Primestation Pulsar | R7 PRO 5750G 45 W / 45 W | Vega 8 ? / 1600 MHz 8 GB | 32 GB | 36.7 |
| Morefine S500+ | R9 5900HX 35 W / 54 W | Vega 8 | 32 GB | 38.2 |
| Geekom AS 5 | R9 5900HX 54 W / 35 W | Vega 8 | 32 GB | 38.9 |
| AMD Ryzen 7 5700G | R7 5700G 65 W / 65 W | Vega 8 65 W \ MHz 4 GB | 32 GB | 39.9 |
| Lenovo ThinkPad P14s G2 AMD | R7 PRO 5850U 26 W / 24 W | Vega 8 | 32 GB | 66.3 |
| Geekom A5 | R7 5800H 54 W / 35 W | Vega 8 | 32 GB | 78.2 |
| GPU TDP ? | TDP 65 W |
|---|---|
| 100% | 98% |
| Model | CPU | GPU | RAM | Value |
|---|---|---|---|---|
| Minisforum Venus Series NPB5 | i5-13500H 95 W / 45 W | Iris Xe G7 80EUs 1450 MHz | 16 GB | 20.4 |
| Model | CPU | GPU | RAM | Value |
|---|---|---|---|---|
| Minisforum HM90 | R9 4900H 45 W / 35 W | Vega 8 | 16 GB | 13.5 |
| Minisforum EliteMini B550 | R7 5700G 77 W / 72 W | Vega 8 ? / 1600 MHz 0.5 GB | 16 GB | 13.8 |
| Minisforum EliteMini HX90 | R9 5900HX 54 W / 54 W | Vega 8 | 16 GB | 14.1 |
| Geekom AS 5 | R9 5900HX 54 W / 35 W | Vega 8 | 32 GB | 17.1 |
| Morefine S500+ | R9 5900HX 35 W / 54 W | Vega 8 | 32 GB | 17.3 |
| Prime Computer Primestation Pulsar | R7 PRO 5750G 45 W / 45 W | Vega 8 ? / 1600 MHz 8 GB | 32 GB | 17.4 |
| Lenovo ThinkPad P14s G2 AMD | R7 PRO 5850U 26 W / 24 W | Vega 8 | 32 GB | 19 |
| Geekom A5 | R7 5800H 54 W / 35 W | Vega 8 | 32 GB | 21.5 |
| AMD Ryzen 7 5700G | R7 5700G 65 W / 65 W | Vega 8 65 W \ MHz 4 GB | 32 GB | 22 |
| GPU TDP ? | TDP 65 W |
|---|---|
| 78% | 100% |
| Model | CPU | GPU | RAM | Value |
|---|---|---|---|---|
| Minisforum Venus Series NPB5 | i5-13500H 95 W / 45 W | Iris Xe G7 80EUs 1450 MHz | 16 GB | 7.92 |
| Model | CPU | GPU | RAM | Value |
|---|---|---|---|---|
| Minisforum HM90 | R9 4900H 45 W / 35 W | Vega 8 | 16 GB | 16.4 |
| Lenovo ThinkPad P14s G2 AMD | R7 PRO 5850U 26 W / 24 W | Vega 8 | 32 GB | 18.58 |
| Minisforum EliteMini B550 | R7 5700G 77 W / 72 W | Vega 8 ? / 1600 MHz 0.5 GB | 16 GB | 18.7 |
| Minisforum EliteMini HX90 | R9 5900HX 54 W / 54 W | Vega 8 | 16 GB | 19.2 |
| Prime Computer Primestation Pulsar | R7 PRO 5750G 45 W / 45 W | Vega 8 ? / 1600 MHz 8 GB | 32 GB | 20.4 |
| Geekom AS 5 | R9 5900HX 54 W / 35 W | Vega 8 | 32 GB | 20.5 |
| Morefine S500+ | R9 5900HX 35 W / 54 W | Vega 8 | 32 GB | 21.2 |
| AMD Ryzen 7 5700G | R7 5700G 65 W / 65 W | Vega 8 65 W \ MHz 4 GB | 32 GB | 21.7 |
| Geekom A5 | R7 5800H 54 W / 35 W | Vega 8 | 32 GB | 31 |
| GPU TDP ? | TDP 65 W |
|---|---|
| 89% | 100% |
| Model | CPU | GPU | RAM | Value |
|---|---|---|---|---|
| Minisforum Venus Series NPB5 | i5-13500H 95 W / 45 W | Iris Xe G7 80EUs 1450 MHz | 16 GB | 46 |
| Model | CPU | GPU | RAM | Value |
|---|---|---|---|---|
| Minisforum HM90 | R9 4900H 45 W / 35 W | Vega 8 | 16 GB | 35.1 |
| Minisforum EliteMini HX90 | R9 5900HX 54 W / 54 W | Vega 8 | 16 GB | 38.9 |
| Minisforum EliteMini B550 | R7 5700G 77 W / 72 W | Vega 8 ? / 1600 MHz 0.5 GB | 16 GB | 39.1 |
| Prime Computer Primestation Pulsar | R7 PRO 5750G 45 W / 45 W | Vega 8 ? / 1600 MHz 8 GB | 32 GB | 48 |
| Morefine S500+ | R9 5900HX 35 W / 54 W | Vega 8 | 32 GB | 48.6 |
| Geekom AS 5 | R9 5900HX 54 W / 35 W | Vega 8 | 32 GB | 49.2 |
| Lenovo ThinkPad P14s G2 AMD | R7 PRO 5850U 26 W / 24 W | Vega 8 | 32 GB | 49.48 |
| Geekom A5 | R7 5800H 54 W / 35 W | Vega 8 | 32 GB | 56.5 |
| AMD Ryzen 7 5700G | R7 5700G 65 W / 65 W | Vega 8 65 W \ MHz 4 GB | 32 GB | 58.5 |
| GPU TDP ? | TDP 65 W |
|---|---|
| 78% | 100% |
| Model | CPU | GPU | RAM | Value |
|---|---|---|---|---|
| Minisforum Venus Series NPB5 | i5-13500H 95 W / 45 W | Iris Xe G7 80EUs 1450 MHz | 16 GB | 2.03 |
| Model | CPU | GPU | RAM | Value |
|---|---|---|---|---|
| Minisforum HM90 | R9 4900H 45 W / 35 W | Vega 8 | 16 GB | 0.82 |
| Minisforum EliteMini B550 | R7 5700G 77 W / 72 W | Vega 8 ? / 1600 MHz 0.5 GB | 16 GB | 0.87 |
| Minisforum EliteMini HX90 | R9 5900HX 54 W / 54 W | Vega 8 | 16 GB | 0.88 |
| Geekom AS 5 | R9 5900HX 54 W / 35 W | Vega 8 | 32 GB | 0.99 |
| Morefine S500+ | R9 5900HX 35 W / 54 W | Vega 8 | 32 GB | 6.93 |
| Prime Computer Primestation Pulsar | R7 PRO 5750G 45 W / 45 W | Vega 8 ? / 1600 MHz 8 GB | 32 GB | 6.97 |
| AMD Ryzen 7 5700G | R7 5700G 65 W / 65 W | Vega 8 65 W \ MHz 4 GB | 32 GB | 7.57 |
| Lenovo ThinkPad P14s G2 AMD | R7 PRO 5850U 26 W / 24 W | Vega 8 | 32 GB | 8.09 |
| Geekom A5 | R7 5800H 54 W / 35 W | Vega 8 | 32 GB | 10.6 |
| GPU TDP ? | TDP 65 W |
|---|---|
| 56% | 100% |
| Model | CPU | GPU | RAM | Value |
|---|---|---|---|---|
| Minisforum Venus Series NPB5 | i5-13500H 95 W / 45 W | Iris Xe G7 80EUs 1450 MHz | 16 GB | 37.1 |
| Model | CPU | GPU | RAM | Value |
|---|---|---|---|---|
| Minisforum HM90 | R9 4900H 45 W / 35 W | Vega 8 | 16 GB | 37.7 |
| Minisforum EliteMini B550 | R7 5700G 77 W / 72 W | Vega 8 ? / 1600 MHz 0.5 GB | 16 GB | 41.8 |
| Minisforum EliteMini HX90 | R9 5900HX 54 W / 54 W | Vega 8 | 16 GB | 44.9 |
| Lenovo ThinkPad P14s G2 AMD | R7 PRO 5850U 26 W / 24 W | Vega 8 | 32 GB | 45.45 |
| Prime Computer Primestation Pulsar | R7 PRO 5750G 45 W / 45 W | Vega 8 ? / 1600 MHz 8 GB | 32 GB | 49 |
| Morefine S500+ | R9 5900HX 35 W / 54 W | Vega 8 | 32 GB | 50.4 |
| Geekom A5 | R7 5800H 54 W / 35 W | Vega 8 | 32 GB | 50.6 |
| Geekom AS 5 | R9 5900HX 54 W / 35 W | Vega 8 | 32 GB | 50.7 |
| AMD Ryzen 7 5700G | R7 5700G 65 W / 65 W | Vega 8 65 W \ MHz 4 GB | 32 GB | 59.3 |
| GPU TDP ? | TDP 65 W |
|---|---|
| 76% | 100% |
| Model | CPU | GPU | RAM | Value |
|---|---|---|---|---|
| Minisforum Venus Series NPB5 | i5-13500H 95 W / 45 W | Iris Xe G7 80EUs 1450 MHz | 16 GB | 44.8 |
| Model | CPU | GPU | RAM | Value |
|---|---|---|---|---|
| Minisforum HM90 | R9 4900H 45 W / 35 W | Vega 8 | 16 GB | 46.4 |
| Minisforum EliteMini B550 | R7 5700G 77 W / 72 W | Vega 8 ? / 1600 MHz 0.5 GB | 16 GB | 49.3 |
| Lenovo ThinkPad P14s G2 AMD | R7 PRO 5850U 26 W / 24 W | Vega 8 | 32 GB | 49.93 |
| Minisforum EliteMini HX90 | R9 5900HX 54 W / 54 W | Vega 8 | 16 GB | 52.2 |
| Geekom AS 5 | R9 5900HX 54 W / 35 W | Vega 8 | 32 GB | 57.9 |
| Morefine S500+ | R9 5900HX 35 W / 54 W | Vega 8 | 32 GB | 59.3 |
| Prime Computer Primestation Pulsar | R7 PRO 5750G 45 W / 45 W | Vega 8 ? / 1600 MHz 8 GB | 32 GB | 59.9 |
| Geekom A5 | R7 5800H 54 W / 35 W | Vega 8 | 32 GB | 62.1 |
| AMD Ryzen 7 5700G | R7 5700G 65 W / 65 W | Vega 8 65 W \ MHz 4 GB | 32 GB | 69.1 |
| GPU TDP ? | TDP 65 W |
|---|---|
| 77% | 100% |
| Model | CPU | GPU | RAM | Value |
|---|---|---|---|---|
| Minisforum Venus Series NPB5 | i5-13500H 95 W / 45 W | Iris Xe G7 80EUs 1450 MHz | 16 GB | 41.5 |
| Model | CPU | GPU | RAM | Value |
|---|---|---|---|---|
| Minisforum HM90 | R9 4900H 45 W / 35 W | Vega 8 | 16 GB | 37.8 |
| Minisforum EliteMini B550 | R7 5700G 77 W / 72 W | Vega 8 ? / 1600 MHz 0.5 GB | 16 GB | 40.5 |
| Minisforum EliteMini HX90 | R9 5900HX 54 W / 54 W | Vega 8 | 16 GB | 42.9 |
| Lenovo ThinkPad P14s G2 AMD | R7 PRO 5850U 26 W / 24 W | Vega 8 | 32 GB | 46.77 |
| Prime Computer Primestation Pulsar | R7 PRO 5750G 45 W / 45 W | Vega 8 ? / 1600 MHz 8 GB | 32 GB | 46.8 |
| Morefine S500+ | R9 5900HX 35 W / 54 W | Vega 8 | 32 GB | 47.5 |
| Geekom AS 5 | R9 5900HX 54 W / 35 W | Vega 8 | 32 GB | 47.8 |
| Geekom A5 | R7 5800H 54 W / 35 W | Vega 8 | 32 GB | 51.6 |
| AMD Ryzen 7 5700G | R7 5700G 65 W / 65 W | Vega 8 65 W \ MHz 4 GB | 32 GB | 52.9 |
| GPU TDP ? | TDP 65 W |
|---|---|
| 85% | 100% |
| Model | CPU | GPU | RAM | Value |
|---|---|---|---|---|
| Minisforum Venus Series NPB5 | i5-13500H 95 W / 45 W | Iris Xe G7 80EUs 1450 MHz | 16 GB | 7.27 |
| Model | CPU | GPU | RAM | Value |
|---|---|---|---|---|
| Prime Computer Primestation Pulsar | R7 PRO 5750G 45 W / 45 W | Vega 8 ? / 1600 MHz 8 GB | 32 GB | 10.8 |
| Morefine S500+ | R9 5900HX 35 W / 54 W | Vega 8 | 32 GB | 11.1 |
| AMD Ryzen 7 5700G | R7 5700G 65 W / 65 W | Vega 8 65 W \ MHz 4 GB | 32 GB | 12.2 |
| Geekom A5 | R7 5800H 54 W / 35 W | Vega 8 | 32 GB | 12.5 |
| GPU TDP ? | TDP 65 W |
|---|---|
| 85% | 100% |
| Model | CPU | GPU | RAM | Value |
|---|---|---|---|---|
| Minisforum Venus Series NPB5 | i5-13500H 95 W / 45 W | Iris Xe G7 80EUs 1450 MHz | 16 GB | 6.71 |
| Model | CPU | GPU | RAM | Value |
|---|---|---|---|---|
| Minisforum EliteMini HX90 | R9 5900HX 54 W / 54 W | Vega 8 | 16 GB | 22 |
| Prime Computer Primestation Pulsar | R7 PRO 5750G 45 W / 45 W | Vega 8 ? / 1600 MHz 8 GB | 32 GB | 23.5 |
| Morefine S500+ | R9 5900HX 35 W / 54 W | Vega 8 | 32 GB | 26.1 |
| AMD Ryzen 7 5700G | R7 5700G 65 W / 65 W | Vega 8 65 W \ MHz 4 GB | 32 GB | 27.8 |
| Aoostar WTR Pro, R7 5825U | R7 5825U 30 W / 15 W | Vega 8 | 16 GB | 28.3 |
| Geekom A5 | R7 5800H 54 W / 35 W | Vega 8 | 32 GB | 38 |
| GPU TDP ? | TDP 65 W |
|---|---|
| 87% | 100% |
| Model | CPU | GPU | RAM | Value |
|---|---|---|---|---|
| Minisforum Venus Series NPB5 | i5-13500H 95 W / 45 W | Iris Xe G7 80EUs 1450 MHz | 16 GB | 1.37 |
| Model | CPU | GPU | RAM | Value |
|---|---|---|---|---|
| Minisforum EliteMini HX90 | R9 5900HX 54 W / 54 W | Vega 8 | 16 GB | 3.12 |
| Prime Computer Primestation Pulsar | R7 PRO 5750G 45 W / 45 W | Vega 8 ? / 1600 MHz 8 GB | 32 GB | 3.18 |
| AMD Ryzen 7 5700G | R7 5700G 65 W / 65 W | Vega 8 65 W \ MHz 4 GB | 32 GB | 3.3 |
| Morefine S500+ | R9 5900HX 35 W / 54 W | Vega 8 | 32 GB | 3.34 |
| Aoostar WTR Pro, R7 5825U | R7 5825U 30 W / 15 W | Vega 8 | 16 GB | 3.38 |
| Geekom A5 | R7 5800H 54 W / 35 W | Vega 8 | 32 GB | 4.82 |
| GPU TDP ? | TDP 65 W |
|---|---|
| 97% | 100% |
| Model | CPU | GPU | RAM | Value |
|---|---|---|---|---|
| Minisforum Venus Series NPB5 | i5-13500H 95 W / 45 W | Iris Xe G7 80EUs 1450 MHz | 16 GB | 23.6 |
| Model | CPU | GPU | RAM | Value |
|---|---|---|---|---|
| Minisforum EliteMini HX90 | R9 5900HX 54 W / 54 W | Vega 8 | 16 GB | 16.5 |
| Aoostar WTR Pro, R7 5825U | R7 5825U 30 W / 15 W | Vega 8 | 16 GB | 19.8 |
| Prime Computer Primestation Pulsar | R7 PRO 5750G 45 W / 45 W | Vega 8 ? / 1600 MHz 8 GB | 32 GB | 21.7 |
| Morefine S500+ | R9 5900HX 35 W / 54 W | Vega 8 | 32 GB | 23.1 |
| Geekom A5 | R7 5800H 54 W / 35 W | Vega 8 | 32 GB | 25.8 |
| AMD Ryzen 7 5700G | R7 5700G 65 W / 65 W | Vega 8 65 W \ MHz 4 GB | 32 GB | 26.6 |
| GPU TDP ? | TDP 65 W |
|---|---|
| 82% | 100% |
| Model | CPU | GPU | RAM | Value |
|---|---|---|---|---|
| Minisforum Venus Series NPB5 | i5-13500H 95 W / 45 W | Iris Xe G7 80EUs 1450 MHz | 16 GB | 1.18 |
| Model | CPU | GPU | RAM | Value |
|---|---|---|---|---|
| Minisforum EliteMini HX90 | R9 5900HX 54 W / 54 W | Vega 8 | 16 GB | 0.61 |
| Prime Computer Primestation Pulsar | R7 PRO 5750G 45 W / 45 W | Vega 8 ? / 1600 MHz 8 GB | 32 GB | 4.21 |
| AMD Ryzen 7 5700G | R7 5700G 65 W / 65 W | Vega 8 65 W \ MHz 4 GB | 32 GB | 4.47 |
| Geekom A5 | R7 5800H 54 W / 35 W | Vega 8 | 32 GB | 5.33 |
| Aoostar WTR Pro, R7 5825U | R7 5825U 30 W / 15 W | Vega 8 | 16 GB | 6.11 |
| Morefine S500+ | R9 5900HX 35 W / 54 W | Vega 8 | 32 GB | 11 |
| GPU TDP ? | TDP 65 W |
|---|---|
| 100% | 94% |
| Model | CPU | GPU | RAM | Value |
|---|---|---|---|---|
| Minisforum Venus Series NPB5 | i5-13500H 95 W / 45 W | Iris Xe G7 80EUs 1450 MHz | 16 GB | 13.6 |
| Model | CPU | GPU | RAM | Value |
|---|---|---|---|---|
| Minisforum EliteMini HX90 | R9 5900HX 54 W / 54 W | Vega 8 | 16 GB | 13.9 |
| Aoostar WTR Pro, R7 5825U | R7 5825U 30 W / 15 W | Vega 8 | 16 GB | 15.5 |
| Prime Computer Primestation Pulsar | R7 PRO 5750G 45 W / 45 W | Vega 8 ? / 1600 MHz 8 GB | 32 GB | 16.2 |
| Morefine S500+ | R9 5900HX 35 W / 54 W | Vega 8 | 32 GB | 17.6 |
| Geekom A5 | R7 5800H 54 W / 35 W | Vega 8 | 32 GB | 19.1 |
| AMD Ryzen 7 5700G | R7 5700G 65 W / 65 W | Vega 8 65 W \ MHz 4 GB | 32 GB | 20.4 |
| GPU TDP ? | TDP 65 W |
|---|---|
| 78% | 100% |
| Model | CPU | GPU | RAM | Value |
|---|---|---|---|---|
| Minisforum Venus Series NPB5 | i5-13500H 95 W / 45 W | Iris Xe G7 80EUs 1450 MHz | 16 GB | 7.41 |
| Model | CPU | GPU | RAM | Value |
|---|---|---|---|---|
| Minisforum EliteMini HX90 | R9 5900HX 54 W / 54 W | Vega 8 | 16 GB | 7.03 |
| Prime Computer Primestation Pulsar | R7 PRO 5750G 45 W / 45 W | Vega 8 ? / 1600 MHz 8 GB | 32 GB | 8.1 |
| Morefine S500+ | R9 5900HX 35 W / 54 W | Vega 8 | 32 GB | 8.46 |
| AMD Ryzen 7 5700G | R7 5700G 65 W / 65 W | Vega 8 65 W \ MHz 4 GB | 32 GB | 9.53 |
| Geekom A5 | R7 5800H 54 W / 35 W | Vega 8 | 32 GB | 13.1 |
| GPU TDP ? | TDP 65 W |
|---|---|
| 93% | 100% |
| Model | CPU | GPU | RAM | Value |
|---|---|---|---|---|
| Minisforum Venus Series NPB5 | i5-13500H 95 W / 45 W | Iris Xe G7 80EUs 1450 MHz | 16 GB | 10.1 |
| Model | CPU | GPU | RAM | Value |
|---|---|---|---|---|
| Aoostar WTR Pro, R7 5825U | R7 5825U 30 W / 15 W | Vega 8 | 16 GB | 9.01 |
| Minisforum EliteMini HX90 | R9 5900HX 54 W / 54 W | Vega 8 | 16 GB | 9.02 |
| Geekom A5 | R7 5800H 54 W / 35 W | Vega 8 | 32 GB | 11.3 |
| Morefine S500+ | R9 5900HX 35 W / 54 W | Vega 8 | 32 GB | 11.6 |
| Prime Computer Primestation Pulsar | R7 PRO 5750G 45 W / 45 W | Vega 8 ? / 1600 MHz 8 GB | 32 GB | 11.7 |
| AMD Ryzen 7 5700G | R7 5700G 65 W / 65 W | Vega 8 65 W \ MHz 4 GB | 32 GB | 12.1 |
| GPU TDP ? | TDP 65 W |
|---|---|
| 86% | 100% |
| Model | CPU | GPU | RAM | Value |
|---|---|---|---|---|
| Lenovo ThinkPad P14s G2 AMD | R7 PRO 5850U 26 W / 24 W | Vega 8 | 32 GB | 23.24 |
| Model | CPU | GPU | RAM | Value |
|---|---|---|---|---|
| Aoostar WTR Pro, R7 5825U | R7 5825U 30 W / 15 W | Vega 8 | 16 GB | 55.7 |
| Lenovo ThinkPad P14s G2 AMD | R7 PRO 5850U 26 W / 24 W | Vega 8 | 32 GB | 61.3 |
| Model | CPU | GPU | RAM | Value |
|---|---|---|---|---|
| Lenovo ThinkPad P14s G2 AMD | R7 PRO 5850U 26 W / 24 W | Vega 8 | 32 GB | 8 |
| Aoostar WTR Pro, R7 5825U | R7 5825U 30 W / 15 W | Vega 8 | 16 GB | 9.51 |
| Model | CPU | GPU | RAM | Value |
|---|---|---|---|---|
| Lenovo ThinkPad P14s G2 AMD | R7 PRO 5850U 26 W / 24 W | Vega 8 | 32 GB | 46.81 |
| Aoostar WTR Pro, R7 5825U | R7 5825U 30 W / 15 W | Vega 8 | 16 GB | 53.6 |
| Model | CPU | GPU | RAM | Value |
|---|---|---|---|---|
| Lenovo ThinkPad P14s G2 AMD | R7 PRO 5850U 26 W / 24 W | Vega 8 | 32 GB | 7.11 |
| Aoostar WTR Pro, R7 5825U | R7 5825U 30 W / 15 W | Vega 8 | 16 GB | 8.43 |
| Model | CPU | GPU | RAM | Value |
|---|---|---|---|---|
| Lenovo ThinkPad P14s G2 AMD | R7 PRO 5850U 26 W / 24 W | Vega 8 | 32 GB | 27.41 |
| Aoostar WTR Pro, R7 5825U | R7 5825U 30 W / 15 W | Vega 8 | 16 GB | 28.4 |
| Model | CPU | GPU | RAM | Value |
|---|---|---|---|---|
| Lenovo ThinkPad P14s G2 AMD | R7 PRO 5850U 26 W / 24 W | Vega 8 | 32 GB | 13.75 |
| Aoostar WTR Pro, R7 5825U | R7 5825U 30 W / 15 W | Vega 8 | 16 GB | 16.2 |
| Model | CPU | GPU | RAM | Value |
|---|---|---|---|---|
| Aoostar WTR Pro, R7 5825U | R7 5825U 30 W / 15 W | Vega 8 | 16 GB | 15.1 |
| Lenovo ThinkPad P14s G2 AMD | R7 PRO 5850U 26 W / 24 W | Vega 8 | 32 GB | 17.52 |
| Model | CPU | GPU | RAM | Value |
|---|---|---|---|---|
| Samsung Galaxy Book3 15, Core i5-1335U | i5-1335U 39 W / 23 W | Iris Xe G7 80EUs 1.250 / 2128 MHz 0 GB | 16 GB | 11807 |
| Intel NUC Pro Chassis_i5_1245U | i5-1245U | Iris Xe G7 80EUs | 16 GB | 13056 |
| Intel NUC Pro Chassis_i5_1145G7 | i5-1145G7 64 W / 28 W | Iris Xe G7 80EUs | 8 GB | 13435 |
| Intel NUC10i5FNK | i5-1135G7 | Iris Xe G7 80EUs | 13678 | |
| Acer Spin 3 SP313-51N-56YV | i5-1135G7 64 W / 28 W | Iris Xe G7 80EUs 1300 / 2000 MHz | 16 GB | 13805 |
| Xiaomi RedmiBook 14 2025 | Core 5 220H 43 W / 32 W | Iris Xe G7 80EUs 1500 MHz | 32 GB | 14919 |
| Lenovo Yoga Slim 7i Pro 14IAP G7 | i5-1240P 64 W / 50 W | Iris Xe G7 80EUs 1300 MHz | 16 GB | 15022 |
| Minisforum Venus Series NPB5 | i5-13500H 95 W / 45 W | Iris Xe G7 80EUs 1450 MHz | 16 GB | 18652 |
| Dell XPS 13 9315, i5-1230U | i5-1230U 29 W / 14 W | Iris Xe G7 80EUs | 8 GB | 140763 |
| GPU TDP ? | TDP 65 W |
|---|---|
| 100% | 97% |
| Model | CPU | GPU | RAM | Value |
|---|---|---|---|---|
| Samsung Galaxy Book3 Pro 360 16, i5-1340P | i5-1340P 50 W / 34 W | Iris Xe G7 80EUs | 8 GB | 44.63 |
| Intel NUC10i5FNK | i5-1135G7 | Iris Xe G7 80EUs | 55.6 | |
| Lenovo ThinkBook Plus Gen2 Core i5 | i5-1130G7 25 W / 12 W | Iris Xe G7 80EUs | 16 GB | 57.7 |
| Acer Spin 3 SP313-51N-56YV | i5-1135G7 64 W / 28 W | Iris Xe G7 80EUs 1300 / 2000 MHz | 16 GB | 59.6 |
| Dell Latitude 7420 JW6MH | i5-1145G7 45 W / 14 W | Iris Xe G7 80EUs | 16 GB | 60.6 |
| Lenovo Yoga Slim 7i Pro 14IAP G7 | i5-1240P 64 W / 50 W | Iris Xe G7 80EUs 1300 MHz | 16 GB | 68.87 |
| Intel NUC Pro Chassis_i5_1145G7 | i5-1145G7 64 W / 28 W | Iris Xe G7 80EUs | 8 GB | 69.58 |
| Samsung Galaxy Book3 15, Core i5-1335U | i5-1335U 39 W / 23 W | Iris Xe G7 80EUs 1.250 / 2128 MHz 0 GB | 16 GB | 77.06 |
| Intel NUC Pro Chassis_i5_1245U | i5-1245U | Iris Xe G7 80EUs | 16 GB | 79.07 |
| Xiaomi RedmiBook 14 2025 | Core 5 220H 43 W / 32 W | Iris Xe G7 80EUs 1500 MHz | 32 GB | 86.7 |
| Acer Aspire Go AG15-51P-56UR | i5-1334U | Iris Xe G7 80EUs | 16 GB | 91.06 |
| Minisforum Venus Series NPB5 | i5-13500H 95 W / 45 W | Iris Xe G7 80EUs 1450 MHz | 16 GB | 99.01 |
| Model | CPU | GPU | RAM | Value |
|---|---|---|---|---|
| Minisforum HM90 | R9 4900H 45 W / 35 W | Vega 8 | 16 GB | 53.2 |
| Asus ZenBook 13 OLED UM325UA | R7 5700U | Vega 8 | 0 GB | 57.6 |
| Microsoft Surface Laptop 4 15 AMD TFF_00028 | R7 4980U 44 W / 23 W | Vega 8 | 16 GB | 61.6 |
| Lenovo Yoga Slim 7-14ARE | R7 4800U | Vega 8 1750 / 2133 MHz 0.5 GB | 16 GB | 64.9 |
| Minisforum EliteMini B550 | R7 5700G 77 W / 72 W | Vega 8 ? / 1600 MHz 0.5 GB | 16 GB | 71.35 |
| Asus ZenBook 13 UM325S | R7 5800U 30 W / 25 W | Vega 8 | 16 GB | 73 |
| Minisforum EliteMini HX90 | R9 5900HX 54 W / 54 W | Vega 8 | 16 GB | 74.2 |
| Morefine S500+ | R9 5900HX 35 W / 54 W | Vega 8 | 32 GB | 81.3 |
| Prime Computer Primestation Pulsar | R7 PRO 5750G 45 W / 45 W | Vega 8 ? / 1600 MHz 8 GB | 32 GB | 81.35 |
| LG UltraPC 14 14U70Q-G.AA79G | R7 5825U 25 W / 10 W | Vega 8 ? / 2133 MHz 0.5 GB | 16 GB | 83.01 |
| AMD Ryzen 7 5700G | R7 5700G 65 W / 65 W | Vega 8 65 W \ MHz 4 GB | 32 GB | 95.4 |
| GPU TDP ? | TDP 65 W |
|---|---|
| 74% | 100% |
Cinebench R15 OpenGL 64 Bit + Intel Iris Xe Graphics G7 80EUs
| GPU TDP ? | TDP 11 W | TDP 28 W |
|---|---|---|
| 87% | 99% | 100% |
| GPU TDP ? | TDP 11 W | TDP 15 W | TDP 28 W | TDP 65 W |
|---|---|---|---|---|
| 85% | 88% | 81% | 89% | 100% |
| GPU TDP ? | TDP 11 W | TDP 28 W |
|---|---|---|
| 100% | 100% | 100% |
| GPU TDP ? | TDP 11 W | TDP 15 W | TDP 28 W | TDP 65 W |
|---|---|---|---|---|
| 100% | 100% | 100% | 100% | 92% |
| Model | CPU | GPU | RAM | Value |
|---|---|---|---|---|
| HP Dragonfly Pro Chromebook | i5-1235U | Iris Xe G7 80EUs | 16 GB | 12 |
| Lenovo ThinkPad L14 G4 21H1003DGE DirectX 12 | i5-1335U 45 W / 15 W | Iris Xe G7 80EUs | 16 GB | 40.2814 |
| Model | CPU | GPU | RAM | Value |
|---|---|---|---|---|
| Lenovo ThinkPad L14 G4 21H1003DGE DirectX 12 | i5-1335U 45 W / 15 W | Iris Xe G7 80EUs | 16 GB | 21.7796 |
| HP Dragonfly Pro Chromebook | i5-1235U | Iris Xe G7 80EUs | 16 GB | 31 |
| Acer Spin 3 SP313-51N-56YV | i5-1135G7 64 W / 28 W | Iris Xe G7 80EUs 1300 / 2000 MHz | 16 GB | 38.68 |
| Microsoft Surface Pro 7 Plus Vulkan | i5-1135G7 60 W / 30 W | Iris Xe G7 80EUs 1300 MHz | 16 GB | 47.5 |
| Model | CPU | GPU | RAM | Value |
|---|---|---|---|---|
| Lenovo ThinkPad L14 G4 21H1003DGE DirectX 12 | i5-1335U 45 W / 15 W | Iris Xe G7 80EUs | 16 GB | 58.36 |
| HP Dragonfly Pro Chromebook | i5-1235U | Iris Xe G7 80EUs | 16 GB | 85 |
| Acer Spin 3 SP313-51N-56YV | i5-1135G7 64 W / 28 W | Iris Xe G7 80EUs 1300 / 2000 MHz | 16 GB | 91.4 |
| Microsoft Surface Pro 7 Plus Vulkan | i5-1135G7 60 W / 30 W | Iris Xe G7 80EUs 1300 MHz | 16 GB | 120.1 |
| Model | CPU | GPU | RAM | Value |
|---|---|---|---|---|
| Lenovo ThinkPad L14 G4 21H1003DGE | i5-1335U 45 W / 15 W | Iris Xe G7 80EUs | 16 GB | 57.8 |
| HP Dragonfly Pro Chromebook | i5-1235U | Iris Xe G7 80EUs | 16 GB | 79 |
| Microsoft Surface Pro 7 Plus | i5-1135G7 60 W / 30 W | Iris Xe G7 80EUs 1300 MHz | 16 GB | 91.4 |
| Model | CPU | GPU | RAM | Value |
|---|---|---|---|---|
| HP Dragonfly Pro Chromebook | i5-1235U | Iris Xe G7 80EUs | 16 GB | 69 |
| Lenovo ThinkPad L14 G4 21H1003DGE | i5-1335U 45 W / 15 W | Iris Xe G7 80EUs | 16 GB | 69.869 |
| Microsoft Surface Pro 7 Plus | i5-1135G7 60 W / 30 W | Iris Xe G7 80EUs 1300 MHz | 16 GB | 108.6 |
| Model | CPU | GPU | RAM | Value |
|---|---|---|---|---|
| Lenovo ThinkPad L14 G4 21H1003DGE | i5-1335U 45 W / 15 W | Iris Xe G7 80EUs | 16 GB | 101.533 |
| HP Dragonfly Pro Chromebook | i5-1235U | Iris Xe G7 80EUs | 16 GB | 148 |
| Microsoft Surface Pro 7 Plus | i5-1135G7 60 W / 30 W | Iris Xe G7 80EUs 1300 MHz | 16 GB | 170.4 |
GFXBench T-Rex HD Offscreen C24Z16 + Intel Iris Xe Graphics G7 80EUs
| Model | CPU | GPU | RAM | Value |
|---|---|---|---|---|
| Lenovo ThinkPad L14 G4 21H1003DGE | i5-1335U 45 W / 15 W | Iris Xe G7 80EUs | 16 GB | 219.558 |
| HP Dragonfly Pro Chromebook | i5-1235U | Iris Xe G7 80EUs | 16 GB | 253 |
| Microsoft Surface Pro 7 Plus | i5-1135G7 60 W / 30 W | Iris Xe G7 80EUs 1300 MHz | 16 GB | 256.9 |
| Model | CPU | GPU | RAM | Value |
|---|---|---|---|---|
| NiPoGi AM06 Pro bc7 | R7 5700U | Vega 8 | 16 GB | 68.3 |
| Thinkeagle VigoBook G7 bc7 | R7 5700U 13 W / 10 W | Vega 8 ? / 1600 MHz 0.5 GB | 16 GB | 72.8 |
| Ninkear A15 Plus (16+512) bc7 | R7 5700U 30 W / 15 W | Vega 8 | 16 GB | 76.9 |
| HP EliteBook 645 G9, Ryzen 7 5825U bc7 | R7 5825U | Vega 8 ? / 1600 MHz 0.5 GB | 16 GB | 104.6 |
| Asus ZenBook 14 UM3402Y bc7 | R7 7730U 42 W / 30 W | Vega 8 2000 / 2133 MHz 0.5 GB | 16 GB | 104.6 |
| HP Envy x360 15-fh0077ng bc7 | R7 7730U 48 W / 37 W | Vega 8 1200 / 2000 MHz 0.5 GB | 15.6 GB | 104.6 |
| GMK NucBox M5 bc7 | R7 5700U 15 W / 15 W | Vega 8 1750 / 1600 MHz | 32 GB | 104.6 |
| Geekom AS 5 bc7 | R9 5900HX 54 W / 35 W | Vega 8 | 32 GB | 138.1 |
| Geekom A5 bc7 | R7 5800H 54 W / 35 W | Vega 8 | 32 GB | 143.2 |
| Lenovo ThinkPad E14 G5-21JSS05C00 bc7 | R7 7730U 30 W / 30 W | Vega 8 | 24 GB | 289 |
| Lenovo ThinkPad E16 G1-21JUS08X00 bc7 | R7 7730U 25 W / 30 W | Vega 8 | 24 GB | 289 |
| Model | CPU | GPU | RAM | Value |
|---|---|---|---|---|
| Dell Latitude 7230 Rugged Extreme bc7 | i5-1240U 30 W / 28 W | Iris Xe G7 80EUs 900 / 2600 MHz | 16 GB | 3.64 |
| Dell Latitude 3440 bc7 | i5-1345U 32 W / 18 W | Iris Xe G7 80EUs 1200 MHz | 16 GB | 3.64 |
| Lenovo IdeaPad Flex 5 14IRU8 bc7 | i5-1335U 51 W / 15 W | Iris Xe G7 80EUs 1250 / 2133 MHz | 16 GB | 3.64 |
| Durabook R8 Tablet bc7 | i5-1230U 15 W / 7 W | Iris Xe G7 80EUs | 8 GB | 3.64 |
| Dell Latitude 7440 bc7 | i5-1345U 46 W / 25 W | Iris Xe G7 80EUs 1250 / 2400 MHz | 16 GB | 3.64 |
| Minisforum Venus Series NPB5 bc7 | i5-13500H 95 W / 45 W | Iris Xe G7 80EUs 1450 MHz | 16 GB | 3.64 |
| Lenovo ThinkPad E16 G1 Core i5-1335U bc7 | i5-1335U 51 W / 28 W | Iris Xe G7 80EUs 1250 / 1600 MHz | 16 GB | 3.64 |
| Getac S410 G5 bc7 | i5-1350P 54 W / 29 W | Iris Xe G7 80EUs 1500 / 2400 MHz | 32 GB | 3.64 |
| Lenovo IdeaPad Slim 3i 15IRU9 bc7 | Core 5 120U 50 W / 20 W | Iris Xe G7 80EUs 1100 / 2600 MHz | 16 GB | 3.64 |
| Model | CPU | GPU | RAM | Value |
|---|---|---|---|---|
| Asus ZenBook 14 UM3402Y bc7 | R7 7730U 42 W / 30 W | Vega 8 2000 / 2133 MHz 0.5 GB | 16 GB | 3.64 |
| GMK NucBox M5 bc7 | R7 5700U 15 W / 15 W | Vega 8 1750 / 1600 MHz | 32 GB | 3.64 |
| Thinkeagle VigoBook G7 bc7 | R7 5700U 13 W / 10 W | Vega 8 ? / 1600 MHz 0.5 GB | 16 GB | 3.64 |
| NiPoGi AM06 Pro bc7 | R7 5700U | Vega 8 | 16 GB | 6.84 |
| Geekom A5 bc7 | R7 5800H 54 W / 35 W | Vega 8 | 32 GB | 13.9 |
| Geekom AS 5 bc7 | R9 5900HX 54 W / 35 W | Vega 8 | 32 GB | 14.1 |
| Model | CPU | GPU | RAM | Value |
|---|---|---|---|---|
| Thinkeagle VigoBook G7 6.4.0 Pro | R7 5700U 13 W / 10 W | Vega 8 ? / 1600 MHz 0.5 GB | 16 GB | 11116 |
| NiPoGi AM06 Pro 6.4.0 Pro | R7 5700U | Vega 8 | 16 GB | 11693 |
| Lenovo ThinkPad L15 Gen 4 21H70021GE 6.2.1 | R7 PRO 7730U 40 W / 31 W | Vega 8 2000 / 1600 MHz 1 GB | 16 GB | 13067 |
| GMK NucBox M5 6.2.1 | R7 5700U 15 W / 15 W | Vega 8 1750 / 1600 MHz | 32 GB | 13761 |
| Ninkear A15 Plus (16+512) 6.2.1 | R7 5700U 30 W / 15 W | Vega 8 | 16 GB | 13831 |
| Ninkear A15 Plus (16+512) 6.2.1 | R7 5700U 30 W / 15 W | Vega 8 | 16 GB | 13920 |
| Aoostar WTR Pro, R7 5825U 6.4.0 Pro | R7 5825U 30 W / 15 W | Vega 8 | 16 GB | 14304 |
| Lenovo ThinkPad E14 G5-21JSS05C00 | R7 7730U 30 W / 30 W | Vega 8 | 24 GB | 15579 |
| Lenovo ThinkPad E16 G1-21JUS08X00 | R7 7730U 25 W / 30 W | Vega 8 | 24 GB | 15655 |
| HP Envy x360 15-fh0077ng | R7 7730U 48 W / 37 W | Vega 8 1200 / 2000 MHz 0.5 GB | 15.6 GB | 15729 |
| Lenovo ThinkPad L15 Gen 4 21H70021GE 6.2.1, Dual-Channel-Mode | R7 PRO 7730U 40 W / 31 W | Vega 8 2000 / 1600 MHz 1 GB | 16 GB | 15895 |
| Geekom A5 | R7 5800H 54 W / 35 W | Vega 8 | 32 GB | 17591 |
| Model | CPU | GPU | RAM | Value |
|---|---|---|---|---|
| Thinkeagle VigoBook G7 6.4.0 Pro | R7 5700U 13 W / 10 W | Vega 8 ? / 1600 MHz 0.5 GB | 16 GB | 8612 |
| NiPoGi AM06 Pro 6.4.0 Pro | R7 5700U | Vega 8 | 16 GB | 9226 |
| GMK NucBox M5 6.2.1 | R7 5700U 15 W / 15 W | Vega 8 1750 / 1600 MHz | 32 GB | 11671 |
| Lenovo ThinkPad L15 Gen 4 21H70021GE 6.2.1 | R7 PRO 7730U 40 W / 31 W | Vega 8 2000 / 1600 MHz 1 GB | 16 GB | 11705 |
| Ninkear A15 Plus (16+512) 6.2.1 | R7 5700U 30 W / 15 W | Vega 8 | 16 GB | 11873 |
| Ninkear A15 Plus (16+512) 6.2.1 | R7 5700U 30 W / 15 W | Vega 8 | 16 GB | 12195 |
| Lenovo ThinkPad E16 G1-21JUS08X00 | R7 7730U 25 W / 30 W | Vega 8 | 24 GB | 13630 |
| Aoostar WTR Pro, R7 5825U 6.4.0 Pro | R7 5825U 30 W / 15 W | Vega 8 | 16 GB | 14080 |
| Lenovo ThinkPad E14 G5-21JSS05C00 | R7 7730U 30 W / 30 W | Vega 8 | 24 GB | 14734 |
| Lenovo ThinkPad L15 Gen 4 21H70021GE 6.2.1, Dual-Channel-Mode | R7 PRO 7730U 40 W / 31 W | Vega 8 2000 / 1600 MHz 1 GB | 16 GB | 14998 |
| HP Envy x360 15-fh0077ng | R7 7730U 48 W / 37 W | Vega 8 1200 / 2000 MHz 0.5 GB | 15.6 GB | 15498 |
| Geekom A5 | R7 5800H 54 W / 35 W | Vega 8 | 32 GB | 16816 |
| Model | CPU | GPU | RAM | Value |
|---|---|---|---|---|
| Intel NUC10i5FNK | i5-1135G7 | Iris Xe G7 80EUs | 286 | |
| Microsoft Surface Pro 7 Plus | i5-1135G7 60 W / 30 W | Iris Xe G7 80EUs 1300 MHz | 16 GB | 692 |
| Intel NUC Pro Chassis_i5_1145G7 | i5-1145G7 64 W / 28 W | Iris Xe G7 80EUs | 8 GB | 765 |
| Intel NUC Pro Chassis_i5_1245U | i5-1245U | Iris Xe G7 80EUs | 16 GB | 824 |
| Model | CPU | GPU | RAM | Value |
|---|---|---|---|---|
| NiPoGi AM06 Pro | R7 5700U | Vega 8 | 16 GB | 372 |
| Minisforum EliteMini B550 | R7 5700G 77 W / 72 W | Vega 8 ? / 1600 MHz 0.5 GB | 16 GB | 392 |
| Minisforum HM90 | R9 4900H 45 W / 35 W | Vega 8 | 16 GB | 451 |
| Minisforum EliteMini HX90 | R9 5900HX 54 W / 54 W | Vega 8 | 16 GB | 451 |
| Geekom AS 5 | R9 5900HX 54 W / 35 W | Vega 8 | 32 GB | 526 |
| Morefine S500+ | R9 5900HX 35 W / 54 W | Vega 8 | 32 GB | 547 |
| Lenovo Yoga Slim 7-14ARE | R7 4800U | Vega 8 1750 / 2133 MHz 0.5 GB | 16 GB | 572 |
| Geekom A5 | R7 5800H 54 W / 35 W | Vega 8 | 32 GB | 586 |
| Aoostar WTR Pro, R7 5825U | R7 5825U 30 W / 15 W | Vega 8 | 16 GB | 596 |
| Prime Computer Primestation Pulsar | R7 PRO 5750G 45 W / 45 W | Vega 8 ? / 1600 MHz 8 GB | 32 GB | 689 |
| AMD Ryzen 7 5700G | R7 5700G 65 W / 65 W | Vega 8 65 W \ MHz 4 GB | 32 GB | 772 |
| GPU TDP ? | TDP 65 W |
|---|---|
| 72% | 100% |
| Model | CPU | GPU | RAM | Value |
|---|---|---|---|---|
| Intel NUC10i5FNK | i5-1135G7 | Iris Xe G7 80EUs | 1176 | |
| Intel NUC Pro Chassis_i5_1145G7 | i5-1145G7 64 W / 28 W | Iris Xe G7 80EUs | 8 GB | 2049 |
| Intel NUC Pro Chassis_i5_1245U | i5-1245U | Iris Xe G7 80EUs | 16 GB | 2099 |
| Microsoft Surface Pro 7 Plus | i5-1135G7 60 W / 30 W | Iris Xe G7 80EUs 1300 MHz | 16 GB | 2194 |
| Model | CPU | GPU | RAM | Value |
|---|---|---|---|---|
| NiPoGi AM06 Pro | R7 5700U | Vega 8 | 16 GB | 889 |
| Minisforum HM90 | R9 4900H 45 W / 35 W | Vega 8 | 16 GB | 939 |
| Minisforum EliteMini HX90 | R9 5900HX 54 W / 54 W | Vega 8 | 16 GB | 939 |
| Minisforum EliteMini B550 | R7 5700G 77 W / 72 W | Vega 8 ? / 1600 MHz 0.5 GB | 16 GB | 948 |
| Lenovo Yoga Slim 7-14ARE | R7 4800U | Vega 8 1750 / 2133 MHz 0.5 GB | 16 GB | 1030 |
| Aoostar WTR Pro, R7 5825U | R7 5825U 30 W / 15 W | Vega 8 | 16 GB | 1141 |
| Morefine S500+ | R9 5900HX 35 W / 54 W | Vega 8 | 32 GB | 1287 |
| Prime Computer Primestation Pulsar | R7 PRO 5750G 45 W / 45 W | Vega 8 ? / 1600 MHz 8 GB | 32 GB | 1298 |
| Geekom AS 5 | R9 5900HX 54 W / 35 W | Vega 8 | 32 GB | 1311 |
| Geekom A5 | R7 5800H 54 W / 35 W | Vega 8 | 32 GB | 1383 |
| AMD Ryzen 7 5700G | R7 5700G 65 W / 65 W | Vega 8 65 W \ MHz 4 GB | 32 GB | 1575 |
| GPU TDP ? | TDP 65 W |
|---|---|
| 85% | 100% |
| Model | CPU | GPU | RAM | Value |
|---|---|---|---|---|
| Dell XPS 13 9315, i5-1230U | i5-1230U 29 W / 14 W | Iris Xe G7 80EUs | 8 GB | 2101 |
| Intel NUC10i5FNK | i5-1135G7 | Iris Xe G7 80EUs | 2634 | |
| Intel NUC Pro Chassis_i5_1245U | i5-1245U | Iris Xe G7 80EUs | 16 GB | 2803 |
| Intel NUC Pro Chassis_i5_1145G7 | i5-1145G7 64 W / 28 W | Iris Xe G7 80EUs | 8 GB | 2857 |
| Microsoft Surface Pro 7 Plus | i5-1135G7 60 W / 30 W | Iris Xe G7 80EUs 1300 MHz | 16 GB | 2950 |
| Minisforum Venus Series NPB5 | i5-13500H 95 W / 45 W | Iris Xe G7 80EUs 1450 MHz | 16 GB | 3152 |
| Samsung Galaxy Book3 Pro 360 16, i5-1340P | i5-1340P 50 W / 34 W | Iris Xe G7 80EUs | 8 GB | 3208 |
| Acer Spin 3 SP313-51N-56YV | i5-1135G7 64 W / 28 W | Iris Xe G7 80EUs 1300 / 2000 MHz | 16 GB | 3267 |
| Model | CPU | GPU | RAM | Value |
|---|---|---|---|---|
| NiPoGi AM06 Pro | R7 5700U | Vega 8 | 16 GB | 3167 |
| Lenovo Yoga Slim 7-14ARE | R7 4800U | Vega 8 1750 / 2133 MHz 0.5 GB | 16 GB | 3498 |
| Minisforum HM90 | R9 4900H 45 W / 35 W | Vega 8 | 16 GB | 3499 |
| Minisforum EliteMini HX90 | R9 5900HX 54 W / 54 W | Vega 8 | 16 GB | 3499 |
| Minisforum EliteMini B550 | R7 5700G 77 W / 72 W | Vega 8 ? / 1600 MHz 0.5 GB | 16 GB | 3843 |
| Aoostar WTR Pro, R7 5825U | R7 5825U 30 W / 15 W | Vega 8 | 16 GB | 3862 |
| Prime Computer Primestation Pulsar | R7 PRO 5750G 45 W / 45 W | Vega 8 ? / 1600 MHz 8 GB | 32 GB | 4019 |
| Geekom A5 | R7 5800H 54 W / 35 W | Vega 8 | 32 GB | 4020 |
| Morefine S500+ | R9 5900HX 35 W / 54 W | Vega 8 | 32 GB | 4148 |
| AMD Ryzen 7 5700G | R7 5700G 65 W / 65 W | Vega 8 65 W \ MHz 4 GB | 32 GB | 4166 |
| Geekom AS 5 | R9 5900HX 54 W / 35 W | Vega 8 | 32 GB | 4178 |
| GPU TDP ? | TDP 65 W |
|---|---|
| 81% | 100% |
| GPU TDP ? | TDP 11 W | TDP 28 W |
|---|---|---|
| 100% | 100% | 100% |
| GPU TDP ? | TDP 11 W | TDP 15 W | TDP 28 W | TDP 65 W |
|---|---|---|---|---|
| 109% | 109% | 107% | 109% | 100% |
| GPU TDP ? | TDP 28 W |
|---|---|
| 100% | 100% |
| GPU TDP ? | TDP 15 W | TDP 28 W | TDP 65 W |
|---|---|---|---|
| 109% | 106% | 110% | 100% |
| GPU TDP ? | TDP 11 W | TDP 28 W |
|---|---|---|
| 100% | 100% | 102% |
| GPU TDP ? | TDP 11 W | TDP 15 W | TDP 28 W |
|---|---|---|---|
| 104% | 104% | 100% | 106% |
| GPU TDP ? | TDP 11 W | TDP 28 W |
|---|---|---|
| 73% | 87% | 100% |
| GPU TDP ? | TDP 11 W | TDP 15 W | TDP 28 W |
|---|---|---|---|
| 74% | 87% | 67% | 100% |
| GPU TDP ? | TDP 28 W |
|---|---|
| 84% | 100% |
| GPU TDP ? | TDP 15 W | TDP 28 W |
|---|---|---|
| 85% | 70% | 100% |
| Model | CPU | GPU | RAM | Value |
|---|---|---|---|---|
| Lenovo IdeaPad Slim 3i 15IRU9 | Core 5 120U 50 W / 20 W | Iris Xe G7 80EUs 1100 / 2600 MHz | 16 GB | 39.4 |
| Acer Aspire Go AG15-51P-56UR | i5-1334U | Iris Xe G7 80EUs | 16 GB | 48.3 |
| Acer Aspire Go AG15-51P-56UR | i5-1334U | Iris Xe G7 80EUs | 16 GB | 50.2 |
| Xiaomi RedmiBook 14 2025 | Core 5 220H 43 W / 32 W | Iris Xe G7 80EUs 1500 MHz | 32 GB | 51 |
| Model | CPU | GPU | RAM | Value |
|---|---|---|---|---|
| Thinkeagle VigoBook G7 | R7 5700U 13 W / 10 W | Vega 8 ? / 1600 MHz 0.5 GB | 16 GB | 27.7 |
| Model | CPU | GPU | RAM | Value |
|---|---|---|---|---|
| Lenovo IdeaPad Slim 3i 15IRU9 | Core 5 120U 50 W / 20 W | Iris Xe G7 80EUs 1100 / 2600 MHz | 16 GB | 36.2 |
| Acer Aspire Go AG15-51P-56UR | i5-1334U | Iris Xe G7 80EUs | 16 GB | 41.1 |
| Xiaomi RedmiBook 14 2025 | Core 5 220H 43 W / 32 W | Iris Xe G7 80EUs 1500 MHz | 32 GB | 51 |
| Model | CPU | GPU | RAM | Value |
|---|---|---|---|---|
| Thinkeagle VigoBook G7 | R7 5700U 13 W / 10 W | Vega 8 ? / 1600 MHz 0.5 GB | 16 GB | 23.8 |
| NiPoGi AM06 Pro | R7 5700U | Vega 8 | 16 GB | 29.7 |
| Model | CPU | GPU | RAM | Value |
|---|---|---|---|---|
| Xiaomi RedmiBook 14 2025 | Core 5 220H 43 W / 32 W | Iris Xe G7 80EUs 1500 MHz | 32 GB | 0.202 |
| GPU TDP ? | TDP 11 W | TDP 28 W |
|---|---|---|
| 84% | 100% | 79% |
| GPU TDP ? | TDP 11 W | TDP 28 W |
|---|---|---|
| 86% | 100% | 79% |
| Model | CPU | GPU | RAM | Value |
|---|---|---|---|---|
| Acer Spin 3 SP313-51N-56YV | i5-1135G7 64 W / 28 W | Iris Xe G7 80EUs 1300 / 2000 MHz | 16 GB | 1250 |
| HP Envy 14-eb0252ng | i5-1135G7 64 W / 45 W | Iris Xe G7 80EUs 1300 / 2000 MHz | 8 GB | 1300 |
| Lenovo IdeaPad 5 Pro 14ITL6 | i5-1135G7 64 W / 35 W | Iris Xe G7 80EUs 1300 / 1200 MHz | 16 GB | 1300 |
| Model | CPU | GPU | RAM | Value |
|---|---|---|---|---|
| Asus ZenBook 14 UM425U | R7 5700U | Vega 8 ? / 1867 MHz 0.5 GB | 8 GB | 1600 |
| Huawei MateBook 16 R7 5800H | R7 5800H 65 W / 54 W | Vega 8 | 16 GB | 2000 |
| Model | CPU | GPU | RAM | Value |
|---|---|---|---|---|
| Lenovo ThinkBook 13s-ITL-20V90003GE | i5-1135G7 35 W / 20 W | Iris Xe G7 80EUs 11 W 1300 / 1600 MHz | 8 GB | 896 |
| Acer Aspire 5 A515-56-511A | i5-1135G7 64 W / 28 W | Iris Xe G7 80EUs | 16 GB | 1035 |
| Intel NUC 12 Pro Kit NUC12WSBi5 | i5-1240P 62 W / 40 W | Iris Xe G7 80EUs 1300 / 1600 MHz | 16 GB | 1294.9 |
| Acer Spin 3 SP313-51N-56YV | i5-1135G7 64 W / 28 W | Iris Xe G7 80EUs 1300 / 2000 MHz | 16 GB | 1300 |
| GPU TDP ? | TDP 11 W |
|---|---|
| 100% | 74% |
| Model | CPU | GPU | RAM | Value |
|---|---|---|---|---|
| Lenovo ThinkPad T14s G2 20XGS01100 | R7 PRO 5850U 30 W / 22 W | Vega 8 | 32 GB | 900 |
| Huawei MateBook 16 R7 5800H | R7 5800H 65 W / 54 W | Vega 8 | 16 GB | 2000 |
| Lenovo ThinkBook 13s G3 20YA0005GE | R7 5800U 30 W / 25 W | Vega 8 ? / 2133 MHz | 16 GB | 2000 |
| GPU TDP ? | TDP 11 W |
|---|---|
| 100% | 63% |
Average Benchmarks Intel Iris Xe Graphics G7 80EUs → 100% n=61
Average Benchmarks AMD Radeon RX Vega 8 (Ryzen 4000/5000) → 149% n=61
* Smaller numbers mean a higher performance
1 This benchmark is not used for the average calculation
Game Benchmarks
The following benchmarks stem from our benchmarks of review laptops. The performance depends on the used graphics memory, clock rate, processor, system settings, drivers, and operating systems. So the results don't have to be representative for all laptops with this GPU. For detailed information on the benchmark results, click on the fps number.

F1 25
20251299634
Intel Core i5-1335U 0.9GHz
Iris Xe G7 80EUs
min: 22 fps, P1: 24 fps, max: 47 fps
1299634
Intel Core i5-1335U 0.9GHz
Iris Xe G7 80EUs
min: 15 fps, P1: 20 fps, max: 91 fps
1299634
Intel Core i5-1335U 0.9GHz
Iris Xe G7 80EUs
min: 9 fps, P1: 14 fps, max: 68 fps

Civilization 7
2025Intel Core i5-1335U 0.9GHz
Iris Xe G7 80EUs
min: 13.7 fps, P0.1: 15.8 fps, P1: 21.3 fps, max: 117 fps
Intel Core i5-1335U 0.9GHz
Iris Xe G7 80EUs
min: 7.08 fps, P0.1: 7.37 fps, P1: 10.3 fps, max: 32.6 fps

Intel Core i5-1335U 0.9GHz
Iris Xe G7 80EUs
min: 12 fps, P0.1: 12.1 fps, P1: 12.4 fps, max: 16.6 fps
Intel Core i5-1335U 0.9GHz
Iris Xe G7 80EUs
min: 10.5 fps, P0.1: 10.5 fps, P1: 10.5 fps, max: 12.8 fps
Intel Core i5-1335U 0.9GHz
Iris Xe G7 80EUs
min: 8.93 fps, P0.1: 8.93 fps, P1: 9.18 fps, max: 10.9 fps


God of War Ragnarök
2024Intel Core i5-1335U 0.9GHz
Iris Xe G7 80EUs
min: 12 fps, P0.1: 12 fps, P1: 12 fps, max: 20.1 fps
Intel Core i5-1335U 0.9GHz
Iris Xe G7 80EUs
min: 8.56 fps, P0.1: 8.57 fps, P1: 8.57 fps, max: 15.1 fps

Space Marine 2
2024
F1 24
2024
Last Epoch
2024Intel Core i5-11300H 3.1GHz
Iris Xe G7 80EUs
min: 7.44 fps, P0.1: 9.1 fps, P1: 16.3 fps, max: 31.1 fps
Intel Core i5-11300H 3.1GHz
Iris Xe G7 80EUs
min: 6.69 fps, P0.1: 7.16 fps, P1: 14.1 fps, max: 51.3 fps
Intel Core i5-11300H 3.1GHz
Iris Xe G7 80EUs
min: 1.186 fps, P0.1: 1.451 fps, P1: 11.3 fps, max: 31.4 fps

Helldivers 2
2024Intel Core i5-11300H 3.1GHz
Iris Xe G7 80EUs
min: 13.4 fps, P0.1: 13.4 fps, P1: 13.6 fps, max: 18.2 fps
Intel Core i5-11300H 3.1GHz
Iris Xe G7 80EUs
min: 1.926 fps, P0.1: 3.39 fps, P1: 9.4 fps, max: 37.8 fps

Palworld
2024
Intel Core i5-11300H 3.1GHz
Iris Xe G7 80EUs
min: 9.1 fps, P0.1: 10.2 fps, P1: 33.5 fps, max: 93 fps
Intel Core i5-11300H 3.1GHz
Iris Xe G7 80EUs
min: 8.8 fps, P0.1: 11.3 fps, P1: 36 fps, max: 108.8 fps

Ready or Not
2023Intel Core i5-11300H 3.1GHz
Iris Xe G7 80EUs
min: 3.94 fps, P0.1: 4.65 fps, P1: 15.9 fps, max: 33.5 fps
Intel Core i5-11300H 3.1GHz
Iris Xe G7 80EUs
min: 6.79 fps, P0.1: 8.47 fps, P1: 12.3 fps, max: 37.6 fps
Intel Core i5-11300H 3.1GHz
Iris Xe G7 80EUs
min: 8.45 fps, P0.1: 8.61 fps, P1: 10.9 fps, max: 44.5 fps

The Finals
2023Intel Core i5-11300H 3.1GHz
Iris Xe G7 80EUs
min: 18.8 fps, P0.1: 18.9 fps, P1: 20.1 fps, max: 41.7 fps
Intel Core i5-11300H 3.1GHz
Iris Xe G7 80EUs
min: 4.01 fps, P0.1: 4.27 fps, P1: 12.6 fps, max: 54.8 fps
Intel Core i5-11300H 3.1GHz
Iris Xe G7 80EUs
min: 11.5 fps, P0.1: 11.9 fps, P1: 13.9 fps, max: 24.2 fps


EA Sports WRC
2023
Lords of the Fallen
2023AMD Ryzen 7 PRO 7730U 2GHz
Vega 8
min: 8.07 fps, P0.1: 8.48 fps, P1: 10 fps, max: 67.9 fps
AMD Ryzen 7 PRO 7730U 2GHz
Vega 8
min: 3.09 fps, P0.1: 3.76 fps, P1: 8.39 fps, max: 32.7 fps

Total War Pharaoh
2023
Intel Core i5-1335U 0.9GHz
Iris Xe G7 80EUs
min: 1 fps, P0.1: 1 fps, P1: 2 fps, max: 71 fps
Intel Core i5-1335U 0.9GHz
Iris Xe G7 80EUs
min: 2 fps, P0.1: 2 fps, P1: 4 fps, max: 67 fps

EA Sports FC 24
2023Intel Core i5-1335U 0.9GHz
Iris Xe G7 80EUs
min: 25.3 fps, P0.1: 26 fps, P1: 28.2 fps, max: 49 fps

Counter-Strike 2
2023Intel Core i5-11300H 3.1GHz
Iris Xe G7 80EUs
min: 21.1 fps, P0.1: 21.4 fps, P1: 22.2 fps, max: 50.8 fps
AMD Ryzen 7 PRO 7730U 2GHz
Vega 8
min: 38.6 fps, P0.1: 38.7 fps, P1: 42 fps, max: 180.5 fps
Intel Core i5-11300H 3.1GHz
Iris Xe G7 80EUs
min: 17.6 fps, P0.1: 17.7 fps, P1: 18 fps, max: 34.7 fps
AMD Ryzen 7 PRO 7730U 2GHz
Vega 8
min: 28.6 fps, P0.1: 29.7 fps, P1: 32.5 fps, max: 64.5 fps
Intel Core i5-11300H 3.1GHz
Iris Xe G7 80EUs
min: 8.22 fps, P0.1: 8.29 fps, P1: 8.76 fps, max: 21.3 fps
AMD Ryzen 7 PRO 7730U 2GHz
Vega 8
min: 12.3 fps, P0.1: 13.2 fps, P1: 15.9 fps, max: 34.4 fps

Cyberpunk 2077
20232.12
Intel Core i5-1335U 0.9GHz
Iris Xe G7 80EUs
min: 9.33 fps, max: 14.2 fps
2.21
Intel Core i5-1334U 0.9GHz
Iris Xe G7 80EUs
min: 11.6 fps, P1: 11 fps, max: 16.5 fps
2.12
Intel Core 5 120U 0.9GHz
Iris Xe G7 80EUs
min: 11.6 fps, max: 18.9 fps
2.01
Intel Core i5-1335U 0.9GHz
Iris Xe G7 80EUs
min: 11.2 fps, max: 21.9 fps
2.21
Intel Core i5-1334U 0.9GHz
Iris Xe G7 80EUs
min: 12.2 fps, P1: 11.2 fps, max: 20.1 fps
2.21
Intel Core 5 220H 2GHz
Iris Xe G7 80EUs
min: 13.5 fps, max: 21.7 fps
2.02
AMD Ryzen 7 PRO 7730U 2GHz
Vega 8
min: 8.95 fps, max: 23.2 fps
2.12
Intel Core i5-1335U 0.9GHz
Iris Xe G7 80EUs
min: 7.82 fps, max: 11 fps
2.12
Intel Core 5 120U 0.9GHz
Iris Xe G7 80EUs
min: 9.66 fps, max: 14.1 fps
2.01
Intel Core i5-1335U 0.9GHz
Iris Xe G7 80EUs
min: 9.44 fps, max: 15.9 fps
2.21
Intel Core i5-1334U 0.9GHz
Iris Xe G7 80EUs
min: 10.2 fps, P1: 9.78 fps, max: 14.9 fps
2.21
Intel Core 5 220H 2GHz
Iris Xe G7 80EUs
min: 11.6 fps, max: 16.2 fps
2.02
AMD Ryzen 7 PRO 7730U 2GHz
Vega 8
min: 6.4 fps, max: 18 fps
2.12
Intel Core i5-1335U 0.9GHz
Iris Xe G7 80EUs
min: 6.59 fps, max: 8.96 fps
2.21
Intel Core i5-1334U 0.9GHz
Iris Xe G7 80EUs
min: 7.61 fps, P1: 7.37 fps, max: 11.4 fps
2.12
Intel Core 5 120U 0.9GHz
Iris Xe G7 80EUs
min: 8.38 fps, max: 12.2 fps
2.01
Intel Core i5-1335U 0.9GHz
Iris Xe G7 80EUs
min: 8.01 fps, max: 13.8 fps
2.21
Intel Core 5 220H 2GHz
Iris Xe G7 80EUs
min: 10.2 fps, max: 14.6 fps
2.02
AMD Ryzen 7 PRO 7730U 2GHz
Vega 8
min: 6.21 fps, max: 13 fps
2.12
Intel Core i5-1335U 0.9GHz
Iris Xe G7 80EUs
min: 5.77 fps, max: 8.13 fps
2.12
Intel Core 5 120U 0.9GHz
Iris Xe G7 80EUs
min: 7.25 fps, max: 10.8 fps
2.01
Intel Core i5-1335U 0.9GHz
Iris Xe G7 80EUs
min: 7.73 fps, max: 13.3 fps
2.21
Intel Core 5 220H 2GHz
Iris Xe G7 80EUs
min: 9.08 fps, max: 13.1 fps
2.02
AMD Ryzen 7 PRO 7730U 2GHz
Vega 8
min: 5.01 fps, max: 12 fps
2.01
Intel Core i5-1335U 0.9GHz
Iris Xe G7 80EUs
min: 4.73 fps, max: 7.95 fps

Baldur's Gate 3
2023Intel Core i5-1335U 0.9GHz
Iris Xe G7 80EUs
min: 9.61 fps, P0.1: 9.91 fps, P1: 10.5 fps, max: 14 fps
Intel Core i5-1335U 0.9GHz
Iris Xe G7 80EUs
min: 3.93 fps, P0.1: 4.02 fps, P1: 4.6 fps, max: 114.7 fps
AMD Ryzen 7 5700U 1.8GHz
Vega 8
min: 6.78 fps, P0.1: 6.97 fps, P1: 7.56 fps, max: 12.2 fps
AMD Ryzen 7 PRO 7730U 2GHz
Vega 8
min: 10 fps, P0.1: 10.1 fps, P1: 10.3 fps, max: 17.1 fps
Intel Core i5-1335U 0.9GHz
Iris Xe G7 80EUs
min: 8.09 fps, P0.1: 8.11 fps, P1: 8.33 fps, max: 10.7 fps
Intel Core i5-1335U 0.9GHz
Iris Xe G7 80EUs
min: 3.37 fps, P0.1: 3.37 fps, P1: 3.9 fps, max: 104.4 fps
AMD Ryzen 7 5700U 1.8GHz
Vega 8
min: 4.19 fps, P0.1: 4.45 fps, P1: 5.15 fps, max: 9.27 fps
AMD Ryzen 7 PRO 7730U 2GHz
Vega 8
min: 4.48 fps, P0.1: 6 fps, P1: 11.2 fps, max: 15.4 fps
Intel Core i5-1335U 0.9GHz
Iris Xe G7 80EUs
min: 5.21 fps, P0.1: 5.84 fps, P1: 7.26 fps, max: 17 fps
Intel Core i5-1335U 0.9GHz
Iris Xe G7 80EUs
min: 2.7 fps, P0.1: 2.73 fps, P1: 2.89 fps, max: 96.3 fps
AMD Ryzen 7 5700U 1.8GHz
Vega 8
min: 4.4 fps, P0.1: 4.53 fps, P1: 4.91 fps, max: 7.58 fps
AMD Ryzen 7 PRO 7730U 2GHz
Vega 8
min: 5.26 fps, P0.1: 5.92 fps, P1: 7.24 fps, max: 19 fps
Intel Core i5-1335U 0.9GHz
Iris Xe G7 80EUs
min: 4.77 fps, P0.1: 4.89 fps, P1: 6.71 fps, max: 14 fps
Intel Core i5-1335U 0.9GHz
Iris Xe G7 80EUs
min: 2.43 fps, P0.1: 2.46 fps, P1: 2.66 fps, max: 105 fps
Intel Core i5-1335U 0.9GHz
Iris Xe G7 80EUs
min: 1.654 fps, P0.1: 1.656 fps, P1: 1.697 fps, max: 103.5 fps

Lies of P
2023Intel Core i5-1335U 0.9GHz
Iris Xe G7 80EUs
min: 8.38 fps, P0.1: 8.4 fps, P1: 8.63 fps, max: 166.1 fps
AMD Ryzen 7 PRO 7730U 2GHz
Vega 8
min: 8.15 fps, P0.1: 8.68 fps, P1: 9.53 fps, max: 123.9 fps
Intel Core i5-1335U 0.9GHz
Iris Xe G7 80EUs
min: 7.35 fps, P0.1: 7.4 fps, P1: 7.49 fps, max: 156.5 fps
AMD Ryzen 7 PRO 7730U 2GHz
Vega 8
min: 7.53 fps, P0.1: 7.56 fps, P1: 8.38 fps, max: 111.3 fps
Intel Core i5-1335U 0.9GHz
Iris Xe G7 80EUs
min: 5.73 fps, P0.1: 5.78 fps, P1: 6.02 fps, max: 150.2 fps
AMD Ryzen 7 PRO 7730U 2GHz
Vega 8
min: 6.63 fps, P0.1: 6.77 fps, P1: 7.18 fps, max: 105.5 fps
Intel Core i5-1335U 0.9GHz
Iris Xe G7 80EUs
min: 5.54 fps, P0.1: 5.56 fps, P1: 5.91 fps, max: 113.1 fps
AMD Ryzen 7 PRO 7730U 2GHz
Vega 8
min: 5.39 fps, P0.1: 5.4 fps, P1: 6.27 fps, max: 95.7 fps
Intel Core i5-1335U 0.9GHz
Iris Xe G7 80EUs
min: 3.74 fps, P0.1: 3.76 fps, P1: 3.86 fps, max: 102.1 fps

The Crew Motorfest
2023
Starfield
2023
Armored Core 6
2023Intel Core i5-1335U 0.9GHz
Iris Xe G7 80EUs
min: 2.61 fps, P0.1: 2.76 fps, P1: 14.4 fps, max: 76.7 fps
AMD Ryzen 7 PRO 7730U 2GHz
Vega 8
min: 2.33 fps, P0.1: 2.59 fps, P1: 14.6 fps, max: 71.2 fps
Intel Core i5-1335U 0.9GHz
Iris Xe G7 80EUs
min: 2.85 fps, P0.1: 2.98 fps, P1: 18.1 fps, max: 59.9 fps
AMD Ryzen 7 PRO 7730U 2GHz
Vega 8
min: 6.49 fps, P0.1: 8.59 fps, P1: 12 fps, max: 25.8 fps
Intel Core i5-1335U 0.9GHz
Iris Xe G7 80EUs
min: 2.61 fps, P0.1: 5.1 fps, P1: 17.5 fps, max: 49.7 fps
AMD Ryzen 7 PRO 7730U 2GHz
Vega 8
min: 2.51 fps, P0.1: 4.26 fps, P1: 11 fps, max: 61.7 fps
Intel Core i5-1335U 0.9GHz
Iris Xe G7 80EUs
min: 2.21 fps, P0.1: 2.49 fps, P1: 13.6 fps, max: 33.9 fps
AMD Ryzen 7 PRO 7730U 2GHz
Vega 8
min: 2.48 fps, P0.1: 3.94 fps, P1: 8.28 fps, max: 47.3 fps
Intel Core i5-1335U 0.9GHz
Iris Xe G7 80EUs
min: 2.44 fps, P0.1: 2.57 fps, P1: 9.99 fps, max: 76 fps

Immortals of Aveum
2023
Atlas Fallen
2023Intel Core i5-1335U 0.9GHz
Iris Xe G7 80EUs
min: 12.2 fps, P0.1: 12.5 fps, P1: 13.1 fps, max: 62.1 fps
AMD Ryzen 7 PRO 7730U 2GHz
Vega 8
min: 11.1 fps, P0.1: 11.1 fps, P1: 11.7 fps, max: 23 fps
Intel Core i5-1335U 0.9GHz
Iris Xe G7 80EUs
min: 12 fps, P0.1: 12.1 fps, P1: 12.4 fps, max: 22.2 fps
AMD Ryzen 7 PRO 7730U 2GHz
Vega 8
min: 10.3 fps, P0.1: 10.4 fps, P1: 11.6 fps, max: 20.4 fps
Intel Core i5-1335U 0.9GHz
Iris Xe G7 80EUs
min: 9.28 fps, P0.1: 9.43 fps, P1: 9.97 fps, max: 48.5 fps
AMD Ryzen 7 PRO 7730U 2GHz
Vega 8
min: 9.12 fps, P0.1: 9.26 fps, P1: 9.97 fps, max: 19.6 fps
Intel Core i5-1335U 0.9GHz
Iris Xe G7 80EUs
min: 6.77 fps, P0.1: 6.84 fps, P1: 7.54 fps, max: 11.2 fps


F1 23
20231082038
Intel Core i5-1335U 0.9GHz
Iris Xe G7 80EUs
min: 19 fps, P1: 20 fps, max: 28 fps
1082038
Intel Core i5-1235U 0.9GHz
Iris Xe G7 80EUs
min: 24 fps, P1: 25 fps, max: 33 fps
1022189
Intel Core i5-1335U 0.9GHz
Iris Xe G7 80EUs
min: 21 fps, P1: 18 fps, max: 36 fps
1057599
Intel Core i5-1335U 0.9GHz
Iris Xe G7 80EUs
min: 30 fps, P1: 29 fps, max: 43 fps
1057599
Intel Core i5-1335U 0.9GHz
Iris Xe G7 80EUs
min: 31 fps, P1: 29 fps, max: 43 fps
1012607
Intel Core i5-13500H 1.9GHz
Iris Xe G7 80EUs
min: 36 fps, P1: 35 fps, max: 49 fps
1050579
AMD Ryzen 7 PRO 7730U 2GHz
Vega 8
min: 17 fps, P1: 16 fps, max: 25 fps
1070925
AMD Ryzen 7 5700U 1.8GHz
Vega 8
min: 18 fps, P1: 15 fps, max: 27 fps
1016022
AMD Ryzen 7 7730U 2GHz
Vega 8
min: 19 fps, P1: 22 fps, max: 36 fps
1022189
AMD Ryzen 7 7730U 2GHz
Vega 8
min: 26 fps, P1: 23 fps, max: 37 fps
1050579, Dual-Channel-Mode
AMD Ryzen 7 PRO 7730U 2GHz
Vega 8
min: 29 fps, P1: 25 fps, max: 42 fps
1026791
AMD Ryzen 7 7730U 2GHz
Vega 8
min: 28 fps, P1: 27 fps, max: 42 fps
1082038
Intel Core i5-1335U 0.9GHz
Iris Xe G7 80EUs
min: 18 fps, P1: 18 fps, max: 26 fps
1082038
Intel Core i5-1235U 0.9GHz
Iris Xe G7 80EUs
min: 23 fps, P1: 23 fps, max: 29 fps
1022189
Intel Core i5-1335U 0.9GHz
Iris Xe G7 80EUs
min: 24 fps, P1: 23 fps, max: 32 fps
1057599
Intel Core i5-1335U 0.9GHz
Iris Xe G7 80EUs
min: 27 fps, P1: 27 fps, max: 37 fps
1057599
Intel Core i5-1335U 0.9GHz
Iris Xe G7 80EUs
min: 29 fps, P1: 27 fps, max: 37 fps
1012607
Intel Core i5-13500H 1.9GHz
Iris Xe G7 80EUs
min: 32 fps, P1: 32 fps, max: 43 fps
1050579
AMD Ryzen 7 PRO 7730U 2GHz
Vega 8
min: 16 fps, P1: 15 fps, max: 23 fps
1070925
AMD Ryzen 7 5700U 1.8GHz
Vega 8
min: 15 fps, P1: 13 fps, max: 24 fps
1022189
AMD Ryzen 7 7730U 2GHz
Vega 8
min: 20 fps, P1: 20 fps, max: 31 fps
1016022
AMD Ryzen 7 7730U 2GHz
Vega 8
min: 14 fps, P1: 18 fps, max: 32 fps
1050579, Dual-Channel-Mode
AMD Ryzen 7 PRO 7730U 2GHz
Vega 8
min: 26 fps, P1: 23 fps, max: 36 fps
1026791
AMD Ryzen 7 7730U 2GHz
Vega 8
min: 25 fps, P1: 24 fps, max: 36 fps
1082038
Intel Core i5-1335U 0.9GHz
Iris Xe G7 80EUs
min: 13 fps, P1: 13 fps, max: 18 fps
1082038
Intel Core i5-1235U 0.9GHz
Iris Xe G7 80EUs
min: 15 fps, P1: 15 fps, max: 21 fps
1022189
Intel Core i5-1335U 0.9GHz
Iris Xe G7 80EUs
min: 16 fps, P1: 16 fps, max: 22 fps
1057599
Intel Core i5-1335U 0.9GHz
Iris Xe G7 80EUs
min: 18 fps, P1: 17 fps, max: 25 fps
1057599
Intel Core i5-1335U 0.9GHz
Iris Xe G7 80EUs
min: 18 fps, P1: 17 fps, max: 25 fps
1012607
Intel Core i5-13500H 1.9GHz
Iris Xe G7 80EUs
min: 22 fps, P1: 21 fps, max: 29 fps
1050579
AMD Ryzen 7 PRO 7730U 2GHz
Vega 8
min: 13 fps, P1: 12 fps, max: 17 fps
1070925
AMD Ryzen 7 5700U 1.8GHz
Vega 8
min: 12 fps, P1: 10 fps, max: 18 fps
1016022
AMD Ryzen 7 7730U 2GHz
Vega 8
min: 11 fps, P1: 15 fps, max: 23 fps
1022189
AMD Ryzen 7 7730U 2GHz
Vega 8
min: 15 fps, P1: 16 fps, max: 24 fps
1026791
AMD Ryzen 7 7730U 2GHz
Vega 8
min: 18 fps, P1: 17 fps, max: 24 fps
1050579, Dual-Channel-Mode
AMD Ryzen 7 PRO 7730U 2GHz
Vega 8
min: 20 fps, P1: 18 fps, max: 26 fps
1050579
AMD Ryzen 7 PRO 7730U 2GHz
Vega 8
min: 8 fps, P1: 8 fps, max: 12 fps
1070925
AMD Ryzen 7 5700U 1.8GHz
Vega 8
min: 9 fps, P1: 8 fps, max: 13 fps
1026791
AMD Ryzen 7 7730U 2GHz
Vega 8
min: 12 fps, P1: 11 fps, max: 18 fps
1050579, Dual-Channel-Mode
AMD Ryzen 7 PRO 7730U 2GHz
Vega 8
min: 9 fps, P1: 12 fps, max: 19 fps

Diablo 4
2023Intel Core i5-1335U 0.9GHz
Iris Xe G7 80EUs
min: 24.7 fps, P0.1: 25 fps, P1: 26.2 fps, max: 45.1 fps
AMD Ryzen 7 PRO 7730U 2GHz
Vega 8
min: 12.7 fps, P0.1: 12.9 fps, P1: 14 fps, max: 31.8 fps
Intel Core i5-1335U 0.9GHz
Iris Xe G7 80EUs
min: 18.7 fps, P0.1: 19.1 fps, P1: 20.3 fps, max: 36.4 fps
AMD Ryzen 7 PRO 7730U 2GHz
Vega 8
min: 5.8 fps, P0.1: 6.25 fps, P1: 9.88 fps, max: 89.6 fps
Intel Core i5-1335U 0.9GHz
Iris Xe G7 80EUs
min: 15.9 fps, P0.1: 16.3 fps, P1: 17.9 fps, max: 32.8 fps
AMD Ryzen 7 PRO 7730U 2GHz
Vega 8
min: 3.72 fps, P0.1: 4.45 fps, P1: 9.85 fps, max: 22.4 fps
Intel Core i5-1335U 0.9GHz
Iris Xe G7 80EUs
min: 8.22 fps, P0.1: 9.02 fps, P1: 14.5 fps, max: 87.1 fps
AMD Ryzen 7 PRO 7730U 2GHz
Vega 8
min: 6.94 fps, P0.1: 7.15 fps, P1: 8.84 fps, max: 22.7 fps
Intel Core i5-1335U 0.9GHz
Iris Xe G7 80EUs
min: 5.76 fps, P0.1: 5.97 fps, P1: 9.65 fps, max: 172.1 fps


Dead Island 2
2023Intel Core i5-1335U 0.9GHz
Iris Xe G7 80EUs
min: 8.61 fps, P0.1: 11.8 fps, P1: 17.6 fps, max: 137.8 fps
AMD Ryzen 7 PRO 7730U 2GHz
Vega 8
min: 12.1 fps, P0.1: 12.2 fps, P1: 15.1 fps, max: 124.5 fps
Intel Core i5-1335U 0.9GHz
Iris Xe G7 80EUs
min: 8.9 fps, P0.1: 8.92 fps, P1: 14.7 fps, max: 125.2 fps
Intel Core i5-1335U 0.9GHz
Iris Xe G7 80EUs
min: 9.67 fps, P0.1: 9.87 fps, P1: 11 fps, max: 117.9 fps
AMD Ryzen 7 PRO 7730U 2GHz
Vega 8
min: 6.2 fps, P0.1: 7.07 fps, P1: 9.67 fps, max: 91.1 fps
Intel Core i5-1335U 0.9GHz
Iris Xe G7 80EUs
min: 7.12 fps, P0.1: 7.22 fps, P1: 7.5 fps, max: 85.7 fps
AMD Ryzen 7 PRO 7730U 2GHz
Vega 8
min: 5.49 fps, P0.1: 5.61 fps, P1: 6.12 fps, max: 100 fps
Intel Core i5-1335U 0.9GHz
Iris Xe G7 80EUs
min: 4.47 fps, P0.1: 4.49 fps, P1: 5.25 fps, max: 78.2 fps

The Last of Us
2023

Company of Heroes 3
2023Intel Core i5-1240P 1.2GHz
Iris Xe G7 80EUs
P0.1: 11.1 fpsP1: 15.6 fps
Intel Core i5-1240P 1.2GHz
Iris Xe G7 80EUs
P0.1: 7.8 fpsP1: 13.6 fps
Intel Core i5-1240P 1.2GHz
Iris Xe G7 80EUs
P0.1: 7.6 fpsP1: 10.5 fps
Intel Core i5-1240P 1.2GHz
Iris Xe G7 80EUs
P0.1: 8.1 fpsP1: 9.5 fps

Sons of the Forest
2023Intel Core i5-1240P 1.2GHz
Iris Xe G7 80EUs
min: 2.3 fps, P0.1: 2.3 fps, P1: 2.68 fps, max: 25.9 fps
AMD Ryzen 7 PRO 7730U 2GHz
Vega 8
min: 8.66 fps, P0.1: 9.76 fps, P1: 13.6 fps, max: 26.7 fps
Intel Core i5-1240P 1.2GHz
Iris Xe G7 80EUs
min: 2.31 fps, P0.1: 2.33 fps, P1: 2.53 fps, max: 14.5 fps

Atomic Heart
2023Intel Core i5-1240P 1.2GHz
Iris Xe G7 80EUs
min: 11.1 fps, P0.1: 14.8 fps, P1: 18.4 fps, max: 66.8 fps
AMD Ryzen 7 PRO 7730U 2GHz
Vega 8
min: 10.1 fps, P0.1: 12.9 fps, P1: 21.4 fps, max: 72.2 fps
Intel Core i5-1240P 1.2GHz
Iris Xe G7 80EUs
min: 7.14 fps, P0.1: 7.39 fps, P1: 12.6 fps, max: 51.2 fps
AMD Ryzen 7 PRO 7730U 2GHz
Vega 8
min: 11.1 fps, P0.1: 11.8 fps, P1: 16.1 fps, max: 49.3 fps
Intel Core i5-1240P 1.2GHz
Iris Xe G7 80EUs
min: 5.79 fps, P0.1: 6.29 fps, P1: 9.54 fps, max: 39.4 fps
AMD Ryzen 7 PRO 7730U 2GHz
Vega 8
min: 5.95 fps, P0.1: 6.18 fps, P1: 7.97 fps, max: 36.8 fps
Intel Core i5-1240P 1.2GHz
Iris Xe G7 80EUs
min: 5.41 fps, P0.1: 5.56 fps, P1: 7.23 fps, max: 29.8 fps

Returnal
2023
Hogwarts Legacy
2023Intel Core i5-11300H 3.1GHz
Iris Xe G7 80EUs
min: 7.66 fps, P0.1: 7.81 fps, P1: 9.49 fps, max: 31.1 fps
AMD Ryzen 7 PRO 7730U 2GHz
Vega 8
min: 9.44 fps, P0.1: 10.5 fps, P1: 13.1 fps, max: 39.2 fps
AMD Ryzen 7 PRO 7730U 2GHz
Vega 8
min: 6.92 fps, P0.1: 6.98 fps, P1: 9.91 fps, max: 44.8 fps

Dead Space Remake
2023
The Witcher 3 v4
2023Intel Core i5-1135G7 2.4GHz
Iris Xe G7 80EUs
min: 3 fps, P0.1: 11 fps, P1: 17 fps, max: 54.3 fps
AMD Ryzen 7 PRO 7730U 2GHz
Vega 8
min: 6.89 fps, P0.1: 13.9 fps, P1: 17.6 fps, max: 86.9 fps
Intel Core i5-1135G7 2.4GHz
Iris Xe G7 80EUs
min: 6.34 fps, P0.1: 7.51 fps, P1: 13.4 fps, max: 62.3 fps
AMD Ryzen 7 PRO 7730U 2GHz
Vega 8
min: 9.11 fps, P0.1: 11.3 fps, P1: 12.9 fps, max: 63.3 fps

High On Life
2023Intel Core i5-1135G7 2.4GHz
Iris Xe G7 80EUs
min: 10.5 fps, P0.1: 11.1 fps, P1: 13.5 fps, max: 78.9 fps
Intel Core i5-1240P 1.2GHz
Iris Xe G7 80EUs
min: 11.9 fps, P0.1: 12 fps, P1: 14.5 fps, max: 119.9 fps
AMD Ryzen 7 PRO 7730U 2GHz
Vega 8
min: 14.7 fps, P0.1: 17.1 fps, P1: 20.7 fps, max: 122.8 fps
Intel Core i5-1135G7 2.4GHz
Iris Xe G7 80EUs
min: 6.15 fps, P0.1: 6.3 fps, P1: 7.64 fps, max: 74.8 fps
Intel Core i5-1240P 1.2GHz
Iris Xe G7 80EUs
min: 8.25 fps, P0.1: 8.57 fps, P1: 9.72 fps, max: 114.8 fps
AMD Ryzen 7 PRO 7730U 2GHz
Vega 8
min: 6.42 fps, P0.1: 7.02 fps, P1: 9.04 fps, max: 114.7 fps
Intel Core i5-1135G7 2.4GHz
Iris Xe G7 80EUs
min: 4.75 fps, P0.1: 4.79 fps, P1: 5.25 fps, max: 88 fps
Intel Core i5-1240P 1.2GHz
Iris Xe G7 80EUs
min: 4.56 fps, P0.1: 4.82 fps, P1: 6.3 fps, max: 113.5 fps
AMD Ryzen 7 PRO 7730U 2GHz
Vega 8
min: 5.17 fps, P0.1: 5.26 fps, P1: 7.55 fps, max: 93.3 fps
Intel Core i5-1135G7 2.4GHz
Iris Xe G7 80EUs
min: 2.85 fps, P0.1: 3.13 fps, P1: 4.75 fps, max: 71.9 fps
Intel Core i5-1240P 1.2GHz
Iris Xe G7 80EUs
min: 4.69 fps, P0.1: 5.04 fps, P1: 6.3 fps, max: 97.7 fps


Intel Core i5-1240P 1.2GHz
Iris Xe G7 80EUs
min: 4.07 fps, P0.1: 4.84 fps, P1: 5.51 fps, max: 13.3 fps
Intel Core i5-1135G7 2.4GHz
Iris Xe G7 80EUs
min: 5.5 fps, P0.1: 6.61 fps, P1: 13 fps, max: 29.3 fps
AMD Ryzen 7 PRO 7730U 2GHz
Vega 8
min: 6.4 fps, P0.1: 10.5 fps, P1: 19.4 fps, max: 47.1 fps
Intel Core i5-1240P 1.2GHz
Iris Xe G7 80EUs
min: 3.15 fps, P0.1: 3.24 fps, P1: 3.64 fps, max: 16.4 fps
Intel Core i5-1135G7 2.4GHz
Iris Xe G7 80EUs
min: 6.18 fps, P0.1: 6.78 fps, P1: 9.05 fps, max: 27.7 fps
AMD Ryzen 7 PRO 7730U 2GHz
Vega 8
min: 1.595 fps, P0.1: 4.64 fps, P1: 15.5 fps, max: 138 fps
Intel Core i5-1240P 1.2GHz
Iris Xe G7 80EUs
min: 1.328 fps, P0.1: 1.665 fps, P1: 2.99 fps, max: 22.7 fps
Intel Core i5-1135G7 2.4GHz
Iris Xe G7 80EUs
min: 3.58 fps, P0.1: 5.02 fps, P1: 6.69 fps, max: 30.8 fps
AMD Ryzen 7 PRO 7730U 2GHz
Vega 8
min: 2.73 fps, P0.1: 4.42 fps, P1: 9.66 fps, max: 199.2 fps

Intel Core i5-1240P 1.2GHz
Iris Xe G7 80EUs
min: 2.99 fps, P0.1: 3.02 fps, P1: 3.13 fps, max: 5.69 fps
Intel Core i5-1135G7 2.4GHz
Iris Xe G7 80EUs
Problem during benchmarking occured: small graphical problems
min: 7.65 fps, P0.1: 9.24 fps, P1: 13.1 fps, max: 21.9 fps
Intel Core i5-1240P 1.2GHz
Iris Xe G7 80EUs
min: 2.73 fps, P0.1: 2.78 fps, P1: 2.97 fps, max: 5.71 fps
Intel Core i5-1135G7 2.4GHz
Iris Xe G7 80EUs
Problem during benchmarking occured: small graphical problems
min: 12.9 fps, P0.1: 12.9 fps, P1: 13.4 fps, max: 29.2 fps
Intel Core i5-1240P 1.2GHz
Iris Xe G7 80EUs
min: 2.91 fps, P0.1: 2.93 fps, P1: 3.01 fps, max: 6.12 fps
Intel Core i5-1135G7 2.4GHz
Iris Xe G7 80EUs
Problem during benchmarking occured: small graphical problems
min: 11.3 fps, P0.1: 11.4 fps, P1: 12 fps, max: 26.7 fps

Intel Core i5-1240P 1.2GHz
Iris Xe G7 80EUs
Problem during benchmarking occured: game wont start crash
Intel Core i5-1240P 1.2GHz
Iris Xe G7 80EUs
Problem during benchmarking occured: game wont start crash
Intel Core i5-1240P 1.2GHz
Iris Xe G7 80EUs
Problem during benchmarking occured: game wont start crash

Intel Core i5-1240P 1.2GHz
Iris Xe G7 80EUs
min: 3.34 fps, P0.1: 3.34 fps, P1: 3.38 fps, max: 7.78 fps
Intel Core i5-1135G7 2.4GHz
Iris Xe G7 80EUs
min: 8.72 fps, P0.1: 8.72 fps, P1: 8.78 fps, max: 10.6 fps
AMD Ryzen 7 PRO 7730U 2GHz
Vega 8
min: 8.93 fps, P0.1: 8.95 fps, P1: 9.07 fps, max: 14.9 fps
Intel Core i5-1240P 1.2GHz
Iris Xe G7 80EUs
min: 2.06 fps, P0.1: 2.21 fps, P1: 3.42 fps, max: 7.27 fps
Intel Core i5-1135G7 2.4GHz
Iris Xe G7 80EUs
min: 6.78 fps, P0.1: 6.8 fps, P1: 7.38 fps, max: 10.1 fps
Intel Core i5-1240P 1.2GHz
Iris Xe G7 80EUs
min: 2.17 fps, P0.1: 2.18 fps, P1: 2.36 fps, max: 29.5 fps

Intel Core i5-1240P 1.2GHz
Iris Xe G7 80EUs
min: 4.85 fps, P0.1: 4.85 fps, P1: 4.95 fps, max: 7.8 fps
Intel Core i5-1135G7 2.4GHz
Iris Xe G7 80EUs
min: 7.54 fps, P0.1: 7.83 fps, P1: 9.12 fps, max: 16.8 fps
AMD Ryzen 7 PRO 7730U 2GHz
Vega 8
min: 9.21 fps, P0.1: 9.85 fps, P1: 12.4 fps, max: 34.5 fps
Intel Core i5-1240P 1.2GHz
Iris Xe G7 80EUs
min: 4.37 fps, P0.1: 4.41 fps, P1: 4.62 fps, max: 6.71 fps
Intel Core i5-1135G7 2.4GHz
Iris Xe G7 80EUs
min: 6.49 fps, P0.1: 6.69 fps, P1: 7.12 fps, max: 17.8 fps
AMD Ryzen 7 PRO 7730U 2GHz
Vega 8
min: 6.65 fps, P0.1: 6.76 fps, P1: 8.33 fps, max: 67.3 fps
Intel Core i5-1240P 1.2GHz
Iris Xe G7 80EUs
min: 3.85 fps, P0.1: 3.85 fps, P1: 4.02 fps, max: 5.77 fps
Intel Core i5-1135G7 2.4GHz
Iris Xe G7 80EUs
min: 4.01 fps, P0.1: 4.28 fps, P1: 6.12 fps, max: 32 fps
AMD Ryzen 7 PRO 7730U 2GHz
Vega 8
min: 4.09 fps, P0.1: 5.49 fps, P1: 8.99 fps, max: 16.3 fps

FIFA 23
2022
The Quarry
2022AMD Ryzen 9 5900HX 3.3GHz
Vega 8
min: 7.94 fps, P0.1: 7.98 fps, P1: 10.4 fps, max: 43.5 fps
AMD Ryzen 7 5800U 1.9GHz
Vega 8
min: 9.61 fps, P0.1: 9.72 fps, P1: 13.3 fps, max: 23.3 fps
AMD Ryzen 9 5900HX 3.3GHz
Vega 8
min: 5.24 fps, P0.1: 5.46 fps, P1: 6.61 fps, max: 15.3 fps
AMD Ryzen 7 5800U 1.9GHz
Vega 8
min: 6.47 fps, P0.1: 7.35 fps, P1: 9.12 fps, max: 16 fps
AMD Ryzen 9 5900HX 3.3GHz
Vega 8
min: 4.05 fps, P0.1: 4.4 fps, P1: 5.3 fps, max: 15.2 fps
AMD Ryzen 7 5800U 1.9GHz
Vega 8
min: 4.99 fps, P0.1: 5.38 fps, P1: 6.99 fps, max: 12.7 fps
AMD Ryzen 7 5800U 1.9GHz
Vega 8
min: 2.62 fps, P0.1: 2.74 fps, P1: 3.17 fps, max: 9.21 fps

F1 22
2022Intel Core i5-1340P 1.4GHz
Iris Xe G7 80EUs
Problem during benchmarking occured: game wont start
928484
Intel Core i5-1245U 1.2GHz
Iris Xe G7 80EUs
min: 20 fps, P1: 27 fps, max: 37 fps
959964
Intel Core i5-1335U 0.9GHz
Iris Xe G7 80EUs
min: 27 fps, P1: 27 fps, max: 38 fps
959964
Intel Core i5-1335U 0.9GHz
Iris Xe G7 80EUs
min: 24 fps, P1: 23 fps, max: 42 fps
959964
Intel Core i5-1335U 0.9GHz
Iris Xe G7 80EUs
min: 29 fps, P1: 29 fps, max: 41 fps
959964
Intel Core i5-1335U 0.9GHz
Iris Xe G7 80EUs
min: 32 fps, P1: 29 fps, max: 46 fps
959964
Intel Core 5 120U 0.9GHz
Iris Xe G7 80EUs
min: 33 fps, P1: 32 fps, max: 46 fps
959964
Intel Core i5-1345U 1.2GHz
Iris Xe G7 80EUs
min: 33 fps, P1: 33 fps, max: 46 fps
959964
Intel Core i5-1335U 0.9GHz
Iris Xe G7 80EUs
min: 34 fps, P1: 30 fps, max: 47 fps
959964
Intel Core i5-1335U 0.9GHz
Iris Xe G7 80EUs
min: 34 fps, P1: 33 fps, max: 47 fps
959964
Intel Core i5-13500H 1.9GHz
Iris Xe G7 80EUs
min: 39 fps, P1: 39 fps, max: 53 fps
959964
Intel Core i5-1345U 1.2GHz
Iris Xe G7 80EUs
min: 41 fps, P1: 44 fps, max: 76 fps
928484
Intel Core i5-12500H 1.8GHz
Iris Xe G7 80EUs
min: 49 fps, P1: 50 fps, max: 68 fps
959964
AMD Ryzen 7 5700U 1.8GHz
Vega 8
min: 19 fps, P1: 16 fps, max: 25 fps
959964
AMD Ryzen 7 7730U 2GHz
Vega 8
min: 23 fps, P1: 24 fps, max: 41 fps
959964
AMD Ryzen 7 7730U 2GHz
Vega 8
min: 25 fps, P1: 25 fps, max: 42 fps
959964
AMD Ryzen 7 7730U 2GHz
Vega 8
min: 29 fps, P1: 25 fps, max: 41 fps
959964
AMD Ryzen 7 5700U 1.8GHz
Vega 8
min: 32 fps, P1: 29 fps, max: 43 fps
959964
AMD Ryzen 7 7730U 2GHz
Vega 8
min: 33 fps, P1: 32 fps, max: 48 fps
959964
Intel Core i5-1335U 0.9GHz
Iris Xe G7 80EUs
min: 24 fps, P1: 24 fps, max: 33 fps
928484
Intel Core i5-1245U 1.2GHz
Iris Xe G7 80EUs
min: 25 fps, P1: 24 fps, max: 34 fps
959964
Intel Core i5-1335U 0.9GHz
Iris Xe G7 80EUs
min: 22 fps, P1: 22 fps, max: 39 fps
959964
Intel Core i5-1335U 0.9GHz
Iris Xe G7 80EUs
min: 22 fps, P1: 22 fps, max: 40 fps
959964
Intel Core i5-1345U 1.2GHz
Iris Xe G7 80EUs
min: 28 fps, P1: 25 fps, max: 38 fps
959964
Intel Core i5-1335U 0.9GHz
Iris Xe G7 80EUs
min: 29 fps, P1: 26 fps, max: 39 fps
959964
Intel Core 5 120U 0.9GHz
Iris Xe G7 80EUs
min: 30 fps, P1: 29 fps, max: 39 fps
928484
Intel Core i5-12500H 1.8GHz
Iris Xe G7 80EUs
min: 30 fps, P1: 25 fps, max: 39 fps
959964
Intel Core i5-1345U 1.2GHz
Iris Xe G7 80EUs
min: 31 fps, P1: 31 fps, max: 43 fps
959964
Intel Core i5-1335U 0.9GHz
Iris Xe G7 80EUs
min: 31 fps, P1: 28 fps, max: 42 fps
959964
Intel Core i5-1335U 0.9GHz
Iris Xe G7 80EUs
min: 31 fps, P1: 30 fps, max: 43 fps
959964
Intel Core i5-13500H 1.9GHz
Iris Xe G7 80EUs
min: 37 fps, P1: 34 fps, max: 50 fps
959964
AMD Ryzen 7 5700U 1.8GHz
Vega 8
min: 16 fps, P1: 14 fps, max: 23 fps
959964
AMD Ryzen 7 7730U 2GHz
Vega 8
min: 25 fps, P1: 23 fps, max: 35 fps
959964
AMD Ryzen 7 7730U 2GHz
Vega 8
min: 24 fps, P1: 21 fps, max: 36 fps
959964
AMD Ryzen 7 7730U 2GHz
Vega 8
min: 26 fps, P1: 24 fps, max: 40 fps
959964
AMD Ryzen 7 5700U 1.8GHz
Vega 8
min: 28 fps, P1: 27 fps, max: 37 fps
959964
AMD Ryzen 7 7730U 2GHz
Vega 8
min: 29 fps, P1: 27 fps, max: 40 fps
959964
Intel Core i5-1335U 0.9GHz
Iris Xe G7 80EUs
min: 18 fps, P1: 17 fps, max: 24 fps
928484
Intel Core i5-1245U 1.2GHz
Iris Xe G7 80EUs
min: 19 fps, P1: 18 fps, max: 25 fps
959964
Intel Core i5-1335U 0.9GHz
Iris Xe G7 80EUs
min: 15 fps, P1: 15 fps, max: 27 fps
959964
Intel Core i5-1335U 0.9GHz
Iris Xe G7 80EUs
min: 20 fps, P1: 18 fps, max: 29 fps
959964
Intel Core i5-1335U 0.9GHz
Iris Xe G7 80EUs
min: 17 fps, P1: 20 fps, max: 28 fps
959964
Intel Core i5-1345U 1.2GHz
Iris Xe G7 80EUs
min: 21 fps, P1: 21 fps, max: 29 fps
959964
Intel Core i5-1335U 0.9GHz
Iris Xe G7 80EUs
min: 21 fps, P1: 21 fps, max: 29 fps
959964
Intel Core 5 120U 0.9GHz
Iris Xe G7 80EUs
min: 22 fps, P1: 21 fps, max: 30 fps
959964
Intel Core i5-1335U 0.9GHz
Iris Xe G7 80EUs
min: 22 fps, P1: 20 fps, max: 29 fps
959964
Intel Core i5-13500H 1.9GHz
Iris Xe G7 80EUs
min: 25 fps, P1: 23 fps, max: 34 fps
959964
Intel Core i5-1345U 1.2GHz
Iris Xe G7 80EUs
min: 24 fps, P1: 22 fps, max: 35 fps
928484
Intel Core i5-12500H 1.8GHz
Iris Xe G7 80EUs
min: 26 fps, P1: 27 fps, max: 36 fps
959964
AMD Ryzen 7 5700U 1.8GHz
Vega 8
min: 11 fps, P1: 11 fps, max: 17 fps
959964
AMD Ryzen 7 7730U 2GHz
Vega 8
min: 16 fps, P1: 14 fps, max: 26 fps
959964
AMD Ryzen 7 7730U 2GHz
Vega 8
min: 15 fps, P1: 16 fps, max: 26 fps
959964
AMD Ryzen 7 7730U 2GHz
Vega 8
min: 21 fps, P1: 19 fps, max: 27 fps
959964
AMD Ryzen 7 5700U 1.8GHz
Vega 8
min: 21 fps, P1: 19 fps, max: 27 fps
959964
AMD Ryzen 7 7730U 2GHz
Vega 8
min: 22 fps, P1: 21 fps, max: 30 fps
959964
Intel Core i5-1335U 0.9GHz
Iris Xe G7 80EUs
min: 14 fps, P1: 12 fps, max: 18 fps
959964
Intel Core i5-1335U 0.9GHz
Iris Xe G7 80EUs
min: 13 fps, P1: 13 fps, max: 19 fps
959964
Intel Core i5-1335U 0.9GHz
Iris Xe G7 80EUs
min: 11 fps, P1: 12 fps, max: 19 fps
959964
Intel Core i5-1335U 0.9GHz
Iris Xe G7 80EUs
min: 15 fps, P1: 14 fps, max: 22 fps
959964
Intel Core i5-1345U 1.2GHz
Iris Xe G7 80EUs
min: 16 fps, P1: 16 fps, max: 22 fps
959964
Intel Core 5 120U 0.9GHz
Iris Xe G7 80EUs
min: 16 fps, P1: 15 fps, max: 23 fps
959964
Intel Core i5-1335U 0.9GHz
Iris Xe G7 80EUs
min: 16 fps, P1: 16 fps, max: 23 fps
959964
Intel Core i5-13500H 1.9GHz
Iris Xe G7 80EUs
min: 19 fps, P1: 17 fps, max: 26 fps
959964
Intel Core i5-1345U 1.2GHz
Iris Xe G7 80EUs
min: 19 fps, P1: 18 fps, max: 26 fps
928484
Intel Core i5-12500H 1.8GHz
Iris Xe G7 80EUs
min: 20 fps, P1: 20 fps, max: 27 fps

Vampire Bloodhunt
2022AMD Ryzen 9 5900HX 3.3GHz
Vega 8
min: 41.8 fps, P0.1: 45.1 fps, P1: 50.9 fps, max: 119.7 fps
AMD Ryzen 9 5900HX 3.3GHz
Vega 8
min: 4.85 fps, P0.1: 9.84 fps, P1: 27.9 fps, max: 205 fps
AMD Ryzen 7 5800U 1.9GHz
Vega 8
min: 7.08 fps, P0.1: 11.4 fps, P1: 25.4 fps, max: 168.8 fps
AMD Ryzen 7 5800U 1.9GHz
Vega 8
min: 4.15 fps, P0.1: 4.69 fps, P1: 7.64 fps, max: 153 fps
AMD Ryzen 9 5900HX 3.3GHz
Vega 8
min: 10.2 fps, P0.1: 12.4 fps, P1: 24.6 fps, max: 176.7 fps
AMD Ryzen 9 5900HX 3.3GHz
Vega 8
min: 8.39 fps, P0.1: 11.9 fps, P1: 24.8 fps, max: 131.1 fps
AMD Ryzen 9 5900HX 3.3GHz
Vega 8
min: 8.23 fps, P0.1: 10.8 fps, P1: 15.3 fps, max: 93 fps
AMD Ryzen 9 5900HX 3.3GHz
Vega 8
min: 7.13 fps, P0.1: 7.21 fps, P1: 7.55 fps, max: 11.2 fps

Ghostwire Tokyo
2022Intel Core i5-1230U 0.7GHz
Iris Xe G7 80EUs
Problem during benchmarking occured: severe graphical problems out of video memory
AMD Ryzen 7 5800U 1.9GHz
Vega 8
min: 6.15 fps, P0.1: 6.33 fps, P1: 6.72 fps, max: 64.3 fps
AMD Ryzen 7 5700U 1.8GHz
Vega 8
min: 7.26 fps, P0.1: 7.97 fps, P1: 9.87 fps, max: 55.8 fps
AMD Ryzen 9 5900HX 3.3GHz
Vega 8
min: 10.4 fps, P0.1: 10.4 fps, P1: 11 fps, max: 107.8 fps
Intel Core i5-1230U 0.7GHz
Iris Xe G7 80EUs
Problem during benchmarking occured: severe graphical problems out of video memory
AMD Ryzen 7 5800U 1.9GHz
Vega 8
min: 5.43 fps, P0.1: 5.45 fps, P1: 6.26 fps, max: 70.5 fps
AMD Ryzen 7 5700U 1.8GHz
Vega 8
min: 7.36 fps, P0.1: 7.7 fps, P1: 8.24 fps, max: 59 fps
AMD Ryzen 9 5900HX 3.3GHz
Vega 8
min: 10.9 fps, P0.1: 11.1 fps, P1: 11.6 fps, max: 100.4 fps
AMD Ryzen 7 5800U 1.9GHz
Vega 8
min: 5.35 fps, P0.1: 5.49 fps, P1: 6.3 fps, max: 66.1 fps
AMD Ryzen 7 5700U 1.8GHz
Vega 8
min: 7.14 fps, P0.1: 7.2 fps, P1: 8.16 fps, max: 52.6 fps
AMD Ryzen 9 5900HX 3.3GHz
Vega 8
min: 10.4 fps, P0.1: 10.6 fps, P1: 11.2 fps, max: 105.1 fps
AMD Ryzen 7 5700U 1.8GHz
Vega 8
min: 6.58 fps, P0.1: 6.74 fps, P1: 7.94 fps, max: 58.1 fps
AMD Ryzen 9 5900HX 3.3GHz
Vega 8
min: 10.7 fps, P0.1: 10.7 fps, P1: 11.3 fps, max: 102.4 fps
AMD Ryzen 9 5900HX 3.3GHz
Vega 8
min: 6.17 fps, P0.1: 6.18 fps, P1: 6.24 fps, max: 94.3 fps
AMD Ryzen 9 5900HX 3.3GHz
Vega 8
min: 2.82 fps, P0.1: 2.84 fps, P1: 2.96 fps, max: 101.7 fps

Intel Core i5-1135G7 2.4GHz
Iris Xe G7 80EUs
Problem during benchmarking occured: game wont start crash
Intel Core i5-1135G7 2.4GHz
Iris Xe G7 80EUs
Problem during benchmarking occured: game wont start crash

Cyberpunk 2077 1.6
2022Intel Core i5-1235U 0.9GHz
Iris Xe G7 80EUs
min: 8.9 fps, max: 19.1 fps
Intel Core i5-1335U 0.9GHz
Iris Xe G7 80EUs
min: 10.5 fps, max: 19.6 fps
Intel Core i5-1235U 0.9GHz
Iris Xe G7 80EUs
min: 9.8 fps, max: 21.1 fps
Intel Core i5-1335U 0.9GHz
Iris Xe G7 80EUs
min: 10.4 fps, max: 21.7 fps
1.63
Intel Core i5-1335U 0.9GHz
Iris Xe G7 80EUs
min: 11.3 fps, max: 21.5 fps
1.63
AMD Ryzen 7 PRO 7730U 2GHz
Vega 8
min: 7.08 fps, max: 14.4 fps
1.63
Intel Core i5-1335U 0.9GHz
Iris Xe G7 80EUs
min: 9.4 fps, max: 16 fps
Intel Core i5-1235U 0.9GHz
Iris Xe G7 80EUs
min: 8.9 fps, max: 17.1 fps
Intel Core i5-1335U 0.9GHz
Iris Xe G7 80EUs
min: 9.6 fps, max: 17.7 fps
1.63
AMD Ryzen 7 PRO 7730U 2GHz
Vega 8
min: 6.29 fps, max: 10.4 fps
Intel Core i5-1235U 0.9GHz
Iris Xe G7 80EUs
min: 6.7 fps, max: 12.1 fps
Intel Core i5-1235U 0.9GHz
Iris Xe G7 80EUs
min: 7.5 fps, max: 13.2 fps
1.63
Intel Core i5-1335U 0.9GHz
Iris Xe G7 80EUs
min: 8.04 fps, max: 14 fps
1.63
AMD Ryzen 7 PRO 7730U 2GHz
Vega 8
min: 4.71 fps, max: 8.59 fps
Intel Core i5-1235U 0.9GHz
Iris Xe G7 80EUs
min: 5.7 fps, max: 10.9 fps
1.63
Intel Core i5-1335U 0.9GHz
Iris Xe G7 80EUs
min: 7.68 fps, max: 13.1 fps
1.63
AMD Ryzen 7 PRO 7730U 2GHz
Vega 8
min: 3.91 fps, max: 7.91 fps
1.63
Intel Core i5-1335U 0.9GHz
Iris Xe G7 80EUs
min: 4.77 fps, max: 7.8 fps

Elex 2
2022Intel Core i5-1135G7 2.4GHz
Iris Xe G7 80EUs
Problem during benchmarking occured: severe graphical problems
min: 8 fps
AMD Ryzen 9 5900HX 3.3GHz
Vega 8
min: 6.53 fps, P0.1: 6.54 fps, P1: 6.6 fps, max: 8.33 fps
AMD Ryzen 7 5700U 1.8GHz
Vega 8
min: 12.8 fps, P0.1: 13 fps, P1: 13.8 fps, max: 20.1 fps
AMD Ryzen 9 5900HX 3.3GHz
Vega 8
min: 10.7 fps, P0.1: 11.6 fps, P1: 14 fps, max: 25.5 fps
Intel Core i5-1135G7 2.4GHz
Iris Xe G7 80EUs
Problem during benchmarking occured: severe graphical problems
min: 7 fps
AMD Ryzen 9 5900HX 3.3GHz
Vega 8
min: 5.53 fps, P0.1: 5.6 fps, P1: 5.83 fps, max: 7.31 fps
AMD Ryzen 7 5800U 1.9GHz
Vega 8
min: 7.74 fps, P0.1: 7.9 fps, P1: 8.48 fps, max: 13.7 fps
AMD Ryzen 7 5700U 1.8GHz
Vega 8
min: 7.51 fps, P0.1: 8.77 fps, P1: 11.6 fps, max: 16.1 fps
AMD Ryzen 9 5900HX 3.3GHz
Vega 8
min: 11.7 fps, P0.1: 12 fps, P1: 12.9 fps, max: 18 fps
Intel Core i5-1135G7 2.4GHz
Iris Xe G7 80EUs
Problem during benchmarking occured: severe graphical problems
min: 3 fps
AMD Ryzen 9 5900HX 3.3GHz
Vega 8
min: 5.06 fps, P0.1: 5.06 fps, P1: 5.09 fps, max: 6.31 fps
AMD Ryzen 7 5800U 1.9GHz
Vega 8
min: 7.39 fps, P0.1: 7.52 fps, P1: 8 fps, max: 11.6 fps
AMD Ryzen 7 5700U 1.8GHz
Vega 8
min: 9.99 fps, P0.1: 10.1 fps, P1: 10.5 fps, max: 14.3 fps
AMD Ryzen 9 5900HX 3.3GHz
Vega 8
min: 5.61 fps, P0.1: 5.64 fps, P1: 9.36 fps, max: 19.2 fps
AMD Ryzen 7 5700U 1.8GHz
Vega 8
min: 7.19 fps, P0.1: 7.23 fps, P1: 8.64 fps, max: 12.1 fps
AMD Ryzen 9 5900HX 3.3GHz
Vega 8
min: 3.34 fps, P0.1: 4.16 fps, P1: 8.59 fps, max: 14.4 fps
AMD Ryzen 9 5900HX 3.3GHz
Vega 8
min: 5.9 fps, P0.1: 5.92 fps, P1: 6.02 fps, max: 9.15 fps

GRID Legends
2022800660
Intel Core i5-13500H 1.9GHz
Iris Xe G7 80EUs
min: 26.3 fps, max: 136.2 fps
800660
Intel Core i5-13500H 1.9GHz
Iris Xe G7 80EUs
min: 22.8 fps, max: 82.9 fps
800660
Intel Core i5-13500H 1.9GHz
Iris Xe G7 80EUs
min: 24 fps, max: 134.4 fps
800660
Intel Core i5-13500H 1.9GHz
Iris Xe G7 80EUs
min: 13 fps, max: 130.6 fps

Elden Ring
2022Intel Core i5-1135G7 2.4GHz
Iris Xe G7 80EUs
min: 10.7 fps, P0.1: 11 fps, P1: 17.7 fps, max: 33.3 fps
Intel Core i5-1240P 1.2GHz
Iris Xe G7 80EUs
min: 14.7 fps, P0.1: 14.7 fps, P1: 16.6 fps, max: 58.5 fps
AMD Ryzen 9 5900HX 3.3GHz
Vega 8
min: 15.1 fps, P0.1: 16.3 fps, P1: 21.3 fps, max: 53.2 fps
AMD Ryzen 9 5900HX 3.3GHz
Vega 8
min: 19 fps, P0.1: 20.9 fps, P1: 27.4 fps, max: 61.8 fps
Intel Core i5-1240P 1.2GHz
Iris Xe G7 80EUs
min: 9.75 fps, P0.1: 9.98 fps, P1: 10.7 fps, max: 28.5 fps
Intel Core i5-1135G7 2.4GHz
Iris Xe G7 80EUs
min: 9.01 fps, P0.1: 10.8 fps, P1: 15 fps, max: 32.9 fps
AMD Ryzen 9 5900HX 3.3GHz
Vega 8
min: 17.4 fps, P0.1: 18.6 fps, P1: 24.2 fps, max: 67.6 fps
AMD Ryzen 7 5800U 1.9GHz
Vega 8
min: 15.1 fps, P0.1: 15.5 fps, P1: 21.5 fps, max: 49.6 fps
AMD Ryzen 9 5900HX 3.3GHz
Vega 8
min: 15.9 fps, P0.1: 17 fps, P1: 21.5 fps, max: 53.3 fps
Intel Core i5-1240P 1.2GHz
Iris Xe G7 80EUs
min: 7.68 fps, P0.1: 8.16 fps, P1: 9.86 fps, max: 22.7 fps
Intel Core i5-1135G7 2.4GHz
Iris Xe G7 80EUs
min: 9.55 fps, P0.1: 10.7 fps, P1: 13.7 fps, max: 32.3 fps
AMD Ryzen 9 5900HX 3.3GHz
Vega 8
min: 11.8 fps, P0.1: 14.2 fps, P1: 18.5 fps, max: 58.4 fps
AMD Ryzen 7 5800U 1.9GHz
Vega 8
min: 11.8 fps, P0.1: 12.5 fps, P1: 17.1 fps, max: 47.2 fps
AMD Ryzen 9 5900HX 3.3GHz
Vega 8
min: 12.8 fps, P0.1: 14.2 fps, P1: 20.6 fps, max: 54 fps
Intel Core i5-1135G7 2.4GHz
Iris Xe G7 80EUs
min: 8.59 fps, P0.1: 9.06 fps, P1: 11.3 fps, max: 25.5 fps
AMD Ryzen 7 5800U 1.9GHz
Vega 8
min: 9.8 fps, P0.1: 9.87 fps, P1: 12.6 fps, max: 51.3 fps
AMD Ryzen 9 5900HX 3.3GHz
Vega 8
min: 12.8 fps, P0.1: 14 fps, P1: 17.2 fps, max: 44.9 fps
AMD Ryzen 9 5900HX 3.3GHz
Vega 8
min: 13.8 fps, P0.1: 14.8 fps, P1: 18.6 fps, max: 54.3 fps
AMD Ryzen 9 5900HX 3.3GHz
Vega 8
min: 9.82 fps, P0.1: 10.3 fps, P1: 11.9 fps, max: 22.7 fps
AMD Ryzen 9 5900HX 3.3GHz
Vega 8
min: 10.7 fps, P0.1: 11.1 fps, P1: 14.2 fps, max: 45.9 fps
AMD Ryzen 9 5900HX 3.3GHz
Vega 8
min: 4.31 fps, P0.1: 4.49 fps, P1: 6.16 fps, max: 20.3 fps
AMD Ryzen 9 5900HX 3.3GHz
Vega 8
min: 6.63 fps, P0.1: 7.16 fps, P1: 8.97 fps, max: 16.9 fps

Dying Light 2
2022Intel Core i5-1135G7 2.4GHz
Iris Xe G7 80EUs
min: 4.24 fps, P0.1: 4.25 fps, P1: 4.34 fps, max: 122 fps
AMD Ryzen 7 5700U 1.8GHz
Vega 8
min: 8.69 fps, P0.1: 9.61 fps, P1: 12.2 fps, max: 18.2 fps
AMD Ryzen 7 5800U 1.9GHz
Vega 8
min: 12.9 fps, P0.1: 13 fps, P1: 13.6 fps, max: 19.9 fps
AMD Ryzen 9 5900HX 3.3GHz
Vega 8
min: 23.2 fps, P0.1: 23.4 fps, P1: 24.2 fps, max: 33.4 fps
Intel Core i5-1135G7 2.4GHz
Iris Xe G7 80EUs
min: 3.36 fps, P0.1: 3.37 fps, P1: 3.55 fps, max: 117 fps
AMD Ryzen 7 5800U 1.9GHz
Vega 8
min: 7.9 fps, P0.1: 7.91 fps, P1: 8.07 fps, max: 10.6 fps
AMD Ryzen 7 5700U 1.8GHz
Vega 8
min: 8.93 fps, P0.1: 9.23 fps, P1: 10.1 fps, max: 14.1 fps
AMD Ryzen 9 5900HX 3.3GHz
Vega 8
min: 16.5 fps, P0.1: 16.5 fps, P1: 16.8 fps, max: 20.4 fps
AMD Ryzen 9 5900HX 3.3GHz
Vega 8
min: 19.8 fps, P0.1: 19.8 fps, P1: 20.2 fps, max: 25.6 fps
Intel Core i5-1135G7 2.4GHz
Iris Xe G7 80EUs
min: 2.94 fps, P0.1: 2.98 fps, P1: 3.15 fps, max: 138 fps
AMD Ryzen 7 5800U 1.9GHz
Vega 8
min: 6.51 fps, P0.1: 6.51 fps, P1: 6.57 fps, max: 8.93 fps
AMD Ryzen 7 5700U 1.8GHz
Vega 8
min: 7.01 fps, P0.1: 7.21 fps, P1: 8.75 fps, max: 11.4 fps
AMD Ryzen 9 5900HX 3.3GHz
Vega 8
min: 13.7 fps, P0.1: 13.8 fps, P1: 14.3 fps, max: 17.3 fps
AMD Ryzen 9 5900HX 3.3GHz
Vega 8
min: 16.7 fps, P0.1: 16.7 fps, P1: 17 fps, max: 21.1 fps
AMD Ryzen 9 5900HX 3.3GHz
Vega 8
min: 8.34 fps, P0.1: 8.9 fps, P1: 10.6 fps, max: 13 fps
AMD Ryzen 9 5900HX 3.3GHz
Vega 8
min: 12.1 fps, P0.1: 12.2 fps, P1: 12.4 fps, max: 15.1 fps
AMD Ryzen 9 5900HX 3.3GHz
Vega 8
min: 6.31 fps, P0.1: 6.31 fps, P1: 6.34 fps, max: 7.73 fps
AMD Ryzen 9 5900HX 3.3GHz
Vega 8
min: 7.07 fps, P0.1: 7.1 fps, P1: 7.27 fps, max: 8.88 fps

Intel Core i5-1135G7 2.4GHz
Iris Xe G7 80EUs
Problem during benchmarking occured: game wont start crash
Intel Core i5-1135G7 2.4GHz
Iris Xe G7 80EUs
min: 16 fps, max: 27 fps
Intel Core i5-1135G7 2.4GHz
Iris Xe G7 80EUs
Problem during benchmarking occured: game wont start crash
Intel Core i5-1135G7 2.4GHz
Iris Xe G7 80EUs
min: 14 fps, max: 24 fps
Intel Core i5-1135G7 2.4GHz
Iris Xe G7 80EUs
Problem during benchmarking occured: game wont start crash
Intel Core i5-1135G7 2.4GHz
Iris Xe G7 80EUs
min: 12 fps, max: 23 fps
Intel Core i5-1135G7 2.4GHz
Iris Xe G7 80EUs
min: 8 fps, max: 18 fps

God of War
2022Intel Core i5-1135G7 2.4GHz
Iris Xe G7 80EUs
min: 10.9 fps, P0.1: 11.5 fps, P1: 12.8 fps, max: 30.4 fps
Intel Core i5-1155G7 2.5GHz
Iris Xe G7 80EUs
min: 18 fps, P1: 18.25 fps, max: 23 fps
Intel Core i5-1155G7 2.5GHz
Iris Xe G7 80EUs
min: 19 fps, P1: 19.26 fps, max: 23 fps
AMD Ryzen 7 5825U 2GHz
Vega 8
min: 7.99 fps, P0.1: 8.05 fps, P1: 8.33 fps, max: 115.6 fps
AMD Ryzen 7 5700U 1.8GHz
Vega 8
min: 14.1 fps, P0.1: 14.1 fps, P1: 14.3 fps, max: 18.2 fps
AMD Ryzen 9 5900HX 3.3GHz
Vega 8
min: 16.7 fps, P0.1: 16.9 fps, P1: 17.6 fps, max: 25.3 fps
Intel Core i5-1135G7 2.4GHz
Iris Xe G7 80EUs
min: 9.26 fps, P0.1: 9.47 fps, P1: 10.7 fps, max: 22 fps
Intel Core i5-1155G7 2.5GHz
Iris Xe G7 80EUs
min: 17 fps, P1: 17 fps, max: 19 fps
Intel Core i5-1155G7 2.5GHz
Iris Xe G7 80EUs
min: 17 fps, P1: 17.26 fps, max: 20 fps
AMD Ryzen 7 5800U 1.9GHz
Vega 8
min: 6.71 fps, P0.1: 7.25 fps, P1: 8.6 fps, max: 12.6 fps
AMD Ryzen 7 5825U 2GHz
Vega 8
min: 6.09 fps, P0.1: 6.1 fps, P1: 6.18 fps, max: 113.4 fps
AMD Ryzen 7 5700U 1.8GHz
Vega 8
min: 10.8 fps, P0.1: 11 fps, P1: 11.5 fps, max: 13.9 fps
AMD Ryzen 9 5900HX 3.3GHz
Vega 8
min: 11.1 fps, P0.1: 11.5 fps, P1: 12.3 fps, max: 17.9 fps
AMD Ryzen 9 5900HX 3.3GHz
Vega 8
min: 15.3 fps, P0.1: 15.4 fps, P1: 15.8 fps, max: 18.8 fps
Intel Core i5-1155G7 2.5GHz
Iris Xe G7 80EUs
min: 13 fps, P1: 13 fps, max: 16 fps
Intel Core i5-1155G7 2.5GHz
Iris Xe G7 80EUs
min: 14 fps, P1: 14 fps, max: 17 fps
AMD Ryzen 7 5800U 1.9GHz
Vega 8
min: 7.69 fps, P0.1: 7.7 fps, P1: 8.08 fps, max: 10.7 fps
AMD Ryzen 7 5700U 1.8GHz
Vega 8
min: 8 fps, P0.1: 8.06 fps, P1: 8.66 fps, max: 11.7 fps
AMD Ryzen 7 5825U 2GHz
Vega 8
min: 3.88 fps, P0.1: 4.05 fps, P1: 4.71 fps, max: 142.6 fps
AMD Ryzen 9 5900HX 3.3GHz
Vega 8
min: 8.05 fps, P0.1: 8.7 fps, P1: 9.96 fps, max: 12.6 fps
AMD Ryzen 9 5900HX 3.3GHz
Vega 8
min: 7.37 fps, P0.1: 7.38 fps, P1: 11 fps, max: 14.9 fps
Intel Core i5-1155G7 2.5GHz
Iris Xe G7 80EUs
min: 10 fps, P1: 10 fps, max: 13 fps
Intel Core i5-1155G7 2.5GHz
Iris Xe G7 80EUs
min: 11 fps, P1: 11 fps, max: 14 fps
AMD Ryzen 7 5800U 1.9GHz
Vega 8
min: 4.62 fps, P0.1: 4.72 fps, P1: 5.43 fps, max: 7.57 fps
AMD Ryzen 7 5700U 1.8GHz
Vega 8
min: 5.76 fps, P0.1: 5.8 fps, P1: 5.94 fps, max: 8.37 fps
AMD Ryzen 9 5900HX 3.3GHz
Vega 8
min: 6.22 fps, P0.1: 6.29 fps, P1: 6.52 fps, max: 9.48 fps
AMD Ryzen 9 5900HX 3.3GHz
Vega 8
min: 7.74 fps, P0.1: 7.99 fps, P1: 8.51 fps, max: 11.4 fps

Halo Infinite
2021AMD Ryzen 7 5700U 1.8GHz
Vega 8
min: 3.14 fps, P0.1: 3.52 fps, P1: 6.01 fps, max: 67.6 fps
AMD Ryzen 7 5800U 1.9GHz
Vega 8
min: 5.75 fps, P0.1: 5.96 fps, P1: 6.74 fps, max: 24.6 fps
AMD Ryzen 9 5900HX 3.3GHz
Vega 8
min: 8.25 fps, P0.1: 8.63 fps, P1: 10.9 fps, max: 47 fps
AMD Ryzen 7 5800U 1.9GHz
Vega 8
min: 1.857 fps, P0.1: 2.18 fps, P1: 5.32 fps, max: 13.8 fps
AMD Ryzen 7 5700U 1.8GHz
Vega 8
min: 2.8 fps, P0.1: 3.03 fps, P1: 4.53 fps, max: 41.2 fps
AMD Ryzen 7 5800U 1.9GHz
Vega 8
min: 3.64 fps, P0.1: 3.83 fps, P1: 4.94 fps, max: 12.6 fps
AMD Ryzen 7 5700U 1.8GHz
Vega 8
min: 2.66 fps, P0.1: 2.72 fps, P1: 3.8 fps, max: 16.5 fps

Farming Simulator 22
2021Intel Core i5-1135G7 2.4GHz
Iris Xe G7 80EUs
min: 10.6 fps, P0.1: 15.4 fps, P1: 26.5 fps, max: 147 fps
AMD Ryzen 7 5800U 1.9GHz
Vega 8
min: 15.6 fps, P0.1: 18.6 fps, P1: 26.3 fps, max: 165 fps
AMD Ryzen 9 5900HX 3.3GHz
Vega 8
min: 17.6 fps, P0.1: 24.6 fps, P1: 40.6 fps, max: 207 fps
AMD Ryzen 9 5900HX 3.3GHz
Vega 8
min: 24.2 fps, P0.1: 80.1 fps, P1: 107 fps, max: 219 fps
AMD Ryzen 9 5900HX 3.3GHz
Vega 8
min: 17.6 fps, P0.1: 25 fps, P1: 42 fps, max: 230 fps
Intel Core i5-1135G7 2.4GHz
Iris Xe G7 80EUs
min: 5.64 fps, P0.1: 5.99 fps, P1: 8.03 fps, max: 109 fps
AMD Ryzen 7 5800U 1.9GHz
Vega 8
min: 6.03 fps, P0.1: 7.63 fps, P1: 9.37 fps, max: 110 fps
AMD Ryzen 9 5900HX 3.3GHz
Vega 8
min: 10.5 fps, P0.1: 13.7 fps, P1: 20.5 fps, max: 93.2 fps
AMD Ryzen 9 5900HX 3.3GHz
Vega 8
min: 9.07 fps, P0.1: 12.4 fps, P1: 19.8 fps, max: 124 fps
AMD Ryzen 9 5900HX 3.3GHz
Vega 8
min: 9.38 fps, P0.1: 13.8 fps, P1: 19.9 fps, max: 144 fps
Intel Core i5-1135G7 2.4GHz
Iris Xe G7 80EUs
min: 3.38 fps, P0.1: 4.12 fps, P1: 5.35 fps, max: 93.1 fps
AMD Ryzen 7 5800U 1.9GHz
Vega 8
min: 6.22 fps, P0.1: 6.31 fps, P1: 7.06 fps, max: 100 fps
AMD Ryzen 9 5900HX 3.3GHz
Vega 8
min: 9.37 fps, P0.1: 9.88 fps, P1: 15.9 fps, max: 56.9 fps
AMD Ryzen 9 5900HX 3.3GHz
Vega 8
min: 2.32 fps, P0.1: 2.97 fps, P1: 5.79 fps, max: 115 fps
AMD Ryzen 9 5900HX 3.3GHz
Vega 8
min: 10 fps, P0.1: 11.2 fps, P1: 15.9 fps, max: 118 fps
AMD Ryzen 7 5800U 1.9GHz
Vega 8
min: 5.07 fps, P0.1: 6.12 fps, P1: 7.34 fps, max: 67.9 fps
AMD Ryzen 9 5900HX 3.3GHz
Vega 8
min: 10.6 fps, P0.1: 12.3 fps, P1: 14.9 fps, max: 38.3 fps
AMD Ryzen 9 5900HX 3.3GHz
Vega 8
min: 9.45 fps, P0.1: 11.6 fps, P1: 15.2 fps, max: 96.5 fps
AMD Ryzen 9 5900HX 3.3GHz
Vega 8
min: 10.3 fps, P0.1: 12.1 fps, P1: 15.8 fps, max: 103 fps
AMD Ryzen 9 5900HX 3.3GHz
Vega 8
min: 6.67 fps, P0.1: 7.92 fps, P1: 11.7 fps, max: 101 fps
AMD Ryzen 9 5900HX 3.3GHz
Vega 8
min: 10.8 fps, P0.1: 11.5 fps, P1: 18 fps, max: 96.5 fps
AMD Ryzen 9 5900HX 3.3GHz
Vega 8
min: 6.6 fps, P0.1: 7.68 fps, P1: 10 fps, max: 31.1 fps
AMD Ryzen 9 5900HX 3.3GHz
Vega 8
min: 7.75 fps, P0.1: 8.75 fps, P1: 10.8 fps, max: 30 fps

Battlefield 2042
2021Intel Core i5-1135G7 2.4GHz
Iris Xe G7 80EUs
min: 11.9 fps, P0.1: 15.9 fps, P1: 21 fps, max: 48 fps
AMD Ryzen 7 5800U 1.9GHz
Vega 8
min: 2.25 fps, P0.1: 3.5 fps, P1: 12.1 fps, max: 105 fps
AMD Ryzen 9 5900HX 3.3GHz
Vega 8
min: 16.4 fps, P0.1: 17.2 fps, P1: 20.7 fps, max: 117 fps
Intel Core i5-1135G7 2.4GHz
Iris Xe G7 80EUs
min: 9.83 fps, P0.1: 10 fps, P1: 11.3 fps, max: 21.1 fps
AMD Ryzen 7 5800U 1.9GHz
Vega 8
min: 7.22 fps, P0.1: 8.37 fps, P1: 10.4 fps, max: 43.2 fps
AMD Ryzen 9 5900HX 3.3GHz
Vega 8
min: 8.33 fps, P0.1: 8.55 fps, P1: 10.6 fps, max: 103 fps
Intel Core i5-1135G7 2.4GHz
Iris Xe G7 80EUs
min: 9.52 fps, P0.1: 9.72 fps, P1: 10.2 fps, max: 18.7 fps
AMD Ryzen 7 5800U 1.9GHz
Vega 8
min: 6.1 fps, P0.1: 6.45 fps, P1: 8.36 fps, max: 29.5 fps
AMD Ryzen 9 5900HX 3.3GHz
Vega 8
min: 6.44 fps, P0.1: 7.56 fps, P1: 9.74 fps, max: 45.5 fps
AMD Ryzen 7 5800U 1.9GHz
Vega 8
min: 4.78 fps, P0.1: 4.79 fps, P1: 6.49 fps, max: 23.7 fps

Forza Horizon 5
2021
AMD Ryzen 7 5800U 1.9GHz
Vega 8
min: 14.6 fps, P0.1: 16.4 fps, P1: 20.7 fps, max: 248 fps
AMD Ryzen 7 5800U 1.9GHz
Vega 8
min: 11.7 fps, P0.1: 11.9 fps, P1: 15.1 fps, max: 27.2 fps
AMD Ryzen 7 5800U 1.9GHz
Vega 8
min: 8.65 fps, P0.1: 8.78 fps, P1: 10 fps, max: 28 fps
AMD Ryzen 7 5800U 1.9GHz
Vega 8
min: 7.85 fps, P0.1: 8.16 fps, P1: 9.65 fps, max: 14.8 fps

Riders Republic
2021Intel Core i5-1135G7 2.4GHz
Iris Xe G7 80EUs
min: 15 fps, max: 33 fps
Intel Core i5-1135G7 2.4GHz
Iris Xe G7 80EUs
min: 20 fps, max: 33 fps
Intel Core i5-1135G7 2.4GHz
Iris Xe G7 80EUs
min: 11 fps, max: 18 fps
Intel Core i5-1135G7 2.4GHz
Iris Xe G7 80EUs
min: 12 fps, max: 19 fps
Intel Core i5-1135G7 2.4GHz
Iris Xe G7 80EUs
min: 9 fps, max: 15 fps
Intel Core i5-1135G7 2.4GHz
Iris Xe G7 80EUs
min: 10 fps, max: 15 fps
Intel Core i5-1135G7 2.4GHz
Iris Xe G7 80EUs
min: 8 fps, max: 13 fps

Back 4 Blood
2021Intel Core i5-1135G7 2.4GHz
Iris Xe G7 80EUs
min: 25 fps, P0.1: 26.1 fps, P1: 27.8 fps, max: 219 fps
AMD Ryzen 7 5700U 1.8GHz
Vega 8
min: 36.2 fps, P0.1: 39.5 fps, P1: 49 fps, max: 169.9 fps
AMD Ryzen 9 5900HX 3.3GHz
Vega 8
min: 21.8 fps, P0.1: 68.5 fps, P1: 73.6 fps, max: 296 fps
Intel Core i5-1135G7 2.4GHz
Iris Xe G7 80EUs
min: 6.24 fps, P0.1: 6.81 fps, P1: 8.97 fps, max: 143 fps
AMD Ryzen 7 5800U 1.9GHz
Vega 8
min: 11.1 fps, P0.1: 11.6 fps, P1: 14.7 fps, max: 181 fps
AMD Ryzen 7 5700U 1.8GHz
Vega 8
min: 12.4 fps, P0.1: 13 fps, P1: 13.6 fps, max: 139.3 fps
AMD Ryzen 9 5900HX 3.3GHz
Vega 8
min: 24.5 fps, P0.1: 26.6 fps, P1: 30.8 fps, max: 58 fps
Intel Core i5-1135G7 2.4GHz
Iris Xe G7 80EUs
min: 9.02 fps, P0.1: 9.33 fps, P1: 10.1 fps, max: 110 fps
AMD Ryzen 7 5800U 1.9GHz
Vega 8
min: 10.4 fps, P0.1: 11.5 fps, P1: 13 fps, max: 144 fps
AMD Ryzen 7 5700U 1.8GHz
Vega 8
min: 9.6 fps, P0.1: 10.1 fps, P1: 12.2 fps, max: 131.6 fps
AMD Ryzen 9 5900HX 3.3GHz
Vega 8
min: 23.1 fps, P0.1: 23.5 fps, P1: 25.3 fps, max: 46.3 fps
Intel Core i5-1135G7 2.4GHz
Iris Xe G7 80EUs
min: 9 fps, P0.1: 9.02 fps, P1: 9.65 fps, max: 135 fps
AMD Ryzen 7 5800U 1.9GHz
Vega 8
min: 7.93 fps, P0.1: 8.01 fps, P1: 9.19 fps, max: 164 fps
AMD Ryzen 7 5700U 1.8GHz
Vega 8
min: 9.08 fps, P0.1: 9.8 fps, P1: 11.4 fps, max: 112.9 fps
AMD Ryzen 9 5900HX 3.3GHz
Vega 8
min: 19.1 fps, P0.1: 20.4 fps, P1: 21.3 fps, max: 38.6 fps
AMD Ryzen 9 5900HX 3.3GHz
Vega 8
min: 10.6 fps, P0.1: 10.7 fps, P1: 11.3 fps, max: 21.6 fps

Far Cry 6
2021Intel Core i5-1135G7 2.4GHz
Iris Xe G7 80EUs
Problem during benchmarking occured: game wont start

Alan Wake Remastered
2021Intel Core i5-1135G7 2.4GHz
Iris Xe G7 80EUs
min: 25.7 fps, P0.1: 30.2 fps, P1: 35.4 fps, max: 77.3 fps
Intel Core i5-1135G7 2.4GHz
Iris Xe G7 80EUs
min: 7.58 fps, P0.1: 10 fps, P1: 38.8 fps, max: 112 fps
AMD Ryzen 7 5700U 1.8GHz
Vega 8
min: 6.6 fps, P0.1: 9.83 fps, P1: 30.8 fps, max: 146.3 fps
AMD Ryzen 9 5900HX 3.3GHz
Vega 8
min: 22.1 fps, P0.1: 27.1 fps, P1: 37.7 fps, max: 103 fps
Intel Core i5-1135G7 2.4GHz
Iris Xe G7 80EUs
min: 7.43 fps, P0.1: 10.6 fps, P1: 17 fps, max: 55.7 fps
Intel Core i5-1135G7 2.4GHz
Iris Xe G7 80EUs
min: 7.42 fps, P0.1: 8.03 fps, P1: 17.9 fps, max: 70.5 fps
AMD Ryzen 7 5700U 1.8GHz
Vega 8
min: 7.28 fps, P0.1: 7.97 fps, P1: 13.4 fps, max: 65.7 fps
AMD Ryzen 9 5900HX 3.3GHz
Vega 8
min: 14.9 fps, P0.1: 15.5 fps, P1: 17.8 fps, max: 70.5 fps
AMD Ryzen 7 5800U 1.9GHz
Vega 8
min: 11.3 fps, P0.1: 15.7 fps, P1: 20.4 fps, max: 73.5 fps
AMD Ryzen 9 5900HX 3.3GHz
Vega 8
min: 19.7 fps, P0.1: 23.2 fps, P1: 29.9 fps, max: 65.8 fps
AMD Ryzen 9 5900HX 3.3GHz
Vega 8
min: 23.2 fps, P0.1: 29.1 fps, P1: 42.9 fps, max: 121 fps
Intel Core i5-1135G7 2.4GHz
Iris Xe G7 80EUs
min: 6.97 fps, P0.1: 7.02 fps, P1: 12.8 fps, max: 38.1 fps
Intel Core i5-1135G7 2.4GHz
Iris Xe G7 80EUs
min: 7.5 fps, P0.1: 7.51 fps, P1: 13.2 fps, max: 48.3 fps
AMD Ryzen 7 5700U 1.8GHz
Vega 8
min: 11.3 fps, P0.1: 11.5 fps, P1: 12.2 fps, max: 21 fps
AMD Ryzen 9 5900HX 3.3GHz
Vega 8
min: 12.4 fps, P0.1: 12.8 fps, P1: 13.4 fps, max: 35.7 fps
AMD Ryzen 7 5800U 1.9GHz
Vega 8
min: 11.7 fps, P0.1: 12.3 fps, P1: 17.2 fps, max: 48.2 fps
AMD Ryzen 9 5900HX 3.3GHz
Vega 8
min: 19.3 fps, P0.1: 20 fps, P1: 24.5 fps, max: 37.5 fps
AMD Ryzen 9 5900HX 3.3GHz
Vega 8
min: 21 fps, P0.1: 28.8 fps, P1: 34.4 fps, max: 72.1 fps
AMD Ryzen 9 5900HX 3.3GHz
Vega 8
min: 16.7 fps, P0.1: 22.8 fps, P1: 24.3 fps, max: 52.4 fps
AMD Ryzen 9 5900HX 3.3GHz
Vega 8
min: 10.3 fps, P0.1: 12.1 fps, P1: 13.3 fps, max: 35.1 fps

FIFA 22
2021
New World
2021Intel Core i5-1135G7 2.4GHz
Iris Xe G7 80EUs
min: 11.2 fps, P0.1: 13.1 fps, P1: 17.7 fps, max: 69.6 fps
AMD Ryzen 7 5800U 1.9GHz
Vega 8
min: 11 fps, P0.1: 11.4 fps, P1: 15.1 fps, max: 42.8 fps
AMD Ryzen 7 5800H 3.2GHz
Vega 8
min: 18.1 fps, P0.1: 21 fps, P1: 23.1 fps, max: 58.8 fps
Intel Core i5-1135G7 2.4GHz
Iris Xe G7 80EUs
min: 6.64 fps, P0.1: 7.18 fps, P1: 10.2 fps, max: 20.5 fps
AMD Ryzen 7 5800U 1.9GHz
Vega 8
min: 8.24 fps, P0.1: 8.38 fps, P1: 8.74 fps, max: 17.6 fps
AMD Ryzen 7 5800H 3.2GHz
Vega 8
min: 10.4 fps, P0.1: 11.1 fps, P1: 12.4 fps, max: 25 fps
AMD Ryzen 7 5800U 1.9GHz
Vega 8
min: 6.74 fps, P0.1: 6.98 fps, P1: 8.38 fps, max: 15 fps
AMD Ryzen 7 5800H 3.2GHz
Vega 8
min: 10.2 fps, P0.1: 10.8 fps, P1: 11.6 fps, max: 24.4 fps
AMD Ryzen 7 5800U 1.9GHz
Vega 8
min: 5.39 fps, P0.1: 5.43 fps, P1: 5.68 fps, max: 11.2 fps
AMD Ryzen 7 5800H 3.2GHz
Vega 8
min: 6.16 fps, P0.1: 6.78 fps, P1: 9.28 fps, max: 78.8 fps

Deathloop
2021AMD Ryzen 7 5800U 1.9GHz
Vega 8
min: 4.48 fps, P0.1: 6.68 fps, P1: 10.3 fps, max: 42.7 fps
AMD Ryzen 7 5800H 3.2GHz
Vega 8
min: 8.43 fps, P0.1: 13.1 fps, P1: 19.4 fps, max: 55 fps
AMD Ryzen 7 5800U 1.9GHz
Vega 8
min: 1.283 fps, P0.1: 2.73 fps, P1: 8.56 fps, max: 48.5 fps
AMD Ryzen 7 5800H 3.2GHz
Vega 8
min: 6.86 fps, P0.1: 8.94 fps, P1: 13 fps, max: 22.6 fps

F1 2021
2021Intel Core i5-1135G7 2.4GHz
Iris Xe G7 80EUs
Problem during benchmarking occured: game wont start
874931
Intel Core i7-1250U 0.8GHz
Iris Xe G7 80EUs
min: 12 fps, P1: 7 fps, max: 18 fps
843175
Intel Core i5-1135G7 2.4GHz
Iris Xe G7 80EUs
min: 31 fps, P1: 28 fps, max: 48 fps
831795
Intel Core i5-1135G7 2.4GHz
Iris Xe G7 80EUs
min: 33 fps, P1: 33 fps, max: 50 fps
807588
Intel Core i5-1135G7 2.4GHz
Iris Xe G7 80EUs
min: 37 fps, P1: 35 fps, max: 56 fps
874931
Intel Core i5-1250P 1.2GHz
Iris Xe G7 80EUs
min: 14 fps, P1: 20 fps, max: 58 fps
874931
Intel Core i5-1240P 1.2GHz
Iris Xe G7 80EUs
min: 31 fps, P1: 36 fps, max: 78 fps
850670
Intel Core i5-1130G7 1.8GHz
Iris Xe G7 80EUs
min: 49 fps, P1: 45 fps, max: 83 fps
803111
Intel Core i5-11300H 3.1GHz
Iris Xe G7 80EUs
min: 60 fps, P1: 54 fps, max: 82 fps
843175, Dual-Channel
Intel Core i5-1135G7 2.4GHz
Iris Xe G7 80EUs
min: 59 fps, P1: 52 fps, max: 83 fps
874931
Intel Core i5-1240P 1.2GHz
Iris Xe G7 80EUs
min: 54 fps, P1: 52 fps, max: 85 fps
874931
Intel Core i5-1335U 0.9GHz
Iris Xe G7 80EUs
min: 42 fps, P1: 48 fps, max: 90 fps
874931
Intel Core i5-1235U 0.9GHz
Iris Xe G7 80EUs
min: 60 fps, P1: 53 fps, max: 98 fps
874931, Hoch
Intel Core i5-1240P 1.2GHz
Iris Xe G7 80EUs
min: 56 fps, P1: 54 fps, max: 95 fps
831795, Dual-Channel
Intel Core i5-1135G7 2.4GHz
Iris Xe G7 80EUs
min: 58 fps, P1: 58 fps, max: 88 fps
874931
Intel Core i5-1245U 1.2GHz
Iris Xe G7 80EUs
min: 62 fps, P1: 62 fps, max: 93 fps
874931
Intel Core i5-1145G7 2.6GHz
Iris Xe G7 80EUs
min: 74 fps, P1: 72 fps, max: 118 fps
840701
Intel Core i5-1135G7 2.4GHz
Iris Xe G7 80EUs
Problem during benchmarking occured: small graphical problems
min: 76 fps, P1: 67 fps, max: 120 fps
840701
AMD Ryzen 7 5700U 1.8GHz
Vega 8
min: 37 fps, P1: 38 fps, max: 59 fps
868399, Flüstermodus
AMD Ryzen 7 5700U 1.8GHz
Vega 8
min: 60 fps, P1: 59 fps, max: 98 fps
800360
AMD Ryzen 7 5700U 1.8GHz
Vega 8
min: 64 fps, P1: 62 fps, max: 93 fps
868399, Leistungsmodus
AMD Ryzen 7 5700U 1.8GHz
Vega 8
min: 64 fps, P1: 64 fps, max: 98 fps
874931
AMD Ryzen 7 7730U 2GHz
Vega 8
min: 63 fps, P1: 65 fps, max: 97 fps
874931
AMD Ryzen 7 7730U 2GHz
Vega 8
min: 64 fps, P1: 66 fps, max: 96 fps
868399
AMD Ryzen 7 5700U 1.8GHz
Vega 8
min: 65 fps, P1: 67 fps, max: 99 fps
807588
AMD Ryzen 7 5800U 1.9GHz
Vega 8
min: 73 fps, P1: 70 fps, max: 102 fps
874931
AMD Ryzen 7 5700G 3.8GHz
Vega 8
min: 72 fps, P1: 71 fps, max: 106 fps
874931
AMD Ryzen 7 5700U 1.8GHz
Vega 8
min: 75 fps, P1: 71 fps, max: 108 fps
815237
AMD Ryzen 7 5800H 3.2GHz
Vega 8
min: 73 fps, P1: 76 fps, max: 111 fps
831795
AMD Ryzen 9 5900HX 3.3GHz
Vega 8
min: 74 fps, P1: 75 fps, max: 114 fps
874931
AMD Ryzen 7 7730U 2GHz
Vega 8
min: 79 fps, P1: 78 fps, max: 119 fps
874931
AMD Ryzen 7 PRO 5750G 3.8GHz
Vega 8
min: 62 fps, P1: 75 fps, max: 138 fps
874931
Intel Core i5-1250P 1.2GHz
Iris Xe G7 80EUs
min: 3 fps, P1: 4 fps, max: 26 fps
850670
Intel Core i5-1130G7 1.8GHz
Iris Xe G7 80EUs
min: 18 fps, P1: 18 fps, max: 34 fps
874931
Intel Core i5-1240P 1.2GHz
Iris Xe G7 80EUs
min: 20 fps, P1: 20 fps, max: 33 fps
874931
Intel Core i5-1240P 1.2GHz
Iris Xe G7 80EUs
min: 22 fps, P1: 21 fps, max: 37 fps
874931, Hoch
Intel Core i5-1240P 1.2GHz
Iris Xe G7 80EUs
min: 25 fps, P1: 24 fps, max: 39 fps
874931
Intel Core i5-1235U 0.9GHz
Iris Xe G7 80EUs
min: 26 fps, P1: 24 fps, max: 46 fps
831795, Dual-Channel
Intel Core i5-1135G7 2.4GHz
Iris Xe G7 80EUs
min: 29 fps, P1: 29 fps, max: 41 fps
843175, Dual-Channel
Intel Core i5-1135G7 2.4GHz
Iris Xe G7 80EUs
min: 29 fps, P1: 28 fps, max: 40 fps
803111
Intel Core i5-11300H 3.1GHz
Iris Xe G7 80EUs
min: 30 fps, P1: 29 fps, max: 40 fps
874931
Intel Core i5-1245U 1.2GHz
Iris Xe G7 80EUs
min: 30 fps, P1: 28 fps, max: 42 fps
874931
Intel Core i5-1335U 0.9GHz
Iris Xe G7 80EUs
min: 32 fps, P1: 32 fps, max: 49 fps
840701
AMD Ryzen 7 5700U 1.8GHz
Vega 8
min: 10 fps, P1: 15 fps, max: 26 fps
868399, Flüstermodus
AMD Ryzen 7 5700U 1.8GHz
Vega 8
min: 27 fps, P1: 26 fps, max: 43 fps
807588
AMD Ryzen 7 5800U 1.9GHz
Vega 8
min: 29 fps, P1: 29 fps, max: 41 fps
800360
AMD Ryzen 7 5700U 1.8GHz
Vega 8
min: 30 fps, P1: 28 fps, max: 42 fps
874931
AMD Ryzen 7 7730U 2GHz
Vega 8
min: 29 fps, P1: 28 fps, max: 44 fps
874931
AMD Ryzen 7 7730U 2GHz
Vega 8
min: 30 fps, P1: 28 fps, max: 44 fps
868399, Leistungsmodus
AMD Ryzen 7 5700U 1.8GHz
Vega 8
min: 29 fps, P1: 29 fps, max: 44 fps
868399
AMD Ryzen 7 5700U 1.8GHz
Vega 8
min: 31 fps, P1: 30 fps, max: 43 fps
815237
AMD Ryzen 7 5800H 3.2GHz
Vega 8
min: 32 fps, P1: 32 fps, max: 46 fps
874931
AMD Ryzen 7 5700G 3.8GHz
Vega 8
min: 32 fps, P1: 32 fps, max: 47 fps
874931
AMD Ryzen 7 5700U 1.8GHz
Vega 8
min: 32 fps, P1: 32 fps, max: 47 fps
874931
AMD Ryzen 7 7730U 2GHz
Vega 8
min: 31 fps, P1: 31 fps, max: 48 fps
831795
AMD Ryzen 9 5900HX 3.3GHz
Vega 8
min: 34 fps, P1: 34 fps, max: 49 fps
868399
AMD Ryzen 7 5800H @4.5GHz
Vega 8
min: 34 fps, P1: 34 fps, max: 51 fps
874931
AMD Ryzen 7 PRO 5750G 3.8GHz
Vega 8
min: 42 fps, P1: 41 fps, max: 59 fps
874931
Intel Core i5-1250P 1.2GHz
Iris Xe G7 80EUs
min: 5 fps, P1: 11 fps, max: 22 fps
874931
Intel Core i5-1240P 1.2GHz
Iris Xe G7 80EUs
min: 21 fps, P1: 20 fps, max: 27 fps
850670
Intel Core i5-1130G7 1.8GHz
Iris Xe G7 80EUs
min: 19 fps, P1: 19 fps, max: 32 fps
874931
Intel Core i5-1240P 1.2GHz
Iris Xe G7 80EUs
min: 19 fps, P1: 19 fps, max: 30 fps
874931
Intel Core i5-1235U 0.9GHz
Iris Xe G7 80EUs
min: 18 fps, P1: 18 fps, max: 33 fps
874931, Hoch
Intel Core i5-1240P 1.2GHz
Iris Xe G7 80EUs
min: 22 fps, P1: 22 fps, max: 32 fps
843175, Dual-Channel
Intel Core i5-1135G7 2.4GHz
Iris Xe G7 80EUs
min: 23 fps, P1: 22 fps, max: 31 fps
803111
Intel Core i5-11300H 3.1GHz
Iris Xe G7 80EUs
min: 24 fps, P1: 23 fps, max: 32 fps
831795, Dual-Channel
Intel Core i5-1135G7 2.4GHz
Iris Xe G7 80EUs
min: 23 fps, P1: 23 fps, max: 32 fps
874931
Intel Core i5-1245U 1.2GHz
Iris Xe G7 80EUs
min: 25 fps, P1: 24 fps, max: 33 fps
874931
Intel Core i5-1335U 0.9GHz
Iris Xe G7 80EUs
min: 21 fps, P1: 24 fps, max: 37 fps
868399, Flüstermodus
AMD Ryzen 7 5700U 1.8GHz
Vega 8
min: 19 fps, P1: 19 fps, max: 32 fps
800360
AMD Ryzen 7 5700U 1.8GHz
Vega 8
min: 22 fps, P1: 21 fps, max: 31 fps
874931
AMD Ryzen 7 7730U 2GHz
Vega 8
min: 18 fps, P1: 21 fps, max: 31 fps
874931
AMD Ryzen 7 7730U 2GHz
Vega 8
min: 16 fps, P1: 20 fps, max: 32 fps
868399
AMD Ryzen 7 5700U 1.8GHz
Vega 8
min: 24 fps, P1: 24 fps, max: 32 fps
868399, Leistungsmodus
AMD Ryzen 7 5700U 1.8GHz
Vega 8
min: 24 fps, P1: 24 fps, max: 32 fps
807588
AMD Ryzen 7 5800U 1.9GHz
Vega 8
min: 25 fps, P1: 24 fps, max: 33 fps
874931
AMD Ryzen 7 5700G 3.8GHz
Vega 8
min: 25 fps, P1: 25 fps, max: 34 fps
815237
AMD Ryzen 7 5800H 3.2GHz
Vega 8
min: 26 fps, P1: 25 fps, max: 33 fps
874931
AMD Ryzen 7 7730U 2GHz
Vega 8
min: 26 fps, P1: 25 fps, max: 34 fps
874931
AMD Ryzen 7 5700U 1.8GHz
Vega 8
min: 26 fps, P1: 26 fps, max: 35 fps
831795
AMD Ryzen 9 5900HX 3.3GHz
Vega 8
min: 27 fps, P1: 26 fps, max: 36 fps
868399
AMD Ryzen 7 5800H @4.5GHz
Vega 8
min: 26 fps, P1: 26 fps, max: 36 fps
874931
AMD Ryzen 7 PRO 5750G 3.8GHz
Vega 8
min: 33 fps, P1: 33 fps, max: 46 fps
874931
Intel Core i5-1250P 1.2GHz
Iris Xe G7 80EUs
min: 4 fps, P1: 7 fps, max: 15 fps
850670
Intel Core i5-1130G7 1.8GHz
Iris Xe G7 80EUs
min: 10 fps, P1: 10 fps, max: 19 fps
874931
Intel Core i5-1240P 1.2GHz
Iris Xe G7 80EUs
P1: 11 fps, max: 19 fps
874931
Intel Core i5-1240P 1.2GHz
Iris Xe G7 80EUs
min: 13 fps, P1: 13 fps, max: 22 fps
874931, Hoch
Intel Core i5-1240P 1.2GHz
Iris Xe G7 80EUs
min: 14 fps, P1: 14 fps, max: 21 fps
874931
Intel Core i5-1235U 0.9GHz
Iris Xe G7 80EUs
min: 14 fps, P1: 14 fps, max: 22 fps
874931
Intel Core i5-1245U 1.2GHz
Iris Xe G7 80EUs
min: 15 fps, P1: 15 fps, max: 21 fps
843175, Dual-Channel
Intel Core i5-1135G7 2.4GHz
Iris Xe G7 80EUs
min: 15 fps, P1: 15 fps, max: 21 fps
831795, Dual-Channel
Intel Core i5-1135G7 2.4GHz
Iris Xe G7 80EUs
min: 16 fps, P1: 16 fps, max: 22 fps
874931
Intel Core i5-1335U 0.9GHz
Iris Xe G7 80EUs
min: 19 fps, P1: 18 fps, max: 26 fps
868399, Flüstermodus
AMD Ryzen 7 5700U 1.8GHz
Vega 8
min: 12 fps, P1: 13 fps, max: 22 fps
800360
AMD Ryzen 7 5700U 1.8GHz
Vega 8
min: 13 fps, P1: 14 fps, max: 22 fps
807588
AMD Ryzen 7 5800U 1.9GHz
Vega 8
min: 16 fps, P1: 15 fps, max: 23 fps
874931
AMD Ryzen 7 7730U 2GHz
Vega 8
min: 14 fps, P1: 15 fps, max: 22 fps
874931
AMD Ryzen 7 7730U 2GHz
Vega 8
min: 13 fps, P1: 15 fps, max: 22 fps
868399, Leistungsmodus
AMD Ryzen 7 5700U 1.8GHz
Vega 8
min: 16 fps, P1: 16 fps, max: 23 fps
868399
AMD Ryzen 7 5700U 1.8GHz
Vega 8
min: 16 fps, P1: 16 fps, max: 23 fps
874931
AMD Ryzen 7 7730U 2GHz
Vega 8
min: 12 fps, P1: 16 fps, max: 23 fps
815237
AMD Ryzen 7 5800H 3.2GHz
Vega 8
min: 16 fps, P1: 16 fps, max: 24 fps
874931
AMD Ryzen 7 5700G 3.8GHz
Vega 8
min: 16 fps, P1: 17 fps, max: 24 fps
874931
AMD Ryzen 7 5700U 1.8GHz
Vega 8
min: 17 fps, P1: 17 fps, max: 24 fps
831795
AMD Ryzen 9 5900HX 3.3GHz
Vega 8
min: 17 fps, P1: 17 fps, max: 25 fps
874931
AMD Ryzen 7 PRO 5750G 3.8GHz
Vega 8
min: 22 fps, P1: 21 fps, max: 31 fps
874931
Intel Core i5-1240P 1.2GHz
Iris Xe G7 80EUs
min: 5 fps, P1: 8 fps, max: 15 fps
831795
AMD Ryzen 9 5900HX 3.3GHz
Vega 8
min: 13 fps, P1: 13 fps, max: 18 fps
831795
AMD Ryzen 9 5900HX 3.3GHz
Vega 8
min: 6 fps, P1: 6 fps, max: 9 fps

Intel Core i5-11300H 3.1GHz
Iris Xe G7 80EUs
min: 39.3 fps, P0.1: 40.2 fps, P1: 43.9 fps, max: 82.3 fps
AMD Ryzen 7 5800U 1.9GHz
Vega 8
min: 39.2 fps, P0.1: 41.2 fps, P1: 45.1 fps, max: 70.1 fps
AMD Ryzen 7 5700U 1.8GHz
Vega 8
min: 21.6 fps, P0.1: 23.2 fps, P1: 32 fps, max: 84.8 fps
AMD Ryzen 9 5900HX 3.3GHz
Vega 8
min: 53.4 fps, P0.1: 54.8 fps, P1: 60.1 fps, max: 91.3 fps
Intel Core i5-11300H 3.1GHz
Iris Xe G7 80EUs
min: 22.6 fps, P0.1: 22.8 fps, P1: 24.2 fps, max: 40.3 fps
AMD Ryzen 7 5800U 1.9GHz
Vega 8
min: 27.4 fps, P0.1: 27.7 fps, P1: 28.8 fps, max: 41.6 fps
AMD Ryzen 7 5700U 1.8GHz
Vega 8
min: 17.7 fps, P0.1: 19.9 fps, P1: 27.4 fps, max: 52 fps
AMD Ryzen 9 5900HX 3.3GHz
Vega 8
min: 36 fps, P0.1: 36.9 fps, P1: 38.4 fps, max: 52.8 fps
Intel Core i5-11300H 3.1GHz
Iris Xe G7 80EUs
min: 19.7 fps, P0.1: 19.8 fps, P1: 21.2 fps, max: 31.8 fps
AMD Ryzen 7 5800U 1.9GHz
Vega 8
min: 20.8 fps, P0.1: 22.3 fps, P1: 24.4 fps, max: 36.1 fps
AMD Ryzen 7 5700U 1.8GHz
Vega 8
min: 19 fps, P0.1: 20.1 fps, P1: 26 fps, max: 44.4 fps
AMD Ryzen 9 5900HX 3.3GHz
Vega 8
min: 30.9 fps, P0.1: 31.2 fps, P1: 32.1 fps, max: 44.3 fps
AMD Ryzen 9 5900HX 3.3GHz
Vega 8
min: 25.6 fps, P0.1: 25.8 fps, P1: 27.2 fps, max: 32.4 fps

Days Gone
2021Intel Core i5-1135G7 2.4GHz
Iris Xe G7 80EUs
min: 5.57 fps, P0.1: 6.11 fps, P1: 10.9 fps, max: 59.9 fps
AMD Ryzen 7 5800U 1.9GHz
Vega 8
min: 14.7 fps, P0.1: 14.9 fps, P1: 21.8 fps, max: 167 fps
AMD Ryzen 7 5700U 1.8GHz
Vega 8
min: 15.9 fps, P0.1: 16.1 fps, P1: 21.2 fps, max: 86.2 fps
AMD Ryzen 9 5900HX 3.3GHz
Vega 8
min: 25.4 fps, P0.1: 27.1 fps, P1: 35.8 fps, max: 140 fps
Intel Core i5-1135G7 2.4GHz
Iris Xe G7 80EUs
min: 4.19 fps, P0.1: 6.61 fps, P1: 9.16 fps, max: 67.5 fps
AMD Ryzen 7 5700U 1.8GHz
Vega 8
min: 7.2 fps, P0.1: 9 fps, P1: 13.1 fps, max: 61.9 fps
AMD Ryzen 9 5900HX 3.3GHz
Vega 8
min: 13.8 fps, P0.1: 15.3 fps, P1: 19.6 fps, max: 72 fps
Intel Core i5-1135G7 2.4GHz
Iris Xe G7 80EUs
min: 4.61 fps, P0.1: 5.32 fps, P1: 9.98 fps, max: 54.1 fps
AMD Ryzen 7 5700U 1.8GHz
Vega 8
min: 8.98 fps, P0.1: 9.71 fps, P1: 12.5 fps, max: 32.9 fps
AMD Ryzen 9 5900HX 3.3GHz
Vega 8
min: 11.6 fps, P0.1: 11.8 fps, P1: 18.2 fps, max: 78.8 fps
Intel Core i5-1135G7 2.4GHz
Iris Xe G7 80EUs
min: 2.4 fps, P0.1: 4.18 fps, P1: 8.26 fps, max: 59.9 fps
AMD Ryzen 7 5700U 1.8GHz
Vega 8
min: 7.18 fps, P0.1: 7.86 fps, P1: 10.3 fps, max: 40.4 fps
AMD Ryzen 9 5900HX 3.3GHz
Vega 8
min: 8.92 fps, P0.1: 9.05 fps, P1: 14.3 fps, max: 76.6 fps

Intel Core i5-1135G7 2.4GHz
Iris Xe G7 80EUs
min: 18.1 fps, P0.1: 24 fps, P1: 31.8 fps, max: 115 fps
AMD Ryzen 9 5900HX 3.3GHz
Vega 8
min: 22.9 fps, P0.1: 25.4 fps, P1: 27 fps, max: 117 fps
AMD Ryzen 7 5700U 1.8GHz
Vega 8
min: 16.5 fps, P0.1: 18.2 fps, P1: 33.7 fps, max: 98.4 fps
AMD Ryzen 7 5800U 1.9GHz
Vega 8
min: 18.8 fps, P0.1: 20.1 fps, P1: 38.8 fps, max: 133 fps
Intel Core i5-1135G7 2.4GHz
Iris Xe G7 80EUs
min: 16.1 fps, P0.1: 19.2 fps, P1: 21.9 fps, max: 90.9 fps
AMD Ryzen 9 5900HX 3.3GHz
Vega 8
min: 17.3 fps, P0.1: 19 fps, P1: 24.9 fps, max: 45.6 fps
AMD Ryzen 7 5700U 1.8GHz
Vega 8
min: 14.3 fps, P0.1: 15.1 fps, P1: 22.3 fps, max: 57.8 fps
AMD Ryzen 7 5800U 1.9GHz
Vega 8
min: 17.6 fps, P0.1: 17.7 fps, P1: 23.6 fps, max: 57.3 fps

Intel Core i5-1135G7 2.4GHz
Iris Xe G7 80EUs
min: 6.7 fps, P0.1: 7.13 fps, P1: 11.8 fps, max: 51.8 fps
AMD Ryzen 7 5800U 1.9GHz
Vega 8
min: 20 fps, P0.1: 28.6 fps, P1: 42.7 fps, max: 61.4 fps
AMD Ryzen 9 5900HX 3.3GHz
Vega 8
min: 45.2 fps, P0.1: 45.3 fps, P1: 47.6 fps, max: 72.2 fps
Intel Core i5-1135G7 2.4GHz
Iris Xe G7 80EUs
min: 2.68 fps, P0.1: 9.47 fps, P1: 16.4 fps, max: 27.2 fps
AMD Ryzen 7 5800U 1.9GHz
Vega 8
min: 13.5 fps, P0.1: 15.2 fps, P1: 17.2 fps, max: 25.6 fps
AMD Ryzen 9 5900HX 3.3GHz
Vega 8
min: 22.9 fps, P0.1: 22.9 fps, P1: 23.3 fps, max: 34.1 fps
Intel Core i5-1135G7 2.4GHz
Iris Xe G7 80EUs
min: 15 fps, P0.1: 15 fps, P1: 15.5 fps, max: 26.2 fps
AMD Ryzen 7 5800U 1.9GHz
Vega 8
min: 15.5 fps, P0.1: 15.7 fps, P1: 16.5 fps, max: 22.9 fps
AMD Ryzen 9 5900HX 3.3GHz
Vega 8
min: 21.4 fps, P0.1: 21.5 fps, P1: 22.2 fps, max: 34.4 fps
AMD Ryzen 9 5900HX 3.3GHz
Vega 8
min: 19.8 fps, P0.1: 19.8 fps, P1: 20.2 fps, max: 30.7 fps

Outriders
2021Intel Core i5-1135G7 2.4GHz
Iris Xe G7 80EUs
min: 2.92 fps, P0.1: 3.49 fps, P1: 21.2 fps, max: 60 fps
AMD Ryzen 7 5800U 1.9GHz
Vega 8
min: 2.2 fps, P0.1: 2.82 fps, P1: 7.82 fps, max: 96.8 fps
AMD Ryzen 7 5700U 1.8GHz
Vega 8
min: 8.63 fps, P0.1: 14.2 fps, P1: 20.3 fps, max: 81.2 fps
AMD Ryzen 9 5900HX 3.3GHz
Vega 8
min: 23.4 fps, P0.1: 25.9 fps, P1: 36.2 fps, max: 113 fps
Intel Core i5-1135G7 2.4GHz
Iris Xe G7 80EUs
min: 13.2 fps, P0.1: 13.7 fps, P1: 16.1 fps, max: 50.7 fps
AMD Ryzen 7 5700U 1.8GHz
Vega 8
min: 13.6 fps, P0.1: 13.8 fps, P1: 15.3 fps, max: 59 fps
AMD Ryzen 7 5800U 1.9GHz
Vega 8
min: 11.7 fps, P0.1: 12 fps, P1: 14.9 fps, max: 121 fps
AMD Ryzen 9 5900HX 3.3GHz
Vega 8
min: 16 fps, P0.1: 16.8 fps, P1: 19.8 fps, max: 47.5 fps
Intel Core i5-1135G7 2.4GHz
Iris Xe G7 80EUs
min: 12.2 fps, P0.1: 12.4 fps, P1: 13.6 fps, max: 51.6 fps
AMD Ryzen 7 5800U 1.9GHz
Vega 8
min: 5.89 fps, P0.1: 6.84 fps, P1: 11.5 fps, max: 115 fps
AMD Ryzen 7 5700U 1.8GHz
Vega 8
min: 10.2 fps, P0.1: 10.6 fps, P1: 12.5 fps, max: 55.9 fps
AMD Ryzen 9 5900HX 3.3GHz
Vega 8
min: 17.7 fps, P0.1: 18.5 fps, P1: 20.6 fps, max: 40.8 fps
Intel Core i5-1135G7 2.4GHz
Iris Xe G7 80EUs
min: 6.63 fps, P0.1: 7.05 fps, P1: 11.8 fps, max: 46 fps
AMD Ryzen 7 5800U 1.9GHz
Vega 8
min: 5.87 fps, P0.1: 5.95 fps, P1: 7.2 fps, max: 65.7 fps
AMD Ryzen 7 5700U 1.8GHz
Vega 8
min: 7.15 fps, P0.1: 7.63 fps, P1: 9.54 fps, max: 36.1 fps
AMD Ryzen 9 5900HX 3.3GHz
Vega 8
min: 8.11 fps, P0.1: 10.4 fps, P1: 16.2 fps, max: 43.1 fps

Hitman 3
2021
Cyberpunk 2077 1.0
2020Intel Core i5-1135G7 2.4GHz
Iris Xe G7 80EUs
Problem during benchmarking occured: game wont start
Intel Core i5-1135G7 2.4GHz
Iris Xe G7 80EUs
min: 10.6 fps, P0.1: 15.2 fps, P1: 18.3 fps, max: 52.8 fps
AMD Ryzen 9 5900HX 3.3GHz
Vega 8
min: 17.2 fps, P0.1: 25.4 fps, P1: 28.4 fps, max: 70.7 fps
Intel Core i5-1135G7 2.4GHz
Iris Xe G7 80EUs
min: 7.32 fps, P0.1: 7.33 fps, P1: 8.06 fps, max: 18.6 fps
AMD Ryzen 9 5900HX 3.3GHz
Vega 8
min: 10.7 fps, P0.1: 11.4 fps, P1: 12.6 fps, max: 19.1 fps
AMD Ryzen 9 5900HX 3.3GHz
Vega 8
min: 8.37 fps, P0.1: 8.37 fps, P1: 8.9 fps, max: 14.1 fps

Intel Core i5-1135G7 2.4GHz
Iris Xe G7 80EUs
min: 18 fps, max: 53 fps

Yakuza Like a Dragon
2020Intel Core i5-1135G7 2.4GHz
Iris Xe G7 80EUs
min: 14.6 fps, P0.1: 15 fps, P1: 17.2 fps, max: 66.6 fps
AMD Ryzen 7 5700U 1.8GHz
Vega 8
min: 27 fps, P0.1: 29.8 fps, P1: 33.1 fps, max: 64 fps
AMD Ryzen 9 5900HX 3.3GHz
Vega 8
min: 39.5 fps, P0.1: 42 fps, P1: 44.2 fps, max: 106 fps
Intel Core i5-1135G7 2.4GHz
Iris Xe G7 80EUs
min: 5.16 fps, P0.1: 5.21 fps, P1: 9.28 fps, max: 40 fps
AMD Ryzen 7 5700U 1.8GHz
Vega 8
min: 9.31 fps, P0.1: 9.6 fps, P1: 10.4 fps, max: 14.8 fps
AMD Ryzen 9 5900HX 3.3GHz
Vega 8
min: 15.6 fps, P0.1: 15.6 fps, P1: 15.7 fps, max: 21.4 fps
Intel Core i5-1135G7 2.4GHz
Iris Xe G7 80EUs
min: 4.91 fps, P0.1: 4.91 fps, P1: 8.61 fps, max: 34.5 fps
AMD Ryzen 7 5700U 1.8GHz
Vega 8
min: 10.2 fps, P0.1: 10.3 fps, P1: 10.5 fps, max: 14 fps
AMD Ryzen 9 5900HX 3.3GHz
Vega 8
min: 14.4 fps, P0.1: 14.6 fps, P1: 15.1 fps, max: 20.6 fps
Intel Core i5-1135G7 2.4GHz
Iris Xe G7 80EUs
min: 4.01 fps, P0.1: 4.12 fps, P1: 7.36 fps, max: 33.6 fps
AMD Ryzen 7 5700U 1.8GHz
Vega 8
min: 7.35 fps, P0.1: 8.16 fps, P1: 9.79 fps, max: 13.5 fps
AMD Ryzen 9 5900HX 3.3GHz
Vega 8
min: 13.5 fps, P0.1: 13.6 fps, P1: 13.9 fps, max: 19 fps

AMD Ryzen 9 5900HX 3.3GHz
Vega 8
min: 25.7 fps, P0.1: 27.9 fps, P1: 43.4 fps, max: 154 fps
AMD Ryzen 9 5900HX 3.3GHz
Vega 8
min: 4.1 fps, P0.1: 4.14 fps, P1: 18.1 fps, max: 30.6 fps
AMD Ryzen 9 5900HX 3.3GHz
Vega 8
min: 3.9 fps, P0.1: 4.13 fps, P1: 12.6 fps, max: 26.7 fps
AMD Ryzen 9 5900HX 3.3GHz
Vega 8
min: 4.01 fps, P0.1: 4.1 fps, P1: 12.2 fps, max: 25 fps

AMD Ryzen 9 5900HX 3.3GHz
Vega 8
min: 25 fps, P0.1: 29 fps, P1: 36 fps, max: 139 fps
AMD Ryzen 9 5900HX 3.3GHz
Vega 8
min: 14 fps, P0.1: 15 fps, P1: 18 fps, max: 53 fps
AMD Ryzen 9 5900HX 3.3GHz
Vega 8
min: 9 fps, P0.1: 9 fps, P1: 15 fps, max: 33 fps
AMD Ryzen 9 5900HX 3.3GHz
Vega 8
min: 8 fps, P0.1: 8 fps, P1: 12 fps, max: 82 fps

Dirt 5
2020Intel Core i5-1135G7 2.4GHz
Iris Xe G7 80EUs
min: 9.6 fps, P0.1: 23.9 fps, P1: 26.7 fps, max: 39.5 fps
Intel Core i5-1135G7 2.4GHz
Iris Xe G7 80EUs
min: 23.8 fps, P0.1: 24.6 fps, P1: 29.8 fps, max: 43.5 fps
AMD Ryzen 7 5700U 1.8GHz
Vega 8
min: 23.1 fps, P0.1: 26.5 fps, P1: 29.1 fps, max: 55.4 fps
AMD Ryzen 9 5900HX 3.3GHz
Vega 8
min: 20 fps, P0.1: 26.5 fps, P1: 29.7 fps, max: 63 fps
AMD Ryzen 9 5900HX 3.3GHz
Vega 8
min: 33 fps, P0.1: 41.1 fps, P1: 50.9 fps, max: 71.7 fps
Intel Core i5-1135G7 2.4GHz
Iris Xe G7 80EUs
min: 9.2 fps, P0.1: 9.6 fps, P1: 10.5 fps, max: 18.3 fps
Intel Core i5-1135G7 2.4GHz
Iris Xe G7 80EUs
min: 9.3 fps, P0.1: 11.4 fps, P1: 12.5 fps, max: 20 fps
AMD Ryzen 7 5700U 1.8GHz
Vega 8
min: 13.9 fps, P0.1: 15.1 fps, P1: 16.6 fps, max: 24 fps
AMD Ryzen 9 5900HX 3.3GHz
Vega 8
min: 11.4 fps, P0.1: 14.7 fps, P1: 15 fps, max: 47.9 fps
AMD Ryzen 9 5900HX 3.3GHz
Vega 8
min: 14.8 fps, P0.1: 16.2 fps, P1: 20.8 fps, max: 29.3 fps
Intel Core i5-1135G7 2.4GHz
Iris Xe G7 80EUs
min: 7.4 fps, P0.1: 7.8 fps, P1: 8.2 fps, max: 16.7 fps
Intel Core i5-1135G7 2.4GHz
Iris Xe G7 80EUs
min: 9.8 fps, P0.1: 10.1 fps, P1: 10.5 fps, max: 16.3 fps
AMD Ryzen 7 5700U 1.8GHz
Vega 8
min: 11.9 fps, P0.1: 12.4 fps, P1: 13.3 fps, max: 17.9 fps
AMD Ryzen 9 5900HX 3.3GHz
Vega 8
min: 9.9 fps, P0.1: 11.9 fps, P1: 12 fps, max: 20.3 fps
AMD Ryzen 9 5900HX 3.3GHz
Vega 8
min: 13.3 fps, P0.1: 13.6 fps, P1: 16 fps, max: 22.4 fps
Intel Core i5-1135G7 2.4GHz
Iris Xe G7 80EUs
min: 6.2 fps, P0.1: 6.3 fps, P1: 6.8 fps, max: 10.2 fps
Intel Core i5-1135G7 2.4GHz
Iris Xe G7 80EUs
min: 7.7 fps, P0.1: 8.1 fps, P1: 8.5 fps, max: 13.2 fps
AMD Ryzen 7 5700U 1.8GHz
Vega 8
min: 8.6 fps, P0.1: 9.7 fps, P1: 10.4 fps, max: 14.1 fps
AMD Ryzen 9 5900HX 3.3GHz
Vega 8
min: 9.9 fps, P0.1: 10 fps, P1: 10 fps, max: 20.2 fps
AMD Ryzen 9 5900HX 3.3GHz
Vega 8
min: 12.2 fps, P0.1: 12.7 fps, P1: 13.2 fps, max: 17.7 fps
AMD Ryzen 9 5900HX 3.3GHz
Vega 8
min: 6.8 fps, P0.1: 7.3 fps, P1: 8.6 fps, max: 15.6 fps
AMD Ryzen 9 5900HX 3.3GHz
Vega 8
min: 8.7 fps, P0.1: 8.9 fps, P1: 10 fps, max: 13.1 fps

Watch Dogs Legion
2020Intel Core i5-1135G7 2.4GHz
Iris Xe G7 80EUs
min: 17.05 fps, P1: 20.77 fps, max: 35.7 fps
Intel Core i5-11300H 3.1GHz
Iris Xe G7 80EUs
min: 17.29 fps, P1: 22.57 fps, max: 39.2 fps
AMD Ryzen 7 5700U 1.8GHz
Vega 8
min: 20.67 fps, P1: 23.49 fps, max: 42.71 fps
AMD Ryzen 9 5900HX 3.3GHz
Vega 8
min: 29.53 fps, P1: 34.16 fps, max: 57.37 fps
Intel Core i5-1135G7 2.4GHz
Iris Xe G7 80EUs
min: 6.91 fps, P1: 11.84 fps, max: 31.68 fps
Intel Core i5-11300H 3.1GHz
Iris Xe G7 80EUs
min: 8.8 fps, P1: 12.66 fps, max: 21.3 fps
AMD Ryzen 7 5700U 1.8GHz
Vega 8
min: 12.66 fps, P1: 13.99 fps, max: 20.89 fps
AMD Ryzen 9 5900HX 3.3GHz
Vega 8
min: 14.91 fps, P1: 19.98 fps, max: 28.81 fps
Intel Core i5-1135G7 2.4GHz
Iris Xe G7 80EUs
min: 7.57 fps, P1: 10.14 fps, max: 29.07 fps
Intel Core i5-11300H 3.1GHz
Iris Xe G7 80EUs
min: 9.16 fps, P1: 10.75 fps, max: 19.28 fps
AMD Ryzen 7 5700U 1.8GHz
Vega 8
min: 8.84 fps, P1: 11.69 fps, max: 22.59 fps
AMD Ryzen 9 5900HX 3.3GHz
Vega 8
min: 13.98 fps, P1: 17.03 fps, max: 24.72 fps
AMD Ryzen 9 5900HX 3.3GHz
Vega 8
min: 9.05 fps, P1: 10.25 fps, max: 15.14 fps

FIFA 21
2020Intel Core i5-11300H 3.1GHz
Iris Xe G7 80EUs
min: 63.9 fps, P0.1: 67.9 fps, P1: 74.3 fps, max: 173 fps
Intel Core i5-11300H 3.1GHz
Iris Xe G7 80EUs
min: 40.3 fps, P0.1: 42.4 fps, P1: 45 fps, max: 118 fps
Intel Core i5-11300H 3.1GHz
Iris Xe G7 80EUs
min: 35.1 fps, P0.1: 36.4 fps, P1: 38.8 fps, max: 82 fps
Intel Core i5-11300H 3.1GHz
Iris Xe G7 80EUs
min: 27.3 fps, P0.1: 30.8 fps, P1: 33.5 fps, max: 58.2 fps

Star Wars Squadrons
2020Intel Core i5-1135G7 2.4GHz
Iris Xe G7 80EUs
min: 27.9 fps, P0.1: 34.4 fps, P1: 42.3 fps, max: 123 fps
Intel Core i5-1135G7 2.4GHz
Iris Xe G7 80EUs
min: 15.4 fps, P0.1: 28.4 fps, P1: 64 fps, max: 122 fps
AMD Ryzen 7 5700U 1.8GHz
Vega 8
min: 46.1 fps, P0.1: 48.8 fps, P1: 68 fps, max: 153 fps
AMD Ryzen 9 5900HX 3.3GHz
Vega 8
min: 67.2 fps, P0.1: 81 fps, P1: 93.9 fps, max: 200 fps
Intel Core i5-1135G7 2.4GHz
Iris Xe G7 80EUs
min: 10.1 fps, P0.1: 13.9 fps, P1: 16.6 fps, max: 82.2 fps
Intel Core i5-1135G7 2.4GHz
Iris Xe G7 80EUs
min: 10.4 fps, P0.1: 25.9 fps, P1: 29 fps, max: 86.5 fps
AMD Ryzen 7 5700U 1.8GHz
Vega 8
min: 10.6 fps, P0.1: 24.3 fps, P1: 27.8 fps, max: 51.5 fps
AMD Ryzen 9 5900HX 3.3GHz
Vega 8
min: 31.1 fps, P0.1: 32.9 fps, P1: 43.1 fps, max: 68.7 fps
Intel Core i5-1135G7 2.4GHz
Iris Xe G7 80EUs
min: 11.3 fps, P0.1: 11.8 fps, P1: 15.4 fps, max: 86.8 fps
Intel Core i5-1135G7 2.4GHz
Iris Xe G7 80EUs
min: 12.8 fps, P0.1: 19.6 fps, P1: 24.2 fps, max: 63.4 fps
AMD Ryzen 7 5700U 1.8GHz
Vega 8
min: 17.8 fps, P0.1: 19.4 fps, P1: 25.4 fps, max: 47 fps
AMD Ryzen 9 5900HX 3.3GHz
Vega 8
min: 27.1 fps, P0.1: 30.5 fps, P1: 37.8 fps, max: 58.9 fps
Intel Core i5-1135G7 2.4GHz
Iris Xe G7 80EUs
min: 18.4 fps, P0.1: 19.1 fps, P1: 22.3 fps, max: 39 fps
AMD Ryzen 7 5700U 1.8GHz
Vega 8
min: 18.7 fps, P0.1: 19.8 fps, P1: 23.2 fps, max: 43 fps
AMD Ryzen 9 5900HX 3.3GHz
Vega 8
min: 21.9 fps, P0.1: 27.4 fps, P1: 32.3 fps, max: 55.2 fps

Intel Core i5-11300H 3.1GHz
Iris Xe G7 80EUs
min: 16.3 fps, P0.1: 17.1 fps, P1: 18.5 fps, max: 53.5 fps
AMD Ryzen 9 5900HX 3.3GHz
Vega 8
min: 20.4 fps, P0.1: 23 fps, P1: 28.4 fps, max: 85.8 fps
Intel Core i5-11300H 3.1GHz
Iris Xe G7 80EUs
min: 6.51 fps, P0.1: 6.77 fps, P1: 7.15 fps, max: 44.3 fps
AMD Ryzen 9 5900HX 3.3GHz
Vega 8
min: 10.3 fps, P0.1: 10.8 fps, P1: 11.8 fps, max: 63.6 fps
AMD Ryzen 9 5900HX 3.3GHz
Vega 8
min: 10 fps, P0.1: 10.1 fps, P1: 10.6 fps, max: 69.1 fps

Serious Sam 4
2020Intel Core i5-1135G7 2.4GHz
Iris Xe G7 80EUs
min: 3.42 fps, P0.1: 7.97 fps, P1: 31.3 fps, max: 220 fps
AMD Ryzen 7 5700U 1.8GHz
Vega 8
min: 4.57 fps, P0.1: 11.3 fps, P1: 22.5 fps, max: 110 fps
AMD Ryzen 9 5900HX 3.3GHz
Vega 8
min: 5.78 fps, P0.1: 16.3 fps, P1: 38.9 fps, max: 196 fps
Intel Core i5-1135G7 2.4GHz
Iris Xe G7 80EUs
min: 1.665 fps, P0.1: 1.893 fps, P1: 2.92 fps, max: 60.8 fps
AMD Ryzen 7 5700U 1.8GHz
Vega 8
min: 2.28 fps, P0.1: 4.67 fps, P1: 8.89 fps, max: 72.4 fps
AMD Ryzen 9 5900HX 3.3GHz
Vega 8
min: 4.88 fps, P0.1: 7.7 fps, P1: 15 fps, max: 99 fps
Intel Core i5-1135G7 2.4GHz
Iris Xe G7 80EUs
min: 1.463 fps, P0.1: 1.612 fps, P1: 4.54 fps, max: 60.9 fps
AMD Ryzen 7 5700U 1.8GHz
Vega 8
min: 0.892 fps, P0.1: 0.975 fps, P1: 5.89 fps, max: 50.9 fps
AMD Ryzen 9 5900HX 3.3GHz
Vega 8
min: 4.07 fps, P0.1: 6.82 fps, P1: 10.2 fps, max: 81.4 fps
Intel Core i5-1135G7 2.4GHz
Iris Xe G7 80EUs
min: 0.965 fps, P0.1: 1.048 fps, P1: 1.885 fps, max: 43.1 fps
AMD Ryzen 7 5700U 1.8GHz
Vega 8
min: 0.802 fps, P0.1: 1.318 fps, P1: 4.1 fps, max: 44.4 fps
AMD Ryzen 9 5900HX 3.3GHz
Vega 8
min: 3.46 fps, P0.1: 4.04 fps, P1: 7.81 fps, max: 77.8 fps

Crysis Remastered
2020Intel Core i5-1135G7 2.4GHz
Iris Xe G7 80EUs
min: 15.9 fps, P0.1: 18.2 fps, P1: 21.8 fps, max: 88.9 fps
Intel Core i5-1135G7 2.4GHz
Iris Xe G7 80EUs
min: 23.5 fps, P0.1: 25.7 fps, P1: 34.6 fps, max: 113 fps
AMD Ryzen 9 5900HX 3.3GHz
Vega 8
min: 23 fps, P0.1: 24 fps, P1: 27.5 fps, max: 347 fps
Intel Core i5-1135G7 2.4GHz
Iris Xe G7 80EUs
min: 10.4 fps, P0.1: 11 fps, P1: 13 fps, max: 45.8 fps
Intel Core i5-1135G7 2.4GHz
Iris Xe G7 80EUs
min: 7.18 fps, P0.1: 8.45 fps, P1: 10.3 fps, max: 154 fps
AMD Ryzen 9 5900HX 3.3GHz
Vega 8
min: 5.17 fps, P0.1: 5.18 fps, P1: 5.5 fps, max: 222 fps
Intel Core i5-1135G7 2.4GHz
Iris Xe G7 80EUs
min: 3.93 fps, P0.1: 3.95 fps, P1: 4.18 fps, max: 33.3 fps
Intel Core i5-1135G7 2.4GHz
Iris Xe G7 80EUs
min: 2.28 fps, P0.1: 2.42 fps, P1: 3.43 fps, max: 60.4 fps

Intel Core i5-1135G7 2.4GHz
Iris Xe G7 80EUs
min: 16.2 fps, P0.1: 17 fps, P1: 17.6 fps, max: 22.9 fps
Intel Core i5-1135G7 2.4GHz
Iris Xe G7 80EUs
min: 8.25 fps, P0.1: 8.27 fps, P1: 8.67 fps, max: 10.6 fps

Horizon Zero Dawn
2020
Death Stranding
2020Intel Core i5-1135G7 2.4GHz
Iris Xe G7 80EUs
min: 27.6 fps, P0.1: 29 fps, P1: 32.2 fps, max: 73.8 fps
AMD Ryzen 7 5700U 1.8GHz
Vega 8
min: 23.8 fps, P0.1: 27 fps, P1: 29.4 fps, max: 54.6 fps
AMD Ryzen 9 5900HX 3.3GHz
Vega 8
min: 36.4 fps, P0.1: 36.8 fps, P1: 39.6 fps, max: 56.7 fps
Intel Core i5-1135G7 2.4GHz
Iris Xe G7 80EUs
min: 15.6 fps, P0.1: 16.4 fps, P1: 18 fps, max: 49.7 fps
AMD Ryzen 7 5700U 1.8GHz
Vega 8
min: 9.73 fps, P0.1: 11.2 fps, P1: 17.1 fps, max: 28.5 fps
AMD Ryzen 9 5900HX 3.3GHz
Vega 8
min: 14.9 fps, P0.1: 20.9 fps, P1: 23.6 fps, max: 34.8 fps
Intel Core i5-1135G7 2.4GHz
Iris Xe G7 80EUs
min: 14.7 fps, P0.1: 14.8 fps, P1: 16.3 fps, max: 35.7 fps
AMD Ryzen 7 5700U 1.8GHz
Vega 8
min: 15.3 fps, P0.1: 15.3 fps, P1: 15.7 fps, max: 22.5 fps
AMD Ryzen 9 5900HX 3.3GHz
Vega 8
min: 17.4 fps, P0.1: 20.4 fps, P1: 21.1 fps, max: 26.8 fps
Intel Core i5-1135G7 2.4GHz
Iris Xe G7 80EUs
min: 7.19 fps, P0.1: 7.77 fps, P1: 12.1 fps, max: 38.5 fps
AMD Ryzen 7 5700U 1.8GHz
Vega 8
min: 6.58 fps, P0.1: 8.37 fps, P1: 15.8 fps, max: 35.4 fps
AMD Ryzen 9 5900HX 3.3GHz
Vega 8
min: 19.3 fps, P0.1: 19.5 fps, P1: 21.5 fps, max: 28.5 fps

F1 2020
2020759689
Intel Core i5-1135G7 2.4GHz
Iris Xe G7 80EUs
min: 32 fps, max: 66 fps
759689
Intel Core i5-1135G7 2.4GHz
Iris Xe G7 80EUs
min: 5 fps, max: 77 fps
Intel Core i5-1135G7 2.4GHz
Iris Xe G7 80EUs
min: 52 fps, max: 70 fps
759689
Intel Core i5-1145G7 2.6GHz
Iris Xe G7 80EUs
min: 58 fps, max: 78 fps
759689
Intel Core i5-1245U 1.2GHz
Iris Xe G7 80EUs
min: 58 fps, max: 78 fps
728712
Intel Core i5-1135G7 2.4GHz
Iris Xe G7 80EUs
min: 65 fps, max: 89 fps
759689
AMD Ryzen 7 5800H @4.5GHz
Vega 8
min: 80 fps, max: 115 fps
759689
AMD Ryzen 7 PRO 5750G 3.8GHz
Vega 8
min: 98 fps, max: 134 fps
759689
Intel Core i5-1135G7 2.4GHz
Iris Xe G7 80EUs
min: 1 fps, max: 42 fps
759689
Intel Core i5-1135G7 2.4GHz
Iris Xe G7 80EUs
min: 24 fps, max: 33 fps
759689
Intel Core i5-1245U 1.2GHz
Iris Xe G7 80EUs
min: 26 fps, max: 37 fps
759689
Intel Core i5-1135G7 2.4GHz
Iris Xe G7 80EUs
min: 1 fps, max: 45 fps
759689
Intel Core i5-1135G7 2.4GHz
Iris Xe G7 80EUs
min: 1 fps, max: 45 fps
759689
Intel Core i5-1145G7 2.6GHz
Iris Xe G7 80EUs
min: 34 fps, max: 49 fps
759689
AMD Ryzen 7 5800H @4.5GHz
Vega 8
min: 37 fps, max: 53 fps
759689
AMD Ryzen 7 PRO 5750G 3.8GHz
Vega 8
min: 42 fps, max: 62 fps
759689
Intel Core i5-1245U 1.2GHz
Iris Xe G7 80EUs
min: 20 fps, max: 29 fps
728712
Intel Core i5-1135G7 2.4GHz
Iris Xe G7 80EUs
min: 4 fps, max: 32 fps
759689
Intel Core i5-1145G7 2.6GHz
Iris Xe G7 80EUs
min: 26 fps, max: 37 fps
759689
AMD Ryzen 7 5800H @4.5GHz
Vega 8
min: 27 fps, max: 40 fps
759689
AMD Ryzen 7 PRO 5750G 3.8GHz
Vega 8
min: 32 fps, max: 47 fps
759689
Intel Core i5-1245U 1.2GHz
Iris Xe G7 80EUs
min: 9 fps, max: 19 fps
728712
Intel Core i5-1135G7 2.4GHz
Iris Xe G7 80EUs
min: 2 fps, max: 23 fps
759689
AMD Ryzen 7 5800H @4.5GHz
Vega 8
min: 18 fps, max: 31 fps
759689
AMD Ryzen 7 PRO 5750G 3.8GHz
Vega 8
min: 20 fps, max: 35 fps

Gears Tactics
2020
Doom Eternal
2020Intel Core i5-11300H 3.1GHz
Iris Xe G7 80EUs
min: 0.591 fps, P0.1: 0.912 fps, P1: 2.94 fps, max: 47.7 fps
AMD Ryzen 7 5700U 1.8GHz
Vega 8
min: 22 fps, P0.1: 38.5 fps, P1: 44.5 fps, max: 92.6 fps
AMD Ryzen 9 5900HX 3.3GHz
Vega 8
min: 8.88 fps, P0.1: 36.5 fps, P1: 67.4 fps, max: 278 fps
Intel Core i5-11300H 3.1GHz
Iris Xe G7 80EUs
min: 1.337 fps, P0.1: 1.846 fps, P1: 14.6 fps, max: 21.9 fps
AMD Ryzen 7 5700U 1.8GHz
Vega 8
min: 21.6 fps, P0.1: 21.7 fps, P1: 22.2 fps, max: 33.1 fps
AMD Ryzen 9 5900HX 3.3GHz
Vega 8
min: 49.2 fps, P0.1: 49.2 fps, P1: 50.8 fps, max: 70.7 fps
Intel Core i5-11300H 3.1GHz
Iris Xe G7 80EUs
min: 2.05 fps, P0.1: 2.09 fps, P1: 13.7 fps, max: 20.1 fps
AMD Ryzen 7 5700U 1.8GHz
Vega 8
min: 16.3 fps, P0.1: 17.2 fps, P1: 18.8 fps, max: 26 fps
AMD Ryzen 9 5900HX 3.3GHz
Vega 8
min: 39.4 fps, P0.1: 42.7 fps, P1: 44.9 fps, max: 65.9 fps
AMD Ryzen 7 5700U 1.8GHz
Vega 8
min: 16.7 fps, P0.1: 16.7 fps, P1: 17.7 fps, max: 25.6 fps
AMD Ryzen 9 5900HX 3.3GHz
Vega 8
min: 38.8 fps, P0.1: 39.9 fps, P1: 41.4 fps, max: 66 fps

Hunt Showdown
2020Intel Core i5-1135G7 2.4GHz
Iris Xe G7 80EUs
min: 12.2 fps, P0.1: 17.6 fps, P1: 28 fps, max: 60.1 fps
Intel Core i5-11300H 3.1GHz
Iris Xe G7 80EUs
min: 23.4 fps, P0.1: 25.3 fps, P1: 29.9 fps, max: 59.2 fps
AMD Ryzen 9 5900HX 3.3GHz
Vega 8
min: 21.9 fps, P0.1: 37.1 fps, P1: 39.7 fps, max: 119 fps
Intel Core i5-1135G7 2.4GHz
Iris Xe G7 80EUs
min: 11.4 fps, P0.1: 12.1 fps, P1: 13.3 fps, max: 21.5 fps
Intel Core i5-11300H 3.1GHz
Iris Xe G7 80EUs
min: 9.58 fps, P0.1: 10 fps, P1: 12 fps, max: 29 fps
AMD Ryzen 9 5900HX 3.3GHz
Vega 8
min: 12.2 fps, P0.1: 12.5 fps, P1: 13.3 fps, max: 20.8 fps
Intel Core i5-1135G7 2.4GHz
Iris Xe G7 80EUs
min: 4.15 fps, P0.1: 5.6 fps, P1: 10.8 fps, max: 33.2 fps
Intel Core i5-11300H 3.1GHz
Iris Xe G7 80EUs
min: 5.75 fps, P0.1: 6.64 fps, P1: 10.3 fps, max: 21.8 fps
AMD Ryzen 9 5900HX 3.3GHz
Vega 8
min: 8.98 fps, P0.1: 9.54 fps, P1: 11.4 fps, max: 18.6 fps
AMD Ryzen 9 5900HX 3.3GHz
Vega 8
min: 4.11 fps, P0.1: 4.3 fps, P1: 5.89 fps, max: 49.4 fps

Fall Guys
2020Intel Core i5-1135G7 2.4GHz
Iris Xe G7 80EUs
Problem during benchmarking occured: game wont start

Intel Core i5-1135G7 2.4GHz
Iris Xe G7 80EUs
min: 37.8 fps, P1: 43.5 fps, max: 62.2 fps
AMD Ryzen 9 5900HX 3.3GHz
Vega 8
min: 37.8 fps, P1: 41.7 fps, max: 56.4 fps
Intel Core i5-1135G7 2.4GHz
Iris Xe G7 80EUs
min: 17.6 fps, P1: 18.2 fps, max: 31.1 fps
AMD Ryzen 9 5900HX 3.3GHz
Vega 8
min: 19.3 fps, P1: 20.4 fps, max: 27.5 fps
Intel Core i5-1135G7 2.4GHz
Iris Xe G7 80EUs
min: 8.99 fps, P1: 9.26 fps, max: 20.3 fps
AMD Ryzen 9 5900HX 3.3GHz
Vega 8
min: 11.6 fps, P1: 12.2 fps, max: 18.4 fps

AMD Ryzen 9 5900HX 3.3GHz
Vega 8
min: 22.9 fps, P0.1: 23.5 fps, P1: 26.5 fps, max: 44.8 fps
AMD Ryzen 9 5900HX 3.3GHz
Vega 8
min: 20.4 fps, P0.1: 20.5 fps, P1: 21.5 fps, max: 30 fps
AMD Ryzen 9 5900HX 3.3GHz
Vega 8
min: 12.7 fps, P0.1: 13.8 fps, P1: 17.5 fps, max: 29.6 fps

Borderlands 3
2019
Control
2019Intel Core i5-1135G7 2.4GHz
Iris Xe G7 80EUs
min: 30.8 fps, P0.1: 33.8 fps, P1: 36.5 fps, max: 125 fps
AMD Ryzen 9 5900HX 3.3GHz
Vega 8
min: 25.6 fps, P0.1: 32.1 fps, P1: 43.2 fps, max: 116 fps
Intel Core i5-1135G7 2.4GHz
Iris Xe G7 80EUs
min: 5.81 fps, P0.1: 5.92 fps, P1: 6.46 fps, max: 59.8 fps
AMD Ryzen 9 5900HX 3.3GHz
Vega 8
min: 14.1 fps, P0.1: 14.1 fps, P1: 14.5 fps, max: 20.3 fps
Intel Core i5-1135G7 2.4GHz
Iris Xe G7 80EUs
min: 3.86 fps, P0.1: 3.96 fps, P1: 4.69 fps, max: 77.5 fps
AMD Ryzen 9 5900HX 3.3GHz
Vega 8
min: 11.1 fps, P0.1: 11.1 fps, P1: 11.2 fps, max: 14.6 fps

F1 2019
2019
Intel Core i5-1135G7 2.4GHz
Iris Xe G7 80EUs
min: 34 fps, max: 63 fps
Intel Core i5-1135G7 2.4GHz
Iris Xe G7 80EUs
min: 14 fps, max: 25 fps

Anno 1800
2019AMD Ryzen 7 5700U 1.8GHz
Vega 8
min: 24.5 fps, P0.1: 26.5 fps, P1: 35.8 fps, max: 65.6 fps
AMD Ryzen 7 5700U 1.8GHz
Vega 8
min: 15 fps, P0.1: 15.1 fps, P1: 16.4 fps, max: 27.2 fps
AMD Ryzen 7 5700U 1.8GHz
Vega 8
min: 7.38 fps, P0.1: 7.63 fps, P1: 8.43 fps, max: 18.9 fps
AMD Ryzen 7 5700U 1.8GHz
Vega 8
min: 5.63 fps, P0.1: 5.66 fps, P1: 5.91 fps, max: 7.9 fps

The Division 2
2019
Far Cry New Dawn
2019Intel Core i5-1145G7 2.6GHz
Iris Xe G7 80EUs
min: 28 fps, max: 59 fps
Intel Core i5-1245U 1.2GHz
Iris Xe G7 80EUs
min: 34 fps, max: 63 fps
Intel Core i5-13500H 1.9GHz
Iris Xe G7 80EUs
min: 40 fps, max: 75 fps
Intel Core i5-1145G7 2.6GHz
Iris Xe G7 80EUs
min: 21 fps, max: 34 fps
Intel Core i5-1245U 1.2GHz
Iris Xe G7 80EUs
min: 20 fps, max: 33 fps
Intel Core i5-13500H 1.9GHz
Iris Xe G7 80EUs
min: 24 fps, max: 39 fps
Intel Core i5-1145G7 2.6GHz
Iris Xe G7 80EUs
min: 20 fps, max: 32 fps
Intel Core i5-1245U 1.2GHz
Iris Xe G7 80EUs
min: 19 fps, max: 31 fps
Intel Core i5-13500H 1.9GHz
Iris Xe G7 80EUs
min: 22 fps, max: 36 fps
Intel Core i5-13500H 1.9GHz
Iris Xe G7 80EUs
min: 19 fps, max: 34 fps

Metro Exodus
2019Intel Core i5-1245U 1.2GHz
Iris Xe G7 80EUs
min: 18.95 fps, max: 50.31 fps
Intel Core i5-1145G7 2.6GHz
Iris Xe G7 80EUs
min: 20.6 fps, max: 53.56 fps
Intel Core i5-13500H 1.9GHz
Iris Xe G7 80EUs
min: 22.59 fps, max: 61.75 fps
AMD Ryzen 7 PRO 5750G 3.8GHz
Vega 8
min: 29.67 fps, max: 71.65 fps
Intel Core i5-1135G7 2.4GHz
Iris Xe G7 80EUs
min: 7.6 fps, max: 21 fps
Intel Core i5-1245U 1.2GHz
Iris Xe G7 80EUs
min: 8.13 fps, max: 21.74 fps
Intel Core i5-1145G7 2.6GHz
Iris Xe G7 80EUs
min: 9.18 fps, max: 24.04 fps
Intel Core i5-13500H 1.9GHz
Iris Xe G7 80EUs
min: 9.55 fps, max: 28.87 fps
AMD Ryzen 7 PRO 5750G 3.8GHz
Vega 8
min: 10.49 fps, max: 30.74 fps
Intel Core i5-1135G7 2.4GHz
Iris Xe G7 80EUs
min: 5.4 fps, max: 18.1 fps
Intel Core i5-1245U 1.2GHz
Iris Xe G7 80EUs
min: 5.88 fps, max: 18.12 fps
Intel Core i5-13500H 1.9GHz
Iris Xe G7 80EUs
min: 7.24 fps, max: 21.83 fps
AMD Ryzen 7 PRO 5750G 3.8GHz
Vega 8
min: 8.03 fps, max: 22.8 fps
Intel Core i5-1135G7 2.4GHz
Iris Xe G7 80EUs
min: 4.9 fps, max: 13.6 fps
Intel Core i5-13500H 1.9GHz
Iris Xe G7 80EUs
min: 6.07 fps, max: 17.6 fps
AMD Ryzen 7 PRO 5750G 3.8GHz
Vega 8
min: 7.25 fps, max: 19.22 fps

Apex Legends
2019Intel Core i5-1135G7 2.4GHz
Iris Xe G7 80EUs
min: 44.2 fps, P0.1: 47.7 fps, P1: 52.7 fps, max: 157 fps
Intel Core i5-1135G7 2.4GHz
Iris Xe G7 80EUs
min: 20.8 fps, P0.1: 22.7 fps, P1: 28.2 fps, max: 57 fps
Intel Core i5-1135G7 2.4GHz
Iris Xe G7 80EUs
min: 19.6 fps, P0.1: 20.4 fps, P1: 22.5 fps, max: 43.9 fps
Intel Core i5-1135G7 2.4GHz
Iris Xe G7 80EUs
min: 16.8 fps, P0.1: 16.9 fps, P1: 19 fps, max: 48 fps

Battlefield V
2018Intel Core i5-1135G7 2.4GHz
Iris Xe G7 80EUs
min: 9.72 fps, P0.1: 11.4 fps, P1: 30.8 fps, max: 91.7 fps
AMD Ryzen 9 5900HX 3.3GHz
Vega 8
min: 22.6 fps, P0.1: 34 fps, P1: 39.6 fps, max: 268 fps
Intel Core i5-1135G7 2.4GHz
Iris Xe G7 80EUs
min: 9.8 fps, P0.1: 10.3 fps, P1: 17.7 fps, max: 62 fps
AMD Ryzen 9 5900HX 3.3GHz
Vega 8
min: 15.9 fps, P0.1: 23.1 fps, P1: 27.9 fps, max: 98.9 fps
Intel Core i5-1135G7 2.4GHz
Iris Xe G7 80EUs
min: 11.1 fps, P0.1: 11.5 fps, P1: 17.2 fps, max: 43.5 fps
AMD Ryzen 9 5900HX 3.3GHz
Vega 8
min: 18.9 fps, P0.1: 20.3 fps, P1: 24.6 fps, max: 59.8 fps
Intel Core i5-1135G7 2.4GHz
Iris Xe G7 80EUs
min: 10.6 fps, P0.1: 10.7 fps, P1: 17.1 fps, max: 41.9 fps
AMD Ryzen 9 5900HX 3.3GHz
Vega 8
min: 17.1 fps, P0.1: 17.3 fps, P1: 22.6 fps, max: 59.1 fps

Intel Core i5-1135G7 2.4GHz
Iris Xe G7 80EUs
min: 8 fps, max: 194 fps
Intel Core i5-1135G7 2.4GHz
Iris Xe G7 80EUs
min: 12 fps, max: 29 fps

Strange Brigade
20181.47.22.14 D3D12
Intel Core i7-1250U 0.8GHz
Iris Xe G7 80EUs
min: 5 fps, P1: 5.09 fps, max: 403 fps
1.47.22.14 D3D12
Intel Core i5-1135G7 2.4GHz
Iris Xe G7 80EUs
min: 8.5 fps, P1: 10.4 fps, max: 210 fps
1.47.22.14 D3D12
Intel Core i5-1135G7 2.4GHz
Iris Xe G7 80EUs
min: 8.2 fps, P1: 11.2 fps, max: 211 fps
1.47.22.14 D3D12
Intel Core i5-1135G7 2.4GHz
Iris Xe G7 80EUs
min: 8.1 fps, P1: 10.9 fps, max: 243 fps
1.47.22.14 D3D12
Intel Core i5-1135G7 2.4GHz
Iris Xe G7 80EUs
min: 9 fps, P1: 10.8 fps, max: 215 fps
1.47.22.14 D3D12
Intel Core i5-1135G7 2.4GHz
Iris Xe G7 80EUs
min: 8.3 fps, P1: 10.6 fps, max: 211 fps
1.47.22.14 D3D12
Intel Core i5-1135G7 2.4GHz
Iris Xe G7 80EUs
min: 8.9 fps, P1: 13 fps, max: 272 fps
1.47.22.14 D3D12
Intel Core i5-1135G7 2.4GHz
Iris Xe G7 80EUs
min: 8.7 fps, P1: 11.3 fps, max: 229 fps
1.47.22.14 D3D12
Intel Core i5-1230U 0.7GHz
Iris Xe G7 80EUs
min: 10.8 fps, P1: 14.4 fps, max: 278 fps
1.47.22.14 D3D12
Intel Core i5-1135G7 2.4GHz
Iris Xe G7 80EUs
min: 12.2 fps, P1: 14.5 fps, max: 212 fps
1.47.22.14 D3D12
Intel Core i5-1135G7 2.4GHz
Iris Xe G7 80EUs
min: 10.6 fps, P1: 14.2 fps, max: 253 fps
1.47.22.14 D3D12
Intel Core i5-1135G7 2.4GHz
Iris Xe G7 80EUs
min: 11.3 fps, P1: 14.4 fps, max: 247 fps
1.47.22.14 D3D12
Intel Core i5-1235U 0.9GHz
Iris Xe G7 80EUs
min: 5.3 fps, P1: 14.9 fps, max: 171.9 fps
1.47.22.14 D3D12
Intel Core i5-1135G7 2.4GHz
Iris Xe G7 80EUs
min: 11.7 fps, P1: 16.2 fps, max: 251 fps
1.47.22.14 D3D12
Intel Core i5-1240P 1.2GHz
Iris Xe G7 80EUs
min: 12.9 fps, P1: 16.1 fps, max: 268 fps
1.47.22.14 D3D12
Intel Core i5-1240P 1.2GHz
Iris Xe G7 80EUs
min: 12.1 fps, P1: 18 fps, max: 249 fps
1.47.22.14 D3D12
Intel Core i5-1130G7 1.8GHz
Iris Xe G7 80EUs
min: 5 fps, P1: 20 fps, max: 221 fps
1.47.22.14 D3D12
Intel Core i5-1240U 0.8GHz
Iris Xe G7 80EUs
min: 7.6 fps, P1: 18.1 fps, max: 253 fps
1.47.22.14 D3D12
Intel Core i5-1130G7 1.8GHz
Iris Xe G7 80EUs
min: 13.8 fps, P1: 18.3 fps, max: 293 fps
1.47.22.14 D3D12
Intel Core i5-1135G7 2.4GHz
Iris Xe G7 80EUs
min: 14.4 fps, P1: 19.4 fps, max: 253 fps
1.47.22.14 D3D12
Intel Core i5-1135G7 2.4GHz
Iris Xe G7 80EUs
min: 14.4 fps, P1: 21.1 fps, max: 265 fps
1.47.22.14 D3D12, Dual-Channel
Intel Core i5-1135G7 2.4GHz
Iris Xe G7 80EUs
min: 14.1 fps, P1: 19.4 fps, max: 264 fps
1.47.22.14 D3D12
Intel Core i5-1240P 1.2GHz
Iris Xe G7 80EUs
min: 14.1 fps, P1: 21.4 fps, max: 223 fps
1.47.22.14 D3D12
Intel Core i5-1135G7 2.4GHz
Iris Xe G7 80EUs
min: 14.1 fps, P1: 20.1 fps, max: 251 fps
1.47.22.14 D3D12
Intel Core i5-1135G7 2.4GHz
Iris Xe G7 80EUs
min: 14.7 fps, P1: 19.3 fps, max: 260 fps
1.47.22.14 D3D12
Intel Core i5-1135G7 2.4GHz
Iris Xe G7 80EUs
min: 14.9 fps, P1: 19.4 fps, max: 265 fps
1.47.22.14 D3D12
Intel Core i5-1135G7 2.4GHz
Iris Xe G7 80EUs
min: 13.1 fps, P1: 21 fps, max: 266 fps
1.47.22.14 D3D12
Intel Core i5-1235U 0.9GHz
Iris Xe G7 80EUs
min: 15.6 fps, P1: 25.1 fps, max: 223 fps
1.47.22.14 D3D12
Intel Core i5-1235U 0.9GHz
Iris Xe G7 80EUs
min: 14.2 fps, P1: 19.7 fps, max: 420 fps
1.47.22.14 D3D12
Intel Core i5-1245U 1.2GHz
Iris Xe G7 80EUs
min: 9.6 fps, P1: 21.1 fps, max: 422 fps
1.47.22.14 D3D12, Dual-Channel
Intel Core i5-1135G7 2.4GHz
Iris Xe G7 80EUs
min: 15.9 fps, P1: 21.4 fps, max: 233 fps
1.47.22.14 D3D12
Intel Core i5-1335U 0.9GHz
Iris Xe G7 80EUs
min: 15.4 fps, P1: 24.5 fps, max: 274 fps
1.47.22.14 D3D12
Intel Core i5-1240P 1.2GHz
Iris Xe G7 80EUs
min: 15.5 fps, P1: 23.7 fps, max: 289 fps
1.47.22.14 D3D12
Intel Core i5-1335U 0.9GHz
Iris Xe G7 80EUs
min: 15.7 fps, P1: 23.7 fps, max: 194.6 fps
1.47.22.14 D3D12
Intel Core i5-1145G7 2.6GHz
Iris Xe G7 80EUs
min: 14.6 fps, P1: 21.1 fps, max: 257 fps
1.47.22.14 D3D12
Intel Core i5-1135G7 2.4GHz
Iris Xe G7 80EUs
min: 15.7 fps, P1: 21.3 fps, max: 236 fps
1.47.22.14 D3D12
Intel Core i5-1240P 1.2GHz
Iris Xe G7 80EUs
min: 14.9 fps, P1: 22.7 fps, max: 349 fps
1.47.22.14 D3D12
Intel Core i5-1235U 0.9GHz
Iris Xe G7 80EUs
min: 15.5 fps, P1: 22.1 fps, max: 393 fps
1.47.22.14 D3D12
Intel Core i5-1240P 1.2GHz
Iris Xe G7 80EUs
min: 16.1 fps, P1: 22.7 fps, max: 330 fps
1.47.22.14 D3D12
Intel Core i5-1235U 0.9GHz
Iris Xe G7 80EUs
min: 10.2 fps, P1: 24.3 fps, max: 233 fps
1.47.22.14 D3D12
Intel Core i5-1235U 0.9GHz
Iris Xe G7 80EUs
min: 15.4 fps, P1: 21.3 fps, max: 414 fps
1.47.22.14 D3D12
Intel Core i5-1235U 0.9GHz
Iris Xe G7 80EUs
min: 15.7 fps, P1: 23 fps, max: 433 fps
1.47.22.14 D3D12
Intel Core i5-1335U 0.9GHz
Iris Xe G7 80EUs
min: 16.2 fps, P1: 22.7 fps, max: 285 fps
1.47.22.14 D3D12
Intel Core i5-1345U 1.2GHz
Iris Xe G7 80EUs
min: 15.9 fps, P1: 22.2 fps, max: 358 fps
1.47.22.14 D3D12
Intel Core i5-1240P 1.2GHz
Iris Xe G7 80EUs
min: 16 fps, P1: 24.4 fps, max: 295 fps
1.47.22.14 D3D12
Intel Core i5-1135G7 2.4GHz
Iris Xe G7 80EUs
min: 13.3 fps, P1: 22.4 fps, max: 290 fps
1.47.22.14 D3D12
Intel Core i5-1240P 1.2GHz
Iris Xe G7 80EUs
min: 16.5 fps, P1: 23.1 fps, max: 337 fps
1.47.22.14 D3D12, Hoch
Intel Core i5-1240P 1.2GHz
Iris Xe G7 80EUs
min: 14.9 fps, P1: 23.3 fps, max: 346 fps
1.47.22.14 D3D12
Intel Core i5-12500H 1.8GHz
Iris Xe G7 80EUs
min: 16.4 fps, P1: 22.9 fps, max: 347 fps
1.47.22.14 D3D12
Intel Core i5-1335U 0.9GHz
Iris Xe G7 80EUs
min: 16.6 fps, P1: 22.7 fps, max: 240 fps
1.47.22.14 D3D12
Intel Core i5-1135G7 2.4GHz
Iris Xe G7 80EUs
min: 17.3 fps, P1: 24.2 fps, max: 288 fps
1.47.22.14 D3D12
Intel Core i5-1135G7 2.4GHz
Iris Xe G7 80EUs
min: 16.7 fps, P1: 22.9 fps, max: 297 fps
1.47.22.14 D3D12
Intel Core i5-1340P 1.4GHz
Iris Xe G7 80EUs
min: 9.1 fps, P1: 23.2 fps, max: 305 fps
1.47.22.14 D3D12
Intel Core i5-1335U 0.9GHz
Iris Xe G7 80EUs
min: 17.5 fps, P1: 26.6 fps, max: 286 fps
1.47.22.14 D3D12
Intel Core i5-1135G7 2.4GHz
Iris Xe G7 80EUs
min: 17.1 fps, P1: 23 fps, max: 360 fps
1.47.22.14 D3D12
Intel Core i5-1135G7 2.4GHz
Iris Xe G7 80EUs
min: 17.6 fps, P1: 27.6 fps, max: 393 fps
1.47.22.14 D3D12
Intel Core i5-1155G7 2.5GHz
Iris Xe G7 80EUs
min: 17.8 fps, P1: 24.1 fps, max: 279 fps
1.47.22.14 D3D12
Intel Core i5-1240P 1.2GHz
Iris Xe G7 80EUs
min: 12.7 fps, P1: 25.7 fps, max: 343 fps
1.47.22.14 D3D12
Intel Core i5-1135G7 2.4GHz
Iris Xe G7 80EUs
min: 15.9 fps, P1: 26.3 fps, max: 382 fps
1.47.22.14 D3D12
Intel Core i5-1335U 0.9GHz
Iris Xe G7 80EUs
min: 18.3 fps, P1: 26.9 fps, max: 208 fps
1.47.22.14 D3D12
Intel Core i5-1345U 1.2GHz
Iris Xe G7 80EUs
min: 10.9 fps, P1: 23.7 fps, max: 373 fps
1.47.22.14 D3D12
Intel Core i5-1135G7 2.4GHz
Iris Xe G7 80EUs
min: 18.5 fps, P1: 25.2 fps, max: 282 fps
1.47.22.14 D3D12
Intel Core i5-1345U 1.2GHz
Iris Xe G7 80EUs
min: 17.8 fps, P1: 25.1 fps, max: 356 fps
1.47.22.14 D3D12
Intel Core i5-1334U 0.9GHz
Iris Xe G7 80EUs
min: 16.2 fps, P1: 25.5 fps, max: 435 fps
1.47.22.14 D3D12
Intel Core i5-1135G7 2.4GHz
Iris Xe G7 80EUs
min: 18.3 fps, P1: 29.9 fps, max: 368 fps
1.47.22.14 D3D12
Intel Core i5-1335U 0.9GHz
Iris Xe G7 80EUs
min: 17.7 fps, P1: 27.1 fps, max: 290 fps
1.47.22.14 D3D12
Intel Core i5-11300H 3.1GHz
Iris Xe G7 80EUs
min: 18.4 fps, P1: 27.8 fps, max: 329 fps
1.47.22.14 D3D12
Intel Core i5-1135G7 2.4GHz
Iris Xe G7 80EUs
min: 18.5 fps, P1: 27.2 fps, max: 319 fps
1.47.22.14 D3D12
Intel Core i5-1340P 1.4GHz
Iris Xe G7 80EUs
min: 18.2 fps, P1: 27.6 fps, max: 428 fps
1.47.22.14 D3D12
Intel Core i5-1135G7 2.4GHz
Iris Xe G7 80EUs
min: 18.2 fps, P1: 26.4 fps, max: 281 fps
1.47.22.14 D3D12
Intel Core i5-1135G7 2.4GHz
Iris Xe G7 80EUs
min: 18.4 fps, P1: 29.4 fps, max: 343 fps
1.47.22.14 D3D12
Intel Core i5-1335U 0.9GHz
Iris Xe G7 80EUs
min: 16.6 fps, P1: 25.5 fps, max: 387 fps
1.47.22.14 D3D12
Intel Core 5 120U 0.9GHz
Iris Xe G7 80EUs
min: 19.2 fps, P1: 27.3 fps, max: 374 fps
1.47.22.14 D3D12
Intel Core i5-1145G7 2.6GHz
Iris Xe G7 80EUs
min: 18.6 fps, P1: 27.1 fps, max: 320 fps
1.47.22.14 D3D12
Intel Core i5-1155G7 2.5GHz
Iris Xe G7 80EUs
min: 19.1 fps, P1: 28.1 fps, max: 424 fps
1.47.22.14 D3D12
Intel Core i5-1350P 1.4GHz
Iris Xe G7 80EUs
min: 15.1 fps, P1: 23.6 fps, max: 368 fps
1.47.22.14 D3D12
Intel Core i5-1135G7 2.4GHz
Iris Xe G7 80EUs
min: 17.3 fps, P1: 33.8 fps, max: 339 fps
1.47.22.14 D3D12
Intel Core i5-1135G7 2.4GHz
Iris Xe G7 80EUs
min: 16.1 fps, P1: 28.6 fps, max: 345 fps
1.47.22.14 D3D12
Intel Core i5-13500H 1.9GHz
Iris Xe G7 80EUs
min: 21.2 fps, P1: 36.7 fps, max: 442 fps
1.47.22.14 D3D12
AMD Ryzen 7 5700U 1.8GHz
Vega 8
min: 29.7 fps, P1: 37.5 fps, max: 83.4 fps
1.47.22.14 D3D12
AMD Ryzen 7 PRO 7730U 2GHz
Vega 8
min: 19 fps, P1: 36.4 fps, max: 162.8 fps
1.47.22.14 D3D12
AMD Ryzen 7 5700U 1.8GHz
Vega 8
min: 32.2 fps, P1: 38.7 fps, max: 80.6 fps
1.47.22.14 D3D12
AMD Ryzen 7 PRO 5850U 1.9GHz
Vega 8
min: 25.7 fps, P1: 38.3 fps, max: 155 fps
1.47.22.14 D3D12
AMD Ryzen 7 5825U 2GHz
Vega 8
min: 12.3 fps, P1: 40.8 fps, max: 215 fps
1.47.22.14 D3D12
AMD Ryzen 7 5800U 1.9GHz
Vega 8
min: 36.1 fps, P1: 41.3 fps, max: 80.1 fps
1.47.22.14 D3D12
AMD Ryzen 7 5700U 1.8GHz
Vega 8
min: 35 fps, P1: 40.2 fps, max: 66.5 fps
1.47.22.14 D3D12, Akkusparmodus
AMD Ryzen 9 5900HX @2GHz
Vega 8
min: 52.5 fps, P1: 63 fps, max: 94.8 fps
1.47.22.14 D3D12
AMD Ryzen 7 5700U 1.8GHz
Vega 8
min: 43 fps, P1: 47.8 fps, max: 131 fps
1.47.22.14 D3D12
AMD Ryzen 9 4900H 3.3GHz
Vega 8
min: 43.7 fps, P1: 64.9 fps, max: 141 fps
1.47.22.14 D3D12, Leistungsmodus
AMD Ryzen 7 5700U 1.8GHz
Vega 8
min: 40.7 fps, P1: 49.1 fps, max: 153 fps
1.47.22.14 D3D12, Leistungsmodus
AMD Ryzen 7 5700U 1.8GHz
Vega 8
min: 43.7 fps, P1: 50.8 fps, max: 131 fps
1.47.22.14 D3D12
AMD Ryzen 7 5700U 1.8GHz
Vega 8
min: 52.5 fps, P1: 62.9 fps, max: 127 fps
1.47.22.14 D3D12
AMD Ryzen 7 5825U 2GHz
Vega 8
min: 8.8 fps, P1: 56.8 fps, max: 149.7 fps
1.47.22.14 D3D12
AMD Ryzen 7 7730U 2GHz
Vega 8
min: 19.3 fps, P1: 63.7 fps, max: 99.2 fps
1.47.22.14 D3D12
AMD Ryzen 7 7730U 2GHz
Vega 8
min: 34.3 fps, P1: 64.6 fps, max: 168.4 fps
1.47.22.14 D3D12
AMD Ryzen 7 5700U 1.8GHz
Vega 8
min: 49.4 fps, P1: 59.8 fps, max: 103 fps
1.47.22.14 D3D12
AMD Ryzen 7 5700U 1.8GHz
Vega 8
min: 56.1 fps, P1: 65.2 fps, max: 118.3 fps
1.47.22.14 D3D12
AMD Ryzen 7 5700U 1.8GHz
Vega 8
min: 43.7 fps, P1: 66.2 fps, max: 142 fps
1.47.22.14 D3D12, Flüstermodus
AMD Ryzen 7 5700U 1.8GHz
Vega 8
min: 55.4 fps, P1: 64.3 fps, max: 113.2 fps
1.47.22.14 D3D12
AMD Ryzen 7 5700U 1.8GHz
Vega 8
min: 38.8 fps, P1: 66.3 fps, max: 137.1 fps
1.47.22.14 D3D12
AMD Ryzen 7 5700U 1.8GHz
Vega 8
min: 51.4 fps, P1: 67.6 fps, max: 114.1 fps
1.47.22.14 D3D12
AMD Ryzen 7 5800U 1.9GHz
Vega 8
min: 48.5 fps, P1: 67 fps, max: 140 fps
1.47.22.14 D3D12
AMD Ryzen 7 5825U 2GHz
Vega 8
min: 21.2 fps, P1: 62.9 fps, max: 211 fps
1.47.22.14 D3D12
AMD Ryzen 7 4800U 1.8GHz
Vega 8
min: 53.1 fps, P1: 68.2 fps, max: 113 fps
1.47.22.14 D3D12
AMD Ryzen 7 4800U 1.8GHz
Vega 8
min: 49.2 fps, P1: 68.9 fps, max: 151 fps
1.47.22.14 D3D12
AMD Ryzen 7 5700U 1.8GHz
Vega 8
min: 20.7 fps, P1: 69.9 fps, max: 148.1 fps
1.47.22.14 D3D12
AMD Ryzen 7 5700G 3.8GHz
Vega 8
min: 46 fps, P1: 70 fps, max: 176.1 fps
1.47.22.14 D3D12
AMD Ryzen 7 4800U 1.8GHz
Vega 8
min: 43.8 fps, P1: 72.3 fps, max: 142 fps
1.47.22.14 D3D12, Dual-Channel-Mode
AMD Ryzen 7 PRO 7730U 2GHz
Vega 8
min: 15.1 fps, P1: 71.6 fps, max: 276 fps
1.47.22.14 D3D12
AMD Ryzen 7 5800H 3.2GHz
Vega 8
min: 54.2 fps, P1: 74.5 fps, max: 165.6 fps
1.47.22.14 D3D12
AMD Ryzen 7 5700U 1.8GHz
Vega 8
min: 57.7 fps, P1: 72.2 fps, max: 152 fps
1.47.22.14 D3D12
AMD Ryzen 7 7730U 2GHz
Vega 8
min: 40.5 fps, P1: 74.7 fps, max: 143 fps
1.47.22.14 D3D12
AMD Ryzen 7 7730U 2GHz
Vega 8
min: 55.5 fps, P1: 75.5 fps, max: 162.5 fps
1.47.22.14 D3D12
AMD Ryzen 7 7730U 2GHz
Vega 8
min: 15.8 fps, P1: 75 fps, max: 240 fps
1.47.22.14 D3D12, Hoechstleistung
AMD Ryzen 9 5900HX 3.3GHz
Vega 8
min: 63.9 fps, P1: 76.7 fps, max: 116 fps
1.47.22.14 D3D12
AMD Ryzen 9 5900HX 3.3GHz
Vega 8
min: 45 fps, P1: 75.6 fps, max: 140 fps
1.47.22.14 D3D12
AMD Ryzen 9 5900HX 3.3GHz
Vega 8
min: 67.5 fps, P1: 76.2 fps, max: 123 fps
1.47.22.14 D3D12
AMD Ryzen 7 5800H @4.5GHz
Vega 8
min: 69.6 fps, P1: 78.2 fps, max: 118.1 fps
1.47.22.14 D3D12
AMD Ryzen 7 PRO 5850U 1.9GHz
Vega 8
min: 63.3 fps, P1: 76.8 fps, max: 128 fps
1.47.22.14 D3D12
AMD Ryzen 7 7730U 2GHz
Vega 8
min: 62.5 fps, P1: 76.7 fps, max: 134.4 fps
1.47.22.14 D3D12
AMD Ryzen 7 PRO 5850U 1.9GHz
Vega 8
min: 29.4 fps, P1: 77 fps, max: 128 fps
1.47.22.14 D3D12
AMD Ryzen 7 PRO 5750G 3.8GHz
Vega 8
min: 77.9 fps, P1: 80.7 fps, max: 121.1 fps
1.47.22.14 D3D12
AMD Ryzen 9 5900HX 3.3GHz
Vega 8
min: 28 fps, P1: 76.9 fps, max: 249 fps
1.47.22.14 D3D12
AMD Ryzen 9 5900HX 3.3GHz
Vega 8
min: 72.8 fps, P1: 85.4 fps, max: 154 fps
1.47.22.14 D3D12
AMD Ryzen 9 5900HX 3.3GHz
Vega 8
min: 79.6 fps, P1: 85.5 fps, max: 128 fps
1.47.22.14 D3D12
AMD Ryzen 7 5800H 3.2GHz
Vega 8
min: 66.3 fps, P1: 84.2 fps, max: 135.8 fps
1.47.22.14 D3D12
Intel Core i5-1230U 0.7GHz
Iris Xe G7 80EUs
min: 5 fps, P1: 5 fps, max: 98.8 fps
1.47.22.14 D3D12
Intel Core i7-1250U 0.8GHz
Iris Xe G7 80EUs
min: 5 fps, P1: 5 fps, max: 237 fps
1.47.22.14 D3D12
Intel Core i5-1135G7 2.4GHz
Iris Xe G7 80EUs
min: 5 fps, P1: 5.45 fps, max: 176 fps
1.47.22.14 D3D12
Intel Core i5-1135G7 2.4GHz
Iris Xe G7 80EUs
min: 5 fps, P1: 5.18 fps, max: 189 fps
1.47.22.14 D3D12
Intel Core i5-1135G7 2.4GHz
Iris Xe G7 80EUs
min: 5 fps, P1: 5.89 fps, max: 196.4 fps
1.47.22.14 D3D12
Intel Core i5-1135G7 2.4GHz
Iris Xe G7 80EUs
min: 5 fps, P1: 5.89 fps, max: 180 fps
1.47.22.14 D3D12
Intel Core i5-1135G7 2.4GHz
Iris Xe G7 80EUs
min: 5 fps, P1: 5.88 fps, max: 205 fps
1.47.22.14 D3D12
Intel Core i5-1135G7 2.4GHz
Iris Xe G7 80EUs
min: 5 fps, P1: 5 fps, max: 211 fps
1.47.22.14 D3D12
Intel Core i5-1135G7 2.4GHz
Iris Xe G7 80EUs
min: 5 fps, P1: 5.49 fps, max: 201 fps
1.47.22.14 D3D12
Intel Core i5-1135G7 2.4GHz
Iris Xe G7 80EUs
min: 5 fps, P1: 7.02 fps, max: 243 fps
1.47.22.14 D3D12
Intel Core i5-1135G7 2.4GHz
Iris Xe G7 80EUs
min: 5.5 fps, P1: 7.36 fps, max: 184 fps
1.47.22.14 D3D12
Intel Core i5-1135G7 2.4GHz
Iris Xe G7 80EUs
min: 5.9 fps, P1: 7.09 fps, max: 206 fps
1.47.22.14 D3D12
Intel Core i5-1135G7 2.4GHz
Iris Xe G7 80EUs
min: 5.9 fps, P1: 8.09 fps, max: 201 fps
1.47.22.14 D3D12
Intel Core i5-1130G7 1.8GHz
Iris Xe G7 80EUs
min: 6.3 fps, P1: 8.85 fps, max: 142 fps
1.47.22.14 D3D12
Intel Core i5-1240P 1.2GHz
Iris Xe G7 80EUs
min: 10 fps, P1: 11.8 fps, max: 119.3 fps
1.47.22.14 D3D12
Intel Core i5-1235U 0.9GHz
Iris Xe G7 80EUs
min: 5.4 fps, P1: 8.81 fps, max: 105.1 fps
1.47.22.14 D3D12
Intel Core i5-1240P 1.2GHz
Iris Xe G7 80EUs
min: 9.6 fps, P1: 12.5 fps, max: 131 fps
1.47.22.14 D3D12
Intel Core i5-1240P 1.2GHz
Iris Xe G7 80EUs
min: 9.1 fps, P1: 12.7 fps, max: 132.5 fps
1.47.22.14 D3D12
Intel Core i5-1135G7 2.4GHz
Iris Xe G7 80EUs
min: 6.5 fps, P1: 9.28 fps, max: 221 fps
1.47.22.14 D3D12
Intel Core i5-1135G7 2.4GHz
Iris Xe G7 80EUs
min: 7.6 fps, P1: 9.91 fps, max: 214 fps
1.47.22.14 D3D12
Intel Core i5-1135G7 2.4GHz
Iris Xe G7 80EUs
min: 5.5 fps, P1: 6.32 fps, max: 231 fps
1.47.22.14 D3D12
Intel Core i5-1135G7 2.4GHz
Iris Xe G7 80EUs
min: 8 fps, P1: 10.2 fps, max: 207 fps
1.47.22.14 D3D12
Intel Core i5-1240P 1.2GHz
Iris Xe G7 80EUs
min: 11.5 fps, P1: 14.1 fps, max: 140.2 fps
1.47.22.14 D3D12
Intel Core i5-1135G7 2.4GHz
Iris Xe G7 80EUs
min: 6.4 fps, P1: 10.2 fps, max: 207 fps
1.47.22.14 D3D12, Dual-Channel
Intel Core i5-1135G7 2.4GHz
Iris Xe G7 80EUs
min: 6.3 fps, P1: 9.66 fps, max: 200 fps
1.47.22.14 D3D12
Intel Core i5-1135G7 2.4GHz
Iris Xe G7 80EUs
min: 7.8 fps, P1: 11.1 fps, max: 200 fps
1.47.22.14 D3D12
Intel Core i5-1240P 1.2GHz
Iris Xe G7 80EUs
min: 6.8 fps, P1: 14.8 fps, max: 122.7 fps
1.47.22.14 D3D12
Intel Core i5-1135G7 2.4GHz
Iris Xe G7 80EUs
min: 6.7 fps, P1: 10.3 fps, max: 216 fps
1.47.22.14 D3D12
Intel Core i5-1235U 0.9GHz
Iris Xe G7 80EUs
min: 7 fps, P1: 12.6 fps, max: 227 fps
1.47.22.14 D3D12, Dual-Channel
Intel Core i5-1135G7 2.4GHz
Iris Xe G7 80EUs
min: 8.2 fps, P1: 12 fps, max: 201 fps
1.47.22.14 D3D12
Intel Core i5-1130G7 1.8GHz
Iris Xe G7 80EUs
min: 7.1 fps, P1: 13.5 fps, max: 215 fps
1.47.22.14 D3D12
Intel Core i5-1335U 0.9GHz
Iris Xe G7 80EUs
min: 7.9 fps, P1: 12.3 fps, max: 245 fps
1.47.22.14 D3D12
Intel Core i5-1240U 0.8GHz
Iris Xe G7 80EUs
min: 8.8 fps, P1: 14.7 fps, max: 206 fps
1.47.22.14 D3D12
Intel Core i5-1240P 1.2GHz
Iris Xe G7 80EUs
min: 11.5 fps, P1: 15.8 fps, max: 117.9 fps
1.47.22.14 D3D12
Intel Core i5-1345U 1.2GHz
Iris Xe G7 80EUs
min: 8.1 fps, P1: 12.9 fps, max: 213 fps
1.47.22.14 D3D12
Intel Core i5-1235U 0.9GHz
Iris Xe G7 80EUs
min: 9.1 fps, P1: 11.1 fps, max: 130.1 fps
1.47.22.14 D3D12
Intel Core i5-1135G7 2.4GHz
Iris Xe G7 80EUs
min: 6.5 fps, P1: 8.29 fps, max: 220 fps
1.47.22.14 D3D12
Intel Core i5-1335U 0.9GHz
Iris Xe G7 80EUs
min: 10.3 fps, P1: 15 fps, max: 173.4 fps
1.47.22.14 D3D12
Intel Core i5-1335U 0.9GHz
Iris Xe G7 80EUs
min: 9.9 fps, P1: 14.9 fps, max: 124.9 fps
1.47.22.14 D3D12
Intel Core i5-1245U 1.2GHz
Iris Xe G7 80EUs
min: 9.5 fps, P1: 16 fps, max: 238 fps
1.47.22.14 D3D12
Intel Core i5-1335U 0.9GHz
Iris Xe G7 80EUs
min: 7.6 fps, P1: 12.5 fps, max: 206 fps
1.47.22.14 D3D12
Intel Core i5-1235U 0.9GHz
Iris Xe G7 80EUs
min: 13.7 fps, P1: 17.1 fps, max: 201 fps
1.47.22.14 D3D12
Intel Core i5-1135G7 2.4GHz
Iris Xe G7 80EUs
min: 10.6 fps, P1: 16.5 fps, max: 153 fps
1.47.22.14 D3D12
Intel Core i5-1145G7 2.6GHz
Iris Xe G7 80EUs
min: 9.9 fps, P1: 16.7 fps, max: 166 fps
1.47.22.14 D3D12
Intel Core i5-1240P 1.2GHz
Iris Xe G7 80EUs
min: 10.4 fps, P1: 16.6 fps, max: 161 fps
1.47.22.14 D3D12
Intel Core i5-1235U 0.9GHz
Iris Xe G7 80EUs
min: 10 fps, P1: 16.9 fps, max: 145.7 fps
1.47.22.14 D3D12
Intel Core i5-1135G7 2.4GHz
Iris Xe G7 80EUs
min: 9.7 fps, P1: 16.6 fps, max: 202 fps
1.47.22.14 D3D12
Intel Core i5-1235U 0.9GHz
Iris Xe G7 80EUs
min: 14.2 fps, P1: 17 fps, max: 204 fps
1.47.22.14 D3D12
Intel Core i5-1240P 1.2GHz
Iris Xe G7 80EUs
min: 7.3 fps, P1: 12 fps, max: 200 fps
1.47.22.14 D3D12
Intel Core i5-1135G7 2.4GHz
Iris Xe G7 80EUs
min: 10.6 fps, P1: 17.9 fps, max: 172 fps
1.47.22.14 D3D12, Hoch
Intel Core i5-1240P 1.2GHz
Iris Xe G7 80EUs
min: 11.9 fps, P1: 17.7 fps, max: 176.8 fps
1.47.22.14 D3D12
Intel Core i5-1240P 1.2GHz
Iris Xe G7 80EUs
min: 11.6 fps, P1: 17.4 fps, max: 163.6 fps
1.47.22.14 D3D12
Intel Core i5-1340P 1.4GHz
Iris Xe G7 80EUs
min: 9.2 fps, P1: 15.6 fps, max: 239 fps
1.47.22.14 D3D12
Intel Core i5-1335U 0.9GHz
Iris Xe G7 80EUs
min: 8.1 fps, P1: 17.8 fps, max: 149.7 fps
1.47.22.14 D3D12
Intel Core i5-1135G7 2.4GHz
Iris Xe G7 80EUs
min: 7.8 fps, P1: 8.65 fps, max: 349 fps
1.47.22.14 D3D12
Intel Core i5-1235U 0.9GHz
Iris Xe G7 80EUs
min: 11.1 fps, P1: 18.2 fps, max: 147.1 fps
1.47.22.14 D3D12
Intel Core i5-1345U 1.2GHz
Iris Xe G7 80EUs
min: 7.9 fps, P1: 17.6 fps, max: 155.3 fps
1.47.22.14 D3D12
Intel Core i5-12500H 1.8GHz
Iris Xe G7 80EUs
min: 17.7 fps, P1: 19.3 fps, max: 178.9 fps
1.47.22.14 D3D12
Intel Core i5-1135G7 2.4GHz
Iris Xe G7 80EUs
min: 8.1 fps, P1: 11.5 fps, max: 197.5 fps
1.47.22.14 D3D12
Intel Core i5-1334U 0.9GHz
Iris Xe G7 80EUs
min: 9.7 fps, P1: 13.4 fps, max: 287 fps
1.47.22.14 D3D12
Intel Core i5-1335U 0.9GHz
Iris Xe G7 80EUs
min: 10.8 fps, P1: 18.4 fps, max: 177.8 fps
1.47.22.14 D3D12
Intel Core i5-1345U 1.2GHz
Iris Xe G7 80EUs
min: 11.5 fps, P1: 18.6 fps, max: 210 fps
1.47.22.14 D3D12
Intel Core i5-1340P 1.4GHz
Iris Xe G7 80EUs
min: 12 fps, P1: 19.5 fps, max: 225 fps
1.47.22.14 D3D12
Intel Core i5-1135G7 2.4GHz
Iris Xe G7 80EUs
min: 12.3 fps, P1: 18.8 fps, max: 182 fps
1.47.22.14 D3D12
Intel Core i5-11300H 3.1GHz
Iris Xe G7 80EUs
min: 12.2 fps, P1: 19.7 fps, max: 203 fps
1.47.22.14 D3D12
Intel Core i5-1335U 0.9GHz
Iris Xe G7 80EUs
min: 12 fps, P1: 19.9 fps, max: 190.6 fps
1.47.22.14 D3D12
Intel Core i5-1135G7 2.4GHz
Iris Xe G7 80EUs
min: 11.9 fps, P1: 20.2 fps, max: 165.5 fps
1.47.22.14 D3D12
Intel Core i5-1335U 0.9GHz
Iris Xe G7 80EUs
min: 11.7 fps, P1: 19.7 fps, max: 151.5 fps
1.47.22.14 D3D12
Intel Core i5-1135G7 2.4GHz
Iris Xe G7 80EUs
min: 9.2 fps, P1: 17.4 fps, max: 223 fps
1.47.22.14 D3D12
Intel Core i5-1155G7 2.5GHz
Iris Xe G7 80EUs
min: 10.1 fps, P1: 13.6 fps, max: 238 fps
1.47.22.14 D3D12
Intel Core i5-1135G7 2.4GHz
Iris Xe G7 80EUs
min: 17.6 fps, P1: 21.3 fps, max: 145 fps
1.47.22.14 D3D12
Intel Core 5 120U 0.9GHz
Iris Xe G7 80EUs
min: 12.8 fps, P1: 20.8 fps, max: 141.1 fps
1.47.22.14 D3D12
Intel Core i5-1135G7 2.4GHz
Iris Xe G7 80EUs
min: 12.9 fps, P1: 20.1 fps, max: 165 fps
1.47.22.14 D3D12
Intel Core i5-1155G7 2.5GHz
Iris Xe G7 80EUs
min: 12.9 fps, P1: 20.4 fps, max: 213 fps
1.47.22.14 D3D12
Intel Core i5-1135G7 2.4GHz
Iris Xe G7 80EUs
min: 8 fps, P1: 10.5 fps, max: 317 fps
1.47.22.14 D3D12
Intel Core i5-1145G7 2.6GHz
Iris Xe G7 80EUs
min: 12.6 fps, P1: 20.5 fps, max: 201 fps
1.47.22.14 D3D12
Intel Core i5-1135G7 2.4GHz
Iris Xe G7 80EUs
min: 8.1 fps, P1: 9.59 fps, max: 309 fps
1.47.22.14 D3D12
Intel Core i5-1155G7 2.5GHz
Iris Xe G7 80EUs
min: 14.4 fps, P1: 21.1 fps, max: 189.6 fps
1.47.22.14 D3D12
Intel Core i5-1350P 1.4GHz
Iris Xe G7 80EUs
min: 15.2 fps, P1: 23.6 fps, max: 137.4 fps
1.47.22.14 D3D12
Intel Core i5-13500H 1.9GHz
Iris Xe G7 80EUs
min: 10.8 fps, P1: 22.7 fps, max: 252 fps
Intel Core i5-1335U 0.9GHz
Iris Xe G7 80EUs
min: 5.8 fps, max: 202 fps
AMD Ryzen 7 PRO 7730U 2GHz
Vega 8
min: 9.3 fps, P1: 14.8 fps, max: 52.8 fps
1.47.22.14 D3D12
AMD Ryzen 7 5700U 1.8GHz
Vega 8
min: 13.6 fps, P1: 15.1 fps, max: 24 fps
1.47.22.14 D3D12
AMD Ryzen 7 PRO 5850U 1.9GHz
Vega 8
min: 13.5 fps, P1: 15.3 fps, max: 25.6 fps
1.47.22.14 D3D12
AMD Ryzen 7 5825U 2GHz
Vega 8
min: 8.7 fps, P1: 15.8 fps, max: 117.4 fps
1.47.22.14 D3D12
AMD Ryzen 7 5700U 1.8GHz
Vega 8
min: 15 fps, P1: 16.3 fps, max: 22.7 fps
1.47.22.14 D3D12
AMD Ryzen 7 5800U 1.9GHz
Vega 8
min: 16 fps, P1: 16.4 fps, max: 24 fps
1.47.22.14 D3D12
AMD Ryzen 7 5700U 1.8GHz
Vega 8
min: 10.9 fps, P1: 16.1 fps, max: 25.5 fps
1.47.22.14 D3D12
AMD Ryzen 7 5700U 1.8GHz
Vega 8
min: 20.7 fps, P1: 25.2 fps, max: 37.2 fps
1.47.22.14 D3D12
AMD Ryzen 7 5700U 1.8GHz
Vega 8
min: 20.3 fps, P1: 25.2 fps, max: 38.6 fps
1.47.22.14 D3D12
AMD Ryzen 9 4900H 3.3GHz
Vega 8
min: 23.3 fps, P1: 25.9 fps, max: 43.5 fps
1.47.22.14 D3D12
AMD Ryzen 7 5825U 2GHz
Vega 8
min: 13.3 fps, P1: 23.4 fps, max: 156.7 fps
1.47.22.14 D3D12
AMD Ryzen 7 7730U 2GHz
Vega 8
min: 24.1 fps, P1: 25.7 fps, max: 36.6 fps
1.47.22.14 D3D12
AMD Ryzen 7 5825U 2GHz
Vega 8
min: 23.1 fps, P1: 25.8 fps, max: 39.6 fps
1.47.22.14 D3D12
AMD Ryzen 7 7730U 2GHz
Vega 8
min: 22.1 fps, P1: 26 fps, max: 55.2 fps
1.47.22.14 D3D12, Leistungsmodus
AMD Ryzen 7 5700U 1.8GHz
Vega 8
min: 22.3 fps, P1: 25.9 fps, max: 38.1 fps
1.47.22.14 D3D12, Flüstermodus
AMD Ryzen 7 5700U 1.8GHz
Vega 8
min: 25 fps, P1: 26.1 fps, max: 36.5 fps
1.47.22.14 D3D12
AMD Ryzen 7 5700U 1.8GHz
Vega 8
min: 21.3 fps, P1: 26 fps, max: 45.2 fps
1.47.22.14 D3D12
AMD Ryzen 7 5800U 1.9GHz
Vega 8
min: 22 fps, P1: 26 fps, max: 41 fps
1.47.22.14 D3D12
AMD Ryzen 7 5700U 1.8GHz
Vega 8
min: 23 fps, P1: 24.8 fps, max: 40.3 fps
1.47.22.14 D3D12, Leistungsmodus
AMD Ryzen 7 5700U 1.8GHz
Vega 8
min: 22.6 fps, P1: 26.6 fps, max: 46.7 fps
1.47.22.14 D3D12
AMD Ryzen 7 5700U 1.8GHz
Vega 8
min: 25.5 fps, P1: 26.5 fps, max: 36.9 fps
1.47.22.14 D3D12
AMD Ryzen 7 5700U 1.8GHz
Vega 8
min: 19.9 fps, P1: 26.5 fps, max: 51.8 fps
1.47.22.14 D3D12
AMD Ryzen 7 5700G 3.8GHz
Vega 8
min: 20.6 fps, P1: 27.8 fps, max: 46.8 fps
1.47.22.14 D3D12
AMD Ryzen 7 4800U 1.8GHz
Vega 8
min: 26.8 fps, P1: 28 fps, max: 39.7 fps
1.47.22.14 D3D12
AMD Ryzen 7 5700U 1.8GHz
Vega 8
min: 25.4 fps, P1: 28.1 fps, max: 39.9 fps
1.47.22.14 D3D12, Dual-Channel-Mode
AMD Ryzen 7 PRO 7730U 2GHz
Vega 8
min: 11.5 fps, P1: 27.7 fps, max: 213 fps
1.47.22.14 D3D12
AMD Ryzen 7 5700U 1.8GHz
Vega 8
min: 15.3 fps, P1: 28.3 fps, max: 101.9 fps
1.47.22.14 D3D12
AMD Ryzen 7 4800U 1.8GHz
Vega 8
min: 25.4 fps, P1: 28.5 fps, max: 41.2 fps
1.47.22.14 D3D12
AMD Ryzen 7 5800H 3.2GHz
Vega 8
min: 26.8 fps, P1: 29.2 fps, max: 48.4 fps
1.47.22.14 D3D12
AMD Ryzen 7 4800U 1.8GHz
Vega 8
min: 24 fps, P1: 29.6 fps, max: 50.6 fps
1.47.22.14 D3D12
AMD Ryzen 9 5900HX 3.3GHz
Vega 8
min: 28 fps, P1: 29.5 fps, max: 42.7 fps
1.47.22.14 D3D12
AMD Ryzen 9 5900HX 3.3GHz
Vega 8
min: 28.7 fps, P1: 29.8 fps, max: 43.2 fps
1.47.22.14 D3D12
AMD Ryzen 7 PRO 5850U 1.9GHz
Vega 8
min: 28.5 fps, P1: 30.1 fps, max: 41.5 fps
1.47.22.14 D3D12
AMD Ryzen 7 5800H @4.5GHz
Vega 8
min: 28.2 fps, P1: 29.6 fps, max: 45.2 fps
1.47.22.14 D3D12
AMD Ryzen 7 5800H 3.2GHz
Vega 8
min: 28.6 fps, P1: 29.7 fps, max: 43.9 fps
1.47.22.14 D3D12
AMD Ryzen 7 7730U 2GHz
Vega 8
min: 18 fps, P1: 29.4 fps, max: 103.8 fps
1.47.22.14 D3D12
AMD Ryzen 7 7730U 2GHz
Vega 8
min: 6.6 fps, P1: 29.2 fps, max: 194 fps
1.47.22.14 D3D12
AMD Ryzen 7 5700U 1.8GHz
Vega 8
min: 27.9 fps, P1: 30 fps, max: 44.9 fps
1.47.22.14 D3D12
AMD Ryzen 7 PRO 5850U 1.9GHz
Vega 8
min: 28 fps, P1: 30.6 fps, max: 44 fps
1.47.22.14 D3D12
AMD Ryzen 7 7730U 2GHz
Vega 8
min: 24.7 fps, P1: 29.7 fps, max: 68.6 fps
1.47.22.14 D3D12
AMD Ryzen 7 7730U 2GHz
Vega 8
min: 28.5 fps, P1: 30.8 fps, max: 44.5 fps
1.47.22.14 D3D12
AMD Ryzen 7 PRO 5750G 3.8GHz
Vega 8
min: 31.7 fps, P1: 32.7 fps, max: 46.7 fps
1.47.22.14 D3D12
AMD Ryzen 9 5900HX 3.3GHz
Vega 8
min: 31.8 fps, P1: 33.6 fps, max: 48.4 fps
1.47.22.14 D3D12
AMD Ryzen 9 5900HX 3.3GHz
Vega 8
min: 18.6 fps, P1: 32.1 fps, max: 82.2 fps
1.47.22.14 D3D12
AMD Ryzen 9 5900HX 3.3GHz
Vega 8
min: 26.5 fps, P1: 33.7 fps, max: 48 fps
1.47.22.14 D3D12
AMD Ryzen 7 5800H 3.2GHz
Vega 8
min: 24.2 fps, P1: 34.3 fps, max: 56.7 fps
1.47.22.14 D3D12
Intel Core i5-1135G7 2.4GHz
Iris Xe G7 80EUs
min: 5 fps, P1: 5 fps, max: 165.5 fps
1.47.22.14 D3D12
Intel Core i5-1135G7 2.4GHz
Iris Xe G7 80EUs
min: 5 fps, P1: 5 fps, max: 158 fps
1.47.22.14 D3D12
Intel Core i5-1135G7 2.4GHz
Iris Xe G7 80EUs
min: 5 fps, P1: 5 fps, max: 170 fps
1.47.22.14 D3D12
Intel Core i5-1135G7 2.4GHz
Iris Xe G7 80EUs
min: 5 fps, P1: 5 fps, max: 191 fps
1.47.22.14 D3D12
Intel Core i5-1135G7 2.4GHz
Iris Xe G7 80EUs
min: 5 fps, P1: 5 fps, max: 187 fps
1.47.22.14 D3D12
Intel Core i5-1135G7 2.4GHz
Iris Xe G7 80EUs
min: 5 fps, P1: 5 fps, max: 199 fps
1.47.22.14 D3D12
Intel Core i5-1135G7 2.4GHz
Iris Xe G7 80EUs
min: 5 fps, P1: 5 fps, max: 148 fps
1.47.22.14 D3D12
Intel Core i5-1135G7 2.4GHz
Iris Xe G7 80EUs
min: 5 fps, P1: 5 fps, max: 245 fps
1.47.22.14 D3D12
Intel Core i5-1130G7 1.8GHz
Iris Xe G7 80EUs
min: 5 fps, P1: 6.12 fps, max: 145 fps
1.47.22.14 D3D12
Intel Core i5-1135G7 2.4GHz
Iris Xe G7 80EUs
min: 5 fps, P1: 5 fps, max: 172 fps
1.47.22.14 D3D12
Intel Core i5-1135G7 2.4GHz
Iris Xe G7 80EUs
min: 5 fps, P1: 5.58 fps, max: 153 fps
1.47.22.14 D3D12
Intel Core i5-1135G7 2.4GHz
Iris Xe G7 80EUs
min: 5 fps, P1: 5.63 fps, max: 175 fps
1.47.22.14 D3D12
Intel Core i5-1240P 1.2GHz
Iris Xe G7 80EUs
min: 6.5 fps, P1: 8.45 fps, max: 141.8 fps
1.47.22.14 D3D12
Intel Core i5-1230U 0.7GHz
Iris Xe G7 80EUs
min: 6.6 fps, P1: 9.19 fps, max: 148.7 fps
1.47.22.14 D3D12
Intel Core i5-1235U 0.9GHz
Iris Xe G7 80EUs
min: 5 fps, P1: 5.9 fps, max: 101.6 fps
Intel Core i5-1335U 0.9GHz
Iris Xe G7 80EUs
min: 5 fps, max: 184 fps
1.47.22.14 D3D12
Intel Core i5-1135G7 2.4GHz
Iris Xe G7 80EUs
min: 5.7 fps, P1: 7.28 fps, max: 214 fps
1.47.22.14 D3D12
Intel Core i5-1135G7 2.4GHz
Iris Xe G7 80EUs
min: 5.7 fps, P1: 7.35 fps, max: 204 fps
1.47.22.14 D3D12
Intel Core i5-1135G7 2.4GHz
Iris Xe G7 80EUs
min: 5.6 fps, P1: 7.51 fps, max: 196.5 fps
1.47.22.14 D3D12
Intel Core i5-1240P 1.2GHz
Iris Xe G7 80EUs
min: 10.1 fps, P1: 11.3 fps, max: 125.1 fps
1.47.22.14 D3D12
Intel Core i5-1135G7 2.4GHz
Iris Xe G7 80EUs
min: 5 fps, P1: 5.29 fps, max: 233 fps
1.47.22.14 D3D12
Intel Core i5-1240P 1.2GHz
Iris Xe G7 80EUs
min: 6.8 fps, P1: 11 fps, max: 131.6 fps
1.47.22.14 D3D12
Intel Core i5-1240P 1.2GHz
Iris Xe G7 80EUs
min: 7.2 fps, P1: 11 fps, max: 154.3 fps
1.47.22.14 D3D12
Intel Core i5-1135G7 2.4GHz
Iris Xe G7 80EUs
min: 5.5 fps, P1: 7.46 fps, max: 214 fps
1.47.22.14 D3D12
Intel Core i5-1135G7 2.4GHz
Iris Xe G7 80EUs
min: 5.9 fps, P1: 7.88 fps, max: 185 fps
1.47.22.14 D3D12, Dual-Channel
Intel Core i5-1135G7 2.4GHz
Iris Xe G7 80EUs
min: 5.7 fps, P1: 7.57 fps, max: 179 fps
1.47.22.14 D3D12
Intel Core i5-1235U 0.9GHz
Iris Xe G7 80EUs
min: 5 fps, P1: 7.98 fps, max: 254 fps
1.47.22.14 D3D12
Intel Core i5-1240U 0.8GHz
Iris Xe G7 80EUs
min: 5 fps, P1: 7.65 fps, max: 232 fps
1.47.22.14 D3D12
Intel Core i5-1130G7 1.8GHz
Iris Xe G7 80EUs
min: 5.7 fps, P1: 7.54 fps, max: 244 fps
1.47.22.14 D3D12, Dual-Channel
Intel Core i5-1135G7 2.4GHz
Iris Xe G7 80EUs
min: 5.5 fps, P1: 8.17 fps, max: 203 fps
1.47.22.14 D3D12
Intel Core i5-1335U 0.9GHz
Iris Xe G7 80EUs
min: 5.4 fps, P1: 7.66 fps, max: 153.8 fps
1.47.22.14 D3D12
Intel Core i5-1240P 1.2GHz
Iris Xe G7 80EUs
min: 9.2 fps, P1: 12.1 fps, max: 141 fps
1.47.22.14 D3D12
Intel Core i5-1135G7 2.4GHz
Iris Xe G7 80EUs
min: 5.5 fps, P1: 8.28 fps, max: 185.3 fps
1.47.22.14 D3D12
Intel Core i5-1335U 0.9GHz
Iris Xe G7 80EUs
min: 5.7 fps, P1: 7.62 fps, max: 258 fps
1.47.22.14 D3D12
Intel Core i5-1235U 0.9GHz
Iris Xe G7 80EUs
min: 5.7 fps, P1: 7.84 fps, max: 142.4 fps
1.47.22.14 D3D12
Intel Core i5-1240P 1.2GHz
Iris Xe G7 80EUs
min: 8.3 fps, P1: 12.4 fps, max: 132 fps
1.47.22.14 D3D12
Intel Core i5-1345U 1.2GHz
Iris Xe G7 80EUs
min: 6.2 fps, P1: 8.42 fps, max: 227 fps
1.47.22.14 D3D12
Intel Core i5-1135G7 2.4GHz
Iris Xe G7 80EUs
min: 5.3 fps, P1: 6.14 fps, max: 239 fps
1.47.22.14 D3D12
Intel Core i5-1245U 1.2GHz
Iris Xe G7 80EUs
min: 5.8 fps, P1: 8.9 fps, max: 317 fps
1.47.22.14 D3D12
Intel Core i5-1335U 0.9GHz
Iris Xe G7 80EUs
min: 6.3 fps, P1: 8.44 fps, max: 276 fps
1.47.22.14 D3D12
Intel Core i5-1235U 0.9GHz
Iris Xe G7 80EUs
min: 8.2 fps, P1: 13.1 fps, max: 153 fps
1.47.22.14 D3D12
Intel Core i5-1235U 0.9GHz
Iris Xe G7 80EUs
min: 7.2 fps, P1: 9.24 fps, max: 182 fps
1.47.22.14 D3D12
Intel Core i5-1235U 0.9GHz
Iris Xe G7 80EUs
min: 6.9 fps, P1: 12.5 fps, max: 217 fps
1.47.22.14 D3D12
Intel Core i5-1240P 1.2GHz
Iris Xe G7 80EUs
min: 8.4 fps, P1: 13.2 fps, max: 134.9 fps
1.47.22.14 D3D12
Intel Core i5-1335U 0.9GHz
Iris Xe G7 80EUs
min: 6.2 fps, P1: 8.6 fps, max: 242 fps
1.47.22.14 D3D12
Intel Core i5-1145G7 2.6GHz
Iris Xe G7 80EUs
min: 7.7 fps, P1: 9.95 fps, max: 143 fps
1.47.22.14 D3D12
Intel Core i5-1135G7 2.4GHz
Iris Xe G7 80EUs
min: 6.2 fps, P1: 9.3 fps, max: 191 fps
1.47.22.14 D3D12
Intel Core i5-1135G7 2.4GHz
Iris Xe G7 80EUs
min: 5.1 fps, P1: 8.82 fps, max: 235 fps
1.47.22.14 D3D12, Hoch
Intel Core i5-1240P 1.2GHz
Iris Xe G7 80EUs
min: 11.6 fps, P1: 14.2 fps, max: 149.3 fps
1.47.22.14 D3D12
Intel Core i5-1135G7 2.4GHz
Iris Xe G7 80EUs
min: 5 fps, P1: 6.81 fps, max: 337 fps
1.47.22.14 D3D12
Intel Core i5-1240P 1.2GHz
Iris Xe G7 80EUs
min: 5.1 fps, P1: 8.77 fps, max: 314 fps
1.47.22.14 D3D12
Intel Core i5-1235U 0.9GHz
Iris Xe G7 80EUs
min: 5 fps, P1: 8.18 fps, max: 135.1 fps
1.47.22.14 D3D12
Intel Core i5-1240P 1.2GHz
Iris Xe G7 80EUs
min: 8.7 fps, P1: 14.1 fps, max: 158.9 fps
1.47.22.14 D3D12
Intel Core i5-1335U 0.9GHz
Iris Xe G7 80EUs
min: 5.8 fps, P1: 8.74 fps, max: 145.9 fps
1.47.22.14 D3D12
Intel Core i5-12500H 1.8GHz
Iris Xe G7 80EUs
min: 9 fps, P1: 14.7 fps, max: 185.6 fps
1.47.22.14 D3D12
Intel Core i5-1335U 0.9GHz
Iris Xe G7 80EUs
min: 7.2 fps, P1: 9.3 fps, max: 146.7 fps
1.47.22.14 D3D12
Intel Core i5-1345U 1.2GHz
Iris Xe G7 80EUs
min: 6.5 fps, P1: 9.4 fps, max: 161.2 fps
1.47.22.14 D3D12
Intel Core i5-1135G7 2.4GHz
Iris Xe G7 80EUs
min: 6.1 fps, P1: 9.74 fps, max: 158 fps
1.47.22.14 D3D12
Intel Core i5-1334U 0.9GHz
Iris Xe G7 80EUs
min: 8.5 fps, P1: 10.2 fps, max: 314 fps
1.47.22.14 D3D12
Intel Core i5-1135G7 2.4GHz
Iris Xe G7 80EUs
min: 6.4 fps, P1: 9.41 fps, max: 198.7 fps
1.47.22.14 D3D12
Intel Core i5-1345U 1.2GHz
Iris Xe G7 80EUs
min: 6.9 fps, P1: 12.5 fps, max: 249 fps
1.47.22.14 D3D12
Intel Core i5-1335U 0.9GHz
Iris Xe G7 80EUs
min: 7.6 fps, P1: 10.7 fps, max: 180.3 fps
1.47.22.14 D3D12
Intel Core i5-1135G7 2.4GHz
Iris Xe G7 80EUs
min: 7.2 fps, P1: 13.6 fps, max: 133 fps
1.47.22.14 D3D12
Intel Core i5-1135G7 2.4GHz
Iris Xe G7 80EUs
min: 7.9 fps, P1: 10.2 fps, max: 159.5 fps
1.47.22.14 D3D12
Intel Core i5-11300H 3.1GHz
Iris Xe G7 80EUs
min: 9.1 fps, P1: 14.1 fps, max: 202 fps
1.47.22.14 D3D12
Intel Core i5-1335U 0.9GHz
Iris Xe G7 80EUs
min: 7.7 fps, P1: 13 fps, max: 142.4 fps
1.47.22.14 D3D12
Intel Core i5-1135G7 2.4GHz
Iris Xe G7 80EUs
min: 9 fps, P1: 11.3 fps, max: 199 fps
1.47.22.14 D3D12
Intel Core i5-1135G7 2.4GHz
Iris Xe G7 80EUs
min: 5.1 fps, P1: 7.1 fps, max: 328 fps
1.47.22.14 D3D12
Intel Core i5-1135G7 2.4GHz
Iris Xe G7 80EUs
min: 8.2 fps, P1: 16.1 fps, max: 143 fps
1.47.22.14 D3D12
Intel Core i5-1135G7 2.4GHz
Iris Xe G7 80EUs
min: 6.2 fps, P1: 11.2 fps, max: 251 fps
1.47.22.14 D3D12
Intel Core i5-1135G7 2.4GHz
Iris Xe G7 80EUs
min: 5.3 fps, P1: 7.35 fps, max: 274 fps
1.47.22.14 D3D12
Intel Core 5 120U 0.9GHz
Iris Xe G7 80EUs
min: 6.4 fps, P1: 14.3 fps, max: 253 fps
1.47.22.14 D3D12
Intel Core i5-1155G7 2.5GHz
Iris Xe G7 80EUs
min: 7.6 fps, P1: 10.4 fps, max: 212 fps
1.47.22.14 D3D12
Intel Core i5-1155G7 2.5GHz
Iris Xe G7 80EUs
min: 10.4 fps, P1: 14.9 fps, max: 201 fps
1.47.22.14 D3D12
Intel Core i5-1155G7 2.5GHz
Iris Xe G7 80EUs
min: 10.1 fps, P1: 13.8 fps, max: 192.2 fps
1.47.22.14 D3D12
Intel Core i5-1350P 1.4GHz
Iris Xe G7 80EUs
min: 5 fps, P1: 12.6 fps, max: 250 fps
1.47.22.14 D3D12
Intel Core i5-13500H 1.9GHz
Iris Xe G7 80EUs
min: 8.2 fps, P1: 17 fps, max: 261 fps
1.47.22.14 D3D12
AMD Ryzen 7 PRO 7730U 2GHz
Vega 8
min: 7.4 fps, P1: 9.4 fps, max: 99.7 fps
1.47.22.14 D3D12
AMD Ryzen 7 5700U 1.8GHz
Vega 8
min: 11.4 fps, P1: 12.1 fps, max: 22.1 fps
1.47.22.14 D3D12
AMD Ryzen 7 PRO 5850U 1.9GHz
Vega 8
min: 12 fps, P1: 12.2 fps, max: 27 fps
1.47.22.14 D3D12
AMD Ryzen 7 5700U 1.8GHz
Vega 8
min: 10.3 fps, P1: 12.5 fps, max: 26 fps
1.47.22.14 D3D12
AMD Ryzen 7 5800U 1.9GHz
Vega 8
min: 9.7 fps, P1: 11.1 fps, max: 21.8 fps
1.47.22.14 D3D12
AMD Ryzen 7 5825U 2GHz
Vega 8
min: 6.9 fps, P1: 9.17 fps, max: 153.7 fps
1.47.22.14 D3D12
AMD Ryzen 7 5700U 1.8GHz
Vega 8
min: 9.8 fps, P1: 12.7 fps, max: 22.9 fps
1.47.22.14 D3D12
AMD Ryzen 7 5700U 1.8GHz
Vega 8
min: 17 fps, P1: 18.8 fps, max: 51.1 fps
1.47.22.14 D3D12
AMD Ryzen 7 5825U 2GHz
Vega 8
min: 13.4 fps, P1: 17.4 fps, max: 125.1 fps
1.47.22.14 D3D12, Flüstermodus
AMD Ryzen 7 5700U 1.8GHz
Vega 8
min: 16.1 fps, P1: 18.9 fps, max: 51.5 fps
1.47.22.14 D3D12
AMD Ryzen 7 5825U 2GHz
Vega 8
min: 11.5 fps, P1: 19.2 fps, max: 154.4 fps
1.47.22.14 D3D12
AMD Ryzen 7 7730U 2GHz
Vega 8
min: 5.8 fps, P1: 8.47 fps, max: 188.5 fps
1.47.22.14 D3D12
AMD Ryzen 7 5700U 1.8GHz
Vega 8
min: 18.4 fps, P1: 19.2 fps, max: 33.3 fps
1.47.22.14 D3D12, Leistungsmodus
AMD Ryzen 7 5700U 1.8GHz
Vega 8
min: 18.1 fps, P1: 18.9 fps, max: 39.9 fps
1.47.22.14 D3D12
AMD Ryzen 7 7730U 2GHz
Vega 8
min: 15.6 fps, P1: 19.3 fps, max: 33.4 fps
1.47.22.14 D3D12
AMD Ryzen 9 4900H 3.3GHz
Vega 8
min: 17.5 fps, P1: 19.6 fps, max: 41.1 fps
1.47.22.14 D3D12
AMD Ryzen 7 5700U 1.8GHz
Vega 8
min: 17.8 fps, P1: 19.2 fps, max: 35.6 fps
1.47.22.14 D3D12
AMD Ryzen 7 5800U 1.9GHz
Vega 8
min: 18.2 fps, P1: 19.6 fps, max: 42.5 fps
1.47.22.14 D3D12
AMD Ryzen 7 5700U 1.8GHz
Vega 8
min: 18.7 fps, P1: 19.5 fps, max: 41.3 fps
1.47.22.14 D3D12, Leistungsmodus
AMD Ryzen 7 5700U 1.8GHz
Vega 8
min: 17.7 fps, P1: 19.9 fps, max: 40.4 fps
1.47.22.14 D3D12
AMD Ryzen 7 5700U 1.8GHz
Vega 8
min: 18.7 fps, P1: 20.1 fps, max: 38.8 fps
1.47.22.14 D3D12
AMD Ryzen 7 5700U 1.8GHz
Vega 8
min: 15.6 fps, P1: 19.6 fps, max: 63.9 fps
1.47.22.14 D3D12
AMD Ryzen 7 4800U 1.8GHz
Vega 8
min: 18.3 fps, P1: 20.4 fps, max: 52.3 fps
1.47.22.14 D3D12
AMD Ryzen 7 5700G 3.8GHz
Vega 8
min: 19.9 fps, P1: 21.1 fps, max: 41.1 fps
1.47.22.14 D3D12
AMD Ryzen 7 5700U 1.8GHz
Vega 8
min: 14.8 fps, P1: 19.1 fps, max: 106 fps
1.47.22.14 D3D12
AMD Ryzen 7 7730U 2GHz
Vega 8
min: 5.5 fps, P1: 8.17 fps, max: 256 fps
1.47.22.14 D3D12, Dual-Channel-Mode
AMD Ryzen 7 PRO 7730U 2GHz
Vega 8
min: 8.4 fps, P1: 16.1 fps, max: 186 fps
1.47.22.14 D3D12
AMD Ryzen 7 4800U 1.8GHz
Vega 8
min: 17.2 fps, P1: 21.5 fps, max: 44.5 fps
1.47.22.14 D3D12
AMD Ryzen 7 5800H 3.2GHz
Vega 8
min: 21 fps, P1: 22.1 fps, max: 44.9 fps
1.47.22.14 D3D12
AMD Ryzen 9 5900HX 3.3GHz
Vega 8
min: 20.1 fps, P1: 21.8 fps, max: 47.9 fps
1.47.22.14 D3D12
AMD Ryzen 7 7730U 2GHz
Vega 8
min: 5.2 fps, P1: 8.39 fps, max: 284 fps
1.47.22.14 D3D12
AMD Ryzen 7 4800U 1.8GHz
Vega 8
min: 20.4 fps, P1: 22.5 fps, max: 52.6 fps
1.47.22.14 D3D12
AMD Ryzen 7 5800H @4.5GHz
Vega 8
min: 21.1 fps, P1: 22.8 fps, max: 45.3 fps
1.47.22.14 D3D12
AMD Ryzen 9 5900HX 3.3GHz
Vega 8
min: 21.6 fps, P1: 22.5 fps, max: 37.4 fps
1.47.22.14 D3D12
AMD Ryzen 7 5700U 1.8GHz
Vega 8
min: 20.7 fps, P1: 22.8 fps, max: 43.7 fps
1.47.22.14 D3D12
AMD Ryzen 7 PRO 5850U 1.9GHz
Vega 8
min: 22.1 fps, P1: 23.2 fps, max: 39.1 fps
1.47.22.14 D3D12
AMD Ryzen 7 5800H 3.2GHz
Vega 8
min: 20.3 fps, P1: 22.7 fps, max: 45.9 fps
1.47.22.14 D3D12
AMD Ryzen 7 7730U 2GHz
Vega 8
min: 9.9 fps, P1: 20.8 fps, max: 180.5 fps
1.47.22.14 D3D12
AMD Ryzen 7 7730U 2GHz
Vega 8
min: 9.6 fps, P1: 22.5 fps, max: 199.7 fps
1.47.22.14 D3D12
AMD Ryzen 7 PRO 5850U 1.9GHz
Vega 8
min: 21 fps, P1: 23.5 fps, max: 46 fps
1.47.22.14 D3D12
AMD Ryzen 7 PRO 5750G 3.8GHz
Vega 8
min: 24.1 fps, P1: 24.7 fps, max: 41.5 fps
1.47.22.14 D3D12
AMD Ryzen 9 5900HX 3.3GHz
Vega 8
min: 23.5 fps, P1: 25.5 fps, max: 45.5 fps
1.47.22.14 D3D12
AMD Ryzen 9 5900HX 3.3GHz
Vega 8
min: 16 fps, P1: 24.6 fps, max: 195 fps
1.47.22.14 D3D12
AMD Ryzen 9 5900HX 3.3GHz
Vega 8
min: 24.3 fps, P1: 25.8 fps, max: 42.5 fps
1.47.22.14 D3D12
AMD Ryzen 7 5800H 3.2GHz
Vega 8
min: 23.8 fps, P1: 25.8 fps, max: 44.4 fps
1.47.22.14 D3D12
Intel Core i5-1130G7 1.8GHz
Iris Xe G7 80EUs
min: 5 fps, P1: 5 fps, max: 163 fps
1.47.22.14 D3D12
Intel Core i5-1240P 1.2GHz
Iris Xe G7 80EUs
min: 5 fps, P1: 5.01 fps, max: 145.2 fps
1.47.22.14 D3D12
Intel Core i5-1135G7 2.4GHz
Iris Xe G7 80EUs
min: 5 fps, P1: 5 fps, max: 168 fps
1.47.22.14 D3D12
Intel Core i5-1135G7 2.4GHz
Iris Xe G7 80EUs
min: 5 fps, P1: 5 fps, max: 211 fps
1.47.22.14 D3D12
Intel Core i5-1235U 0.9GHz
Iris Xe G7 80EUs
min: 5 fps, P1: 5 fps, max: 98.9 fps
1.47.22.14 D3D12
Intel Core i5-1135G7 2.4GHz
Iris Xe G7 80EUs
min: 5 fps, P1: 5 fps, max: 231 fps
1.47.22.14 D3D12
Intel Core i5-1135G7 2.4GHz
Iris Xe G7 80EUs
min: 5 fps, P1: 5 fps, max: 264 fps
1.47.22.14 D3D12
Intel Core i5-1135G7 2.4GHz
Iris Xe G7 80EUs
min: 5 fps, P1: 5 fps, max: 192 fps
1.47.22.14 D3D12
Intel Core i5-1335U 0.9GHz
Iris Xe G7 80EUs
min: 5 fps, P1: 5 fps, max: 187.9 fps
1.47.22.14 D3D12, Dual-Channel
Intel Core i5-1135G7 2.4GHz
Iris Xe G7 80EUs
min: 5 fps, P1: 5 fps, max: 201 fps
1.47.22.14 D3D12
Intel Core i5-1135G7 2.4GHz
Iris Xe G7 80EUs
min: 5 fps, P1: 5 fps, max: 203 fps
1.47.22.14 D3D12
Intel Core i5-1235U 0.9GHz
Iris Xe G7 80EUs
min: 5 fps, P1: 5 fps, max: 336 fps
1.47.22.14 D3D12
Intel Core i5-1235U 0.9GHz
Iris Xe G7 80EUs
min: 5 fps, P1: 5 fps, max: 213 fps
1.47.22.14 D3D12, Dual-Channel
Intel Core i5-1135G7 2.4GHz
Iris Xe G7 80EUs
min: 5 fps, P1: 5 fps, max: 219 fps
1.47.22.14 D3D12
Intel Core i5-1240U 0.8GHz
Iris Xe G7 80EUs
min: 5 fps, P1: 5 fps, max: 279 fps
1.47.22.14 D3D12
Intel Core i5-1240P 1.2GHz
Iris Xe G7 80EUs
min: 5.1 fps, P1: 6.22 fps, max: 152 fps
1.47.22.14 D3D12
Intel Core i5-1130G7 1.8GHz
Iris Xe G7 80EUs
min: 5 fps, P1: 5 fps, max: 237 fps
1.47.22.14 D3D12
Intel Core i5-1335U 0.9GHz
Iris Xe G7 80EUs
min: 5 fps, P1: 5 fps, max: 315 fps
1.47.22.14 D3D12
Intel Core i5-1345U 1.2GHz
Iris Xe G7 80EUs
min: 5 fps, P1: 5 fps, max: 272 fps
1.47.22.14 D3D12
Intel Core i5-1245U 1.2GHz
Iris Xe G7 80EUs
min: 5 fps, P1: 5 fps, max: 316 fps
1.47.22.14 D3D12
Intel Core i5-1240P 1.2GHz
Iris Xe G7 80EUs
min: 6 fps, P1: 7.2 fps, max: 181.6 fps
1.47.22.14 D3D12
Intel Core i5-1335U 0.9GHz
Iris Xe G7 80EUs
min: 5 fps, P1: 5 fps, max: 345 fps
1.47.22.14 D3D12
Intel Core i5-1135G7 2.4GHz
Iris Xe G7 80EUs
min: 5 fps, P1: 5 fps, max: 281 fps
1.47.22.14 D3D12
Intel Core i5-1235U 0.9GHz
Iris Xe G7 80EUs
min: 6.2 fps, P1: 6.97 fps, max: 162.5 fps
1.47.22.14 D3D12
Intel Core i5-1235U 0.9GHz
Iris Xe G7 80EUs
min: 5.2 fps, P1: 6.87 fps, max: 149.7 fps
1.47.22.14 D3D12
Intel Core i5-1235U 0.9GHz
Iris Xe G7 80EUs
min: 5.5 fps, P1: 7.13 fps, max: 259 fps
1.47.22.14 D3D12
Intel Core i5-1235U 0.9GHz
Iris Xe G7 80EUs
min: 5 fps, P1: 5 fps, max: 194 fps
1.47.22.14 D3D12
Intel Core i5-1335U 0.9GHz
Iris Xe G7 80EUs
min: 5 fps, P1: 5 fps, max: 318 fps
1.47.22.14 D3D12
Intel Core i5-1135G7 2.4GHz
Iris Xe G7 80EUs
min: 5 fps, P1: 5 fps, max: 288 fps
1.47.22.14 D3D12
Intel Core i5-1145G7 2.6GHz
Iris Xe G7 80EUs
min: 5 fps, P1: 5 fps, max: 191 fps
1.47.22.14 D3D12
Intel Core i5-1135G7 2.4GHz
Iris Xe G7 80EUs
min: 5 fps, P1: 5.2 fps, max: 231 fps
1.47.22.14 D3D12
Intel Core i5-1240P 1.2GHz
Iris Xe G7 80EUs
min: 6.4 fps, P1: 7.32 fps, max: 188.1 fps
1.47.22.14 D3D12, Hoch
Intel Core i5-1240P 1.2GHz
Iris Xe G7 80EUs
min: 6.5 fps, P1: 7.66 fps, max: 199.9 fps
1.47.22.14 D3D12
Intel Core i5-1240P 1.2GHz
Iris Xe G7 80EUs
min: 5 fps, P1: 5.03 fps, max: 297 fps
1.47.22.14 D3D12
Intel Core i5-1335U 0.9GHz
Iris Xe G7 80EUs
min: 5 fps, P1: 5.13 fps, max: 169.6 fps
1.47.22.14 D3D12
Intel Core i5-12500H 1.8GHz
Iris Xe G7 80EUs
min: 5.1 fps, P1: 7.28 fps, max: 266 fps
1.47.22.14 D3D12
Intel Core i5-1335U 0.9GHz
Iris Xe G7 80EUs
min: 5 fps, P1: 5.12 fps, max: 194.8 fps
1.47.22.14 D3D12
Intel Core i5-1345U 1.2GHz
Iris Xe G7 80EUs
min: 5 fps, P1: 5.02 fps, max: 181.9 fps
1.47.22.14 D3D12
Intel Core i5-1334U 0.9GHz
Iris Xe G7 80EUs
min: 5 fps, P1: 6.12 fps, max: 343 fps
1.47.22.14 D3D12
Intel Core i5-1335U 0.9GHz
Iris Xe G7 80EUs
min: 5 fps, P1: 6.51 fps, max: 253 fps
1.47.22.14 D3D12
Intel Core i5-1345U 1.2GHz
Iris Xe G7 80EUs
min: 5 fps, P1: 6.24 fps, max: 289 fps
1.47.22.14 D3D12
Intel Core i5-1335U 0.9GHz
Iris Xe G7 80EUs
min: 5 fps, P1: 6.24 fps, max: 272 fps
1.47.22.14 D3D12
Intel Core i5-11300H 3.1GHz
Iris Xe G7 80EUs
min: 5 fps, P1: 6.49 fps, max: 228 fps
1.47.22.14 D3D12
Intel Core i5-1135G7 2.4GHz
Iris Xe G7 80EUs
min: 5 fps, P1: 5.5 fps, max: 355 fps
1.47.22.14 D3D12
Intel Core 5 120U 0.9GHz
Iris Xe G7 80EUs
min: 5 fps, P1: 5.93 fps, max: 261 fps
1.47.22.14 D3D12
Intel Core i5-1135G7 2.4GHz
Iris Xe G7 80EUs
min: 5 fps, P1: 5.65 fps, max: 312 fps
1.47.22.14 D3D12
Intel Core i5-1135G7 2.4GHz
Iris Xe G7 80EUs
min: 5 fps, P1: 7.93 fps, max: 196 fps
1.47.22.14 D3D12
Intel Core i5-1135G7 2.4GHz
Iris Xe G7 80EUs
min: 5 fps, P1: 5.78 fps, max: 305 fps
1.47.22.14 D3D12
Intel Core i5-1155G7 2.5GHz
Iris Xe G7 80EUs
min: 6.1 fps, P1: 6.52 fps, max: 241 fps
1.47.22.14 D3D12
Intel Core i5-1155G7 2.5GHz
Iris Xe G7 80EUs
min: 6.4 fps, P1: 7.66 fps, max: 224 fps
1.47.22.14 D3D12
Intel Core i5-1155G7 2.5GHz
Iris Xe G7 80EUs
min: 6.1 fps, P1: 8.11 fps, max: 248 fps
1.47.22.14 D3D12
Intel Core i5-1155G7 2.5GHz
Iris Xe G7 80EUs
min: 6.1 fps, P1: 8.11 fps, max: 248 fps
1.47.22.14 D3D12
Intel Core i5-1350P 1.4GHz
Iris Xe G7 80EUs
min: 5.1 fps, P1: 7.53 fps, max: 343 fps
1.47.22.14 D3D12
Intel Core i5-13500H 1.9GHz
Iris Xe G7 80EUs
min: 5.2 fps, P1: 9.1 fps, max: 326 fps
1.47.22.14 D3D12
AMD Ryzen 7 PRO 7730U 2GHz
Vega 8
min: 6.2 fps, P1: 6.7 fps, max: 160.6 fps
1.47.22.14 D3D12
AMD Ryzen 7 PRO 5850U 1.9GHz
Vega 8
min: 10.1 fps, P1: 10.7 fps, max: 22.7 fps
1.47.22.14 D3D12
AMD Ryzen 7 5700U 1.8GHz
Vega 8
min: 5.7 fps, P1: 10.1 fps, max: 81.1 fps
1.47.22.14 D3D12
AMD Ryzen 7 5700U 1.8GHz
Vega 8
min: 6.5 fps, P1: 6.96 fps, max: 103.2 fps
1.47.22.14 D3D12
AMD Ryzen 7 5825U 2GHz
Vega 8
min: 5.7 fps, P1: 7.06 fps, max: 166.1 fps
1.47.22.14 D3D12
AMD Ryzen 7 5800U 1.9GHz
Vega 8
min: 10.8 fps, P1: 11.2 fps, max: 19.9 fps
1.47.22.14 D3D12
AMD Ryzen 7 5700U 1.8GHz
Vega 8
min: 7.6 fps, P1: 11.5 fps, max: 18.8 fps
1.47.22.14 D3D12, Flüstermodus
AMD Ryzen 7 5700U 1.8GHz
Vega 8
min: 13.4 fps, P1: 15 fps, max: 49.8 fps
1.47.22.14 D3D12
AMD Ryzen 7 5700U 1.8GHz
Vega 8
min: 13.6 fps, P1: 15.6 fps, max: 45 fps
1.47.22.14 D3D12
AMD Ryzen 7 7730U 2GHz
Vega 8
min: 5 fps, P1: 6.95 fps, max: 206 fps
1.47.22.14 D3D12
AMD Ryzen 7 7730U 2GHz
Vega 8
min: 5.1 fps, P1: 6.57 fps, max: 268 fps
1.47.22.14 D3D12
AMD Ryzen 7 5700U 1.8GHz
Vega 8
min: 13.1 fps, P1: 15.6 fps, max: 30.6 fps
1.47.22.14 D3D12
AMD Ryzen 7 5825U 2GHz
Vega 8
min: 10.9 fps, P1: 13.3 fps, max: 140.2 fps
1.47.22.14 D3D12
AMD Ryzen 7 5825U 2GHz
Vega 8
min: 7 fps, P1: 16.4 fps, max: 134.6 fps
1.47.22.14 D3D12
AMD Ryzen 7 5700U 1.8GHz
Vega 8
min: 15.4 fps, P1: 16.7 fps, max: 33.8 fps
1.47.22.14 D3D12
AMD Ryzen 9 4900H 3.3GHz
Vega 8
min: 14.5 fps, P1: 16.8 fps, max: 41.3 fps
1.47.22.14 D3D12
AMD Ryzen 7 5800U 1.9GHz
Vega 8
min: 14.6 fps, P1: 16.1 fps, max: 43.6 fps
1.47.22.14 D3D12, Leistungsmodus
AMD Ryzen 7 5700U 1.8GHz
Vega 8
min: 15.5 fps, P1: 16.9 fps, max: 34.9 fps
1.47.22.14 D3D12
AMD Ryzen 7 5700U 1.8GHz
Vega 8
min: 16 fps, P1: 17.2 fps, max: 44 fps
1.47.22.14 D3D12
AMD Ryzen 7 5700U 1.8GHz
Vega 8
min: 16.5 fps, P1: 17.5 fps, max: 36.8 fps
1.47.22.14 D3D12, Leistungsmodus
AMD Ryzen 7 5700U 1.8GHz
Vega 8
min: 15.6 fps, P1: 17.3 fps, max: 35.6 fps
1.47.22.14 D3D12
AMD Ryzen 7 4800U 1.8GHz
Vega 8
min: 14.5 fps, P1: 16.1 fps, max: 63 fps
1.47.22.14 D3D12
AMD Ryzen 7 7730U 2GHz
Vega 8
min: 5 fps, P1: 5.54 fps, max: 290 fps
1.47.22.14 D3D12
AMD Ryzen 7 5700U 1.8GHz
Vega 8
min: 11.3 fps, P1: 12.5 fps, max: 118.6 fps
1.47.22.14 D3D12
AMD Ryzen 7 5700G 3.8GHz
Vega 8
min: 15.3 fps, P1: 17.9 fps, max: 36.2 fps
1.47.22.14 D3D12
AMD Ryzen 7 5800H 3.2GHz
Vega 8
min: 17.7 fps, P1: 19 fps, max: 34.7 fps
1.47.22.14 D3D12
AMD Ryzen 7 4800U 1.8GHz
Vega 8
min: 16.2 fps, P1: 17.6 fps, max: 46.7 fps
1.47.22.14 D3D12
AMD Ryzen 7 7730U 2GHz
Vega 8
min: 5 fps, P1: 5.82 fps, max: 285 fps
1.47.22.14 D3D12, Dual-Channel-Mode
AMD Ryzen 7 PRO 7730U 2GHz
Vega 8
min: 7.2 fps, P1: 8.8 fps, max: 221 fps
1.47.22.14 D3D12
AMD Ryzen 9 5900HX 3.3GHz
Vega 8
min: 18.2 fps, P1: 19.2 fps, max: 34.3 fps
1.47.22.14 D3D12
AMD Ryzen 7 4800U 1.8GHz
Vega 8
min: 17.8 fps, P1: 19.5 fps, max: 39.5 fps
1.47.22.14 D3D12
AMD Ryzen 9 5900HX 3.3GHz
Vega 8
min: 17.9 fps, P1: 19.1 fps, max: 36.2 fps
1.47.22.14 D3D12
AMD Ryzen 7 5800H @4.5GHz
Vega 8
min: 17 fps, P1: 19.3 fps, max: 38 fps
1.47.22.14 D3D12
AMD Ryzen 7 7730U 2GHz
Vega 8
min: 6.1 fps, P1: 7.58 fps, max: 229 fps
1.47.22.14 D3D12
AMD Ryzen 7 7730U 2GHz
Vega 8
min: 8.6 fps, P1: 10.4 fps, max: 182.3 fps
1.47.22.14 D3D12
AMD Ryzen 7 5700U 1.8GHz
Vega 8
min: 18.1 fps, P1: 19.6 fps, max: 40 fps
1.47.22.14 D3D12
AMD Ryzen 7 PRO 5850U 1.9GHz
Vega 8
min: 18.4 fps, P1: 19.6 fps, max: 46.1 fps
1.47.22.14 D3D12
AMD Ryzen 7 5800H 3.2GHz
Vega 8
min: 18.1 fps, P1: 19.6 fps, max: 41 fps
1.47.22.14 D3D12
AMD Ryzen 7 PRO 5850U 1.9GHz
Vega 8
min: 18 fps, P1: 19.8 fps, max: 40.3 fps
1.47.22.14 D3D12
AMD Ryzen 7 PRO 5750G 3.8GHz
Vega 8
min: 20.9 fps, P1: 21.7 fps, max: 35.6 fps
1.47.22.14 D3D12
AMD Ryzen 9 5900HX 3.3GHz
Vega 8
min: 15.6 fps, P1: 18.4 fps, max: 145.8 fps
1.47.22.14 D3D12
AMD Ryzen 7 5800H 3.2GHz
Vega 8
min: 19.7 fps, P1: 22.4 fps, max: 42.9 fps
1.47.22.14 D3D12
AMD Ryzen 9 5900HX 3.3GHz
Vega 8
min: 21.3 fps, P1: 22.3 fps, max: 38.1 fps
1.47.22.14 D3D12
AMD Ryzen 9 5900HX 3.3GHz
Vega 8
min: 21.9 fps, P1: 22.5 fps, max: 39 fps
1.47.22.14 D3D12
Intel Core i5-1240P 1.2GHz
Iris Xe G7 80EUs
min: 5 fps, P1: 5.72 fps, max: 217 fps
1.47.22.14 D3D12
Intel Core i5-1335U 0.9GHz
Iris Xe G7 80EUs
min: 5 fps, P1: 5 fps, max: 279 fps
1.47.22.14 D3D12
AMD Ryzen 9 5900HX 3.3GHz
Vega 8
min: 13 fps, P1: 13.5 fps, max: 21.8 fps
1.47.22.14 D3D12
AMD Ryzen 9 5900HX 3.3GHz
Vega 8
min: 12.7 fps, P1: 13.3 fps, max: 22.6 fps
1.47.22.14 D3D12
AMD Ryzen 7 PRO 5850U 1.9GHz
Vega 8
min: 13 fps, P1: 13.7 fps, max: 24.6 fps
1.47.22.14 D3D12
AMD Ryzen 9 5900HX 3.3GHz
Vega 8
min: 15.1 fps, P1: 15.7 fps, max: 22.6 fps
1.47.22.14 D3D12
AMD Ryzen 9 5900HX 3.3GHz
Vega 8
min: 6.6 fps, P1: 7.12 fps, max: 10.4 fps
1.47.22.14 D3D12
AMD Ryzen 7 PRO 5850U 1.9GHz
Vega 8
min: 7.1 fps, P1: 7.25 fps, max: 11.3 fps
1.47.22.14 D3D12
AMD Ryzen 9 5900HX 3.3GHz
Vega 8
min: 8 fps, P1: 8.6 fps, max: 12.1 fps

F1 2018
2018
Monster Hunter World
2018
Far Cry 5
2018Intel Core i5-1135G7 2.4GHz
Iris Xe G7 80EUs
min: 7 fps, max: 30 fps
Intel Core i5-1135G7 2.4GHz
Iris Xe G7 80EUs
min: 23 fps, max: 37 fps
Intel Core i5-1240P 1.2GHz
Iris Xe G7 80EUs
min: 22 fps, max: 34 fps
Intel Core i5-1135G7 2.4GHz
Iris Xe G7 80EUs
min: 29 fps, max: 41 fps
Intel Core i5-1335U 0.9GHz
Iris Xe G7 80EUs
min: 35 fps, max: 46 fps
Intel Core i5-1135G7 2.4GHz
Iris Xe G7 80EUs
min: 36 fps, max: 50 fps
Intel Core i5-1135G7 2.4GHz
Iris Xe G7 80EUs
min: 38 fps, max: 54 fps
Intel Core i5-1145G7 2.6GHz
Iris Xe G7 80EUs
min: 28 fps, max: 60 fps
Intel Core i5-1245U 1.2GHz
Iris Xe G7 80EUs
min: 46 fps, max: 57 fps
Intel Core i5-1135G7 2.4GHz
Iris Xe G7 80EUs
min: 43 fps, max: 66 fps
Intel Core i5-13500H 1.9GHz
Iris Xe G7 80EUs
min: 57 fps, max: 71 fps
Intel Core i5-1240P 1.2GHz
Iris Xe G7 80EUs
min: 7 fps, max: 16 fps
Intel Core i5-1135G7 2.4GHz
Iris Xe G7 80EUs
min: 16 fps, max: 22 fps
Intel Core i5-1335U 0.9GHz
Iris Xe G7 80EUs
min: 18 fps, max: 23 fps
Intel Core i5-1135G7 2.4GHz
Iris Xe G7 80EUs
min: 20 fps, max: 27 fps
Intel Core i5-1135G7 2.4GHz
Iris Xe G7 80EUs
min: 21 fps, max: 28 fps
Intel Core i5-1135G7 2.4GHz
Iris Xe G7 80EUs
min: 24 fps, max: 31 fps
Intel Core i5-1145G7 2.6GHz
Iris Xe G7 80EUs
min: 24 fps, max: 31 fps
Intel Core i5-1245U 1.2GHz
Iris Xe G7 80EUs
min: 23 fps, max: 32 fps
Intel Core i5-13500H 1.9GHz
Iris Xe G7 80EUs
min: 27 fps, max: 37 fps
Intel Core i5-1240P 1.2GHz
Iris Xe G7 80EUs
min: 10 fps, max: 15 fps
Intel Core i5-1135G7 2.4GHz
Iris Xe G7 80EUs
min: 15 fps, max: 20 fps
Intel Core i5-1335U 0.9GHz
Iris Xe G7 80EUs
min: 16 fps, max: 22 fps
Intel Core i5-1135G7 2.4GHz
Iris Xe G7 80EUs
min: 19 fps, max: 26 fps
Intel Core i5-1135G7 2.4GHz
Iris Xe G7 80EUs
min: 20 fps, max: 30 fps
Intel Core i5-1135G7 2.4GHz
Iris Xe G7 80EUs
min: 20 fps, max: 29 fps
Intel Core i5-1245U 1.2GHz
Iris Xe G7 80EUs
min: 21 fps, max: 30 fps
Intel Core i5-1145G7 2.6GHz
Iris Xe G7 80EUs
min: 22 fps, max: 31 fps
Intel Core i5-13500H 1.9GHz
Iris Xe G7 80EUs
min: 25 fps, max: 34 fps
Intel Core i5-1240P 1.2GHz
Iris Xe G7 80EUs
min: 9 fps, max: 14 fps
Intel Core i5-1135G7 2.4GHz
Iris Xe G7 80EUs
min: 14 fps, max: 18 fps
Intel Core i5-1335U 0.9GHz
Iris Xe G7 80EUs
min: 15 fps, max: 20 fps
Intel Core i5-1135G7 2.4GHz
Iris Xe G7 80EUs
min: 17 fps, max: 23 fps
Intel Core i5-1135G7 2.4GHz
Iris Xe G7 80EUs
min: 18 fps, max: 25 fps
Intel Core i5-13500H 1.9GHz
Iris Xe G7 80EUs
min: 24 fps, max: 32 fps

X-Plane 11.11
2018Intel Core 5 220H 2GHz
Iris Xe G7 80EUs
Problem during benchmarking occured: game wont start
Hoechstleistung
Intel Core i5-1135G7 2.4GHz
Iris Xe G7 80EUs
Hoechstleistung
Intel Core i5-1135G7 2.4GHz
Iris Xe G7 80EUs
Hoechstleistung
Intel Core i5-1135G7 2.4GHz
Iris Xe G7 80EUs

1.3, Hoechstleistung
Intel Core i5-1135G7 2.4GHz
Iris Xe G7 80EUs
Intel Core i5-1240P 1.2GHz
Iris Xe G7 80EUs
Problem during benchmarking occured: game wont start crash
1.3
Intel Core i5-1135G7 2.4GHz
Iris Xe G7 80EUs
Problem during benchmarking occured: high texture details and antialiasing not available
1.3
Intel Core i5-1135G7 2.4GHz
Iris Xe G7 80EUs
Problem during benchmarking occured: severe graphical problems
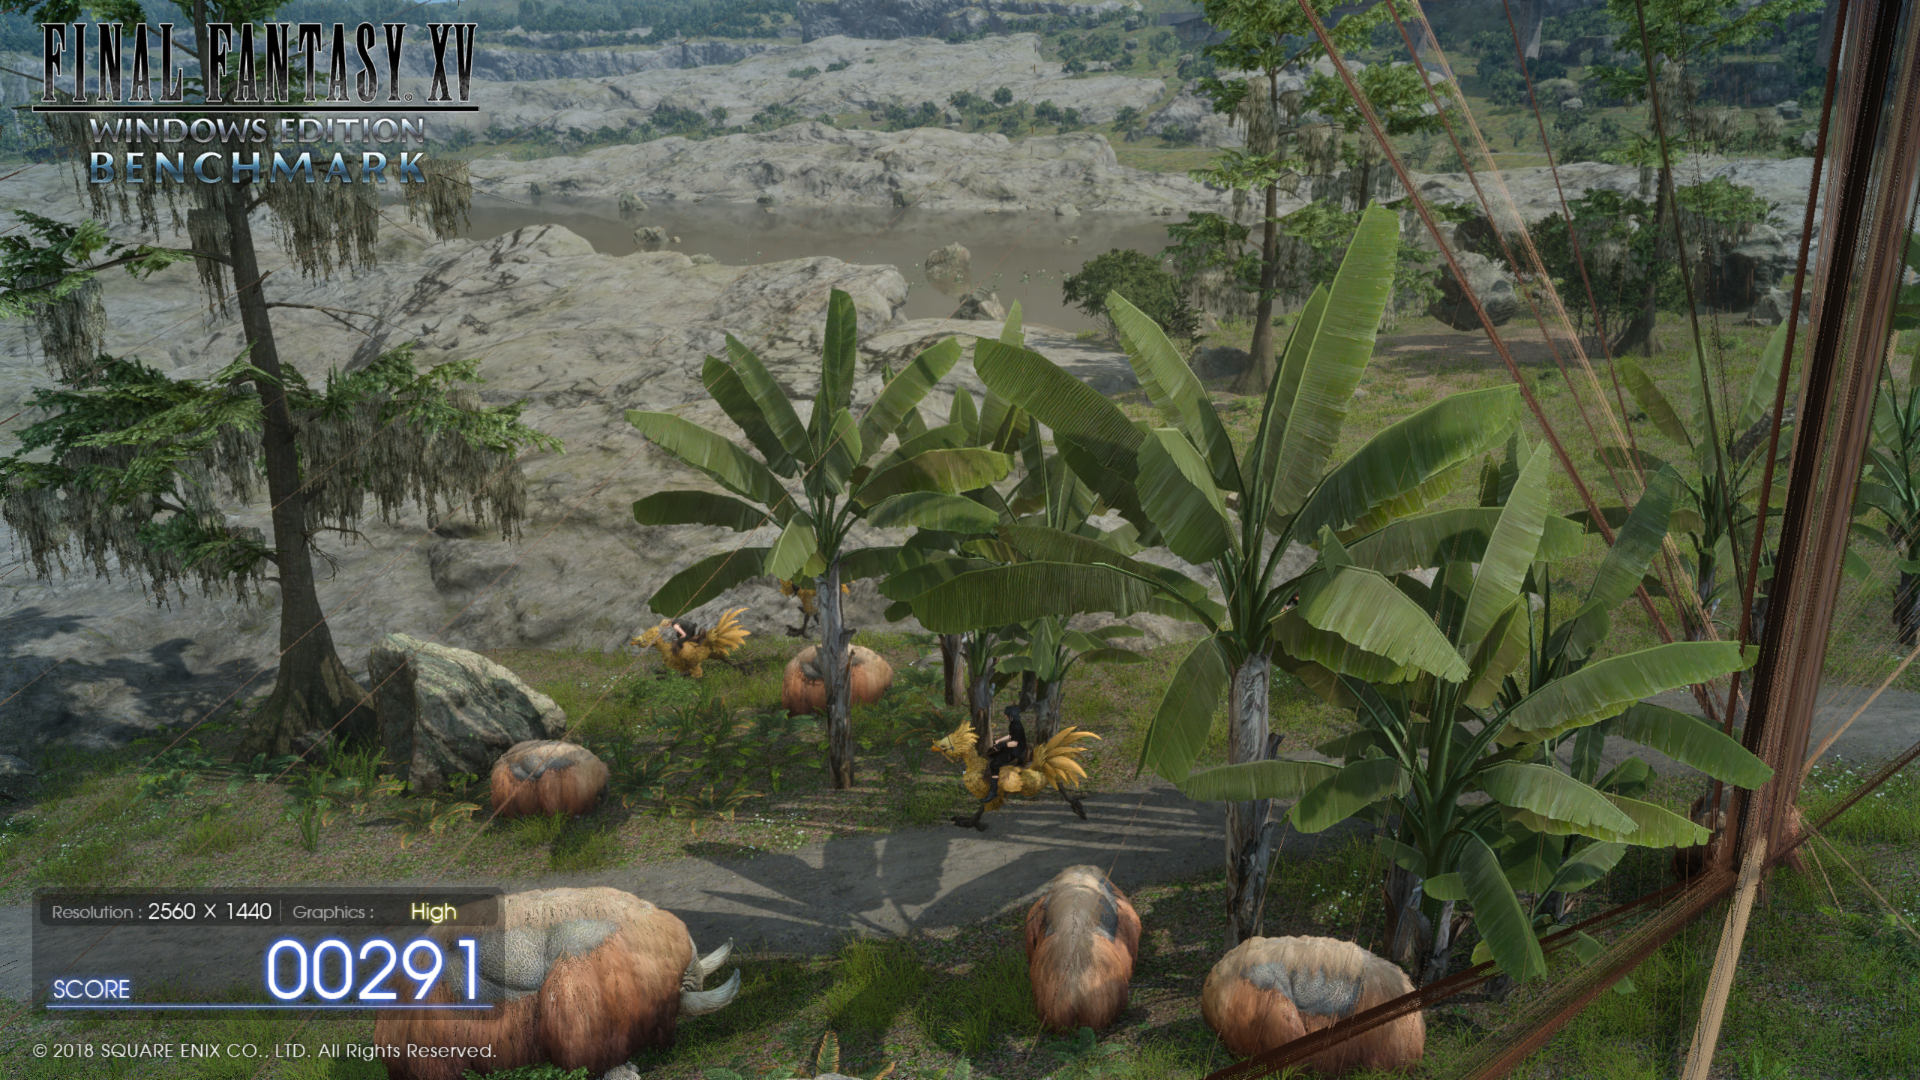

Fortnite
2018
Rocket League
2017AMD Ryzen 9 5900HX 3.3GHz
Vega 8
min: 1.17 fps, P0.1: 3.53 fps, P1: 19.5 fps, max: 599 fps
AMD Ryzen 9 5900HX 3.3GHz
Vega 8
min: 16.9 fps, P0.1: 18.5 fps, P1: 19.5 fps, max: 594 fps
AMD Ryzen 9 5900HX 3.3GHz
Vega 8
min: 10.2 fps, P0.1: 11.4 fps, P1: 11.7 fps, max: 463 fps
AMD Ryzen 9 5900HX 3.3GHz
Vega 8
min: 7.67 fps, P0.1: 7.82 fps, P1: 8.11 fps, max: 428 fps
AMD Ryzen 9 5900HX 3.3GHz
Vega 8
min: 4.15 fps, P0.1: 4.2 fps, P1: 4.36 fps, max: 336 fps

Overwatch
2016

AMD Ryzen 9 5900HX 3.3GHz
Vega 8
min: 37.9 fps, P0.1: 39 fps, P1: 41.4 fps, max: 56.1 fps
AMD Ryzen 7 5700G 3.8GHz
Vega 8
min: 49 fps, P0.1: 50.4 fps, P1: 52.2 fps, max: 68.3 fps
AMD Ryzen 7 PRO 5750G 3.8GHz
Vega 8
min: 55.8 fps, P0.1: 56.5 fps, P1: 58 fps, max: 78 fps
AMD Ryzen 9 5900HX 3.3GHz
Vega 8
min: 28.9 fps, P0.1: 29.4 fps, P1: 30.6 fps, max: 38.6 fps
AMD Ryzen 7 5700G 3.8GHz
Vega 8
min: 32.4 fps, P0.1: 32.8 fps, P1: 35.6 fps, max: 45.1 fps
AMD Ryzen 7 PRO 5750G 3.8GHz
Vega 8
min: 36.3 fps, P0.1: 36.8 fps, P1: 39.2 fps, max: 50.3 fps
AMD Ryzen 9 5900HX 3.3GHz
Vega 8
min: 15.7 fps, P0.1: 15.8 fps, P1: 16.9 fps, max: 22.5 fps
AMD Ryzen 7 5700G 3.8GHz
Vega 8
min: 18.7 fps, P0.1: 19.2 fps, P1: 19.7 fps, max: 24.3 fps
AMD Ryzen 7 PRO 5750G 3.8GHz
Vega 8
min: 21.2 fps, P0.1: 21.5 fps, P1: 21.9 fps, max: 27.8 fps
AMD Ryzen 9 5900HX 3.3GHz
Vega 8
min: 13.6 fps, P0.1: 13.7 fps, P1: 14 fps, max: 18.4 fps
AMD Ryzen 7 5700G 3.8GHz
Vega 8
min: 14.3 fps, P0.1: 14.5 fps, P1: 15.1 fps, max: 18.7 fps
AMD Ryzen 7 PRO 5750G 3.8GHz
Vega 8
min: 16.5 fps, P0.1: 16.5 fps, P1: 16.8 fps, max: 21.2 fps

Metal Gear Solid V
2015Dota 2 Reborn
2015Intel Core i7-1250U 0.8GHz
Iris Xe G7 80EUs
min: -20.9 fps, max: -1 fps
Intel Core i5-1240P 1.2GHz
Iris Xe G7 80EUs
min: 33.6 fps, max: -1 fps
Intel Core i5-1135G7 2.4GHz
Iris Xe G7 80EUs
min: 51.1 fps, max: -1 fps
Intel Core i5-1135G7 2.4GHz
Iris Xe G7 80EUs
min: 50.7 fps, max: -1 fps
Intel Core i5-1135G7 2.4GHz
Iris Xe G7 80EUs
min: 53 fps, max: -1 fps
Intel Core i5-1135G7 2.4GHz
Iris Xe G7 80EUs
min: 45.8 fps, max: -1 fps
Intel Core i5-1135G7 2.4GHz
Iris Xe G7 80EUs
min: 48.4 fps, max: -1 fps
Intel Core i5-1135G7 2.4GHz
Iris Xe G7 80EUs
min: 48.4 fps, max: -1 fps
Intel Core i5-1135G7 2.4GHz
Iris Xe G7 80EUs
min: 51.2 fps, max: -1 fps
Intel Core i5-1135G7 2.4GHz
Iris Xe G7 80EUs
min: 48.9 fps, max: -1 fps
Intel Core i5-1135G7 2.4GHz
Iris Xe G7 80EUs
min: 47.1 fps, max: -1 fps
Intel Core i5-1135G7 2.4GHz
Iris Xe G7 80EUs
min: 68.8 fps, max: -1 fps
Intel Core i5-1240P 1.2GHz
Iris Xe G7 80EUs
min: 59.8 fps, max: -1 fps
Intel Core i5-1135G7 2.4GHz
Iris Xe G7 80EUs
min: 54.3 fps, max: -1 fps
Intel Core i5-1135G7 2.4GHz
Iris Xe G7 80EUs
min: 44.4 fps, max: -1 fps
Intel Core i5-1135G7 2.4GHz
Iris Xe G7 80EUs
min: 51.3 fps, max: -1 fps
Intel Core i5-1135G7 2.4GHz
Iris Xe G7 80EUs
min: 50.5 fps, max: -1 fps
Intel Core i5-1135G7 2.4GHz
Iris Xe G7 80EUs
min: 50.6 fps, max: -1 fps
Hoechstleistung
Intel Core i5-1135G7 2.4GHz
Iris Xe G7 80EUs
min: 53.3 fps, max: -1 fps
Intel Core i5-1135G7 2.4GHz
Iris Xe G7 80EUs
min: 51.3 fps, max: -1 fps
Intel Core i5-1135G7 2.4GHz
Iris Xe G7 80EUs
min: 48.6 fps, max: -1 fps
Intel Core i5-1135G7 2.4GHz
Iris Xe G7 80EUs
min: 46.5 fps, max: -1 fps
Intel Core i5-1135G7 2.4GHz
Iris Xe G7 80EUs
min: 44.8 fps, max: -1 fps
Intel Core i5-1135G7 2.4GHz
Iris Xe G7 80EUs
min: 49.7 fps, max: -1 fps
Intel Core i5-1135G7 2.4GHz
Iris Xe G7 80EUs
min: 75.6 fps, max: -1 fps
Intel Core i5-1130G7 1.8GHz
Iris Xe G7 80EUs
min: 50.6 fps, max: -1 fps
Intel Core i5-1135G7 2.4GHz
Iris Xe G7 80EUs
min: 53.6 fps, max: -1 fps
Intel Core i5-1135G7 2.4GHz
Iris Xe G7 80EUs
min: 52.7 fps, max: -1 fps
Intel Core i5-1135G7 2.4GHz
Iris Xe G7 80EUs
min: 46.3 fps, max: -1 fps
Intel Core i5-1135G7 2.4GHz
Iris Xe G7 80EUs
min: 75.5 fps, max: -1 fps
Intel Core i5-1135G7 2.4GHz
Iris Xe G7 80EUs
min: 45.2 fps, max: -1 fps
Intel Core i5-1135G7 2.4GHz
Iris Xe G7 80EUs
min: 46.9 fps, max: -1 fps
Intel Core i5-1135G7 2.4GHz
Iris Xe G7 80EUs
min: 53.7 fps, max: -1 fps
Intel Core i5-1135G7 2.4GHz
Iris Xe G7 80EUs
min: 51.6 fps, max: -1 fps
Intel Core i5-1335U 0.9GHz
Iris Xe G7 80EUs
min: 68.7 fps, max: -1 fps
Intel Core i5-1140G7 1.8GHz
Iris Xe G7 80EUs
min: 77.5 fps, max: -1 fps
Dual-Channel
Intel Core i5-1135G7 2.4GHz
Iris Xe G7 80EUs
min: 74.5 fps, max: -1 fps
Intel Core i5-1235U 0.9GHz
Iris Xe G7 80EUs
min: 71.6 fps, max: -1 fps
Intel Core i5-1334U 0.9GHz
Iris Xe G7 80EUs
min: 56.6 fps, max: -1 fps
Intel Core i5-1335U 0.9GHz
Iris Xe G7 80EUs
min: 70.7 fps, max: -1 fps
Intel Core i5-1250P 1.2GHz
Iris Xe G7 80EUs
min: 73.5 fps, max: -1 fps
Intel Core i5-1335U 0.9GHz
Iris Xe G7 80EUs
min: 73.7 fps, max: -1 fps
Intel Core i5-1235U 0.9GHz
Iris Xe G7 80EUs
min: 67.3 fps, max: -1 fps
Intel Core i5-1345U 1.2GHz
Iris Xe G7 80EUs
min: 77.5 fps, max: -1 fps
Intel Core i5-1240P 1.2GHz
Iris Xe G7 80EUs
min: 69.8 fps, max: -1 fps
Intel Core i5-1240P 1.2GHz
Iris Xe G7 80EUs
min: 82.2 fps, max: -1 fps
Intel Core i5-1335U 0.9GHz
Iris Xe G7 80EUs
min: 81 fps, max: -1 fps
Intel Core i5-1240U 0.8GHz
Iris Xe G7 80EUs
min: 78.4 fps, max: -1 fps
Intel Core i5-1340P 1.4GHz
Iris Xe G7 80EUs
min: 72.8 fps, max: -1 fps
Intel Core i5-1335U 0.9GHz
Iris Xe G7 80EUs
min: 80.4 fps, max: -1 fps
Intel Core i5-1230U 0.7GHz
Iris Xe G7 80EUs
min: 80.9 fps, max: -1 fps
Dual-Channel
Intel Core i5-1135G7 2.4GHz
Iris Xe G7 80EUs
min: 91.6 fps, max: -1 fps
Intel Core i5-1135G7 2.4GHz
Iris Xe G7 80EUs
min: 93.3 fps, max: -1 fps
Intel Core i5-1335U 0.9GHz
Iris Xe G7 80EUs
min: 81.3 fps, max: -1 fps
Intel Core 5 120U 0.9GHz
Iris Xe G7 80EUs
min: 80.8 fps, max: -1 fps
Intel Core i5-1240P 1.2GHz
Iris Xe G7 80EUs
min: 8.2 fps, max: -1 fps
Intel Core i5-1240P 1.2GHz
Iris Xe G7 80EUs
min: 85.6 fps, max: -1 fps
Intel Core i5-1335U 0.9GHz
Iris Xe G7 80EUs
min: 81.8 fps, max: -1 fps
Intel Core i5-1335U 0.9GHz
Iris Xe G7 80EUs
min: 81.2 fps, max: -1 fps
Intel Core i5-1235U 0.9GHz
Iris Xe G7 80EUs
min: 86.7 fps, max: -1 fps
Intel Core i5-1335U 0.9GHz
Iris Xe G7 80EUs
min: 77.5 fps, max: -1 fps
Intel Core i5-1245U 1.2GHz
Iris Xe G7 80EUs
min: 89.3 fps, max: -1 fps
Intel Core i5-1235U 0.9GHz
Iris Xe G7 80EUs
min: 87 fps, max: -1 fps
Intel Core i5-1135G7 2.4GHz
Iris Xe G7 80EUs
min: 97.8 fps, max: -1 fps
Intel Core i5-1235U 0.9GHz
Iris Xe G7 80EUs
min: 89.6 fps, max: -1 fps
Intel Core i5-1155G7 2.5GHz
Iris Xe G7 80EUs
min: 103.7 fps, max: -1 fps
Intel Core i5-11300H 3.1GHz
Iris Xe G7 80EUs
min: 105.9 fps, max: -1 fps
Intel Core i5-1340P 1.4GHz
Iris Xe G7 80EUs
min: 88.6 fps, max: -1 fps
Intel Core i5-1135G7 2.4GHz
Iris Xe G7 80EUs
min: 104.7 fps, max: -1 fps
Intel Core i5-1135G7 2.4GHz
Iris Xe G7 80EUs
min: 102.6 fps, max: -1 fps
Intel Core i5-1145G7 2.6GHz
Iris Xe G7 80EUs
min: 110.4 fps, max: -1 fps
Intel Core i5-1155G7 2.5GHz
Iris Xe G7 80EUs
min: 112.8 fps, max: -1 fps
Intel Core i5-1240P 1.2GHz
Iris Xe G7 80EUs
min: 81.4 fps, max: -1 fps
Intel Core i5-12500H 1.8GHz
Iris Xe G7 80EUs
min: 81.4 fps, max: -1 fps
Intel Core i5-13500H 1.9GHz
Iris Xe G7 80EUs
min: 102.2 fps, max: -1 fps
AMD Ryzen 7 4980U 2GHz
Vega 8
min: 81.5 fps, max: -1 fps
Flüstermodus
AMD Ryzen 7 5700U 1.8GHz
Vega 8
min: 83.9 fps, max: -1 fps
Leistungsmodus
AMD Ryzen 7 5700U 1.8GHz
Vega 8
min: 85.7 fps, max: -1 fps
Leistungsmodus
AMD Ryzen 7 5700U 1.8GHz
Vega 8
min: 85.1 fps, max: -1 fps
AMD Ryzen 7 5700U 1.8GHz
Vega 8
min: 86.8 fps, max: -1 fps
Dual-Channel-Mode
AMD Ryzen 7 PRO 7730U 2GHz
Vega 8
min: 86.7 fps, max: -1 fps
Akkusparmodus
AMD Ryzen 9 5900HX @2GHz
Vega 8
min: 96.5 fps, max: -1 fps
Hoechstleistung
AMD Ryzen 9 5900HX 3.3GHz
Vega 8
min: 112.1 fps, max: -1 fps
AMD Ryzen 7 PRO 5750G 3.8GHz
Vega 8
min: 110.9 fps, max: -1 fps
Intel Core i5-1135G7 2.4GHz
Iris Xe G7 80EUs
min: 22.6 fps, max: -1 fps
Intel Core i5-1240P 1.2GHz
Iris Xe G7 80EUs
min: 33.9 fps, max: -1 fps
Intel Core i5-1135G7 2.4GHz
Iris Xe G7 80EUs
min: 30.4 fps, max: -1 fps
Intel Core i5-1135G7 2.4GHz
Iris Xe G7 80EUs
min: 26.3 fps, max: -1 fps
Intel Core i5-1135G7 2.4GHz
Iris Xe G7 80EUs
min: 26.3 fps, max: -1 fps
Intel Core i5-1135G7 2.4GHz
Iris Xe G7 80EUs
min: 34.3 fps, max: -1 fps
Intel Core i5-1135G7 2.4GHz
Iris Xe G7 80EUs
min: 32.2 fps, max: -1 fps
Intel Core i5-1135G7 2.4GHz
Iris Xe G7 80EUs
min: 38 fps, max: -1 fps
Intel Core i5-1135G7 2.4GHz
Iris Xe G7 80EUs
min: 28.9 fps, max: -1 fps
Intel Core i5-1135G7 2.4GHz
Iris Xe G7 80EUs
min: 40.6 fps, max: -1 fps
Intel Core i5-1135G7 2.4GHz
Iris Xe G7 80EUs
min: 35.9 fps, max: -1 fps
Intel Core i5-1135G7 2.4GHz
Iris Xe G7 80EUs
min: 43.7 fps, max: -1 fps
Intel Core i5-1135G7 2.4GHz
Iris Xe G7 80EUs
min: 44.7 fps, max: -1 fps
Intel Core i5-1135G7 2.4GHz
Iris Xe G7 80EUs
min: 38.6 fps, max: -1 fps
Intel Core i5-1240P 1.2GHz
Iris Xe G7 80EUs
min: 38.8 fps, max: -1 fps
Intel Core i5-1135G7 2.4GHz
Iris Xe G7 80EUs
min: 42.7 fps, max: -1 fps
Intel Core i5-1135G7 2.4GHz
Iris Xe G7 80EUs
min: 37.5 fps, max: -1 fps
Intel Core i5-1135G7 2.4GHz
Iris Xe G7 80EUs
min: 40.8 fps, max: -1 fps
Intel Core i5-1135G7 2.4GHz
Iris Xe G7 80EUs
min: 44.1 fps, max: -1 fps
Intel Core i5-1235U 0.9GHz
Iris Xe G7 80EUs
min: 46.9 fps, max: -1 fps
Intel Core i5-1135G7 2.4GHz
Iris Xe G7 80EUs
min: 48.1 fps, max: -1 fps
Intel Core i5-1135G7 2.4GHz
Iris Xe G7 80EUs
min: 36 fps, max: -1 fps
Intel Core i5-1335U 0.9GHz
Iris Xe G7 80EUs
min: 48.1 fps, max: -1 fps
Intel Core i5-1135G7 2.4GHz
Iris Xe G7 80EUs
min: 41.1 fps, max: -1 fps
Intel Core i5-1235U 0.9GHz
Iris Xe G7 80EUs
min: 49.4 fps, max: -1 fps
Intel Core i5-1135G7 2.4GHz
Iris Xe G7 80EUs
min: 50.1 fps, max: -1 fps
Intel Core i5-1135G7 2.4GHz
Iris Xe G7 80EUs
min: 53.2 fps, max: -1 fps
Intel Core i5-1130G7 1.8GHz
Iris Xe G7 80EUs
min: 42.7 fps, max: -1 fps
Intel Core i5-1140G7 1.8GHz
Iris Xe G7 80EUs
min: 50.4 fps, max: -1 fps
Intel Core i5-1250P 1.2GHz
Iris Xe G7 80EUs
min: 48.7 fps, max: -1 fps
Intel Core i5-1335U 0.9GHz
Iris Xe G7 80EUs
min: 52.4 fps, max: -1 fps
Intel Core i5-1240P 1.2GHz
Iris Xe G7 80EUs
min: 49.8 fps, max: -1 fps
Intel Core i5-1240P 1.2GHz
Iris Xe G7 80EUs
min: 54.7 fps, max: -1 fps
Intel Core i5-1135G7 2.4GHz
Iris Xe G7 80EUs
min: 48.8 fps, max: -1 fps
Intel Core i5-1345U 1.2GHz
Iris Xe G7 80EUs
min: 54 fps, max: -1 fps
Hoechstleistung
Intel Core i5-1135G7 2.4GHz
Iris Xe G7 80EUs
min: 53.1 fps, max: -1 fps
Dual-Channel
Intel Core i5-1135G7 2.4GHz
Iris Xe G7 80EUs
min: 59.4 fps, max: -1 fps
Dual-Channel
Intel Core i5-1135G7 2.4GHz
Iris Xe G7 80EUs
min: 60.1 fps, max: -1 fps
Intel Core i5-1135G7 2.4GHz
Iris Xe G7 80EUs
min: 46.5 fps, max: -1 fps
Intel Core i5-1335U 0.9GHz
Iris Xe G7 80EUs
min: 55.1 fps, max: -1 fps
Intel Core i5-1335U 0.9GHz
Iris Xe G7 80EUs
min: 59 fps, max: -1 fps
Intel Core i5-1135G7 2.4GHz
Iris Xe G7 80EUs
min: 53.4 fps, max: -1 fps
Intel Core i5-1135G7 2.4GHz
Iris Xe G7 80EUs
min: 47.6 fps, max: -1 fps
Intel Core i5-1135G7 2.4GHz
Iris Xe G7 80EUs
min: 46.5 fps, max: -1 fps
Intel Core i5-1335U 0.9GHz
Iris Xe G7 80EUs
min: 53.6 fps, max: -1 fps
Intel Core i5-1135G7 2.4GHz
Iris Xe G7 80EUs
min: 55.2 fps, max: -1 fps
Intel Core i5-1135G7 2.4GHz
Iris Xe G7 80EUs
min: 45.2 fps, max: -1 fps
Intel Core i5-1335U 0.9GHz
Iris Xe G7 80EUs
min: 59.4 fps, max: -1 fps
Intel Core i5-1135G7 2.4GHz
Iris Xe G7 80EUs
min: 59.8 fps, max: -1 fps
Intel Core i5-1335U 0.9GHz
Iris Xe G7 80EUs
min: 61.2 fps, max: -1 fps
Intel Core i5-1230U 0.7GHz
Iris Xe G7 80EUs
min: 62.3 fps, max: -1 fps
Intel Core i5-1240U 0.8GHz
Iris Xe G7 80EUs
min: 61.8 fps, max: -1 fps
Intel Core i5-1135G7 2.4GHz
Iris Xe G7 80EUs
min: 52.5 fps, max: -1 fps
Intel Core i5-1240P 1.2GHz
Iris Xe G7 80EUs
min: 62 fps, max: -1 fps
Intel Core i5-1240P 1.2GHz
Iris Xe G7 80EUs
min: 59.9 fps, max: -1 fps
Intel Core i5-1335U 0.9GHz
Iris Xe G7 80EUs
min: 63.1 fps, max: -1 fps
Intel Core i5-1340P 1.4GHz
Iris Xe G7 80EUs
min: 62.3 fps, max: -1 fps
Intel Core i5-1335U 0.9GHz
Iris Xe G7 80EUs
min: 64 fps, max: -1 fps
Intel Core i5-1235U 0.9GHz
Iris Xe G7 80EUs
min: 65 fps, max: -1 fps
Intel Core i5-1235U 0.9GHz
Iris Xe G7 80EUs
min: 70.2 fps, max: -1 fps
Intel Core i5-1235U 0.9GHz
Iris Xe G7 80EUs
min: 69.6 fps, max: -1 fps
Intel Core i5-1135G7 2.4GHz
Iris Xe G7 80EUs
min: 73.6 fps, max: -1 fps
Intel Core i5-1340P 1.4GHz
Iris Xe G7 80EUs
min: 69.1 fps, max: -1 fps
Intel Core i5-1145G7 2.6GHz
Iris Xe G7 80EUs
min: 72.3 fps, max: -1 fps
Intel Core i5-1245U 1.2GHz
Iris Xe G7 80EUs
min: 72.1 fps, max: -1 fps
Intel Core i5-11300H 3.1GHz
Iris Xe G7 80EUs
min: 76.5 fps, max: -1 fps
Intel Core i5-1155G7 2.5GHz
Iris Xe G7 80EUs
min: 86.8 fps, max: -1 fps
Intel Core i5-13500H 1.9GHz
Iris Xe G7 80EUs
min: 78.4 fps, max: -1 fps
Intel Core i5-1135G7 2.4GHz
Iris Xe G7 80EUs
min: 96.8 fps, max: -1 fps
Intel Core i5-1155G7 2.5GHz
Iris Xe G7 80EUs
min: 103 fps, max: -1 fps
Intel Core i5-1240P 1.2GHz
Iris Xe G7 80EUs
min: 103.4 fps, max: -1 fps
Intel Core i5-12500H 1.8GHz
Iris Xe G7 80EUs
min: 103.4 fps, max: -1 fps
AMD Ryzen 7 4980U 2GHz
Vega 8
min: 65.9 fps, max: -1 fps
Flüstermodus
AMD Ryzen 7 5700U 1.8GHz
Vega 8
min: 67.5 fps, max: -1 fps
AMD Ryzen 7 5700U 1.8GHz
Vega 8
min: 66.3 fps, max: -1 fps
Leistungsmodus
AMD Ryzen 7 5700U 1.8GHz
Vega 8
min: 69.4 fps, max: -1 fps
Leistungsmodus
AMD Ryzen 7 5700U 1.8GHz
Vega 8
min: 69.7 fps, max: -1 fps
Akkusparmodus
AMD Ryzen 9 5900HX @2GHz
Vega 8
min: 75.4 fps, max: -1 fps
Dual-Channel-Mode
AMD Ryzen 7 PRO 7730U 2GHz
Vega 8
min: 73 fps, max: -1 fps
Hoechstleistung
AMD Ryzen 9 5900HX 3.3GHz
Vega 8
min: 88.4 fps, max: -1 fps
Intel Core i7-1250U 0.8GHz
Iris Xe G7 80EUs
min: -1.6 fps, max: -1 fps
Intel Core i5-1135G7 2.4GHz
Iris Xe G7 80EUs
min: 16.9 fps, max: -1 fps
Intel Core i5-1135G7 2.4GHz
Iris Xe G7 80EUs
min: 21.3 fps, max: -1 fps
Intel Core i5-1135G7 2.4GHz
Iris Xe G7 80EUs
min: 15.8 fps, max: -1 fps
Intel Core i5-1135G7 2.4GHz
Iris Xe G7 80EUs
min: 18.4 fps, max: -1 fps
Intel Core i5-1135G7 2.4GHz
Iris Xe G7 80EUs
min: 23.7 fps, max: -1 fps
Intel Core i5-1135G7 2.4GHz
Iris Xe G7 80EUs
min: 24.5 fps, max: -1 fps
Intel Core i5-1135G7 2.4GHz
Iris Xe G7 80EUs
min: 21.1 fps, max: -1 fps
Intel Core i5-1135G7 2.4GHz
Iris Xe G7 80EUs
min: 21.1 fps, max: -1 fps
Intel Core i5-1135G7 2.4GHz
Iris Xe G7 80EUs
min: 22 fps, max: -1 fps
Intel Core i5-1135G7 2.4GHz
Iris Xe G7 80EUs
min: 18 fps, max: -1 fps
Intel Core i5-1135G7 2.4GHz
Iris Xe G7 80EUs
min: 23.8 fps, max: -1 fps
Intel Core i5-1135G7 2.4GHz
Iris Xe G7 80EUs
min: 20.5 fps, max: -1 fps
Intel Core i5-1135G7 2.4GHz
Iris Xe G7 80EUs
min: 21.9 fps, max: -1 fps
Intel Core i5-1240P 1.2GHz
Iris Xe G7 80EUs
min: 33 fps, max: -1 fps
Intel Core i5-1240P 1.2GHz
Iris Xe G7 80EUs
min: 31.9 fps, max: -1 fps
Intel Core i5-1135G7 2.4GHz
Iris Xe G7 80EUs
min: 26.2 fps, max: -1 fps
Intel Core i5-1135G7 2.4GHz
Iris Xe G7 80EUs
min: 26.2 fps, max: -1 fps
Intel Core i5-1135G7 2.4GHz
Iris Xe G7 80EUs
min: 26.1 fps, max: -1 fps
Intel Core i5-1250P 1.2GHz
Iris Xe G7 80EUs
min: 32.7 fps, max: -1 fps
Intel Core i5-1135G7 2.4GHz
Iris Xe G7 80EUs
min: 26.7 fps, max: -1 fps
Intel Core i5-1235U 0.9GHz
Iris Xe G7 80EUs
min: 32.9 fps, max: -1 fps
Intel Core i5-1230U 0.7GHz
Iris Xe G7 80EUs
min: 35 fps, max: -1 fps
Intel Core i5-1335U 0.9GHz
Iris Xe G7 80EUs
min: 35.1 fps, max: -1 fps
Intel Core i5-1135G7 2.4GHz
Iris Xe G7 80EUs
min: 27.5 fps, max: -1 fps
Hoechstleistung
Intel Core i5-1135G7 2.4GHz
Iris Xe G7 80EUs
min: 22.7 fps, max: -1 fps
Dual-Channel
Intel Core i5-1135G7 2.4GHz
Iris Xe G7 80EUs
min: 35.3 fps, max: -1 fps
Intel Core i5-1130G7 1.8GHz
Iris Xe G7 80EUs
min: 16.5 fps, max: -1 fps
Intel Core i5-1335U 0.9GHz
Iris Xe G7 80EUs
min: 36.1 fps, max: -1 fps
Intel Core i5-1135G7 2.4GHz
Iris Xe G7 80EUs
min: 27.4 fps, max: -1 fps
Intel Core i5-1140G7 1.8GHz
Iris Xe G7 80EUs
min: 36.5 fps, max: -1 fps
Intel Core i5-1135G7 2.4GHz
Iris Xe G7 80EUs
min: 21.5 fps, max: -1 fps
Intel Core i5-1135G7 2.4GHz
Iris Xe G7 80EUs
min: 24.5 fps, max: -1 fps
Intel Core i5-1135G7 2.4GHz
Iris Xe G7 80EUs
min: 35.7 fps, max: -1 fps
Intel Core i5-1135G7 2.4GHz
Iris Xe G7 80EUs
min: 30.7 fps, max: -1 fps
Dual-Channel
Intel Core i5-1135G7 2.4GHz
Iris Xe G7 80EUs
min: 39.3 fps, max: -1 fps
Intel Core i5-1240P 1.2GHz
Iris Xe G7 80EUs
min: 37 fps, max: -1 fps
Intel Core i5-1335U 0.9GHz
Iris Xe G7 80EUs
min: 39.5 fps, max: -1 fps
Intel Core i5-1235U 0.9GHz
Iris Xe G7 80EUs
min: 42.6 fps, max: -1 fps
Intel Core i5-1135G7 2.4GHz
Iris Xe G7 80EUs
min: 29.7 fps, max: -1 fps
Intel Core i5-1235U 0.9GHz
Iris Xe G7 80EUs
min: 36.6 fps, max: -1 fps
Intel Core i5-1135G7 2.4GHz
Iris Xe G7 80EUs
min: 22.1 fps, max: -1 fps
Intel Core i5-1235U 0.9GHz
Iris Xe G7 80EUs
min: 42.1 fps, max: -1 fps
Intel Core i5-1240P 1.2GHz
Iris Xe G7 80EUs
min: 42.8 fps, max: -1 fps
Intel Core i5-1235U 0.9GHz
Iris Xe G7 80EUs
min: 42.7 fps, max: -1 fps
Intel Core i5-1235U 0.9GHz
Iris Xe G7 80EUs
min: 43.5 fps, max: -1 fps
Intel Core i5-1135G7 2.4GHz
Iris Xe G7 80EUs
min: 23.2 fps, max: -1 fps
Intel Core i5-1135G7 2.4GHz
Iris Xe G7 80EUs
min: 33.3 fps, max: -1 fps
Intel Core i5-1335U 0.9GHz
Iris Xe G7 80EUs
min: 42.5 fps, max: -1 fps
Intel Core i5-1335U 0.9GHz
Iris Xe G7 80EUs
min: 45.6 fps, max: -1 fps
Intel Core i5-1135G7 2.4GHz
Iris Xe G7 80EUs
min: 31.3 fps, max: -1 fps
Intel Core i5-1245U 1.2GHz
Iris Xe G7 80EUs
min: 46.3 fps, max: -1 fps
Intel Core i5-1135G7 2.4GHz
Iris Xe G7 80EUs
min: 24.3 fps, max: -1 fps
Intel Core i5-1240U 0.8GHz
Iris Xe G7 80EUs
min: 46.9 fps, max: -1 fps
Intel Core i5-1135G7 2.4GHz
Iris Xe G7 80EUs
min: 15.6 fps, max: -1 fps
Intel Core i5-1345U 1.2GHz
Iris Xe G7 80EUs
min: 44.5 fps, max: -1 fps
Intel Core i5-1335U 0.9GHz
Iris Xe G7 80EUs
min: 43.3 fps, max: -1 fps
Intel Core i5-1335U 0.9GHz
Iris Xe G7 80EUs
min: 44.9 fps, max: -1 fps
Intel Core i5-1145G7 2.6GHz
Iris Xe G7 80EUs
min: 46.5 fps, max: -1 fps
Intel Core i5-1340P 1.4GHz
Iris Xe G7 80EUs
min: 50.1 fps, max: -1 fps
Intel Core i5-11300H 3.1GHz
Iris Xe G7 80EUs
min: 46.9 fps, max: -1 fps
Intel Core 5 120U 0.9GHz
Iris Xe G7 80EUs
min: 49.2 fps, max: -1 fps
Intel Core i5-1135G7 2.4GHz
Iris Xe G7 80EUs
min: 52.8 fps, max: -1 fps
Intel Core i5-1240P 1.2GHz
Iris Xe G7 80EUs
min: 52.7 fps, max: -1 fps
Intel Core i5-1334U 0.9GHz
Iris Xe G7 80EUs
min: 37.4 fps, max: -1 fps
Intel Core i5-1135G7 2.4GHz
Iris Xe G7 80EUs
min: 52.5 fps, max: -1 fps
Intel Core i5-1155G7 2.5GHz
Iris Xe G7 80EUs
min: 53.7 fps, max: -1 fps
Intel Core i5-1335U 0.9GHz
Iris Xe G7 80EUs
min: 53.6 fps, max: -1 fps
Intel Core i5-1335U 0.9GHz
Iris Xe G7 80EUs
min: 57.4 fps, max: -1 fps
Intel Core i5-1155G7 2.5GHz
Iris Xe G7 80EUs
min: 55.1 fps, max: -1 fps
Intel Core i5-13500H 1.9GHz
Iris Xe G7 80EUs
min: 65.7 fps, max: -1 fps
Intel Core i5-1240P 1.2GHz
Iris Xe G7 80EUs
min: 59.6 fps, max: -1 fps
Intel Core i5-12500H 1.8GHz
Iris Xe G7 80EUs
min: 59.6 fps, max: -1 fps
Flüstermodus
AMD Ryzen 7 5700U 1.8GHz
Vega 8
min: 37.6 fps, max: -1 fps
Akkusparmodus
AMD Ryzen 9 5900HX @2GHz
Vega 8
min: 42.7 fps, max: -1 fps
Leistungsmodus
AMD Ryzen 7 5700U 1.8GHz
Vega 8
min: 42 fps, max: -1 fps
AMD Ryzen 7 5700U 1.8GHz
Vega 8
min: 44.2 fps, max: -1 fps
Leistungsmodus
AMD Ryzen 7 5700U 1.8GHz
Vega 8
min: 44.3 fps, max: -1 fps
AMD Ryzen 7 4980U 2GHz
Vega 8
min: 44.4 fps, max: -1 fps
Dual-Channel-Mode
AMD Ryzen 7 PRO 7730U 2GHz
Vega 8
min: 48.1 fps, max: -1 fps
Hoechstleistung
AMD Ryzen 9 5900HX 3.3GHz
Vega 8
min: 51.7 fps, max: -1 fps
Intel Core i5-1135G7 2.4GHz
Iris Xe G7 80EUs
min: 15.7 fps, max: -1 fps
Intel Core i5-1135G7 2.4GHz
Iris Xe G7 80EUs
min: 19.9 fps, max: -1 fps
Intel Core i5-1135G7 2.4GHz
Iris Xe G7 80EUs
min: 17.1 fps, max: -1 fps
Intel Core i5-1135G7 2.4GHz
Iris Xe G7 80EUs
min: 14.9 fps, max: -1 fps
Intel Core i5-1135G7 2.4GHz
Iris Xe G7 80EUs
min: 22.1 fps, max: -1 fps
Intel Core i5-1135G7 2.4GHz
Iris Xe G7 80EUs
min: 22.8 fps, max: -1 fps
Intel Core i5-1135G7 2.4GHz
Iris Xe G7 80EUs
min: 10.6 fps, max: -1 fps
Intel Core i5-1135G7 2.4GHz
Iris Xe G7 80EUs
min: 16.5 fps, max: -1 fps
Intel Core i5-1135G7 2.4GHz
Iris Xe G7 80EUs
min: 19.9 fps, max: -1 fps
Intel Core i5-1135G7 2.4GHz
Iris Xe G7 80EUs
min: 19.9 fps, max: -1 fps
Intel Core i5-1135G7 2.4GHz
Iris Xe G7 80EUs
min: 21.1 fps, max: -1 fps
Intel Core i5-1135G7 2.4GHz
Iris Xe G7 80EUs
min: 22.8 fps, max: -1 fps
Intel Core i5-1135G7 2.4GHz
Iris Xe G7 80EUs
min: 19.4 fps, max: -1 fps
Intel Core i5-1135G7 2.4GHz
Iris Xe G7 80EUs
min: 21.7 fps, max: -1 fps
Intel Core i5-1240P 1.2GHz
Iris Xe G7 80EUs
min: 29.2 fps, max: -1 fps
Intel Core i5-1250P 1.2GHz
Iris Xe G7 80EUs
min: 29 fps, max: -1 fps
Intel Core i5-1135G7 2.4GHz
Iris Xe G7 80EUs
min: 24.8 fps, max: -1 fps
Intel Core i5-1240P 1.2GHz
Iris Xe G7 80EUs
min: 32.3 fps, max: -1 fps
Intel Core i5-1135G7 2.4GHz
Iris Xe G7 80EUs
min: 24.1 fps, max: -1 fps
Intel Core i5-1230U 0.7GHz
Iris Xe G7 80EUs
min: 31.2 fps, max: -1 fps
Intel Core i5-1135G7 2.4GHz
Iris Xe G7 80EUs
min: 24.3 fps, max: -1 fps
Intel Core i5-1235U 0.9GHz
Iris Xe G7 80EUs
min: 30.1 fps, max: -1 fps
Intel Core i5-1335U 0.9GHz
Iris Xe G7 80EUs
min: 32.1 fps, max: -1 fps
Intel Core i5-1130G7 1.8GHz
Iris Xe G7 80EUs
min: 15.1 fps, max: -1 fps
Intel Core i5-1135G7 2.4GHz
Iris Xe G7 80EUs
min: 24.4 fps, max: -1 fps
Hoechstleistung
Intel Core i5-1135G7 2.4GHz
Iris Xe G7 80EUs
min: 20.3 fps, max: -1 fps
Dual-Channel
Intel Core i5-1135G7 2.4GHz
Iris Xe G7 80EUs
min: 32 fps, max: -1 fps
Intel Core i5-1140G7 1.8GHz
Iris Xe G7 80EUs
min: 31.3 fps, max: -1 fps
Intel Core i5-1135G7 2.4GHz
Iris Xe G7 80EUs
min: 16.5 fps, max: -1 fps
Intel Core i5-1135G7 2.4GHz
Iris Xe G7 80EUs
min: 25.5 fps, max: -1 fps
Intel Core i5-1335U 0.9GHz
Iris Xe G7 80EUs
min: 32.9 fps, max: -1 fps
Intel Core i5-1135G7 2.4GHz
Iris Xe G7 80EUs
min: 21.8 fps, max: -1 fps
Intel Core i5-1135G7 2.4GHz
Iris Xe G7 80EUs
min: 34.9 fps, max: -1 fps
Intel Core i5-1135G7 2.4GHz
Iris Xe G7 80EUs
min: 26.9 fps, max: -1 fps
Intel Core i5-1135G7 2.4GHz
Iris Xe G7 80EUs
min: 26 fps, max: -1 fps
Intel Core i5-1240P 1.2GHz
Iris Xe G7 80EUs
min: 32.6 fps, max: -1 fps
Intel Core i5-1135G7 2.4GHz
Iris Xe G7 80EUs
min: 23.4 fps, max: -1 fps
Intel Core i5-1235U 0.9GHz
Iris Xe G7 80EUs
min: 32.3 fps, max: -1 fps
Intel Core i5-1235U 0.9GHz
Iris Xe G7 80EUs
min: 39.3 fps, max: -1 fps
Dual-Channel
Intel Core i5-1135G7 2.4GHz
Iris Xe G7 80EUs
min: 36 fps, max: -1 fps
Intel Core i5-1135G7 2.4GHz
Iris Xe G7 80EUs
min: 20.4 fps, max: -1 fps
Intel Core i5-1235U 0.9GHz
Iris Xe G7 80EUs
min: 39.5 fps, max: -1 fps
Intel Core i5-1235U 0.9GHz
Iris Xe G7 80EUs
min: 38.9 fps, max: -1 fps
Intel Core i5-1135G7 2.4GHz
Iris Xe G7 80EUs
min: 29.1 fps, max: -1 fps
Intel Core i5-1235U 0.9GHz
Iris Xe G7 80EUs
min: 40.1 fps, max: -1 fps
Intel Core i5-1135G7 2.4GHz
Iris Xe G7 80EUs
min: 21.9 fps, max: -1 fps
Intel Core i5-1240P 1.2GHz
Iris Xe G7 80EUs
min: 39.9 fps, max: -1 fps
Intel Core i5-1335U 0.9GHz
Iris Xe G7 80EUs
min: 41.1 fps, max: -1 fps
Intel Core i5-1335U 0.9GHz
Iris Xe G7 80EUs
min: 38.5 fps, max: -1 fps
Intel Core i5-1135G7 2.4GHz
Iris Xe G7 80EUs
min: 22.1 fps, max: -1 fps
Intel Core i5-1245U 1.2GHz
Iris Xe G7 80EUs
min: 42.8 fps, max: -1 fps
Intel Core i5-1240U 0.8GHz
Iris Xe G7 80EUs
min: 42.1 fps, max: -1 fps
Intel Core i5-1345U 1.2GHz
Iris Xe G7 80EUs
min: 39.3 fps, max: -1 fps
Intel Core i5-1335U 0.9GHz
Iris Xe G7 80EUs
min: 38.8 fps, max: -1 fps
Intel Core i5-1135G7 2.4GHz
Iris Xe G7 80EUs
min: 41.1 fps, max: -1 fps
Intel Core i5-1135G7 2.4GHz
Iris Xe G7 80EUs
min: 31.1 fps, max: -1 fps
Intel Core i5-1135G7 2.4GHz
Iris Xe G7 80EUs
min: 41.6 fps, max: -1 fps
Intel Core i5-1135G7 2.4GHz
Iris Xe G7 80EUs
min: 29.5 fps, max: -1 fps
Intel Core i5-1335U 0.9GHz
Iris Xe G7 80EUs
min: 42 fps, max: -1 fps
Intel Core i5-1340P 1.4GHz
Iris Xe G7 80EUs
min: 45.1 fps, max: -1 fps
Intel Core i5-1135G7 2.4GHz
Iris Xe G7 80EUs
min: 45.9 fps, max: -1 fps
Intel Core i5-1135G7 2.4GHz
Iris Xe G7 80EUs
min: 45.3 fps, max: -1 fps
Intel Core 5 120U 0.9GHz
Iris Xe G7 80EUs
min: 44.8 fps, max: -1 fps
Intel Core i5-11300H 3.1GHz
Iris Xe G7 80EUs
min: 46 fps, max: -1 fps
Intel Core i5-1240P 1.2GHz
Iris Xe G7 80EUs
min: 47.7 fps, max: -1 fps
Intel Core i5-1145G7 2.6GHz
Iris Xe G7 80EUs
min: 46.5 fps, max: -1 fps
Intel Core i5-1155G7 2.5GHz
Iris Xe G7 80EUs
min: 47.6 fps, max: -1 fps
Intel Core i5-1334U 0.9GHz
Iris Xe G7 80EUs
min: 36.5 fps, max: -1 fps
Intel Core i5-1335U 0.9GHz
Iris Xe G7 80EUs
min: 49 fps, max: -1 fps
Intel Core i5-1335U 0.9GHz
Iris Xe G7 80EUs
min: 50.9 fps, max: -1 fps
Intel Core i5-1155G7 2.5GHz
Iris Xe G7 80EUs
min: 52.7 fps, max: -1 fps
Intel Core i5-13500H 1.9GHz
Iris Xe G7 80EUs
min: 58.2 fps, max: -1 fps
Intel Core i5-1240P 1.2GHz
Iris Xe G7 80EUs
min: 49.7 fps, max: -1 fps
Intel Core i5-12500H 1.8GHz
Iris Xe G7 80EUs
min: 49.7 fps, max: -1 fps
Flüstermodus
AMD Ryzen 7 5700U 1.8GHz
Vega 8
min: 37.3 fps, max: -1 fps
Akkusparmodus
AMD Ryzen 9 5900HX @2GHz
Vega 8
min: 40.6 fps, max: -1 fps
Leistungsmodus
AMD Ryzen 7 5700U 1.8GHz
Vega 8
min: 40.1 fps, max: -1 fps
Leistungsmodus
AMD Ryzen 7 5700U 1.8GHz
Vega 8
min: 41.2 fps, max: -1 fps
AMD Ryzen 7 4980U 2GHz
Vega 8
min: 42 fps, max: -1 fps
Dual-Channel-Mode
AMD Ryzen 7 PRO 7730U 2GHz
Vega 8
min: 45.4 fps, max: -1 fps
Hoechstleistung
AMD Ryzen 9 5900HX 3.3GHz
Vega 8
min: 49 fps, max: -1 fps
Intel Core i5-1340P 1.4GHz
Iris Xe G7 80EUs
min: 15.9 fps, max: -1 fps
Intel Core i5-1135G7 2.4GHz
Iris Xe G7 80EUs
min: 3.1 fps, max: -1 fps

The Witcher 3
2015Intel Core i5-1135G7 2.4GHz
Iris Xe G7 80EUs
min: 4.78 fps, P0.1: 5.88 fps, P1: 19.1 fps, max: 85 fps
Intel Core i5-1135G7 2.4GHz
Iris Xe G7 80EUs
min: 5.09 fps, P0.1: 8.84 fps, P1: 20 fps, max: 76.8 fps
Intel Core i5-1135G7 2.4GHz
Iris Xe G7 80EUs
min: 27 fps, max: 43 fps
Intel Core i5-1140G7 1.8GHz
Iris Xe G7 80EUs
min: 31 fps, max: 53 fps
Intel Core i5-1135G7 2.4GHz
Iris Xe G7 80EUs
min: 38 fps, max: 53 fps
Intel Core i5-1240P 1.2GHz
Iris Xe G7 80EUs
min: 22.8 fps, P0.1: 26.6 fps, P1: 31.5 fps, max: 101.6 fps
Intel Core i5-1235U 0.9GHz
Iris Xe G7 80EUs
min: 15 fps, max: 64 fps
Intel Core i5-1335U 0.9GHz
Iris Xe G7 80EUs
min: 48 fps, max: 61 fps
Intel Core i5-1135G7 2.4GHz
Iris Xe G7 80EUs
min: 2.8 fps, P0.1: 12.4 fps, P1: 34.9 fps, max: 120.4 fps
Intel Core i5-1230U 0.7GHz
Iris Xe G7 80EUs
min: 15 fps, max: 66 fps
Intel Core i5-1135G7 2.4GHz
Iris Xe G7 80EUs
min: 51 fps, max: 66 fps
Dual-Channel
Intel Core i5-1135G7 2.4GHz
Iris Xe G7 80EUs
min: 3.21 fps, P0.1: 11.5 fps, P1: 33.3 fps, max: 148 fps
Intel Core i5-1135G7 2.4GHz
Iris Xe G7 80EUs
min: 28.2 fps, P0.1: 28.3 fps, P1: 37.1 fps, max: 122 fps
Intel Core i5-1135G7 2.4GHz
Iris Xe G7 80EUs
min: 3.62 fps, P0.1: 9.3 fps, P1: 25.9 fps, max: 118 fps
Intel Core i5-1135G7 2.4GHz
Iris Xe G7 80EUs
min: 60 fps, max: 71 fps
Dual-Channel
Intel Core i5-1135G7 2.4GHz
Iris Xe G7 80EUs
min: 28.3 fps, P0.1: 35.6 fps, P1: 43 fps, max: 123 fps
Intel Core i5-1240U 0.8GHz
Iris Xe G7 80EUs
min: 61 fps, max: 77 fps
Intel Core i5-1240P 1.2GHz
Iris Xe G7 80EUs
min: 4.99 fps, P0.1: 11.5 fps, P1: 34.4 fps, max: 192.7 fps
Intel Core i5-1135G7 2.4GHz
Iris Xe G7 80EUs
min: 33.2 fps, P0.1: 38.3 fps, P1: 53.4 fps, max: 110 fps
Intel Core i5-1235U 0.9GHz
Iris Xe G7 80EUs
min: 23 fps, max: 83 fps
Intel Core i5-1335U 0.9GHz
Iris Xe G7 80EUs
min: 57 fps, max: 81 fps
Intel Core i5-1250P 1.2GHz
Iris Xe G7 80EUs
min: 61 fps, max: 81 fps
Intel Core i5-1345U 1.2GHz
Iris Xe G7 80EUs
min: 67 fps, P1: 69 fps, max: 88 fps
Intel Core i5-1235U 0.9GHz
Iris Xe G7 80EUs
min: 33.7 fps, P0.1: 38.5 fps, P1: 45.2 fps, max: 170.9 fps
Intel Core i5-1335U 0.9GHz
Iris Xe G7 80EUs
min: 61 fps, max: 83 fps
Intel Core i5-1240P 1.2GHz
Iris Xe G7 80EUs
min: 63 fps, max: 85 fps
Intel Core i5-1335U 0.9GHz
Iris Xe G7 80EUs
min: 64 fps, max: 86 fps
Intel Core i5-1335U 0.9GHz
Iris Xe G7 80EUs
min: 67 fps, max: 86 fps
Intel Core i5-1335U 0.9GHz
Iris Xe G7 80EUs
min: 3.84 fps, P0.1: 10.1 fps, P1: 36.8 fps, max: 246 fps
Intel Core i5-1145G7 2.6GHz
Iris Xe G7 80EUs
min: 4.78 fps, P0.1: 20.4 fps, P1: 42.9 fps, max: 213 fps
Intel Core i5-1245U 1.2GHz
Iris Xe G7 80EUs
min: 31.8 fps, P0.1: 35.9 fps, P1: 47.9 fps, max: 266 fps
Intel Core i5-1135G7 2.4GHz
Iris Xe G7 80EUs
min: 62 fps, max: 93 fps
Intel Core i5-1135G7 2.4GHz
Iris Xe G7 80EUs
min: 75 fps, P1: 76.12 fps, max: 88 fps
Intel Core i5-1155G7 2.5GHz
Iris Xe G7 80EUs
min: 71 fps, P1: 74 fps, max: 102 fps
Intel Core i5-1135G7 2.4GHz
Iris Xe G7 80EUs
min: 2.78 fps, P0.1: 12.7 fps, P1: 35 fps, max: 120.4 fps
AMD Ryzen 7 5700U 1.8GHz
Vega 8
min: 32.2 fps, P0.1: 32.6 fps, P1: 38 fps, max: 130 fps
AMD Ryzen 7 5700U 1.8GHz
Vega 8
min: 9.97 fps, P0.1: 16.2 fps, P1: 33.7 fps, max: 146.5 fps
AMD Ryzen 7 5825U 2GHz
Vega 8
min: 54 fps, P1: 54 fps, max: 76 fps
AMD Ryzen 9 4900H 3.3GHz
Vega 8
min: 30.7 fps, P0.1: 37.2 fps, P1: 46.5 fps, max: 182 fps
AMD Ryzen 9 5900HX 3.3GHz
Vega 8
min: 15.1 fps, P0.1: 33 fps, P1: 46 fps, max: 173 fps
AMD Ryzen 7 5700G 3.8GHz
Vega 8
min: 13.2 fps, P0.1: 36.3 fps, P1: 41.6 fps, max: 257 fps
AMD Ryzen 9 5900HX 3.3GHz
Vega 8
min: 21.1 fps, P0.1: 40.1 fps, P1: 51.4 fps, max: 229 fps
Dual-Channel-Mode
AMD Ryzen 7 PRO 7730U 2GHz
Vega 8
min: 64 fps, max: 83 fps
AMD Ryzen 7 PRO 5750G 3.8GHz
Vega 8
min: 17.6 fps, P0.1: 46.9 fps, P1: 61.6 fps, max: 254 fps
AMD Ryzen 9 5900HX 3.3GHz
Vega 8
min: 18.4 fps, P0.1: 24 fps, P1: 61.8 fps, max: 302 fps
Intel Core i5-1135G7 2.4GHz
Iris Xe G7 80EUs
min: 10.7 fps, P0.1: 11.5 fps, P1: 16.3 fps, max: 44.2 fps
Intel Core i5-1135G7 2.4GHz
Iris Xe G7 80EUs
min: 1.787 fps, P0.1: 4.05 fps, P1: 17.2 fps, max: 47.1 fps
Intel Core i5-1135G7 2.4GHz
Iris Xe G7 80EUs
min: 21 fps, max: 26 fps
Intel Core i5-1130G7 1.8GHz
Iris Xe G7 80EUs
min: 20 fps, P1: 22 fps, max: 39 fps
Intel Core i5-1135G7 2.4GHz
Iris Xe G7 80EUs
min: 11 fps, max: 34 fps
Intel Core i5-1140G7 1.8GHz
Iris Xe G7 80EUs
min: 27 fps, max: 37 fps
Intel Core i5-1240P 1.2GHz
Iris Xe G7 80EUs
min: 5.05 fps, P0.1: 14.7 fps, P1: 18.3 fps, max: 91.2 fps
Intel Core i5-1335U 0.9GHz
Iris Xe G7 80EUs
min: 30 fps, max: 38 fps
Intel Core i5-1135G7 2.4GHz
Iris Xe G7 80EUs
min: 31 fps, max: 40 fps
Intel Core i5-1135G7 2.4GHz
Iris Xe G7 80EUs
min: 1.6 fps, P0.1: 5.6 fps, P1: 22.4 fps, max: 88 fps
Intel Core i5-1135G7 2.4GHz
Iris Xe G7 80EUs
min: 30 fps, max: 43 fps
Intel Core i5-1235U 0.9GHz
Iris Xe G7 80EUs
min: 31 fps, max: 44 fps
Intel Core i5-1335U 0.9GHz
Iris Xe G7 80EUs
min: 31 fps, max: 50 fps
Intel Core i5-1230U 0.7GHz
Iris Xe G7 80EUs
min: 36 fps, max: 42 fps
Dual-Channel
Intel Core i5-1135G7 2.4GHz
Iris Xe G7 80EUs
min: 17.2 fps, P0.1: 17.4 fps, P1: 23.2 fps, max: 115 fps
Intel Core i5-1135G7 2.4GHz
Iris Xe G7 80EUs
min: 15.5 fps, P0.1: 16.6 fps, P1: 19.4 fps, max: 110 fps
Intel Core i5-1135G7 2.4GHz
Iris Xe G7 80EUs
min: 30 fps, max: 46 fps
Intel Core i5-1240U 0.8GHz
Iris Xe G7 80EUs
min: 38 fps, max: 45 fps
Intel Core i5-1135G7 2.4GHz
Iris Xe G7 80EUs
min: 2.89 fps, P0.1: 16.6 fps, P1: 30.7 fps, max: 85.8 fps
Intel Core i5-1250P 1.2GHz
Iris Xe G7 80EUs
min: 38 fps, max: 51 fps
Intel Core i5-1240P 1.2GHz
Iris Xe G7 80EUs
min: 2.75 fps, P0.1: 21.1 fps, P1: 25.5 fps, max: 164.5 fps
Intel Core i5-1335U 0.9GHz
Iris Xe G7 80EUs
min: 40 fps, max: 49 fps
Intel Core i5-1135G7 2.4GHz
Iris Xe G7 80EUs
min: 3.46 fps, P0.1: 12.3 fps, P1: 32.1 fps, max: 94.4 fps
Intel Core i5-1235U 0.9GHz
Iris Xe G7 80EUs
min: 42 fps, max: 53 fps
Intel Core i5-1335U 0.9GHz
Iris Xe G7 80EUs
min: 41 fps, max: 54 fps
Intel Core i5-1235U 0.9GHz
Iris Xe G7 80EUs
min: 14.9 fps, P0.1: 22.5 fps, P1: 26.2 fps, max: 132.6 fps
Intel Core i5-1240P 1.2GHz
Iris Xe G7 80EUs
min: 44 fps, max: 54 fps
Intel Core i5-1135G7 2.4GHz
Iris Xe G7 80EUs
min: 44 fps, P1: 45.14 fps, max: 59 fps
Intel Core i5-1335U 0.9GHz
Iris Xe G7 80EUs
min: 42 fps, max: 56 fps
Intel Core i5-1155G7 2.5GHz
Iris Xe G7 80EUs
min: 46 fps, P1: 46.59 fps, max: 60 fps
Intel Core i5-1145G7 2.6GHz
Iris Xe G7 80EUs
min: 3.24 fps, P0.1: 25.2 fps, P1: 29.7 fps, max: 150.2 fps
Intel Core i5-1245U 1.2GHz
Iris Xe G7 80EUs
min: 22.4 fps, P0.1: 24.9 fps, P1: 29.9 fps, max: 188.3 fps
Intel Core i5-1335U 0.9GHz
Iris Xe G7 80EUs
min: 7.14 fps, P0.1: 25.6 fps, P1: 30.6 fps, max: 180.8 fps
Hoch
Intel Core i5-1240P 1.2GHz
Iris Xe G7 80EUs
min: 17.7 fps, P0.1: 25.9 fps, P1: 30.6 fps, max: 131.7 fps
Intel Core i5-1155G7 2.5GHz
Iris Xe G7 80EUs
min: 43 fps, P1: 44.83 fps, max: 62 fps
Intel Core i5-1135G7 2.4GHz
Iris Xe G7 80EUs
min: 52 fps, max: 61 fps
Flüstermodus
AMD Ryzen 7 5700U 1.8GHz
Vega 8
min: 9.91 fps, P0.1: 13.3 fps, P1: 20.7 fps, max: 72.5 fps
Leistungsmodus
AMD Ryzen 7 5700U 1.8GHz
Vega 8
min: 21.1 fps, P0.1: 21.5 fps, P1: 25.7 fps, max: 68.4 fps
AMD Ryzen 7 5700U 1.8GHz
Vega 8
min: 24.8 fps, P0.1: 25.3 fps, P1: 26.8 fps, max: 66 fps
AMD Ryzen 7 5700U 1.8GHz
Vega 8
min: 24.8 fps, P0.1: 26.3 fps, P1: 29.2 fps, max: 73 fps
AMD Ryzen 9 4900H 3.3GHz
Vega 8
min: 21.6 fps, P0.1: 25.4 fps, P1: 31.8 fps, max: 97.1 fps
AMD Ryzen 7 5825U 2GHz
Vega 8
min: 35 fps, P1: 35 fps, max: 52 fps
AMD Ryzen 7 5700G 3.8GHz
Vega 8
min: 1.9 fps, P0.1: 2.75 fps, P1: 29.8 fps, max: 66.7 fps
AMD Ryzen 9 5900HX 3.3GHz
Vega 8
min: 18 fps, P0.1: 23.2 fps, P1: 32.4 fps, max: 119 fps
AMD Ryzen 9 5900HX 3.3GHz
Vega 8
min: 31 fps, P0.1: 32.6 fps, P1: 36.6 fps, max: 70.6 fps
Dual-Channel-Mode
AMD Ryzen 7 PRO 7730U 2GHz
Vega 8
min: 40 fps, max: 49 fps
AMD Ryzen 7 PRO 5750G 3.8GHz
Vega 8
min: 31.7 fps, P0.1: 37 fps, P1: 44 fps, max: 161.6 fps
AMD Ryzen 9 5900HX 3.3GHz
Vega 8
min: 32.2 fps, P0.1: 36.1 fps, P1: 43.2 fps, max: 108 fps
AMD Ryzen 7 5800H 3.2GHz
Vega 8
min: 16.8 fps, P0.1: 34.9 fps, P1: 43.7 fps, max: 138 fps
Intel Core i5-1135G7 2.4GHz
Iris Xe G7 80EUs
min: 5.29 fps, P0.1: 5.52 fps, P1: 7.01 fps, max: 26.1 fps
Intel Core i5-1135G7 2.4GHz
Iris Xe G7 80EUs
min: 5.65 fps, P0.1: 5.75 fps, P1: 6.42 fps, max: 39 fps
Intel Core i5-1135G7 2.4GHz
Iris Xe G7 80EUs
min: 9 fps, max: 14 fps
Intel Core i5-1135G7 2.4GHz
Iris Xe G7 80EUs
min: 11 fps, max: 18 fps
Intel Core i5-1240P 1.2GHz
Iris Xe G7 80EUs
min: 6.06 fps, P0.1: 7.83 fps, P1: 8.73 fps, max: 77 fps
Intel Core i5-1335U 0.9GHz
Iris Xe G7 80EUs
min: 13 fps, max: 19 fps
Intel Core i5-1135G7 2.4GHz
Iris Xe G7 80EUs
min: 13 fps, P1: 14.88 fps, max: 21 fps
Intel Core i5-1135G7 2.4GHz
Iris Xe G7 80EUs
min: 4.8 fps, P0.1: 5.6 fps, P1: 10.6 fps, max: 74.6 fps
Intel Core i5-1135G7 2.4GHz
Iris Xe G7 80EUs
min: 14 fps, max: 22 fps
Intel Core i5-1140G7 1.8GHz
Iris Xe G7 80EUs
min: 15 fps, max: 21 fps
Intel Core i5-1135G7 2.4GHz
Iris Xe G7 80EUs
min: 3.68 fps, P0.1: 3.82 fps, P1: 6.51 fps, max: 95.7 fps
Intel Core i5-1235U 0.9GHz
Iris Xe G7 80EUs
min: 16 fps, max: 24 fps
Intel Core i5-1135G7 2.4GHz
Iris Xe G7 80EUs
min: 18 fps, max: 22 fps
Intel Core i5-1230U 0.7GHz
Iris Xe G7 80EUs
min: 17 fps, max: 23 fps
Intel Core i5-1335U 0.9GHz
Iris Xe G7 80EUs
min: 18 fps, max: 25 fps
Intel Core i5-1335U 0.9GHz
Iris Xe G7 80EUs
min: 19 fps, max: 24 fps
Intel Core i5-1250P 1.2GHz
Iris Xe G7 80EUs
min: 17 fps, max: 26 fps
Intel Core i5-1135G7 2.4GHz
Iris Xe G7 80EUs
min: 9.98 fps, P0.1: 11.8 fps, P1: 18.5 fps, max: 64.6 fps
Intel Core i5-1240U 0.8GHz
Iris Xe G7 80EUs
min: 22 fps, max: 27 fps
Intel Core i5-1240P 1.2GHz
Iris Xe G7 80EUs
min: 21 fps, max: 28 fps
Intel Core i5-1335U 0.9GHz
Iris Xe G7 80EUs
min: 20 fps, max: 29 fps
Intel Core i5-1135G7 2.4GHz
Iris Xe G7 80EUs
min: 19 fps, P1: 21.36 fps, max: 34 fps
Intel Core i5-1240P 1.2GHz
Iris Xe G7 80EUs
min: 12.2 fps, P0.1: 13.1 fps, P1: 16.1 fps, max: 82.7 fps
Intel Core i5-1135G7 2.4GHz
Iris Xe G7 80EUs
min: 13.2 fps, P0.1: 13.3 fps, P1: 13.9 fps, max: 79.2 fps
Intel Core i5-1235U 0.9GHz
Iris Xe G7 80EUs
min: 12.7 fps, P0.1: 13.3 fps, P1: 14.4 fps, max: 129.5 fps
Intel Core i5-1235U 0.9GHz
Iris Xe G7 80EUs
min: 24 fps, max: 29 fps
Intel Core i5-1335U 0.9GHz
Iris Xe G7 80EUs
min: 22 fps, max: 31 fps
Intel Core i5-1145G7 2.6GHz
Iris Xe G7 80EUs
min: 13.7 fps, P0.1: 14.2 fps, P1: 15.9 fps, max: 94.2 fps
Intel Core i5-1245U 1.2GHz
Iris Xe G7 80EUs
min: 12.8 fps, P0.1: 13.7 fps, P1: 15.4 fps, max: 122.2 fps
Intel Core i5-1155G7 2.5GHz
Iris Xe G7 80EUs
min: 24 fps, P1: 24 fps, max: 32 fps
Intel Core i5-1335U 0.9GHz
Iris Xe G7 80EUs
min: 2.43 fps, P0.1: 10.4 fps, P1: 16.1 fps, max: 155.1 fps
Intel Core i5-1155G7 2.5GHz
Iris Xe G7 80EUs
min: 25 fps, P1: 25.64 fps, max: 37 fps
Intel Core i5-1135G7 2.4GHz
Iris Xe G7 80EUs
min: 25 fps, max: 32 fps
AMD Ryzen 7 5700U 1.8GHz
Vega 8
min: 6.44 fps, P0.1: 8.3 fps, P1: 13.8 fps, max: 71.2 fps
AMD Ryzen 7 5825U 2GHz
Vega 8
min: 16 fps, P1: 16 fps, max: 22 fps
AMD Ryzen 7 5700G 3.8GHz
Vega 8
min: 2.25 fps, P0.1: 2.26 fps, P1: 2.92 fps, max: 33.1 fps
AMD Ryzen 7 5700U 1.8GHz
Vega 8
min: 15 fps, P0.1: 15.3 fps, P1: 16.1 fps, max: 25.5 fps
AMD Ryzen 9 4900H 3.3GHz
Vega 8
min: 15.7 fps, P0.1: 15.8 fps, P1: 16.8 fps, max: 26.6 fps
AMD Ryzen 9 5900HX 3.3GHz
Vega 8
min: 12 fps, P0.1: 14.2 fps, P1: 17.2 fps, max: 76.4 fps
AMD Ryzen 9 5900HX 3.3GHz
Vega 8
min: 8.18 fps, P0.1: 17.5 fps, P1: 19 fps, max: 131 fps
Dual-Channel-Mode
AMD Ryzen 7 PRO 7730U 2GHz
Vega 8
min: 18 fps, max: 25 fps
AMD Ryzen 9 5900HX 3.3GHz
Vega 8
min: 19.1 fps, P0.1: 20 fps, P1: 22.1 fps, max: 34.9 fps
AMD Ryzen 7 PRO 5750G 3.8GHz
Vega 8
min: 17.5 fps, P0.1: 21.1 fps, P1: 22.6 fps, max: 35.7 fps
AMD Ryzen 7 5800H 3.2GHz
Vega 8
min: 20.8 fps, P0.1: 21.4 fps, P1: 22.6 fps, max: 35.8 fps
Intel Core i5-1135G7 2.4GHz
Iris Xe G7 80EUs
min: 5 fps, P1: 6 fps, max: 7 fps
Intel Core i5-1135G7 2.4GHz
Iris Xe G7 80EUs
min: 3.35 fps, P0.1: 3.37 fps, P1: 4.51 fps, max: 15.5 fps
Intel Core i5-1135G7 2.4GHz
Iris Xe G7 80EUs
min: 3.75 fps, P0.1: 3.76 fps, P1: 5.25 fps, max: 17.7 fps
Intel Core i5-1135G7 2.4GHz
Iris Xe G7 80EUs
min: 7 fps, P1: 8 fps, max: 9 fps
Intel Core i5-1240P 1.2GHz
Iris Xe G7 80EUs
min: 6 fps, P1: 7 fps, max: 9 fps
Intel Core i5-1135G7 2.4GHz
Iris Xe G7 80EUs
min: 6 fps, P1: 6 fps, max: 11 fps
Intel Core i5-1230U 0.7GHz
Iris Xe G7 80EUs
min: 7 fps, max: 10 fps
Intel Core i5-1335U 0.9GHz
Iris Xe G7 80EUs
min: 7 fps, max: 10 fps
Intel Core i5-1135G7 2.4GHz
Iris Xe G7 80EUs
min: 8 fps, P1: 8 fps, max: 10 fps
Intel Core i7-1250U 0.8GHz
Iris Xe G7 80EUs
min: 8 fps, P1: 9 fps, max: 11 fps
Intel Core i5-1135G7 2.4GHz
Iris Xe G7 80EUs
min: 8 fps, P1: 8 fps, max: 11 fps
Intel Core i5-1135G7 2.4GHz
Iris Xe G7 80EUs
min: 7 fps, P1: 9 fps, max: 13 fps
Intel Core i5-1235U 0.9GHz
Iris Xe G7 80EUs
min: 8 fps, max: 11 fps
Intel Core i5-1140G7 1.8GHz
Iris Xe G7 80EUs
min: 7 fps, max: 12 fps
Intel Core i5-1240P 1.2GHz
Iris Xe G7 80EUs
min: 4.59 fps, P0.1: 4.84 fps, P1: 7.56 fps, max: 17.5 fps
Intel Core i5-1235U 0.9GHz
Iris Xe G7 80EUs
min: 7 fps, P1: 9 fps, max: 11 fps
Intel Core i5-1130G7 1.8GHz
Iris Xe G7 80EUs
min: 8 fps, P1: 9 fps, max: 12 fps
Intel Core i5-1135G7 2.4GHz
Iris Xe G7 80EUs
min: 4.4 fps, P0.1: 4.9 fps, P1: 6.4 fps, max: 31.3 fps
Intel Core i5-1235U 0.9GHz
Iris Xe G7 80EUs
min: 8 fps, P1: 9 fps, max: 12 fps
Intel Core i5-1135G7 2.4GHz
Iris Xe G7 80EUs
min: 8 fps, max: 12 fps
Intel Core i5-1250P 1.2GHz
Iris Xe G7 80EUs
min: 8 fps, max: 13 fps
Intel Core i5-1335U 0.9GHz
Iris Xe G7 80EUs
min: 8 fps, max: 12 fps
Intel Core i5-1135G7 2.4GHz
Iris Xe G7 80EUs
min: 9 fps, P1: 10 fps, max: 12 fps
Intel Core i5-1240U 0.8GHz
Iris Xe G7 80EUs
min: 9 fps, max: 13 fps
Intel Core i5-1240P 1.2GHz
Iris Xe G7 80EUs
min: 9 fps, P1: 9 fps, max: 13 fps
Intel Core i5-1135G7 2.4GHz
Iris Xe G7 80EUs
min: 4.41 fps, P0.1: 4.54 fps, P1: 5.56 fps, max: 80.9 fps
Dual-Channel
Intel Core i5-1135G7 2.4GHz
Iris Xe G7 80EUs
min: 3.3 fps, P0.1: 4.73 fps, P1: 8.21 fps, max: 33.4 fps
Intel Core i5-1335U 0.9GHz
Iris Xe G7 80EUs
min: 9 fps, P1: 10 fps, max: 13 fps
Intel Core i5-1335U 0.9GHz
Iris Xe G7 80EUs
min: 10 fps, max: 13 fps
Intel Core i5-1335U 0.9GHz
Iris Xe G7 80EUs
min: 9 fps, max: 13 fps
Intel Core i5-11300H 3.1GHz
Iris Xe G7 80EUs
min: 11 fps, P1: 11 fps, max: 14 fps
Intel Core i5-1235U 0.9GHz
Iris Xe G7 80EUs
min: 10 fps, max: 14 fps
Intel Core i5-1240P 1.2GHz
Iris Xe G7 80EUs
min: 10 fps, max: 14 fps
Intel Core i5-1135G7 2.4GHz
Iris Xe G7 80EUs
min: 10 fps, P1: 11 fps, max: 14 fps
Intel Core i5-1235U 0.9GHz
Iris Xe G7 80EUs
min: 3.35 fps, P0.1: 5.87 fps, P1: 7.15 fps, max: 72.3 fps
Intel Core i5-1335U 0.9GHz
Iris Xe G7 80EUs
min: 10 fps, max: 14 fps
Intel Core i5-1135G7 2.4GHz
Iris Xe G7 80EUs
min: 9 fps, P1: 10 fps, max: 16 fps
Intel Core i5-1335U 0.9GHz
Iris Xe G7 80EUs
min: 6.5 fps, P0.1: 7.63 fps, P1: 8.62 fps, max: 30.4 fps
Intel Core i5-1240P 1.2GHz
Iris Xe G7 80EUs
min: 12 fps, P1: 12 fps, max: 14 fps
Intel Core i5-1135G7 2.4GHz
Iris Xe G7 80EUs
min: 6.67 fps, P0.1: 7.01 fps, P1: 11 fps, max: 53.1 fps
Intel Core i5-1155G7 2.5GHz
Iris Xe G7 80EUs
min: 11 fps, P1: 12 fps, max: 15 fps
Intel Core i5-1135G7 2.4GHz
Iris Xe G7 80EUs
min: 11 fps, max: 17 fps
Intel Core i5-1155G7 2.5GHz
Iris Xe G7 80EUs
min: 12 fps, P1: 13 fps, max: 14 fps
Intel Core i5-1135G7 2.4GHz
Iris Xe G7 80EUs
min: 6.66 fps, P0.1: 6.67 fps, P1: 6.96 fps, max: 74.1 fps
Intel Core i5-1335U 0.9GHz
Iris Xe G7 80EUs
min: 12 fps, P1: 13 fps, max: 15 fps
Hoch
Intel Core i5-1240P 1.2GHz
Iris Xe G7 80EUs
min: 6.51 fps, P0.1: 6.63 fps, P1: 10.9 fps, max: 29 fps
Intel Core i5-12500H 1.8GHz
Iris Xe G7 80EUs
min: 13 fps, P1: 13 fps, max: 15 fps
AMD Ryzen 7 5800U 1.9GHz
Vega 8
min: 8 fps, P1: 9 fps, max: 10 fps
AMD Ryzen 7 5825U 2GHz
Vega 8
min: 8 fps, P1: 9 fps, max: 11 fps
Flüstermodus
AMD Ryzen 7 5700U 1.8GHz
Vega 8
min: 6.06 fps, P0.1: 6.17 fps, P1: 8.01 fps, max: 52.7 fps
Leistungsmodus
AMD Ryzen 7 5700U 1.8GHz
Vega 8
min: 8.26 fps, P0.1: 8.46 fps, P1: 9.07 fps, max: 19.5 fps
AMD Ryzen 7 5700U 1.8GHz
Vega 8
min: 4.41 fps, P0.1: 5.72 fps, P1: 10.1 fps, max: 68.1 fps
AMD Ryzen 7 7730U 2GHz
Vega 8
min: 12 fps, P1: 12 fps, max: 14 fps
AMD Ryzen 7 7730U 2GHz
Vega 8
min: 9 fps, P1: 12 fps, max: 15 fps
AMD Ryzen 7 5700U 1.8GHz
Vega 8
min: 8.64 fps, P0.1: 9.14 fps, P1: 10.9 fps, max: 16.2 fps
AMD Ryzen 7 5700U 1.8GHz
Vega 8
min: 12 fps, P1: 12 fps, max: 15 fps
AMD Ryzen 9 4900H 3.3GHz
Vega 8
min: 11.8 fps, P0.1: 11.8 fps, P1: 12 fps, max: 18.5 fps
AMD Ryzen 7 5825U 2GHz
Vega 8
min: 12 fps, P1: 12 fps, max: 15 fps
AMD Ryzen 7 5700G 3.8GHz
Vega 8
min: 2.51 fps, P0.1: 2.63 fps, P1: 2.93 fps, max: 21.2 fps
AMD Ryzen 7 PRO 5850U 1.9GHz
Vega 8
min: 13 fps, P1: 13 fps, max: 16 fps
AMD Ryzen 9 5900HX 3.3GHz
Vega 8
min: 11 fps, P0.1: 11.1 fps, P1: 11.5 fps, max: 18.9 fps
AMD Ryzen 7 5800U 1.9GHz
Vega 8
min: 13 fps, P1: 13 fps, max: 17 fps
Dual-Channel-Mode
AMD Ryzen 7 PRO 7730U 2GHz
Vega 8
min: 11 fps, max: 17 fps
AMD Ryzen 9 5900HX 3.3GHz
Vega 8
min: 8.07 fps, P0.1: 10.9 fps, P1: 12 fps, max: 59.1 fps
AMD Ryzen 7 PRO 5750G 3.8GHz
Vega 8
min: 13.9 fps, P0.1: 14.1 fps, P1: 15 fps, max: 28.7 fps
AMD Ryzen 9 5900HX 3.3GHz
Vega 8
min: 14 fps, P0.1: 14.2 fps, P1: 14.7 fps, max: 22.5 fps
Intel Core i5-1335U 0.9GHz
Iris Xe G7 80EUs
min: 4.94 fps, P0.1: 5.43 fps, P1: 6.08 fps, max: 28.4 fps

GTA V
2015Intel Core i5-1135G7 2.4GHz
Iris Xe G7 80EUs
min: 4.19 fps, P1: 20 fps, max: 128 fps
Intel Core i5-1135G7 2.4GHz
Iris Xe G7 80EUs
min: 7.26 fps, P1: 23.8 fps, max: 74.8 fps
Intel Core i5-1135G7 2.4GHz
Iris Xe G7 80EUs
min: 14.6 fps, P1: 24.4 fps, max: 72.2 fps
Intel Core i5-1135G7 2.4GHz
Iris Xe G7 80EUs
min: 13 fps, P1: 26.3 fps, max: 85.4 fps
Intel Core i5-1235U 0.9GHz
Iris Xe G7 80EUs
min: 6.78 fps, P1: 22.7 fps, max: 96.3 fps
Intel Core i5-1135G7 2.4GHz
Iris Xe G7 80EUs
min: 1.947 fps, P1: 28.6 fps, max: 146 fps
Intel Core i5-1135G7 2.4GHz
Iris Xe G7 80EUs
min: 8.57 fps, P1: 38.5 fps, max: 172 fps
Intel Core i5-1335U 0.9GHz
Iris Xe G7 80EUs
min: 7.59 fps, P1: 34.5 fps, max: 92.3 fps
Intel Core i5-1130G7 1.8GHz
Iris Xe G7 80EUs
min: 9.92 fps, P1: 26.3 fps, max: 158 fps
Intel Core i5-1135G7 2.4GHz
Iris Xe G7 80EUs
min: 14.8 fps, P1: 41.7 fps, max: 129 fps
Intel Core i5-1130G7 1.8GHz
Iris Xe G7 80EUs
min: 13 fps, P1: 33.3 fps, max: 107 fps
Intel Core i5-1135G7 2.4GHz
Iris Xe G7 80EUs
min: 10.2 fps, P1: 47.6 fps, max: 105 fps
Intel Core i5-1230U 0.7GHz
Iris Xe G7 80EUs
min: 8.61 fps, P1: 28.6 fps, max: 117.4 fps
Intel Core i5-1240P 1.2GHz
Iris Xe G7 80EUs
min: 10.6 fps, P1: 35.7 fps, max: 93.3 fps
Intel Core i5-1235U 0.9GHz
Iris Xe G7 80EUs
min: 1.27 fps, P1: 25 fps, max: 129.7 fps
Intel Core i5-1135G7 2.4GHz
Iris Xe G7 80EUs
min: 8.71 fps, P1: 41.7 fps, max: 145 fps
Intel Core i5-1235U 0.9GHz
Iris Xe G7 80EUs
min: 14.9 fps, P1: 38.5 fps, max: 110.4 fps
Intel Core i5-1135G7 2.4GHz
Iris Xe G7 80EUs
min: 20 fps, P1: 40 fps, max: 105.1 fps
Intel Core i5-1135G7 2.4GHz
Iris Xe G7 80EUs
min: 7.45 fps, P1: 30.3 fps, max: 109.4 fps
Intel Core i5-1240P 1.2GHz
Iris Xe G7 80EUs
min: 10.2 fps, P1: 38.5 fps, max: 116.5 fps
Intel Core i5-1135G7 2.4GHz
Iris Xe G7 80EUs
min: 14.1 fps, P1: 45.5 fps, max: 143 fps
Intel Core i5-1240P 1.2GHz
Iris Xe G7 80EUs
min: 10.9 fps, P1: 40 fps, max: 118.4 fps
Intel Core i5-1135G7 2.4GHz
Iris Xe G7 80EUs
min: 10.2 fps, P1: 43.5 fps, max: 190 fps
Intel Core i5-1240P 1.2GHz
Iris Xe G7 80EUs
min: 6.6 fps, P1: 27.8 fps, max: 255 fps
Intel Core i5-1135G7 2.4GHz
Iris Xe G7 80EUs
min: 8.79 fps, P1: 38.5 fps, max: 284 fps
Intel Core i5-1135G7 2.4GHz
Iris Xe G7 80EUs
min: 15 fps, P1: 43.5 fps, max: 233 fps
Intel Core i7-1250U 0.8GHz
Iris Xe G7 80EUs
min: 6.73 fps, P1: 14.9 fps, max: 162.5 fps
Intel Core i5-1235U 0.9GHz
Iris Xe G7 80EUs
min: 10.2 fps, P1: 47.6 fps, max: 124.4 fps
Intel Core i5-1135G7 2.4GHz
Iris Xe G7 80EUs
min: 17.9 fps, P1: 55.6 fps, max: 97.7 fps
Dual-Channel
Intel Core i5-1135G7 2.4GHz
Iris Xe G7 80EUs
min: 7.73 fps, P1: 50 fps, max: 229 fps
Dual-Channel
Intel Core i5-1135G7 2.4GHz
Iris Xe G7 80EUs
min: 22 fps, P1: 52.6 fps, max: 141 fps
Intel Core i5-1135G7 2.4GHz
Iris Xe G7 80EUs
min: 16.3 fps, P1: 52.6 fps, max: 141 fps
Intel Core i5-1135G7 2.4GHz
Iris Xe G7 80EUs
min: 5.16 fps, P1: 41.7 fps, max: 165.4 fps
Intel Core i5-1345U 1.2GHz
Iris Xe G7 80EUs
min: 17.2 fps, P1: 50 fps, max: 138.8 fps
Intel Core i5-1135G7 2.4GHz
Iris Xe G7 80EUs
min: 20 fps, P1: 50 fps, max: 144 fps
Intel Core i5-1345U 1.2GHz
Iris Xe G7 80EUs
min: 14.4 fps, P1: 52.6 fps, max: 138.3 fps
Intel Core i5-1335U 0.9GHz
Iris Xe G7 80EUs
min: 10.6 fps, P1: 52.6 fps, max: 189.8 fps
Intel Core i5-1135G7 2.4GHz
Iris Xe G7 80EUs
min: 13.4 fps, P1: 55.6 fps, max: 171 fps
Intel Core i5-1135G7 2.4GHz
Iris Xe G7 80EUs
min: 14.9 fps, P1: 50 fps, max: 148 fps
Intel Core i5-1335U 0.9GHz
Iris Xe G7 80EUs
min: 7.05 fps, P1: 52.6 fps, max: 196.2 fps
Intel Core i5-1240P 1.2GHz
Iris Xe G7 80EUs
min: 11.4 fps, P1: 47.6 fps, max: 140.1 fps
Intel Core i5-1240P 1.2GHz
Iris Xe G7 80EUs
min: 15.8 fps, P1: 40 fps, max: 147.1 fps
Intel Core i5-1155G7 2.5GHz
Iris Xe G7 80EUs
min: 15.9 fps, P1: 52.6 fps, max: 165.7 fps
Intel Core i5-1340P 1.4GHz
Iris Xe G7 80EUs
min: 0.55 fps, P1: 24.4 fps, max: 230 fps
Hoch
Intel Core i5-1240P 1.2GHz
Iris Xe G7 80EUs
min: 18.1 fps, P1: 58.8 fps, max: 147 fps
Intel Core i5-1145G7 2.6GHz
Iris Xe G7 80EUs
min: 6.11 fps, P1: 50 fps, max: 237 fps
Intel Core i5-1135G7 2.4GHz
Iris Xe G7 80EUs
min: 21.9 fps, P1: 55.6 fps, max: 151 fps
Intel Core i5-1235U 0.9GHz
Iris Xe G7 80EUs
min: 15.5 fps, P1: 55.6 fps, max: 155.5 fps
Intel Core i5-1155G7 2.5GHz
Iris Xe G7 80EUs
min: 13.5 fps, P1: 55.6 fps, max: 173.7 fps
Intel Core i5-1245U 1.2GHz
Iris Xe G7 80EUs
min: 17.8 fps, P1: 62.5 fps, max: 179 fps
Intel Core i5-1135G7 2.4GHz
Iris Xe G7 80EUs
min: 14.8 fps, P1: 55.6 fps, max: 228 fps
Intel Core i5-1135G7 2.4GHz
Iris Xe G7 80EUs
min: 11.7 fps, P1: 52.6 fps, max: 240 fps
Intel Core i5-1345U 1.2GHz
Iris Xe G7 80EUs
min: 12 fps, P1: 50 fps, max: 188.2 fps
Intel Core i5-1335U 0.9GHz
Iris Xe G7 80EUs
min: 17.3 fps, P1: 58.8 fps, max: 174.6 fps
Intel Core i5-1350P 1.4GHz
Iris Xe G7 80EUs
min: 12.6 fps, P1: 62.5 fps, max: 214 fps
Intel Core i5-11300H 3.1GHz
Iris Xe G7 80EUs
min: 14 fps, P1: 62.5 fps, max: 229 fps
Intel Core 5 120U 0.9GHz
Iris Xe G7 80EUs
min: 12.1 fps, P1: 62.5 fps, max: 165.6 fps
Intel Core i5-1240U 0.8GHz
Iris Xe G7 80EUs
min: 23.4 fps, P1: 62.5 fps, max: 182.2 fps
Intel Core i5-1155G7 2.5GHz
Iris Xe G7 80EUs
min: 15 fps, P1: 62.5 fps, max: 179 fps
Intel Core i5-1335U 0.9GHz
Iris Xe G7 80EUs
min: 17.6 fps, P1: 62.5 fps, max: 194.2 fps
Intel Core i5-1335U 0.9GHz
Iris Xe G7 80EUs
min: 24.5 fps, P1: 66.7 fps, max: 177.6 fps
Intel Core i5-1335U 0.9GHz
Iris Xe G7 80EUs
min: 13 fps, P1: 66.7 fps, max: 252 fps
Intel Core i5-1335U 0.9GHz
Iris Xe G7 80EUs
min: 17.8 fps, P1: 71.4 fps, max: 174 fps
Intel Core i5-1235U 0.9GHz
Iris Xe G7 80EUs
min: 6.23 fps, P1: 83.3 fps, max: 175.7 fps
Intel Core i5-1335U 0.9GHz
Iris Xe G7 80EUs
min: 23.8 fps, P1: 62.5 fps, max: 245 fps
Intel Core i5-1335U 0.9GHz
Iris Xe G7 80EUs
min: 11.9 fps, P1: 55.6 fps, max: 209 fps
Intel Core i5-1240P 1.2GHz
Iris Xe G7 80EUs
min: 19.6 fps, P1: 71.4 fps, max: 167.1 fps
Intel Core i5-1235U 0.9GHz
Iris Xe G7 80EUs
min: 24.8 fps, P1: 71.4 fps, max: 197.3 fps
Intel Core i5-1334U 0.9GHz
Iris Xe G7 80EUs
min: 14.5 fps, P1: 55.6 fps, max: 197.2 fps
Intel Core i5-12500H 1.8GHz
Iris Xe G7 80EUs
min: 21.3 fps, P1: 66.7 fps, max: 237 fps
Intel Core 5 220H 2GHz
Iris Xe G7 80EUs
min: 13 fps, P1: 76.9 fps, max: 259 fps
Intel Core i5-1340P 1.4GHz
Iris Xe G7 80EUs
min: 1.807 fps, P1: 76.9 fps, max: 295 fps
Intel Core i5-13500H 1.9GHz
Iris Xe G7 80EUs
min: 8.46 fps, P1: 100 fps, max: 307 fps
AMD Ryzen 7 PRO 5850U 1.9GHz
Vega 8
min: 17.7 fps, P1: 35.7 fps, max: 94.1 fps
AMD Ryzen 7 5825U 2GHz
Vega 8
min: 10.6 fps, P1: 35.7 fps, max: 107.9 fps
AMD Ryzen 7 PRO 7730U 2GHz
Vega 8
min: 12.9 fps, P1: 41.7 fps, max: 104.7 fps
AMD Ryzen 7 5800U 1.9GHz
Vega 8
min: 11.7 fps, P1: 47.6 fps, max: 109 fps
Flüstermodus
AMD Ryzen 7 5700U 1.8GHz
Vega 8
min: 28.2 fps, P1: 50 fps, max: 159.3 fps
AMD Ryzen 7 5700U 1.8GHz
Vega 8
min: 30.7 fps, P1: 58.8 fps, max: 143 fps
AMD Ryzen 7 5700U 1.8GHz
Vega 8
min: 11.7 fps, P1: 55.6 fps, max: 159 fps
Leistungsmodus
AMD Ryzen 7 5700U 1.8GHz
Vega 8
min: 14.8 fps, P1: 47.6 fps, max: 158 fps
AMD Ryzen 7 5700U 1.8GHz
Vega 8
min: 12.4 fps, P1: 47.6 fps, max: 151 fps
AMD Ryzen 7 7730U 2GHz
Vega 8
min: 11.8 fps, P1: 55.6 fps, max: 153 fps
AMD Ryzen 7 5700U 1.8GHz
Vega 8
min: 10.4 fps, P1: 62.5 fps, max: 150 fps
AMD Ryzen 7 7730U 2GHz
Vega 8
min: 19.3 fps, P1: 62.5 fps, max: 152.9 fps
Leistungsmodus
AMD Ryzen 7 5700U 1.8GHz
Vega 8
min: 21 fps, P1: 47.6 fps, max: 155.7 fps
AMD Ryzen 7 5700U 1.8GHz
Vega 8
min: 12.6 fps, P1: 58.8 fps, max: 169.3 fps
AMD Ryzen 7 5825U 2GHz
Vega 8
min: 11.5 fps, P1: 62.5 fps, max: 146.7 fps
AMD Ryzen 7 5800U 1.9GHz
Vega 8
min: 12.8 fps, P1: 62.5 fps, max: 170 fps
AMD Ryzen 7 5700U 1.8GHz
Vega 8
min: 18.6 fps, P1: 58.8 fps, max: 149.1 fps
AMD Ryzen 7 5825U 2GHz
Vega 8
min: 10.9 fps, P1: 26.3 fps, max: 171.2 fps
Akkusparmodus
AMD Ryzen 9 5900HX @2GHz
Vega 8
min: 26.7 fps, P1: 66.7 fps, max: 212 fps
AMD Ryzen 7 7730U 2GHz
Vega 8
min: 6.7 fps, P1: 66.7 fps, max: 188.2 fps
AMD Ryzen 7 4800U 1.8GHz
Vega 8
min: 10.4 fps, P1: 66.7 fps, max: 168 fps
AMD Ryzen 7 5700U 1.8GHz
Vega 8
min: 11.9 fps, P1: 62.5 fps, max: 165.6 fps
AMD Ryzen 7 5700U 1.8GHz
Vega 8
min: 17.6 fps, P1: 58.8 fps, max: 173 fps
AMD Ryzen 7 7730U 2GHz
Vega 8
min: 12.9 fps, P1: 71.4 fps, max: 180.5 fps
AMD Ryzen 7 5800H 3.2GHz
Vega 8
min: 10.3 fps, P1: 71.4 fps, max: 226 fps
Dual-Channel-Mode
AMD Ryzen 7 PRO 7730U 2GHz
Vega 8
min: 17.7 fps, P1: 71.4 fps, max: 192 fps
AMD Ryzen 7 5700G 3.8GHz
Vega 8
min: 25.6 fps, P1: 76.9 fps, max: 181.1 fps
AMD Ryzen 7 5800H 3.2GHz
Vega 8
min: 14.2 fps, P1: 76.9 fps, max: 182.4 fps
AMD Ryzen 9 5900HX 3.3GHz
Vega 8
min: 17 fps, P1: 76.9 fps, max: 213 fps
AMD Ryzen 9 5900HX 3.3GHz
Vega 8
min: 35.5 fps, P1: 76.9 fps, max: 189 fps
Hoechstleistung
AMD Ryzen 9 5900HX 3.3GHz
Vega 8
min: 37 fps, P1: 83.3 fps, max: 185 fps
AMD Ryzen 7 PRO 5750G 3.8GHz
Vega 8
min: 43.4 fps, P1: 90.9 fps, max: 240 fps
Intel Core i5-1135G7 2.4GHz
Iris Xe G7 80EUs
min: 8.41 fps, P1: 15.9 fps, max: 102 fps
Intel Core i5-1135G7 2.4GHz
Iris Xe G7 80EUs
min: 13.7 fps, P1: 19.2 fps, max: 64.9 fps
Intel Core i5-1135G7 2.4GHz
Iris Xe G7 80EUs
min: 5.01 fps, P1: 17.9 fps, max: 70 fps
Intel Core i5-1135G7 2.4GHz
Iris Xe G7 80EUs
min: 14.3 fps, P1: 21.7 fps, max: 75.8 fps
Intel Core i5-1230U 0.7GHz
Iris Xe G7 80EUs
min: 8.67 fps, P1: 21.3 fps, max: 70.3 fps
Intel Core i5-1130G7 1.8GHz
Iris Xe G7 80EUs
min: 15 fps, P1: 23.3 fps, max: 90.4 fps
Intel Core i5-1135G7 2.4GHz
Iris Xe G7 80EUs
min: 2.69 fps, P1: 23.8 fps, max: 90.9 fps
Intel Core i7-1250U 0.8GHz
Iris Xe G7 80EUs
min: 6 fps, P1: 14.5 fps, max: 150 fps
Intel Core i5-1135G7 2.4GHz
Iris Xe G7 80EUs
min: 10.6 fps, P1: 29.4 fps, max: 236 fps
Intel Core i5-1135G7 2.4GHz
Iris Xe G7 80EUs
min: 11.9 fps, P1: 31.3 fps, max: 74 fps
Intel Core i5-1235U 0.9GHz
Iris Xe G7 80EUs
min: 6.73 fps, P1: 25 fps, max: 85.9 fps
Intel Core i5-1235U 0.9GHz
Iris Xe G7 80EUs
min: 0.983 fps, P1: 25.6 fps, max: 87.8 fps
Intel Core i5-1240P 1.2GHz
Iris Xe G7 80EUs
min: 11.5 fps, P1: 33.3 fps, max: 74.9 fps
Intel Core i5-1335U 0.9GHz
Iris Xe G7 80EUs
min: 17.2 fps, P1: 31.3 fps, max: 93.5 fps
Intel Core i5-1135G7 2.4GHz
Iris Xe G7 80EUs
min: 12.5 fps, P1: 32.3 fps, max: 104 fps
Intel Core i5-1135G7 2.4GHz
Iris Xe G7 80EUs
min: 17.5 fps, P1: 33.3 fps, max: 269 fps
Intel Core i5-1130G7 1.8GHz
Iris Xe G7 80EUs
min: 12.8 fps, P1: 31.3 fps, max: 113 fps
Intel Core i5-1240P 1.2GHz
Iris Xe G7 80EUs
min: 9.55 fps, P1: 37 fps, max: 105 fps
Intel Core i5-1135G7 2.4GHz
Iris Xe G7 80EUs
min: 12.4 fps, P1: 31.3 fps, max: 103.8 fps
Intel Core i5-1135G7 2.4GHz
Iris Xe G7 80EUs
min: 10.9 fps, P1: 43.5 fps, max: 68.4 fps
Intel Core i5-1135G7 2.4GHz
Iris Xe G7 80EUs
min: 10.3 fps, P1: 37 fps, max: 110 fps
Intel Core i5-1135G7 2.4GHz
Iris Xe G7 80EUs
min: 21.1 fps, P1: 31.3 fps, max: 98.8 fps
Intel Core i5-1240P 1.2GHz
Iris Xe G7 80EUs
min: 13 fps, P1: 32.3 fps, max: 114.8 fps
Intel Core i5-1135G7 2.4GHz
Iris Xe G7 80EUs
min: 17.4 fps, P1: 35.7 fps, max: 265 fps
Intel Core i5-1135G7 2.4GHz
Iris Xe G7 80EUs
min: 12.4 fps, P1: 37 fps, max: 97 fps
Intel Core i5-1135G7 2.4GHz
Iris Xe G7 80EUs
min: 14.1 fps, P1: 34.5 fps, max: 107 fps
Intel Core i5-1235U 0.9GHz
Iris Xe G7 80EUs
min: 22.9 fps, P1: 34.5 fps, max: 110.9 fps
Dual-Channel
Intel Core i5-1135G7 2.4GHz
Iris Xe G7 80EUs
min: 20.3 fps, P1: 41.7 fps, max: 105 fps
Dual-Channel
Intel Core i5-1135G7 2.4GHz
Iris Xe G7 80EUs
min: 5.99 fps, P1: 41.7 fps, max: 205 fps
Intel Core i5-1240P 1.2GHz
Iris Xe G7 80EUs
min: 6.74 fps, P1: 32.3 fps, max: 258 fps
Intel Core i5-1235U 0.9GHz
Iris Xe G7 80EUs
min: 16.6 fps, P1: 43.5 fps, max: 113.4 fps
Intel Core i5-1345U 1.2GHz
Iris Xe G7 80EUs
min: 21.2 fps, P1: 43.5 fps, max: 103.6 fps
Intel Core i5-1335U 0.9GHz
Iris Xe G7 80EUs
min: 34.9 fps, P1: 41.7 fps, max: 107.2 fps
Intel Core i5-1335U 0.9GHz
Iris Xe G7 80EUs
min: 20.4 fps, P1: 45.5 fps, max: 109 fps
Intel Core i5-1135G7 2.4GHz
Iris Xe G7 80EUs
min: 7.09 fps, P1: 37 fps, max: 122 fps
Intel Core i5-1135G7 2.4GHz
Iris Xe G7 80EUs
min: 13.1 fps, P1: 34.5 fps, max: 132.2 fps
Intel Core i5-1135G7 2.4GHz
Iris Xe G7 80EUs
min: 11.1 fps, P1: 43.5 fps, max: 202 fps
Intel Core i5-1335U 0.9GHz
Iris Xe G7 80EUs
min: 21.2 fps, P1: 45.5 fps, max: 121.9 fps
Intel Core i5-1345U 1.2GHz
Iris Xe G7 80EUs
min: 19.6 fps, P1: 45.5 fps, max: 118.9 fps
Intel Core i5-1135G7 2.4GHz
Iris Xe G7 80EUs
min: 13.2 fps, P1: 41.7 fps, max: 125.5 fps
Intel Core i5-1240P 1.2GHz
Iris Xe G7 80EUs
min: 12.4 fps, P1: 32.3 fps, max: 123.7 fps
Intel Core i5-1135G7 2.4GHz
Iris Xe G7 80EUs
min: 9.48 fps, P1: 40 fps, max: 142 fps
Intel Core i5-1340P 1.4GHz
Iris Xe G7 80EUs
min: 1.918 fps, P1: 24.4 fps, max: 170.6 fps
Intel Core i5-1135G7 2.4GHz
Iris Xe G7 80EUs
min: 21.5 fps, P1: 50 fps, max: 150 fps
Hoch
Intel Core i5-1240P 1.2GHz
Iris Xe G7 80EUs
min: 15.6 fps, P1: 41.7 fps, max: 126.4 fps
Intel Core i5-1145G7 2.6GHz
Iris Xe G7 80EUs
min: 13.6 fps, P1: 47.6 fps, max: 138.8 fps
Intel Core i5-1235U 0.9GHz
Iris Xe G7 80EUs
min: 19.5 fps, P1: 50 fps, max: 125.7 fps
Intel Core i5-1235U 0.9GHz
Iris Xe G7 80EUs
min: 7.05 fps, P1: 50 fps, max: 177.5 fps
Intel Core i5-1240P 1.2GHz
Iris Xe G7 80EUs
min: 16 fps, P1: 45.5 fps, max: 139.1 fps
Intel Core i5-1135G7 2.4GHz
Iris Xe G7 80EUs
min: 0.4206 fps, P1: 47.6 fps, max: 157 fps
Intel Core i5-1335U 0.9GHz
Iris Xe G7 80EUs
min: 19.7 fps, P1: 47.6 fps, max: 137.5 fps
Intel Core i5-1155G7 2.5GHz
Iris Xe G7 80EUs
min: 18.2 fps, P1: 47.6 fps, max: 153.4 fps
Intel Core i5-1135G7 2.4GHz
Iris Xe G7 80EUs
min: 12.3 fps, P1: 41.7 fps, max: 263 fps
Intel Core i5-1335U 0.9GHz
Iris Xe G7 80EUs
min: 24.1 fps, P1: 50 fps, max: 139.8 fps
Intel Core i5-1155G7 2.5GHz
Iris Xe G7 80EUs
min: 18.2 fps, P1: 52.6 fps, max: 155.7 fps
Intel Core i5-11300H 3.1GHz
Iris Xe G7 80EUs
min: 13.9 fps, P1: 52.6 fps, max: 166 fps
Intel Core i5-1245U 1.2GHz
Iris Xe G7 80EUs
min: 9.45 fps, P1: 55.6 fps, max: 212 fps
Intel Core i5-1155G7 2.5GHz
Iris Xe G7 80EUs
min: 15.7 fps, P1: 55.6 fps, max: 147 fps
Intel Core 5 120U 0.9GHz
Iris Xe G7 80EUs
min: 14.4 fps, P1: 58.8 fps, max: 141 fps
Intel Core i5-1240P 1.2GHz
Iris Xe G7 80EUs
min: 3.15 fps, P1: 55.6 fps, max: 260 fps
Intel Core i5-1345U 1.2GHz
Iris Xe G7 80EUs
min: 7.31 fps, P1: 47.6 fps, max: 224 fps
Intel Core i5-1240U 0.8GHz
Iris Xe G7 80EUs
min: 18.7 fps, P1: 55.6 fps, max: 155.1 fps
Intel Core i5-1335U 0.9GHz
Iris Xe G7 80EUs
min: 21.2 fps, P1: 55.6 fps, max: 158.4 fps
Intel Core i5-1350P 1.4GHz
Iris Xe G7 80EUs
min: 5.63 fps, P1: 58.8 fps, max: 199.2 fps
Intel Core i5-1335U 0.9GHz
Iris Xe G7 80EUs
min: 6.57 fps, P1: 55.6 fps, max: 167.7 fps
Intel Core i5-1235U 0.9GHz
Iris Xe G7 80EUs
min: 6.9 fps, P1: 58.8 fps, max: 169.6 fps
Intel Core i5-1235U 0.9GHz
Iris Xe G7 80EUs
min: 7.72 fps, P1: 66.7 fps, max: 246 fps
Intel Core i5-1335U 0.9GHz
Iris Xe G7 80EUs
min: 19.9 fps, P1: 62.5 fps, max: 152.6 fps
Intel Core i5-1335U 0.9GHz
Iris Xe G7 80EUs
min: 17.2 fps, P1: 50 fps, max: 159.9 fps
Intel Core i5-12500H 1.8GHz
Iris Xe G7 80EUs
min: 19 fps, P1: 58.8 fps, max: 224 fps
Intel Core i5-1334U 0.9GHz
Iris Xe G7 80EUs
min: 15.9 fps, P1: 50 fps, max: 172.6 fps
Intel Core 5 220H 2GHz
Iris Xe G7 80EUs
min: 18.3 fps, P1: 66.7 fps, max: 169.9 fps
Intel Core i5-1340P 1.4GHz
Iris Xe G7 80EUs
min: 11.3 fps, P1: 58.8 fps, max: 198 fps
Intel Core i5-13500H 1.9GHz
Iris Xe G7 80EUs
min: 46.7 fps, P1: 83.3 fps, max: 296 fps
AMD Ryzen 7 5825U 2GHz
Vega 8
min: 8.48 fps, P1: 25.6 fps, max: 102.8 fps
AMD Ryzen 7 PRO 5850U 1.9GHz
Vega 8
min: 18.7 fps, P1: 31.3 fps, max: 127 fps
AMD Ryzen 7 PRO 7730U 2GHz
Vega 8
min: 12.5 fps, P1: 38.5 fps, max: 105.6 fps
AMD Ryzen 7 5700U 1.8GHz
Vega 8
min: 12.2 fps, P1: 33.3 fps, max: 135.1 fps
AMD Ryzen 7 5800U 1.9GHz
Vega 8
min: 10.1 fps, P1: 35.7 fps, max: 129 fps
Flüstermodus
AMD Ryzen 7 5700U 1.8GHz
Vega 8
min: 11.6 fps, P1: 45.5 fps, max: 102.8 fps
AMD Ryzen 7 5700U 1.8GHz
Vega 8
min: 8.28 fps, P1: 47.6 fps, max: 135 fps
AMD Ryzen 7 7730U 2GHz
Vega 8
min: 10.5 fps, P1: 47.6 fps, max: 132.4 fps
AMD Ryzen 7 7730U 2GHz
Vega 8
min: 9.53 fps, P1: 50 fps, max: 131.3 fps
Leistungsmodus
AMD Ryzen 7 5700U 1.8GHz
Vega 8
min: 13 fps, P1: 41.7 fps, max: 137 fps
AMD Ryzen 7 5700U 1.8GHz
Vega 8
min: 23.4 fps, P1: 50 fps, max: 140 fps
Leistungsmodus
AMD Ryzen 7 5700U 1.8GHz
Vega 8
min: 27.3 fps, P1: 41.7 fps, max: 143.3 fps
AMD Ryzen 7 5700U 1.8GHz
Vega 8
min: 42 fps, P1: 52.6 fps, max: 141.4 fps
AMD Ryzen 7 7730U 2GHz
Vega 8
min: 23.7 fps, P1: 55.6 fps, max: 162.4 fps
Akkusparmodus
AMD Ryzen 9 5900HX @2GHz
Vega 8
min: 22.5 fps, P1: 58.8 fps, max: 185 fps
AMD Ryzen 7 5825U 2GHz
Vega 8
min: 9.84 fps, P1: 27.8 fps, max: 144.1 fps
AMD Ryzen 7 5700U 1.8GHz
Vega 8
min: 9.88 fps, P1: 58.8 fps, max: 146.1 fps
AMD Ryzen 7 7730U 2GHz
Vega 8
min: 12.7 fps, P1: 58.8 fps, max: 181.7 fps
AMD Ryzen 7 5700G 3.8GHz
Vega 8
min: 31.8 fps, P1: 66.7 fps, max: 196.1 fps
AMD Ryzen 7 7730U 2GHz
Vega 8
min: 12.8 fps, P1: 62.5 fps, max: 183.9 fps
Dual-Channel-Mode
AMD Ryzen 7 PRO 7730U 2GHz
Vega 8
min: 14.3 fps, P1: 62.5 fps, max: 174 fps
AMD Ryzen 7 5800H 3.2GHz
Vega 8
min: 18.8 fps, P1: 66.7 fps, max: 174 fps
AMD Ryzen 9 5900HX 3.3GHz
Vega 8
min: 13.4 fps, P1: 71.4 fps, max: 185 fps
AMD Ryzen 9 5900HX 3.3GHz
Vega 8
min: 28.7 fps, P1: 71.4 fps, max: 168 fps
Hoechstleistung
AMD Ryzen 9 5900HX 3.3GHz
Vega 8
min: 36.5 fps, P1: 71.4 fps, max: 185 fps
AMD Ryzen 7 PRO 5750G 3.8GHz
Vega 8
min: 40.9 fps, P1: 83.3 fps, max: 218 fps
Intel Core i5-1135G7 2.4GHz
Iris Xe G7 80EUs
min: 2.81 fps, P1: 4.1 fps, max: 111 fps
Intel Core i7-1250U 0.8GHz
Iris Xe G7 80EUs
min: 2.65 fps, P1: 2.96 fps, max: 55.7 fps
Intel Core i5-1135G7 2.4GHz
Iris Xe G7 80EUs
min: 2.1 fps, P1: 4.76 fps, max: 38.2 fps
Intel Core i5-1135G7 2.4GHz
Iris Xe G7 80EUs
min: 4.18 fps, P1: 5.21 fps, max: 25.7 fps
Intel Core i5-1135G7 2.4GHz
Iris Xe G7 80EUs
min: 4.29 fps, P1: 5.38 fps, max: 26.3 fps
Intel Core i5-1240P 1.2GHz
Iris Xe G7 80EUs
min: 4.82 fps, P1: 7.19 fps, max: 26 fps
Intel Core i5-1335U 0.9GHz
Iris Xe G7 80EUs
min: 4.36 fps, P1: 7.52 fps, max: 25.8 fps
Intel Core i5-1135G7 2.4GHz
Iris Xe G7 80EUs
min: 4.66 fps, P1: 7.58 fps, max: 89.2 fps
Intel Core i5-1135G7 2.4GHz
Iris Xe G7 80EUs
min: 4.48 fps, P1: 7.25 fps, max: 18.9 fps
Intel Core i5-1235U 0.9GHz
Iris Xe G7 80EUs
min: 0.853 fps, P1: 3.31 fps, max: 87.7 fps
Intel Core i5-1230U 0.7GHz
Iris Xe G7 80EUs
min: 3.09 fps, P1: 5.59 fps, max: 80.4 fps
Intel Core i5-1235U 0.9GHz
Iris Xe G7 80EUs
min: 3.81 fps, P1: 5.78 fps, max: 40.9 fps
Intel Core i5-1135G7 2.4GHz
Iris Xe G7 80EUs
min: 2.63 fps, P1: 7.25 fps, max: 127 fps
Intel Core i5-1130G7 1.8GHz
Iris Xe G7 80EUs
min: 6.12 fps, P1: 9.17 fps, max: 24.3 fps
Intel Core i5-1335U 0.9GHz
Iris Xe G7 80EUs
min: 7.11 fps, P1: 10.3 fps, max: 111.2 fps
Intel Core i5-1135G7 2.4GHz
Iris Xe G7 80EUs
min: 4.7 fps, P1: 10 fps, max: 78.4 fps
Intel Core i5-1345U 1.2GHz
Iris Xe G7 80EUs
min: 9.29 fps, P1: 10.9 fps, max: 93.5 fps
Intel Core i5-1240P 1.2GHz
Iris Xe G7 80EUs
min: 5.29 fps, P1: 9.8 fps, max: 45.5 fps
Intel Core i5-1135G7 2.4GHz
Iris Xe G7 80EUs
min: 0.933 fps, P1: 6.67 fps, max: 89.4 fps
Intel Core i5-1135G7 2.4GHz
Iris Xe G7 80EUs
min: 6.26 fps, P1: 10.8 fps, max: 25.6 fps
Intel Core i5-1135G7 2.4GHz
Iris Xe G7 80EUs
min: 4.94 fps, P1: 11.8 fps, max: 74.7 fps
Intel Core i5-1235U 0.9GHz
Iris Xe G7 80EUs
min: 4.74 fps, P1: 12.5 fps, max: 95.8 fps
Intel Core i5-1240P 1.2GHz
Iris Xe G7 80EUs
min: 1.86 fps, P1: 6.02 fps, max: 136.8 fps
Intel Core i5-1135G7 2.4GHz
Iris Xe G7 80EUs
min: 6.34 fps, P1: 9.01 fps, max: 44.4 fps
Intel Core i5-1335U 0.9GHz
Iris Xe G7 80EUs
min: 8.54 fps, P1: 12.7 fps, max: 41.4 fps
Intel Core i5-1135G7 2.4GHz
Iris Xe G7 80EUs
min: 5.6 fps, P1: 9.9 fps, max: 54.4 fps
Intel Core i5-1240P 1.2GHz
Iris Xe G7 80EUs
min: 2.3 fps, P1: 13.3 fps, max: 135.5 fps
Intel Core i5-1240P 1.2GHz
Iris Xe G7 80EUs
min: 3.83 fps, P1: 10.2 fps, max: 36.1 fps
Intel Core i5-1135G7 2.4GHz
Iris Xe G7 80EUs
min: 4.41 fps, P1: 12.7 fps, max: 26.2 fps
Intel Core i5-1235U 0.9GHz
Iris Xe G7 80EUs
min: 9.35 fps, P1: 13.5 fps, max: 137.4 fps
Dual-Channel
Intel Core i5-1135G7 2.4GHz
Iris Xe G7 80EUs
min: 8.84 fps, P1: 13.5 fps, max: 38.1 fps
Dual-Channel
Intel Core i5-1135G7 2.4GHz
Iris Xe G7 80EUs
min: 8.95 fps, P1: 13 fps, max: 31.2 fps
Intel Core i5-1235U 0.9GHz
Iris Xe G7 80EUs
min: 6.23 fps, P1: 13.7 fps, max: 35.7 fps
Intel Core i5-1240P 1.2GHz
Iris Xe G7 80EUs
min: 5.96 fps, P1: 12.8 fps, max: 40.4 fps
Intel Core i5-1235U 0.9GHz
Iris Xe G7 80EUs
min: 8.22 fps, P1: 13.2 fps, max: 92.9 fps
Intel Core i5-1240U 0.8GHz
Iris Xe G7 80EUs
min: 6.37 fps, P1: 13.7 fps, max: 117.1 fps
Intel Core i5-1335U 0.9GHz
Iris Xe G7 80EUs
min: 6.42 fps, P1: 13.5 fps, max: 142.1 fps
Intel Core i5-1130G7 1.8GHz
Iris Xe G7 80EUs
min: 4.98 fps, P1: 14.5 fps, max: 113 fps
Intel Core i5-1240P 1.2GHz
Iris Xe G7 80EUs
min: 6.61 fps, P1: 13.7 fps, max: 44.3 fps
Intel Core i5-1335U 0.9GHz
Iris Xe G7 80EUs
min: 7.46 fps, P1: 13.9 fps, max: 35.3 fps
Intel Core i5-1235U 0.9GHz
Iris Xe G7 80EUs
min: 7.23 fps, P1: 15.2 fps, max: 43.8 fps
Intel Core i5-1235U 0.9GHz
Iris Xe G7 80EUs
min: 8.58 fps, P1: 15.6 fps, max: 100.9 fps
Intel Core i5-1335U 0.9GHz
Iris Xe G7 80EUs
min: 8.11 fps, P1: 14.7 fps, max: 37.6 fps
Intel Core i5-1345U 1.2GHz
Iris Xe G7 80EUs
min: 7.08 fps, P1: 14.5 fps, max: 127.1 fps
Hoch
Intel Core i5-1240P 1.2GHz
Iris Xe G7 80EUs
min: 8.63 fps, P1: 15.6 fps, max: 53 fps
Intel Core i5-1345U 1.2GHz
Iris Xe G7 80EUs
min: 7.69 fps, P1: 15.4 fps, max: 64.5 fps
Intel Core i5-1335U 0.9GHz
Iris Xe G7 80EUs
min: 9 fps, P1: 15.2 fps, max: 50.7 fps
Intel Core i5-1334U 0.9GHz
Iris Xe G7 80EUs
min: 5.71 fps, P1: 14.5 fps, max: 90.3 fps
Intel Core i5-1135G7 2.4GHz
Iris Xe G7 80EUs
min: 8.42 fps, P1: 14.9 fps, max: 119 fps
Intel Core i5-1335U 0.9GHz
Iris Xe G7 80EUs
min: 9.36 fps, P1: 16.1 fps, max: 45.1 fps
Intel Core i5-1335U 0.9GHz
Iris Xe G7 80EUs
min: 7.8 fps, P1: 15.6 fps, max: 57.8 fps
Intel Core i5-1335U 0.9GHz
Iris Xe G7 80EUs
min: 7.39 fps, P1: 15.9 fps, max: 47.8 fps
Intel Core i5-12500H 1.8GHz
Iris Xe G7 80EUs
min: 8.1 fps, P1: 16.4 fps, max: 104.2 fps
Intel Core i5-1245U 1.2GHz
Iris Xe G7 80EUs
min: 11 fps, P1: 16.7 fps, max: 187.7 fps
Intel Core i5-1135G7 2.4GHz
Iris Xe G7 80EUs
min: 5.93 fps, P1: 15.2 fps, max: 63.5 fps
Intel Core 5 120U 0.9GHz
Iris Xe G7 80EUs
min: 8.86 fps, P1: 15.9 fps, max: 162.9 fps
Intel Core i5-1135G7 2.4GHz
Iris Xe G7 80EUs
min: 6.58 fps, P1: 14.1 fps, max: 106 fps
Intel Core i5-1350P 1.4GHz
Iris Xe G7 80EUs
min: 11.5 fps, P1: 17.2 fps, max: 49.4 fps
Intel Core i5-1135G7 2.4GHz
Iris Xe G7 80EUs
min: 3.54 fps, P1: 11.1 fps, max: 61.2 fps
Intel Core i5-1135G7 2.4GHz
Iris Xe G7 80EUs
min: 7.44 fps, P1: 16.9 fps, max: 126 fps
Intel Core i5-1135G7 2.4GHz
Iris Xe G7 80EUs
min: 1.566 fps, P1: 8.55 fps, max: 68.8 fps
Intel Core i5-13500H 1.9GHz
Iris Xe G7 80EUs
min: 14.7 fps, P1: 18.9 fps, max: 185.5 fps
Intel Core i5-11300H 3.1GHz
Iris Xe G7 80EUs
min: 7.11 fps, P1: 18.5 fps, max: 137 fps
Intel Core i5-1340P 1.4GHz
Iris Xe G7 80EUs
min: 4.58 fps, P1: 11.2 fps, max: 275 fps
Intel Core i5-1155G7 2.5GHz
Iris Xe G7 80EUs
min: 9.11 fps, P1: 18.2 fps, max: 141.7 fps
Intel Core i5-1135G7 2.4GHz
Iris Xe G7 80EUs
min: 5.51 fps, P1: 15.4 fps, max: 109 fps
Intel Core i5-1135G7 2.4GHz
Iris Xe G7 80EUs
min: 6.13 fps, P1: 19.6 fps, max: 39.8 fps
Intel Core i5-1135G7 2.4GHz
Iris Xe G7 80EUs
min: 6.56 fps, P1: 20.4 fps, max: 120.4 fps
Intel Core 5 220H 2GHz
Iris Xe G7 80EUs
min: 5.21 fps, P1: 19.6 fps, max: 82.7 fps
Intel Core i5-1145G7 2.6GHz
Iris Xe G7 80EUs
min: 2.45 fps, P1: 15.6 fps, max: 196 fps
Intel Core i5-1155G7 2.5GHz
Iris Xe G7 80EUs
min: 7.62 fps, P1: 19.2 fps, max: 38.7 fps
Intel Core i5-1135G7 2.4GHz
Iris Xe G7 80EUs
min: 2.85 fps, P1: 16.7 fps, max: 139 fps
Intel Core i5-1155G7 2.5GHz
Iris Xe G7 80EUs
min: 7.89 fps, P1: 20.8 fps, max: 138 fps
AMD Ryzen 7 PRO 5850U 1.9GHz
Vega 8
min: 3.81 fps, P1: 9.71 fps, max: 84.3 fps
AMD Ryzen 7 5825U 2GHz
Vega 8
min: 4.72 fps, P1: 10.8 fps, max: 45.2 fps
AMD Ryzen 7 PRO 7730U 2GHz
Vega 8
min: 3.31 fps, P1: 10.5 fps, max: 76.6 fps
AMD Ryzen 7 5700U 1.8GHz
Vega 8
min: 4.45 fps, P1: 11.6 fps, max: 28 fps
AMD Ryzen 7 5800U 1.9GHz
Vega 8
min: 5.37 fps, P1: 12.2 fps, max: 22.3 fps
AMD Ryzen 7 7730U 2GHz
Vega 8
min: 2.27 fps, P1: 15.4 fps, max: 29.8 fps
AMD Ryzen 7 7730U 2GHz
Vega 8
min: 1.978 fps, P1: 15.9 fps, max: 88.3 fps
AMD Ryzen 7 5825U 2GHz
Vega 8
min: 4.83 fps, P1: 16.4 fps, max: 110.7 fps
AMD Ryzen 7 5800U 1.9GHz
Vega 8
min: 3.38 fps, P1: 16.9 fps, max: 118 fps
AMD Ryzen 7 5700U 1.8GHz
Vega 8
min: 3.36 fps, P1: 14.3 fps, max: 100 fps
AMD Ryzen 7 5700U 1.8GHz
Vega 8
min: 4.04 fps, P1: 17.5 fps, max: 31.4 fps
AMD Ryzen 7 5700U 1.8GHz
Vega 8
min: 4.64 fps, P1: 17.2 fps, max: 40.4 fps
AMD Ryzen 7 5825U 2GHz
Vega 8
min: 3.45 fps, P1: 17.2 fps, max: 129.7 fps
AMD Ryzen 7 5700U 1.8GHz
Vega 8
min: 4.58 fps, P1: 18.2 fps, max: 33.1 fps
Leistungsmodus
AMD Ryzen 7 5700U 1.8GHz
Vega 8
min: 4.78 fps, P1: 18.2 fps, max: 33.5 fps
AMD Ryzen 7 5700U 1.8GHz
Vega 8
min: 4.1 fps, P1: 18.2 fps, max: 36.8 fps
AMD Ryzen 7 5800H 3.2GHz
Vega 8
min: 6.93 fps, P1: 18.9 fps, max: 126 fps
AMD Ryzen 7 5700G 3.8GHz
Vega 8
min: 10.4 fps, P1: 18.9 fps, max: 182.9 fps
AMD Ryzen 7 7730U 2GHz
Vega 8
min: 9.64 fps, P1: 19.2 fps, max: 91.2 fps
AMD Ryzen 9 5900HX 3.3GHz
Vega 8
min: 7.07 fps, P1: 20 fps, max: 36.3 fps
AMD Ryzen 7 7730U 2GHz
Vega 8
min: 4.53 fps, P1: 20 fps, max: 112.8 fps
AMD Ryzen 7 5800H 3.2GHz
Vega 8
min: 8.24 fps, P1: 19.6 fps, max: 135.9 fps
AMD Ryzen 7 5700U 1.8GHz
Vega 8
min: 4.98 fps, P1: 20.4 fps, max: 111 fps
AMD Ryzen 7 5700U 1.8GHz
Vega 8
min: 4.95 fps, P1: 21.3 fps, max: 53.5 fps
AMD Ryzen 7 PRO 5850U 1.9GHz
Vega 8
min: 9.17 fps, P1: 21.3 fps, max: 61.8 fps
AMD Ryzen 9 5900HX 3.3GHz
Vega 8
min: 6.21 fps, P1: 20.4 fps, max: 192 fps
Dual-Channel-Mode
AMD Ryzen 7 PRO 7730U 2GHz
Vega 8
min: 4.22 fps, P1: 20.8 fps, max: 38.7 fps
AMD Ryzen 7 4800U 1.8GHz
Vega 8
min: 3.22 fps, P1: 21.3 fps, max: 83.4 fps
AMD Ryzen 7 PRO 5750G 3.8GHz
Vega 8
min: 15.6 fps, P1: 24.4 fps, max: 72.2 fps
Intel Core i5-1135G7 2.4GHz
Iris Xe G7 80EUs
min: 0.823 fps, P1: 2.16 fps, max: 8.39 fps
Intel Core i5-1135G7 2.4GHz
Iris Xe G7 80EUs
min: 0.749 fps, P1: 2.38 fps, max: 7.21 fps
Intel Core i5-1135G7 2.4GHz
Iris Xe G7 80EUs
min: 1.737 fps, P1: 2.45 fps, max: 7.87 fps
Intel Core i5-1135G7 2.4GHz
Iris Xe G7 80EUs
min: 1.749 fps, P1: 2.52 fps, max: 8.13 fps
Intel Core i5-1335U 0.9GHz
Iris Xe G7 80EUs
min: 2.08 fps, P1: 2.51 fps, max: 18 fps
Intel Core i5-1135G7 2.4GHz
Iris Xe G7 80EUs
min: 1.61 fps, P1: 3.57 fps, max: 87.3 fps
Intel Core i5-1135G7 2.4GHz
Iris Xe G7 80EUs
min: 2.33 fps, P1: 3.61 fps, max: 13.4 fps
Intel Core i5-1135G7 2.4GHz
Iris Xe G7 80EUs
min: 1.938 fps, P1: 3.16 fps, max: 84.2 fps
Intel Core i5-1235U 0.9GHz
Iris Xe G7 80EUs
min: 0.868 fps, P1: 3.07 fps, max: 69.9 fps
Intel Core i5-1335U 0.9GHz
Iris Xe G7 80EUs
min: 2.92 fps, P1: 3.36 fps, max: 19.2 fps
Intel Core i5-1235U 0.9GHz
Iris Xe G7 80EUs
min: 2.11 fps, P1: 3 fps, max: 16.1 fps
Intel Core i5-1135G7 2.4GHz
Iris Xe G7 80EUs
min: 2.33 fps, P1: 4.67 fps, max: 68.3 fps
Intel Core i5-1135G7 2.4GHz
Iris Xe G7 80EUs
min: 1.273 fps, P1: 3.98 fps, max: 12.6 fps
Intel Core i5-1345U 1.2GHz
Iris Xe G7 80EUs
min: 2.98 fps, P1: 3.75 fps, max: 82.9 fps
Intel Core i5-1230U 0.7GHz
Iris Xe G7 80EUs
min: 1.275 fps, P1: 2.14 fps, max: 36.5 fps
Intel Core i5-1240P 1.2GHz
Iris Xe G7 80EUs
min: 0.771 fps, P1: 3.61 fps, max: 26.8 fps
Intel Core i5-1135G7 2.4GHz
Iris Xe G7 80EUs
min: 2.13 fps, P1: 5.08 fps, max: 85.7 fps
Intel Core i5-1135G7 2.4GHz
Iris Xe G7 80EUs
min: 1.56 fps, P1: 4.29 fps, max: 18.9 fps
Dual-Channel
Intel Core i5-1135G7 2.4GHz
Iris Xe G7 80EUs
min: 3.2 fps, P1: 4.13 fps, max: 16.7 fps
Dual-Channel
Intel Core i5-1135G7 2.4GHz
Iris Xe G7 80EUs
min: 3.4 fps, P1: 4.18 fps, max: 18.2 fps
Intel Core i5-1235U 0.9GHz
Iris Xe G7 80EUs
min: 3.21 fps, P1: 4.05 fps, max: 79.9 fps
Intel Core i5-1335U 0.9GHz
Iris Xe G7 80EUs
min: 3.67 fps, P1: 4.13 fps, max: 30.8 fps
Intel Core i5-1240P 1.2GHz
Iris Xe G7 80EUs
min: 3.57 fps, P1: 4.52 fps, max: 135.5 fps
Intel Core i5-1240P 1.2GHz
Iris Xe G7 80EUs
min: 2.93 fps, P1: 4.15 fps, max: 33.4 fps
Intel Core i5-1235U 0.9GHz
Iris Xe G7 80EUs
min: 3.52 fps, P1: 4.12 fps, max: 31.4 fps
Intel Core i5-1135G7 2.4GHz
Iris Xe G7 80EUs
min: 2.23 fps, P1: 6.1 fps, max: 26.2 fps
Intel Core i5-1240P 1.2GHz
Iris Xe G7 80EUs
min: 1.936 fps, P1: 4.76 fps, max: 21 fps
Intel Core i5-1240U 0.8GHz
Iris Xe G7 80EUs
min: 2.93 fps, P1: 4.93 fps, max: 76.2 fps
Intel Core i5-1135G7 2.4GHz
Iris Xe G7 80EUs
min: 3.68 fps, P1: 5.03 fps, max: 25.9 fps
Intel Core i5-1335U 0.9GHz
Iris Xe G7 80EUs
min: 2.9 fps, P1: 5.24 fps, max: 24.4 fps
Intel Core i5-1235U 0.9GHz
Iris Xe G7 80EUs
min: 3.96 fps, P1: 4.9 fps, max: 67.9 fps
Intel Core i5-1235U 0.9GHz
Iris Xe G7 80EUs
min: 3.64 fps, P1: 4.98 fps, max: 99.5 fps
Hoch
Intel Core i5-1240P 1.2GHz
Iris Xe G7 80EUs
min: 3.82 fps, P1: 5.13 fps, max: 27.8 fps
Intel Core i5-1335U 0.9GHz
Iris Xe G7 80EUs
min: 3.99 fps, P1: 5.59 fps, max: 74.9 fps
Intel Core i5-1345U 1.2GHz
Iris Xe G7 80EUs
min: 3.75 fps, P1: 5.65 fps, max: 25.5 fps
Intel Core i5-1235U 0.9GHz
Iris Xe G7 80EUs
min: 3.82 fps, P1: 5.18 fps, max: 91.6 fps
Intel Core i5-1335U 0.9GHz
Iris Xe G7 80EUs
min: 4.4 fps, P1: 5.32 fps, max: 99.5 fps
Intel Core i5-1345U 1.2GHz
Iris Xe G7 80EUs
min: 4.42 fps, P1: 5.46 fps, max: 36.6 fps
Intel Core i5-1130G7 1.8GHz
Iris Xe G7 80EUs
min: 2.2 fps, P1: 6.49 fps, max: 68.3 fps
Intel Core i5-1335U 0.9GHz
Iris Xe G7 80EUs
min: 3.8 fps, P1: 5.18 fps, max: 30.7 fps
Intel Core i5-1235U 0.9GHz
Iris Xe G7 80EUs
min: 4.07 fps, P1: 5.38 fps, max: 90.6 fps
Intel Core i5-1334U 0.9GHz
Iris Xe G7 80EUs
min: 3.68 fps, P1: 6.33 fps, max: 44 fps
Intel Core i5-1135G7 2.4GHz
Iris Xe G7 80EUs
min: 0.645 fps, P1: 5.85 fps, max: 29 fps
Intel Core i5-1335U 0.9GHz
Iris Xe G7 80EUs
min: 4.42 fps, P1: 5.41 fps, max: 33.2 fps
Intel Core i5-1335U 0.9GHz
Iris Xe G7 80EUs
min: 4.15 fps, P1: 5.56 fps, max: 32.8 fps
Intel Core i5-1135G7 2.4GHz
Iris Xe G7 80EUs
min: 3.68 fps, P1: 6.76 fps, max: 39.6 fps
Intel Core i5-1245U 1.2GHz
Iris Xe G7 80EUs
min: 4.28 fps, P1: 5.71 fps, max: 31 fps
Intel Core 5 120U 0.9GHz
Iris Xe G7 80EUs
min: 4.54 fps, P1: 5.43 fps, max: 37.7 fps
Intel Core i5-1350P 1.4GHz
Iris Xe G7 80EUs
min: 5.37 fps, P1: 7.81 fps, max: 93 fps
Intel Core i5-12500H 1.8GHz
Iris Xe G7 80EUs
min: 3.86 fps, P1: 5.75 fps, max: 37.3 fps
Intel Core i5-11300H 3.1GHz
Iris Xe G7 80EUs
min: 3.4 fps, P1: 7.58 fps, max: 46.6 fps
Intel Core i5-1135G7 2.4GHz
Iris Xe G7 80EUs
min: 0.943 fps, P1: 4.95 fps, max: 53.1 fps
Intel Core i5-1135G7 2.4GHz
Iris Xe G7 80EUs
min: 2.22 fps, P1: 7.19 fps, max: 84.6 fps
Intel Core i5-1135G7 2.4GHz
Iris Xe G7 80EUs
min: 2.93 fps, P1: 6.99 fps, max: 40.6 fps
Intel Core i5-1155G7 2.5GHz
Iris Xe G7 80EUs
min: 3.87 fps, P1: 7.75 fps, max: 115.5 fps
Intel Core i5-1340P 1.4GHz
Iris Xe G7 80EUs
min: 0.768 fps, P1: 6.33 fps, max: 42.2 fps
Intel Core i5-13500H 1.9GHz
Iris Xe G7 80EUs
min: 4.68 fps, P1: 5.59 fps, max: 44.6 fps
Intel Core i5-1145G7 2.6GHz
Iris Xe G7 80EUs
min: 2.08 fps, P1: 7.58 fps, max: 27.1 fps
Intel Core i5-1135G7 2.4GHz
Iris Xe G7 80EUs
min: 2.19 fps, P1: 7.75 fps, max: 48.6 fps
Intel Core i5-1155G7 2.5GHz
Iris Xe G7 80EUs
min: 4.16 fps, P1: 8.2 fps, max: 114.8 fps
Intel Core i5-1135G7 2.4GHz
Iris Xe G7 80EUs
min: 1.552 fps, P1: 7.63 fps, max: 16 fps
Intel Core 5 220H 2GHz
Iris Xe G7 80EUs
min: 3.98 fps, P1: 8.55 fps, max: 33.7 fps
Intel Core i5-1155G7 2.5GHz
Iris Xe G7 80EUs
min: 4.23 fps, P1: 8.26 fps, max: 47.5 fps
Intel Core i5-1135G7 2.4GHz
Iris Xe G7 80EUs
min: 3.49 fps, P1: 9.17 fps, max: 55.5 fps
Intel Core i5-1135G7 2.4GHz
Iris Xe G7 80EUs
min: 0.4288 fps, P1: 7.63 fps, max: 102 fps
AMD Ryzen 7 5825U 2GHz
Vega 8
min: 1.339 fps, P1: 4.18 fps, max: 82 fps
AMD Ryzen 7 PRO 5850U 1.9GHz
Vega 8
min: 1.778 fps, P1: 4.35 fps, max: 86.3 fps
AMD Ryzen 7 PRO 7730U 2GHz
Vega 8
min: 1.278 fps, P1: 4.46 fps, max: 68.8 fps
AMD Ryzen 7 5800U 1.9GHz
Vega 8
min: 2.53 fps, P1: 5.05 fps, max: 19.1 fps
AMD Ryzen 7 5700U 1.8GHz
Vega 8
min: 2.51 fps, P1: 5.41 fps, max: 96.2 fps
AMD Ryzen 7 7730U 2GHz
Vega 8
min: 1.351 fps, P1: 5.95 fps, max: 72.1 fps
AMD Ryzen 7 5800U 1.9GHz
Vega 8
min: 2.33 fps, P1: 6.54 fps, max: 105 fps
AMD Ryzen 7 5700U 1.8GHz
Vega 8
min: 1.991 fps, P1: 6.67 fps, max: 22.3 fps
AMD Ryzen 7 7730U 2GHz
Vega 8
min: 1.481 fps, P1: 6.54 fps, max: 115.7 fps
AMD Ryzen 7 5700U 1.8GHz
Vega 8
min: 2.63 fps, P1: 7.09 fps, max: 132 fps
AMD Ryzen 7 7730U 2GHz
Vega 8
min: 0.946 fps, P1: 7.09 fps, max: 75.8 fps
AMD Ryzen 7 5800H 3.2GHz
Vega 8
min: 3.52 fps, P1: 7.35 fps, max: 118 fps
AMD Ryzen 7 5700U 1.8GHz
Vega 8
min: 1.901 fps, P1: 7.41 fps, max: 36.1 fps
AMD Ryzen 7 5700U 1.8GHz
Vega 8
min: 3.2 fps, P1: 8 fps, max: 136.4 fps
AMD Ryzen 7 5800H 3.2GHz
Vega 8
min: 6.44 fps, P1: 7.94 fps, max: 19.5 fps
AMD Ryzen 7 5825U 2GHz
Vega 8
min: 1.235 fps, P1: 7.52 fps, max: 95 fps
AMD Ryzen 7 5700G 3.8GHz
Vega 8
min: 5.88 fps, P1: 8.26 fps, max: 32.9 fps
AMD Ryzen 7 5700U 1.8GHz
Vega 8
min: 2.5 fps, P1: 8 fps, max: 35.5 fps
AMD Ryzen 7 5700U 1.8GHz
Vega 8
min: 2.66 fps, P1: 8.13 fps, max: 20.7 fps
AMD Ryzen 7 7730U 2GHz
Vega 8
min: 3.02 fps, P1: 8.26 fps, max: 103.6 fps
AMD Ryzen 9 5900HX 3.3GHz
Vega 8
min: 3.91 fps, P1: 8.93 fps, max: 33.5 fps
AMD Ryzen 7 5700U 1.8GHz
Vega 8
min: 3.25 fps, P1: 8.62 fps, max: 64.3 fps
AMD Ryzen 7 4800U 1.8GHz
Vega 8
min: 1.902 fps, P1: 8.4 fps, max: 63.6 fps
AMD Ryzen 7 7730U 2GHz
Vega 8
min: 1.009 fps, P1: 8.2 fps, max: 18.8 fps
Dual-Channel-Mode
AMD Ryzen 7 PRO 7730U 2GHz
Vega 8
min: 2.68 fps, P1: 8.93 fps, max: 99.6 fps
AMD Ryzen 9 5900HX 3.3GHz
Vega 8
min: 2.18 fps, P1: 9.43 fps, max: 28.9 fps
AMD Ryzen 7 PRO 5850U 1.9GHz
Vega 8
min: 6.58 fps, P1: 9.9 fps, max: 48.6 fps
AMD Ryzen 7 PRO 5750G 3.8GHz
Vega 8
min: 9.14 fps, P1: 11.2 fps, max: 60.5 fps
Intel Core i5-1240P 1.2GHz
Iris Xe G7 80EUs
min: 1.325 fps, P1: 2.75 fps, max: 127.6 fps
Intel Core i5-1335U 0.9GHz
Iris Xe G7 80EUs
min: 2.79 fps, P1: 3.5 fps, max: 102.4 fps
Intel Core i5-1340P 1.4GHz
Iris Xe G7 80EUs
min: 0.804 fps, P1: 4.59 fps, max: 34 fps
Intel Core i5-1145G7 2.6GHz
Iris Xe G7 80EUs
min: 0.825 fps, P1: 5.08 fps, max: 26.5 fps
AMD Ryzen 9 5900HX 3.3GHz
Vega 8
min: 3.56 fps, P1: 6.1 fps, max: 20.3 fps
AMD Ryzen 7 PRO 5850U 1.9GHz
Vega 8
min: 4.76 fps, P1: 6.8 fps, max: 21 fps
AMD Ryzen 9 5900HX 3.3GHz
Vega 8
min: 1.554 fps, P1: 6.33 fps, max: 19.2 fps
AMD Ryzen 9 5900HX 3.3GHz
Vega 8
min: 4.51 fps, P1: 6.21 fps, max: 187 fps
AMD Ryzen 7 PRO 5850U 1.9GHz
Vega 8
min: 4.78 fps, P1: 6.71 fps, max: 33.6 fps
BioShock Infinite
2013Counter-Strike: GO
2012AMD Ryzen 9 5900HX 3.3GHz
Vega 8
min: 29.4 fps, P0.1: 71.4 fps, P1: 106 fps, max: 874 fps
AMD Ryzen 9 5900HX 3.3GHz
Vega 8
min: 21.7 fps, P0.1: 43.7 fps, P1: 92.2 fps, max: 465 fps
AMD Ryzen 9 5900HX 3.3GHz
Vega 8
min: 41.9 fps, P0.1: 42.9 fps, P1: 59.6 fps, max: 237 fps
AMD Ryzen 9 5900HX 3.3GHz
Vega 8
min: 25.5 fps, P0.1: 33.8 fps, P1: 39.9 fps, max: 87.2 fps
AMD Ryzen 9 5900HX 3.3GHz
Vega 8
min: 8.42 fps, P0.1: 8.53 fps, P1: 10.9 fps, max: 188 fps
Average Gaming Intel Iris Xe Graphics G7 80EUs → 100%
Average Gaming 30-70 fps → 100%
Average Gaming AMD Radeon RX Vega 8 (Ryzen 4000/5000) → 126%
Average Gaming 30-70 fps → 132%
| Intel Iris Xe Graphics G7 80EUs | AMD Radeon RX Vega 8 (Ryzen 4000/5000) | |||||||||||||
|---|---|---|---|---|---|---|---|---|---|---|---|---|---|---|
| low | med. | high | ultra | QHD | 4K | low | med. | high | ultra | QHD | 4K | |||
| F1 25 | 31.1 | 25.4 | 18.3 | 13.7 | ||||||||||
| Civilization 7 | 50.2 | 22.5 | 11.9 | |||||||||||
| Kingdom Come Deliverance 2 | 14.6 | 11.7 | 9.99 | 6.98 | ||||||||||
| Call of Duty Black Ops 6 | 15 | 14 | 10 | |||||||||||
| God of War Ragnarök | 13.8 | 10.7 | 8.96 | |||||||||||
| Space Marine 2 | 10 | 8.32 | ||||||||||||
| Last Epoch | 18.7 | 15.9 | 12.3 | 10.6 | ||||||||||
| Helldivers 2 | 15.5 | 11.2 | 9.8 | |||||||||||
| Palworld | 16 | 13.2 | ||||||||||||
| Prince of Persia The Lost Crown | 61.3 | 53.2 | 51.9 | |||||||||||
| Ready or Not | 23.4 | 20.9 | 20.4 | 13.2 | ||||||||||
| The Finals | 27.4 | 20 | 18.4 | 14.4 | ||||||||||
| EA Sports WRC | 13.5 | 14.2 | ||||||||||||
| Total War Pharaoh | 45 | 32 | 22 | 22.4 | 16.8 | 46.4 | 33.5 | 18.4 | 14.4 | |||||
| Assassin's Creed Mirage | 17 | 16 | 17 | 16 | ||||||||||
| EA Sports FC 24 | 34.6 | 34 | ||||||||||||
| Counter-Strike 2 | 31.1 | 23.7 | 14.8 | 9.76 | 62.8 | 43.4 | 21.9 | 15.9 | ||||||
| Cyberpunk 2077 | 15 | 12 | 10 | 8 | 6.05 | 14 | 11 | 9 | 9 | |||||
| Baldur's Gate 3 | 15 | 12 | 10 | 10 | 5.45 | 14 | 12 | 9 | 11.5 | |||||
| Lies of P | 17.8 | 15.5 | 13.2 | 11.8 | 8.05 | 21.6 | 18.6 | 16.1 | 13.3 | |||||
| Armored Core 6 | 27.8 | 23 | 20.2 | 15.5 | 11.2 | 22.8 | 16.8 | 15.2 | 11.2 | |||||
| Atlas Fallen | 17.6 | 16.9 | 15.2 | 12.5 | 8.51 | 15.3 | 15.1 | 14.1 | ||||||
| Ratchet & Clank Rift Apart | 11.5 | |||||||||||||
| F1 23 | 33 | 30 | 21 | 32 | 28 | 21 | 15 | |||||||
| Diablo 4 | 34 | 28.1 | 24 | 20.1 | 13.6 | 21.7 | 18.1 | 15.5 | 14 | |||||
| Dead Island 2 | 30.5 | 25.9 | 19 | 14.3 | 9.91 | 30.1 | 25.8 | 19.7 | 13.3 | |||||
| Resident Evil 4 Remake | 13.5 | 10.1 | ||||||||||||
| Company of Heroes 3 | 23.2 | 20.9 | 15.9 | 15.8 | 27.4 | 24.3 | 18.8 | |||||||
| Sons of the Forest | 10.2 | 7.74 | 18.7 | 11.7 | ||||||||||
| Atomic Heart | 22.6 | 16.4 | 11.7 | 8.42 | 24.3 | 18.9 | 11.2 | |||||||
| Hogwarts Legacy | 13.6 | 17.9 | 13.9 | 10.3 | ||||||||||
| Dead Space Remake | 8.26 | 10.5 | ||||||||||||
| The Witcher 3 v4 | 20.7 | 15.9 | 7.41 | 24.4 | 17.6 | 7.14 | ||||||||
| High On Life | 28 | 17 | 16 | 11 | 40 | 19.7 | 18.2 | 12.2 | ||||||
| The Callisto Protocol | 14 | 10 | 6 | 6.9 | 24.9 | 15.2 | 13.9 | |||||||
| Need for Speed Unbound | 13 | 11 | 9 | 9.31 | 23.7 | 18.7 | 14.9 | |||||||
| Spider-Man Miles Morales | 11 | 11 | 10 | 12.7 | ||||||||||
| Call of Duty Modern Warfare 2 2022 | 12 | 10 | 8 | 14 | 28 | 27 | 20 | |||||||
| Uncharted Legacy of Thieves Collection | 7 | 7 | 4.49 | 12 | ||||||||||
| A Plague Tale Requiem | 9 | 7 | 6 | 6.7 | 15.7 | 12.7 | 10.7 | |||||||
| FIFA 23 | 28.6 | 28.4 | ||||||||||||
| The Quarry | 12 | 9 | 6 | 17 | 11 | 9 | 6.12 | |||||||
| F1 22 | 36 | 33 | 25 | 20 | 35 | 31 | 23 | 18 | ||||||
| Vampire Bloodhunt | 41 | 25 | 23 | 53 | 35 | 24 | 30.5 | 18.4 | 8.68 | |||||
| Ghostwire Tokyo | 20 | 16 | 13.2 | 17 | 16 | 16 | 18 | 12.5 | 6.11 | |||||
| Tiny Tina's Wonderlands | 23 | 16 | 10 | 10 | 30 | 23 | 14 | 11 | 9.97 | 5.06 | ||||
| Cyberpunk 2077 1.6 | 14 | 13 | 10 | 9 | 6.06 | 18 | 13 | 9 | 8 | 4.8 | ||||
| Elex 2 | 15 | 13 | 10 | 7 | 14 | 12 | 10 | 11 | 7.55 | |||||
| GRID Legends | 42 | 34 | 28 | 21 | 64 | 43 | 35 | 26 | 19 | 10 | ||||
| Elden Ring | 24 | 17 | 14 | 13.3 | 32 | 30 | 27 | 23 | 17 | 9 | ||||
| Dying Light 2 | 12 | 10 | 9 | 20 | 15 | 13 | 12 | 7 | ||||||
| Rainbow Six Extraction | 11 | 10 | 10 | 13 | 27 | 25 | 23 | 17 | 12 | 6 | ||||
| God of War | 18 | 16 | 15 | 12 | 19 | 14 | 11 | 8 | ||||||
| Farming Simulator 22 | 58 | 29 | 24 | 22 | 127 | 48 | 33 | 27 | 22 | 13 | ||||
| Battlefield 2042 | 29.9 | 14.3 | 12.4 | 39 | 19 | 15 | 10.9 | |||||||
| Forza Horizon 5 | 52 | 21 | 20 | 72 | 32 | 28 | 17 | 13 | 8 | |||||
| Riders Republic | 27 | 15 | 13 | 9 | 5 | 38 | 22 | 16 | 14 | 11 | 5 | |||
| Back 4 Blood | 46 | 24 | 23 | 20 | 94 | 32 | 27 | 23 | 15.5 | 7.53 | ||||
| Far Cry 6 | 0 | 48 | 23 | 18 | 17 | 12 | 4.93 | |||||||
| Alan Wake Remastered | 49 | 21 | 16 | 54 | 33 | 26 | 27.9 | 15.1 | ||||||
| New World | 29.4 | 13 | 30 | 14 | 13 | 10 | ||||||||
| F1 2021 | 64 | 33 | 27 | 18 | 12.3 | 95 | 41 | 33 | 22 | 19 | 10 | |||
| Monster Hunter Stories 2 | 61 | 36 | 30 | 57 | 36 | 31 | 30 | |||||||
| Days Gone | 24 | 18.7 | 16.6 | 12.2 | 37 | 21 | 19 | 15 | 11.1 | |||||
| Mass Effect Legendary Edition | 49 | 32.4 | 50 | 34 | 21.9 | |||||||||
| Resident Evil Village | 31.2 | 20.6 | 19 | 55 | 24 | 23 | 24.2 | 15 | ||||||
| Outriders | 32.9 | 26.1 | 22.4 | 20.8 | 43 | 29 | 24 | 19 | 17.1 | |||||
| Hitman 3 | 69 | 28 | 24 | 21 | 68 | 25 | 22 | 20 | 15.1 | |||||
| Cyberpunk 2077 1.0 | 12 | 10.5 | 35.9 | 15.5 | 11.3 | 9.5 | ||||||||
| Immortals Fenyx Rising | 36 | 22 | 19 | 17 | 44 | 22 | 19 | 17 | 14 | |||||
| Yakuza Like a Dragon | 32.5 | 16.3 | 14.6 | 12.4 | 50 | 15 | 15 | 14 | 9.67 | |||||
| Assassin´s Creed Valhalla | 31 | 19 | 16 | 40 | 20 | 16 | 14 | 11 | ||||||
| Dirt 5 | 35 | 15 | 12 | 10 | 47 | 20 | 15 | 12 | 11 | |||||
| Watch Dogs Legion | 27 | 16 | 14 | 38 | 21 | 17 | 12.1 | 8.4 | ||||||
| FIFA 21 | 113 | 62.1 | 49.3 | 38.4 | 59.2 | |||||||||
| Star Wars Squadrons | 80 | 33 | 29 | 27 | 115 | 48 | 43 | 38 | 27.5 | |||||
| Mafia Definitive Edition | 26.8 | 12 | 40.4 | 18.1 | 17.1 | 10.9 | ||||||||
| Serious Sam 4 | 99.4 | 14.6 | 10.1 | 6.67 | 73 | 26 | 18 | 12 | 11.3 | |||||
| Crysis Remastered | 49 | 23 | 8 | 65.4 | 11.8 | 5.59 | ||||||||
| Flight Simulator 2020 | 20.7 | 9.83 | 6.83 | |||||||||||
| Horizon Zero Dawn | 28 | 15 | 13 | 42 | 20 | 17 | 15 | 12 | ||||||
| Death Stranding | 42.2 | 23.4 | 20.7 | 19.8 | 42 | 23 | 21 | 21 | 14.6 | |||||
| F1 2020 | 63 | 32 | 28 | 16 | 96 | 45 | 34 | 24 | 19 | 10 | ||||
| Gears Tactics | 90 | 32 | 21 | 15 | 94 | 35 | 23 | 16 | ||||||
| Doom Eternal | 28.1 | 17.9 | 15.9 | 70 | 44 | 38 | 37 | 39.2 | ||||||
| Hunt Showdown | 40 | 16 | 14 | 49.3 | 16.6 | 14.3 | 9.05 | |||||||
| Fall Guys | 0 | |||||||||||||
| Red Dead Redemption 2 | 49.2 | 22.7 | 12.9 | 45.6 | 22.3 | 14.4 | 8.78 | |||||||
| Borderlands 3 | 47 | 21 | 13 | 11 | 69 | 27 | 16 | 13 | 9 | 4 | ||||
| Control | 57.9 | 17.3 | 11.6 | 51.3 | 17.1 | 12.6 | 7.68 | |||||||
| Total War: Three Kingdoms | 52.5 | 20.9 | 66.4 | 20.2 | 13.4 | 9.1 | ||||||||
| Far Cry New Dawn | 44 | 26 | 24 | 21 | 50 | 25 | 24 | 22 | 16 | 8 | ||||
| Metro Exodus | 34 | 16 | 12 | 10 | 46 | 19 | 14 | 12 | 10 | 6 | ||||
| Apex Legends | 82 | 37.7 | 28.2 | 25.3 | 80.8 | 34.7 | 26.6 | 24 | ||||||
| Battlefield V | 30 | 25.8 | 23.3 | 22.6 | 81 | 39.2 | 32.5 | 29.9 | 20.8 | |||||
| Shadow of the Tomb Raider | 44 | 18 | 19 | 16 | 62 | 23 | 21 | 18 | 12 | 6 | ||||
| Strange Brigade | 68 | 28 | 23 | 20 | 16 | 78 | 31 | 26 | 22 | 18 | 10 | |||
| Far Cry 5 | 39 | 20 | 19 | 18 | 12 | 46 | 22 | 21 | 19 | 16 | 8 | |||
| X-Plane 11.11 | 36 | 29 | 26 | 20 | 44 | 34 | 30 | 24 | ||||||
| Final Fantasy XV Benchmark | 32 | 17 | 13 | 10 | 5 | 35 | 18 | 12 | 9 | 6 | ||||
| Assassin´s Creed Origins | 32 | 17 | 11 | |||||||||||
| Dota 2 Reborn | 91 | 68 | 43 | 40 | 17 | 107 | 85 | 51 | 48 | 19 | ||||
| The Witcher 3 | 65 | 42 | 22 | 11 | 9.85 | 66 | 41 | 21 | 14 | |||||
| GTA V | 84 | 71 | 18 | 8 | 6 | 100 | 87 | 26 | 11 | 10 | 10 | |||
| Intel Iris Xe Graphics G7 80EUs | AMD Radeon RX Vega 8 (Ryzen 4000/5000) | |||||||||||||
| low | med. | high | ultra | QHD | 4K | low | med. | high | ultra | QHD | 4K | < 30 fps < 60 fps < 120 fps ≥ 120 fps | 51 37 13 | 81 11 4 | 82 4 | 55 4 | 16 | 3 | < 30 fps < 60 fps < 120 fps ≥ 120 fps | 26 36 21 1 | 56 21 2 | 67 10 | 55 5 | 43 3 | 25 |
For more games that might be playable and a list of all games and graphics cards visit our Gaming List
#0 ran 0s before starting gpusingle class +0s ... 0s
#1 checking url part for id 10395 +0s ... 0s
#2 checking url part for id 10313 +0s ... 0s
#3 redirected to Ajax server, took 1765622432s time from redirect:0 +0s ... 0s
#4 did not recreate cache, as it is less than 5 days old! Created at Sat, 13 Dec 2025 05:19:17 +0100 +0s ... 0s
#5 composed specs +0.012s ... 0.012s
#6 did output specs +0s ... 0.012s
#7 start showIntegratedCPUs +0s ... 0.012s
#8 getting avg benchmarks for device 10395 +0.022s ... 0.034s
#9 got single benchmarks 10395 +0.161s ... 0.195s
#10 getting avg benchmarks for device 10313 +0.005s ... 0.2s
#11 got single benchmarks 10313 +0.076s ... 0.276s
#12 got avg benchmarks for devices +0s ... 0.276s
#13 min, max, avg, median took s +0.086s ... 0.362s
#14 before gaming benchmark output +0s ... 0.362s
#15 Got 5463 rows for game benchmarks. +0.295s ... 0.657s
#16 composed SQL query for gamebenchmarks +0s ... 0.657s
#17 got data and put it in $dataArray +0.022s ... 0.679s
#18 benchmarks composed for output. +0.072s ... 0.751s
#19 calculated avg scores. +0s ... 0.751s
#20 return log +0.006s ... 0.757s