


KFA² GeForce GTX 1060 6 GB EX OC Review
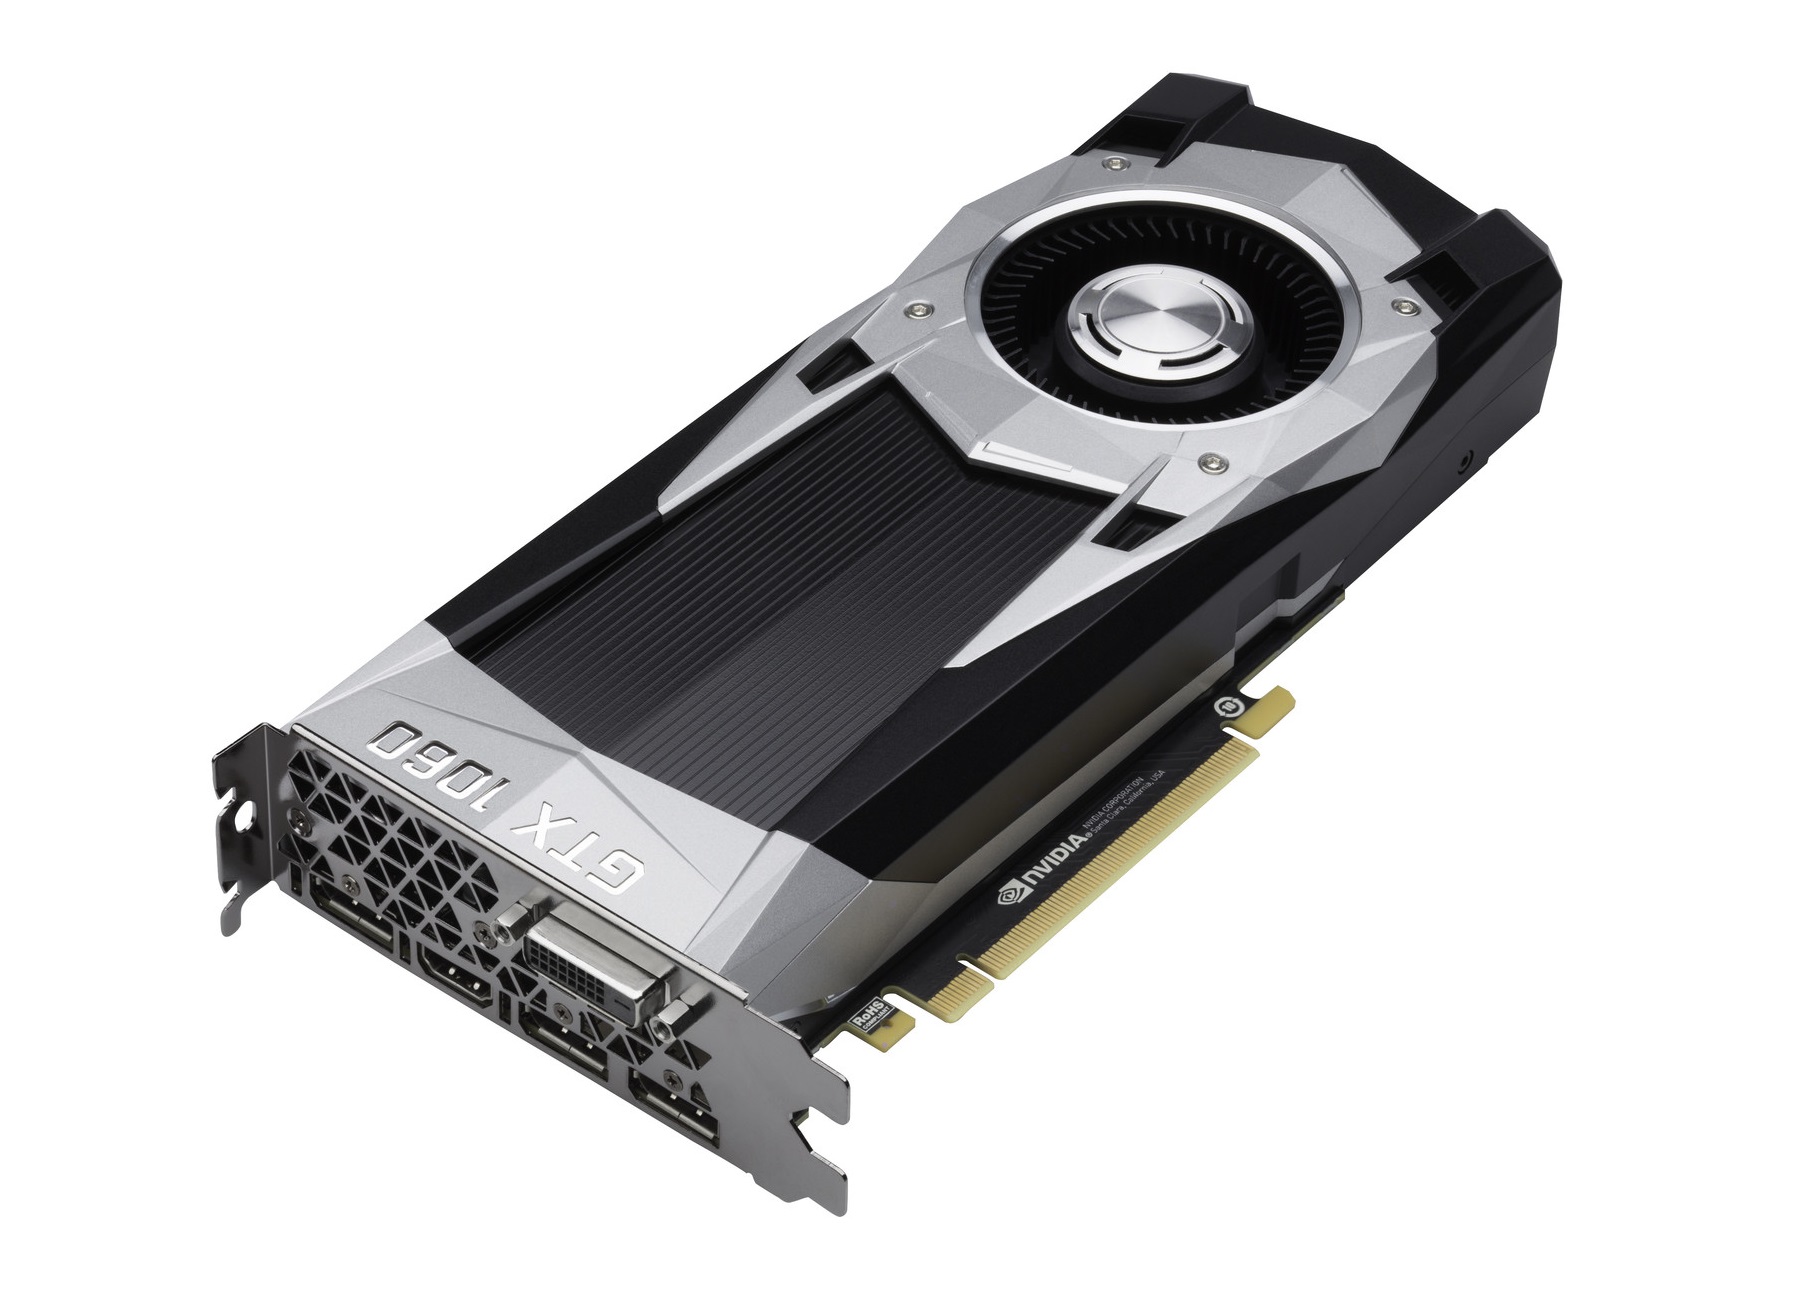
Upper mid-range Pascal GPU. Nvidia's Pascal generation brought many changes to the GPU segment last year. We now have an upper mid-range model with a specifically developed cooling unit from KFA². Our test sample is also equipped with 6 GB GDDR5 VRAM. Continue reading to find out how effective the cooling unit is and whether it is worth buying this graphics card.
Intel Xeon E5-2680 v4, NVIDIA GeForce GTX 1060 (Desktop), 32"