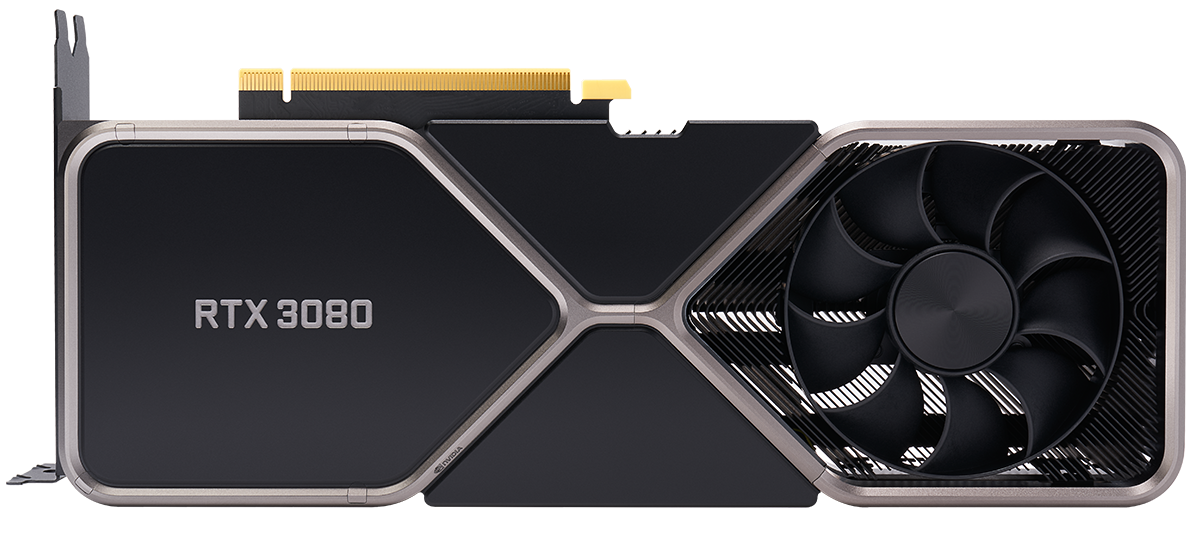
Notebookcheck Logo

NVIDIA GeForce RTX 3080

NVIDIA NVIDIA GeForce RTX 3080

The Nvidia GeForce RTX 3080 is high-end desktop graphics card based on the Ampere generation. It uses the big GA102 chip and offers 8,704 shaders and 10 GB GDDR6X graphics memory.

The gaming performance in 4k is clearly better than the old GeForce RTX 2080 Ti (approximately 15% faster). Therefore, even demanding games should run with maximum detail settings in 4k. Enabling raytracing will however reduce the framerate and therefore maximum details won't be playable. 

The RTX3080 is produced in 8nm at Samsung and rated at 320 Watt but the power efficiency is still quite good.

GeForce RTX 3000 Series

NVIDIA GeForce RTX 3090 Ti compare 10752 @ 1.56 - 1.86 GHz384 Bit @ 21000 MHz
NVIDIA GeForce RTX 3090 compare 10496 @ 1.4 - 1.7 GHz384 Bit @ 19500 MHz
NVIDIA GeForce RTX 3080 Ti compare 10240 @ 1.37 - 1.67 GHz384 Bit @ 19000 MHz
NVIDIA GeForce RTX 3080 12 GB compare 8960/ cores @ 1.26 - 1.71 GHz384 Bit @ 19000 MHz
NVIDIA GeForce RTX 3080 8704 @ 1.45 - 1.71 GHz320 Bit @ 19000 MHz
GeForce RTX 3070 Ti compare 6144 @ 1.58 - 1.77 GHz256 Bit @ 19000 MHz
GeForce RTX 3080 Ti Laptop GPU compare 7424 @ 0.98 - 1.59 GHz256 Bit @ 14000 MHz
NVIDIA GeForce RTX 3070 compare 5888 @ 1.5 - 1.73 GHz256 Bit @ 14000 MHz
GeForce RTX 3080 Laptop GPU compare 6144 @ 0.78 - 1.25 GHz256 Bit @ 14000 MHz
NVIDIA GeForce RTX 3060 Ti compare 4864 @ 1.41 - 1.67 GHz256 Bit @ 14000 MHz
GeForce RTX 3070 Ti Laptop GPU compare 5888 @ 0.92 - 1.48 GHz256 Bit @ 14000 MHz
GeForce RTX 3070 Laptop GPU compare 5120 @ 0.78 - 1.29 GHz256 Bit @ 14000 MHz
GeForce RTX 3080 Max-Q compare 6144 @ 0.78 - 1.25 GHz256 Bit @ 6000 MHz
NVIDIA GeForce RTX 3060 compare 3584 @ 1.32 - 1.78 GHz192 Bit @ 15000 MHz
GeForce RTX 3070 Max-Q compare 5120 @ 1.29 GHz256 Bit
GeForce RTX 3060 Laptop GPU compare 3840 @ 0.82 - 1.7 GHz192 Bit @ 14000 MHz
GeForce RTX 3060 Max-Q compare 3840 @ 1.28 GHz192 Bit
NVIDIA GeForce RTX 3050 compare 2560 @ 1.55 - 1.78 GHz128 Bit Bit @ 1750 MHz
GeForce RTX 3050 Ti Laptop GPU compare 2560 @ 1.22 - 1.49 GHz128 Bit @ 12000 MHz
GeForce RTX 3050 6GB Laptop GPU compare 2560 @ 1.24 - 1.49 GHz96 Bit @ 12000 MHz
GeForce RTX 3050 4GB Laptop GPU compare 2048 @ 1.24 - 1.5 GHz128 Bit @ 12000 MHz
CodenameAmpere GA102
ArchitectureAmpere
Pipelines8704 - unified
Core Speed1450 - 1710 (Boost) MHz
Memory Speed19000 MHz
Memory Bus Width320 Bit
Memory TypeGDDR6X
Max. Amount of Memory24 GB
Shared Memoryno
APIDirectX 12_2, Shader 6.7, OpenGL 4.6
Power Consumption320 Watt
Transistor Count28 Billion
technology8 nm
Date of Announcement16.09.2020

Benchmarks

Performance Rating - 3DMark 11 + Fire Strike + Time Spy
17.9 pt (54%)
3DMark Vantage
3DM Vant. Perf. total +
3DM Vant. Perf. GPU no PhysX +
3DMark 06 3DMark 06 - Standard 1280x1024 +
SPECviewperf 12
specvp12 sw-03 +
specvp12 snx-02 +
specvp12 showcase-01 +
specvp12 mediacal-01 +
specvp12 maya-04 +
specvp12 energy-01 +
specvp12 creo-01 +
specvp12 catia-04 +
specvp12 3dsmax-05 +
SPECviewperf 13 specvp13 sw-04 +
specvp13 snx-03 +
specvp13 showcase-02 +
specvp13 medical-02 +
specvp13 maya-05 +
specvp13 energy-02 +
specvp13 creo-02 +
specvp13 catia-05 +
specvp13 3dsmax-06 +
SPECviewperf 2020 specvp2020 solidworks-05 4k +
specvp2020 snx-04 4k +
specvp2020 medical-03 4k +
specvp2020 maya-06 4k +
specvp2020 energy-03 4k +
specvp2020 creo-03 4k +
specvp2020 catia-06 4k +
specvp2020 3dsmax-07 4k +
- Range of benchmark values for this graphics card
- Average benchmark values for this graphics card
* Smaller numbers mean a higher performance

Game Benchmarks

The following benchmarks stem from our benchmarks of review laptops. The performance depends on the used graphics memory, clock rate, processor, system settings, drivers, and operating systems. So the results don't have to be representative for all laptops with this GPU. For detailed information on the benchmark results, click on the fps number.

The Last of Us

The Last of Us

2023
low 1920x1080
148.6  fps    + Compare + 📈 Graph
med. 1920x1080
128.8  fps    + Compare + 📈 Graph
high 1920x1080
120.2  fps    + Compare + 📈 Graph
ultra 1920x1080
106.3  fps    + Compare + 📈 Graph
QHD 2560x1440
71.2  fps    + Compare + 📈 Graph
4K 3840x2160
34.9  fps    + Compare + 📈 Graph
3840x2160
59.6  fps    + Compare + 📈 Graph
» With all tested laptops playable in detail settings ultra.
low 1920x1080
253  fps    + Compare + 📈 Graph
med. 1920x1080
188.8  fps    + Compare + 📈 Graph
high 1920x1080
173  fps    + Compare + 📈 Graph
ultra 1920x1080
127.3  fps    + Compare + 📈 Graph
QHD 2560x1440
97.6  fps    + Compare + 📈 Graph
4K 3840x2160
59.3  fps    + Compare + 📈 Graph
» With all tested laptops playable in detail settings ultra.
med. 1920x1080
289  fps    + Compare
high 1920x1080
235  fps    + Compare
ultra 1920x1080
230  fps    + Compare
QHD 2560x1440
180  fps    + Compare
4K 3840x2160
109  fps    + Compare
» With all tested laptops playable in detail settings ultra.
low 1920x1080
120.9  fps    + Compare + 📈 Graph
med. 1920x1080
116.5  fps    + Compare + 📈 Graph
high 1920x1080
114  fps    + Compare + 📈 Graph
ultra 1920x1080
112.4  fps    + Compare + 📈 Graph
QHD 2560x1440
98.5  fps    + Compare + 📈 Graph
4K 3840x2160
69.5  fps    + Compare + 📈 Graph
» With all tested laptops playable in detail settings ultra.
low 1920x1080
307  fps    + Compare + 📈 Graph
med. 1920x1080
239  fps    + Compare + 📈 Graph
high 1920x1080
147.4  fps    + Compare + 📈 Graph
ultra 1920x1080
121.4  fps    + Compare + 📈 Graph
QHD 2560x1440
95.7  fps    + Compare + 📈 Graph
4K 3840x2160
60  fps    + Compare + 📈 Graph
» With all tested laptops playable in detail settings ultra.
Returnal

Returnal

2023
med. 1920x1080
161  fps    + Compare
high 1920x1080
145  fps    + Compare
ultra 1920x1080
128  fps    + Compare
QHD 2560x1440
103  fps    + Compare
4K 3840x2160
63  fps    + Compare
» With all tested laptops playable in detail settings ultra.
Additional Benchmarks
Epic Preset + Epic Ray-Tracing 1920x1080
106
Epic Preset + Epic Ray-Tracing 3840x2160
46
med. 1920x1080
134.6  fps    + Compare + 📈 Graph
high 1920x1080
122.7  fps    + Compare + 📈 Graph
ultra 1920x1080
101  fps    + Compare + 📈 Graph
QHD 2560x1440
83.5  fps    + Compare + 📈 Graph
4K 3840x2160
48.5  fps    + Compare + 📈 Graph
» With all tested laptops playable in detail settings ultra.
Additional Benchmarks
Ultra Preset + Full Ray Tracing High TAA 1920x1080
66.7
Ultra Preset + Full Ray Tracing High TAA 3840x2160
28.4
low 1920x1080
124.8  fps    + Compare + 📈 Graph
med. 1920x1080
121.7  fps    + Compare + 📈 Graph
high 1920x1080
107  fps    + Compare + 📈 Graph
ultra 1920x1080
100.9  fps    + Compare + 📈 Graph
QHD 2560x1440
72.1  fps    + Compare + 📈 Graph
4K 3840x2160
39.1  fps    + Compare + 📈 Graph
» With all tested laptops playable in detail settings ultra.
med. 1920x1080
257  fps    + Compare + 📈 Graph
high 1920x1080
222  fps    + Compare + 📈 Graph
ultra 1920x1080
191.6  fps    + Compare + 📈 Graph
QHD 2560x1440
154  fps    + Compare + 📈 Graph
4K 3840x2160
87.8  fps    + Compare + 📈 Graph
» With all tested laptops playable in detail settings ultra.
Additional Benchmarks
RT Ultra Preset / On FXAA 1920x1080
53.6
low 1920x1080
348  fps    + Compare + 📈 Graph
med. 1920x1080
275  fps    + Compare + 📈 Graph
high 1920x1080
206  fps    + Compare + 📈 Graph
ultra 1920x1080
170.9  fps    + Compare + 📈 Graph
QHD 2560x1440
108.5  fps    + Compare + 📈 Graph
4K 3840x2160
44  fps    + Compare + 📈 Graph
» With all tested laptops playable in detail settings ultra.
med. 1920x1080
178  fps    + Compare
high 1920x1080
126  fps    + Compare
ultra 1920x1080
125  fps    + Compare
QHD 2560x1440
95.9  fps    + Compare
4K 3840x2160
58.6  fps    + Compare
» With all tested laptops playable in detail settings ultra.
Additional Benchmarks
Ultra Preset (without FSR Upscaling) + Full Ray-Tracing 1920x1080
71.3
med. 1920x1080
178.5  fps    + Compare + 📈 Graph
high 1920x1080
161  fps    + Compare + 📈 Graph
ultra 1920x1080
141.5  fps    + Compare + 📈 Graph
QHD 2560x1440
131.1  fps    + Compare + 📈 Graph
4K 3840x2160
77.6  fps    + Compare + 📈 Graph
» With all tested laptops playable in detail settings ultra.
med. 1920x1080
151.7  fps    + Compare + 📈 Graph
high 1920x1080
150.6  fps    + Compare + 📈 Graph
ultra 1920x1080
149  fps    + Compare + 📈 Graph
QHD 2560x1440
123.7  fps    + Compare + 📈 Graph
4K 3840x2160
73.1  fps    + Compare + 📈 Graph
» With all tested laptops playable in detail settings ultra.
Additional Benchmarks
Very High Preset + Ray-Tracing TAA 1920x0180
80.8
med. 1920x1080
209  fps    + Compare
high 1920x1080
162  fps    + Compare
ultra 1920x1080
160  fps    + Compare
QHD 2560x1440
114  fps    + Compare
4K 3840x2160
68  fps    + Compare
» With all tested laptops playable in detail settings ultra.
med. 1920x1080
108.2  fps    + Compare + 📈 Graph
high 1920x1080
106.8  fps    + Compare + 📈 Graph
ultra 1920x1080
103.4  fps    + Compare + 📈 Graph
QHD 2560x1440
88.3  fps    + Compare + 📈 Graph
4K 3840x2160
57.4  fps    + Compare + 📈 Graph
» With all tested laptops playable in detail settings ultra.
med. 1920x1080
114.9  fps    + Compare + 📈 Graph
high 1920x1080
100.1  fps    + Compare + 📈 Graph
ultra 1920x1080
86.3  fps    + Compare + 📈 Graph
QHD 2560x1440
65.1  fps    + Compare + 📈 Graph
4K 3840x2160
38.3  fps    + Compare + 📈 Graph
» With all tested laptops playable in detail settings ultra.
FIFA 23

FIFA 23

2022
med. 1920x1080
223  fps    + Compare + 📈 Graph
high 1920x1080
203  fps    + Compare + 📈 Graph
ultra 1920x1080
200  fps    + Compare + 📈 Graph
QHD 2560x1440
191.4  fps    + Compare + 📈 Graph
4K 3840x2160
143.8  fps    + Compare + 📈 Graph
» With all tested laptops playable in detail settings ultra.
med. 1920x1080
203  fps    + Compare + 📈 Graph
high 1920x1080
166.8  fps    + Compare + 📈 Graph
ultra 1920x1080
134.4  fps    + Compare + 📈 Graph
QHD 2560x1440
97.2  fps    + Compare + 📈 Graph
4K 3840x2160
53.8  fps    + Compare + 📈 Graph
» With all tested laptops playable in detail settings ultra.
F1 22

F1 22

2022
med. 1920x1080
327  fps    + Compare
high 1920x1080
305  fps    + Compare
ultra 1920x1080
123  fps    + Compare
QHD 2560x1440
79  fps    + Compare
4K 3840x2160
40  fps    + Compare
» With all tested laptops playable in detail settings ultra.
med. 1920x1080
353  fps    + Compare + 📈 Graph
high 1920x1080
345  fps    + Compare + 📈 Graph
ultra 1920x1080
329  fps    + Compare + 📈 Graph
QHD 2560x1440
237  fps    + Compare + 📈 Graph
4K 3840x2160
127.3  fps    + Compare + 📈 Graph
» With all tested laptops playable in detail settings ultra.
med. 1920x1080
216  fps    + Compare + 📈 Graph
high 1920x1080
207  fps    + Compare + 📈 Graph
ultra 1920x1080
205  fps    + Compare + 📈 Graph
QHD 2560x1440
172.5  fps    + Compare + 📈 Graph
4K 3840x2160
89.9  fps    + Compare + 📈 Graph
» With all tested laptops playable in detail settings ultra.
Additional Benchmarks
Highest Settings + Maximum Ray Tracing 1920x1080
97.9
med. 1920x1080
243  fps    + Compare
high 1920x1080
194  fps    + Compare
ultra 1920x1080
157  fps    + Compare
QHD 2560x1440
115  fps    + Compare
4K 3840x2160
65.4  fps    + Compare
» With all tested laptops playable in detail settings ultra.
med. 1920x1080
138  fps    + Compare
high 1920x1080
134  fps    + Compare
ultra 1920x1080
131  fps    + Compare
QHD 2560x1440
86.1  fps    + Compare
4K 3840x2160
42.8  fps    + Compare
» With all tested laptops playable in detail settings ultra.
Additional Benchmarks
Ray Tracing Ultra Preset (DLSS off) 1920x1080
61.1
Ray Tracing Ultra Preset (DLSS off) 3840x2160
12.1
Elex 2

Elex 2

2022
med. 1920x1080
93.3  fps    + Compare + 📈 Graph
high 1920x1080
92.5  fps    + Compare + 📈 Graph
ultra 1920x1080
92.1  fps    + Compare + 📈 Graph
QHD 2560x1440
79.5  fps    + Compare + 📈 Graph
4K 3840x2160
59.6  fps    + Compare + 📈 Graph
» With all tested laptops playable in detail settings ultra.
med. 1920x1080
155  fps    + Compare
high 1920x1080
135  fps    + Compare
ultra 1920x1080
125  fps    + Compare
QHD 2560x1440
123  fps    + Compare
4K 3840x2160
105  fps    + Compare
» With all tested laptops playable in detail settings ultra.
med. 1920x1080
59.2  fps    + Compare + 📈 Graph
high 1920x1080
58.6  fps    + Compare + 📈 Graph
ultra 1920x1080
58.6  fps    + Compare + 📈 Graph
QHD 2560x1440
58.6  fps    + Compare + 📈 Graph
4K 3840x2160
58.3  fps    + Compare + 📈 Graph
» With all tested laptops playable in detail settings ultra.
med. 1920x1080
139  fps    + Compare + 📈 Graph
high 1920x1080
128  fps    + Compare + 📈 Graph
QHD 2560x1440
94.6  fps    + Compare + 📈 Graph
4K 3840x2160
53.8  fps    + Compare + 📈 Graph
» With all tested laptops playable in detail settings high.
Additional Benchmarks
High Quality Raytracing 1920x1080
59.7
med. 1920x1080
330  fps    + Compare
high 1920x1080
324  fps    + Compare
ultra 1920x1080
263  fps    + Compare
QHD 2560x1440
181  fps    + Compare
4K 3840x2160
98  fps    + Compare
» With all tested laptops playable in detail settings ultra.
med. 1920x1080
135  fps    + Compare + 📈 Graph
high 1920x1080
131  fps    + Compare + 📈 Graph
ultra 1920x1080
110  fps    + Compare + 📈 Graph
QHD 2560x1440
94.1  fps    + Compare + 📈 Graph
4K 3840x2160
66.2  fps    + Compare + 📈 Graph
» With all tested laptops playable in detail settings ultra.
med. 1920x1080
174  fps    + Compare + 📈 Graph
high 1920x1080
151  fps    + Compare + 📈 Graph
ultra 1920x1080
142  fps    + Compare + 📈 Graph
QHD 2560x1440
114  fps    + Compare + 📈 Graph
4K 3840x2160
70.1  fps    + Compare + 📈 Graph
» With all tested laptops playable in detail settings ultra.
med. 1920x1080
166  fps    + Compare + 📈 Graph
high 1920x1080
154  fps    + Compare + 📈 Graph
ultra 1920x1080
138  fps    + Compare + 📈 Graph
QHD 2560x1440
136  fps    + Compare + 📈 Graph
4K 3840x2160
128  fps    + Compare + 📈 Graph
» With all tested laptops playable in detail settings ultra.
med. 1920x1080
133  fps    + Compare + 📈 Graph
high 1920x1080
130  fps    + Compare + 📈 Graph
ultra 1920x1080
123  fps    + Compare + 📈 Graph
QHD 2560x1440
113  fps    + Compare + 📈 Graph
4K 3840x2160
77.6  fps    + Compare + 📈 Graph
» With all tested laptops playable in detail settings ultra.
Additional Benchmarks
Ultra Preset + Ray Tracing 1920x1080
87.9
med. 1920x1080
152  fps    + Compare
high 1920x1080
140  fps    + Compare
ultra 1920x1080
100  fps    + Compare
QHD 2560x1440
93  fps    + Compare
4K 3840x2160
75  fps    + Compare
» With all tested laptops playable in detail settings ultra.
Additional Benchmarks
Low Preset 1920x1080
172
med. 1920x1080
179  fps    + Compare + 📈 Graph
high 1920x1080
176  fps    + Compare + 📈 Graph
ultra 1920x1080
161  fps    + Compare + 📈 Graph
QHD 2560x1440
126  fps    + Compare + 📈 Graph
4K 3840x2160
77.7  fps    + Compare + 📈 Graph
» With all tested laptops playable in detail settings ultra.
Additional Benchmarks
Low Preset 1920x1080
189
med. 1920x1080
152  fps    + Compare
high 1920x1080
144  fps    + Compare
ultra 1920x1080
140  fps    + Compare
QHD 2560x1440
119  fps    + Compare
4K 3840x2160
72  fps    + Compare
» With all tested laptops playable in detail settings ultra.
Additional Benchmarks
Low Preset 1920x1080
164
med. 1920x1080
113  fps    + Compare
high 1920x1080
112  fps    + Compare
ultra 1920x1080
111  fps    + Compare
QHD 2560x1440
110  fps    + Compare
4K 3840x2160
95  fps    + Compare
» With all tested laptops playable in detail settings ultra.
Additional Benchmarks
Ultra Preset + Ultra Ray-Tracing 1920x1080
87
med. 1920x1080
290  fps    + Compare + 📈 Graph
high 1920x1080
273  fps    + Compare + 📈 Graph
ultra 1920x1080
270  fps    + Compare + 📈 Graph
QHD 2560x1440
223  fps    + Compare + 📈 Graph
4K 3840x2160
131  fps    + Compare + 📈 Graph
» With all tested laptops playable in detail settings ultra.
Additional Benchmarks
Low Preset (DX12) 1920x1080
317
Far Cry 6

Far Cry 6

2021
med. 1920x1080
104  fps    + Compare
high 1920x1080
99  fps    + Compare
ultra 1920x1080
92  fps    + Compare
QHD 2560x1440
88  fps    + Compare
4K 3840x2160
72  fps    + Compare
» With all tested laptops playable in detail settings ultra.
Additional Benchmarks
Low Graphics Quality 1920x1080
115
Ultra Graphics Quality + HD Textures + DXR TAA 1920x1080
73
med. 1920x1080
106  fps    + Compare + 📈 Graph
high 1920x1080
102  fps    + Compare + 📈 Graph
QHD 2560x1440
101  fps    + Compare + 📈 Graph
4K 3840x2160
97  fps    + Compare + 📈 Graph
» With all tested laptops playable in detail settings high.
Additional Benchmarks
Low Preset 1920x1080
109
FIFA 22

FIFA 22

2021
med. 1920x1080
268  fps    + Compare + 📈 Graph
high 1920x1080
265  fps    + Compare + 📈 Graph
ultra 1920x1080
263  fps    + Compare + 📈 Graph
QHD 2560x1440
261  fps    + Compare + 📈 Graph
4K 3840x2160
260  fps    + Compare + 📈 Graph
» With all tested laptops playable in detail settings ultra.
Additional Benchmarks
Low Rendering Quality 1920x1080
270
New World

New World

2021
med. 1920x1080
74.8  fps    + Compare + 📈 Graph
high 1920x1080
70.8  fps    + Compare + 📈 Graph
ultra 1920x1080
70.6  fps    + Compare + 📈 Graph
QHD 2560x1440
69.7  fps    + Compare + 📈 Graph
4K 3840x2160
68.1  fps    + Compare + 📈 Graph
» With all tested laptops playable in detail settings ultra.
Additional Benchmarks
Low Video Quality 1920x1080
87.6
Deathloop

Deathloop

2021
med. 1920x1080
119  fps    + Compare + 📈 Graph
high 1920x1080
119  fps    + Compare + 📈 Graph
ultra 1920x1080
114  fps    + Compare + 📈 Graph
QHD 2560x1440
108  fps    + Compare + 📈 Graph
4K 3840x2160
68.5  fps    + Compare + 📈 Graph
» With all tested laptops playable in detail settings ultra.
Additional Benchmarks
Low Preset 1920x1080
119
F1 2021

F1 2021

2021
med. 1920x1080
263  fps    + Compare
high 1920x1080
255  fps    + Compare
ultra 1920x1080
152  fps    + Compare
QHD 2560x1440
149  fps    + Compare
4K 3840x2160
91  fps    + Compare
» With all tested laptops playable in detail settings ultra.
Additional Benchmarks
Ultra Low Preset 1920x1080
292
med. 1920x1080
144  fps    + Compare + 📈 Graph
high 1920x1080
144  fps    + Compare + 📈 Graph
QHD 2560x1440
144  fps    + Compare + 📈 Graph
4K 3840x2160
144  fps    + Compare + 📈 Graph
» With all tested laptops playable in detail settings high.
Additional Benchmarks
Low Preset 1920x1080
144
Days Gone

Days Gone

2021
med. 1920x1080
172  fps    + Compare + 📈 Graph
high 1920x1080
169  fps    + Compare + 📈 Graph
ultra 1920x1080
158  fps    + Compare + 📈 Graph
QHD 2560x1440
131  fps    + Compare + 📈 Graph
4K 3840x2160
78.6  fps    + Compare + 📈 Graph
» With all tested laptops playable in detail settings ultra.
Additional Benchmarks
Low Preset 1920x1080
173
low 1280x720
129  fps    + Compare + 📈 Graph
ultra 1920x1080
122  fps    + Compare + 📈 Graph
QHD 2560x1440
120  fps    + Compare + 📈 Graph
4K 3840x2160
117  fps    + Compare + 📈 Graph
» With all tested laptops playable in detail settings ultra.
med. 1920x1080
188  fps    + Compare + 📈 Graph
high 1920x1080
187  fps    + Compare + 📈 Graph
ultra 1920x1080
186  fps    + Compare + 📈 Graph
QHD 2560x1440
182  fps    + Compare + 📈 Graph
4K 3840x2160
103  fps    + Compare + 📈 Graph
» With all tested laptops playable in detail settings ultra.
Additional Benchmarks
Prioritize Performance Preset 1920x1080
191
Ray Tracing Preset 1920x1080
150
Outriders

Outriders

2021
med. 1920x1080
135  fps    + Compare + 📈 Graph
high 1920x1080
133  fps    + Compare + 📈 Graph
ultra 1920x1080
126  fps    + Compare + 📈 Graph
QHD 2560x1440
125  fps    + Compare + 📈 Graph
4K 3840x2160
79.1  fps    + Compare + 📈 Graph
» With all tested laptops playable in detail settings ultra.
Additional Benchmarks
Low Preset 1920x1080
142
Hitman 3

Hitman 3

2021
med. 1920x1080
172  fps    + Compare
high 1920x1080
168  fps    + Compare
ultra 1920x1080
166  fps    + Compare
QHD 2560x1440
164  fps    + Compare
4K 3840x2160
109  fps    + Compare
» With all tested laptops playable in detail settings ultra.
Additional Benchmarks
Minimum Settings 1920x1080
208
low 1280x720
132  fps    + Compare + 📈 Graph
med. 1920x1080
128  fps    + Compare + 📈 Graph
high 1920x1080
116  fps    + Compare + 📈 Graph
ultra 1920x1080
103  fps    + Compare + 📈 Graph
QHD 2560x1440
72.5  fps    + Compare + 📈 Graph
4K 3840x2160
38.9  fps    + Compare + 📈 Graph
» With all tested laptops playable in detail settings ultra.
Additional Benchmarks
Low Preset 1920x1080
134
Ray Tracing Ultra Preset (DLSS off) 1920x1080
56.6
Ray Tracing Ultra Preset (DLSS off) 3840x2160
19
low 1280x720
143  fps    + Compare
med. 1920x1080
121  fps    + Compare
high 1920x1080
109  fps    + Compare
ultra 1920x1080
80  fps    + Compare
QHD 2560x1440
74  fps    + Compare
4K 3840x2160
57  fps    + Compare
» With all tested laptops playable in detail settings ultra.
low 1280x720
121  fps    + Compare + 📈 Graph
med. 1920x1080
116  fps    + Compare + 📈 Graph
high 1920x1080
118  fps    + Compare + 📈 Graph
ultra 1920x1080
110  fps    + Compare + 📈 Graph
QHD 2560x1440
112  fps    + Compare + 📈 Graph
4K 3840x2160
72.4  fps    + Compare + 📈 Graph
» With all tested laptops playable in detail settings ultra.
low 1280x720
235  fps    + Compare + 📈 Graph
med. 1920x1080
201  fps    + Compare + 📈 Graph
high 1920x1080
173  fps    + Compare + 📈 Graph
ultra 1920x1080
127  fps    + Compare + 📈 Graph
QHD 2560x1440
104  fps    + Compare + 📈 Graph
4K 3840x2160
65.6  fps    + Compare + 📈 Graph
» With all tested laptops playable in detail settings ultra.
Additional Benchmarks
Highest Settings + Ultra Ray Tracing 1920x1080
81.9
low 1280x720
136  fps    + Compare
med. 1920x1080
111  fps    + Compare
high 1920x1080
96  fps    + Compare
ultra 1920x1080
88  fps    + Compare
QHD 2560x1440
76  fps    + Compare
4K 3840x2160
52  fps    + Compare
» With all tested laptops playable in detail settings ultra.
Dirt 5

Dirt 5

2020
low 1280x720
176 186 ~ 181 fps    + Compare
med. 1920x1080
121 134 ~ 128 fps    + Compare
high 1920x1080
111 112 ~ 112 fps    + Compare
ultra 1920x1080
97 111 ~ 104 fps    + Compare
QHD 2560x1440
69.1 85.5 ~ 77 fps    + Compare
4K 3840x2160
55.3 65.7 ~ 61 fps    + Compare
» With all tested laptops playable in detail settings ultra.
low 1280x720
122 147 ~ 135 fps    + Compare + 📈 Graph
med. 1920x1080
121 146 ~ 134 fps    + Compare + 📈 Graph
high 1920x1080
113 125 ~ 119 fps    + Compare + 📈 Graph
ultra 1920x1080
99.3 103 ~ 101 fps    + Compare + 📈 Graph
QHD 2560x1440
81.1 81.6 ~ 81 fps    + Compare + 📈 Graph
4K 3840x2160
53.5 54.1 ~ 54 fps    + Compare + 📈 Graph
» With all tested laptops playable in detail settings ultra.
Additional Benchmarks
Ultra Preset + Ultra Ray Tracing (DX12) 1920x1080
70.9
71.3
FIFA 21

FIFA 21

2020
low 1280x720
170 306 ~ 238 fps    + Compare + 📈 Graph
med. 1920x1080
184 312 ~ 248 fps    + Compare + 📈 Graph
high 1920x1080
182 293 ~ 238 fps    + Compare + 📈 Graph
ultra 1920x1080
181 295 ~ 238 fps    + Compare + 📈 Graph
QHD 2560x1440
199 295 ~ 247 fps    + Compare + 📈 Graph
4K 3840x2160
195 284 ~ 240 fps    + Compare + 📈 Graph
» With all tested laptops playable in detail settings ultra.
low 1280x720
360 586 ~ 473 fps    + Compare + 📈 Graph
med. 1920x1080
392 433 ~ 413 fps    + Compare + 📈 Graph
high 1920x1080
362 379 ~ 371 fps    + Compare + 📈 Graph
ultra 1920x1080
358 362 ~ 360 fps    + Compare + 📈 Graph
QHD 2560x1440
266 274 ~ 270 fps    + Compare + 📈 Graph
4K 3840x2160
169 175 ~ 172 fps    + Compare + 📈 Graph
» With all tested laptops playable in detail settings ultra.
low 1280x720
182 199 ~ 191 fps    + Compare + 📈 Graph
med. 1920x1080
159 184 ~ 172 fps    + Compare + 📈 Graph
high 1920x1080
144 169 ~ 157 fps    + Compare + 📈 Graph
QHD 2560x1440
127 137 ~ 132 fps    + Compare + 📈 Graph
4K 3840x2160
78.1 78.2 ~ 78 fps    + Compare + 📈 Graph
» With all tested laptops playable in detail settings high.
low 1280x720
161 182.5 ~ 172 fps    + Compare
med. 1920x1080
125.2 148.6 ~ 137 fps    + Compare
high 1920x1080
121.7 138.1 ~ 130 fps    + Compare
ultra 1920x1080
114.3 135.2 ~ 125 fps    + Compare
QHD 2560x1440
112.8 124.8 ~ 119 fps    + Compare
4K 3840x2160
112.7 117 ~ 115 fps    + Compare
» With all tested laptops playable in detail settings ultra.
low 1280x720
227  fps    + Compare + 📈 Graph
med. 1920x1080
157  fps    + Compare + 📈 Graph
high 1920x1080
98.9  fps    + Compare + 📈 Graph
ultra 1920x1080
62.1  fps    + Compare + 📈 Graph
QHD 2560x1440
59.9  fps    + Compare + 📈 Graph
4K 3840x2160
49.2  fps    + Compare + 📈 Graph
» With all tested laptops playable in detail settings ultra.
low 1280x720
115  fps    + Compare + 📈 Graph
med. 1920x1080
97.4  fps    + Compare + 📈 Graph
high 1920x1080
79.9  fps    + Compare + 📈 Graph
ultra 1920x1080
62.8  fps    + Compare + 📈 Graph
QHD 2560x1440
55.6  fps    + Compare + 📈 Graph
4K 3840x2160
37.3  fps    + Compare + 📈 Graph
» With all tested laptops playable in detail settings ultra.
low 1280x720
164 198 ~ 181 fps    + Compare
med. 1920x1080
151 180 ~ 166 fps    + Compare
high 1920x1080
147 164 ~ 156 fps    + Compare
ultra 1920x1080
141 144 ~ 143 fps    + Compare
QHD 2560x1440
128 133 ~ 131 fps    + Compare
4K 3840x2160
82 95 ~ 89 fps    + Compare
» With all tested laptops playable in detail settings ultra.
low 1280x720
232  fps    + Compare + 📈 Graph
med. 1920x1080
219  fps    + Compare + 📈 Graph
high 1920x1080
208  fps    + Compare + 📈 Graph
ultra 1920x1080
202  fps    + Compare + 📈 Graph
QHD 2560x1440
163  fps    + Compare + 📈 Graph
4K 3840x2160
98.7  fps    + Compare + 📈 Graph
» With all tested laptops playable in detail settings ultra.
F1 2020

F1 2020

2020
low 1280x720
321 367 ~ 344 fps    + Compare
med. 1920x1080
255 288 ~ 272 fps    + Compare
high 1920x1080
239 249 ~ 244 fps    + Compare
ultra 1920x1080
179 185 ~ 182 fps    + Compare
QHD 2560x1440
146 155 ~ 151 fps    + Compare
4K 3840x2160
114 118 ~ 116 fps    + Compare
» With all tested laptops playable in detail settings ultra.
low 1280x720
283 283 305 ~ 290 fps    + Compare
med. 1920x1080
277 277 302 ~ 285 fps    + Compare
high 1920x1080
270 270 291 ~ 277 fps    + Compare
ultra 1920x1080
268 268 290 ~ 275 fps    + Compare
QHD 2560x1440
248 248 277 ~ 258 fps    + Compare
4K 3840x2160
153 153 167 ~ 158 fps    + Compare
» With all tested laptops playable in detail settings ultra.
low 1280x720
236 260 ~ 248 fps    + Compare
med. 1920x1080
173 232 ~ 203 fps    + Compare
high 1920x1080
172 228 ~ 200 fps    + Compare
QHD 2560x1440
155 188 ~ 172 fps    + Compare
4K 3840x2160
95.8 107 ~ 101 fps    + Compare
» With all tested laptops playable in detail settings high.
low 1280x720
152.1 167 ~ 160 fps    + Compare
med. 1920x1080
149.5 154 ~ 152 fps    + Compare
high 1920x1080
135 141.9 ~ 138 fps    + Compare
ultra 1920x1080
96 103 ~ 100 fps    + Compare
QHD 2560x1440
81 86.4 ~ 84 fps    + Compare
4K 3840x2160
56 56.4 ~ 56 fps    + Compare
» With all tested laptops playable in detail settings ultra.
med. 1920x1080
128 134 ~ 131 fps    + Compare
high 1920x1080
127 132 ~ 130 fps    + Compare
ultra 1920x1080
129 133 ~ 131 fps    + Compare
QHD 2560x1440
128 132 ~ 130 fps    + Compare
4K 3840x2160
92.9 97.2 ~ 95 fps    + Compare
» With all tested laptops playable in detail settings ultra.
low 1280x720
147 165 ~ 156 fps    + Compare
med. 1920x1080
127 143 ~ 135 fps    + Compare
high 1920x1080
120 129 ~ 125 fps    + Compare
ultra 1920x1080
117 128 ~ 123 fps    + Compare
QHD 2560x1440
95.7 103 ~ 99 fps    + Compare
4K 3840x2160
61.5 61.9 ~ 62 fps    + Compare
» With all tested laptops playable in detail settings ultra.
Control

Control

2019
low 1280x720
235 240 ~ 238 fps    + Compare
med. 1920x1080
185 196 ~ 191 fps    + Compare
high 1920x1080
151 155 ~ 153 fps    + Compare
QHD 2560x1440
105 106 ~ 106 fps    + Compare
4K 3840x2160
56.2 56.7 ~ 56 fps    + Compare
» With all tested laptops playable in detail settings high.
Additional Benchmarks
High Quality Preset & High Ray Tracing Preset (DX12) 1920x1080
103
98.1
Rage 2

Rage 2

2019
low 1280x720
294  fps    + Compare
med. 1920x1080
209  fps    + Compare
high 1920x1080
182  fps    + Compare
ultra 1920x1080
180  fps    + Compare
QHD 2560x1440
134  fps    + Compare
4K 3840x2160
72.1  fps    + Compare
» With all tested laptops playable in detail settings ultra.
Anno 1800

Anno 1800

2019
low 1280x720
137 142 ~ 140 fps    + Compare
med. 1920x1080
135 139 ~ 137 fps    + Compare
high 1920x1080
93.9 99.3 ~ 97 fps    + Compare
ultra 1920x1080
54 54.1 ~ 54 fps    + Compare
QHD 2560x1440
52.4 52.5 ~ 52 fps    + Compare
4K 3840x2160
43.2 46.3 ~ 45 fps    + Compare
» With all tested laptops playable in detail settings ultra.
low 1280x720
240  fps    + Compare
med. 1920x1080
197  fps    + Compare
high 1920x1080
168  fps    + Compare
ultra 1920x1080
140  fps    + Compare
QHD 2560x1440
107  fps    + Compare
4K 3840x2160
65  fps    + Compare
» With all tested laptops playable in detail settings ultra.
low 1280x720
143 150 ~ 147 fps    + Compare + 📈 Graph
med. 1920x1080
125 132 ~ 129 fps    + Compare + 📈 Graph
high 1920x1080
120 127 ~ 124 fps    + Compare + 📈 Graph
ultra 1920x1080
108 115 ~ 112 fps    + Compare + 📈 Graph
QHD 2560x1440
103 110 ~ 107 fps    + Compare + 📈 Graph
4K 3840x2160
88 89 ~ 89 fps    + Compare + 📈 Graph
» With all tested laptops playable in detail settings ultra.
low 1280x720
212 220 ~ 216 fps    + Compare
med. 1920x1080
155 181 ~ 168 fps    + Compare
high 1920x1080
60.2 143 ~ 102 fps    + Compare
ultra 1920x1080
111 116 ~ 114 fps    + Compare
QHD 2560x1440
92.2 97.4 ~ 95 fps    + Compare
4K 3840x2160
64.1 65.9 ~ 65 fps    + Compare
» With all tested laptops playable in detail settings ultra.
Additional Benchmarks
Ultra Quality DXR 16xAF 1920x1080
91.5
102
low 1280x720
144 144 ~ 144 fps    + Compare
med. 1920x1080
144 144 ~ 144 fps    + Compare
high 1920x1080
144 144 ~ 144 fps    + Compare
ultra 1920x1080
144 144 ~ 144 fps    + Compare
QHD 2560x1440
144 144 ~ 144 fps    + Compare
4K 3840x2160
140 143 ~ 142 fps    + Compare
» With all tested laptops playable in detail settings ultra.
low 1280x720
187.3 192 ~ 190 fps    + Compare
med. 1920x1080
165.8 178 ~ 172 fps    + Compare
high 1920x1080
148.6 163 ~ 156 fps    + Compare
ultra 1920x1080
137.9 152 ~ 145 fps    + Compare
QHD 2560x1440
116.1 132 ~ 124 fps    + Compare
4K 3840x2160
87.2 94.2 ~ 91 fps    + Compare
» With all tested laptops playable in detail settings ultra.
Additional Benchmarks
Ultra Preset DXR 1920x1080
128
122.1
low 1280x720
191 227 ~ 209 fps    + Compare
med. 1920x1080
181 206 ~ 194 fps    + Compare
high 1920x1080
186 198 ~ 192 fps    + Compare
ultra 1920x1080
177 185 ~ 181 fps    + Compare
QHD 2560x1440
147 152 ~ 150 fps    + Compare
4K 3840x2160
83.9 87.9 ~ 86 fps    + Compare
» With all tested laptops playable in detail settings ultra.
Strange Brigade

Strange Brigade

2018
low 1280x720
426 567 ~ 497 fps    + Compare
med. 1920x1080
350 416 ~ 383 fps    + Compare
high 1920x1080
315 336 ~ 326 fps    + Compare
ultra 1920x1080
285 289 ~ 287 fps    + Compare
QHD 2560x1440
218 220 ~ 219 fps    + Compare
4K 3840x2160
134 135 ~ 135 fps    + Compare
» With all tested laptops playable in detail settings ultra.
Far Cry 5

Far Cry 5

2018
low 1280x720
175 184 ~ 180 fps    + Compare + 📈 Graph
med. 1920x1080
152 162 ~ 157 fps    + Compare + 📈 Graph
high 1920x1080
144 155 ~ 150 fps    + Compare + 📈 Graph
ultra 1920x1080
135 145 ~ 140 fps    + Compare + 📈 Graph
QHD 2560x1440
132 137 ~ 135 fps    + Compare + 📈 Graph
4K 3840x2160
93 95 ~ 94 fps    + Compare + 📈 Graph
» With all tested laptops playable in detail settings ultra.
low 1280x720
163 165 ~ 164 fps    + Compare
med. 1920x1080
153 153 ~ 153 fps    + Compare
high 1920x1080
122.5 123 ~ 123 fps    + Compare
4K 3840x2160
104.8 105 ~ 105 fps    + Compare
» With all tested laptops playable in detail settings high.
low 1280x720
148 228 ~ 188 fps    + Compare
med. 1920x1080
132 205 ~ 169 fps    + Compare
high 1920x1080
113 156 ~ 135 fps    + Compare
QHD 2560x1440
91 124 ~ 108 fps    + Compare
4K 3840x2160
66 76.1 ~ 71 fps    + Compare
» With all tested laptops playable in detail settings high.
low 1024x768
327 388 ~ 358 fps    + Compare
med. 1366x768
231 300 ~ 266 fps    + Compare
high 1920x1080
217 273 ~ 245 fps    + Compare
ultra 1920x1080
217 233 ~ 225 fps    + Compare
4K 3840x2160
107 114 ~ 111 fps    + Compare
» With all tested laptops playable in detail settings ultra.
low 1280x720
124.1 216.6 ~ 170 fps    + Compare
med. 1366x768
113.2 197.1 ~ 155 fps    + Compare
high 1920x1080
109.3 184.4 ~ 147 fps    + Compare
ultra 1920x1080
101.1 168.7 ~ 135 fps    + Compare
4K 3840x2160
98 159.1 ~ 129 fps    + Compare
» With all tested laptops playable in detail settings ultra.
low 1024x768
427 446 ~ 437 fps    + Compare
med. 1366x768
375 413 ~ 394 fps    + Compare
high 1920x1080
286 320 ~ 303 fps    + Compare
ultra 1920x1080
145 152 ~ 149 fps    + Compare + 📈 Graph
4K 3840x2160
114 115 ~ 115 fps    + Compare
» With all tested laptops playable in detail settings ultra.
Additional Benchmarks
Ultra Graphics & Postprocessing (HBAO+) 3840x2160
78
85.7
GTA V

GTA V

2015
low 1024x768
182 187 ~ 185 fps    + Compare
med. 1366x768
175 187 ~ 181 fps    + Compare
high 1920x1080
169 184 ~ 177 fps    + Compare
ultra 1920x1080
104 130 ~ 117 fps    + Compare
QHD 2560x1440
101 122 ~ 112 fps    + Compare
4K 3840x2160
136 150 ~ 143 fps    + Compare
» With all tested laptops playable in detail settings ultra.
Additional Benchmarks
Highest Settings possible 16xAF 4xMSAA + FXAA 3840x2160
78.4
75.2
Normal/Off 4xAF 1920x1080
187
169
Lowest Settings possible 1920x1080
187
180
lowmed.highultraQHD4K
The Last of Us148.6128.8120.2106.371.234.9
Resident Evil 4 Remake253188.8173127.397.659.3
Company of Heroes 3289235230180109
Sons of the Forest120.9116.5114112.498.569.5
Atomic Heart307239147.4121.495.760
Returnal16114512810363
Hogwarts Legacy134.6122.710183.548.5
Dead Space Remake124.8121.7107100.972.139.1
The Witcher 3 v4.00257222191.615487.8
High On Life348275206170.9108.544
The Callisto Protocol17812612595.958.6
Need for Speed Unbound178.5161141.5131.177.6
Spider-Man Miles Morales151.7150.6149123.773.1
Call of Duty Modern Warfare 2 202220916216011468
Uncharted Legacy of Thieves Collection108.2106.8103.488.357.4
A Plague Tale Requiem114.9100.186.365.138.3
FIFA 23223203200191.4143.8
The Quarry203166.8134.497.253.8
F1 223273051237940
Vampire Bloodhunt353345329237127.3
Ghostwire Tokyo216207205172.589.9
Tiny Tina's Wonderlands24319415711565.4
Cyberpunk 2077 1.613813413186.142.8
Elex 293.392.592.179.559.6
GRID Legends155135125123105
Elden Ring59.258.658.658.658.3
Dying Light 213912894.653.8
Rainbow Six Extraction33032426318198
God of War13513111094.166.2
Halo Infinite17415114211470.1
Farming Simulator 22166154138136128
Battlefield 204213313012311377.6
Forza Horizon 51521401009375
Call of Duty Vanguard17917616112677.7
Riders Republic15214414011972
Guardians of the Galaxy11311211111095
Back 4 Blood290273270223131
Far Cry 610499928872
Alan Wake Remastered10610210197
FIFA 22268265263261260
New World74.870.870.669.768.1
Deathloop11911911410868.5
F1 202126325515214991
Monster Hunter Stories 2144144144144
Days Gone17216915813178.6
Mass Effect Legendary Edition129122120117
Resident Evil Village188187186182103
Outriders13513312612579.1
Hitman 3172168166164109
Cyberpunk 2077 1.013212811610372.538.9
Immortals Fenyx Rising143121109807457
Yakuza Like a Dragon12111611811011272.4
Call of Duty Black Ops Cold War23520117312710465.6
Assassin´s Creed Valhalla13611196887652
Dirt 51811281121047761
Watch Dogs Legion1351341191018154
FIFA 21238248238238247240
Star Wars Squadrons473413371360270172
Mafia Definitive Edition19117215713278
Serious Sam 4172137130125119115
Crysis Remastered22715798.962.159.949.2
Flight Simulator 202011597.479.962.855.637.3
Horizon Zero Dawn18116615614313189
Death Stranding23221920820216398.7
F1 2020344272244182151116
Doom Eternal290285277275258158
Hunt Showdown248203200172101
Red Dead Redemption 21601521381008456
Star Wars Jedi Fallen Order13113013113095
Borderlands 31561351251239962
Control23819115310656
Rage 229420918218013472.1
Anno 180014013797545245
The Division 224019716814010765
Far Cry New Dawn14712912411210789
Metro Exodus2161681021149565
Apex Legends144144144144144142
Battlefield V19017215614512491
Shadow of the Tomb Raider20919419218115086
Strange Brigade497383326287219135
Far Cry 518015715014013594
X-Plane 11.11164153123105
Final Fantasy XV Benchmark18816913510871
Rise of the Tomb Raider358266245225111
Dota 2 Reborn170155147135129
The Witcher 3437394303149115
GTA V185181177117112143
< 30 fps
< 60 fps
< 120 fps
≥ 120 fps


1
43

1
12
73

1
20
65

2
25
52

4
44
35

23
51
13

For more games that might be playable and a list of all games and graphics cards visit our Gaming List

Add one or more devices and compare

In the following list you can select (and also search for) devices that should be added to the comparison. You can select more than one device.

restrict list:

show all (including archived), 2024, 2023
v1.26
log 24. 01:29:22

#0 no ids found in url (should be separated by "_") +0s ... 0s

#1 not redirecting to Ajax server +0s ... 0s

#2 did not recreate cache, as it is less than 5 days old! Created at Mon, 22 Apr 2024 05:40:21 +0200 +0.001s ... 0.001s

#3 composed specs +0.046s ... 0.047s

#4 did output specs +0s ... 0.047s

#5 start showIntegratedCPUs +0s ... 0.047s

#6 getting avg benchmarks for device 10487 +0.03s ... 0.077s

#7 got single benchmarks 10487 +0.016s ... 0.093s

#8 got avg benchmarks for devices +0s ... 0.093s

#9 min, max, avg, median took s +0.87s ... 0.963s

#10 before gaming benchmark output +0s ... 0.963s

#11 Got 630 rows for game benchmarks. +0.109s ... 1.072s

#12 composed SQL query for gamebenchmarks +0s ... 1.072s

#13 got data and put it in $dataArray +0.068s ... 1.14s

#14 benchmarks composed for output. +4.235s ... 5.375s

#15 return log +0.059s ... 5.434s

Please share our article, every link counts!

» Comparison of GPUs
Detailed list of all laptop GPUs sorted by class and performance.

» Benchmark List
Sort and restrict laptop GPUs based on performance in synthetic benchmarks.

» Notebook Gaming List
Playable games for each graphics card and their average FPS results.

Class 1

Arc A580 Desktop

Class 2

Arc A380 Desktop

Class 3

UHD Graphics 32EUs
UHD Graphics 750

Class 4

* Approximate position of the graphics adapter

> Expert Reviews and News on Laptops, Smartphones and Tech Innovations > Benchmarks / Tech > Comparison of Laptop Graphics Cards > NVIDIA GeForce RTX 3080 GPU - Benchmarks and Specs
Klaus Hinum (Update: 2020-12-13)