Notebookcheck Logo

NVIDIA GeForce GTX 480M SLI

NVIDIA GeForce GTX 480M SLI

The NVIDIA GeForce GTX 480M SLI is a high-end graphics solution for laptops based on two GTX 480M graphics cards in SLI mode. Each card usually renders a single frame in an alternating manner. Therefore, it may suffer from micro stuttering in low fps ranges of 30fps. This happens because of different timespans between two frames (e.g. Irregular delays between sequential frames).

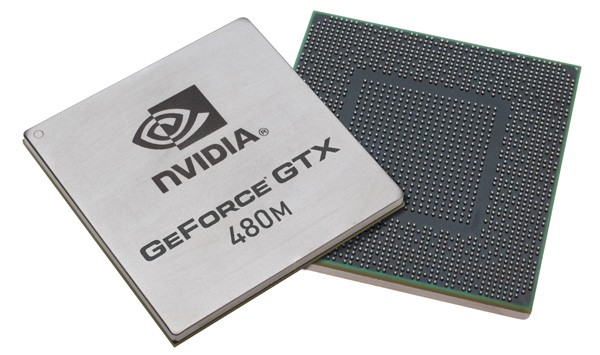
The GeForce GTX480M SLI supports the same features as a single GTX 480M card. A single card is based on the Fermi architecture. Therefore, it supports DirectX 11 and is produced in 40nm at TSMC. Featuring 352 cores, the GTX480M is similar to the desktop GTX 465 but features a lower clock rate. The GeForce GTX 480M is combined with 2 GB of fast GDDR5 graphics memory (dedicated) and the overall performance should be superior to the Mobility Radeon HD 5870.

The GF100 aka. Fermi chip was redesigned from scratch and features 3 billion transistors (with all 512 shaders). Compared to the desktop Radeon HD 5870 with 2.13 billion transistors or the Mobility Radeon HD 5870 (RV870) with 1.04 billion transistors, the GTX480M chipset is quite large.

The mobile Fermi chip is stripped down to 352 shader cores (1-dimensional) with 32 ROPs and 44 Texture Units. The memory bus is 256 bit wide, but due to the fast GDDR5 memory, this should not be a bottleneck. The power consumption is specified with 100 Watt TDP including the MXM board and the 2 GB GDDR5. AMD usually specifies the TDP of the chip alone, therefore this value is not directly comparable. Still, the GTX 480M is only suited for very large DTR laptops with a good cooling system. Originally, only Clevo sold 17" (D901F) and 18" (X8100) barebone systems.

The fast performance of the Nvidia GeForce GTX 480M SLI is marginally better than two ATI Mobility Radeon HD 5870 in Crossfire Mode (CF), partly because of the superior driver support from Nvidia.  This means the GTX 480M SLI was the fastest graphics solution for laptops at the time of arrival (2010-06). It allows the user to play all current games in high resolutions and detail settings with Antialiasing activated. Only Metro 2033 and Crysis have to run at lower settings (see below).

Still, in some games the performance gain from SLI may be very small or sometimes a single card may be even a bit faster (due to no SLI support and overhead). You can still disable SLI through the drivers in this case. In our gaming tests, a single 480M was about 16% (Starcraft 2) to 48% (Far Cry 2) slower than the SLI combination. Otherwise, most modern games run about 40% slower on the single card compared to the SLI setup. (see expandable gaming charts below). Due to the fast tessellation unit, upcoming DirectX 11 games may have an advantage over the AMD 5000 series.

Similar to the GeForce 300M series, the GeForce GTX 480M supports PureVideo HD with VideoProcessor 4 (VP4 with Feature Set C). As a result, the GPU is able to fully decode HD videos in H.254, VC-1, MPEG-2, and MPEG-4 ASP. By using Flash 10.1 or later, the graphics card can also accelerate Flash videos, thus taking workload off of the CPU.

The rendering cores of the Nvidia GeForce GTX 480M can be used for general calculations by means of CUDA or DirectCompute. E.g., the encoding for HD videos can be done significantly faster by using the shader cores of the GPUs rather than using most modern CPUs. PhysX is also supported by the mobile Fermi to calculate physics effects in supported games. Furthermore, a single GTX480M can be used to calculate PhysX while the other card renders the game.

Compared to desktop GPUs, the Geforce GTX 480M is comparable to an underclocked Nvidia GeForce GTX 465 SLI combination (607/1200 clock speed).

GeForce GTX 400M Series

GeForce GTX 485M SLI compare 768 @ 0.58 GHz256 Bit @ 1500 MHz
GeForce GTX 470M SLI compare 576 @ 0.54 GHz192 Bit @ 1250 MHz
GeForce GTX 480M SLI 704 @ 0.43 GHz256 Bit @ 1200 MHz
GeForce GTX 460M SLI compare 384 @ 0.68 GHz192 Bit @ 1250 MHz
GeForce GTX 485M compare 384 @ 0.58 GHz256 Bit @ 1500 MHz
GeForce GTX 470M compare 288 @ 0.54 GHz192 Bit @ 1250 MHz
GeForce GTX 480M compare 352 @ 0.43 GHz256 Bit @ 1200 MHz
GeForce GTX 460M compare 192 @ 0.68 GHz192 Bit @ 1250 MHz
CodenameN11E-GTX-A3
ArchitectureFermi
Pipelines704 - unified
Core Speed425 MHz
Shader Speed850 MHz
Memory Speed1200 MHz
Memory Bus Width256 Bit
Memory TypeGDDR5
Max. Amount of Memory4 GB
Shared Memoryno
APIDirectX 11, Shader 5.0
Power Consumption100 Watt
Transistor Count6 Billion
technology40 nm
Notebook Sizelarge
Date of Announcement25.05.2010
Link to Manufacturer Pagewww.nvidia.com

Benchmarks

3DMark Vantage
3DM Vant. Perf. total +
3DMark Vantage - 3DM Vant. Perf. total
min: 15839     avg: 16500     median: 16499.5 (5%)     max: 17160 Points
3DM Vant. Perf. GPU no PhysX +
3DMark 06 3DMark 06 - Standard 1280x1024 +
3DMark 06 - Standard 1280x768 +
3DMark 06
21792 Points (29%)
SPECviewperf 11
specvp11 snx-01 +
specvp11 tcvis-02 +
specvp11 sw-02 +
specvp11 proe-05 +
specvp11 maya-03 +
specvp11 lightwave-01 +
specvp11 ensight-04 +
specvp11 catia-03 +
Cinebench R10 Cinebench R10 Shading (32bit) +
Cinebench R11.5 Cinebench R11.5 OpenGL 64 Bit +
- Range of benchmark values for this graphics card
- Average benchmark values for this graphics card
* Smaller numbers mean a higher performance

Game Benchmarks

The following benchmarks stem from our benchmarks of review laptops. The performance depends on the used graphics memory, clock rate, processor, system settings, drivers, and operating systems. So the results don't have to be representative for all laptops with this GPU. For detailed information on the benchmark results, click on the fps number.

Mafia 2

Mafia 2

2010
low 800x600
124.7  fps    + Compare
med. 1024x768
113.2  fps    + Compare
high 1360x768
105.8  fps    + Compare
ultra 1920x1080
75.8  fps    + Compare
» With all tested laptops playable in detail settings ultra.
low 1024x768
279.6  fps    + Compare
med. 1360x768
74.9  fps    + Compare
high 1360x768
64.6  fps    + Compare
ultra 1920x1080
42.5  fps    + Compare
» With all tested laptops playable in detail settings ultra.
low 800x600
med. 1360x768
high 1600x900
ultra 1920x1080
» With all tested laptops playable in detail settings high.
low 1024x768
med. 1366x768
high 1366x768
ultra 1920x1080
» With all tested laptops playable in detail settings ultra.
low 800x600
med. 1024x768
high 1366x768
ultra 1920x1080
» With all tested laptops playable in detail settings ultra.
Risen

Risen

2009
low 800x600
med. 1024x768
high 1366x768
ultra 1920x1080
» With all tested laptops playable in detail settings ultra.
Resident Evil 5

Resident Evil 5

2009
low 800x600
157.8  fps    + Compare
high 1360x768
98.7  fps    + Compare
ultra 1920x1080
97.5  fps    + Compare
» With all tested laptops playable in detail settings ultra.
Need for Speed Shift

Need for Speed Shift

2009
med. 1024x768
high 1366x768
ultra 1920x1080
» With all tested laptops playable in detail settings ultra.
Colin McRae: DIRT 2

Colin McRae: DIRT 2

2009
low 800x600
188.2  fps    + Compare
med. 1024x768
157.5  fps    + Compare
high 1360x768
130.7  fps    + Compare
ultra 1920x1080
81.3  fps    + Compare
» With all tested laptops playable in detail settings ultra.
Anno 1404

Anno 1404

2009
low 1024x768
ultra 1280x1024
» With all tested laptops playable in detail settings ultra.
F.E.A.R. 2

F.E.A.R. 2

2009
low 800x600
med. 1024x768
high 1280x1024
ultra 1920x1080
» With all tested laptops playable in detail settings ultra.
Left 4 Dead

Left 4 Dead

2008
low 640x480
high 1024x768
» With all tested laptops playable in detail settings high.
Far Cry 2

Far Cry 2

2008
low 640x480
199.7  fps    + Compare
high 1024x768
134  fps    + Compare
ultra 1920x1080
88.1  fps    + Compare
» With all tested laptops playable in detail settings ultra.
Call of Duty 4 - Modern Warfare

Call of Duty 4 - Modern Warfare

2007
low 800x600
med. 1024x768
high 1280x1024
» With all tested laptops playable in detail settings high.
Crysis - GPU Benchmark

Crysis - GPU Benchmark

2007
low 1024x768
132.1  fps    + Compare
med. 1024x768
83.4  fps    + Compare
high 1024x768
68.8  fps    + Compare
ultra 1920x1080
30.9  fps    + Compare
» With all tested laptops playable in detail settings high.
Crysis - CPU Benchmark

Crysis - CPU Benchmark

2007
low 1024x768
170.3  fps    + Compare
med. 1024x768
89.5  fps    + Compare
high 1024x768
72.8  fps    + Compare
ultra 1920x1080
30.1  fps    + Compare
» With all tested laptops playable in detail settings high.
Call of Juarez Benchmark

Call of Juarez Benchmark

2006
high 1024x768
152.2  fps    + Compare
» With all tested laptops playable in detail settings high.
Half Life 2 - Lost Coast Benchmark

Half Life 2 - Lost Coast Benchmark

2005
high 1024x768
244.9  fps    + Compare
» With all tested laptops playable in detail settings high.
lowmed.highultraQHD4K
Mafia 2124.7113.2105.875.8
StarCraft 2279.674.964.642.5
Metro 2033134.4106.861.123.1
Battlefield: Bad Company 2151.6134.4110.664.7
CoD Modern Warfare 2277.5148129.190.3
Risen148.9125.7104.670.9
Resident Evil 5157.898.797.5
Need for Speed Shift113.8115.993
Colin McRae: DIRT 2188.2157.5130.781.3
Anno 1404173103.9
F.E.A.R. 2238.3160.2154.7108.7
Left 4 Dead244.2191.1
Far Cry 2199.713488.1
Call of Duty 4 - Modern Warfare357.4244172.1
Crysis - GPU Benchmark132.183.468.830.9
Crysis - CPU Benchmark170.389.572.830.1
Call of Juarez Benchmark152.2
Half Life 2 - Lost Coast Benchmark244.9
< 30 fps
< 60 fps
< 120 fps
≥ 120 fps


15


6
6


9
8
1
3
10


For more games that might be playable and a list of all games and graphics cards visit our Gaming List

Add one or more devices and compare

In the following list you can select (and also search for) devices that should be added to the comparison. You can select more than one device.

restrict list:

show all (including archived), 2024, 2023
v1.26
log 15. 12:16:39

#0 no ids found in url (should be separated by "_") +0s ... 0s

#1 not redirecting to Ajax server +0s ... 0s

#2 did not recreate cache, as it is less than 5 days old! Created at Wed, 13 Mar 2024 05:40:26 +0100 +0.001s ... 0.001s

#3 composed specs +0.05s ... 0.051s

#4 did output specs +0s ... 0.051s

#5 start showIntegratedCPUs +0s ... 0.051s

#6 getting avg benchmarks for device 1857 +0.013s ... 0.064s

#7 got single benchmarks 1857 +0.009s ... 0.073s

#8 got avg benchmarks for devices +0s ... 0.073s

#9 min, max, avg, median took s +0.382s ... 0.454s

#10 before gaming benchmark output +0s ... 0.454s

#11 Got 58 rows for game benchmarks. +0.006s ... 0.46s

#12 composed SQL query for gamebenchmarks +0s ... 0.46s

#13 got data and put it in $dataArray +0.01s ... 0.47s

#14 benchmarks composed for output. +0.493s ... 0.963s

#15 return log +0.039s ... 1.002s

Please share our article, every link counts!

» Comparison of GPUs
Detailed list of all laptop GPUs sorted by class and performance.

» Benchmark List
Sort and restrict laptop GPUs based on performance in synthetic benchmarks.

» Notebook Gaming List
Playable games for each graphics card and their average FPS results.

Class 0

Arc A380

Class 1

Class 2

Radeon PRO W6600M *

Class 3

UHD Graphics 32EUs
UHD Graphics 750

Class 4

Class 5

* Approximate position of the graphics adapter