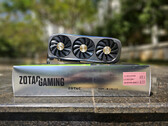
NVIDIA GeForce RTX 4070
The Nvidia GeForce RTX 4070 is a high-end desktop graphics card based on the AD104 chip using the Ada Lovelace architecture. The 4070 offers 5,888 cores and 12 GB GDDR6X graphics memory with a 192 bit memory bus and clocked at 21 Gbits. The card offers a good raytracing performance thanks to the 46 dedicated raytracing cores. For AI calculations (and DLSS 3 in games), the RTX 4070 has 184 Tensor cores.
The gaming performance is well suited for 2k/QHD gaming in most demanding games, and should be able to handle 4k gaming for lesser demanding games (or with reduced settings / DLSS activated). The raw gaming performance is comparable to an older RTX 3080 or a AMD Radeon 6800 XT . Compared to the similar named mobile GeForce RTX 4070 Laptop GPU , the desktop variant is much faster.
The AD104 chip is manufactured in the modern 5nm process at TSMC (4N with EUV) and specified with a TGP (Total Graphics Power) of 200 Watt (compared to the 450 Watt of the RTX 4090 ).
GeForce RTX 4000 Series Codename AD104 Architecture Ada Lovelace Pipelines 5888 - unified TMUs 184 ROPs 64 Raytracing Cores 46 Tensor / AI Cores 184 Core Speed 1920 - 2475 (Boost) MHz Theoretical Performance 29.1 TFLOPS FP16, 29.1 TFLOPS FP32, 0.63 TFLOPS FP64 Cache L2: 36 MB Memory Speed 21000 effective = 1313 MHz Memory Bus Width 192 Bit Memory Type GDDR6X Max. Amount of Memory 12 GB Shared Memory no Memory Bandwidth 504.2 GB/s API DirectX 12 Ultimate, Shader 6.7, OpenGL 4.6, OpenCL 3.0, Vulkan 1.3 Power Consumption 200 Watt Transistor Count 35.8 Billion Die Size 295 mm² technology 5 nm PCIe 4.0 x16 Displays 4 Displays (max.), HDMI 2.1, DisplayPort 1.4a Date of Announcement 13.04.2023 Predecessor NVIDIA GeForce RTX 3070
Benchmarks Performance Rating - 3DMark 11 + Fire Strike + Time Spy
20 pt (60%)
...
...
3DMark - 3DMark Time Spy Score
min: 17690 avg: 17905 median: 17905 (52%) max: 18120 Points
...
...
3DMark - 3DMark Time Spy Graphics
min: 17827 avg: 17837 median: 17837 (47%) max: 17847 Points
...
...
3DMark - 3DMark Ice Storm Unlimited Graphics
min: 748837 avg: 773592 median: 773592 (88%) max: 798347 Points
...
...
3DMark - 3DMark Ice Storm Extreme Graphics
min: 524404 avg: 559874 median: 559874 (72%) max: 595343 Points
...
...
3DMark - 3DMark Cloud Gate Score
min: 80436 avg: 82474 median: 82473.5 (88%) max: 84511 Points
...
3DMark - 3DMark Cloud Gate Graphics
min: 164148 avg: 193559 median: 193559 (51%) max: 222970 Points
...
...
3DMark - 3DMark Fire Strike Standard Score
min: 36970 avg: 38929 median: 38929 (69%) max: 40888 Points
...
...
3DMark - 3DMark Fire Strike Standard Graphics
min: 43583 avg: 43824 median: 43824 (49%) max: 44065 Points
...
...
3DMark - 3DMark Ice Storm Graphics
min: 588470 avg: 611815 median: 611814 (73%) max: 635159 Points
...
...
3DMark - 3DMark Wild Life Unlimited
110844 Points (56%)
...
3DMark - 3DMark Wild Life Extreme Unlimited
35424 Points (41%)
...
3DMark - 3DMark Night Raid
min: 83149 avg: 86590 median: 86590 (82%) max: 90031 Points
...
3DMark - 3DMark Night Raid Graphics Score
min: 183108 avg: 187585 median: 187585 (72%) max: 192062 Points
...
...
3DMark 11 - 3DM11 Performance Score
min: 47838 avg: 49046 median: 49045.5 (68%) max: 50253 Points
...
...
3DMark 11 - 3DM11 Performance GPU
min: 59510 avg: 59969 median: 59969 (52%) max: 60428 Points
...
...
3DMark Vantage 3DM Vant. Perf. total + 3DMark Vantage - 3DM Vant. Perf. total
128530 Points (37%)
...
3DM Vant. Perf. GPU no PhysX + 3DMark Vantage - 3DM Vant. Perf. GPU no PhysX
138261 Points (78%)
...
3DMark 05 - 3DMark 05 - Standard
86975 Points (95%)
...
3DMark 06 3DMark 06 - Standard 1280x1024 +
69488 Points (91%)
...
Unigine Valley 1.0 - Unigine Valley 1.0 DX
min: 190 avg: 192.6 median: 192.6 (63%) max: 195.2 fps
...
...
Blender - Blender 3.3 Classroom CUDA *
23 Seconds (3%)
...
...
Blender - Blender 3.3 Classroom OPTIX *
14 Seconds (5%)
...
SPECviewperf 12 specvp12 sw-03 + SPECviewperf 12 - specvp12 sw-03
109 fps (27%)
...
...
specvp12 snx-02 + SPECviewperf 12 - specvp12 snx-02
16.4 fps (2%)
...
...
specvp12 showcase-01 + SPECviewperf 12 - specvp12 showcase-01
190 fps (41%)
...
...
specvp12 mediacal-01 + SPECviewperf 12 - specvp12 mediacal-01
132 fps (34%)
...
...
specvp12 maya-04 + SPECviewperf 12 - specvp12 maya-04
284 fps (77%)
...
specvp12 energy-01 + SPECviewperf 12 - specvp12 energy-01
31.7 fps (28%)
...
...
specvp12 creo-01 + SPECviewperf 12 - specvp12 creo-01
89.1 fps (36%)
...
...
specvp12 catia-04 + SPECviewperf 12 - specvp12 catia-04
161 fps (27%)
...
Intel Arc A580
...
specvp12 3dsmax-05 + SPECviewperf 12 - specvp12 3dsmax-05
382 fps (67%)
...
SPECviewperf 13 specvp13 sw-04 + SPECviewperf 13 - specvp13 sw-04
157 fps (42%)
...
...
specvp13 snx-03 + SPECviewperf 13 - specvp13 snx-03
29.5 fps (3%)
...
...
specvp13 showcase-02 + SPECviewperf 13 - specvp13 showcase-02
191 fps (42%)
...
...
specvp13 medical-02 + SPECviewperf 13 - specvp13 medical-02
112 fps (23%)
...
...
specvp13 maya-05 + SPECviewperf 13 - specvp13 maya-05
510 fps (58%)
...
...
specvp13 energy-02 + SPECviewperf 13 - specvp13 energy-02
54.2 fps (17%)
...
...
specvp13 creo-02 + SPECviewperf 13 - specvp13 creo-02
375 fps (55%)
...
...
specvp13 catia-05 + SPECviewperf 13 - specvp13 catia-05
241 fps (27%)
...
Intel Arc A580
...
specvp13 3dsmax-06 + SPECviewperf 13 - specvp13 3dsmax-06
381 fps (66%)
...
...
SPECviewperf 2020 specvp2020 snx-04 4k + SPECviewperf 2020 - specvp2020 snx-04 4k
23.9 fps (2%)
...
...
specvp2020 medical-03 4k + SPECviewperf 2020 - specvp2020 medical-03 4k
22.2 fps (21%)
...
...
specvp2020 maya-06 4k + SPECviewperf 2020 - specvp2020 maya-06 4k
305 fps (50%)
...
...
specvp2020 energy-03 4k + SPECviewperf 2020 - specvp2020 energy-03 4k
57.6 fps (13%)
...
...
specvp2020 creo-03 4k + SPECviewperf 2020 - specvp2020 creo-03 4k
112 fps (53%)
...
...
specvp2020 catia-06 4k + SPECviewperf 2020 - specvp2020 catia-06 4k
51.6 fps (34%)
...
...
specvp2020 3dsmax-07 4k + SPECviewperf 2020 - specvp2020 3dsmax-07 4k
122 fps (51%)
...
...
Basemark GPU 1.2 - Basemark GPU 1.2 Vulkan Official Medium Offscreen 1080
104.6 fps (1%)
...
...
Basemark GPU 1.2 - Basemark GPU 1.2 Vulkan Official High Offscreen 2160
3.6 fps (1%)
...
LuxMark v2.0 64Bit - LuxMark v2.0 Room GPU
min: 6950 avg: 7176 median: 7176 (32%) max: 7402 Samples/s
...
...
LuxMark v2.0 64Bit - LuxMark v2.0 Sala GPU
min: 14493 avg: 14797 median: 14796.5 (26%) max: 15100 Samples/s
...
...
ComputeMark v2.1 - ComputeMark v2.1 Result
min: 41933 avg: 42491 median: 42491 (46%) max: 43049 points
...
...
Power Consumption - Furmark Stress Test Power Consumption - external Monitor *
min: 311 avg: 330.3 median: 329 (47%) max: 351 Watt
...
Intel Arc A580
...
0 20 40 60 80 100 120 140 160 180 200 220 240 260 280 300 320 340 360 380 Tooltip Zotac Gaming GeForce RTX 4070 AMP Airo 120% PT: Ø311 (307-371)
Zotac Gaming GeForce RTX 4070 AMP Airo 120% PT: Ø351 (344-400)
KFA2 GeForce RTX 4070 EX Gamer: Ø329 (257-337)
Power Consumption - The Witcher 3 Power Consumption - external Monitor *
min: 353 avg: 356.7 median: 358 (50%) max: 359 Watt
...
...
0 25 50 75 100 125 150 175 200 225 250 275 300 325 350 375 400 425 Tooltip Zotac Gaming GeForce RTX 4070 AMP Airo 120% PT: Ø353 (347-440)
Zotac Gaming GeForce RTX 4070 AMP Airo 120% PT: Ø358 (348-400)
KFA2 GeForce RTX 4070 EX Gamer: Ø359 (356-375)
Power Consumption - Witcher 3 ultra Power Efficiency - external Monitor
min: 0.4709 avg: 0.5 median: 0.5 (39%) max: 0.4769 fps per Watt
...
...
- Range of benchmark values for this graphics card
- Average benchmark values for this graphics card
* Smaller numbers mean a higher performance
Game Benchmarks The following benchmarks stem from our benchmarks of review laptops. The performance depends on the used graphics memory, clock rate, processor, system settings, drivers, and operating systems. So the results don't have to be representative for all laptops with this GPU. For detailed information on the benchmark results, click on the fps number.
...
...
...
...
...
...
...
...
...
...
...
» With all tested laptops playable in detail settings ultra.
Additional Benchmarks
Ultra Low Preset TAA 1280x720
397 [X] AMD Ryzen 9 7950X 4.5GHz
NVIDIA GeForce RTX 4070
min:
286 fps, max:
504 fps
...
...
Intel UHD Graphics 32EUs (Alder Lake)
...
0 100 200 300 400 500 600 700 800 900 1000 1100 1200 1300 1400 1500 1600 1700 1800 1900 2000 2100 2200 2300 2400 2500 2600 2700 2800 2900 3000 3100 3200 3300 3400 3500 3600 3700 Tooltip
Intel UHD Graphics 32EUs (Alder Lake)
...
...
...
» With all tested laptops playable in detail settings ultra.
Additional Benchmarks
Low Preset 1280x720
396 [X] AMD Ryzen 9 7950X 4.5GHz
NVIDIA GeForce RTX 4070
min:
80.1 fps, P0.1:
146.1 fps, P1:
252 fps, max:
618 fps
...
...
...
...
...
...
...
...
...
...
» With all tested laptops playable in detail settings ultra.
Additional Benchmarks
Low Preset 1280x720
141.8 [X] AMD Ryzen 9 7950X 4.5GHz
NVIDIA GeForce RTX 4070
min:
11.7 fps, P0.1:
47.7 fps, P1:
112.8 fps, max:
181 fps
Epic Preset + Ray Tracing 1920x1080
83.9 [X] AMD Ryzen 9 7950X 4.5GHz
NVIDIA GeForce RTX 4070
min:
16.9 fps, P0.1:
23.7 fps, P1:
54.8 fps, max:
131 fps
...
...
0 100 200 300 400 500 600 700 800 Tooltip
...
...
...
0 100 200 Tooltip : Ø169.9 (145.225-216.58)
...
...
...
» With all tested laptops playable in detail settings ultra.
Additional Benchmarks
Low Preset Low TAA 1280x720
316 [X] AMD Ryzen 9 7950X 4.5GHz
NVIDIA GeForce RTX 4070
min:
23.7 fps, P0.1:
33.5 fps, P1:
203 fps, max:
427 fps
...
...
...
...
...
...
...
...
...
...
» With all tested laptops playable in detail settings ultra.
Additional Benchmarks
Low Preset 1280x720
178 [X] AMD Ryzen 9 7950X 4.5GHz
NVIDIA GeForce RTX 4070
min:
61.7 fps, P0.1:
80.2 fps, P1:
122.4 fps, max:
267 fps
...
...
0 100 200 300 400 500 600 700 Tooltip
...
...
...
...
...
...
...
...
...
...
» With all tested laptops playable in detail settings ultra.
Additional Benchmarks
Prioritize Performance Preset 1280x720
286 [X] AMD Ryzen 9 7950X 4.5GHz
NVIDIA GeForce RTX 4070
min:
11.9 fps, P0.1:
82.8 fps, P1:
191 fps, max:
379 fps
...
...
...
...
...
...
...
...
...
» With all tested laptops playable in detail settings ultra.
Additional Benchmarks
Minimum Settings 1280x720
390.5 [X] AMD Ryzen 9 7950X 4.5GHz
NVIDIA GeForce RTX 4070
...
...
...
...
...
...
...
...
0 100 200 300 400 500 600 Tooltip
...
...
...
...
» With all tested laptops playable in detail settings ultra.
Additional Benchmarks
Ultra Low Preset 1280x720
138.2 [X] AMD Ryzen 9 7950X 4.5GHz
NVIDIA GeForce RTX 4070
min:
6.83 fps, P0.1:
63.4 fps, P1:
106.5 fps, max:
192 fps
...
...
...
...
0 100 200 300 400 500 600 Tooltip
...
...
...
...
...
...
» With all tested laptops playable in detail settings ultra.
Additional Benchmarks
Low Preset 1280x720
325 [X] AMD Ryzen 9 7950X 4.5GHz
NVIDIA GeForce RTX 4070
min:
31.7 fps, P0.1:
175.1 fps, P1:
254 fps, max:
415 fps
...
...
...
...
...
...
...
...
...
...
...
...
» With all tested laptops playable in detail settings ultra.
Additional Benchmarks
Low Preset 1280x720
197 [X] AMD Ryzen 9 7950X 4.5GHz
NVIDIA GeForce RTX 4070
Epic Preset + Epic Ray-Tracing 1920x1080
102 [X] AMD Ryzen 9 7950X 4.5GHz
NVIDIA GeForce RTX 4070
Epic Preset + Epic Ray-Tracing 3840x2160
40 [X] AMD Ryzen 9 7950X 4.5GHz
NVIDIA GeForce RTX 4070
...
...
...
...
...
...
...
...
...
...
...
» With all tested laptops playable in detail settings ultra.
Additional Benchmarks
Low Preset Low TAA 1280x720
166.2 [X] AMD Ryzen 9 7950X 4.5GHz
NVIDIA GeForce RTX 4070
min:
39.9 fps, P0.1:
102.6 fps, P1:
132.1 fps, max:
201 fps
Ultra Preset + Full Ray Tracing High TAA 1920x1080
73.1 [X] AMD Ryzen 9 7950X 4.5GHz
NVIDIA GeForce RTX 4070
min:
24.1 fps, P0.1:
27.4 fps, P1:
42 fps, max:
101.3 fps
Ultra Preset + Full Ray Tracing High TAA 3840x2160
29.3 [X] AMD Ryzen 9 7950X 4.5GHz
NVIDIA GeForce RTX 4070
min:
5.17 fps, P0.1:
5.84 fps, P1:
20.8 fps, max:
74.8 fps
...
...
...
...
0 100 Tooltip : Ø139.6 (114.192-171.445)
...
...
0 100 Tooltip : Ø136.9 (113.245-166.432)
...
...
...
...
...
...
» With all tested laptops playable in detail settings ultra.
Additional Benchmarks
Low Preset TAA 1280x720
236 [X] AMD Ryzen 9 7950X 4.5GHz
NVIDIA GeForce RTX 4070
min:
52.1 fps, P0.1:
72.3 fps, P1:
133.9 fps, max:
712 fps
0 100 200 300 400 500 600 700 800 900 1000 1100 Tooltip : Ø247 (192.292-1160)
: Ø304 (236.412-381.063)
...
...
Intel UHD Graphics 32EUs (Alder Lake)
...
0 100 200 300 400 500 600 700 800 900 1000 1100 Tooltip Gaming GeForce RTX 4070 AMP Airo: Ø146.9 (127.431-198.7)
: Ø247 (192.292-1160)
...
...
0 100 200 Tooltip Gaming GeForce RTX 4070 AMP Airo: Ø123.8 (111.56-160.8)
: Ø197.3 (176.043-237.1)
...
...
0 100 200 Tooltip Gaming GeForce RTX 4070 AMP Airo: Ø86.4 (66.26-264.3)
: Ø143.8 (119.089-189.93)
...
...
0 100 200 300 400 500 600 Tooltip Gaming GeForce RTX 4070 AMP Airo: Ø46.6 (36.008-121.8)
: Ø87.6 (68.123-663)
...
...
» With all tested laptops playable in detail settings ultra.
Additional Benchmarks
Low Preset / Off 1280x720
293 [X] AMD Ryzen 9 7950X 4.5GHz
NVIDIA GeForce RTX 4070
min:
11.3 fps, P0.1:
68.8 fps, P1:
216 fps, max:
435 fps
RT Ultra Preset / On FXAA 1920x1080
52.6 [X] AMD Ryzen 9 7950X 4.5GHz
NVIDIA GeForce RTX 4070
min:
6.36 fps, P0.1:
8.16 fps, P1:
20.8 fps, max:
120.2 fps
...
...
...
...
...
...
...
...
...
...
» With all tested laptops playable in detail settings ultra.
Additional Benchmarks
Low Preset 1280x720
376 [X] AMD Ryzen 9 7950X 4.5GHz
NVIDIA GeForce RTX 4070
min:
59.3 fps, P0.1:
204 fps, P1:
269 fps, max:
520 fps
...
...
...
...
...
...
...
...
...
...
» With all tested laptops playable in detail settings ultra.
Additional Benchmarks
Low Preset (without FSR Upscaling) 1280x720
240.6 [X] AMD Ryzen 9 7950X 4.5GHz
NVIDIA GeForce RTX 4070
Ultra Preset (without FSR Upscaling) + Full Ray-Tracing 1920x1080
78.6 [X] AMD Ryzen 9 7950X 4.5GHz
NVIDIA GeForce RTX 4070
...
...
...
...
0 100 Tooltip : Ø126.6 (112.768-180.426)
...
...
...
» With all tested laptops playable in detail settings ultra.
Additional Benchmarks
Very Low Preset 1280x720
208 [X] AMD Ryzen 9 7950X 4.5GHz
NVIDIA GeForce RTX 4070
min:
66.2 fps, P0.1:
103.7 fps, P1:
147.3 fps, max:
269 fps
Very High Preset + Ray-Tracing TAA 1920x0180
88.2 [X] AMD Ryzen 9 7950X 4.5GHz
NVIDIA GeForce RTX 4070
min:
67.7 fps, P0.1:
70.6 fps, P1:
73.5 fps, max:
171.7 fps
...
...
...
...
...
...
...
» With all tested laptops playable in detail settings ultra.
...
...
0 100 200 Tooltip Gaming GeForce RTX 4070 AMP Airo: Ø136.3 (115.137-218.9)
: Ø134.1 (114.019-212.1)
...
...
0 100 200 300 400 500 600 Tooltip Gaming GeForce RTX 4070 AMP Airo: Ø144.6 (109.608-668)
: Ø125.9 (110.029-162.6)
...
0 100 Tooltip Gaming GeForce RTX 4070 AMP Airo: Ø97.6 (85.205-153.3)
: Ø100.9 (87.23-183)
...
0 100 Tooltip Gaming GeForce RTX 4070 AMP Airo: Ø56.8 (52.485-67.9)
: Ø61 (52.463-136.7)
...
...
» With all tested laptops playable in detail settings ultra.
Additional Benchmarks
Low Preset 1280x720
149.7 [X] AMD Ryzen 9 7950X 4.5GHz
NVIDIA GeForce RTX 4070
min:
102.8 fps, P0.1:
112.1 fps, P1:
121.1 fps, max:
191.2 fps
...
...
...
...
...
...
...
...
...
...
...
...
» With all tested laptops playable in detail settings ultra.
Additional Benchmarks
Low Preset 1280x720
189.6 [X] AMD Ryzen 9 7950X 4.5GHz
NVIDIA GeForce RTX 4070
min:
16.9 fps, P0.1:
79 fps, P1:
139.1 fps, max:
245 fps
Ultra DLSS Quality 3840x2160
49.9 [X] AMD Ryzen 9 7950X 4.5GHz
NVIDIA GeForce RTX 4070
min:
38.9 fps, P0.1:
42.9 fps, P1:
44.1 fps, max:
63.2 fps
...
...
...
...
...
...
...
...
0 100 200 300 400 500 600 700 800 900 1000 1100 1200 1300 1400 1500 1600 1700 1800 1900 2000 2100 2200 2300 2400 2500 2600 2700 2800 2900 3000 3100 3200 3300 3400 3500 3600 3700 3800 3900 4000 4100 4200 4300 4400 4500 4600 4700 4800 4900 5000 5100 5200 5300 5400 5500 Tooltip
...
...
...
...
» With all tested laptops playable in detail settings ultra.
Additional Benchmarks
Low Preset 1280x720
345 [X] AMD Ryzen 9 7950X 4.5GHz
NVIDIA GeForce RTX 4070
min:
23.6 fps, P0.1:
122 fps, P1:
243 fps, max:
581 fps
...
...
...
...
...
...
...
...
...
...
...
...
» With all tested laptops playable in detail settings ultra.
Additional Benchmarks
Ultra Low Preset 16xAF TAA 1280x720
508 [X] AMD Ryzen 9 7950X 4.5GHz
NVIDIA GeForce RTX 4070
min:
367 fps, P1:
316 fps, max:
572 fps
0 100 200 300 400 500 600 Tooltip
...
...
...
0 100 200 300 Tooltip : Ø263 (242.55-328.8)
Gaming GeForce RTX 4070 AMP Airo: Ø268 (206.83-358)
...
0 100 200 300 Tooltip : Ø253 (235.01-272.3)
Gaming GeForce RTX 4070 AMP Airo: Ø262 (213.49-301.32)
...
...
0 100 200 Tooltip Gaming GeForce RTX 4070 AMP Airo: Ø171.4 (144.69-288.7)
: Ø171.9 (159.418-259)
...
...
0 100 200 Tooltip Gaming GeForce RTX 4070 AMP Airo: Ø78.1 (69.013-106.4)
: Ø85.5 (73.524-228.2)
...
...
» With all tested laptops playable in detail settings ultra.
Additional Benchmarks
Lowest Settings 1280x720
272 [X] AMD Ryzen 9 7950X 4.5GHz
NVIDIA GeForce RTX 4070
min:
30.5 fps, P0.1:
105.4 fps, P1:
223 fps, max:
360 fps
Highest Settings + Maximum Ray Tracing 1920x1080
113.3 [X] AMD Ryzen 9 7950X 4.5GHz
NVIDIA GeForce RTX 4070
min:
41.1 fps, P0.1:
59 fps, P1:
70.4 fps, max:
212 fps
...
...
...
...
...
...
...
...
...
...
...
...
» With all tested laptops playable in detail settings ultra.
Additional Benchmarks
Lowest Preset (DX12) 1280x720
441 [X] AMD Ryzen 9 7950X 4.5GHz
NVIDIA GeForce RTX 4070
...
...
...
...
...
...
...
...
...
...
...
» With all tested laptops playable in detail settings ultra.
Additional Benchmarks
Low Preset 1280x720
231.9 [X] AMD Ryzen 9 7950X 4.5GHz
NVIDIA GeForce RTX 4070
Ray Tracing Ultra Preset (DLSS off) 1920x1080
63.1 [X] AMD Ryzen 9 7950X 4.5GHz
NVIDIA GeForce RTX 4070
Ray Tracing Ultra Preset (DLSS off) 3840x2160
17.9 [X] AMD Ryzen 9 7950X 4.5GHz
NVIDIA GeForce RTX 4070
...
...
...
...
...
...
...
...
...
» With all tested laptops playable in detail settings ultra.
Additional Benchmarks
Low Preset 1280x720
288 [X] AMD Ryzen 9 7950X 4.5GHz
NVIDIA GeForce RTX 4070
min:
91.6 fps, max:
458 fps
0 100 200 300 400 500 600 700 800 900 Tooltip Gaming GeForce RTX 4070 AMP Airo: Ø179.8 (128.767-981)
...
...
0 100 Tooltip Gaming GeForce RTX 4070 AMP Airo: Ø94.6 (89.126-103.726)
...
...
0 Tooltip Gaming GeForce RTX 4070 AMP Airo: Ø48.6 (44.406-68.2)
...
...
» With all tested laptops playable in detail settings high.
Additional Benchmarks
High Quality Raytracing 1920x1080
...
0 100 200 300 400 500 600 700 800 900 1000 1100 1200 1300 1400 1500 1600 1700 1800 1900 2000 2100 2200 2300 2400 2500 2600 2700 2800 2900 3000 3100 3200 3300 3400 3500 3600 3700 3800 3900 4000 4100 4200 4300 4400 4500 4600 4700 4800 Tooltip
...
...
...
...
...
...
...
...
0 100 200 300 400 500 600 Tooltip
...
...
» With all tested laptops playable in detail settings ultra.
Additional Benchmarks
Low Preset 1280x720
268 [X] AMD Ryzen 9 7950X 4.5GHz
NVIDIA GeForce RTX 4070
min:
90.5 fps, P0.1:
121.4 fps, P1:
171.2 fps, max:
517 fps
...
...
...
...
...
...
...
...
...
...
...
...
» With all tested laptops playable in detail settings ultra.
Additional Benchmarks
Low Preset 1920x1080
221 [X] AMD Ryzen 9 7950X 4.5GHz
NVIDIA GeForce RTX 4070
Ultra Preset + Ultra Ray-Tracing 1920x1080
131 [X] AMD Ryzen 9 7950X 4.5GHz
NVIDIA GeForce RTX 4070
...
...
...
...
...
...
...
...
...
» With all tested laptops playable in detail settings ultra.
Additional Benchmarks
Low Graphics Quality 1920x1080
218 [X] AMD Ryzen 9 7950X 4.5GHz
NVIDIA GeForce RTX 4070
min:
175 fps, max:
272 fps
Ultra Graphics Quality + HD Textures + DXR TAA 1920x1080
132 [X] AMD Ryzen 9 7950X 4.5GHz
NVIDIA GeForce RTX 4070
min:
110 fps, max:
169 fps
...
...
...
...
...
...
...
...
...
...
» With all tested laptops playable in detail settings ultra.
0 100 200 Tooltip Gaming GeForce RTX 4070 AMP Airo: Ø166.2 (25-233)
...
...
0 100 Tooltip Gaming GeForce RTX 4070 AMP Airo: Ø125.4 (24-183)
...
0 100 Tooltip Gaming GeForce RTX 4070 AMP Airo: Ø93.5 (22-145)
...
...
0 100 Tooltip Gaming GeForce RTX 4070 AMP Airo: Ø52.6 (0-153)
...
...
» With all tested laptops playable in detail settings ultra.
Additional Benchmarks
Ultra Preset + Ultra Ray Tracing (DX12) 1920x1080
0 100 200 Tooltip Gaming GeForce RTX 4070 AMP Airo: Ø210 (187.299-240.6)
...
...
0 100 200 Tooltip Gaming GeForce RTX 4070 AMP Airo: Ø147.7 (132.15-256.3)
...
...
0 Tooltip Gaming GeForce RTX 4070 AMP Airo: Ø75.9 (69.602-99.6)
...
...
» With all tested laptops playable in detail settings high.
...
...
...
...
...
...
...
...
...
...
...
» With all tested laptops playable in detail settings ultra.
...
...
...
...
...
...
...
...
...
...
...
» With all tested laptops playable in detail settings ultra.
Additional Benchmarks
Very Low Overall Quality (DX11) 1920x1080
253 [X] AMD Ryzen 9 7950X 4.5GHz
NVIDIA GeForce RTX 4070
...
...
...
...
0 100 200 Tooltip Gaming GeForce RTX 4070 AMP Airo: Ø160.9 (143.41-186.4)
: Ø164 (143.292-213.8)
...
...
0 100 200 Tooltip : Ø109.6 (92.029-232.8)
Gaming GeForce RTX 4070 AMP Airo: Ø106 (93.06-163.3)
...
...
0 100 200 Tooltip : Ø59.7 (44.068-245.9)
Gaming GeForce RTX 4070 AMP Airo: Ø55.9 (45.773-156.4)
...
...
» With all tested laptops playable in detail settings high.
Additional Benchmarks
High Quality Preset & High Ray Tracing Preset (DX12) 1920x1080
102 [X] AMD Ryzen 9 7950X 4.5GHz
NVIDIA GeForce RTX 4070
min:
17.8 fps, P0.1:
80 fps, P1:
85.2 fps, max:
186.7 fps
High Quality Preset & High Ray Tracing Preset (DX12) 3840x2160
30.8 [X] AMD Ryzen 9 7950X 4.5GHz
NVIDIA GeForce RTX 4070
min:
9.56 fps, P0.1:
10.9 fps, P1:
28.2 fps, max:
146.4 fps
...
Intel Arc A580
...
...
...
...
...
...
» With all tested laptops playable in detail settings ultra.
...
...
...
...
...
...
...
...
...
...
...
» With all tested laptops playable in detail settings ultra.
Additional Benchmarks
Ultra Quality DXR 16xAF 1920x1080
109.4 [X] AMD Ryzen 9 7950X 4.5GHz
NVIDIA GeForce RTX 4070
min:
61.5 fps, max:
162.87 fps
...
...
...
...
...
...
...
...
...
» With all tested laptops playable in detail settings ultra.
Additional Benchmarks
Lowest Preset 1920x1080
337 [X] AMD Ryzen 9 7950X 4.5GHz
NVIDIA GeForce RTX 4070
max:
491.9 fps
...
Intel Arc A580
...
...
...
...
...
...
...
...
...
...
» With all tested laptops playable in detail settings ultra.
...
...
...
...
...
...
...
» With all tested laptops playable in detail settings ultra.
Additional Benchmarks
Low Preset TAA 1920x1080
236 [X] AMD Ryzen 9 7950X 4.5GHz
NVIDIA GeForce RTX 4070
min:
169 fps, max:
318 fps
...
...
...
...
» With all tested laptops playable in detail settings high.
...
...
...
...
...
...
...
...
...
...
» With all tested laptops playable in detail settings high.
...
...
...
...
...
...
...
...
...
» With all tested laptops playable in detail settings ultra.
...
...
...
0 100 200 300 Tooltip Gaming GeForce RTX 4070 AMP Airo: Ø350 (298-386)
...
...
0 100 Tooltip Gaming GeForce RTX 4070 AMP Airo: Ø164.8 (160-168)
...
...
0 100 Tooltip Gaming GeForce RTX 4070 AMP Airo: Ø116.9 (102-129)
...
...
» With all tested laptops playable in detail settings ultra.
Additional Benchmarks
Ultra Graphics & Postprocessing (HBAO+) 3840x2160
75.2 [X] AMD Ryzen 9 7950X 4.5GHz
NVIDIA GeForce RTX 4070
Medium Graphics & Postprocessing 1920x1080
420.1 [X] AMD Ryzen 9 7950X 4.5GHz
NVIDIA GeForce RTX 4070
...
...
Intel Arc A580
...
...
...
...
...
...
...
» With all tested laptops playable in detail settings ultra.
Additional Benchmarks
Highest Settings possible 16xAF 4xMSAA + FXAA 3840x2160
59.9 [X] AMD Ryzen 9 7950X 4.5GHz
NVIDIA GeForce RTX 4070
min:
4.14 fps, P1:
40 fps, max:
214 fps
Normal/Off 4xAF 1920x1080
187.8 [X] AMD Ryzen 9 7950X 4.5GHz
NVIDIA GeForce RTX 4070
min:
2.92 fps, P1:
200 fps, max:
664 fps
Lowest Settings possible 1920x1080
187.8 [X] AMD Ryzen 9 7950X 4.5GHz
NVIDIA GeForce RTX 4070
min:
4.6 fps, P1:
200 fps, max:
644 fps
low med. high ultra QHD 4K F1 23 438 415 302 105 66 32 Diablo 4 397 378 338 285 192.7 97.2 Star Wars Jedi Survivor 127.7 130.2 121.2 106.7 69.6 34.3 Dead Island 2 326 319 275 249 168 79.5 The Last of Us 164.7 138.7 122.7 108.8 72.5 35.2 Resident Evil 4 Remake 252 190 175.9 127.8 94.9 52.8 Company of Heroes 3 333.9 297.1 227.4 226.6 170.3 97.5 Sons of the Forest 133 126.3 122.5 120.1 99.9 59.7 Atomic Heart 320 250 148.3 144.8 109.4 62.4 Returnal 159 156 141 121 90 53 Hogwarts Legacy 163.9 148.4 131 112.8 84.2 41.9 Dead Space Remake 167.7 159.2 139.5 136.7 89.4 44.8 The Witcher 3 v4.00 263 257 184 157 108 56 High On Life 406 267 213 169.7 106.3 45.7 The Callisto Protocol 228.3 189.3 183 122 90 52 Spider-Man Miles Morales 184.8 176.4 166.3 160.3 124.2 70.8 Call of Duty Modern Warfare 2 2022 149 143 103 62 Uncharted Legacy of Thieves Collection 135.4 132.7 126 122 94 55 A Plague Tale Requiem 179.6 147.3 111.6 85.9 61 34.6 The Quarry 277 204 167 132.8 90.9 32.5 F1 22 389 379 303 113 73 37 Ghostwire Tokyo 272 260 262 257 166 76 Tiny Tina's Wonderlands 363 293 196 153.9 106.9 56.4 Cyberpunk 2077 1.6 215.8 173.8 143 128 81 36 GRID Legends 286 263 236 207 166.8 110.2 Dying Light 2 135.2 92.7 45.8 God of War 233 192.3 151.8 105.6 92.6 63.1 Guardians of the Galaxy 219 223 222 218 172 92 Far Cry 6 227 195.7 181 170 134 74 F1 2021 627 543 428 222 162 90 Watch Dogs Legion 163.7 124.4 93.3 49.5 Mafia Definitive Edition 207 141.1 72.3 F1 2020 529 470 418 293 222 129.6 Borderlands 3 251 228 186 155 111 59 Control 240 220 160 102 50 Far Cry New Dawn 198 174 168 152 143 96 Metro Exodus 296 212 162 130 104 65 Shadow of the Tomb Raider 339 274 258 238 162 84 Strange Brigade 654 482 376 322 222 121 Far Cry 5 241 210 204 189 171 93 X-Plane 11.11 234 202 156 130 Final Fantasy XV Benchmark 236 233 179 134 74 Dota 2 Reborn 289 261 249 234 205 The Witcher 3 781.2 569 351 170 115 GTA V 188 188 187 161 137 146 < 30 fps < 60 fps < 120 fps ≥ 120 fps 41 41 1 44 7 33 25 17 21 19 5
For more games that might be playable and a list of all games and graphics cards visit our Gaming List
v1.26
log 08. 15:00:47
#0 no ids found in url (should be separated by "_") +0s ... 0s
#1 not redirecting to Ajax server +0s ... 0s
#2 did not recreate cache, as it is less than 5 days old! Created at Tue, 07 May 2024 05:40:33 +0200 +0.001s ... 0.001s
#3 composed specs +0.079s ... 0.08s
#4 did output specs +0s ... 0.08s
#5 start showIntegratedCPUs +0s ... 0.08s
#6 getting avg benchmarks for device 11582 +0.047s ... 0.127s
#7 got single benchmarks 11582 +0.017s ... 0.144s
#8 got avg benchmarks for devices +0s ... 0.144s
#9 min, max, avg, median took s +1.043s ... 1.187s
#10 before gaming benchmark output +0s ... 1.187s
#11 Got 339 rows for game benchmarks. +0.099s ... 1.286s
#12 composed SQL query for gamebenchmarks +0s ... 1.286s
#13 got data and put it in $dataArray +0.037s ... 1.324s
#14 benchmarks composed for output. +2.789s ... 4.113s
#15 return log +0.077s ... 4.19s
Please share our article, every link counts!
» Comparison of GPUs Detailed list of all laptop GPUs sorted by class and performance.
» Benchmark List Sort and restrict laptop GPUs based on performance in synthetic benchmarks.
» Notebook Gaming List Playable games for each graphics card and their average FPS results.
Class 1 Arc A580
Class 2 Arc A380
Class 3 UHD Graphics 32EUs
UHD Graphics 750
Class 4 * Approximate position of the graphics adapter
Working For Notebookcheck
Are you a techie who knows how to translate? Then join our Team!
Details here
Top 10 Laptops Multimedia , Budget Multimedia , Gaming , Budget Gaming , Lightweight Gaming , Business , Budget Office , Workstation , Subnotebooks , Ultrabooks , Chromebooks
under 300 USD/Euros , under 500 USD/Euros , 1,000 USD/Euros , for University Students , Best Displays
Top 10 Smartphones Smartphones , Phablets , ≤6-inch , Camera Smartphones
Klaus Hinum (Update: 2023-08-19)