Intel UHD Graphics Xe G4 48EUs vs Intel UHD Graphics 64EUs (Alder Lake 12th Gen) vs Intel Iris Xe Graphics G7 80EUs
Intel UHD Graphics Xe G4 48EUs ► remove from comparison
The Intel UHD Graphics Xe Graphics G4 (Tiger-Lake U GPU with 48 EUs) is a integrated graphics card in the low end Tiger-Lake U CPUs (15 Watt, e.g. Core i3 11th Gen). It is using the new Xe architecture (Gen12) and should be announced later in 2020.
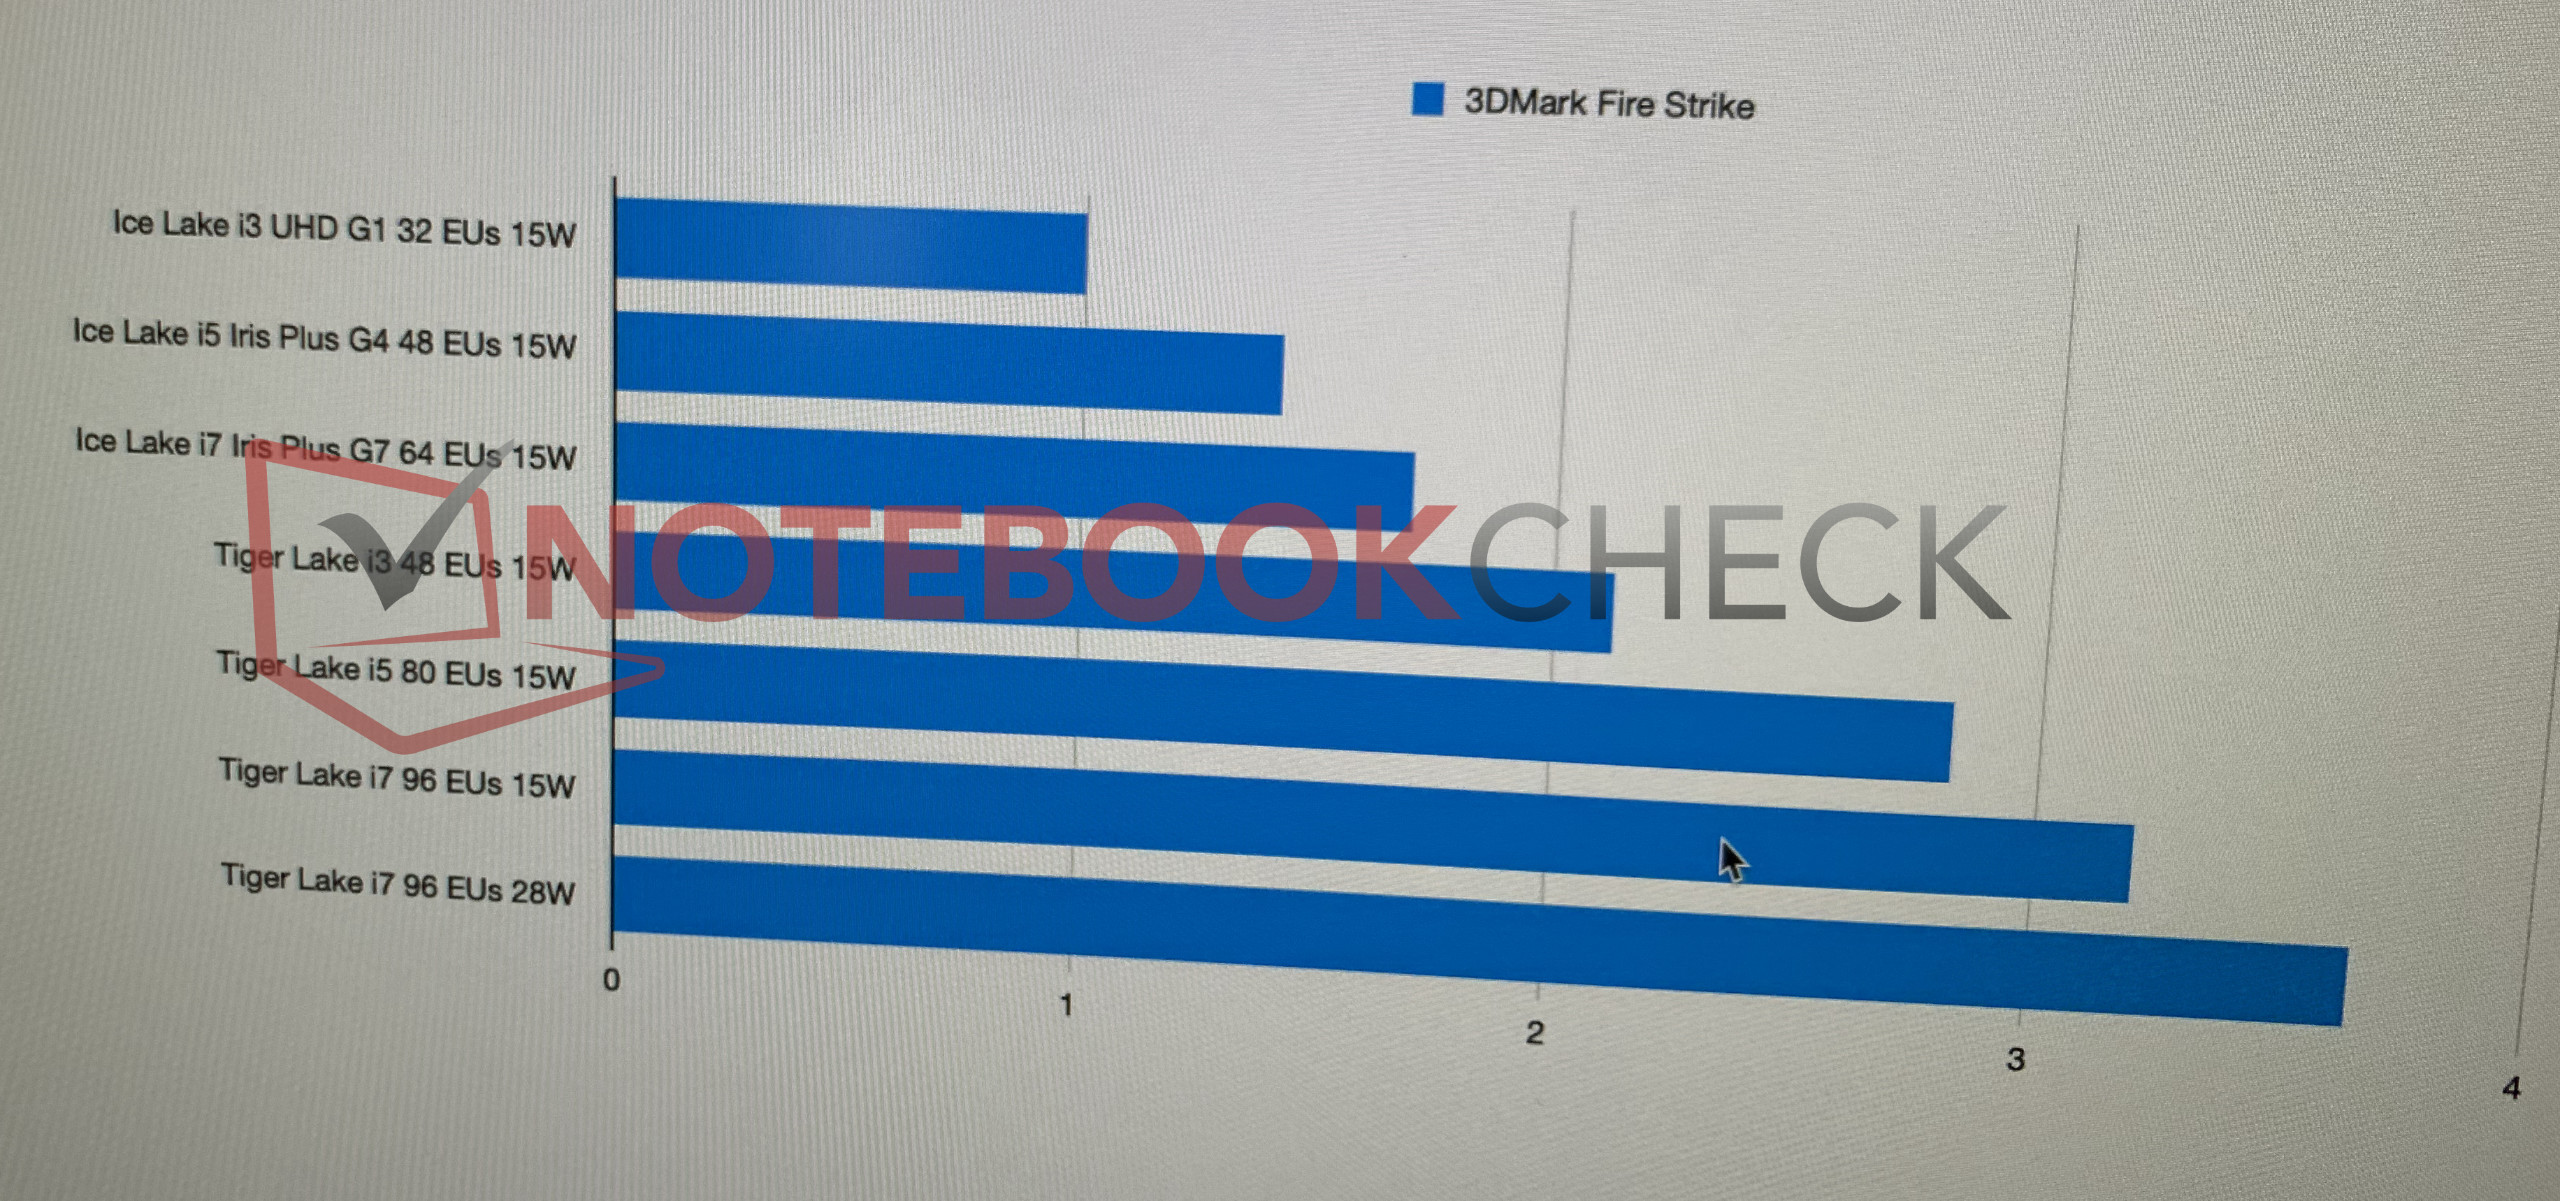
The performance depends on the TDP settings of the laptop and the used cooling. First informations show that the chip can be configured at 15 and 28 Watt TDP default (as the Ice Lake-U chips) and the performance should be around a dedicated GeForce MX230 in 3DMark benchmarks. For gaming we are expecting a bit worse performance due to the missing dedicated graphics memory and driver support. Compared to the fastest Ice Lake iGPU (Iris Plus G7) , the 48 EU version in an i3 should be slightly faster. Therefore, the iGPU is still only for lowest graphical settings and low resolutions in demanding games.
The Tiger Lake SoCs and therefore the integrated GPU are manufactured in the modern 10nm+ process (improved 10nm process) at Intel and therefore should offer a very good efficiency.
Intel UHD Graphics 64EUs (Alder Lake 12th Gen) ► remove from comparison
The Intel UHD Graphics 80EUs (12th Gen Alder Lake GPU, Xe Architecture with 80 EUs) is an integrated graphics card in the mid range Alder-Lake CPUs. It is using the new Xe architecture (Gen12) and was introduced with the Alder Lake-H series. In theoretical benchmarks the GPU is on par with the Radeon RX Vega 8 (iGPU of Ryzen 4000 CPUs) but in games the performance is a bit worse due to less optimized drivers (in 2022). E.g. in our tests only low demanding games like GRID Legends were playable in low settings.
The SoC is manufactured in an improved 10nm process (called Intel 7).
Intel Iris Xe Graphics G7 80EUs ► remove from comparison
The Intel Xe Graphics G7 80EUs (Tiger-Lake U GPU with 80 EUs) is a integrated graphics card in the mid range Tiger-Lake U CPUs (15 - 28 Watt, e.g. Core i5 11th Gen CPUs). It is using the new Xe architecture (Gen12) and should be announced later in 2020.
The performance depends on the TDP settings of the laptop and the used cooling. First informations show that the chip can be configured at 15 and 28 Watt TDP default (as the Ice Lake-U chips) and the performance should be around a dedicated GeForce MX330 in 3DMark benchmarks. For gaming we are expecting a bit worse performance due to the missing dedicated graphics memory and driver support. Compared to the older Iris Plus G4 in Ice Lake chips, the Tiger Lake GPU should be nearly twice as fast. Benchmarks with various laptops show that the 80EU version lacks about 18% behind the faster 96EU version and on par with the MX330. Compared to AMD iGPUs, the G7 80EU positions itself around the Vega 7 and Vega 8 chips (see chart below for details).
Therefore, the iGPU is still only for lowest graphical settings and low resolutions in demanding games. Some modern games like Days Gone or Cyberpunk wont run over 30 fps in minimum settings (see below).
The Tiger Lake SoCs and therefore the integrated GPU are manufactured in the modern 10nm+ (10nm Superfin) process (improved 10nm process) at Intel and therefore should offer a very good efficiency.
Intel UHD Graphics Xe G4 48EUs Intel UHD Graphics 64EUs (Alder Lake 12th Gen) Intel Iris Xe Graphics G7 80EUs Gen. 12 / Xe Series Codename Tiger Lake Xe Alder Lake Xe Tiger Lake Xe Architecture Gen. 11 Ice Lake Gen. 12 Gen. 11 Ice Lake Pipelines 48 - unified 64 - unified 80 - unified Core Speed 350 - 1450 (Boost) MHz 1400 (Boost) MHz 400 - 1350 (Boost) MHz Shared Memory yes yes yes API DirectX 12_1, OpenGL 4.6 DirectX 12_1, OpenGL 4.6 DirectX 12_1, OpenGL 4.6 Power Consumption 28 Watt 28 Watt technology 10 nm 10 nm 10 nm Features QuickSync QuickSync QuickSync Date of Announcement 15.08.2020 04.01.2022 15.08.2020
CPU in UHD Graphics Xe G4 48EUs GPU Base Speed GPU Boost / Turbo Intel Core i5-13420H 8 x 1500 MHz, 45 W ? MHz 1400 MHz Intel Core i5-12450H 8 x 1500 MHz, 45 W ? MHz 1200 MHz Intel Core i3-1125G4 4 x 2000 MHz, 28 W 400 MHz 1250 MHz » show 11 more Intel Processor U300 5 x 900 MHz, 15 W ? MHz 1100 MHz Intel Pentium 8505 5 x 900 MHz, 15 W ? MHz 1100 MHz Intel Pentium 8500 5 x 700 MHz, 9 W ? MHz 800 MHz Intel Core i3-1115G4 2 x 3000 MHz, 28 W 400 MHz 1250 MHz Intel Core i3-1120G4 4 x 1500 MHz, 15 W 400 MHz 1100 MHz Intel Core i3-1110G4 2 x 2500 MHz, 15 W 400 MHz 1100 MHz Intel Celeron 7305 5 x 900 MHz, 15 W ? MHz 1100 MHz Intel Celeron 7300 5 x 700 MHz, 9 W ? MHz 800 MHz Intel Celeron 6305 2 x 1800 MHz, 15 W 400 MHz 1250 MHz Intel Celeron 6205 2 x ? MHz, 15 W 400 MHz ? MHz Intel Pentium Gold 7505 2 x 2000 MHz, 15 W 400 MHz 1250 MHz min. - max. 400 MHz 1250 - 1400 MHz
CPU in UHD Graphics 64EUs GPU Base Speed GPU Boost / Turbo Intel Core i7-13620H 10 x 1800 MHz, 45 W ? MHz 1500 MHz Intel Core i7-12650H 10 x 1700 MHz, 45 W ? MHz 1400 MHz Intel Core i3-1220P 10 x 1100 MHz, 28 W ? MHz 1100 MHz » show 5 more Intel Core 3 100U 6 x 900 MHz, 15 W ? MHz 1250 MHz Intel Core i3-1315U 6 x 900 MHz, 15 W ? MHz 1250 MHz Intel Core i3-1215U 6 x 900 MHz, 15 W ? MHz 1100 MHz Intel Core i3-1305U 5 x 1200 MHz, 15 W ? MHz 1250 MHz Intel Core i3-1210U 6 x 700 MHz, 9 W ? MHz 850 MHz min. - max. ? - 400 MHz 850 - 1500 MHz
CPU in Iris Xe G7 80EUs GPU Base Speed GPU Boost / Turbo Intel Core i5-12600H 12 x 2000 MHz, 45 W ? MHz 1400 MHz Intel Core i5-13600H 12 x 2100 MHz, 45 W ? MHz 1500 MHz Intel Core i5-13505H 12 x 1900 MHz, 45 W ? MHz 1450 MHz » show 20 more Intel Core i5-13500H 12 x 1900 MHz, 45 W ? MHz 1450 MHz Intel Core i5-12500H 12 x 1800 MHz, 45 W ? MHz 1300 MHz Intel Core 5 120U 10 x 900 MHz, 15 W ? MHz 1250 MHz Intel Core i5-1350P 12 x 1400 MHz, 28 W ? MHz 1500 MHz Intel Core i5-1340P 12 x 1400 MHz, 28 W ? MHz 1450 MHz Intel Core i5-1250P 12 x 1200 MHz, 28 W ? MHz 1400 MHz Intel Core i5-1240P 12 x 1200 MHz, 28 W ? MHz 1300 MHz Intel Core i5-1345U 10 x 1200 MHz, 15 W ? MHz 1250 MHz Intel Core i5-1245U 10 x 1200 MHz, 15 W ? MHz 1200 MHz Intel Core i5-1335U 10 x 900 MHz, 15 W ? MHz 1250 MHz Intel Core i5-1334U 10 x 900 MHz, 15 W ? MHz 1250 MHz Intel Core i5-1155G7 4 x 2500 MHz, 28 W 400 MHz 1350 MHz Intel Core i5-1235U 10 x 900 MHz, 15 W ? MHz 1200 MHz Intel Core i5-11300H 4 x 3100 MHz, 35 W 400 MHz 1300 MHz Intel Core i5-1240U 10 x 800 MHz, 9 W ? MHz 900 MHz Intel Core i5-1230U 10 x 700 MHz, 9 W ? MHz 850 MHz Intel Core i5-1145G7 4 x 2600 MHz, 28 W 400 MHz 1300 MHz Intel Core i5-1135G7 4 x 2400 MHz, 28 W 400 MHz 1300 MHz Intel Core i5-1140G7 4 x 1800 MHz, 15 W 400 MHz 1100 MHz Intel Core i5-1130G7 4 x 1800 MHz, 15 W 400 MHz 1100 MHz min. - max. 400 MHz 850 - 1500 MHz
Benchmarks Performance Rating - 3DMark 11 + Fire Strike + Time Spy - UHD Graphics Xe G4 48EUs
1.1 pt (3%)
...
Intel UHD Graphics Xe G4 48EUs
...
max:
Performance Rating - 3DMark 11 + Fire Strike + Time Spy - UHD Graphics 64EUs
1.8 pt (5%)
...
Intel UHD Graphics 64EUs (Alder Lake 12th Gen)
...
max:
Performance Rating - 3DMark 11 + Fire Strike + Time Spy - Iris Xe G7 80EUs
1.8 pt (5%)
...
Intel Iris Xe Graphics G7 80EUs
...
max:
3DMark - 3DMark Time Spy Score
min: 715 avg: 855 median: 888 (3%) max: 1018 Points
min: 935 avg: 1206 median: 1243 (4%) max: 1537 Points
GPU TDP ? TDP 52 W 69% 100%
min: 630 avg: 1314 median: 1333.5 (4%) max: 1731 Points
GPU TDP ? TDP 11 W TDP 28 W TDP 52 W 85% 100% 100% 99%
3DMark - 3DMark Time Spy Graphics
min: 634 avg: 763 median: 798 (2%) max: 913 Points
min: 830 avg: 1056 median: 1106 (3%) max: 1336 Points
GPU TDP ? TDP 52 W 70% 100%
min: 561 avg: 1170 median: 1180 (3%) max: 1511 Points
GPU TDP ? TDP 11 W TDP 28 W TDP 52 W 83% 98% 100% 95%
3DMark - 3DMark Ice Storm Unlimited Graphics
min: 73098 avg: 97350 median: 97415.5 (11%) max: 121471 Points
min: 192047 avg: 233684 median: 209544 (24%) max: 279392 Points
min: 79355 avg: 167735 median: 166479 (19%) max: 321464 Points
3DMark - 3DMark Ice Storm Extreme Graphics
min: 41710 avg: 47311 median: 45259 (6%) max: 54963 Points
min: 44105 avg: 77363 median: 82608 (11%) max: 92077 Points
min: 27687 avg: 56325 median: 62965 (8%) max: 96826 Points
3DMark - 3DMark Cloud Gate Score
min: 4925 avg: 9868 median: 9422 (10%) max: 17770 Points
min: 15139 avg: 18914 median: 18265 (20%) max: 24767 Points
min: 5327 avg: 16450 median: 16480.5 (18%) max: 25911 Points
GPU TDP ? TDP 11 W 85% 100%
3DMark - 3DMark Cloud Gate Graphics
min: 11270 avg: 15421 median: 15992 (4%) max: 21778 Points
min: 19949 avg: 21951 median: 21383 (6%) max: 27185 Points
min: 6361 avg: 21769 median: 21817.5 (6%) max: 30894 Points
GPU TDP ? TDP 11 W 68% 100%
3DMark - 3DMark Fire Strike Standard Score
min: 1362 avg: 2029 median: 1962 (3%) max: 2928 Points
min: 2275 avg: 3387 median: 3494 (6%) max: 4318 Points
GPU TDP ? TDP 52 W 61% 100%
min: 1177 avg: 3421 median: 3649 (6%) max: 4962 Points
GPU TDP ? TDP 11 W TDP 28 W TDP 52 W 76% 99% 95% 100%
3DMark - 3DMark Fire Strike Standard Graphics
min: 1602 avg: 2282 median: 2321 (3%) max: 3131 Points
min: 2592 avg: 3635 median: 3891 (4%) max: 4567 Points
GPU TDP ? TDP 52 W 63% 100%
min: 1560 avg: 3782 median: 4010 (5%) max: 5305 Points
GPU TDP ? TDP 11 W TDP 28 W TDP 52 W 77% 100% 100% 97%
3DMark - 3DMark Ice Storm Graphics
min: 48107 avg: 62475 median: 63020 (8%) max: 76298 Points
min: 59484 avg: 109652 median: 119715 (14%) max: 128009 Points
min: 25199 avg: 83387 median: 87210 (10%) max: 142022 Points
3DMark - 3DMark Sling Shot Extreme (ES 3.1) Unlimited
9566 Points (48%)
3DMark - 3DMark Sling Shot Extreme (ES 3.1) Unlimited Graphics
12146 Points (36%)
3DMark - 3DMark Wild Life Unlimited
min: 5698 avg: 6584 median: 6396 (3%) max: 7659 Points
10921 Points (6%)
min: 5244 avg: 8354 median: 8807 (4%) max: 11404 Points
3DMark - 3DMark Wild Life Extreme Unlimited
min: 1593 avg: 1781 median: 1730 (2%) max: 2072 Points
min: 1719 avg: 2343 median: 2342.5 (3%) max: 2966 Points
min: 1257 avg: 2430 median: 2589 (3%) max: 3190 Points
3DMark - 3DMark Night Raid
min: 5276 avg: 7762 median: 7848.5 (7%) max: 10585 Points
17836 Points (17%)
min: 7611 avg: 12905 median: 12908 (12%) max: 17012 Points
3DMark - 3DMark Night Raid Graphics Score
min: 7908 avg: 10360 median: 10838 (4%) max: 13151 Points
18555 Points (7%)
min: 7524 avg: 14684 median: 15172 (6%) max: 19656 Points
3DMark 11 - 3DM11 Performance Score
min: 1991 avg: 3356 median: 3508 (5%) max: 4418 Points
min: 4116 avg: 5210 median: 5324 (7%) max: 6259 Points
GPU TDP ? TDP 52 W 67% 100%
min: 2254 avg: 5448 median: 5598 (8%) max: 7227 Points
GPU TDP ? TDP 11 W TDP 28 W TDP 52 W 81% 98% 100% 97%
3DMark 11 - 3DM11 Performance GPU
min: 2156 avg: 3288 median: 3510 (3%) max: 3906 Points
min: 3886 avg: 4678 median: 5030 (4%) max: 5566 Points
GPU TDP ? TDP 52 W 70% 100%
min: 2246 avg: 5167 median: 5332 (5%) max: 6477 Points
GPU TDP ? TDP 11 W TDP 28 W TDP 52 W 83% 99% 100% 93%
3DMark Vantage + Intel UHD Graphics Xe G4 48EUs 3DMark Vantage - 3DM Vant. Perf. total
10650 Points (3%)
3DM Vant. Perf. total + Intel UHD Graphics 64EUs (Alder Lake 12th Gen)
min: 15454 avg: 18595 median: 18748.5 (5%) max: 22757 Points
3DM Vant. Perf. total + Intel Iris Xe Graphics G7 80EUs
min: 20679 avg: 23021 median: 21729 (6%) max: 26656 Points
3DM Vant. Perf. GPU no PhysX + Intel UHD Graphics Xe G4 48EUs 3DMark Vantage - 3DM Vant. Perf. GPU no PhysX
9484 Points (5%)
3DM Vant. Perf. GPU no PhysX + Intel UHD Graphics 64EUs (Alder Lake 12th Gen)
min: 12674 avg: 15409 median: 16126 (9%) max: 18466 Points
3DM Vant. Perf. GPU no PhysX + Intel Iris Xe Graphics G7 80EUs
min: 18551 avg: 19797 median: 18628 (11%) max: 22211 Points
3DMark 05 - 3DMark 05 - Standard
min: 26272 avg: 35662 median: 36705 (40%) max: 41013 Points
min: 34227 avg: 39066 median: 37064 (41%) max: 45907 Points
3DMark 06 3DMark 06 - Standard 1280x1024 + Intel UHD Graphics Xe G4 48EUs
min: 10519 avg: 10780 median: 10779.5 (14%) max: 11040 Points
3DMark 06 - Standard 1280x1024 + Intel UHD Graphics 64EUs (Alder Lake 12th Gen)
min: 22825 avg: 26660 median: 25362 (33%) max: 33042 Points
3DMark 06 - Standard 1280x1024 + Intel Iris Xe Graphics G7 80EUs
min: 15617 avg: 25404 median: 25691 (34%) max: 34471 Points
Unigine Valley 1.0 - Unigine Valley 1.0 DX
min: 10 avg: 11.2 median: 11.7 (4%) max: 12.8 fps
min: 14.6 avg: 16 median: 16 (5%) max: 17.4 fps
Unigine Heaven 3.0 - Unigine Heaven 3.0 DX 11
43.8 fps (14%)
Unigine Heaven 3.0 - Unigine Heaven 3.0 OpenGL
57.3 fps (25%)
Unigine Heaven 2.1 - Heaven 2.1 high
63.2 fps (12%)
SPECviewperf 12 + Intel UHD Graphics 64EUs (Alder Lake 12th Gen) SPECviewperf 12 - specvp12 sw-03
min: 38.3 avg: 40.7 median: 38.9 (10%) max: 44.5 fps
specvp12 sw-03 + Intel Iris Xe Graphics G7 80EUs
46.1 fps (11%)
specvp12 snx-02 + Intel UHD Graphics 64EUs (Alder Lake 12th Gen) SPECviewperf 12 - specvp12 snx-02
min: 2.81 avg: 3.4 median: 3.4 (1%) max: 3.89 fps
specvp12 snx-02 + Intel Iris Xe Graphics G7 80EUs
3.8 fps (1%)
specvp12 showcase-01 + Intel UHD Graphics 64EUs (Alder Lake 12th Gen) SPECviewperf 12 - specvp12 showcase-01
min: 13.1 avg: 14.4 median: 15.1 (3%) max: 15.9 fps
specvp12 showcase-01 + Intel Iris Xe Graphics G7 80EUs
20.4 fps (4%)
specvp12 mediacal-01 + Intel UHD Graphics 64EUs (Alder Lake 12th Gen) SPECviewperf 12 - specvp12 mediacal-01
min: 4.98 avg: 7 median: 8.3 (2%) max: 9.12 fps
specvp12 mediacal-01 + Intel Iris Xe Graphics G7 80EUs
8.4 fps (2%)
specvp12 maya-04 + Intel UHD Graphics 64EUs (Alder Lake 12th Gen) SPECviewperf 12 - specvp12 maya-04
min: 22.8 avg: 28.4 median: 31.4 (9%) max: 33.4 fps
specvp12 maya-04 + Intel Iris Xe Graphics G7 80EUs
35.9 fps (10%)
specvp12 energy-01 + Intel UHD Graphics 64EUs (Alder Lake 12th Gen) SPECviewperf 12 - specvp12 energy-01
min: 0.24 avg: 0.5 median: 0.6 (1%) max: 0.78 fps
specvp12 energy-01 + Intel Iris Xe Graphics G7 80EUs 0.4 fps (0%)
specvp12 creo-01 + Intel UHD Graphics 64EUs (Alder Lake 12th Gen) SPECviewperf 12 - specvp12 creo-01
min: 6.44 avg: 17.5 median: 18.4 (7%) max: 21.1 fps
specvp12 creo-01 + Intel Iris Xe Graphics G7 80EUs
23.4 fps (9%)
specvp12 catia-04 + Intel UHD Graphics 64EUs (Alder Lake 12th Gen) SPECviewperf 12 - specvp12 catia-04
min: 22.8 avg: 27.6 median: 29.9 (5%) max: 34.5 fps
specvp12 catia-04 + Intel Iris Xe Graphics G7 80EUs
31 fps (5%)
specvp12 3dsmax-05 + Intel UHD Graphics 64EUs (Alder Lake 12th Gen) SPECviewperf 12 - specvp12 3dsmax-05
min: 29.5 avg: 32.6 median: 34.2 (6%) max: 36.2 fps
specvp12 3dsmax-05 + Intel Iris Xe Graphics G7 80EUs
41.5 fps (7%)
SPECviewperf 13 specvp13 sw-04 + Intel UHD Graphics 64EUs (Alder Lake 12th Gen) SPECviewperf 13 - specvp13 sw-04
min: 46.6 avg: 49.2 median: 47.2 (13%) max: 53.9 fps
specvp13 sw-04 + Intel Iris Xe Graphics G7 80EUs
56 fps (15%)
specvp13 snx-03 + Intel UHD Graphics 64EUs (Alder Lake 12th Gen) SPECviewperf 13 - specvp13 snx-03
min: 5.06 avg: 6 median: 6.1 (1%) max: 6.68 fps
specvp13 snx-03 + Intel Iris Xe Graphics G7 80EUs
6.8 fps (1%)
specvp13 showcase-02 + Intel UHD Graphics 64EUs (Alder Lake 12th Gen) SPECviewperf 13 - specvp13 showcase-02
min: 13.1 avg: 14.3 median: 15 (3%) max: 15.7 fps
specvp13 showcase-02 + Intel Iris Xe Graphics G7 80EUs
20.4 fps (4%)
specvp13 medical-02 + Intel UHD Graphics 64EUs (Alder Lake 12th Gen) SPECviewperf 13 - specvp13 medical-02
min: 4.48 avg: 7.2 median: 8.6 (2%) max: 10.9 fps
specvp13 medical-02 + Intel Iris Xe Graphics G7 80EUs
7.9 fps (2%)
specvp13 maya-05 + Intel UHD Graphics 64EUs (Alder Lake 12th Gen) SPECviewperf 13 - specvp13 maya-05
min: 32.1 avg: 36.8 median: 38.2 (4%) max: 41.3 fps
specvp13 maya-05 + Intel Iris Xe Graphics G7 80EUs
46 fps (5%)
specvp13 energy-02 + Intel UHD Graphics 64EUs (Alder Lake 12th Gen) SPECviewperf 13 - specvp13 energy-02
min: 0.92 avg: 1.9 median: 2.6 (1%) max: 2.82 fps
specvp13 energy-02 + Intel Iris Xe Graphics G7 80EUs
2 fps (1%)
specvp13 creo-02 + Intel UHD Graphics 64EUs (Alder Lake 12th Gen) SPECviewperf 13 - specvp13 creo-02
min: 26.5 avg: 30.3 median: 32.4 (5%) max: 33.1 fps
specvp13 creo-02 + Intel Iris Xe Graphics G7 80EUs
37.1 fps (5%)
specvp13 catia-05 + Intel UHD Graphics 64EUs (Alder Lake 12th Gen) SPECviewperf 13 - specvp13 catia-05
min: 32.7 avg: 39.6 median: 42.8 (5%) max: 49.6 fps
specvp13 catia-05 + Intel Iris Xe Graphics G7 80EUs
44.8 fps (5%)
specvp13 3dsmax-06 + Intel UHD Graphics 64EUs (Alder Lake 12th Gen) SPECviewperf 13 - specvp13 3dsmax-06
min: 29.3 avg: 32.4 median: 34.1 (6%) max: 36 fps
specvp13 3dsmax-06 + Intel Iris Xe Graphics G7 80EUs
41.5 fps (7%)
SPECviewperf 2020 specvp2020 solidworks-05 4k + Intel UHD Graphics 64EUs (Alder Lake 12th Gen) SPECviewperf 2020 - specvp2020 solidworks-05 4k
min: 5.05 avg: 5.1 median: 5.1 (2%) max: 5.1 fps
specvp2020 solidworks-05 4k + Intel Iris Xe Graphics G7 80EUs
7.3 fps (2%)
specvp2020 snx-04 4k + Intel UHD Graphics 64EUs (Alder Lake 12th Gen) SPECviewperf 2020 - specvp2020 snx-04 4k
min: 5.69 avg: 6 median: 5.9 (1%) max: 6.61 fps
specvp2020 snx-04 4k + Intel Iris Xe Graphics G7 80EUs
6.7 fps (1%)
specvp2020 medical-03 4k + Intel UHD Graphics 64EUs (Alder Lake 12th Gen) SPECviewperf 2020 - specvp2020 medical-03 4k
min: 0.78 avg: 1.2 median: 0.8 (1%) max: 2.54 fps
specvp2020 medical-03 4k + Intel Iris Xe Graphics G7 80EUs
1.4 fps (1%)
specvp2020 maya-06 4k + Intel UHD Graphics 64EUs (Alder Lake 12th Gen) SPECviewperf 2020 - specvp2020 maya-06 4k
min: 15.3 avg: 16.8 median: 15.4 (3%) max: 21.2 fps
specvp2020 maya-06 4k + Intel Iris Xe Graphics G7 80EUs
23.6 fps (4%)
specvp2020 energy-03 4k + Intel UHD Graphics 64EUs (Alder Lake 12th Gen) SPECviewperf 2020 - specvp2020 energy-03 4k
min: 0.52 avg: 1 median: 0.8 (0%) max: 1.9 fps
specvp2020 energy-03 4k + Intel Iris Xe Graphics G7 80EUs 1.2 fps (0%)
specvp2020 creo-03 4k + Intel UHD Graphics 64EUs (Alder Lake 12th Gen) SPECviewperf 2020 - specvp2020 creo-03 4k
min: 9.17 avg: 10.2 median: 9.4 (4%) max: 12.7 fps
specvp2020 creo-03 4k + Intel Iris Xe Graphics G7 80EUs
13.6 fps (6%)
specvp2020 catia-06 4k + Intel UHD Graphics 64EUs (Alder Lake 12th Gen) SPECviewperf 2020 - specvp2020 catia-06 4k
min: 5.24 avg: 5.8 median: 5.3 (3%) max: 7.63 fps
specvp2020 catia-06 4k + Intel Iris Xe Graphics G7 80EUs
7.4 fps (5%)
specvp2020 3dsmax-07 4k + Intel UHD Graphics 64EUs (Alder Lake 12th Gen) SPECviewperf 2020 - specvp2020 3dsmax-07 4k
min: 6.95 avg: 7.4 median: 7 (3%) max: 8.65 fps
specvp2020 3dsmax-07 4k + Intel Iris Xe Graphics G7 80EUs
10.1 fps (4%)
Cinebench R10 Cinebench R10 Shading (32bit) + Intel UHD Graphics Xe G4 48EUs Cinebench R10 - Cinebench R10 Shading (32bit)
min: 6630 avg: 9932 median: 10477 (7%) max: 12689 Points
Cinebench R10 Shading (32bit) + Intel UHD Graphics 64EUs (Alder Lake 12th Gen)
min: 14413 avg: 17390 median: 17783 (13%) max: 19969 Points
Cinebench R10 Shading (32bit) + Intel Iris Xe Graphics G7 80EUs
min: 11807 avg: 30027 median: 13741.5 (10%) max: 140763 Points
Cinebench R11.5 Cinebench R11.5 OpenGL 64 Bit + Intel UHD Graphics Xe G4 48EUs Cinebench R11.5 - Cinebench R11.5 OpenGL 64 Bit
min: 28.91 avg: 35.5 median: 35.5 (12%) max: 42.14 fps
Cinebench R11.5 OpenGL 64 Bit + Intel UHD Graphics 64EUs (Alder Lake 12th Gen)
min: 68.25 avg: 83.7 median: 81.5 (28%) max: 95.55 fps
Cinebench R11.5 OpenGL 64 Bit + Intel Iris Xe Graphics G7 80EUs
min: 44.63 avg: 67.2 median: 64.7 (22%) max: 99.01 fps
Cinebench R15 + Intel UHD Graphics Xe G4 48EUs Cinebench R15 - Cinebench R15 OpenGL 64 Bit
min: 45.1 avg: 66.1 median: 63.8 (4%) max: 88.5 fps
Cinebench R15 OpenGL 64 Bit + Intel UHD Graphics 64EUs (Alder Lake 12th Gen)
min: 74.5 avg: 94.5 median: 93.4 (5%) max: 117.3 fps
GPU TDP ? TDP 52 W 72% 100%
Cinebench R15 OpenGL 64 Bit + Intel Iris Xe Graphics G7 80EUs
min: 8.74 avg: 83.5 median: 85.9 (5%) max: 103.44 fps
GPU TDP ? TDP 11 W TDP 28 W TDP 52 W 76% 88% 89% 100%
Cinebench R15 OpenGL Ref. Match 64 Bit + Intel UHD Graphics Xe G4 48EUs Cinebench R15 - Cinebench R15 OpenGL Ref. Match 64 Bit
97.8 % (98%)
Cinebench R15 OpenGL Ref. Match 64 Bit + Intel UHD Graphics 64EUs (Alder Lake 12th Gen)
97.8 % (98%)
GPU TDP ? TDP 52 W 100% 100%
Cinebench R15 OpenGL Ref. Match 64 Bit + Intel Iris Xe Graphics G7 80EUs
97.8 % (98%)
GPU TDP ? TDP 11 W TDP 28 W TDP 52 W 100% 100% 100% 100%
GFXBench - GFXBench 5.0 4K Aztec Ruins High Tier Offscreen
9.6 fps (4%)
17.9 fps (7%)
12 fps (5%)
GFXBench - GFXBench 5.0 Aztec Ruins High Tier Offscreen
24 fps (4%)
42.4 fps (8%)
min: 31 avg: 39.1 median: 38.7 (7%) max: 47.5 fps
GFXBench - GFXBench 5.0 Aztec Ruins Normal Tier Offscreen
65 fps (5%)
118.5 fps (9%)
min: 85 avg: 98.8 median: 91.4 (7%) max: 120.1 fps
GFXBench - GFXBench Car Chase Offscreen
60 fps (7%)
101.4 fps (11%)
min: 79 avg: 85.2 median: 85.2 (10%) max: 91.4 fps
GFXBench 3.1 - GFXBench Manhattan ES 3.1 Offscreen
85 fps (2%)
130.9 fps (3%)
min: 69 avg: 88.8 median: 88.8 (2%) max: 108.6 fps
GFXBench 3.0 - GFXBench 3.0 Manhattan Offscreen
234.9 fps (14%)
min: 148 avg: 159.2 median: 159.2 (9%) max: 170.4 fps
GFXBench (DX / GLBenchmark) 2.7 + Intel UHD Graphics Xe G4 48EUs GFXBench (DX / GLBenchmark) 2.7 - GFXBench T-Rex HD Offscreen C24Z16
210 fps (2%)
GFXBench T-Rex HD Offscreen C24Z16 + Intel UHD Graphics 64EUs (Alder Lake 12th Gen)
320.3 fps (3%)
GFXBench T-Rex HD Offscreen C24Z16 + Intel Iris Xe Graphics G7 80EUs
min: 253 avg: 255 median: 255 (2%) max: 256.9 fps
Basemark GPU 1.2 - Basemark GPU 1.2 Vulkan Official Medium Offscreen 1080
min: 54.3 avg: 89.2 median: 89.2 (1%) max: 124 fps
min: 104.6 avg: 157.9 median: 148 (1%) max: 289 fps
GPU TDP ? TDP 52 W 76% 100%
min: 104.6 avg: 132.7 median: 104.6 (1%) max: 289 fps
GPU TDP ? TDP 52 W 73% 100%
Basemark GPU 1.2 - Basemark GPU 1.2 Vulkan Official High Offscreen 2160
3.6 fps (1%)
min: 3.64 avg: 8.7 median: 9.4 (2%) max: 11.6 fps
GPU TDP ? TDP 52 W 100% 42%
3.6 fps (1%)
GPU TDP ? TDP 52 W 100% 59%
Geekbench 6.2 - Geekbench 6.2 GPU OpenCL
8422 Points (2%)
min: 8359 avg: 10212 median: 11174 (3%) max: 12297 Points
GPU TDP ? TDP 52 W 80% 100%
min: 10269 avg: 11904 median: 12230 (4%) max: 13997 Points
GPU TDP ? TDP 52 W 89% 100%
Geekbench 6.2 - Geekbench 6.2 GPU Vulkan
10448 Points (3%)
min: 10236 avg: 12504 median: 13760 (4%) max: 14850 Points
GPU TDP ? TDP 52 W 81% 100%
min: 12605 avg: 15244 median: 15717 (5%) max: 19099 Points
GPU TDP ? TDP 52 W 93% 100%
LuxMark v2.0 64Bit - LuxMark v2.0 Room GPU
221 Samples/s (1%)
min: 448 avg: 562 median: 558 (3%) max: 743 Samples/s
min: 286 avg: 642 median: 728.5 (3%) max: 824 Samples/s
LuxMark v2.0 64Bit - LuxMark v2.0 Sala GPU
905 Samples/s (2%)
min: 1164 avg: 1623 median: 1717 (3%) max: 2059 Samples/s
min: 1176 avg: 1880 median: 2074 (4%) max: 2194 Samples/s
ComputeMark v2.1 - ComputeMark v2.1 Result
1863 Points (2%)
min: 1724 avg: 2185 median: 2353 (3%) max: 2657 Points
min: 2101 avg: 2872 median: 2903.5 (3%) max: 3267 Points
Power Consumption - Furmark Stress Test Power Consumption - external Monitor *
min: 20.4 avg: 28.1 median: 28.6 (4%) max: 34.5 Watt
min: 28.6 avg: 44.1 median: 42.2 (6%) max: 62.1 Watt
GPU TDP ? TDP 52 W 103% 100%
min: 13.9 avg: 32.7 median: 32.5 (5%) max: 54 Watt
GPU TDP ? TDP 11 W TDP 28 W TDP 52 W 103% 103% 103% 100%
Power Consumption - The Witcher 3 Power Consumption - external Monitor *
min: 23.5 avg: 32 median: 32.5 (5%) max: 46.4 Watt
min: 24.4 avg: 46 median: 47.6 (7%) max: 66.5 Watt
GPU TDP ? TDP 52 W 103% 100%
min: 13.6 avg: 32.4 median: 31.3 (4%) max: 71.9 Watt
GPU TDP ? TDP 28 W TDP 52 W 103% 104% 100%
Power Consumption - Witcher 3 Power Consumption *
min: 24.3 avg: 33.4 median: 31.7 (7%) max: 46.4 Watt
min: 34.5 avg: 41.5 median: 34.9 (8%) max: 55.2 Watt
GPU TDP ? TDP 52 W 105% 100%
min: 15.5 avg: 35.3 median: 34.8 (8%) max: 53.8 Watt
GPU TDP ? TDP 11 W TDP 28 W TDP 52 W 105% 105% 107% 100%
Power Consumption - Witcher 3 ultra Power Efficiency
min: 0.228 avg: 0.2 median: 0.2 (24%) max: 0.2763 fps per Watt
min: 0.2023 avg: 0.2 median: 0.2 (22%) max: 0.25 fps per Watt
GPU TDP ? TDP 52 W 96% 100%
min: 0.1944 avg: 0.3 median: 0.3 (30%) max: 0.4879 fps per Watt
GPU TDP ? TDP 11 W TDP 28 W TDP 52 W 72% 87% 100% 59%
Power Consumption - Witcher 3 ultra Power Efficiency - external Monitor
min: 0.2426 avg: 0.3 median: 0.3 (23%) max: 0.3165 fps per Watt
min: 0.1789 avg: 0.2 median: 0.2 (18%) max: 0.25 fps per Watt
GPU TDP ? TDP 52 W 96% 100%
min: 0.2108 avg: 0.3 median: 0.3 (28%) max: 0.611 fps per Watt
GPU TDP ? TDP 28 W TDP 52 W 81% 100% 61%
Emissions Witcher 3 Fan Noise + Intel UHD Graphics Xe G4 48EUs Emissions - Witcher 3 Fan Noise
min: 43.15 avg: 43.3 median: 43.3 (69%) max: 43.5 dB(A)
Witcher 3 Fan Noise + Intel UHD Graphics 64EUs (Alder Lake 12th Gen)
min: 36.2 avg: 39.5 median: 38.3 (61%) max: 45.2 dB(A)
GPU TDP ? TDP 52 W 100% 97%
Witcher 3 Fan Noise + Intel Iris Xe Graphics G7 80EUs
min: 0 avg: 35.9 median: 37 (59%) max: 46.4 dB(A)
GPU TDP ? TDP 11 W TDP 28 W TDP 52 W 85% 100% 79% 94%
Clock Speed - GPU Clock Witcher 3 ultra
min: 1250 avg: 1283 median: 1300 (51%) max: 1300 MHz
Clock Speed - GPU Clock Speed Furmark
min: 896 avg: 1131 median: 1165 (46%) max: 1300 MHz
GPU TDP ? TDP 11 W 100% 74%
Average Benchmarks Intel UHD Graphics Xe G4 48EUs → 100% n=35 Average Benchmarks Intel UHD Graphics 64EUs (Alder Lake 12th Gen) → 173% n=35 Average Benchmarks Intel Iris Xe Graphics G7 80EUs → 158% n=35
- Range of benchmark values for this graphics card
- Average benchmark values for this graphics card
* Smaller numbers mean a higher performance
1 This benchmark is not used for the average calculation
Game Benchmarks The following benchmarks stem from our benchmarks of review laptops. The performance depends on the used graphics memory, clock rate, processor, system settings, drivers, and operating systems. So the results don't have to be representative for all laptops with this GPU. For detailed information on the benchmark results, click on the fps number.
Iris Xe G7 80EUs:
16.2 28 ~ 22 fps
Iris Xe G7 80EUs:
22.4 fps
Iris Xe G7 80EUs:
16.8 fps
Iris Xe G7 80EUs:
34.6 fps
100%
UHD Graphics Xe G4 48EUs:
46.3 [X] MSI Thin GF63 12UC-667 Intel Core i5-12450H 1.5GHz
UHD Graphics Xe G4 48EUs
min:
23 fps, P0.1:
23.2 fps, P1:
30.1 fps, max:
216 fps
fps
100%
UHD Graphics Xe G4 48EUs:
29 [X] MSI Thin GF63 12UC-667 Intel Core i5-12450H 1.5GHz
UHD Graphics Xe G4 48EUs
min:
18 fps, P0.1:
18.2 fps, P1:
19.2 fps, max:
57.6 fps
fps
100%
UHD Graphics Xe G4 48EUs:
13.6 [X] MSI Thin GF63 12UC-667 Intel Core i5-12450H 1.5GHz
UHD Graphics Xe G4 48EUs
min:
7.04 fps, P0.1:
7.19 fps, P1:
8.66 fps, max:
51.4 fps
fps
100%
UHD Graphics Xe G4 48EUs:
10.5 [X] MSI Thin GF63 12UC-667 2.02
Intel Core i5-12450H 1.5GHz
UHD Graphics Xe G4 48EUs
min:
7.37 fps, max:
14.9 fps
fps
148%
Iris Xe G7 80EUs:
15.5 fps
100%
UHD Graphics Xe G4 48EUs:
8.1 [X] MSI Thin GF63 12UC-667 2.02
Intel Core i5-12450H 1.5GHz
UHD Graphics Xe G4 48EUs
min:
6.23 fps, max:
10.5 fps
fps
152%
Iris Xe G7 80EUs:
12.2 fps
Iris Xe G7 80EUs:
10.4 fps
Iris Xe G7 80EUs:
17.8 fps
Iris Xe G7 80EUs:
15.5 fps
Iris Xe G7 80EUs:
13.2 fps
Iris Xe G7 80EUs:
11.8 fps
Iris Xe G7 80EUs:
27.8 fps
Iris Xe G7 80EUs:
20.2 fps
Iris Xe G7 80EUs:
15.5 fps
Iris Xe G7 80EUs:
11.2 fps
Iris Xe G7 80EUs:
17.6 fps
Iris Xe G7 80EUs:
16.9 fps
Iris Xe G7 80EUs:
15.2 fps
Iris Xe G7 80EUs:
12.5 fps
100%
UHD Graphics Xe G4 48EUs:
11.1 [X] MSI Thin GF63 12UC-667 Intel Core i5-12450H 1.5GHz
UHD Graphics Xe G4 48EUs
min:
3.08 fps, P0.1:
3.18 fps, P1:
4.5 fps, max:
6035 fps
fps
121%
Iris Xe G7 80EUs:
13.4 fps
Iris Xe G7 80EUs:
11.3 fps
UHD Graphics 64EUs:
24.2 [X] NiPoGi CK10 1030131
Intel Core i5-12450H 1.5GHz
UHD Graphics 64EUs
min:
20 fps, P1:
20 fps, max:
27 fps
24.6 [X] Geekom Mini IT12 1050579
Intel Core i5-12450H 1.5GHz
UHD Graphics 64EUs
min:
20 fps, P1:
20 fps, max:
28 fps
28.6 [X] NiPoGi AD08 1057599
Intel Core i7-12650H 1.7GHz
UHD Graphics 64EUs
min:
23 fps, P1:
23 fps, max:
33 fps
31.1 [X] NiPoGi AD08 1057599
Intel Core i7-12650H 1.7GHz
UHD Graphics 64EUs
min:
26 fps, P1:
26 fps, max:
36 fps
32.3 [X] NiPoGi AD08 1057599
Intel Core i7-12650H 1.7GHz
UHD Graphics 64EUs
min:
27 fps, P1:
27 fps, max:
37 fps
~ 28 fps
Iris Xe G7 80EUs:
24.8 [X] Lenovo ThinkPad L14 G4 21H1003DGE 1082038
Intel Core i5-1335U 0.9GHz
Iris Xe G7 80EUs
min:
19 fps, P1:
20 fps, max:
28 fps
29.4 37.2 37.2 43 ~ 34 fps
UHD Graphics 64EUs:
21.6 [X] NiPoGi CK10 1030131
Intel Core i5-12450H 1.5GHz
UHD Graphics 64EUs
min:
19 fps, P1:
17 fps, max:
24 fps
22.1 [X] Geekom Mini IT12 1050579
Intel Core i5-12450H 1.5GHz
UHD Graphics 64EUs
min:
19 fps, P1:
19 fps, max:
24 fps
26.2 [X] NiPoGi AD08 1057599
Intel Core i7-12650H 1.7GHz
UHD Graphics 64EUs
min:
22 fps, P1:
22 fps, max:
29 fps
28.3 [X] NiPoGi AD08 1057599
Intel Core i7-12650H 1.7GHz
UHD Graphics 64EUs
min:
24 fps, P1:
24 fps, max:
31 fps
29.2 [X] NiPoGi AD08 1057599
Intel Core i7-12650H 1.7GHz
UHD Graphics 64EUs
min:
25 fps, P1:
24 fps, max:
32 fps
~ 25 fps
Iris Xe G7 80EUs:
22.8 [X] Lenovo ThinkPad L14 G4 21H1003DGE 1082038
Intel Core i5-1335U 0.9GHz
Iris Xe G7 80EUs
min:
18 fps, P1:
18 fps, max:
26 fps
28.2 33.2 33.4 38.4 ~ 31 fps
UHD Graphics 64EUs:
14.8 [X] NiPoGi CK10 1030131
Intel Core i5-12450H 1.5GHz
UHD Graphics 64EUs
min:
12 fps, P1:
12 fps, max:
16 fps
15.2 [X] Geekom Mini IT12 1050579
Intel Core i5-12450H 1.5GHz
UHD Graphics 64EUs
min:
12 fps, P1:
12 fps, max:
16 fps
18.2 [X] NiPoGi AD08 1057599
Intel Core i7-12650H 1.7GHz
UHD Graphics 64EUs
min:
15 fps, P1:
15 fps, max:
20 fps
19.5 [X] NiPoGi AD08 1057599
Intel Core i7-12650H 1.7GHz
UHD Graphics 64EUs
min:
16 fps, P1:
16 fps, max:
21 fps
19.9 [X] NiPoGi AD08 1057599
Intel Core i7-12650H 1.7GHz
UHD Graphics 64EUs
min:
16 fps, P1:
15 fps, max:
22 fps
~ 18 fps
Iris Xe G7 80EUs:
16.3 [X] Lenovo ThinkPad L14 G4 21H1003DGE 1082038
Intel Core i5-1335U 0.9GHz
Iris Xe G7 80EUs
min:
13 fps, P1:
13 fps, max:
18 fps
19.9 22.9 22.9 25.9 ~ 22 fps
UHD Graphics 64EUs:
14.1 [X] NiPoGi AD08 1057599
Intel Core i7-12650H 1.7GHz
UHD Graphics 64EUs
min:
12 fps, P1:
11 fps, max:
16 fps
15.1 [X] NiPoGi AD08 1057599
Intel Core i7-12650H 1.7GHz
UHD Graphics 64EUs
min:
12 fps, P1:
12 fps, max:
17 fps
15.2 [X] NiPoGi AD08 1057599
Intel Core i7-12650H 1.7GHz
UHD Graphics 64EUs
min:
13 fps, P1:
12 fps, max:
18 fps
~ 15 fps
Iris Xe G7 80EUs:
28.1 fps
Iris Xe G7 80EUs:
20.1 fps
Iris Xe G7 80EUs:
13.6 fps
Iris Xe G7 80EUs:
30.5 fps
Iris Xe G7 80EUs:
25.9 fps
Iris Xe G7 80EUs:
14.3 fps
UHD Graphics 64EUs:
23.3 [X] MSI Katana 17 B13VFK Intel Core i7-13620H 1.8GHz
UHD Graphics 64EUs
P0.1:
15.6 fpsP1:
16.8 fps
fps
Iris Xe G7 80EUs:
23.2 fps
UHD Graphics 64EUs:
21.4 [X] MSI Katana 17 B13VFK Intel Core i7-13620H 1.8GHz
UHD Graphics 64EUs
P0.1:
10.6 fpsP1:
14.8 fps
fps
Iris Xe G7 80EUs:
20.9 fps
UHD Graphics 64EUs:
16.7 [X] MSI Katana 17 B13VFK Intel Core i7-13620H 1.8GHz
UHD Graphics 64EUs
P0.1:
8.5 fpsP1:
10.6 fps
fps
Iris Xe G7 80EUs:
15.9 fps
Iris Xe G7 80EUs:
15.8 fps
UHD Graphics 64EUs:
12.4 [X] MSI Katana 17 B13VFK Intel Core i7-13620H 1.8GHz
UHD Graphics 64EUs
min:
2.7 fps, P0.1:
2.73 fps, P1:
3.04 fps, max:
27.5 fps
fps
Iris Xe G7 80EUs:
10.2 fps
UHD Graphics 64EUs:
24.4 [X] MSI Katana 17 B13VFK Intel Core i7-13620H 1.8GHz
UHD Graphics 64EUs
min:
14.2 fps, P0.1:
18.7 fps, P1:
20.7 fps, max:
82.7 fps
fps
Iris Xe G7 80EUs:
22.6 fps
UHD Graphics 64EUs:
17.5 [X] MSI Katana 17 B13VFK Intel Core i7-13620H 1.8GHz
UHD Graphics 64EUs
min:
11.1 fps, P0.1:
14 fps, P1:
15.1 fps, max:
42.4 fps
fps
Iris Xe G7 80EUs:
16.4 fps
UHD Graphics 64EUs:
12.5 [X] MSI Katana 17 B13VFK Intel Core i7-13620H 1.8GHz
UHD Graphics 64EUs
min:
7.61 fps, P0.1:
9.77 fps, P1:
11.2 fps, max:
44.9 fps
fps
Iris Xe G7 80EUs:
11.7 fps
UHD Graphics 64EUs:
17.1 [X] MSI Katana 17 B13VFK Intel Core i7-13620H 1.8GHz
UHD Graphics 64EUs
min:
9.3 fps, P0.1:
9.96 fps, P1:
13.4 fps, max:
74.5 fps
fps
UHD Graphics 64EUs:
11.6 [X] MSI Katana 17 B13VFK Intel Core i7-13620H 1.8GHz
UHD Graphics 64EUs
min:
7.09 fps, P0.1:
7.42 fps, P1:
8.97 fps, max:
20.7 fps
fps
UHD Graphics 64EUs:
11.7 (!) [X] MSI Katana 17 B13VFK Intel Core i7-13620H 1.8GHz
UHD Graphics 64EUs
min:
9.19 fps, P0.1:
9.23 fps, P1:
9.62 fps, max:
16.9 fps
fps
Iris Xe G7 80EUs:
8.3 (!) [X] Dell Latitude 3520 Intel Core i5-1135G7 2.4GHz
Iris Xe G7 80EUs
min:
5.46 fps, P0.1:
5.48 fps, P1:
5.7 fps, max:
12.1 fps
fps
100%
UHD Graphics Xe G4 48EUs:
21 [X] MSI Thin GF63 12UC-667 Intel Core i5-12450H 1.5GHz
UHD Graphics Xe G4 48EUs
min:
4.99 fps, P0.1:
10.9 fps, P1:
16.7 fps, max:
139.2 fps
fps
99%
Iris Xe G7 80EUs:
20.7 [X] Dell Latitude 3520 Intel Core i5-1135G7 2.4GHz
Iris Xe G7 80EUs
min:
3 fps, P0.1:
11 fps, P1:
17 fps, max:
54.3 fps
fps
100%
UHD Graphics Xe G4 48EUs:
16.4 [X] MSI Thin GF63 12UC-667 Intel Core i5-12450H 1.5GHz
UHD Graphics Xe G4 48EUs
min:
12.6 fps, P0.1:
13 fps, P1:
13.7 fps, max:
18.5 fps
fps
97%
Iris Xe G7 80EUs:
15.9 [X] Dell Latitude 3520 Intel Core i5-1135G7 2.4GHz
Iris Xe G7 80EUs
min:
6.34 fps, P0.1:
7.51 fps, P1:
13.4 fps, max:
62.3 fps
fps
Iris Xe G7 80EUs:
7.4 [X] Dell Latitude 3520 Intel Core i5-1135G7 2.4GHz
Iris Xe G7 80EUs
min:
3.6 fps, P0.1:
6.41 fps, P1:
6.77 fps, max:
29 fps
fps
UHD Graphics 64EUs:
33.4 [X] MSI Katana 17 B13VFK Intel Core i7-13620H 1.8GHz
UHD Graphics 64EUs
min:
12.5 fps, P0.1:
12.6 fps, P1:
15.9 fps, max:
220 fps
fps
Iris Xe G7 80EUs:
26.1 [X] Dell Latitude 3520 Intel Core i5-1135G7 2.4GHz
Iris Xe G7 80EUs
min:
10.5 fps, P0.1:
11.1 fps, P1:
13.5 fps, max:
78.9 fps
29.7 ~ 28 fps
UHD Graphics 64EUs:
20.1 [X] MSI Katana 17 B13VFK Intel Core i7-13620H 1.8GHz
UHD Graphics 64EUs
min:
7.77 fps, P0.1:
7.81 fps, P1:
10.2 fps, max:
224 fps
fps
Iris Xe G7 80EUs:
15.4 [X] Dell Latitude 3520 Intel Core i5-1135G7 2.4GHz
Iris Xe G7 80EUs
min:
6.15 fps, P0.1:
6.3 fps, P1:
7.64 fps, max:
74.8 fps
18.4 ~ 17 fps
UHD Graphics 64EUs:
18.2 [X] MSI Katana 17 B13VFK Intel Core i7-13620H 1.8GHz
UHD Graphics 64EUs
min:
6.49 fps, P0.1:
6.59 fps, P1:
7.54 fps, max:
176.1 fps
fps
Iris Xe G7 80EUs:
14.5 [X] Dell Latitude 3520 Intel Core i5-1135G7 2.4GHz
Iris Xe G7 80EUs
min:
4.75 fps, P0.1:
4.79 fps, P1:
5.25 fps, max:
88 fps
17 ~ 16 fps
Iris Xe G7 80EUs:
10.3 [X] Dell Latitude 3520 Intel Core i5-1135G7 2.4GHz
Iris Xe G7 80EUs
min:
2.85 fps, P0.1:
3.13 fps, P1:
4.75 fps, max:
71.9 fps
12.2 ~ 11 fps
UHD Graphics 64EUs:
19.7 [X] MSI Katana 17 B13VFK Intel Core i7-13620H 1.8GHz
UHD Graphics 64EUs
fps
Iris Xe G7 80EUs:
10.9 16.2 [X] Dell Latitude 3520 Intel Core i5-1135G7 2.4GHz
Iris Xe G7 80EUs
~ 14 fps
UHD Graphics 64EUs:
13.6 [X] MSI Katana 17 B13VFK Intel Core i7-13620H 1.8GHz
UHD Graphics 64EUs
fps
Iris Xe G7 80EUs:
8.6 11.1 [X] Dell Latitude 3520 Intel Core i5-1135G7 2.4GHz
Iris Xe G7 80EUs
~ 10 fps
Iris Xe G7 80EUs:
5 6.8 [X] Dell Latitude 3520 Intel Core i5-1135G7 2.4GHz
Iris Xe G7 80EUs
~ 6 fps
Iris Xe G7 80EUs:
6.9 [X] Dell Latitude 3520 Intel Core i5-1135G7 2.4GHz
Iris Xe G7 80EUs
fps
UHD Graphics 64EUs:
20.8 [X] MSI Katana 17 B13VFK Intel Core i7-13620H 1.8GHz
UHD Graphics 64EUs
min:
15.6 fps, P0.1:
15.6 fps, P1:
16.4 fps, max:
31.3 fps
fps
Iris Xe G7 80EUs:
8.8 [X] LG Gram 15Z90Q Intel Core i5-1240P 1.2GHz
Iris Xe G7 80EUs
min:
4.07 fps, P0.1:
4.84 fps, P1:
5.51 fps, max:
13.3 fps
17.2 [X] Dell Latitude 3520 Intel Core i5-1135G7 2.4GHz
Iris Xe G7 80EUs
min:
5.5 fps, P0.1:
6.61 fps, P1:
13 fps, max:
29.3 fps
~ 13 fps
UHD Graphics 64EUs:
17.1 [X] MSI Katana 17 B13VFK Intel Core i7-13620H 1.8GHz
UHD Graphics 64EUs
min:
1.665 fps, P0.1:
8.82 fps, P1:
14.4 fps, max:
97.4 fps
fps
Iris Xe G7 80EUs:
8.3 [X] LG Gram 15Z90Q Intel Core i5-1240P 1.2GHz
Iris Xe G7 80EUs
min:
3.15 fps, P0.1:
3.24 fps, P1:
3.64 fps, max:
16.4 fps
14.1 [X] Dell Latitude 3520 Intel Core i5-1135G7 2.4GHz
Iris Xe G7 80EUs
min:
6.18 fps, P0.1:
6.78 fps, P1:
9.05 fps, max:
27.7 fps
~ 11 fps
UHD Graphics 64EUs:
14.1 [X] MSI Katana 17 B13VFK Intel Core i7-13620H 1.8GHz
UHD Graphics 64EUs
min:
6.56 fps, P0.1:
7.05 fps, P1:
11.8 fps, max:
51.3 fps
fps
Iris Xe G7 80EUs:
6.4 [X] LG Gram 15Z90Q Intel Core i5-1240P 1.2GHz
Iris Xe G7 80EUs
min:
1.328 fps, P0.1:
1.665 fps, P1:
2.99 fps, max:
22.7 fps
11.4 [X] Dell Latitude 3520 Intel Core i5-1135G7 2.4GHz
Iris Xe G7 80EUs
min:
3.58 fps, P0.1:
5.02 fps, P1:
6.69 fps, max:
30.8 fps
~ 9 fps
Iris Xe G7 80EUs:
9.3 [X] Dell Latitude 3520 Intel Core i5-1135G7 2.4GHz
Iris Xe G7 80EUs
min:
2.68 fps, P0.1:
3.78 fps, P1:
6.01 fps, max:
20.2 fps
fps
UHD Graphics 64EUs:
22.4 (!) [X] MSI Katana 17 B13VFK Intel Core i7-13620H 1.8GHz
UHD Graphics 64EUs
min:
18 fps, P0.1:
18 fps, P1:
19.1 fps, max:
27.3 fps
fps
Iris Xe G7 80EUs:
4.9 [X] LG Gram 15Z90Q Intel Core i5-1240P 1.2GHz
Iris Xe G7 80EUs
min:
2.99 fps, P0.1:
3.02 fps, P1:
3.13 fps, max:
5.69 fps
17.4 (!) [X] Dell Latitude 3520 Intel Core i5-1135G7 2.4GHz
Iris Xe G7 80EUs
min:
7.65 fps, P0.1:
9.24 fps, P1:
13.1 fps, max:
21.9 fps
~ 11 fps
UHD Graphics 64EUs:
19.5 (!) [X] MSI Katana 17 B13VFK Intel Core i7-13620H 1.8GHz
UHD Graphics 64EUs
min:
14.5 fps, P0.1:
15.1 fps, P1:
16.1 fps, max:
30 fps
fps
Iris Xe G7 80EUs:
4.6 [X] LG Gram 15Z90Q Intel Core i5-1240P 1.2GHz
Iris Xe G7 80EUs
min:
2.73 fps, P0.1:
2.78 fps, P1:
2.97 fps, max:
5.71 fps
16.7 (!) [X] Dell Latitude 3520 Intel Core i5-1135G7 2.4GHz
Iris Xe G7 80EUs
min:
12.9 fps, P0.1:
12.9 fps, P1:
13.4 fps, max:
29.2 fps
~ 11 fps
UHD Graphics 64EUs:
18.5 (!) [X] MSI Katana 17 B13VFK Intel Core i7-13620H 1.8GHz
UHD Graphics 64EUs
min:
15.3 fps, P0.1:
15.4 fps, P1:
15.9 fps, max:
32.7 fps
fps
Iris Xe G7 80EUs:
4.4 [X] LG Gram 15Z90Q Intel Core i5-1240P 1.2GHz
Iris Xe G7 80EUs
min:
2.91 fps, P0.1:
2.93 fps, P1:
3.01 fps, max:
6.12 fps
14.8 (!) [X] Dell Latitude 3520 Intel Core i5-1135G7 2.4GHz
Iris Xe G7 80EUs
min:
11.3 fps, P0.1:
11.4 fps, P1:
12 fps, max:
26.7 fps
~ 10 fps
Iris Xe G7 80EUs:
12.7 (!) [X] Dell Latitude 3520 Intel Core i5-1135G7 2.4GHz
Iris Xe G7 80EUs
min:
10.3 fps, P0.1:
10.3 fps, P1:
10.4 fps, max:
15.1 fps
fps
100%
UHD Graphics Xe G4 48EUs:
14 [X] Acer Aspire 5 A515-56-P8NZ Intel Pentium Gold 7505 2GHz
UHD Graphics Xe G4 48EUs
fps
171%
UHD Graphics 64EUs:
24 [X] MSI Katana 17 B13VFK Intel Core i7-13620H 1.8GHz
UHD Graphics 64EUs
min:
14 fps
fps
86%
Iris Xe G7 80EUs:
0 (!) [X] LG Gram 15Z90Q Intel Core i5-1240P 1.2GHz
Iris Xe G7 80EUs
23 ~ 12 fps
UHD Graphics 64EUs:
21 [X] MSI Katana 17 B13VFK Intel Core i7-13620H 1.8GHz
UHD Graphics 64EUs
min:
13 fps
fps
Iris Xe G7 80EUs:
0 (!) [X] LG Gram 15Z90Q Intel Core i5-1240P 1.2GHz
Iris Xe G7 80EUs
20 ~ 10 fps
UHD Graphics 64EUs:
18 [X] MSI Katana 17 B13VFK Intel Core i7-13620H 1.8GHz
UHD Graphics 64EUs
min:
7 fps
fps
Iris Xe G7 80EUs:
0 (!) [X] LG Gram 15Z90Q Intel Core i5-1240P 1.2GHz
Iris Xe G7 80EUs
16 ~ 8 fps
Iris Xe G7 80EUs:
5.4 [X] LG Gram 15Z90Q Intel Core i5-1240P 1.2GHz
Iris Xe G7 80EUs
min:
3.34 fps, P0.1:
3.34 fps, P1:
3.38 fps, max:
7.78 fps
9.6 [X] Dell Latitude 3520 Intel Core i5-1135G7 2.4GHz
Iris Xe G7 80EUs
min:
8.72 fps, P0.1:
8.72 fps, P1:
8.78 fps, max:
10.6 fps
~ 7 fps
Iris Xe G7 80EUs:
4.8 [X] LG Gram 15Z90Q Intel Core i5-1240P 1.2GHz
Iris Xe G7 80EUs
min:
2.06 fps, P0.1:
2.21 fps, P1:
3.42 fps, max:
7.27 fps
9 [X] Dell Latitude 3520 Intel Core i5-1135G7 2.4GHz
Iris Xe G7 80EUs
min:
6.78 fps, P0.1:
6.8 fps, P1:
7.38 fps, max:
10.1 fps
~ 7 fps
Iris Xe G7 80EUs:
4.5 [X] LG Gram 15Z90Q Intel Core i5-1240P 1.2GHz
Iris Xe G7 80EUs
min:
2.17 fps, P0.1:
2.18 fps, P1:
2.36 fps, max:
29.5 fps
fps
Iris Xe G7 80EUs:
6 [X] LG Gram 15Z90Q Intel Core i5-1240P 1.2GHz
Iris Xe G7 80EUs
min:
4.85 fps, P0.1:
4.85 fps, P1:
4.95 fps, max:
7.8 fps
11.9 [X] Dell Latitude 3520 Intel Core i5-1135G7 2.4GHz
Iris Xe G7 80EUs
min:
7.54 fps, P0.1:
7.83 fps, P1:
9.12 fps, max:
16.8 fps
~ 9 fps
Iris Xe G7 80EUs:
5.3 [X] LG Gram 15Z90Q Intel Core i5-1240P 1.2GHz
Iris Xe G7 80EUs
min:
4.37 fps, P0.1:
4.41 fps, P1:
4.62 fps, max:
6.71 fps
9.6 [X] Dell Latitude 3520 Intel Core i5-1135G7 2.4GHz
Iris Xe G7 80EUs
min:
6.49 fps, P0.1:
6.69 fps, P1:
7.12 fps, max:
17.8 fps
~ 7 fps
Iris Xe G7 80EUs:
4.7 [X] LG Gram 15Z90Q Intel Core i5-1240P 1.2GHz
Iris Xe G7 80EUs
min:
3.85 fps, P0.1:
3.85 fps, P1:
4.02 fps, max:
5.77 fps
8 [X] Dell Latitude 3520 Intel Core i5-1135G7 2.4GHz
Iris Xe G7 80EUs
min:
4.01 fps, P0.1:
4.28 fps, P1:
6.12 fps, max:
32 fps
~ 6 fps
Iris Xe G7 80EUs:
6.7 [X] Dell Latitude 3520 Intel Core i5-1135G7 2.4GHz
Iris Xe G7 80EUs
min:
3.61 fps, P0.1:
4.15 fps, P1:
5.45 fps, max:
12.1 fps
fps
100%
UHD Graphics Xe G4 48EUs:
19.2 [X] Acer Aspire 5 A515-56-P8NZ Dual-Channel
Intel Pentium Gold 7505 2GHz
UHD Graphics Xe G4 48EUs
min:
12.2 fps, P0.1:
13.6 fps, P1:
15.1 fps, max:
37 fps
fps
149%
Iris Xe G7 80EUs:
28.6 [X] Dell Latitude 3520 Intel Core i5-1135G7 2.4GHz
Iris Xe G7 80EUs
min:
18.1 fps, P0.1:
23.3 fps, P1:
24.5 fps, max:
45.8 fps
fps
Iris Xe G7 80EUs:
28.4 [X] Dell Latitude 3520 Intel Core i5-1135G7 2.4GHz
Iris Xe G7 80EUs
min:
17.7 fps, P0.1:
22.5 fps, P1:
24 fps, max:
41.3 fps
fps
100%
UHD Graphics Xe G4 48EUs:
8.1 [X] Acer Aspire 5 A515-56-P8NZ Dual-Channel
Intel Pentium Gold 7505 2GHz
UHD Graphics Xe G4 48EUs
min:
4.08 fps, P0.1:
4.49 fps, P1:
6.03 fps, max:
18.8 fps
fps
171%
UHD Graphics 64EUs:
13.8 [X] MSI Katana 17 B13VFK Intel Core i7-13620H 1.8GHz
UHD Graphics 64EUs
min:
10.2 fps, P0.1:
10.5 fps, P1:
11.1 fps, max:
23.1 fps
fps
149%
Iris Xe G7 80EUs:
11.5 11.9 ~ 12 fps
100%
UHD Graphics Xe G4 48EUs:
6.4 [X] Acer Aspire 5 A515-56-P8NZ Dual-Channel
Intel Pentium Gold 7505 2GHz
UHD Graphics Xe G4 48EUs
min:
4.02 fps, P0.1:
4.03 fps, P1:
4.47 fps, max:
11.1 fps
fps
140%
Iris Xe G7 80EUs:
8.4 8.9 ~ 9 fps
Iris Xe G7 80EUs:
5.4 7.1 ~ 6 fps
100%
UHD Graphics Xe G4 48EUs:
25.3 [X] Acer Aspire 5 A515-56-P8NZ 923650, Dual-Channel
Intel Pentium Gold 7505 2GHz
UHD Graphics Xe G4 48EUs
min:
20 fps, P1:
19 fps, max:
28 fps
27.9 [X] GMK NucBox M3 959964
Intel Core i5-12450H 1.5GHz
UHD Graphics Xe G4 48EUs
min:
23 fps, P1:
19 fps, max:
32 fps
~ 27 fps
119%
UHD Graphics 64EUs:
27.1 [X] NiPoGi CK10 959964
Intel Core i5-12450H 1.5GHz
UHD Graphics 64EUs
min:
21 fps, P1:
21 fps, max:
31 fps
27.3 [X] Geekom Mini IT12 959964
Intel Core i5-12450H 1.5GHz
UHD Graphics 64EUs
min:
23 fps, P1:
20 fps, max:
31 fps
27.9 31.7 [X] NiPoGi AD08 959964
Intel Core i7-12650H 1.7GHz
UHD Graphics 64EUs
min:
25 fps, P1:
23 fps, max:
36 fps
34.4 [X] NiPoGi AD08 959964
Intel Core i7-12650H 1.7GHz
UHD Graphics 64EUs
min:
29 fps, P1:
27 fps, max:
40 fps
35.2 [X] NiPoGi AD08 959964
Intel Core i7-12650H 1.7GHz
UHD Graphics 64EUs
min:
30 fps, P1:
27 fps, max:
42 fps
37.6 ~ 32 fps
100%
UHD Graphics Xe G4 48EUs:
23 [X] Acer Aspire 5 A515-56-P8NZ 923650, Dual-Channel
Intel Pentium Gold 7505 2GHz
UHD Graphics Xe G4 48EUs
min:
20 fps, P1:
18 fps, max:
26 fps
24.8 [X] GMK NucBox M3 959964
Intel Core i5-12450H 1.5GHz
UHD Graphics Xe G4 48EUs
min:
21 fps, P1:
17 fps, max:
28 fps
~ 24 fps
121%
UHD Graphics 64EUs:
24.3 [X] NiPoGi CK10 959964
Intel Core i5-12450H 1.5GHz
UHD Graphics 64EUs
min:
19 fps, P1:
19 fps, max:
27 fps
24.5 [X] Geekom Mini IT12 959964
Intel Core i5-12450H 1.5GHz
UHD Graphics 64EUs
min:
19 fps, P1:
18 fps, max:
27 fps
24.9 29.4 [X] NiPoGi AD08 959964
Intel Core i7-12650H 1.7GHz
UHD Graphics 64EUs
min:
24 fps, P1:
22 fps, max:
33 fps
31.3 [X] NiPoGi AD08 959964
Intel Core i7-12650H 1.7GHz
UHD Graphics 64EUs
min:
27 fps, P1:
24 fps, max:
36 fps
31.9 [X] NiPoGi AD08 959964
Intel Core i7-12650H 1.7GHz
UHD Graphics 64EUs
min:
27 fps, P1:
24 fps, max:
37 fps
34 ~ 29 fps
100%
UHD Graphics Xe G4 48EUs:
16.4 [X] Acer Aspire 5 A515-56-P8NZ 923650, Dual-Channel
Intel Pentium Gold 7505 2GHz
UHD Graphics Xe G4 48EUs
min:
14 fps, P1:
13 fps, max:
18 fps
17.5 [X] GMK NucBox M3 959964
Intel Core i5-12450H 1.5GHz
UHD Graphics Xe G4 48EUs
min:
14 fps, P1:
12 fps, max:
20 fps
~ 17 fps
118%
UHD Graphics 64EUs:
17.2 [X] NiPoGi CK10 959964
Intel Core i5-12450H 1.5GHz
UHD Graphics 64EUs
min:
14 fps, P1:
13 fps, max:
19 fps
17.5 [X] Geekom Mini IT12 959964
Intel Core i5-12450H 1.5GHz
UHD Graphics 64EUs
min:
14 fps, P1:
13 fps, max:
20 fps
17.7 21.1 [X] NiPoGi AD08 959964
Intel Core i7-12650H 1.7GHz
UHD Graphics 64EUs
min:
17 fps, P1:
16 fps, max:
23 fps
21.9 [X] NiPoGi AD08 959964
Intel Core i7-12650H 1.7GHz
UHD Graphics 64EUs
min:
18 fps, P1:
17 fps, max:
25 fps
22.1 [X] NiPoGi AD08 959964
Intel Core i7-12650H 1.7GHz
UHD Graphics 64EUs
min:
19 fps, P1:
17 fps, max:
25 fps
24.7 ~ 20 fps
100%
UHD Graphics Xe G4 48EUs:
12.7 [X] Acer Aspire 5 A515-56-P8NZ 923650, Dual-Channel
Intel Pentium Gold 7505 2GHz
UHD Graphics Xe G4 48EUs
min:
11 fps, P1:
10 fps, max:
14 fps
13.5 [X] GMK NucBox M3 959964
Intel Core i5-12450H 1.5GHz
UHD Graphics Xe G4 48EUs
min:
11 fps, P1:
11 fps, max:
16 fps
~ 13 fps
123%
UHD Graphics 64EUs:
13.4 [X] NiPoGi CK10 959964
Intel Core i5-12450H 1.5GHz
UHD Graphics 64EUs
min:
9 fps, P1:
10 fps, max:
15 fps
13.5 [X] Geekom Mini IT12 959964
Intel Core i5-12450H 1.5GHz
UHD Graphics 64EUs
min:
11 fps, P1:
10 fps, max:
16 fps
13.6 16.6 [X] NiPoGi AD08 959964
Intel Core i7-12650H 1.7GHz
UHD Graphics 64EUs
min:
13 fps, P1:
13 fps, max:
19 fps
17.3 [X] NiPoGi AD08 959964
Intel Core i7-12650H 1.7GHz
UHD Graphics 64EUs
min:
14 fps, P1:
14 fps, max:
20 fps
17.3 [X] NiPoGi AD08 959964
Intel Core i7-12650H 1.7GHz
UHD Graphics 64EUs
min:
14 fps, P1:
13 fps, max:
20 fps
18.8 ~ 16 fps
100%
UHD Graphics Xe G4 48EUs:
33.9 [X] Acer Aspire 5 A515-56-P8NZ Dual-Channel
Intel Pentium Gold 7505 2GHz
UHD Graphics Xe G4 48EUs
min:
14.8 fps, P0.1:
18.7 fps, P1:
21.4 fps, max:
81.9 fps
fps
186%
UHD Graphics 64EUs:
63.2 [X] MSI Katana 17 B13VFK Intel Core i7-13620H 1.8GHz
UHD Graphics 64EUs
min:
15.7 fps, P0.1:
46.5 fps, P1:
50.1 fps, max:
203 fps
fps
121%
Iris Xe G7 80EUs:
39.4 41.7 ~ 41 fps
100%
UHD Graphics Xe G4 48EUs:
20.5 [X] Acer Aspire 5 A515-56-P8NZ Dual-Channel
Intel Pentium Gold 7505 2GHz
UHD Graphics Xe G4 48EUs
min:
6.66 fps, P0.1:
7.39 fps, P1:
15.7 fps, max:
59.9 fps
fps
190%
UHD Graphics 64EUs:
38.9 [X] MSI Katana 17 B13VFK Intel Core i7-13620H 1.8GHz
UHD Graphics 64EUs
min:
17.7 fps, P0.1:
18.6 fps, P1:
30.4 fps, max:
244 fps
fps
122%
Iris Xe G7 80EUs:
24.4 25 ~ 25 fps
100%
UHD Graphics Xe G4 48EUs:
18.6 [X] Acer Aspire 5 A515-56-P8NZ Dual-Channel
Intel Pentium Gold 7505 2GHz
UHD Graphics Xe G4 48EUs
min:
6.58 fps, P0.1:
8.99 fps, P1:
13.6 fps, max:
46.2 fps
fps
169%
UHD Graphics 64EUs:
31.4 [X] MSI Katana 17 B13VFK Intel Core i7-13620H 1.8GHz
UHD Graphics 64EUs
min:
8.68 fps, P0.1:
11.2 fps, P1:
24 fps, max:
147.9 fps
fps
124%
Iris Xe G7 80EUs:
23 23.2 ~ 23 fps
100%
UHD Graphics Xe G4 48EUs:
16.4 [X] Acer Aspire 5 A515-56-P8NZ Dual-Channel
Intel Pentium Gold 7505 2GHz
UHD Graphics Xe G4 48EUs
min:
10.7 fps, P0.1:
10.8 fps, P1:
12.5 fps, max:
27.1 fps
fps
171%
UHD Graphics 64EUs:
28.1 [X] MSI Katana 17 B13VFK Intel Core i7-13620H 1.8GHz
UHD Graphics 64EUs
min:
14.9 fps, P0.1:
15.8 fps, P1:
22.6 fps, max:
190.9 fps
fps
100%
UHD Graphics Xe G4 48EUs:
8.9 [X] Lenovo IdeaPad 3 14ITL6 82H700CCGE Intel Celeron 6305 1.8GHz
UHD Graphics Xe G4 48EUs
min:
2.92 fps, P0.1:
2.95 fps, P1:
3.78 fps, max:
66.5 fps
fps
209%
UHD Graphics 64EUs:
18.6 [X] Asus TUF Dash F15 FX517ZR Intel Core i7-12650H 1.7GHz
UHD Graphics 64EUs
min:
7.55 fps, P0.1:
7.91 fps, P1:
9.37 fps, max:
174.2 fps
fps
UHD Graphics 64EUs:
18.6 [X] Asus TUF Dash F15 FX517ZR Intel Core i7-12650H 1.7GHz
UHD Graphics 64EUs
min:
7.44 fps, P0.1:
7.84 fps, P1:
9.5 fps, max:
168.9 fps
fps
UHD Graphics 64EUs:
18.4 [X] Asus TUF Dash F15 FX517ZR Intel Core i7-12650H 1.7GHz
UHD Graphics 64EUs
min:
7.56 fps, P0.1:
7.98 fps, P1:
9.46 fps, max:
167.5 fps
fps
Iris Xe G7 80EUs:
13.2 fps
UHD Graphics 64EUs:
18.1 [X] Asus TUF Dash F15 FX517ZR Intel Core i7-12650H 1.7GHz
UHD Graphics 64EUs
min:
8.31 fps, P0.1:
8.37 fps, P1:
9.04 fps, max:
161.1 fps
fps
100%
UHD Graphics Xe G4 48EUs:
14.6 [X] Acer Aspire 5 A515-56-P8NZ Intel Pentium Gold 7505 2GHz
UHD Graphics Xe G4 48EUs
17.1 ~ 16 fps
131%
UHD Graphics 64EUs:
16.7 17.6 19.4 22.9 25.1 25.5 [X] Asus TUF Dash F15 FX517ZR Intel Core i7-12650H 1.7GHz
UHD Graphics 64EUs
~ 21 fps
100%
UHD Graphics Xe G4 48EUs:
12.2 [X] Acer Aspire 5 A515-56-P8NZ Intel Pentium Gold 7505 2GHz
UHD Graphics Xe G4 48EUs
13.3 ~ 13 fps
131%
UHD Graphics 64EUs:
12.7 13.8 16.4 17.8 19.6 19.9 [X] Asus TUF Dash F15 FX517ZR Intel Core i7-12650H 1.7GHz
UHD Graphics 64EUs
~ 17 fps
UHD Graphics 64EUs:
8.3 8.7 10.6 11 12.1 12.4 [X] Asus TUF Dash F15 FX517ZR Intel Core i7-12650H 1.7GHz
UHD Graphics 64EUs
~ 11 fps
UHD Graphics 64EUs:
6 6.4 6.7 8.1 9.3 9.7 [X] Asus TUF Dash F15 FX517ZR Intel Core i7-12650H 1.7GHz
UHD Graphics 64EUs
~ 8 fps
100%
UHD Graphics Xe G4 48EUs:
10.8 [X] GMK NucBox M3 Intel Core i5-12450H 1.5GHz
UHD Graphics Xe G4 48EUs
min:
7.7 fps, max:
15.1 fps
10.9 [X] Lenovo IdeaPad 3 14ITL6 82H700CCGE Intel Celeron 6305 1.8GHz
UHD Graphics Xe G4 48EUs
min:
1.3 fps, max:
37.8 fps
~ 11 fps
164%
UHD Graphics 64EUs:
18 [X] Asus TUF Dash F15 FX517ZR Intel Core i7-12650H 1.7GHz
UHD Graphics 64EUs
min:
12.2 fps, max:
26.4 fps
fps
UHD Graphics 64EUs:
14.7 [X] Asus TUF Dash F15 FX517ZR Intel Core i7-12650H 1.7GHz
UHD Graphics 64EUs
min:
10.5 fps, max:
20.2 fps
fps
UHD Graphics 64EUs:
11.3 [X] Asus TUF Dash F15 FX517ZR Intel Core i7-12650H 1.7GHz
UHD Graphics 64EUs
min:
8.6 fps, max:
15 fps
fps
100%
UHD Graphics Xe G4 48EUs:
12.1 [X] Acer Aspire 5 A515-56-P8NZ Dual-Channel
Intel Pentium Gold 7505 2GHz
UHD Graphics Xe G4 48EUs
min:
6.77 fps, P0.1:
6.8 fps, P1:
7.29 fps, max:
27.9 fps
fps
124%
Iris Xe G7 80EUs:
14 15.7 (!) [X] HP Envy 14-eb0252ng Intel Core i5-1135G7 2.4GHz
Iris Xe G7 80EUs
min:
8 fps
~ 15 fps
Iris Xe G7 80EUs:
13 13.6 (!) [X] HP Envy 14-eb0252ng Intel Core i5-1135G7 2.4GHz
Iris Xe G7 80EUs
min:
7 fps
~ 13 fps
Iris Xe G7 80EUs:
8 11 (!) [X] HP Envy 14-eb0252ng Intel Core i5-1135G7 2.4GHz
Iris Xe G7 80EUs
min:
3 fps
~ 10 fps
100%
UHD Graphics Xe G4 48EUs:
38.1 (!) [X] Acer Aspire 5 A515-56-P8NZ Dual-Channel
Intel Pentium Gold 7505 2GHz
UHD Graphics Xe G4 48EUs
min:
29.5 fps, max:
45.2 fps
fps
147%
UHD Graphics 64EUs:
56.1 [X] Asus TUF Dash F15 FX517ZR Intel Core i7-12650H 1.7GHz
UHD Graphics 64EUs
min:
43.1 fps, max:
66.6 fps
fps
100%
UHD Graphics Xe G4 48EUs:
29.4 (!) [X] Acer Aspire 5 A515-56-P8NZ Dual-Channel
Intel Pentium Gold 7505 2GHz
UHD Graphics Xe G4 48EUs
min:
23.2 fps, max:
34.8 fps
fps
141%
UHD Graphics 64EUs:
41.6 [X] Asus TUF Dash F15 FX517ZR Intel Core i7-12650H 1.7GHz
UHD Graphics 64EUs
min:
32 fps, max:
48.9 fps
fps
100%
UHD Graphics Xe G4 48EUs:
23.4 (!) [X] Acer Aspire 5 A515-56-P8NZ Dual-Channel
Intel Pentium Gold 7505 2GHz
UHD Graphics Xe G4 48EUs
min:
18.3 fps, max:
28.4 fps
fps
147%
UHD Graphics 64EUs:
34.4 [X] Asus TUF Dash F15 FX517ZR Intel Core i7-12650H 1.7GHz
UHD Graphics 64EUs
min:
29.1 fps, max:
39.7 fps
fps
UHD Graphics 64EUs:
25.3 [X] Asus TUF Dash F15 FX517ZR Intel Core i7-12650H 1.7GHz
UHD Graphics 64EUs
min:
20 fps, max:
30.1 fps
fps
UHD Graphics 64EUs:
20.2 [X] Asus TUF Dash F15 FX517ZR Intel Core i7-12650H 1.7GHz
UHD Graphics 64EUs
min:
16.5 fps, max:
23.5 fps
fps
100%
UHD Graphics Xe G4 48EUs:
18.5 [X] Acer Aspire 5 A515-56-P8NZ Dual-Channel
Intel Pentium Gold 7505 2GHz
UHD Graphics Xe G4 48EUs
min:
12.1 fps, P0.1:
12.4 fps, P1:
14.3 fps, max:
26.7 fps
fps
192%
UHD Graphics 64EUs:
35.5 [X] MSI Katana 17 B13VFK Intel Core i7-13620H 1.8GHz
UHD Graphics 64EUs
min:
15.3 fps, P0.1:
23.6 fps, P1:
27.5 fps, max:
66.6 fps
fps
130%
Iris Xe G7 80EUs:
23.4 [X] Dell Latitude 3520 Intel Core i5-1135G7 2.4GHz
Iris Xe G7 80EUs
min:
10.7 fps, P0.1:
11 fps, P1:
17.7 fps, max:
33.3 fps
24.7 [X] LG Gram 15Z90Q Intel Core i5-1240P 1.2GHz
Iris Xe G7 80EUs
min:
14.7 fps, P0.1:
14.7 fps, P1:
16.6 fps, max:
58.5 fps
~ 24 fps
100%
UHD Graphics Xe G4 48EUs:
14.8 [X] Acer Aspire 5 A515-56-P8NZ Dual-Channel
Intel Pentium Gold 7505 2GHz
UHD Graphics Xe G4 48EUs
min:
9.84 fps, P0.1:
10.4 fps, P1:
11.6 fps, max:
21 fps
fps
197%
UHD Graphics 64EUs:
29.1 [X] MSI Katana 17 B13VFK Intel Core i7-13620H 1.8GHz
UHD Graphics 64EUs
min:
12.4 fps, P0.1:
15.2 fps, P1:
20.1 fps, max:
72.2 fps
fps
115%
Iris Xe G7 80EUs:
14.7 [X] LG Gram 15Z90Q Intel Core i5-1240P 1.2GHz
Iris Xe G7 80EUs
min:
9.75 fps, P0.1:
9.98 fps, P1:
10.7 fps, max:
28.5 fps
19.5 [X] Dell Latitude 3520 Intel Core i5-1135G7 2.4GHz
Iris Xe G7 80EUs
min:
9.01 fps, P0.1:
10.8 fps, P1:
15 fps, max:
32.9 fps
~ 17 fps
100%
UHD Graphics Xe G4 48EUs:
13.6 [X] Acer Aspire 5 A515-56-P8NZ Dual-Channel
Intel Pentium Gold 7505 2GHz
UHD Graphics Xe G4 48EUs
min:
9.45 fps, P0.1:
9.95 fps, P1:
10.5 fps, max:
21 fps
fps
182%
UHD Graphics 64EUs:
24.7 [X] MSI Katana 17 B13VFK Intel Core i7-13620H 1.8GHz
UHD Graphics 64EUs
min:
11.4 fps, P0.1:
16.2 fps, P1:
19.7 fps, max:
62.1 fps
fps
103%
Iris Xe G7 80EUs:
11.8 [X] LG Gram 15Z90Q Intel Core i5-1240P 1.2GHz
Iris Xe G7 80EUs
min:
7.68 fps, P0.1:
8.16 fps, P1:
9.86 fps, max:
22.7 fps
16.9 [X] Dell Latitude 3520 Intel Core i5-1135G7 2.4GHz
Iris Xe G7 80EUs
min:
9.55 fps, P0.1:
10.7 fps, P1:
13.7 fps, max:
32.3 fps
~ 14 fps
100%
UHD Graphics Xe G4 48EUs:
11.2 [X] Acer Aspire 5 A515-56-P8NZ Dual-Channel
Intel Pentium Gold 7505 2GHz
UHD Graphics Xe G4 48EUs
min:
6.95 fps, P0.1:
7.62 fps, P1:
9.45 fps, max:
17 fps
fps
181%
UHD Graphics 64EUs:
20.3 [X] MSI Katana 17 B13VFK Intel Core i7-13620H 1.8GHz
UHD Graphics 64EUs
min:
10.3 fps, P0.1:
11.5 fps, P1:
14.7 fps, max:
59.9 fps
fps
119%
Iris Xe G7 80EUs:
13.3 [X] Dell Latitude 3520 Intel Core i5-1135G7 2.4GHz
Iris Xe G7 80EUs
min:
8.59 fps, P0.1:
9.06 fps, P1:
11.3 fps, max:
25.5 fps
fps
100%
UHD Graphics Xe G4 48EUs:
9.7 [X] Acer Aspire 5 A515-56-P8NZ Dual-Channel
Intel Pentium Gold 7505 2GHz
UHD Graphics Xe G4 48EUs
min:
3.02 fps, P0.1:
3.12 fps, P1:
3.46 fps, max:
95.3 fps
fps
124%
Iris Xe G7 80EUs:
11.3 11.7 [X] Acer Extensa 15 EX215-54-5103 Intel Core i5-1135G7 2.4GHz
Iris Xe G7 80EUs
min:
4.24 fps, P0.1:
4.25 fps, P1:
4.34 fps, max:
122 fps
~ 12 fps
Iris Xe G7 80EUs:
9.5 9.7 [X] Acer Extensa 15 EX215-54-5103 Intel Core i5-1135G7 2.4GHz
Iris Xe G7 80EUs
min:
3.36 fps, P0.1:
3.37 fps, P1:
3.55 fps, max:
117 fps
~ 10 fps
Iris Xe G7 80EUs:
8.5 8.6 [X] Acer Extensa 15 EX215-54-5103 Intel Core i5-1135G7 2.4GHz
Iris Xe G7 80EUs
min:
2.94 fps, P0.1:
2.98 fps, P1:
3.15 fps, max:
138 fps
~ 9 fps
100%
UHD Graphics Xe G4 48EUs:
18 [X] Lenovo IdeaPad 3 15ITL05 81X80074GE Intel Core i3-1115G4 3GHz
UHD Graphics Xe G4 48EUs
min:
12 fps, max:
21 fps
fps
183%
UHD Graphics 64EUs:
33 [X] Asus TUF Dash F15 FX517ZR Intel Core i7-12650H 1.7GHz
UHD Graphics 64EUs
min:
21 fps, max:
42 fps
fps
61%
Iris Xe G7 80EUs:
0 (!) [X] HP Envy 14-eb0252ng Intel Core i5-1135G7 2.4GHz
Iris Xe G7 80EUs
21 [X] Acer Extensa 15 EX215-54-5103 Intel Core i5-1135G7 2.4GHz
Iris Xe G7 80EUs
min:
16 fps, max:
27 fps
~ 11 fps
100%
UHD Graphics Xe G4 48EUs:
15 [X] Lenovo IdeaPad 3 15ITL05 81X80074GE Intel Core i3-1115G4 3GHz
UHD Graphics Xe G4 48EUs
min:
11 fps, max:
19 fps
fps
167%
UHD Graphics 64EUs:
25 [X] Asus TUF Dash F15 FX517ZR Intel Core i7-12650H 1.7GHz
UHD Graphics 64EUs
min:
16 fps, max:
32 fps
fps
67%
Iris Xe G7 80EUs:
0 (!) [X] HP Envy 14-eb0252ng Intel Core i5-1135G7 2.4GHz
Iris Xe G7 80EUs
19 [X] Acer Extensa 15 EX215-54-5103 Intel Core i5-1135G7 2.4GHz
Iris Xe G7 80EUs
min:
14 fps, max:
24 fps
~ 10 fps
100%
UHD Graphics Xe G4 48EUs:
14 [X] Lenovo IdeaPad 3 15ITL05 81X80074GE Intel Core i3-1115G4 3GHz
UHD Graphics Xe G4 48EUs
min:
10 fps, max:
18 fps
fps
171%
UHD Graphics 64EUs:
24 [X] Asus TUF Dash F15 FX517ZR Intel Core i7-12650H 1.7GHz
UHD Graphics 64EUs
min:
15 fps, max:
31 fps
fps
71%
Iris Xe G7 80EUs:
0 (!) [X] HP Envy 14-eb0252ng Intel Core i5-1135G7 2.4GHz
Iris Xe G7 80EUs
19 [X] Acer Extensa 15 EX215-54-5103 Intel Core i5-1135G7 2.4GHz
Iris Xe G7 80EUs
min:
12 fps, max:
23 fps
~ 10 fps
Iris Xe G7 80EUs:
13 [X] Acer Extensa 15 EX215-54-5103 Intel Core i5-1135G7 2.4GHz
Iris Xe G7 80EUs
min:
8 fps, max:
18 fps
fps
100%
UHD Graphics Xe G4 48EUs:
12.9 [X] Lenovo IdeaPad 3 15ITL05 81X80074GE Intel Core i3-1115G4 3GHz
UHD Graphics Xe G4 48EUs
min:
3.03 fps, P0.1:
3.34 fps, P1:
9.04 fps, max:
19.4 fps
fps
124%
UHD Graphics 64EUs:
13.1 [X] NiPoGi CK10 Intel Core i5-12450H 1.5GHz
UHD Graphics 64EUs
min:
8.88 fps, P0.1:
9.02 fps, P1:
10.1 fps, max:
20.8 fps
18.8 [X] Asus TUF Dash F15 FX517ZR Intel Core i7-12650H 1.7GHz
UHD Graphics 64EUs
min:
12.6 fps, P0.1:
12.8 fps, P1:
14.1 fps, max:
32.5 fps
~ 16 fps
140%
Iris Xe G7 80EUs:
14 15.7 17.6 [X] Acer TravelMate P4 TMP414-51-59MR Intel Core i5-1135G7 2.4GHz
Iris Xe G7 80EUs
min:
10.9 fps, P0.1:
11.5 fps, P1:
12.8 fps, max:
30.4 fps
21 21.1 ~ 18 fps
UHD Graphics 64EUs:
11.3 [X] NiPoGi CK10 Intel Core i5-12450H 1.5GHz
UHD Graphics 64EUs
min:
7.4 fps, P0.1:
7.53 fps, P1:
8.25 fps, max:
20.9 fps
16.6 [X] Asus TUF Dash F15 FX517ZR Intel Core i7-12650H 1.7GHz
UHD Graphics 64EUs
min:
11.1 fps, P0.1:
11.1 fps, P1:
12.7 fps, max:
28.7 fps
~ 14 fps
Iris Xe G7 80EUs:
13.5 14.3 [X] Acer TravelMate P4 TMP414-51-59MR Intel Core i5-1135G7 2.4GHz
Iris Xe G7 80EUs
min:
9.26 fps, P0.1:
9.47 fps, P1:
10.7 fps, max:
22 fps
14.6 17.9 18.9 ~ 16 fps
UHD Graphics 64EUs:
8.9 [X] NiPoGi CK10 Intel Core i5-12450H 1.5GHz
UHD Graphics 64EUs
min:
5.93 fps, P0.1:
5.96 fps, P1:
8.1 fps, max:
20.2 fps
13.2 [X] Asus TUF Dash F15 FX517ZR Intel Core i7-12650H 1.7GHz
UHD Graphics 64EUs
min:
8.36 fps, P0.1:
8.47 fps, P1:
9.64 fps, max:
32.6 fps
~ 11 fps
UHD Graphics 64EUs:
6.6 [X] NiPoGi CK10 Intel Core i5-12450H 1.5GHz
UHD Graphics 64EUs
min:
5.04 fps, P0.1:
5.1 fps, P1:
5.61 fps, max:
11.3 fps
fps
UHD Graphics 64EUs:
12.1 [X] Asus TUF Dash F15 FX517ZR Intel Core i7-12650H 1.7GHz
UHD Graphics 64EUs
min:
9.17 fps, P0.1:
9.22 fps, P1:
9.71 fps, max:
20.2 fps
fps
100%
UHD Graphics Xe G4 48EUs:
62.5 [X] Lenovo IdeaPad 3 15ITL05 81X80074GE Intel Core i3-1115G4 3GHz
UHD Graphics Xe G4 48EUs
min:
10.9 fps, P0.1:
11.7 fps, P1:
36.6 fps, max:
123 fps
fps
93%
Iris Xe G7 80EUs:
16 50 51 83.4 [X] Acer TravelMate P4 TMP414-51-59MR Intel Core i5-1135G7 2.4GHz
Iris Xe G7 80EUs
min:
10.6 fps, P0.1:
15.4 fps, P1:
26.5 fps, max:
147 fps
89 ~ 58 fps
100%
UHD Graphics Xe G4 48EUs:
20.3 [X] Lenovo IdeaPad 3 15ITL05 81X80074GE Intel Core i3-1115G4 3GHz
UHD Graphics Xe G4 48EUs
min:
3.21 fps, P0.1:
4 fps, P1:
6.33 fps, max:
91.1 fps
fps
143%
Iris Xe G7 80EUs:
18 28.8 [X] Acer TravelMate P4 TMP414-51-59MR Intel Core i5-1135G7 2.4GHz
Iris Xe G7 80EUs
min:
5.64 fps, P0.1:
5.99 fps, P1:
8.03 fps, max:
109 fps
32 38 ~ 29 fps
100%
UHD Graphics Xe G4 48EUs:
14.7 [X] Lenovo IdeaPad 3 15ITL05 81X80074GE Intel Core i3-1115G4 3GHz
UHD Graphics Xe G4 48EUs
min:
2.39 fps, P0.1:
2.91 fps, P1:
4.84 fps, max:
82.6 fps
fps
163%
Iris Xe G7 80EUs:
20.8 [X] Acer TravelMate P4 TMP414-51-59MR Intel Core i5-1135G7 2.4GHz
Iris Xe G7 80EUs
min:
3.38 fps, P0.1:
4.12 fps, P1:
5.35 fps, max:
93.1 fps
23 27 ~ 24 fps
100%
UHD Graphics Xe G4 48EUs:
14.4 [X] Lenovo IdeaPad 3 15ITL05 81X80074GE Intel Core i3-1115G4 3GHz
UHD Graphics Xe G4 48EUs
min:
5.21 fps, P0.1:
5.38 fps, P1:
6.83 fps, max:
32.9 fps
fps
208%
Iris Xe G7 80EUs:
29.9 [X] Acer TravelMate P4 TMP414-51-59MR Intel Core i5-1135G7 2.4GHz
Iris Xe G7 80EUs
min:
11.9 fps, P0.1:
15.9 fps, P1:
21 fps, max:
48 fps
fps
Iris Xe G7 80EUs:
14.3 [X] Acer TravelMate P4 TMP414-51-59MR Intel Core i5-1135G7 2.4GHz
Iris Xe G7 80EUs
min:
9.83 fps, P0.1:
10 fps, P1:
11.3 fps, max:
21.1 fps
fps
Iris Xe G7 80EUs:
12.4 [X] Acer TravelMate P4 TMP414-51-59MR Intel Core i5-1135G7 2.4GHz
Iris Xe G7 80EUs
min:
9.52 fps, P0.1:
9.72 fps, P1:
10.2 fps, max:
18.7 fps
fps
100%
UHD Graphics Xe G4 48EUs:
38 [X] Lenovo IdeaPad 3 15ITL05 81X80074GE Intel Core i3-1115G4 3GHz
UHD Graphics Xe G4 48EUs
fps
145%
UHD Graphics 64EUs:
55 [X] Asus TUF Dash F15 FX517ZR Intel Core i7-12650H 1.7GHz
UHD Graphics 64EUs
fps
137%
Iris Xe G7 80EUs:
50 [X] Acer Extensa 15 EX215-54-5103 Intel Core i5-1135G7 2.4GHz
Iris Xe G7 80EUs
53 [X] Acer TravelMate P4 TMP414-51-59MR Intel Core i5-1135G7 2.4GHz
Iris Xe G7 80EUs
~ 52 fps
100%
UHD Graphics Xe G4 48EUs:
15 [X] Lenovo IdeaPad 3 15ITL05 81X80074GE Intel Core i3-1115G4 3GHz
UHD Graphics Xe G4 48EUs
fps
167%
UHD Graphics 64EUs:
25 [X] Asus TUF Dash F15 FX517ZR Intel Core i7-12650H 1.7GHz
UHD Graphics 64EUs
fps
140%
Iris Xe G7 80EUs:
20 [X] Acer Extensa 15 EX215-54-5103 Intel Core i5-1135G7 2.4GHz
Iris Xe G7 80EUs
21 [X] Acer TravelMate P4 TMP414-51-59MR Intel Core i5-1135G7 2.4GHz
Iris Xe G7 80EUs
~ 21 fps
100%
UHD Graphics Xe G4 48EUs:
14 [X] Lenovo IdeaPad 3 15ITL05 81X80074GE Intel Core i3-1115G4 3GHz
UHD Graphics Xe G4 48EUs
fps
157%
UHD Graphics 64EUs:
22 [X] Asus TUF Dash F15 FX517ZR Intel Core i7-12650H 1.7GHz
UHD Graphics 64EUs
fps
143%
Iris Xe G7 80EUs:
19 [X] Acer Extensa 15 EX215-54-5103 Intel Core i5-1135G7 2.4GHz
Iris Xe G7 80EUs
20 [X] Acer TravelMate P4 TMP414-51-59MR Intel Core i5-1135G7 2.4GHz
Iris Xe G7 80EUs
~ 20 fps
100%
UHD Graphics Xe G4 48EUs:
19 [X] Lenovo IdeaPad 3 15ITL05 81X80074GE Intel Core i3-1115G4 3GHz
UHD Graphics Xe G4 48EUs
min:
13 fps, max:
25 fps
fps
158%
UHD Graphics 64EUs:
30 [X] Asus TUF Dash F15 FX517ZR Intel Core i7-12650H 1.7GHz
UHD Graphics 64EUs
min:
23 fps, max:
39 fps
fps
142%
Iris Xe G7 80EUs:
25 [X] Acer TravelMate P4 TMP414-51-59MR Intel Core i5-1135G7 2.4GHz
Iris Xe G7 80EUs
min:
15 fps, max:
33 fps
25 [X] Acer Extensa 15 EX215-54-5103 Intel Core i5-1135G7 2.4GHz
Iris Xe G7 80EUs
min:
20 fps, max:
33 fps
30 ~ 27 fps
UHD Graphics 64EUs:
19 [X] Asus TUF Dash F15 FX517ZR Intel Core i7-12650H 1.7GHz
UHD Graphics 64EUs
min:
16 fps, max:
23 fps
fps
Iris Xe G7 80EUs:
14 [X] Acer TravelMate P4 TMP414-51-59MR Intel Core i5-1135G7 2.4GHz
Iris Xe G7 80EUs
min:
11 fps, max:
18 fps
14 [X] Acer Extensa 15 EX215-54-5103 Intel Core i5-1135G7 2.4GHz
Iris Xe G7 80EUs
min:
12 fps, max:
19 fps
18 ~ 15 fps
UHD Graphics 64EUs:
15 [X] Asus TUF Dash F15 FX517ZR Intel Core i7-12650H 1.7GHz
UHD Graphics 64EUs
min:
12 fps, max:
19 fps
fps
Iris Xe G7 80EUs:
12 [X] Acer TravelMate P4 TMP414-51-59MR Intel Core i5-1135G7 2.4GHz
Iris Xe G7 80EUs
min:
9 fps, max:
15 fps
12 [X] Acer Extensa 15 EX215-54-5103 Intel Core i5-1135G7 2.4GHz
Iris Xe G7 80EUs
min:
10 fps, max:
15 fps
14 ~ 13 fps
UHD Graphics 64EUs:
13 [X] Asus TUF Dash F15 FX517ZR Intel Core i7-12650H 1.7GHz
UHD Graphics 64EUs
min:
11 fps, max:
17 fps
fps
Iris Xe G7 80EUs:
7 10 [X] Acer Extensa 15 EX215-54-5103 Intel Core i5-1135G7 2.4GHz
Iris Xe G7 80EUs
min:
8 fps, max:
13 fps
~ 9 fps
100%
UHD Graphics Xe G4 48EUs:
31.9 [X] Lenovo IdeaPad 3 14ITL6 82H700CCGE Intel Celeron 6305 1.8GHz
UHD Graphics Xe G4 48EUs
min:
5.1 fps, P0.1:
8.52 fps, P1:
15.7 fps, max:
217 fps
34.8 [X] Lenovo IdeaPad 3 15ITL05 81X80074GE Intel Core i3-1115G4 3GHz
UHD Graphics Xe G4 48EUs
min:
6.71 fps, P0.1:
11.6 fps, P1:
15.6 fps, max:
230 fps
34.9 [X] Acer Aspire 5 A515-56-P8NZ Dual-Channel
Intel Pentium Gold 7505 2GHz
UHD Graphics Xe G4 48EUs
min:
14.7 fps, P0.1:
15 fps, P1:
16.2 fps, max:
182.2 fps
~ 34 fps
135%
Iris Xe G7 80EUs:
43.8 47.2 [X] Acer Extensa 15 EX215-54-5103 Intel Core i5-1135G7 2.4GHz
Iris Xe G7 80EUs
min:
25 fps, P0.1:
26.1 fps, P1:
27.8 fps, max:
219 fps
~ 46 fps
100%
UHD Graphics Xe G4 48EUs:
14.3 [X] Lenovo IdeaPad 3 14ITL6 82H700CCGE Intel Celeron 6305 1.8GHz
UHD Graphics Xe G4 48EUs
min:
4.34 fps, P0.1:
4.96 fps, P1:
6.68 fps, max:
138.4 fps
18.2 [X] Lenovo IdeaPad 3 15ITL05 81X80074GE Intel Core i3-1115G4 3GHz
UHD Graphics Xe G4 48EUs
min:
8.65 fps, P0.1:
8.72 fps, P1:
9.33 fps, max:
112 fps
22.2 [X] Acer Aspire 5 A515-56-P8NZ Dual-Channel
Intel Pentium Gold 7505 2GHz
UHD Graphics Xe G4 48EUs
min:
9.72 fps, P0.1:
9.93 fps, P1:
10.4 fps, max:
171.8 fps
~ 18 fps
133%
Iris Xe G7 80EUs:
21.4 [X] Acer Extensa 15 EX215-54-5103 Intel Core i5-1135G7 2.4GHz
Iris Xe G7 80EUs
min:
6.24 fps, P0.1:
6.81 fps, P1:
8.97 fps, max:
143 fps
27.4 ~ 24 fps
100%
UHD Graphics Xe G4 48EUs:
12.9 [X] Lenovo IdeaPad 3 14ITL6 82H700CCGE Intel Celeron 6305 1.8GHz
UHD Graphics Xe G4 48EUs
min:
5.37 fps, P0.1:
5.6 fps, P1:
6.25 fps, max:
188.5 fps
14.9 [X] Lenovo IdeaPad 3 15ITL05 81X80074GE Intel Core i3-1115G4 3GHz
UHD Graphics Xe G4 48EUs
min:
6.77 fps, P0.1:
6.84 fps, P1:
7.58 fps, max:
161 fps
16.4 [X] Acer Aspire 5 A515-56-P8NZ Dual-Channel
Intel Pentium Gold 7505 2GHz
UHD Graphics Xe G4 48EUs
min:
8.25 fps, P0.1:
8.25 fps, P1:
8.38 fps, max:
100.3 fps
~ 15 fps
153%
Iris Xe G7 80EUs:
19.8 [X] Acer Extensa 15 EX215-54-5103 Intel Core i5-1135G7 2.4GHz
Iris Xe G7 80EUs
min:
9.02 fps, P0.1:
9.33 fps, P1:
10.1 fps, max:
110 fps
25.9 ~ 23 fps
100%
UHD Graphics Xe G4 48EUs:
13.2 [X] Acer Aspire 5 A515-56-P8NZ Dual-Channel
Intel Pentium Gold 7505 2GHz
UHD Graphics Xe G4 48EUs
min:
6.18 fps, P0.1:
6.23 fps, P1:
6.63 fps, max:
94.5 fps
fps
152%
Iris Xe G7 80EUs:
19.4 [X] Acer Extensa 15 EX215-54-5103 Intel Core i5-1135G7 2.4GHz
Iris Xe G7 80EUs
min:
9 fps, P0.1:
9.02 fps, P1:
9.65 fps, max:
135 fps
20.2 ~ 20 fps
100%
UHD Graphics Xe G4 48EUs:
24 [X] Acer Aspire 5 A515-56-P8NZ Intel Pentium Gold 7505 2GHz
UHD Graphics Xe G4 48EUs
min:
20 fps, max:
27 fps
fps
187%
UHD Graphics 64EUs:
44.8 [X] Asus TUF Dash F15 FX517ZR Intel Core i7-12650H 1.7GHz
UHD Graphics 64EUs
min:
37 fps, max:
48 fps
fps
0%
Iris Xe G7 80EUs:
0 (!) fps
100%
UHD Graphics Xe G4 48EUs:
12.4 [X] Acer Aspire 5 A515-56-P8NZ Intel Pentium Gold 7505 2GHz
UHD Graphics Xe G4 48EUs
min:
9 fps, max:
14 fps
fps
174%
UHD Graphics 64EUs:
21.6 [X] Asus TUF Dash F15 FX517ZR Intel Core i7-12650H 1.7GHz
UHD Graphics 64EUs
min:
18 fps, max:
23 fps
fps
100%
UHD Graphics Xe G4 48EUs:
11.2 [X] Acer Aspire 5 A515-56-P8NZ Intel Pentium Gold 7505 2GHz
UHD Graphics Xe G4 48EUs
min:
10 fps, max:
12 fps
fps
156%
UHD Graphics 64EUs:
17.5 [X] Asus TUF Dash F15 FX517ZR Intel Core i7-12650H 1.7GHz
UHD Graphics 64EUs
min:
16 fps, max:
19 fps
fps
UHD Graphics 64EUs:
14.7 [X] Asus TUF Dash F15 FX517ZR Intel Core i7-12650H 1.7GHz
UHD Graphics 64EUs
min:
13 fps, max:
17 fps
fps
100%
UHD Graphics Xe G4 48EUs:
34.9 [X] Lenovo IdeaPad 3 15ITL05 81X80074GE Intel Core i3-1115G4 3GHz
UHD Graphics Xe G4 48EUs
min:
6.66 fps, P0.1:
8.69 fps, P1:
28.6 fps, max:
85 fps
fps
140%
Iris Xe G7 80EUs:
48.3 [X] Acer Extensa 15 EX215-54-5103 Intel Core i5-1135G7 2.4GHz
Iris Xe G7 80EUs
min:
25.7 fps, P0.1:
30.2 fps, P1:
35.4 fps, max:
77.3 fps
49.5 [X] Acer TravelMate P4 TMP414-51-59MR Intel Core i5-1135G7 2.4GHz
Iris Xe G7 80EUs
min:
7.58 fps, P0.1:
10 fps, P1:
38.8 fps, max:
112 fps
~ 49 fps
100%
UHD Graphics Xe G4 48EUs:
16.3 [X] Lenovo IdeaPad 3 15ITL05 81X80074GE Intel Core i3-1115G4 3GHz
UHD Graphics Xe G4 48EUs
min:
5.52 fps, P0.1:
7.33 fps, P1:
13.6 fps, max:
52.6 fps
fps
129%
Iris Xe G7 80EUs:
20.4 [X] Acer Extensa 15 EX215-54-5103 Intel Core i5-1135G7 2.4GHz
Iris Xe G7 80EUs
min:
7.43 fps, P0.1:
10.6 fps, P1:
17 fps, max:
55.7 fps
21.3 [X] Acer TravelMate P4 TMP414-51-59MR Intel Core i5-1135G7 2.4GHz
Iris Xe G7 80EUs
min:
7.42 fps, P0.1:
8.03 fps, P1:
17.9 fps, max:
70.5 fps
~ 21 fps
100%
UHD Graphics Xe G4 48EUs:
12.5 [X] Lenovo IdeaPad 3 15ITL05 81X80074GE Intel Core i3-1115G4 3GHz
UHD Graphics Xe G4 48EUs
min:
6.28 fps, P0.1:
6.29 fps, P1:
10.4 fps, max:
36.3 fps
fps
128%
Iris Xe G7 80EUs:
15.5 [X] Acer Extensa 15 EX215-54-5103 Intel Core i5-1135G7 2.4GHz
Iris Xe G7 80EUs
min:
6.97 fps, P0.1:
7.02 fps, P1:
12.8 fps, max:
38.1 fps
16 [X] Acer TravelMate P4 TMP414-51-59MR Intel Core i5-1135G7 2.4GHz
Iris Xe G7 80EUs
min:
7.5 fps, P0.1:
7.51 fps, P1:
13.2 fps, max:
48.3 fps
~ 16 fps
100%
UHD Graphics Xe G4 48EUs:
19.7 [X] Acer Aspire 5 A515-56-P8NZ Dual-Channel
Intel Pentium Gold 7505 2GHz
UHD Graphics Xe G4 48EUs
min:
7.09 fps, P0.1:
7.48 fps, P1:
10.8 fps, max:
67.9 fps
fps
149%
Iris Xe G7 80EUs:
29.4 [X] Acer TravelMate P4 TMP414-51-59MR Intel Core i5-1135G7 2.4GHz
Iris Xe G7 80EUs
min:
11.2 fps, P0.1:
13.1 fps, P1:
17.7 fps, max:
69.6 fps
fps
Iris Xe G7 80EUs:
13 [X] Acer TravelMate P4 TMP414-51-59MR Intel Core i5-1135G7 2.4GHz
Iris Xe G7 80EUs
min:
6.64 fps, P0.1:
7.18 fps, P1:
10.2 fps, max:
20.5 fps
fps
100%
UHD Graphics Xe G4 48EUs:
42 [X] Lenovo IdeaPad 3 14ITL6 82H700CCGE 874931, Dual-Channel
Intel Celeron 6305 1.8GHz
UHD Graphics Xe G4 48EUs
min:
5 fps, P1:
11 fps, max:
58 fps
60.4 ~ 51 fps
157%
UHD Graphics 64EUs:
68.4 [X] NiPoGi CK10 874931
Intel Core i5-12450H 1.5GHz
UHD Graphics 64EUs
min:
49 fps, P1:
49 fps, max:
79 fps
69.2 [X] Geekom Mini IT12 874931
Intel Core i5-12450H 1.5GHz
UHD Graphics 64EUs
min:
52 fps, P1:
52 fps, max:
80 fps
71.5 76.9 [X] NiPoGi AD08 874931
Intel Core i7-12650H 1.7GHz
UHD Graphics 64EUs
min:
61 fps, P1:
62 fps, max:
90 fps
82.9 [X] NiPoGi AD08 874931
Intel Core i7-12650H 1.7GHz
UHD Graphics 64EUs
min:
66 fps, P1:
63 fps, max:
95 fps
84.8 [X] NiPoGi AD08 874931
Intel Core i7-12650H 1.7GHz
UHD Graphics 64EUs
min:
66 fps, P1:
62 fps, max:
97 fps
92.1 96.3 [X] Asus TUF Dash F15 FX517ZR 874931
Intel Core i7-12650H 1.7GHz
UHD Graphics 64EUs
min:
76 fps, P1:
74 fps, max:
111 fps
~ 80 fps
125%
Iris Xe G7 80EUs:
0 (!) 15.6 41.5 44.3 48.1 48.3 66.7 69.1 71.1 [X] Dell Inspiron 15 5518-2X3JR 803111
Intel Core i5-11300H 3.1GHz
Iris Xe G7 80EUs
min:
60 fps, P1:
54 fps, max:
82 fps
72.5 [X] Acer Extensa 15 EX215-54-5103 843175, Dual-Channel
Intel Core i5-1135G7 2.4GHz
Iris Xe G7 80EUs
min:
59 fps, P1:
52 fps, max:
83 fps
73 73.1 [X] LG Gram 17 (2022) 874931
Intel Core i5-1240P 1.2GHz
Iris Xe G7 80EUs
min:
54 fps, P1:
52 fps, max:
85 fps
73.1 77 77.5 [X] LG Gram 17 (2022) 874931, Hoch
Intel Core i5-1240P 1.2GHz
Iris Xe G7 80EUs
min:
56 fps, P1:
54 fps, max:
95 fps
77.8 [X] Acer TravelMate P4 TMP414-51-59MR 831795, Dual-Channel
Intel Core i5-1135G7 2.4GHz
Iris Xe G7 80EUs
min:
58 fps, P1:
58 fps, max:
88 fps
80.9 101.1 102 (!) ~ 64 fps
100%
UHD Graphics Xe G4 48EUs:
19.2 [X] Lenovo IdeaPad 3 14ITL6 82H700CCGE 874931, Dual-Channel
Intel Celeron 6305 1.8GHz
UHD Graphics Xe G4 48EUs
min:
1 fps, P1:
4 fps, max:
31 fps
fps
188%
UHD Graphics 64EUs:
30.4 [X] NiPoGi CK10 874931
Intel Core i5-12450H 1.5GHz
UHD Graphics 64EUs
min:
25 fps, P1:
23 fps, max:
34 fps
31.1 [X] Geekom Mini IT12 874931
Intel Core i5-12450H 1.5GHz
UHD Graphics 64EUs
min:
26 fps, P1:
23 fps, max:
34 fps
31.4 34.8 [X] NiPoGi AD08 874931
Intel Core i7-12650H 1.7GHz
UHD Graphics 64EUs
min:
30 fps, P1:
26 fps, max:
39 fps
38 [X] NiPoGi AD08 874931
Intel Core i7-12650H 1.7GHz
UHD Graphics 64EUs
min:
31 fps, P1:
27 fps, max:
43 fps
39 [X] NiPoGi AD08 874931
Intel Core i7-12650H 1.7GHz
UHD Graphics 64EUs
min:
32 fps, P1:
21 fps, max:
45 fps
42.6 44.1 [X] Asus TUF Dash F15 FX517ZR 874931
Intel Core i7-12650H 1.7GHz
UHD Graphics 64EUs
min:
14 fps, P1:
35 fps, max:
51 fps
~ 36 fps
172%
Iris Xe G7 80EUs:
20.1 26.3 28.7 31.4 [X] LG Gram 17 (2022) 874931
Intel Core i5-1240P 1.2GHz
Iris Xe G7 80EUs
min:
22 fps, P1:
21 fps, max:
37 fps
33.9 [X] LG Gram 17 (2022) 874931, Hoch
Intel Core i5-1240P 1.2GHz
Iris Xe G7 80EUs
min:
25 fps, P1:
24 fps, max:
39 fps
34 34.3 35.8 [X] Acer TravelMate P4 TMP414-51-59MR 831795, Dual-Channel
Intel Core i5-1135G7 2.4GHz
Iris Xe G7 80EUs
min:
29 fps, P1:
29 fps, max:
41 fps
36 [X] Acer Extensa 15 EX215-54-5103 843175, Dual-Channel
Intel Core i5-1135G7 2.4GHz
Iris Xe G7 80EUs
min:
29 fps, P1:
28 fps, max:
40 fps
36.2 [X] Dell Inspiron 15 5518-2X3JR 803111
Intel Core i5-11300H 3.1GHz
Iris Xe G7 80EUs
min:
30 fps, P1:
29 fps, max:
40 fps
36.4 42.9 ~ 33 fps
UHD Graphics 64EUs:
24.4 [X] NiPoGi CK10 874931
Intel Core i5-12450H 1.5GHz
UHD Graphics 64EUs
min:
20 fps, P1:
20 fps, max:
26 fps
24.8 [X] Geekom Mini IT12 874931
Intel Core i5-12450H 1.5GHz
UHD Graphics 64EUs
min:
21 fps, P1:
19 fps, max:
27 fps
25.2 27.6 [X] NiPoGi AD08 874931
Intel Core i7-12650H 1.7GHz
UHD Graphics 64EUs
min:
23 fps, P1:
21 fps, max:
30 fps
30.3 [X] NiPoGi AD08 874931
Intel Core i7-12650H 1.7GHz
UHD Graphics 64EUs
min:
25 fps, P1:
23 fps, max:
33 fps
30.7 [X] NiPoGi AD08 874931
Intel Core i7-12650H 1.7GHz
UHD Graphics 64EUs
min:
25 fps, P1:
18 fps, max:
33 fps
33.2 35.4 [X] Asus TUF Dash F15 FX517ZR 874931
Intel Core i7-12650H 1.7GHz
UHD Graphics 64EUs
min:
29 fps, P1:
29 fps, max:
38 fps
~ 29 fps
Iris Xe G7 80EUs:
18.1 24.4 26.2 26.4 [X] LG Gram 17 (2022) 874931
Intel Core i5-1240P 1.2GHz
Iris Xe G7 80EUs
min:
19 fps, P1:
19 fps, max:
30 fps
26.5 28 28.2 [X] LG Gram 17 (2022) 874931, Hoch
Intel Core i5-1240P 1.2GHz
Iris Xe G7 80EUs
min:
22 fps, P1:
22 fps, max:
32 fps
28.5 [X] Acer Extensa 15 EX215-54-5103 843175, Dual-Channel
Intel Core i5-1135G7 2.4GHz
Iris Xe G7 80EUs
min:
23 fps, P1:
22 fps, max:
31 fps
28.7 [X] Dell Inspiron 15 5518-2X3JR 803111
Intel Core i5-11300H 3.1GHz
Iris Xe G7 80EUs
min:
24 fps, P1:
23 fps, max:
32 fps
28.9 [X] Acer TravelMate P4 TMP414-51-59MR 831795, Dual-Channel
Intel Core i5-1135G7 2.4GHz
Iris Xe G7 80EUs
min:
23 fps, P1:
23 fps, max:
32 fps
30.1 32.5 ~ 27 fps
UHD Graphics 64EUs:
16 [X] NiPoGi CK10 874931
Intel Core i5-12450H 1.5GHz
UHD Graphics 64EUs
min:
13 fps, P1:
12 fps, max:
18 fps
16.1 [X] Geekom Mini IT12 874931
Intel Core i5-12450H 1.5GHz
UHD Graphics 64EUs
min:
13 fps, P1:
12 fps, max:
18 fps
16.2 19.7 [X] NiPoGi AD08 874931
Intel Core i7-12650H 1.7GHz
UHD Graphics 64EUs
min:
16 fps, P1:
15 fps, max:
22 fps
20.7 [X] NiPoGi AD08 874931
Intel Core i7-12650H 1.7GHz
UHD Graphics 64EUs
min:
17 fps, P1:
16 fps, max:
23 fps
20.9 [X] NiPoGi AD08 874931
Intel Core i7-12650H 1.7GHz
UHD Graphics 64EUs
min:
16 fps, P1:
13 fps, max:
23 fps
22.5 24.1 [X] Asus TUF Dash F15 FX517ZR 874931
Intel Core i7-12650H 1.7GHz
UHD Graphics 64EUs
min:
19 fps, P1:
19 fps, max:
27 fps
~ 20 fps
Iris Xe G7 80EUs:
13.1 15 16.1 18.3 [X] LG Gram 17 (2022) 874931
Intel Core i5-1240P 1.2GHz
Iris Xe G7 80EUs
min:
13 fps, P1:
13 fps, max:
22 fps
18.6 [X] LG Gram 17 (2022) 874931, Hoch
Intel Core i5-1240P 1.2GHz
Iris Xe G7 80EUs
min:
14 fps, P1:
14 fps, max:
21 fps
18.8 18.9 19.4 [X] Acer Extensa 15 EX215-54-5103 843175, Dual-Channel
Intel Core i5-1135G7 2.4GHz
Iris Xe G7 80EUs
min:
15 fps, P1:
15 fps, max:
21 fps
19.9 [X] Acer TravelMate P4 TMP414-51-59MR 831795, Dual-Channel
Intel Core i5-1135G7 2.4GHz
Iris Xe G7 80EUs
min:
16 fps, P1:
16 fps, max:
22 fps
23.2 ~ 18 fps
Iris Xe G7 80EUs:
12.3 [X] LG Gram 17 (2022) 874931
Intel Core i5-1240P 1.2GHz
Iris Xe G7 80EUs
min:
5 fps, P1:
8 fps, max:
15 fps
fps
100%
UHD Graphics Xe G4 48EUs:
37.3 [X] Lenovo IdeaPad 3 14ITL6 82H700CCGE Intel Celeron 6305 1.8GHz
UHD Graphics Xe G4 48EUs
min:
17.4 fps, P0.1:
23.2 fps, P1:
27.1 fps, max:
56.1 fps
50.9 [X] Lenovo IdeaPad 3 15ITL05 81X80074GE Intel Core i3-1115G4 3GHz
UHD Graphics Xe G4 48EUs
min:
37.7 fps, P0.1:
38.5 fps, P1:
39.8 fps, max:
68.5 fps
~ 44 fps
139%
Iris Xe G7 80EUs:
51.3 57.3 [X] Dell Inspiron 15 5518-2X3JR Intel Core i5-11300H 3.1GHz
Iris Xe G7 80EUs
min:
39.3 fps, P0.1:
40.2 fps, P1:
43.9 fps, max:
82.3 fps
75.2 ~ 61 fps
100%
UHD Graphics Xe G4 48EUs:
23.6 [X] Lenovo IdeaPad 3 14ITL6 82H700CCGE Intel Celeron 6305 1.8GHz
UHD Graphics Xe G4 48EUs
min:
12.7 fps, P0.1:
14.8 fps, P1:
18.9 fps, max:
44.8 fps
28.4 [X] Lenovo IdeaPad 3 15ITL05 81X80074GE Intel Core i3-1115G4 3GHz
UHD Graphics Xe G4 48EUs
min:
23.3 fps, P0.1:
23.5 fps, P1:
24.1 fps, max:
35.2 fps
~ 26 fps
138%
Iris Xe G7 80EUs:
25.8 30.7 [X] Dell Inspiron 15 5518-2X3JR Intel Core i5-11300H 3.1GHz
Iris Xe G7 80EUs
min:
22.6 fps, P0.1:
22.8 fps, P1:
24.2 fps, max:
40.3 fps
50.1 ~ 36 fps
100%
UHD Graphics Xe G4 48EUs:
17.9 [X] Lenovo IdeaPad 3 14ITL6 82H700CCGE Intel Celeron 6305 1.8GHz
UHD Graphics Xe G4 48EUs
min:
6.27 fps, P0.1:
7.1 fps, P1:
11.2 fps, max:
22.5 fps
22.9 [X] Lenovo IdeaPad 3 15ITL05 81X80074GE Intel Core i3-1115G4 3GHz
UHD Graphics Xe G4 48EUs
min:
19 fps, P0.1:
19.3 fps, P1:
19.7 fps, max:
27.9 fps
~ 20 fps
150%
Iris Xe G7 80EUs:
21.6 25 [X] Dell Inspiron 15 5518-2X3JR Intel Core i5-11300H 3.1GHz
Iris Xe G7 80EUs
min:
19.7 fps, P0.1:
19.8 fps, P1:
21.2 fps, max:
31.8 fps
43.3 ~ 30 fps
100%
UHD Graphics Xe G4 48EUs:
18.8 [X] Acer Aspire 5 A515-56-P8NZ Dual-Channel
Intel Pentium Gold 7505 2GHz
UHD Graphics Xe G4 48EUs
min:
1.447 fps, P0.1:
1.91 fps, P1:
7.81 fps, max:
42.7 fps
fps
128%
Iris Xe G7 80EUs:
24 fps
100%
UHD Graphics Xe G4 48EUs:
11 [X] Acer Aspire 5 A515-56-P8NZ Dual-Channel
Intel Pentium Gold 7505 2GHz
UHD Graphics Xe G4 48EUs
min:
4.93 fps, P0.1:
5.44 fps, P1:
6.58 fps, max:
37 fps
fps
170%
Iris Xe G7 80EUs:
18.7 fps
Iris Xe G7 80EUs:
16.6 fps
Iris Xe G7 80EUs:
12.2 fps
100%
UHD Graphics Xe G4 48EUs:
33.3 [X] Lenovo IdeaPad 3 15ITL05 81X80074GE Intel Core i3-1115G4 3GHz
UHD Graphics Xe G4 48EUs
min:
12.2 fps, P0.1:
13 fps, P1:
19.6 fps, max:
59.8 fps
fps
147%
Iris Xe G7 80EUs:
49 fps
100%
UHD Graphics Xe G4 48EUs:
21.6 [X] Lenovo IdeaPad 3 15ITL05 81X80074GE Intel Core i3-1115G4 3GHz
UHD Graphics Xe G4 48EUs
min:
12.8 fps, P0.1:
13.6 fps, P1:
16 fps, max:
37.3 fps
fps
150%
Iris Xe G7 80EUs:
32.4 fps
Iris Xe G7 80EUs:
31.2 fps
Iris Xe G7 80EUs:
20.6 fps
Iris Xe G7 80EUs:
32.9 fps
Iris Xe G7 80EUs:
26.1 fps
Iris Xe G7 80EUs:
22.4 fps
Iris Xe G7 80EUs:
20.8 fps
100%
UHD Graphics Xe G4 48EUs:
42.1 [X] Lenovo IdeaPad 3 15ITL05 81X80074GE Intel Core i3-1115G4 3GHz
UHD Graphics Xe G4 48EUs
fps
169%
UHD Graphics 64EUs:
71 [X] Asus TUF Dash F15 FX517ZR Intel Core i7-12650H 1.7GHz
UHD Graphics 64EUs
fps
164%
Iris Xe G7 80EUs:
56.3 [X] Acer TravelMate P4 TMP414-51-59MR Intel Core i5-1135G7 2.4GHz
Iris Xe G7 80EUs
82.3 ~ 69 fps
100%
UHD Graphics Xe G4 48EUs:
16.2 [X] Lenovo IdeaPad 3 15ITL05 81X80074GE Intel Core i3-1115G4 3GHz
UHD Graphics Xe G4 48EUs
fps
191%
UHD Graphics 64EUs:
30.9 [X] Asus TUF Dash F15 FX517ZR Intel Core i7-12650H 1.7GHz
UHD Graphics 64EUs
fps
173%
Iris Xe G7 80EUs:
21.7 [X] Acer TravelMate P4 TMP414-51-59MR Intel Core i5-1135G7 2.4GHz
Iris Xe G7 80EUs
35.2 ~ 28 fps
100%
UHD Graphics Xe G4 48EUs:
15.7 [X] Lenovo IdeaPad 3 15ITL05 81X80074GE Intel Core i3-1115G4 3GHz
UHD Graphics Xe G4 48EUs
fps
157%
UHD Graphics 64EUs:
24.6 [X] Asus TUF Dash F15 FX517ZR Intel Core i7-12650H 1.7GHz
UHD Graphics 64EUs
fps
153%
Iris Xe G7 80EUs:
19.4 [X] Acer TravelMate P4 TMP414-51-59MR Intel Core i5-1135G7 2.4GHz
Iris Xe G7 80EUs
28.5 ~ 24 fps
UHD Graphics 64EUs:
22.5 [X] Asus TUF Dash F15 FX517ZR Intel Core i7-12650H 1.7GHz
UHD Graphics 64EUs
fps
Iris Xe G7 80EUs:
17.2 [X] Acer TravelMate P4 TMP414-51-59MR Intel Core i5-1135G7 2.4GHz
Iris Xe G7 80EUs
23.9 ~ 21 fps
UHD Graphics 64EUs:
13.8 [X] Asus TUF Dash F15 FX517ZR Intel Core i7-12650H 1.7GHz
UHD Graphics 64EUs
fps
100%
UHD Graphics Xe G4 48EUs:
14.5 [X] Lenovo IdeaPad 3 15ITL05 81X80074GE Intel Core i3-1115G4 3GHz
UHD Graphics Xe G4 48EUs
min:
3.49 fps, P0.1:
4.67 fps, P1:
6.7 fps, max:
37.9 fps
fps
Iris Xe G7 80EUs:
10.5 fps
100%
UHD Graphics Xe G4 48EUs:
20 [X] Lenovo IdeaPad 3 15ITL05 81X80074GE Intel Core i3-1115G4 3GHz
UHD Graphics Xe G4 48EUs
min:
10 fps, max:
29 fps
fps
180%
Iris Xe G7 80EUs:
36 fps
100%
UHD Graphics Xe G4 48EUs:
12 [X] Lenovo IdeaPad 3 15ITL05 81X80074GE Intel Core i3-1115G4 3GHz
UHD Graphics Xe G4 48EUs
min:
7 fps, max:
19 fps
fps
183%
Iris Xe G7 80EUs:
22 fps
100%
UHD Graphics Xe G4 48EUs:
25.1 [X] Lenovo IdeaPad 3 15ITL05 81X80074GE Intel Core i3-1115G4 3GHz
UHD Graphics Xe G4 48EUs
min:
12.9 fps, P0.1:
13 fps, P1:
13.8 fps, max:
40 fps
fps
129%
Iris Xe G7 80EUs:
32.5 fps
100%
UHD Graphics Xe G4 48EUs:
9.5 [X] Lenovo IdeaPad 3 15ITL05 81X80074GE Intel Core i3-1115G4 3GHz
UHD Graphics Xe G4 48EUs
min:
4.24 fps, P0.1:
4.55 fps, P1:
7.45 fps, max:
23 fps
fps
171%
Iris Xe G7 80EUs:
16.3 fps
Iris Xe G7 80EUs:
14.6 fps
Iris Xe G7 80EUs:
12.4 fps
100%
UHD Graphics Xe G4 48EUs:
21 [X] Lenovo IdeaPad 3 15ITL05 81X80074GE Intel Core i3-1115G4 3GHz
UHD Graphics Xe G4 48EUs
min:
8 fps, max:
42 fps
fps
148%
UHD Graphics 64EUs:
31 [X] Asus TUF Dash F15 FX517ZR Intel Core i7-12650H 1.7GHz
UHD Graphics 64EUs
min:
22 fps, P0.1:
23 fps, P1:
24 fps, max:
142 fps
fps
148%
Iris Xe G7 80EUs:
31 fps
100%
UHD Graphics Xe G4 48EUs:
12 [X] Lenovo IdeaPad 3 15ITL05 81X80074GE Intel Core i3-1115G4 3GHz
UHD Graphics Xe G4 48EUs
min:
7 fps, max:
20 fps
fps
150%
UHD Graphics 64EUs:
18 [X] Asus TUF Dash F15 FX517ZR Intel Core i7-12650H 1.7GHz
UHD Graphics 64EUs
min:
14 fps, P0.1:
14 fps, P1:
15 fps, max:
107 fps
fps
158%
Iris Xe G7 80EUs:
19 fps
UHD Graphics 64EUs:
15 [X] Asus TUF Dash F15 FX517ZR Intel Core i7-12650H 1.7GHz
UHD Graphics 64EUs
min:
11 fps, P0.1:
11 fps, P1:
12 fps, max:
82 fps
fps
100%
UHD Graphics Xe G4 48EUs:
26.1 [X] Lenovo IdeaPad 3 15ITL05 81X80074GE Intel Core i3-1115G4 3GHz
UHD Graphics Xe G4 48EUs
min:
20.3 fps, P0.1:
21.2 fps, P1:
22.2 fps, max:
30.8 fps
fps
159%
UHD Graphics 64EUs:
41.4 [X] Asus TUF Dash F15 FX517ZR Intel Core i7-12650H 1.7GHz
UHD Graphics 64EUs
min:
30 fps, P0.1:
31.5 fps, P1:
35.1 fps, max:
51.7 fps
fps
100%
UHD Graphics Xe G4 48EUs:
11.6 [X] Lenovo IdeaPad 3 15ITL05 81X80074GE Intel Core i3-1115G4 3GHz
UHD Graphics Xe G4 48EUs
min:
8.5 fps, P0.1:
9 fps, P1:
9.7 fps, max:
14.1 fps
fps
152%
UHD Graphics 64EUs:
17.6 [X] Asus TUF Dash F15 FX517ZR Intel Core i7-12650H 1.7GHz
UHD Graphics 64EUs
min:
13.5 fps, P0.1:
13.8 fps, P1:
14.3 fps, max:
22.7 fps
fps
UHD Graphics 64EUs:
14.6 [X] Asus TUF Dash F15 FX517ZR Intel Core i7-12650H 1.7GHz
UHD Graphics 64EUs
min:
11.1 fps, P0.1:
11.4 fps, P1:
12 fps, max:
18.2 fps
fps
Iris Xe G7 80EUs:
26 [X] Acer Extensa 15 EX215-54-5103 Intel Core i5-1135G7 2.4GHz
Iris Xe G7 80EUs
min:
17.05 fps, P1:
20.77 fps, max:
35.7 fps
28.6 [X] Dell Inspiron 15 5518-2X3JR Intel Core i5-11300H 3.1GHz
Iris Xe G7 80EUs
min:
17.29 fps, P1:
22.57 fps, max:
39.2 fps
~ 27 fps
Iris Xe G7 80EUs:
15.2 [X] Acer Extensa 15 EX215-54-5103 Intel Core i5-1135G7 2.4GHz
Iris Xe G7 80EUs
min:
6.91 fps, P1:
11.84 fps, max:
31.68 fps
16.4 [X] Dell Inspiron 15 5518-2X3JR Intel Core i5-11300H 3.1GHz
Iris Xe G7 80EUs
min:
8.8 fps, P1:
12.66 fps, max:
21.3 fps
~ 16 fps
Iris Xe G7 80EUs:
13.3 [X] Acer Extensa 15 EX215-54-5103 Intel Core i5-1135G7 2.4GHz
Iris Xe G7 80EUs
min:
7.57 fps, P1:
10.14 fps, max:
29.07 fps
13.9 [X] Dell Inspiron 15 5518-2X3JR Intel Core i5-11300H 3.1GHz
Iris Xe G7 80EUs
min:
9.16 fps, P1:
10.75 fps, max:
19.28 fps
~ 14 fps
Iris Xe G7 80EUs:
113 [X] Dell Inspiron 15 5518-2X3JR Intel Core i5-11300H 3.1GHz
Iris Xe G7 80EUs
min:
63.9 fps, P0.1:
67.9 fps, P1:
74.3 fps, max:
173 fps
fps
Iris Xe G7 80EUs:
62.1 [X] Dell Inspiron 15 5518-2X3JR Intel Core i5-11300H 3.1GHz
Iris Xe G7 80EUs
min:
40.3 fps, P0.1:
42.4 fps, P1:
45 fps, max:
118 fps
fps
Iris Xe G7 80EUs:
49.3 [X] Dell Inspiron 15 5518-2X3JR Intel Core i5-11300H 3.1GHz
Iris Xe G7 80EUs
min:
35.1 fps, P0.1:
36.4 fps, P1:
38.8 fps, max:
82 fps
fps
Iris Xe G7 80EUs:
38.4 [X] Dell Inspiron 15 5518-2X3JR Intel Core i5-11300H 3.1GHz
Iris Xe G7 80EUs
min:
27.3 fps, P0.1:
30.8 fps, P1:
33.5 fps, max:
58.2 fps
fps
100%
UHD Graphics Xe G4 48EUs:
62.5 [X] Lenovo IdeaPad 3 15ITL05 81X80074GE Intel Core i3-1115G4 3GHz
UHD Graphics Xe G4 48EUs
min:
19.4 fps, P0.1:
25.6 fps, P1:
36.4 fps, max:
123 fps
fps
128%
Iris Xe G7 80EUs:
68.7 [X] Acer Extensa 15 EX215-54-5103 Intel Core i5-1135G7 2.4GHz
Iris Xe G7 80EUs
min:
27.9 fps, P0.1:
34.4 fps, P1:
42.3 fps, max:
123 fps
91.5 ~ 80 fps
100%
UHD Graphics Xe G4 48EUs:
27.2 [X] Lenovo IdeaPad 3 15ITL05 81X80074GE Intel Core i3-1115G4 3GHz
UHD Graphics Xe G4 48EUs
min:
12.2 fps, P0.1:
12.7 fps, P1:
15 fps, max:
82.9 fps
fps
121%
Iris Xe G7 80EUs:
28.6 [X] Acer Extensa 15 EX215-54-5103 Intel Core i5-1135G7 2.4GHz
Iris Xe G7 80EUs
min:
10.1 fps, P0.1:
13.9 fps, P1:
16.6 fps, max:
82.2 fps
38 ~ 33 fps
100%
UHD Graphics Xe G4 48EUs:
24.3 [X] Lenovo IdeaPad 3 15ITL05 81X80074GE Intel Core i3-1115G4 3GHz
UHD Graphics Xe G4 48EUs
min:
11.1 fps, P0.1:
12.1 fps, P1:
15.4 fps, max:
77.4 fps
fps
119%
Iris Xe G7 80EUs:
26.4 [X] Acer Extensa 15 EX215-54-5103 Intel Core i5-1135G7 2.4GHz
Iris Xe G7 80EUs
min:
11.3 fps, P0.1:
11.8 fps, P1:
15.4 fps, max:
86.8 fps
32.3 ~ 29 fps
100%
UHD Graphics Xe G4 48EUs:
22.6 [X] Lenovo IdeaPad 3 15ITL05 81X80074GE Intel Core i3-1115G4 3GHz
UHD Graphics Xe G4 48EUs
min:
11.1 fps, P0.1:
11.5 fps, P1:
14.3 fps, max:
64.6 fps
fps
119%
Iris Xe G7 80EUs:
25.8 [X] Acer Extensa 15 EX215-54-5103 Intel Core i5-1135G7 2.4GHz
Iris Xe G7 80EUs
29 ~ 27 fps
100%
UHD Graphics Xe G4 48EUs:
16.1 [X] HP Pavilion x360 14-dw1xxx Intel Pentium Gold 7505 2GHz
UHD Graphics Xe G4 48EUs
min:
12 fps, P0.1:
12.1 fps, P1:
13.9 fps, max:
23.7 fps
fps
166%
Iris Xe G7 80EUs:
26.8 [X] Dell Inspiron 15 5518-2X3JR Intel Core i5-11300H 3.1GHz
Iris Xe G7 80EUs
min:
16.3 fps, P0.1:
17.1 fps, P1:
18.5 fps, max:
53.5 fps
fps
Iris Xe G7 80EUs:
12 [X] Dell Inspiron 15 5518-2X3JR Intel Core i5-11300H 3.1GHz
Iris Xe G7 80EUs
min:
6.51 fps, P0.1:
6.77 fps, P1:
7.15 fps, max:
44.3 fps
fps
100%
UHD Graphics Xe G4 48EUs:
61.3 [X] Lenovo IdeaPad 3 15ITL05 81X80074GE Intel Core i3-1115G4 3GHz
UHD Graphics Xe G4 48EUs
min:
7.69 fps, P0.1:
19.7 fps, P1:
33 fps, max:
146 fps
fps
162%
Iris Xe G7 80EUs:
99.4 fps
100%
UHD Graphics Xe G4 48EUs:
11.9 [X] Lenovo IdeaPad 3 15ITL05 81X80074GE Intel Core i3-1115G4 3GHz
UHD Graphics Xe G4 48EUs
min:
1.726 fps, P0.1:
2.37 fps, P1:
4.17 fps, max:
56 fps
fps
123%
Iris Xe G7 80EUs:
14.6 fps
100%
UHD Graphics Xe G4 48EUs:
8.2 [X] Lenovo IdeaPad 3 15ITL05 81X80074GE Intel Core i3-1115G4 3GHz
UHD Graphics Xe G4 48EUs
min:
0.978 fps, P0.1:
1.325 fps, P1:
4.5 fps, max:
34.4 fps
fps
123%
Iris Xe G7 80EUs:
10.1 fps
100%
UHD Graphics Xe G4 48EUs:
28.9 [X] Lenovo IdeaPad 3 15ITL05 81X80074GE Intel Core i3-1115G4 3GHz
UHD Graphics Xe G4 48EUs
min:
17 fps, P0.1:
17 fps, P1:
20.6 fps, max:
59 fps
33.1 [X] Lenovo IdeaPad 3 15ITL05 81X80074GE Intel Core i3-1115G4 3GHz
UHD Graphics Xe G4 48EUs
min:
6.26 fps, P0.1:
7.53 fps, P1:
11.4 fps, max:
124 fps
~ 31 fps
158%
Iris Xe G7 80EUs:
43.5 [X] Acer Extensa 15 EX215-54-5103 Intel Core i5-1135G7 2.4GHz
Iris Xe G7 80EUs
min:
15.9 fps, P0.1:
18.2 fps, P1:
21.8 fps, max:
88.9 fps
54.9 ~ 49 fps
100%
UHD Graphics Xe G4 48EUs:
8.6 [X] Lenovo IdeaPad 3 15ITL05 81X80074GE Intel Core i3-1115G4 3GHz
UHD Graphics Xe G4 48EUs
min:
3.98 fps, P0.1:
4.04 fps, P1:
4.71 fps, max:
30.9 fps
9.5 [X] Lenovo IdeaPad 3 15ITL05 81X80074GE Intel Core i3-1115G4 3GHz
UHD Graphics Xe G4 48EUs
min:
4.41 fps, P0.1:
4.41 fps, P1:
4.51 fps, max:
61.1 fps
~ 9 fps
256%
Iris Xe G7 80EUs:
20.1 [X] Acer Extensa 15 EX215-54-5103 Intel Core i5-1135G7 2.4GHz
Iris Xe G7 80EUs
min:
10.4 fps, P0.1:
11 fps, P1:
13 fps, max:
45.8 fps
24.9 ~ 23 fps
Iris Xe G7 80EUs:
7.2 [X] Acer Extensa 15 EX215-54-5103 Intel Core i5-1135G7 2.4GHz
Iris Xe G7 80EUs
min:
3.93 fps, P0.1:
3.95 fps, P1:
4.18 fps, max:
33.3 fps
8.5 ~ 8 fps
UHD Graphics 64EUs:
27 [X] MSI Katana 17 B13VFK Intel Core i7-13620H 1.8GHz
UHD Graphics 64EUs
min:
18.1 fps, P0.1:
18.6 fps, P1:
24.8 fps, max:
29.3 fps
fps
Iris Xe G7 80EUs:
20.7 [X] Dell Latitude 3520 Intel Core i5-1135G7 2.4GHz
Iris Xe G7 80EUs
min:
16.2 fps, P0.1:
17 fps, P1:
17.6 fps, max:
22.9 fps
fps
UHD Graphics 64EUs:
12.5 [X] MSI Katana 17 B13VFK Intel Core i7-13620H 1.8GHz
UHD Graphics 64EUs
min:
10.2 fps, P0.1:
10.3 fps, P1:
11.4 fps, max:
13.5 fps
fps
Iris Xe G7 80EUs:
9.8 [X] Dell Latitude 3520 Intel Core i5-1135G7 2.4GHz
Iris Xe G7 80EUs
min:
8.25 fps, P0.1:
8.27 fps, P1:
8.67 fps, max:
10.6 fps
fps
Iris Xe G7 80EUs:
6.8 [X] Dell Latitude 3520 Intel Core i5-1135G7 2.4GHz
Iris Xe G7 80EUs
min:
0.4788 fps, P0.1:
0.767 fps, P1:
5.72 fps, max:
8.28 fps
fps
100%
UHD Graphics Xe G4 48EUs:
14 [X] Acer Aspire 5 A515-56-P8NZ Intel Pentium Gold 7505 2GHz
UHD Graphics Xe G4 48EUs
min:
3 fps, max:
24 fps
fps
200%
Iris Xe G7 80EUs:
28 [X] Dell Inspiron 15 5518-2X3JR Intel Core i5-11300H 3.1GHz
Iris Xe G7 80EUs
min:
13 fps, max:
40 fps
fps
100%
UHD Graphics Xe G4 48EUs:
10 [X] Acer Aspire 5 A515-56-P8NZ Intel Pentium Gold 7505 2GHz
UHD Graphics Xe G4 48EUs
min:
4 fps, max:
14 fps
fps
150%
Iris Xe G7 80EUs:
15 [X] Dell Inspiron 15 5518-2X3JR Intel Core i5-11300H 3.1GHz
Iris Xe G7 80EUs
min:
10 fps, max:
27 fps
fps
Iris Xe G7 80EUs:
13 [X] Dell Inspiron 15 5518-2X3JR Intel Core i5-11300H 3.1GHz
Iris Xe G7 80EUs
min:
8 fps, max:
19 fps
fps
100%
UHD Graphics Xe G4 48EUs:
24.6 [X] Lenovo IdeaPad 3 15ITL05 81X80074GE Intel Core i3-1115G4 3GHz
UHD Graphics Xe G4 48EUs
min:
6.79 fps, P0.1:
9.12 fps, P1:
14.7 fps, max:
52.2 fps
fps
170%
UHD Graphics 64EUs:
41.7 [X] Asus TUF Dash F15 FX517ZR Intel Core i7-12650H 1.7GHz
UHD Graphics 64EUs
min:
8 fps, P0.1:
32.9 fps, P1:
34.6 fps, max:
130.5 fps
fps
172%
Iris Xe G7 80EUs:
42.2 fps
100%
UHD Graphics Xe G4 48EUs:
15.3 [X] Lenovo IdeaPad 3 15ITL05 81X80074GE Intel Core i3-1115G4 3GHz
UHD Graphics Xe G4 48EUs
min:
10.5 fps, P0.1:
10.9 fps, P1:
12.9 fps, max:
23.2 fps
fps
156%
UHD Graphics 64EUs:
23.8 [X] Asus TUF Dash F15 FX517ZR Intel Core i7-12650H 1.7GHz
UHD Graphics 64EUs
min:
19.5 fps, P0.1:
19.6 fps, P1:
20.9 fps, max:
28.8 fps
fps
153%
Iris Xe G7 80EUs:
23.4 fps
100%
UHD Graphics Xe G4 48EUs:
14.4 [X] Lenovo IdeaPad 3 15ITL05 81X80074GE Intel Core i3-1115G4 3GHz
UHD Graphics Xe G4 48EUs
min:
10.9 fps, P0.1:
10.9 fps, P1:
12.2 fps, max:
24.5 fps
fps
155%
UHD Graphics 64EUs:
22.3 [X] Asus TUF Dash F15 FX517ZR Intel Core i7-12650H 1.7GHz
UHD Graphics 64EUs
min:
19.8 fps, P0.1:
19.8 fps, P1:
20.2 fps, max:
25.6 fps
fps
144%
Iris Xe G7 80EUs:
20.7 fps
UHD Graphics 64EUs:
21.6 [X] Asus TUF Dash F15 FX517ZR Intel Core i7-12650H 1.7GHz
UHD Graphics 64EUs
min:
13 fps, P0.1:
13.1 fps, P1:
18.7 fps, max:
43.8 fps
fps
Iris Xe G7 80EUs:
19.8 fps
100%
UHD Graphics Xe G4 48EUs:
55.7 [X] Acer Aspire 5 A515-56-P8NZ 759689, Dual-Channel
Intel Pentium Gold 7505 2GHz
UHD Graphics Xe G4 48EUs
min:
48 fps, max:
63 fps
fps
122%
UHD Graphics 64EUs:
58.2 [X] NiPoGi CK10 759689
Intel Core i5-12450H 1.5GHz
UHD Graphics 64EUs
min:
52 fps, max:
67 fps
60.2 67 [X] NiPoGi AD08 759689
Intel Core i7-12650H 1.7GHz
UHD Graphics 64EUs
min:
58 fps, max:
76 fps
72.1 [X] NiPoGi AD08 759689
Intel Core i7-12650H 1.7GHz
UHD Graphics 64EUs
min:
64 fps, max:
83 fps
73 [X] NiPoGi AD08 759689
Intel Core i7-12650H 1.7GHz
UHD Graphics 64EUs
min:
64 fps, max:
85 fps
78.4 ~ 68 fps
100%
UHD Graphics Xe G4 48EUs:
27 [X] Acer Aspire 5 A515-56-P8NZ 759689, Dual-Channel
Intel Pentium Gold 7505 2GHz
UHD Graphics Xe G4 48EUs
min:
22 fps, max:
31 fps
fps
122%
UHD Graphics 64EUs:
27.5 [X] NiPoGi CK10 759689
Intel Core i5-12450H 1.5GHz
UHD Graphics 64EUs
min:
23 fps, max:
31 fps
28.3 32.4 [X] NiPoGi AD08 759689
Intel Core i7-12650H 1.7GHz
UHD Graphics 64EUs
min:
23 fps, max:
37 fps
35.1 [X] NiPoGi AD08 759689
Intel Core i7-12650H 1.7GHz
UHD Graphics 64EUs
min:
30 fps, max:
40 fps
35.5 [X] NiPoGi AD08 759689
Intel Core i7-12650H 1.7GHz
UHD Graphics 64EUs
min:
29 fps, max:
41 fps
38.2 ~ 33 fps
100%
UHD Graphics Xe G4 48EUs:
20.1 [X] Acer Aspire 5 A515-56-P8NZ 759689, Dual-Channel
Intel Pentium Gold 7505 2GHz
UHD Graphics Xe G4 48EUs
min:
16 fps, max:
23 fps
fps
124%
UHD Graphics 64EUs:
20.5 [X] NiPoGi CK10 759689
Intel Core i5-12450H 1.5GHz
UHD Graphics 64EUs
min:
16 fps, max:
24 fps
21 25.7 [X] NiPoGi AD08 759689
Intel Core i7-12650H 1.7GHz
UHD Graphics 64EUs
min:
21 fps, max:
30 fps
26.6 [X] NiPoGi AD08 759689
Intel Core i7-12650H 1.7GHz
UHD Graphics 64EUs
min:
21 fps, max:
31 fps
26.9 [X] NiPoGi AD08 759689
Intel Core i7-12650H 1.7GHz
UHD Graphics 64EUs
min:
22 fps, max:
31 fps
29 ~ 25 fps
100%
UHD Graphics Xe G4 48EUs:
12.3 [X] Acer Aspire 5 A515-56-P8NZ 759689, Dual-Channel
Intel Pentium Gold 7505 2GHz
UHD Graphics Xe G4 48EUs
min:
8 fps, max:
15 fps
fps
130%
UHD Graphics 64EUs:
12.9 [X] NiPoGi CK10 759689
Intel Core i5-12450H 1.5GHz
UHD Graphics 64EUs
min:
8 fps, max:
16 fps
13 16.8 [X] NiPoGi AD08 759689
Intel Core i7-12650H 1.7GHz
UHD Graphics 64EUs
min:
11 fps, max:
21 fps
16.9 [X] NiPoGi AD08 759689
Intel Core i7-12650H 1.7GHz
UHD Graphics 64EUs
min:
11 fps, max:
21 fps
16.9 [X] NiPoGi AD08 759689
Intel Core i7-12650H 1.7GHz
UHD Graphics 64EUs
min:
10 fps, max:
22 fps
18.3 ~ 16 fps
100%
UHD Graphics Xe G4 48EUs:
63.3 [X] Lenovo ThinkBook 14 G2 ITL 20VDS02G00 Intel Core i3-1115G4 3GHz
UHD Graphics Xe G4 48EUs
min:
1.748 fps, P0.1:
10.6 fps, P1:
31.4 fps, max:
137 fps
fps
100%
UHD Graphics Xe G4 48EUs:
36.4 [X] Lenovo ThinkBook 14 G2 ITL 20VDS02G00 Intel Core i3-1115G4 3GHz
UHD Graphics Xe G4 48EUs
min:
6.28 fps, P0.1:
9.77 fps, P1:
17.8 fps, max:
66 fps
fps
100%
UHD Graphics Xe G4 48EUs:
48.7 [X] Lenovo ThinkBook 14 G2 ITL 20VDS02G00 Intel Core i3-1115G4 3GHz
UHD Graphics Xe G4 48EUs
70 [X] Lenovo IdeaPad 3 15ITL05 81X80074GE Intel Core i3-1115G4 3GHz
UHD Graphics Xe G4 48EUs
~ 59 fps
186%
UHD Graphics 64EUs:
109.9 [X] Asus TUF Dash F15 FX517ZR Intel Core i7-12650H 1.7GHz
UHD Graphics 64EUs
fps
153%
Iris Xe G7 80EUs:
88.5 [X] Acer TravelMate P4 TMP414-51-59MR Intel Core i5-1135G7 2.4GHz
Iris Xe G7 80EUs
91.2 [X] Dell Inspiron 15 5518-2X3JR Intel Core i5-11300H 3.1GHz
Iris Xe G7 80EUs
~ 90 fps
100%
UHD Graphics Xe G4 48EUs:
0 (!) [X] Lenovo ThinkBook 14 G2 ITL 20VDS02G00 Intel Core i3-1115G4 3GHz
UHD Graphics Xe G4 48EUs
23.4 [X] Lenovo IdeaPad 3 15ITL05 81X80074GE Intel Core i3-1115G4 3GHz
UHD Graphics Xe G4 48EUs
~ 12 fps
348%
UHD Graphics 64EUs:
41.7 [X] Asus TUF Dash F15 FX517ZR Intel Core i7-12650H 1.7GHz
UHD Graphics 64EUs
fps
267%
Iris Xe G7 80EUs:
32.2 [X] Acer TravelMate P4 TMP414-51-59MR Intel Core i5-1135G7 2.4GHz
Iris Xe G7 80EUs
32.7 [X] Dell Inspiron 15 5518-2X3JR Intel Core i5-11300H 3.1GHz
Iris Xe G7 80EUs
~ 32 fps
100%
UHD Graphics Xe G4 48EUs:
16.2 [X] Lenovo IdeaPad 3 15ITL05 81X80074GE Intel Core i3-1115G4 3GHz
UHD Graphics Xe G4 48EUs
fps
157%
UHD Graphics 64EUs:
25.4 [X] Asus TUF Dash F15 FX517ZR Intel Core i7-12650H 1.7GHz
UHD Graphics 64EUs
fps
130%
Iris Xe G7 80EUs:
20.5 [X] Acer TravelMate P4 TMP414-51-59MR Intel Core i5-1135G7 2.4GHz
Iris Xe G7 80EUs
20.9 [X] Dell Inspiron 15 5518-2X3JR Intel Core i5-11300H 3.1GHz
Iris Xe G7 80EUs
~ 21 fps
100%
UHD Graphics Xe G4 48EUs:
11 [X] Lenovo IdeaPad 3 15ITL05 81X80074GE Intel Core i3-1115G4 3GHz
UHD Graphics Xe G4 48EUs
fps
160%
UHD Graphics 64EUs:
17.6 [X] Asus TUF Dash F15 FX517ZR Intel Core i7-12650H 1.7GHz
UHD Graphics 64EUs
fps
136%
Iris Xe G7 80EUs:
14.6 [X] Dell Inspiron 15 5518-2X3JR Intel Core i5-11300H 3.1GHz
Iris Xe G7 80EUs
15 [X] Acer TravelMate P4 TMP414-51-59MR Intel Core i5-1135G7 2.4GHz
Iris Xe G7 80EUs
~ 15 fps
100%
UHD Graphics Xe G4 48EUs:
35.7 [X] Lenovo IdeaPad 3 15ITL05 81X80074GE Intel Core i3-1115G4 3GHz
UHD Graphics Xe G4 48EUs
min:
23 fps, P0.1:
23.2 fps, P1:
25.6 fps, max:
45.9 fps
fps
139%
UHD Graphics 64EUs:
49.8 [X] Asus TUF Dash F15 FX517ZR Intel Core i7-12650H 1.7GHz
UHD Graphics 64EUs
min:
32.5 fps, P0.1:
34.8 fps, P1:
37 fps, max:
75.7 fps
fps
79%
Iris Xe G7 80EUs:
28.1 [X] Dell Inspiron 15 5518-2X3JR Intel Core i5-11300H 3.1GHz
Iris Xe G7 80EUs
min:
0.591 fps, P0.1:
0.912 fps, P1:
2.94 fps, max:
47.7 fps
fps
100%
UHD Graphics Xe G4 48EUs:
17.2 [X] Lenovo IdeaPad 3 15ITL05 81X80074GE Intel Core i3-1115G4 3GHz
UHD Graphics Xe G4 48EUs
min:
11.7 fps, P0.1:
12.1 fps, P1:
12.9 fps, max:
21.5 fps
fps
145%
UHD Graphics 64EUs:
25 [X] Asus TUF Dash F15 FX517ZR Intel Core i7-12650H 1.7GHz
UHD Graphics 64EUs
min:
17 fps, P0.1:
17.3 fps, P1:
18.9 fps, max:
47.7 fps
fps
104%
Iris Xe G7 80EUs:
17.9 [X] Dell Inspiron 15 5518-2X3JR Intel Core i5-11300H 3.1GHz
Iris Xe G7 80EUs
min:
1.337 fps, P0.1:
1.846 fps, P1:
14.6 fps, max:
21.9 fps
fps
UHD Graphics 64EUs:
22.6 [X] Asus TUF Dash F15 FX517ZR Intel Core i7-12650H 1.7GHz
UHD Graphics 64EUs
min:
17.2 fps, P0.1:
17.2 fps, P1:
17.4 fps, max:
28.4 fps
fps
Iris Xe G7 80EUs:
15.9 [X] Dell Inspiron 15 5518-2X3JR Intel Core i5-11300H 3.1GHz
Iris Xe G7 80EUs
min:
2.05 fps, P0.1:
2.09 fps, P1:
13.7 fps, max:
20.1 fps
fps
UHD Graphics 64EUs:
22.2 [X] Asus TUF Dash F15 FX517ZR Intel Core i7-12650H 1.7GHz
UHD Graphics 64EUs
min:
15.2 fps, P0.1:
15.6 fps, P1:
16.4 fps, max:
27.9 fps
fps
100%
UHD Graphics Xe G4 48EUs:
29.5 [X] Acer Aspire 5 A515-56-P8NZ Intel Pentium Gold 7505 2GHz
UHD Graphics Xe G4 48EUs
min:
12.8 fps, P0.1:
15.4 fps, P1:
24.7 fps, max:
47.3 fps
fps
194%
UHD Graphics 64EUs:
57.3 [X] Asus TUF Dash F15 FX517ZR Intel Core i7-12650H 1.7GHz
UHD Graphics 64EUs
min:
26.1 fps, P0.1:
31.4 fps, P1:
45.3 fps, max:
97.7 fps
fps
136%
Iris Xe G7 80EUs:
37.2 [X] Acer Extensa 15 EX215-54-5103 Intel Core i5-1135G7 2.4GHz
Iris Xe G7 80EUs
min:
12.2 fps, P0.1:
17.6 fps, P1:
28 fps, max:
60.1 fps
41.9 [X] Dell Inspiron 15 5518-2X3JR Intel Core i5-11300H 3.1GHz
Iris Xe G7 80EUs
min:
23.4 fps, P0.1:
25.3 fps, P1:
29.9 fps, max:
59.2 fps
~ 40 fps
100%
UHD Graphics Xe G4 48EUs:
13.6 [X] Acer Aspire 5 A515-56-P8NZ Intel Pentium Gold 7505 2GHz
UHD Graphics Xe G4 48EUs
min:
10.2 fps, P0.1:
10.2 fps, P1:
11 fps, max:
21.1 fps
fps
162%
UHD Graphics 64EUs:
22 [X] Asus TUF Dash F15 FX517ZR Intel Core i7-12650H 1.7GHz
UHD Graphics 64EUs
min:
17.7 fps, P0.1:
17.8 fps, P1:
18.6 fps, max:
27.9 fps
fps
118%
Iris Xe G7 80EUs:
15.8 [X] Acer Extensa 15 EX215-54-5103 Intel Core i5-1135G7 2.4GHz
Iris Xe G7 80EUs
min:
11.4 fps, P0.1:
12.1 fps, P1:
13.3 fps, max:
21.5 fps
17.1 [X] Dell Inspiron 15 5518-2X3JR Intel Core i5-11300H 3.1GHz
Iris Xe G7 80EUs
min:
9.58 fps, P0.1:
10 fps, P1:
12 fps, max:
29 fps
~ 16 fps
100%
UHD Graphics Xe G4 48EUs:
11.6 [X] Acer Aspire 5 A515-56-P8NZ Intel Pentium Gold 7505 2GHz
UHD Graphics Xe G4 48EUs
min:
8.89 fps, P0.1:
8.94 fps, P1:
9.25 fps, max:
16.6 fps
fps
154%
UHD Graphics 64EUs:
17.9 [X] Asus TUF Dash F15 FX517ZR Intel Core i7-12650H 1.7GHz
UHD Graphics 64EUs
min:
8.29 fps, P0.1:
10.7 fps, P1:
15.1 fps, max:
21.6 fps
fps
121%
Iris Xe G7 80EUs:
13.2 [X] Acer Extensa 15 EX215-54-5103 Intel Core i5-1135G7 2.4GHz
Iris Xe G7 80EUs
min:
4.15 fps, P0.1:
5.6 fps, P1:
10.8 fps, max:
33.2 fps
14 [X] Dell Inspiron 15 5518-2X3JR Intel Core i5-11300H 3.1GHz
Iris Xe G7 80EUs
min:
5.75 fps, P0.1:
6.64 fps, P1:
10.3 fps, max:
21.8 fps
~ 14 fps
Iris Xe G7 80EUs:
0 (!) fps
Iris Xe G7 80EUs:
49.2 fps
Iris Xe G7 80EUs:
22.7 fps
Iris Xe G7 80EUs:
12.9 fps
100%
UHD Graphics Xe G4 48EUs:
17.8 [X] Lenovo ThinkBook 14 G2 ITL 20VDS02G00 Intel Core i3-1115G4 3GHz
UHD Graphics Xe G4 48EUs
26.8 [X] Lenovo IdeaPad 3 15ITL05 81X80074GE Intel Core i3-1115G4 3GHz
UHD Graphics Xe G4 48EUs
~ 22 fps
214%
Iris Xe G7 80EUs:
37.9 [X] Acer TravelMate P4 TMP414-51-59MR Intel Core i5-1135G7 2.4GHz
Iris Xe G7 80EUs
46.6 46.7 47.8 57.6 ~ 47 fps
100%
UHD Graphics Xe G4 48EUs:
5.8 [X] Lenovo ThinkBook 14 G2 ITL 20VDS02G00 Intel Core i3-1115G4 3GHz
UHD Graphics Xe G4 48EUs
12.1 [X] Lenovo IdeaPad 3 15ITL05 81X80074GE Intel Core i3-1115G4 3GHz
UHD Graphics Xe G4 48EUs
~ 9 fps
233%
Iris Xe G7 80EUs:
16.5 [X] Acer TravelMate P4 TMP414-51-59MR Intel Core i5-1135G7 2.4GHz
Iris Xe G7 80EUs
20.6 21.4 21.9 25.8 ~ 21 fps
Iris Xe G7 80EUs:
10.6 [X] Acer TravelMate P4 TMP414-51-59MR Intel Core i5-1135G7 2.4GHz
Iris Xe G7 80EUs
12.6 13.1 13.1 15.7 ~ 13 fps
Iris Xe G7 80EUs:
57.9 fps
Iris Xe G7 80EUs:
17.3 fps
Iris Xe G7 80EUs:
11.6 fps
100%
UHD Graphics Xe G4 48EUs:
27.5 [X] Lenovo ThinkBook 14 G2 ITL 20VDS02G00 Intel Core i3-1115G4 3GHz
UHD Graphics Xe G4 48EUs
min:
21 fps, max:
33 fps
fps
191%
Iris Xe G7 80EUs:
52.5 fps
Iris Xe G7 80EUs:
20.9 fps
100%
UHD Graphics Xe G4 48EUs:
30 [X] Lenovo IdeaPad 3 15ITL05 81X80074GE Intel Core i3-1115G4 3GHz
UHD Graphics Xe G4 48EUs
fps
150%
UHD Graphics 64EUs:
45 [X] Asus TUF Dash F15 FX517ZR Intel Core i7-12650H 1.7GHz
UHD Graphics 64EUs
fps
100%
UHD Graphics Xe G4 48EUs:
14 [X] Lenovo IdeaPad 3 15ITL05 81X80074GE Intel Core i3-1115G4 3GHz
UHD Graphics Xe G4 48EUs
fps
157%
UHD Graphics 64EUs:
22 [X] Asus TUF Dash F15 FX517ZR Intel Core i7-12650H 1.7GHz
UHD Graphics 64EUs
fps
UHD Graphics 64EUs:
16 [X] Asus TUF Dash F15 FX517ZR Intel Core i7-12650H 1.7GHz
UHD Graphics 64EUs
fps
UHD Graphics 64EUs:
33 [X] NiPoGi CK10 Intel Core i5-12450H 1.5GHz
UHD Graphics 64EUs
min:
21 fps, max:
42 fps
34 34 [X] NiPoGi AD08 Intel Core i7-12650H 1.7GHz
UHD Graphics 64EUs
min:
24 fps, max:
44 fps
35 44 [X] NiPoGi AD08 Intel Core i7-12650H 1.7GHz
UHD Graphics 64EUs
min:
30 fps, max:
56 fps
45 [X] NiPoGi AD08 Intel Core i7-12650H 1.7GHz
UHD Graphics 64EUs
min:
29 fps, max:
56 fps
48 ~ 39 fps
Iris Xe G7 80EUs:
29 [X] Intel NUC10i5FNK Intel Core i5-1135G7 2.4GHz
Iris Xe G7 80EUs
min:
23 fps, max:
38 fps
41 43 48 59 ~ 44 fps
UHD Graphics 64EUs:
17 17 [X] NiPoGi CK10 Intel Core i5-12450H 1.5GHz
UHD Graphics 64EUs
min:
13 fps, max:
22 fps
17 19 [X] NiPoGi AD08 Intel Core i7-12650H 1.7GHz
UHD Graphics 64EUs
min:
15 fps, max:
24 fps
23 [X] NiPoGi AD08 Intel Core i7-12650H 1.7GHz
UHD Graphics 64EUs
min:
17 fps, max:
28 fps
23 [X] NiPoGi AD08 Intel Core i7-12650H 1.7GHz
UHD Graphics 64EUs
min:
17 fps, max:
29 fps
24 ~ 20 fps
Iris Xe G7 80EUs:
15 [X] Intel NUC10i5FNK Intel Core i5-1135G7 2.4GHz
Iris Xe G7 80EUs
min:
12 fps, max:
18 fps
26 26 27 27 32 ~ 26 fps
UHD Graphics 64EUs:
16 16 [X] NiPoGi CK10 Intel Core i5-12450H 1.5GHz
UHD Graphics 64EUs
min:
12 fps, max:
20 fps
16 18 [X] NiPoGi AD08 Intel Core i7-12650H 1.7GHz
UHD Graphics 64EUs
min:
14 fps, max:
23 fps
22 [X] NiPoGi AD08 Intel Core i7-12650H 1.7GHz
UHD Graphics 64EUs
min:
16 fps, max:
27 fps
22 [X] NiPoGi AD08 Intel Core i7-12650H 1.7GHz
UHD Graphics 64EUs
min:
16 fps, max:
27 fps
23 ~ 19 fps
Iris Xe G7 80EUs:
14 [X] Intel NUC10i5FNK Intel Core i5-1135G7 2.4GHz
Iris Xe G7 80EUs
min:
11 fps, max:
17 fps
24 24 25 25 30 ~ 24 fps
UHD Graphics 64EUs:
15 15 [X] NiPoGi CK10 Intel Core i5-12450H 1.5GHz
UHD Graphics 64EUs
min:
11 fps, max:
19 fps
15 16 [X] NiPoGi AD08 Intel Core i7-12650H 1.7GHz
UHD Graphics 64EUs
min:
11 fps, max:
21 fps
20 [X] NiPoGi AD08 Intel Core i7-12650H 1.7GHz
UHD Graphics 64EUs
min:
13 fps, max:
25 fps
20 [X] NiPoGi AD08 Intel Core i7-12650H 1.7GHz
UHD Graphics 64EUs
min:
14 fps, max:
25 fps
21 ~ 17 fps
Iris Xe G7 80EUs:
13 [X] Intel NUC10i5FNK Intel Core i5-1135G7 2.4GHz
Iris Xe G7 80EUs
min:
9 fps, max:
17 fps
22 27 ~ 21 fps
UHD Graphics 64EUs:
22.3 [X] NiPoGi AD08 Intel Core i7-12650H 1.7GHz
UHD Graphics 64EUs
min:
12.19 fps, max:
37.36 fps
27.3 [X] NiPoGi CK10 Intel Core i5-12450H 1.5GHz
UHD Graphics 64EUs
min:
16.35 fps, max:
41.99 fps
27.5 [X] Geekom Mini IT12 Intel Core i5-12450H 1.5GHz
UHD Graphics 64EUs
min:
16.8 fps, max:
40.79 fps
33.1 [X] NiPoGi AD08 Intel Core i7-12650H 1.7GHz
UHD Graphics 64EUs
min:
19.24 fps, max:
49.3 fps
33.2 [X] NiPoGi AD08 Intel Core i7-12650H 1.7GHz
UHD Graphics 64EUs
min:
19.15 fps, max:
50.68 fps
37.6 ~ 30 fps
UHD Graphics 64EUs:
12.1 [X] NiPoGi AD08 Intel Core i7-12650H 1.7GHz
UHD Graphics 64EUs
min:
6.36 fps, max:
19.45 fps
12.3 [X] NiPoGi CK10 Intel Core i5-12450H 1.5GHz
UHD Graphics 64EUs
min:
6.65 fps, max:
18.79 fps
12.9 [X] Geekom Mini IT12 Intel Core i5-12450H 1.5GHz
UHD Graphics 64EUs
min:
6.97 fps, max:
19.25 fps
15.9 [X] NiPoGi AD08 Intel Core i7-12650H 1.7GHz
UHD Graphics 64EUs
min:
8.49 fps, max:
22.97 fps
15.9 [X] NiPoGi AD08 Intel Core i7-12650H 1.7GHz
UHD Graphics 64EUs
min:
8.54 fps, max:
23.97 fps
17 ~ 14 fps
UHD Graphics 64EUs:
9.5 [X] NiPoGi CK10 Intel Core i5-12450H 1.5GHz
UHD Graphics 64EUs
min:
4.94 fps, max:
14.31 fps
9.6 10 [X] NiPoGi AD08 Intel Core i7-12650H 1.7GHz
UHD Graphics 64EUs
min:
4.99 fps, max:
15.67 fps
11.7 [X] NiPoGi AD08 Intel Core i7-12650H 1.7GHz
UHD Graphics 64EUs
min:
6.1 fps, max:
17.86 fps
11.7 [X] NiPoGi AD08 Intel Core i7-12650H 1.7GHz
UHD Graphics 64EUs
min:
6.13 fps, max:
18.1 fps
12.5 ~ 11 fps
UHD Graphics 64EUs:
7.7 [X] NiPoGi CK10 Intel Core i5-12450H 1.5GHz
UHD Graphics 64EUs
min:
4.18 fps, max:
11.51 fps
7.9 [X] Geekom Mini IT12 Intel Core i5-12450H 1.5GHz
UHD Graphics 64EUs
min:
4.34 fps, max:
11.75 fps
8 [X] NiPoGi AD08 Intel Core i7-12650H 1.7GHz
UHD Graphics 64EUs
min:
4.22 fps, max:
11.91 fps
9.5 [X] NiPoGi AD08 Intel Core i7-12650H 1.7GHz
UHD Graphics 64EUs
min:
5.26 fps, max:
14.62 fps
9.5 [X] NiPoGi AD08 Intel Core i7-12650H 1.7GHz
UHD Graphics 64EUs
min:
5.24 fps, max:
14.77 fps
10.2 ~ 9 fps
Iris Xe G7 80EUs:
8.7 11 ~ 10 fps
Iris Xe G7 80EUs:
37.7 fps
Iris Xe G7 80EUs:
28.2 fps
Iris Xe G7 80EUs:
25.3 fps
100%
UHD Graphics Xe G4 48EUs:
43.8 [X] Lenovo IdeaPad 3 15ITL05 81X80074GE Intel Core i3-1115G4 3GHz
UHD Graphics Xe G4 48EUs
min:
13 fps, P0.1:
17.1 fps, P1:
25.6 fps, max:
102 fps
fps
68%
Iris Xe G7 80EUs:
8 51.7 ~ 30 fps
100%
UHD Graphics Xe G4 48EUs:
18.7 [X] Lenovo IdeaPad 3 15ITL05 81X80074GE Intel Core i3-1115G4 3GHz
UHD Graphics Xe G4 48EUs
min:
10.4 fps, P0.1:
10.5 fps, P1:
11.6 fps, max:
54.5 fps
fps
138%
Iris Xe G7 80EUs:
25.8 fps
100%
UHD Graphics Xe G4 48EUs:
15.5 [X] Lenovo IdeaPad 3 15ITL05 81X80074GE Intel Core i3-1115G4 3GHz
UHD Graphics Xe G4 48EUs
min:
5.46 fps, P0.1:
6.15 fps, P1:
8.13 fps, max:
42.1 fps
fps
150%
Iris Xe G7 80EUs:
23.3 fps
100%
UHD Graphics Xe G4 48EUs:
14.3 [X] Lenovo IdeaPad 3 15ITL05 81X80074GE Intel Core i3-1115G4 3GHz
UHD Graphics Xe G4 48EUs
min:
6.36 fps, P0.1:
6.92 fps, P1:
8.53 fps, max:
52.4 fps
fps
158%
Iris Xe G7 80EUs:
22.6 fps
100%
UHD Graphics Xe G4 48EUs:
25 [X] Acer Aspire 5 A515-56-P8NZ Intel Pentium Gold 7505 2GHz
UHD Graphics Xe G4 48EUs
fps
100%
UHD Graphics Xe G4 48EUs:
12 [X] Acer Aspire 5 A515-56-P8NZ Intel Pentium Gold 7505 2GHz
UHD Graphics Xe G4 48EUs
fps
Iris Xe G7 80EUs:
9 18 21.6 ~ 16 fps
100%
UHD Graphics Xe G4 48EUs:
31.3 [X] Lenovo ThinkBook 14 G2 ITL 20VDS02G00 1.47.22.14 D3D12
Intel Core i3-1115G4 3GHz
UHD Graphics Xe G4 48EUs
min:
7.4 fps, P1:
9.51 fps, max:
190 fps
32.4 50.2 52.7 [X] Asus P1511CEA-BQ753R 1.47.22.14 D3D12
Intel Core i3-1115G4 3GHz
UHD Graphics Xe G4 48EUs
min:
12.3 fps, P1:
20.4 fps, max:
221 fps
53 [X] Acer Aspire 5 A515-56-P8NZ 1.47.22.14 D3D12, Dual-Channel
Intel Pentium Gold 7505 2GHz
UHD Graphics Xe G4 48EUs
min:
12.4 fps, P1:
16.7 fps, max:
174.7 fps
63.6 [X] Realme Book (Slim) 1.47.22.14 D3D12
Intel Core i3-1115G4 3GHz
UHD Graphics Xe G4 48EUs
min:
14.7 fps, P1:
22.9 fps, max:
283 fps
64.4 [X] GMK NucBox M3 1.47.22.14 D3D12
Intel Core i5-12450H 1.5GHz
UHD Graphics Xe G4 48EUs
min:
13.2 fps, P1:
19 fps, max:
346 fps
~ 50 fps
144%
UHD Graphics 64EUs:
47.9 [X] HP 250 G9 7N029ES 1.47.22.14 D3D12
Intel Core i3-1215U 0.9GHz
UHD Graphics 64EUs
min:
6.9 fps, P1:
16.3 fps, max:
249 fps
61.7 [X] NiPoGi CK10 1.47.22.14 D3D12
Intel Core i5-12450H 1.5GHz
UHD Graphics 64EUs
min:
14.2 fps, P1:
18.8 fps, max:
283 fps
63.4 [X] Geekom Mini IT12 1.47.22.14 D3D12
Intel Core i5-12450H 1.5GHz
UHD Graphics 64EUs
min:
14.3 fps, P1:
18.6 fps, max:
372 fps
67.4 76.4 [X] NiPoGi AD08 1.47.22.14 D3D12
Intel Core i7-12650H 1.7GHz
UHD Graphics 64EUs
min:
17.3 fps, P1:
24.6 fps, max:
362 fps
77.3 [X] NiPoGi AD08 1.47.22.14 D3D12
Intel Core i7-12650H 1.7GHz
UHD Graphics 64EUs
min:
17.1 fps, P1:
24.6 fps, max:
383 fps
78.1 [X] NiPoGi AD08 1.47.22.14 D3D12
Intel Core i7-12650H 1.7GHz
UHD Graphics 64EUs
min:
17.5 fps, P1:
24 fps, max:
419 fps
84.5 89.1 [X] Asus TUF Dash F15 FX517ZR 1.47.22.14 D3D12
Intel Core i7-12650H 1.7GHz
UHD Graphics 64EUs
min:
19.7 fps, P1:
29.6 fps, max:
492 fps
~ 72 fps
134%
Iris Xe G7 80EUs:
22.7 35.5 36.7 37.3 37.7 [X] Dell Latitude 3520 1.47.22.14 D3D12
Intel Core i5-1135G7 2.4GHz
Iris Xe G7 80EUs
min:
9 fps, P1:
10.8 fps, max:
215 fps
38 38.4 38.6 47.5 48.1 48.8 [X] Lenovo Yoga 7 14ITL5 1.47.22.14 D3D12
Intel Core i5-1135G7 2.4GHz
Iris Xe G7 80EUs
min:
10.6 fps, P1:
14.2 fps, max:
253 fps
48.8 50.9 51 52.7 57.5 59.4 60.2 60.4 60.8 61.7 61.7 [X] Acer Extensa 15 EX215-54-5103 1.47.22.14 D3D12, Dual-Channel
Intel Core i5-1135G7 2.4GHz
Iris Xe G7 80EUs
min:
14.1 fps, P1:
19.4 fps, max:
264 fps
61.8 62.6 62.9 [X] Asus F415EA-EK115W 1.47.22.14 D3D12
Intel Core i5-1135G7 2.4GHz
Iris Xe G7 80EUs
min:
14.7 fps, P1:
19.3 fps, max:
260 fps
63.8 64.2 65.9 66.1 66.8 [X] Acer TravelMate P4 TMP414-51-59MR 1.47.22.14 D3D12, Dual-Channel
Intel Core i5-1135G7 2.4GHz
Iris Xe G7 80EUs
min:
15.9 fps, P1:
21.4 fps, max:
233 fps
67 [X] Acer Aspire 5 Spin 14 1.47.22.14 D3D12
Intel Core i5-1335U 0.9GHz
Iris Xe G7 80EUs
min:
15.4 fps, P1:
24.5 fps, max:
274 fps
67.7 68 68.1 68.1 [X] HP Envy 14-eb0252ng 1.47.22.14 D3D12
Intel Core i5-1135G7 2.4GHz
Iris Xe G7 80EUs
min:
15.7 fps, P1:
21.3 fps, max:
236 fps
68.6 [X] LG Gram 14Z90Q 1.47.22.14 D3D12
Intel Core i5-1240P 1.2GHz
Iris Xe G7 80EUs
min:
14.9 fps, P1:
22.7 fps, max:
349 fps
68.8 69.3 [X] LG Gram 15Z90Q 1.47.22.14 D3D12
Intel Core i5-1240P 1.2GHz
Iris Xe G7 80EUs
min:
16.1 fps, P1:
22.7 fps, max:
330 fps
69.6 69.7 70.3 70.3 70.7 [X] Dell Latitude 3440 1.47.22.14 D3D12
Intel Core i5-1345U 1.2GHz
Iris Xe G7 80EUs
min:
15.9 fps, P1:
22.2 fps, max:
358 fps
70.9 71 71.1 [X] LG Gram 17 (2022) 1.47.22.14 D3D12
Intel Core i5-1240P 1.2GHz
Iris Xe G7 80EUs
min:
16.5 fps, P1:
23.1 fps, max:
337 fps
71.3 [X] LG Gram 17 (2022) 1.47.22.14 D3D12, Hoch
Intel Core i5-1240P 1.2GHz
Iris Xe G7 80EUs
min:
14.9 fps, P1:
23.3 fps, max:
346 fps
73.1 73.4 73.8 74.1 74.4 75 76.1 76.1 76.1 76.5 [X] Beelink GTI 11 1.47.22.14 D3D12
Intel Core i5-1135G7 2.4GHz
Iris Xe G7 80EUs
min:
17.1 fps, P1:
23 fps, max:
360 fps
76.7 77.2 [X] VAIO SX12 VJS124X1011P 1.47.22.14 D3D12
Intel Core i5-1155G7 2.5GHz
Iris Xe G7 80EUs
min:
17.8 fps, P1:
24.1 fps, max:
279 fps
77.2 77.7 [X] LG Gram 17Z90P-G.AA56G 1.47.22.14 D3D12
Intel Core i5-1135G7 2.4GHz
Iris Xe G7 80EUs
min:
15.9 fps, P1:
26.3 fps, max:
382 fps
77.9 78.5 [X] Dell Latitude 7440 1.47.22.14 D3D12
Intel Core i5-1345U 1.2GHz
Iris Xe G7 80EUs
min:
10.9 fps, P1:
23.7 fps, max:
373 fps
78.7 80.4 81.3 81.6 81.9 81.9 81.9 82 83.4 83.4 85.3 86.2 87.7 [X] GPD Win 3 1.47.22.14 D3D12
Intel Core i5-1135G7 2.4GHz
Iris Xe G7 80EUs
min:
17.3 fps, P1:
33.8 fps, max:
339 fps
88.3 [X] LG Gram 14T90P 1.47.22.14 D3D12
Intel Core i5-1135G7 2.4GHz
Iris Xe G7 80EUs
min:
16.1 fps, P1:
28.6 fps, max:
345 fps
98.7 ~ 67 fps
100%
UHD Graphics Xe G4 48EUs:
11.7 [X] Lenovo ThinkBook 14 G2 ITL 20VDS02G00 1.47.22.14 D3D12
Intel Core i3-1115G4 3GHz
UHD Graphics Xe G4 48EUs
min:
5 fps, P1:
5.16 fps, max:
162 fps
13.4 19.9 21.1 [X] Asus P1511CEA-BQ753R 1.47.22.14 D3D12
Intel Core i3-1115G4 3GHz
UHD Graphics Xe G4 48EUs
min:
6 fps, P1:
8.15 fps, max:
199.5 fps
21.8 [X] Acer Aspire 5 A515-56-P8NZ 1.47.22.14 D3D12, Dual-Channel
Intel Pentium Gold 7505 2GHz
UHD Graphics Xe G4 48EUs
min:
7.5 fps, P1:
8.69 fps, max:
153.2 fps
25.6 [X] GMK NucBox M3 1.47.22.14 D3D12
Intel Core i5-12450H 1.5GHz
UHD Graphics Xe G4 48EUs
min:
7.1 fps, P1:
12.5 fps, max:
248 fps
26.7 [X] Realme Book (Slim) 1.47.22.14 D3D12
Intel Core i3-1115G4 3GHz
UHD Graphics Xe G4 48EUs
min:
6.9 fps, P1:
14.7 fps, max:
163 fps
~ 20 fps
150%
UHD Graphics 64EUs:
17.9 [X] HP 250 G9 7N029ES 1.47.22.14 D3D12
Intel Core i3-1215U 0.9GHz
UHD Graphics 64EUs
min:
5 fps, P1:
6.89 fps, max:
214 fps
25.1 [X] NiPoGi CK10 1.47.22.14 D3D12
Intel Core i5-12450H 1.5GHz
UHD Graphics 64EUs
min:
8.8 fps, P1:
12.7 fps, max:
181.3 fps
25.1 [X] Geekom Mini IT12 1.47.22.14 D3D12
Intel Core i5-12450H 1.5GHz
UHD Graphics 64EUs
min:
7.6 fps, P1:
11.4 fps, max:
246 fps
29.9 32.2 [X] NiPoGi AD08 1.47.22.14 D3D12
Intel Core i7-12650H 1.7GHz
UHD Graphics 64EUs
min:
11.9 fps, P1:
17.7 fps, max:
168.4 fps
32.3 [X] NiPoGi AD08 1.47.22.14 D3D12
Intel Core i7-12650H 1.7GHz
UHD Graphics 64EUs
min:
8.8 fps, P1:
18.4 fps, max:
199.4 fps
32.4 [X] NiPoGi AD08 1.47.22.14 D3D12
Intel Core i7-12650H 1.7GHz
UHD Graphics 64EUs
min:
11.4 fps, P1:
17.3 fps, max:
174.2 fps
34.5 38.6 [X] Asus TUF Dash F15 FX517ZR 1.47.22.14 D3D12
Intel Core i7-12650H 1.7GHz
UHD Graphics 64EUs
min:
16.6 fps, P1:
20.9 fps, max:
290 fps
~ 30 fps
140%
Iris Xe G7 80EUs:
6 6 13.3 13.5 13.5 [X] Dell Latitude 3520 1.47.22.14 D3D12
Intel Core i5-1135G7 2.4GHz
Iris Xe G7 80EUs
min:
5 fps, P1:
5.89 fps, max:
196.4 fps
13.6 14 14.3 15 17.6 [X] Lenovo Yoga 7 14ITL5 1.47.22.14 D3D12
Intel Core i5-1135G7 2.4GHz
Iris Xe G7 80EUs
min:
5 fps, P1:
7.02 fps, max:
243 fps
18.4 18.4 19.5 19.6 20.3 22.3 23 [X] LG Gram 15Z90Q 1.47.22.14 D3D12
Intel Core i5-1240P 1.2GHz
Iris Xe G7 80EUs
min:
9.6 fps, P1:
12.5 fps, max:
131 fps
23.3 [X] LG Gram 14Z90Q 1.47.22.14 D3D12
Intel Core i5-1240P 1.2GHz
Iris Xe G7 80EUs
min:
9.1 fps, P1:
12.7 fps, max:
132.5 fps
23.8 24 24.6 24.8 [X] Asus F415EA-EK115W 1.47.22.14 D3D12
Intel Core i5-1135G7 2.4GHz
Iris Xe G7 80EUs
min:
8 fps, P1:
10.2 fps, max:
207 fps
25 [X] LG Gram 17 (2022) 1.47.22.14 D3D12
Intel Core i5-1240P 1.2GHz
Iris Xe G7 80EUs
min:
11.5 fps, P1:
14.1 fps, max:
140.2 fps
25.1 25.3 [X] Acer Extensa 15 EX215-54-5103 1.47.22.14 D3D12, Dual-Channel
Intel Core i5-1135G7 2.4GHz
Iris Xe G7 80EUs
min:
6.3 fps, P1:
9.66 fps, max:
200 fps
25.5 26.2 26.5 [X] HP Envy 14-eb0252ng 1.47.22.14 D3D12
Intel Core i5-1135G7 2.4GHz
Iris Xe G7 80EUs
min:
6.7 fps, P1:
10.3 fps, max:
216 fps
26.5 27 [X] Acer TravelMate P4 TMP414-51-59MR 1.47.22.14 D3D12, Dual-Channel
Intel Core i5-1135G7 2.4GHz
Iris Xe G7 80EUs
min:
8.2 fps, P1:
12 fps, max:
201 fps
27.1 27.3 27.4 27.8 27.8 [X] Dell Latitude 3440 1.47.22.14 D3D12
Intel Core i5-1345U 1.2GHz
Iris Xe G7 80EUs
min:
8.1 fps, P1:
12.9 fps, max:
213 fps
28.5 28.6 29.2 [X] Acer Aspire 5 Spin 14 1.47.22.14 D3D12
Intel Core i5-1335U 0.9GHz
Iris Xe G7 80EUs
min:
10.3 fps, P1:
15 fps, max:
173.4 fps
29.5 29.6 29.8 30 30.2 30.5 30.6 30.7 30.7 30.8 [X] Beelink GTI 11 1.47.22.14 D3D12
Intel Core i5-1135G7 2.4GHz
Iris Xe G7 80EUs
min:
9.7 fps, P1:
16.6 fps, max:
202 fps
30.9 31.1 31.3 31.5 [X] LG Gram 17 (2022) 1.47.22.14 D3D12, Hoch
Intel Core i5-1240P 1.2GHz
Iris Xe G7 80EUs
min:
11.9 fps, P1:
17.7 fps, max:
176.8 fps
31.6 32.2 32.5 32.6 32.7 [X] LG Gram 17Z90P-G.AA56G 1.47.22.14 D3D12
Intel Core i5-1135G7 2.4GHz
Iris Xe G7 80EUs
min:
7.8 fps, P1:
8.65 fps, max:
349 fps
32.8 32.9 33 33.1 33.8 33.8 [X] Dell Latitude 7440 1.47.22.14 D3D12
Intel Core i5-1345U 1.2GHz
Iris Xe G7 80EUs
min:
11.5 fps, P1:
18.6 fps, max:
210 fps
34.2 34.4 34.5 34.5 34.6 34.6 34.7 35.5 [X] VAIO SX12 VJS124X1011P 1.47.22.14 D3D12
Intel Core i5-1155G7 2.5GHz
Iris Xe G7 80EUs
min:
10.1 fps, P1:
13.6 fps, max:
238 fps
35.6 36.1 36.1 36.2 [X] GPD Win 3 1.47.22.14 D3D12
Intel Core i5-1135G7 2.4GHz
Iris Xe G7 80EUs
min:
8 fps, P1:
10.5 fps, max:
317 fps
36.2 36.3 [X] LG Gram 14T90P 1.47.22.14 D3D12
Intel Core i5-1135G7 2.4GHz
Iris Xe G7 80EUs
min:
8.1 fps, P1:
9.59 fps, max:
309 fps
37.6 40.9 48.8 ~ 28 fps
100%
UHD Graphics Xe G4 48EUs:
10.8 [X] Lenovo ThinkBook 14 G2 ITL 20VDS02G00 1.47.22.14 D3D12
Intel Core i3-1115G4 3GHz
UHD Graphics Xe G4 48EUs
min:
5 fps, P1:
5 fps, max:
175 fps
11.6 16.5 17.3 [X] Asus P1511CEA-BQ753R 1.47.22.14 D3D12
Intel Core i3-1115G4 3GHz
UHD Graphics Xe G4 48EUs
min:
5 fps, P1:
5.73 fps, max:
163.7 fps
17.8 [X] Acer Aspire 5 A515-56-P8NZ 1.47.22.14 D3D12, Dual-Channel
Intel Pentium Gold 7505 2GHz
UHD Graphics Xe G4 48EUs
min:
5 fps, P1:
6.09 fps, max:
205 fps
20 [X] GMK NucBox M3 1.47.22.14 D3D12
Intel Core i5-12450H 1.5GHz
UHD Graphics Xe G4 48EUs
min:
5 fps, P1:
6.58 fps, max:
313 fps
20.9 [X] Realme Book (Slim) 1.47.22.14 D3D12
Intel Core i3-1115G4 3GHz
UHD Graphics Xe G4 48EUs
min:
5 fps, P1:
7.39 fps, max:
203 fps
~ 16 fps
150%
UHD Graphics 64EUs:
15.3 [X] HP 250 G9 7N029ES 1.47.22.14 D3D12
Intel Core i3-1215U 0.9GHz
UHD Graphics 64EUs
min:
5 fps, P1:
5.16 fps, max:
225 fps
19.8 [X] NiPoGi CK10 1.47.22.14 D3D12
Intel Core i5-12450H 1.5GHz
UHD Graphics 64EUs
min:
5 fps, P1:
6.19 fps, max:
218 fps
19.9 [X] Geekom Mini IT12 1.47.22.14 D3D12
Intel Core i5-12450H 1.5GHz
UHD Graphics 64EUs
min:
5.1 fps, P1:
6.2 fps, max:
255 fps
23.3 25.5 [X] NiPoGi AD08 1.47.22.14 D3D12
Intel Core i7-12650H 1.7GHz
UHD Graphics 64EUs
min:
7.4 fps, P1:
9.71 fps, max:
300 fps
25.5 [X] NiPoGi AD08 1.47.22.14 D3D12
Intel Core i7-12650H 1.7GHz
UHD Graphics 64EUs
min:
6.6 fps, P1:
10.4 fps, max:
218 fps
25.6 [X] NiPoGi AD08 1.47.22.14 D3D12
Intel Core i7-12650H 1.7GHz
UHD Graphics 64EUs
min:
5 fps, P1:
9.18 fps, max:
212 fps
27.2 30 [X] Asus TUF Dash F15 FX517ZR 1.47.22.14 D3D12
Intel Core i7-12650H 1.7GHz
UHD Graphics 64EUs
min:
9.6 fps, P1:
15.1 fps, max:
340 fps
~ 24 fps
144%
Iris Xe G7 80EUs:
11.4 [X] Dell Latitude 3520 1.47.22.14 D3D12
Intel Core i5-1135G7 2.4GHz
Iris Xe G7 80EUs
min:
5 fps, P1:
5 fps, max:
165.5 fps
11.8 11.9 12.1 12.4 12.5 13.3 15.3 [X] Lenovo Yoga 7 14ITL5 1.47.22.14 D3D12
Intel Core i5-1135G7 2.4GHz
Iris Xe G7 80EUs
min:
5 fps, P1:
5 fps, max:
245 fps
15.7 15.8 15.9 16.8 17 17.8 18.5 19.4 19.9 20.3 20.3 [X] Asus F415EA-EK115W 1.47.22.14 D3D12
Intel Core i5-1135G7 2.4GHz
Iris Xe G7 80EUs
min:
5.6 fps, P1:
7.51 fps, max:
196.5 fps
20.4 [X] LG Gram 14Z90Q 1.47.22.14 D3D12
Intel Core i5-1240P 1.2GHz
Iris Xe G7 80EUs
min:
10.1 fps, P1:
11.3 fps, max:
125.1 fps
20.5 20.6 [X] LG Gram 17 (2022) 1.47.22.14 D3D12
Intel Core i5-1240P 1.2GHz
Iris Xe G7 80EUs
min:
6.8 fps, P1:
11 fps, max:
131.6 fps
20.7 20.8 21.2 21.4 [X] Acer Extensa 15 EX215-54-5103 1.47.22.14 D3D12, Dual-Channel
Intel Core i5-1135G7 2.4GHz
Iris Xe G7 80EUs
min:
5.7 fps, P1:
7.57 fps, max:
179 fps
21.4 21.4 21.7 22 [X] Acer TravelMate P4 TMP414-51-59MR 1.47.22.14 D3D12, Dual-Channel
Intel Core i5-1135G7 2.4GHz
Iris Xe G7 80EUs
min:
5.5 fps, P1:
8.17 fps, max:
203 fps
22 22.2 22.4 [X] HP Envy 14-eb0252ng 1.47.22.14 D3D12
Intel Core i5-1135G7 2.4GHz
Iris Xe G7 80EUs
min:
5.5 fps, P1:
8.28 fps, max:
185.3 fps
22.4 22.5 [X] LG Gram 15Z90Q 1.47.22.14 D3D12
Intel Core i5-1240P 1.2GHz
Iris Xe G7 80EUs
min:
8.3 fps, P1:
12.4 fps, max:
132 fps
22.8 [X] Dell Latitude 3440 1.47.22.14 D3D12
Intel Core i5-1345U 1.2GHz
Iris Xe G7 80EUs
min:
6.2 fps, P1:
8.42 fps, max:
227 fps
22.9 23.1 23.5 23.6 [X] Acer Aspire 5 Spin 14 1.47.22.14 D3D12
Intel Core i5-1335U 0.9GHz
Iris Xe G7 80EUs
min:
6.3 fps, P1:
8.44 fps, max:
276 fps
23.8 24.1 24.3 24.4 24.6 24.7 25.2 25.2 [X] Beelink GTI 11 1.47.22.14 D3D12
Intel Core i5-1135G7 2.4GHz
Iris Xe G7 80EUs
min:
5.1 fps, P1:
8.82 fps, max:
235 fps
25.4 [X] LG Gram 17 (2022) 1.47.22.14 D3D12, Hoch
Intel Core i5-1240P 1.2GHz
Iris Xe G7 80EUs
min:
11.6 fps, P1:
14.2 fps, max:
149.3 fps
25.5 [X] LG Gram 17Z90P-G.AA56G 1.47.22.14 D3D12
Intel Core i5-1135G7 2.4GHz
Iris Xe G7 80EUs
min:
5 fps, P1:
6.81 fps, max:
337 fps
25.5 25.5 25.6 25.7 25.9 26 26 26.1 26.3 26.4 26.7 26.9 [X] Dell Latitude 7440 1.47.22.14 D3D12
Intel Core i5-1345U 1.2GHz
Iris Xe G7 80EUs
min:
6.9 fps, P1:
12.5 fps, max:
249 fps
27.2 27.3 27.4 27.5 27.5 27.5 27.9 28 [X] GPD Win 3 1.47.22.14 D3D12
Intel Core i5-1135G7 2.4GHz
Iris Xe G7 80EUs
min:
5.1 fps, P1:
7.1 fps, max:
328 fps
28.3 28.4 28.4 [X] LG Gram 14T90P 1.47.22.14 D3D12
Intel Core i5-1135G7 2.4GHz
Iris Xe G7 80EUs
min:
5.3 fps, P1:
7.35 fps, max:
274 fps
28.8 [X] VAIO SX12 VJS124X1011P 1.47.22.14 D3D12
Intel Core i5-1155G7 2.5GHz
Iris Xe G7 80EUs
min:
7.6 fps, P1:
10.4 fps, max:
212 fps
29 29.8 32.3 ~ 23 fps
100%
UHD Graphics Xe G4 48EUs:
0 (!) [X] Realme Book (Slim) Intel Core i3-1115G4 3GHz
UHD Graphics Xe G4 48EUs
15 [X] Acer Aspire 5 A515-56-P8NZ 1.47.22.14 D3D12, Dual-Channel
Intel Pentium Gold 7505 2GHz
UHD Graphics Xe G4 48EUs
min:
5 fps, P1:
5 fps, max:
250 fps
17.7 [X] GMK NucBox M3 1.47.22.14 D3D12
Intel Core i5-12450H 1.5GHz
UHD Graphics Xe G4 48EUs
min:
5 fps, P1:
5 fps, max:
278 fps
~ 11 fps
164%
UHD Graphics 64EUs:
0 (!) 16.8 [X] NiPoGi CK10 1.47.22.14 D3D12
Intel Core i5-12450H 1.5GHz
UHD Graphics 64EUs
min:
5 fps, P1:
5 fps, max:
274 fps
16.8 [X] Geekom Mini IT12 1.47.22.14 D3D12
Intel Core i5-12450H 1.5GHz
UHD Graphics 64EUs
min:
5 fps, P1:
5 fps, max:
335 fps
20.2 [X] NiPoGi AD08 1.47.22.14 D3D12
Intel Core i7-12650H 1.7GHz
UHD Graphics 64EUs
min:
5 fps, P1:
6.3 fps, max:
223 fps
20.3 [X] NiPoGi AD08 1.47.22.14 D3D12
Intel Core i7-12650H 1.7GHz
UHD Graphics 64EUs
min:
5 fps, P1:
6.46 fps, max:
247 fps
20.5 [X] NiPoGi AD08 1.47.22.14 D3D12
Intel Core i7-12650H 1.7GHz
UHD Graphics 64EUs
min:
5 fps, P1:
5.27 fps, max:
229 fps
22.1 24.4 [X] Asus TUF Dash F15 FX517ZR 1.47.22.14 D3D12
Intel Core i7-12650H 1.7GHz
UHD Graphics 64EUs
min:
6.8 fps, P1:
8.33 fps, max:
464 fps
~ 18 fps
182%
Iris Xe G7 80EUs:
13.6 13.8 14.3 14.9 15.4 15.6 [X] Lenovo Yoga 7 14ITL5 1.47.22.14 D3D12
Intel Core i5-1135G7 2.4GHz
Iris Xe G7 80EUs
min:
5 fps, P1:
5 fps, max:
231 fps
17.1 17.1 17.3 17.4 [X] Acer Extensa 15 EX215-54-5103 1.47.22.14 D3D12, Dual-Channel
Intel Core i5-1135G7 2.4GHz
Iris Xe G7 80EUs
min:
5 fps, P1:
5 fps, max:
201 fps
17.4 17.5 17.7 17.8 [X] Acer TravelMate P4 TMP414-51-59MR 1.47.22.14 D3D12, Dual-Channel
Intel Core i5-1135G7 2.4GHz
Iris Xe G7 80EUs
min:
5 fps, P1:
5 fps, max:
219 fps
17.9 18.1 18.2 18.3 18.5 [X] Dell Latitude 3440 1.47.22.14 D3D12
Intel Core i5-1345U 1.2GHz
Iris Xe G7 80EUs
min:
5 fps, P1:
5 fps, max:
272 fps
18.8 18.9 [X] LG Gram 17 (2022) 1.47.22.14 D3D12
Intel Core i5-1240P 1.2GHz
Iris Xe G7 80EUs
min:
6 fps, P1:
7.2 fps, max:
181.6 fps
19 19 [X] Acer Aspire 5 Spin 14 1.47.22.14 D3D12
Intel Core i5-1335U 0.9GHz
Iris Xe G7 80EUs
min:
5 fps, P1:
5 fps, max:
345 fps
19.1 19.2 19.7 19.7 19.8 19.9 20.2 [X] Beelink GTI 11 1.47.22.14 D3D12
Intel Core i5-1135G7 2.4GHz
Iris Xe G7 80EUs
min:
5 fps, P1:
5 fps, max:
288 fps
20.2 20.3 20.3 20.4 [X] LG Gram 17 (2022) 1.47.22.14 D3D12, Hoch
Intel Core i5-1240P 1.2GHz
Iris Xe G7 80EUs
min:
6.5 fps, P1:
7.66 fps, max:
199.9 fps
20.5 20.6 20.6 20.7 20.7 21 21.9 21.9 [X] Dell Latitude 7440 1.47.22.14 D3D12
Intel Core i5-1345U 1.2GHz
Iris Xe G7 80EUs
min:
5 fps, P1:
6.24 fps, max:
289 fps
22.2 22.3 22.8 [X] GPD Win 3 1.47.22.14 D3D12
Intel Core i5-1135G7 2.4GHz
Iris Xe G7 80EUs
min:
5 fps, P1:
5.5 fps, max:
355 fps
22.9 [X] LG Gram 17Z90P-G.AA56G 1.47.22.14 D3D12
Intel Core i5-1135G7 2.4GHz
Iris Xe G7 80EUs
min:
5 fps, P1:
5.65 fps, max:
312 fps
23.2 23.2 [X] LG Gram 14T90P 1.47.22.14 D3D12
Intel Core i5-1135G7 2.4GHz
Iris Xe G7 80EUs
min:
5 fps, P1:
5.78 fps, max:
305 fps
23.6 [X] VAIO SX12 VJS124X1011P 1.47.22.14 D3D12
Intel Core i5-1155G7 2.5GHz
Iris Xe G7 80EUs
min:
6.1 fps, P1:
6.52 fps, max:
241 fps
24 25 25 26.2 ~ 20 fps
Iris Xe G7 80EUs:
14.7 [X] LG Gram 17 (2022) 1.47.22.14 D3D12
Intel Core i5-1240P 1.2GHz
Iris Xe G7 80EUs
min:
5 fps, P1:
5.72 fps, max:
217 fps
16.5 ~ 16 fps
100%
UHD Graphics Xe G4 48EUs:
23 34 [X] GMK NucBox M3 Intel Core i5-12450H 1.5GHz
UHD Graphics Xe G4 48EUs
min:
20 fps, max:
41 fps
~ 29 fps
138%
UHD Graphics 64EUs:
25 35 [X] NiPoGi AD08 Intel Core i7-12650H 1.7GHz
UHD Graphics 64EUs
min:
32 fps, max:
43 fps
36 36 [X] NiPoGi CK10 Intel Core i5-12450H 1.5GHz
UHD Graphics 64EUs
min:
32 fps, max:
41 fps
36 46 [X] NiPoGi AD08 Intel Core i7-12650H 1.7GHz
UHD Graphics 64EUs
min:
38 fps, max:
52 fps
46 [X] NiPoGi AD08 Intel Core i7-12650H 1.7GHz
UHD Graphics 64EUs
min:
42 fps, max:
54 fps
50 53 [X] Asus TUF Dash F15 FX517ZR Intel Core i7-12650H 1.7GHz
UHD Graphics 64EUs
min:
47 fps, max:
61 fps
~ 40 fps
100%
UHD Graphics Xe G4 48EUs:
14 17 [X] GMK NucBox M3 Intel Core i5-12450H 1.5GHz
UHD Graphics Xe G4 48EUs
min:
15 fps, max:
21 fps
~ 16 fps
119%
UHD Graphics 64EUs:
13 17 17 [X] NiPoGi CK10 Intel Core i5-12450H 1.5GHz
UHD Graphics 64EUs
min:
15 fps, max:
21 fps
17 18 [X] NiPoGi AD08 Intel Core i7-12650H 1.7GHz
UHD Graphics 64EUs
min:
15 fps, max:
24 fps
22 [X] NiPoGi AD08 Intel Core i7-12650H 1.7GHz
UHD Graphics 64EUs
min:
19 fps, max:
27 fps
22 [X] NiPoGi AD08 Intel Core i7-12650H 1.7GHz
UHD Graphics 64EUs
min:
19 fps, max:
27 fps
24 25 [X] Asus TUF Dash F15 FX517ZR Intel Core i7-12650H 1.7GHz
UHD Graphics 64EUs
min:
21 fps, max:
30 fps
~ 19 fps
100%
UHD Graphics Xe G4 48EUs:
13 16 [X] GMK NucBox M3 Intel Core i5-12450H 1.5GHz
UHD Graphics Xe G4 48EUs
min:
14 fps, max:
20 fps
~ 15 fps
127%
UHD Graphics 64EUs:
16 16 [X] NiPoGi CK10 Intel Core i5-12450H 1.5GHz
UHD Graphics 64EUs
min:
13 fps, max:
20 fps
16 17 [X] NiPoGi AD08 Intel Core i7-12650H 1.7GHz
UHD Graphics 64EUs
min:
15 fps, max:
22 fps
21 [X] NiPoGi AD08 Intel Core i7-12650H 1.7GHz
UHD Graphics 64EUs
min:
18 fps, max:
25 fps
21 [X] NiPoGi AD08 Intel Core i7-12650H 1.7GHz
UHD Graphics 64EUs
min:
18 fps, max:
25 fps
22 23 [X] Asus TUF Dash F15 FX517ZR Intel Core i7-12650H 1.7GHz
UHD Graphics 64EUs
min:
20 fps, max:
28 fps
~ 19 fps
100%
UHD Graphics Xe G4 48EUs:
12 15 [X] GMK NucBox M3 Intel Core i5-12450H 1.5GHz
UHD Graphics Xe G4 48EUs
min:
13 fps, max:
18 fps
~ 14 fps
129%
UHD Graphics 64EUs:
14 15 [X] NiPoGi CK10 Intel Core i5-12450H 1.5GHz
UHD Graphics 64EUs
min:
13 fps, max:
18 fps
15 16 [X] NiPoGi AD08 Intel Core i7-12650H 1.7GHz
UHD Graphics 64EUs
min:
14 fps, max:
20 fps
19 [X] NiPoGi AD08 Intel Core i7-12650H 1.7GHz
UHD Graphics 64EUs
min:
17 fps, max:
23 fps
19 [X] NiPoGi AD08 Intel Core i7-12650H 1.7GHz
UHD Graphics 64EUs
min:
17 fps, max:
23 fps
21 [X] Asus TUF Dash F15 FX517ZR Intel Core i7-12650H 1.7GHz
UHD Graphics 64EUs
min:
18 fps, max:
26 fps
21 ~ 18 fps
UHD Graphics 64EUs:
14 [X] Asus TUF Dash F15 FX517ZR Intel Core i7-12650H 1.7GHz
UHD Graphics 64EUs
min:
12 fps, max:
17 fps
fps
Iris Xe G7 80EUs:
9 15 ~ 12 fps
100%
UHD Graphics Xe G4 48EUs:
128.9 [X] Lenovo IdeaPad 3 14ITL6 82H700CCGE Intel Celeron 6305 1.8GHz
UHD Graphics Xe G4 48EUs
min:
18.7 fps, P0.1:
45.6 fps, P1:
66.9 fps, max:
360 fps
fps
100%
UHD Graphics Xe G4 48EUs:
27.8 [X] Lenovo IdeaPad 3 14ITL6 82H700CCGE Intel Celeron 6305 1.8GHz
UHD Graphics Xe G4 48EUs
min:
3.66 fps, P0.1:
8.37 fps, P1:
17.9 fps, max:
68.3 fps
fps
100%
UHD Graphics Xe G4 48EUs:
14.2 [X] Lenovo IdeaPad 3 14ITL6 82H700CCGE Intel Celeron 6305 1.8GHz
UHD Graphics Xe G4 48EUs
min:
8.68 fps, P0.1:
9.28 fps, P1:
9.91 fps, max:
28.4 fps
fps
100%
UHD Graphics Xe G4 48EUs:
21.8 23.1 [X] Lenovo IdeaPad 3 14ITL6 82H700CCGE Dual-Channel
Intel Celeron 6305 1.8GHz
UHD Graphics Xe G4 48EUs
28.4 30.4 [X] Lenovo ThinkBook 14 G2 ITL 20VDS02G00 Intel Core i3-1115G4 3GHz
UHD Graphics Xe G4 48EUs
31.3 31.5 33.7 36.3 39 [X] Acer Aspire 5 A515-56-P8NZ Dual-Channel
Intel Pentium Gold 7505 2GHz
UHD Graphics Xe G4 48EUs
39.4 42.5 ~ 32 fps
100%
UHD Graphics Xe G4 48EUs:
15.8 19.4 19.9 [X] Lenovo IdeaPad 3 14ITL6 82H700CCGE Dual-Channel
Intel Celeron 6305 1.8GHz
UHD Graphics Xe G4 48EUs
21 [X] Lenovo ThinkBook 14 G2 ITL 20VDS02G00 Intel Core i3-1115G4 3GHz
UHD Graphics Xe G4 48EUs
22.1 23.7 23.8 24.2 25.1 26 [X] Acer Aspire 5 A515-56-P8NZ Dual-Channel
Intel Pentium Gold 7505 2GHz
UHD Graphics Xe G4 48EUs
29.6 ~ 23 fps
100%
UHD Graphics Xe G4 48EUs:
14.1 17.3 18.6 [X] Lenovo IdeaPad 3 14ITL6 82H700CCGE Dual-Channel
Intel Celeron 6305 1.8GHz
UHD Graphics Xe G4 48EUs
19.9 [X] Lenovo ThinkBook 14 G2 ITL 20VDS02G00 Intel Core i3-1115G4 3GHz
UHD Graphics Xe G4 48EUs
20.8 22 22.3 22.3 23.2 23.8 [X] Acer Aspire 5 A515-56-P8NZ Dual-Channel
Intel Pentium Gold 7505 2GHz
UHD Graphics Xe G4 48EUs
26.7 ~ 21 fps
Iris Xe G7 80EUs:
11.3 [X] Intel NUC10i5FNK Intel Core i5-1135G7 2.4GHz
Iris Xe G7 80EUs
17 32.5 ~ 20 fps
100%
UHD Graphics Xe G4 48EUs:
14.6 15.8 16.4 [X] Lenovo ThinkBook 14 G2 ITL 20VDS02G00 Intel Core i3-1115G4 3GHz
UHD Graphics Xe G4 48EUs
16.6 19.2 22.3 [X] Lenovo IdeaPad 3 14ITL6 82H700CCGE 1.3, Dual-Channel
Intel Celeron 6305 1.8GHz
UHD Graphics Xe G4 48EUs
24.4 24.4 25.1 [X] Lenovo ThinkBook 14 G2 ITL 20VDS02G00 Intel Core i3-1115G4 3GHz
UHD Graphics Xe G4 48EUs
25.9 [X] Acer Aspire 5 A515-56-P8NZ 1.3, Dual-Channel
Intel Pentium Gold 7505 2GHz
UHD Graphics Xe G4 48EUs
28.5 29.3 ~ 22 fps
100%
UHD Graphics Xe G4 48EUs:
8.9 11.5 12.9 13.1 13.2 [X] Acer Aspire 5 A515-56-P8NZ 1.3, Dual-Channel
Intel Pentium Gold 7505 2GHz
UHD Graphics Xe G4 48EUs
14.8 19 ~ 13 fps
Iris Xe G7 80EUs:
3 5.3 [X] Intel NUC10i5FNK 1.3
Intel Core i5-1135G7 2.4GHz
Iris Xe G7 80EUs
6 ~ 5 fps
100%
UHD Graphics Xe G4 48EUs:
37 [X] GMK NucBox M3 Intel Core i5-12450H 1.5GHz
UHD Graphics Xe G4 48EUs
min:
34.9 fps, max:
-1 fps
46 50.4 [X] Lenovo IdeaPad 3 14ITL6 82H700CCGE Dual-Channel
Intel Celeron 6305 1.8GHz
UHD Graphics Xe G4 48EUs
min:
36.3 fps, max:
-1 fps
68.5 71.1 [X] Lenovo ThinkBook 14 G2 ITL 20VDS02G00 Intel Core i3-1115G4 3GHz
UHD Graphics Xe G4 48EUs
min:
57 fps, max:
-1 fps
73 75.9 83 [X] Lenovo ThinkBook 14 G2 ITL 20VDS02G00 Intel Core i3-1115G4 3GHz
UHD Graphics Xe G4 48EUs
min:
63.8 fps, max:
-1 fps
83.7 85.8 95.5 95.8 [X] Acer Aspire 5 A515-56-P8NZ Dual-Channel
Intel Pentium Gold 7505 2GHz
UHD Graphics Xe G4 48EUs
min:
84.5 fps, max:
-1 fps
~ 72 fps
126%
Iris Xe G7 80EUs:
14.8 [X] LG Gram 17 (2022) Lautlos
Intel Core i5-1240P @2GHz
Iris Xe G7 80EUs
min:
7.9 fps, max:
-1 fps
34 35.9 62.9 65.9 66.2 68 68.2 71.9 71.9 71.9 73.5 [X] Intel NUC10i5FNK Intel Core i5-1135G7 2.4GHz
Iris Xe G7 80EUs
min:
48.9 fps, max:
-1 fps
73.8 73.8 74.1 74.7 74.7 75.2 75.4 75.6 76.2 76.4 76.6 76.6 77.1 77.2 77.3 77.6 78.2 78.2 [X] Lenovo Yoga Slim 7 14ITL05 82A300CNGE Hoechstleistung
Intel Core i5-1135G7 2.4GHz
Iris Xe G7 80EUs
min:
53.3 fps, max:
-1 fps
78.7 78.7 78.7 78.9 80.4 80.9 81.1 81.3 81.4 [X] GPD Win 3 Intel Core i5-1135G7 2.4GHz
Iris Xe G7 80EUs
min:
47.3 fps, max:
-1 fps
81.5 81.5 81.6 81.9 82.4 82.8 83.4 84.5 84.8 84.9 85.8 [X] LG Gram 14T90P Intel Core i5-1135G7 2.4GHz
Iris Xe G7 80EUs
min:
51.3 fps, max:
-1 fps
87.1 87.8 88.6 [X] Acer Extensa 15 EX215-54-5103 Dual-Channel
Intel Core i5-1135G7 2.4GHz
Iris Xe G7 80EUs
min:
74.5 fps, max:
-1 fps
88.7 90.4 91.3 92.4 [X] Lenovo ThinkPad L14 G4 21H1003DGE Intel Core i5-1335U 0.9GHz
Iris Xe G7 80EUs
min:
73.7 fps, max:
-1 fps
93.1 93.8 95.5 95.8 97.5 97.9 98.5 98.5 98.6 98.9 99 100.3 100.7 101 101.2 102 [X] Acer TravelMate P4 TMP414-51-59MR Dual-Channel
Intel Core i5-1135G7 2.4GHz
Iris Xe G7 80EUs
min:
91.6 fps, max:
-1 fps
102.5 102.9 103.6 103.6 103.7 104 [X] LG Gram 14Z90Q Intel Core i5-1240P 1.2GHz
Iris Xe G7 80EUs
min:
85.7 fps, max:
-1 fps
105.3 [X] LG Gram 17 (2022) Hoch
Intel Core i5-1240P 1.2GHz
Iris Xe G7 80EUs
min:
83.8 fps, max:
-1 fps
105.4 106.9 [X] LG Gram 15Z90Q Intel Core i5-1240P 1.2GHz
Iris Xe G7 80EUs
min:
88 fps, max:
-1 fps
107.2 107.3 108.1 108.2 109 109.1 110.3 110.4 111.8 112.1 114.4 116 116.1 116.4 119 119 119.4 123 123 [X] Beelink GTI 11 Intel Core i5-1135G7 2.4GHz
Iris Xe G7 80EUs
min:
107.9 fps, max:
-1 fps
127.6 128 134.4 134.4 140.3 ~ 91 fps
100%
UHD Graphics Xe G4 48EUs:
27.3 31 [X] Acer Aspire 5 A515-56-P8NZ Dual-Channel
Intel Pentium Gold 7505 2GHz
UHD Graphics Xe G4 48EUs
min:
20.6 fps, max:
-1 fps
32.2 [X] Lenovo ThinkBook 14 G2 ITL 20VDS02G00 Intel Core i3-1115G4 3GHz
UHD Graphics Xe G4 48EUs
min:
26 fps, max:
-1 fps
33.1 33.3 35.7 36.2 [X] GMK NucBox M3 Intel Core i5-12450H 1.5GHz
UHD Graphics Xe G4 48EUs
min:
33.9 fps, max:
-1 fps
36.4 36.6 38.9 [X] Lenovo IdeaPad 3 14ITL6 82H700CCGE Dual-Channel
Intel Celeron 6305 1.8GHz
UHD Graphics Xe G4 48EUs
min:
29.2 fps, max:
-1 fps
41 [X] Lenovo ThinkBook 14 G2 ITL 20VDS02G00 Intel Core i3-1115G4 3GHz
UHD Graphics Xe G4 48EUs
min:
31.4 fps, max:
-1 fps
50.8 ~ 36 fps
233%
UHD Graphics 64EUs:
61.1 70.5 [X] NiPoGi AD08 Intel Core i7-12650H 1.7GHz
UHD Graphics 64EUs
min:
55.3 fps, max:
-1 fps
74.6 79.2 [X] NiPoGi CK10 Intel Core i5-12450H 1.5GHz
UHD Graphics 64EUs
min:
64.2 fps, max:
-1 fps
84.1 84.7 [X] NiPoGi AD08 Intel Core i7-12650H 1.7GHz
UHD Graphics 64EUs
min:
65.2 fps, max:
-1 fps
86.5 [X] NiPoGi AD08 Intel Core i7-12650H 1.7GHz
UHD Graphics 64EUs
min:
71.1 fps, max:
-1 fps
88.9 93.4 99.6 100.9 [X] Asus TUF Dash F15 FX517ZR Intel Core i7-12650H 1.7GHz
UHD Graphics 64EUs
min:
80.2 fps, max:
-1 fps
~ 84 fps
189%
Iris Xe G7 80EUs:
10.9 [X] LG Gram 17 (2022) Lautlos
Intel Core i5-1240P @2GHz
Iris Xe G7 80EUs
min:
6.6 fps, max:
-1 fps
21.1 28.3 34 35.7 36.7 41.4 41.4 41.7 41.9 43.3 44.1 46 46.6 47.4 47.6 49.2 49.4 49.9 50.2 51.7 51.8 52.3 52.7 [X] Intel NUC10i5FNK Intel Core i5-1135G7 2.4GHz
Iris Xe G7 80EUs
min:
41 fps, max:
-1 fps
53.7 54.1 54.2 54.4 55.7 56 56.2 57.5 58.8 59.5 59.9 60.5 61.2 61.3 61.7 61.7 62.2 62.8 63.1 63.7 63.9 64 64.1 [X] Lenovo ThinkPad L14 G4 21H1003DGE Intel Core i5-1335U 0.9GHz
Iris Xe G7 80EUs
min:
52.4 fps, max:
-1 fps
64.2 [X] GPD Win 3 Intel Core i5-1135G7 2.4GHz
Iris Xe G7 80EUs
min:
43.4 fps, max:
-1 fps
65 65.1 66.3 67.6 [X] LG Gram 14Z90Q Intel Core i5-1240P 1.2GHz
Iris Xe G7 80EUs
min:
46.7 fps, max:
-1 fps
68.3 68.8 69.5 [X] Lenovo Yoga Slim 7 14ITL05 82A300CNGE Hoechstleistung
Intel Core i5-1135G7 2.4GHz
Iris Xe G7 80EUs
min:
53.1 fps, max:
-1 fps
69.5 [X] Acer Extensa 15 EX215-54-5103 Dual-Channel
Intel Core i5-1135G7 2.4GHz
Iris Xe G7 80EUs
min:
59.4 fps, max:
-1 fps
70 [X] Acer TravelMate P4 TMP414-51-59MR Dual-Channel
Intel Core i5-1135G7 2.4GHz
Iris Xe G7 80EUs
min:
60.1 fps, max:
-1 fps
70.1 70.2 70.2 70.2 70.4 70.5 71.1 71.3 [X] LG Gram 15Z90Q Intel Core i5-1240P 1.2GHz
Iris Xe G7 80EUs
min:
49.5 fps, max:
-1 fps
71.5 72.3 73.3 73.3 [X] LG Gram 14T90P Intel Core i5-1135G7 2.4GHz
Iris Xe G7 80EUs
min:
50.5 fps, max:
-1 fps
73.8 [X] LG Gram 17 (2022) Hoch
Intel Core i5-1240P 1.2GHz
Iris Xe G7 80EUs
min:
57.7 fps, max:
-1 fps
74.3 74.6 74.7 75.2 75.8 76 77.8 78.1 78.7 80.2 80.7 80.9 81 [X] Beelink GTI 11 Intel Core i5-1135G7 2.4GHz
Iris Xe G7 80EUs
min:
68.5 fps, max:
-1 fps
81.5 81.5 82.2 84.2 85 87.2 87.3 87.4 88.3 88.3 88.7 88.7 89 89.9 92 100 101.3 102 109 116 116.6 119.5 119.5 ~ 68 fps
100%
UHD Graphics Xe G4 48EUs:
19.3 20.2 [X] Lenovo ThinkBook 14 G2 ITL 20VDS02G00 Intel Core i3-1115G4 3GHz
UHD Graphics Xe G4 48EUs
min:
14.2 fps, max:
-1 fps
22 23.3 24.1 25.6 [X] Acer Aspire 5 A515-56-P8NZ Dual-Channel
Intel Pentium Gold 7505 2GHz
UHD Graphics Xe G4 48EUs
min:
15.7 fps, max:
-1 fps
25.7 27.5 28.9 [X] Lenovo ThinkBook 14 G2 ITL 20VDS02G00 Intel Core i3-1115G4 3GHz
UHD Graphics Xe G4 48EUs
min:
18.6 fps, max:
-1 fps
33.6 [X] Lenovo IdeaPad 3 14ITL6 82H700CCGE Dual-Channel
Intel Celeron 6305 1.8GHz
UHD Graphics Xe G4 48EUs
min:
25.7 fps, max:
-1 fps
35.4 [X] GMK NucBox M3 Intel Core i5-12450H 1.5GHz
UHD Graphics Xe G4 48EUs
min:
33.8 fps, max:
-1 fps
40.8 ~ 27 fps
185%
UHD Graphics 64EUs:
37.1 43.3 [X] NiPoGi CK10 Intel Core i5-12450H 1.5GHz
UHD Graphics 64EUs
min:
40.5 fps, max:
-1 fps
44.4 44.7 47.9 48.3 [X] NiPoGi AD08 Intel Core i7-12650H 1.7GHz
UHD Graphics 64EUs
min:
44.7 fps, max:
-1 fps
54.8 [X] NiPoGi AD08 Intel Core i7-12650H 1.7GHz
UHD Graphics 64EUs
min:
51.1 fps, max:
-1 fps
55 [X] NiPoGi AD08 Intel Core i7-12650H 1.7GHz
UHD Graphics 64EUs
min:
51.6 fps, max:
-1 fps
57.8 58.3 [X] Asus TUF Dash F15 FX517ZR Intel Core i7-12650H 1.7GHz
UHD Graphics 64EUs
min:
54.2 fps, max:
-1 fps
62.7 ~ 50 fps
156%
Iris Xe G7 80EUs:
10.4 13.2 [X] LG Gram 17 (2022) Lautlos
Intel Core i5-1240P @2GHz
Iris Xe G7 80EUs
min:
5.9 fps, max:
-1 fps
19.6 21.2 22.8 23.5 23.8 24 26.3 27.2 27.4 29.8 30.1 30.1 30.7 31.1 31.2 31.8 32.2 [X] Intel NUC10i5FNK Intel Core i5-1135G7 2.4GHz
Iris Xe G7 80EUs
min:
24.2 fps, max:
-1 fps
32.3 32.4 33 33.1 33.3 [X] LG Gram 14Z90Q Intel Core i5-1240P 1.2GHz
Iris Xe G7 80EUs
min:
28 fps, max:
-1 fps
34.1 34.2 34.6 34.6 34.8 35.1 35.2 35.3 35.7 36 [X] LG Gram 15Z90Q Intel Core i5-1240P 1.2GHz
Iris Xe G7 80EUs
min:
29.7 fps, max:
-1 fps
36.3 36.6 36.6 37.3 37.5 37.6 37.6 37.6 38.7 39.1 39.2 [X] Lenovo Yoga Slim 7 14ITL05 82A300CNGE Hoechstleistung
Intel Core i5-1135G7 2.4GHz
Iris Xe G7 80EUs
min:
22.7 fps, max:
-1 fps
39.3 [X] Acer Extensa 15 EX215-54-5103 Dual-Channel
Intel Core i5-1135G7 2.4GHz
Iris Xe G7 80EUs
min:
35.3 fps, max:
-1 fps
39.5 39.7 [X] Lenovo ThinkPad L14 G4 21H1003DGE Intel Core i5-1335U 0.9GHz
Iris Xe G7 80EUs
min:
36.1 fps, max:
-1 fps
39.9 40 40.6 41.1 41.9 41.9 42.2 42.9 43.5 44.1 [X] Acer TravelMate P4 TMP414-51-59MR Dual-Channel
Intel Core i5-1135G7 2.4GHz
Iris Xe G7 80EUs
min:
39.3 fps, max:
-1 fps
44.3 [X] GPD Win 3 Intel Core i5-1135G7 2.4GHz
Iris Xe G7 80EUs
min:
31 fps, max:
-1 fps
44.7 45.3 45.5 45.8 45.9 46 46 [X] LG Gram 14T90P Intel Core i5-1135G7 2.4GHz
Iris Xe G7 80EUs
min:
28.6 fps, max:
-1 fps
46.9 47 47.2 47.5 47.9 48.2 [X] LG Gram 17 (2022) Hoch
Intel Core i5-1240P 1.2GHz
Iris Xe G7 80EUs
min:
42 fps, max:
-1 fps
48.7 49.1 49.2 49.7 [X] Beelink GTI 11 Intel Core i5-1135G7 2.4GHz
Iris Xe G7 80EUs
min:
44.3 fps, max:
-1 fps
49.8 49.8 49.9 50 50.6 50.7 50.7 50.7 51.1 51.6 51.6 53 53.6 53.8 55 57 57.2 57.4 58 58.2 58.7 60.2 61.8 62.4 62.6 63.2 66.8 70.7 70.9 70.9 ~ 42 fps
100%
UHD Graphics Xe G4 48EUs:
18.9 [X] Lenovo ThinkBook 14 G2 ITL 20VDS02G00 Intel Core i3-1115G4 3GHz
UHD Graphics Xe G4 48EUs
min:
12.5 fps, max:
-1 fps
20 21.1 21.4 22 23.9 [X] Acer Aspire 5 A515-56-P8NZ Dual-Channel
Intel Pentium Gold 7505 2GHz
UHD Graphics Xe G4 48EUs
min:
16 fps, max:
-1 fps
24.5 26.1 27 [X] Lenovo ThinkBook 14 G2 ITL 20VDS02G00 Intel Core i3-1115G4 3GHz
UHD Graphics Xe G4 48EUs
min:
17 fps, max:
-1 fps
32.7 [X] Lenovo IdeaPad 3 14ITL6 82H700CCGE Dual-Channel
Intel Celeron 6305 1.8GHz
UHD Graphics Xe G4 48EUs
min:
26.7 fps, max:
-1 fps
34.7 [X] GMK NucBox M3 Intel Core i5-12450H 1.5GHz
UHD Graphics Xe G4 48EUs
min:
32.5 fps, max:
-1 fps
36 ~ 26 fps
181%
UHD Graphics 64EUs:
34.4 40.4 [X] NiPoGi CK10 Intel Core i5-12450H 1.5GHz
UHD Graphics 64EUs
min:
37.2 fps, max:
-1 fps
41 41.6 43.9 45.1 [X] NiPoGi AD08 Intel Core i7-12650H 1.7GHz
UHD Graphics 64EUs
min:
41.4 fps, max:
-1 fps
50.2 [X] NiPoGi AD08 Intel Core i7-12650H 1.7GHz
UHD Graphics 64EUs
min:
46.8 fps, max:
-1 fps
50.7 [X] NiPoGi AD08 Intel Core i7-12650H 1.7GHz
UHD Graphics 64EUs
min:
47.5 fps, max:
-1 fps
53.3 54 [X] Asus TUF Dash F15 FX517ZR Intel Core i7-12650H 1.7GHz
UHD Graphics 64EUs
min:
49.8 fps, max:
-1 fps
57.5 ~ 47 fps
150%
Iris Xe G7 80EUs:
7.8 [X] LG Gram 17 (2022) Lautlos
Intel Core i5-1240P @2GHz
Iris Xe G7 80EUs
min:
3.8 fps, max:
-1 fps
9.3 13.2 20.8 21.8 22.2 22.2 22.8 24.6 25.1 25.1 27.1 28.5 28.6 28.7 29 29 29.6 30.3 [X] Intel NUC10i5FNK Intel Core i5-1135G7 2.4GHz
Iris Xe G7 80EUs
min:
22.7 fps, max:
-1 fps
30.7 [X] LG Gram 14Z90Q Intel Core i5-1240P 1.2GHz
Iris Xe G7 80EUs
min:
26.4 fps, max:
-1 fps
30.9 31.1 31.2 31.3 31.4 32.3 32.4 32.7 32.7 32.8 33.2 33.7 [X] LG Gram 15Z90Q Intel Core i5-1240P 1.2GHz
Iris Xe G7 80EUs
min:
28.8 fps, max:
-1 fps
33.9 34 34.1 34.2 34.4 34.6 34.7 34.8 34.9 35.1 35.6 35.7 [X] Lenovo Yoga Slim 7 14ITL05 82A300CNGE Hoechstleistung
Intel Core i5-1135G7 2.4GHz
Iris Xe G7 80EUs
min:
20.3 fps, max:
-1 fps
36.1 [X] Acer Extensa 15 EX215-54-5103 Dual-Channel
Intel Core i5-1135G7 2.4GHz
Iris Xe G7 80EUs
min:
32 fps, max:
-1 fps
36.1 36.1 36.8 36.8 [X] Lenovo ThinkPad L14 G4 21H1003DGE Intel Core i5-1335U 0.9GHz
Iris Xe G7 80EUs
min:
32.9 fps, max:
-1 fps
38.3 38.3 38.8 38.9 39.2 39.2 39.4 39.8 40.2 40.2 40.6 [X] LG Gram 17 (2022) Hoch
Intel Core i5-1240P 1.2GHz
Iris Xe G7 80EUs
min:
34.5 fps, max:
-1 fps
40.7 40.7 42.2 [X] LG Gram 14T90P Intel Core i5-1135G7 2.4GHz
Iris Xe G7 80EUs
min:
28 fps, max:
-1 fps
42.2 42.4 [X] Acer TravelMate P4 TMP414-51-59MR Dual-Channel
Intel Core i5-1135G7 2.4GHz
Iris Xe G7 80EUs
min:
36 fps, max:
-1 fps
42.8 43.3 43.6 44 44 44.2 [X] GPD Win 3 Intel Core i5-1135G7 2.4GHz
Iris Xe G7 80EUs
min:
28.1 fps, max:
-1 fps
44.3 44.6 44.9 45 45.1 45.3 45.4 45.5 45.7 45.7 46.5 47 47.1 47.2 [X] Beelink GTI 11 Intel Core i5-1135G7 2.4GHz
Iris Xe G7 80EUs
min:
41.2 fps, max:
-1 fps
47.5 47.9 47.9 48 49.4 50 50.4 50.8 50.9 51.7 52.6 52.6 53.8 54.3 56.3 56.5 56.5 57.1 59.3 64.5 66.1 66.1 ~ 39 fps
Iris Xe G7 80EUs:
11.3 [X] Intel NUC10i5FNK Intel Core i5-1135G7 2.4GHz
Iris Xe G7 80EUs
min:
4.6 fps, max:
-1 fps
18.7 20.6 ~ 17 fps
100%
UHD Graphics Xe G4 48EUs:
20.6 30.8 30.9 [X] Lenovo ThinkBook 14 G2 ITL 20VDS02G00 Intel Core i3-1115G4 3GHz
UHD Graphics Xe G4 48EUs
min:
8.76 fps, P0.1:
9.32 fps, P1:
18.4 fps, max:
60.8 fps
32.4 34.9 [X] Lenovo IdeaPad 3 14ITL6 82H700CCGE Dual-Channel
Intel Celeron 6305 1.8GHz
UHD Graphics Xe G4 48EUs
min:
11.4 fps, P0.1:
14.4 fps, P1:
19.5 fps, max:
58.6 fps
42.7 [X] Acer Aspire 5 A515-56-P8NZ Dual-Channel
Intel Pentium Gold 7505 2GHz
UHD Graphics Xe G4 48EUs
min:
23 fps, P0.1:
23.6 fps, P1:
28.2 fps, max:
80.7 fps
43.8 45.9 [X] Asus P1511CEA-BQ753R Intel Core i3-1115G4 3GHz
UHD Graphics Xe G4 48EUs
min:
2.21 fps, P0.1:
15.6 fps, P1:
26.8 fps, max:
85.3 fps
46.2 61.1 [X] GMK NucBox M3 Intel Core i5-12450H 1.5GHz
UHD Graphics Xe G4 48EUs
min:
39 fps, max:
68 fps
62.3 [X] Realme Book (Slim) Intel Core i3-1115G4 3GHz
UHD Graphics Xe G4 48EUs
min:
56 fps, P1:
56 fps, max:
70 fps
~ 41 fps
163%
UHD Graphics 64EUs:
48 51 59.5 [X] NiPoGi CK10 Intel Core i5-12450H 1.5GHz
UHD Graphics 64EUs
min:
19.9 fps, P0.1:
24.7 fps, P1:
33.7 fps, max:
214 fps
60.8 [X] Geekom Mini IT12 Intel Core i5-12450H 1.5GHz
UHD Graphics 64EUs
min:
17.3 fps, P0.1:
25.8 fps, P1:
34.4 fps, max:
254 fps
62.4 64.3 [X] NiPoGi AD08 Intel Core i7-12650H 1.7GHz
UHD Graphics 64EUs
min:
27.3 fps, P0.1:
29.2 fps, P1:
37 fps, max:
199.8 fps
74 [X] NiPoGi AD08 Intel Core i7-12650H 1.7GHz
UHD Graphics 64EUs
min:
26 fps, P0.1:
29.9 fps, P1:
42.4 fps, max:
267 fps
77.3 [X] NiPoGi AD08 Intel Core i7-12650H 1.7GHz
UHD Graphics 64EUs
min:
33.5 fps, P0.1:
35.5 fps, P1:
45.8 fps, max:
242 fps
78.9 [X] Asus TUF Dash F15 FX517ZR Intel Core i7-12650H 1.7GHz
UHD Graphics 64EUs
min:
7.36 fps, P0.1:
24.8 fps, P1:
43.1 fps, max:
273 fps
80.8 85.3 ~ 67 fps
159%
Iris Xe G7 80EUs:
30.2 33.5 33.6 34.3 35.5 36.1 37 37 37.1 38.8 38.8 39 41.8 42 43 45.6 46.8 47 49.9 50.6 50.7 51.4 51.5 52.6 54 54.2 54.5 54.7 56.4 57.5 [X] Asus F415EA-EK115W Intel Core i5-1135G7 2.4GHz
Iris Xe G7 80EUs
min:
2.8 fps, P0.1:
12.4 fps, P1:
34.9 fps, max:
120.4 fps
57.7 58.3 58.4 58.9 59.1 59.6 59.8 60.1 [X] Acer Extensa 15 EX215-54-5103 Dual-Channel
Intel Core i5-1135G7 2.4GHz
Iris Xe G7 80EUs
min:
3.21 fps, P0.1:
11.5 fps, P1:
33.3 fps, max:
148 fps
60.3 60.6 62.5 63.1 64.5 65 66 66.1 66.2 66.4 [X] Acer TravelMate P4 TMP414-51-59MR Dual-Channel
Intel Core i5-1135G7 2.4GHz
Iris Xe G7 80EUs
min:
28.3 fps, P0.1:
35.6 fps, P1:
43 fps, max:
123 fps
67 67 67.3 69.9 [X] LG Gram 17 (2022) Intel Core i5-1240P 1.2GHz
Iris Xe G7 80EUs
min:
4.99 fps, P0.1:
11.5 fps, P1:
34.4 fps, max:
192.7 fps
70 70 71.4 71.7 72.4 73 73 73 73.6 73.7 74 74.6 74.9 75.5 76.2 77 77.1 [X] Beelink GTI 11 Intel Core i5-1135G7 2.4GHz
Iris Xe G7 80EUs
min:
44 fps, max:
84 fps
77.7 77.8 78 78.3 79 79.8 80 80.3 81.2 81.4 81.4 81.7 81.9 82 82.3 [X] Dynabook Portégé X30W-J-10H Intel Core i5-1135G7 2.4GHz
Iris Xe G7 80EUs
83.5 84 84 84.5 84.8 85 87.1 87.3 87.6 89.1 89.8 [X] LG Gram 14T90P Intel Core i5-1135G7 2.4GHz
Iris Xe G7 80EUs
min:
35 fps, max:
105 fps
90.6 [X] GPD Win 3 Intel Core i5-1135G7 2.4GHz
Iris Xe G7 80EUs
min:
80 fps, max:
101 fps
92.2 97.4 57.5 [X] Asus F415EA-EK115W Intel Core i5-1135G7 2.4GHz
Iris Xe G7 80EUs
min:
2.78 fps, P0.1:
12.7 fps, P1:
35 fps, max:
120.4 fps
~ 65 fps
100%
UHD Graphics Xe G4 48EUs:
15.6 19.8 21.6 27.5 [X] Lenovo IdeaPad 3 14ITL6 82H700CCGE Dual-Channel
Intel Celeron 6305 1.8GHz
UHD Graphics Xe G4 48EUs
min:
12.2 fps, P0.1:
13.2 fps, P1:
18 fps, max:
43.3 fps
27.8 29.8 [X] Acer Aspire 5 A515-56-P8NZ Dual-Channel
Intel Pentium Gold 7505 2GHz
UHD Graphics Xe G4 48EUs
min:
16.1 fps, P0.1:
16.8 fps, P1:
19.2 fps, max:
52.4 fps
30.1 30.6 [X] Asus P1511CEA-BQ753R Intel Core i3-1115G4 3GHz
UHD Graphics Xe G4 48EUs
min:
15.2 fps, P0.1:
16.2 fps, P1:
18.4 fps, max:
77.3 fps
38.6 [X] GMK NucBox M3 Intel Core i5-12450H 1.5GHz
UHD Graphics Xe G4 48EUs
min:
36 fps, max:
41 fps
39.3 [X] Realme Book (Slim) Intel Core i3-1115G4 3GHz
UHD Graphics Xe G4 48EUs
min:
35 fps, P1:
35 fps, max:
42 fps
~ 28 fps
154%
UHD Graphics 64EUs:
31 36.4 [X] NiPoGi CK10 Intel Core i5-12450H 1.5GHz
UHD Graphics 64EUs
min:
17.3 fps, P0.1:
17.8 fps, P1:
20.4 fps, max:
133.7 fps
37 37.5 [X] Geekom Mini IT12 Intel Core i5-12450H 1.5GHz
UHD Graphics 64EUs
min:
4.96 fps, P0.1:
17.4 fps, P1:
20.5 fps, max:
158.5 fps
39 41.5 [X] NiPoGi AD08 Intel Core i7-12650H 1.7GHz
UHD Graphics 64EUs
min:
18.6 fps, P0.1:
19.6 fps, P1:
23.4 fps, max:
152.1 fps
48.9 [X] NiPoGi AD08 Intel Core i7-12650H 1.7GHz
UHD Graphics 64EUs
min:
21.9 fps, P0.1:
23.4 fps, P1:
27.8 fps, max:
179.4 fps
49.8 [X] NiPoGi AD08 Intel Core i7-12650H 1.7GHz
UHD Graphics 64EUs
min:
22.8 fps, P0.1:
24.2 fps, P1:
27.9 fps, max:
193.7 fps
52.4 [X] Asus TUF Dash F15 FX517ZR Intel Core i7-12650H 1.7GHz
UHD Graphics 64EUs
min:
21.3 fps, P0.1:
23.8 fps, P1:
28.3 fps, max:
211 fps
56 ~ 43 fps
150%
Iris Xe G7 80EUs:
21.8 22.6 22.6 22.6 22.7 22.8 23.7 23.9 24.4 26.5 28 29 29.2 29.8 30.4 30.4 31 31.2 31.3 32.1 32.1 32.1 33.4 34.1 35 36.2 36.2 36.3 [X] Asus F415EA-EK115W Intel Core i5-1135G7 2.4GHz
Iris Xe G7 80EUs
min:
1.6 fps, P0.1:
5.6 fps, P1:
22.4 fps, max:
88 fps
36.5 36.5 36.9 37.2 37.5 37.5 37.6 37.6 38.6 38.7 38.9 39.1 [X] Acer Extensa 15 EX215-54-5103 Dual-Channel
Intel Core i5-1135G7 2.4GHz
Iris Xe G7 80EUs
min:
17.2 fps, P0.1:
17.4 fps, P1:
23.2 fps, max:
115 fps
39.4 39.5 40 40.2 40.3 40.6 40.9 41.2 42 42.7 43 43.3 45 45.1 [X] LG Gram 17 (2022) Intel Core i5-1240P 1.2GHz
Iris Xe G7 80EUs
min:
2.75 fps, P0.1:
21.1 fps, P1:
25.5 fps, max:
164.5 fps
45.1 45.2 45.5 46.2 46.6 [X] Beelink GTI 11 Intel Core i5-1135G7 2.4GHz
Iris Xe G7 80EUs
min:
41 fps, max:
55 fps
47 47 47 47 47.7 47.7 47.8 48 48.1 48.1 48.6 48.6 48.7 50.2 50.6 50.9 51 51 51.2 51.7 52 52 52.1 52.3 52.3 52.7 53 53 53.3 [X] LG Gram 17 (2022) Hoch
Intel Core i5-1240P 1.2GHz
Iris Xe G7 80EUs
min:
17.7 fps, P0.1:
25.9 fps, P1:
30.6 fps, max:
131.7 fps
53.4 53.5 53.7 54 [X] Dynabook Portégé X30W-J-10H Intel Core i5-1135G7 2.4GHz
Iris Xe G7 80EUs
54 54 55.1 55.6 [X] GPD Win 3 Intel Core i5-1135G7 2.4GHz
Iris Xe G7 80EUs
min:
52 fps, max:
62 fps
55.6 [X] LG Gram 14T90P Intel Core i5-1135G7 2.4GHz
Iris Xe G7 80EUs
min:
51 fps, max:
59 fps
55.8 56.4 56.9 ~ 42 fps
100%
UHD Graphics Xe G4 48EUs:
8.4 9.5 10.4 14.7 15 15.1 [X] Lenovo IdeaPad 3 14ITL6 82H700CCGE Dual-Channel
Intel Celeron 6305 1.8GHz
UHD Graphics Xe G4 48EUs
min:
7.92 fps, P0.1:
8.33 fps, P1:
9.36 fps, max:
43 fps
15.2 [X] Asus P1511CEA-BQ753R Intel Core i3-1115G4 3GHz
UHD Graphics Xe G4 48EUs
min:
7.99 fps, P0.1:
8.22 fps, P1:
9.43 fps, max:
55.9 fps
15.5 [X] Acer Aspire 5 A515-56-P8NZ Dual-Channel
Intel Pentium Gold 7505 2GHz
UHD Graphics Xe G4 48EUs
min:
8.69 fps, P0.1:
8.71 fps, P1:
11 fps, max:
34.3 fps
20.1 [X] GMK NucBox M3 Intel Core i5-12450H 1.5GHz
UHD Graphics Xe G4 48EUs
min:
17 fps, max:
23 fps
20.7 [X] Realme Book (Slim) Intel Core i3-1115G4 3GHz
UHD Graphics Xe G4 48EUs
min:
17 fps, P1:
17.61 fps, max:
23 fps
~ 14 fps
164%
UHD Graphics 64EUs:
15 19.2 [X] NiPoGi CK10 Intel Core i5-12450H 1.5GHz
UHD Graphics 64EUs
min:
9.37 fps, P0.1:
9.7 fps, P1:
10.7 fps, max:
79.5 fps
20 20 [X] Geekom Mini IT12 Intel Core i5-12450H 1.5GHz
UHD Graphics 64EUs
min:
10.1 fps, P0.1:
11.2 fps, P1:
11.3 fps, max:
78.2 fps
20.2 22.7 [X] NiPoGi AD08 Intel Core i7-12650H 1.7GHz
UHD Graphics 64EUs
min:
11 fps, P0.1:
12 fps, P1:
12.4 fps, max:
86.1 fps
25.7 [X] NiPoGi AD08 Intel Core i7-12650H 1.7GHz
UHD Graphics 64EUs
min:
12.9 fps, P0.1:
13.4 fps, P1:
14.2 fps, max:
112.5 fps
26.2 26.9 [X] Asus TUF Dash F15 FX517ZR Intel Core i7-12650H 1.7GHz
UHD Graphics 64EUs
min:
13.6 fps, P0.1:
13.8 fps, P1:
16.3 fps, max:
107.2 fps
30.1 30.2 [X] NiPoGi AD08 Intel Core i7-12650H 1.7GHz
UHD Graphics 64EUs
min:
5.17 fps, P0.1:
14.7 fps, P1:
16.3 fps, max:
162.3 fps
~ 23 fps
100%
UHD Graphics Xe G4 48EUs:
5.6 5.7 7.7 8.1 [X] Asus P1511CEA-BQ753R Intel Core i3-1115G4 3GHz
UHD Graphics Xe G4 48EUs
min:
4.07 fps, P0.1:
4.28 fps, P1:
5.67 fps, max:
17.8 fps
8.3 8.4 [X] Lenovo IdeaPad 3 14ITL6 82H700CCGE Dual-Channel
Intel Celeron 6305 1.8GHz
UHD Graphics Xe G4 48EUs
min:
4.81 fps, P0.1:
4.84 fps, P1:
4.96 fps, max:
31.4 fps
9.5 [X] GMK NucBox M3 Intel Core i5-12450H 1.5GHz
UHD Graphics Xe G4 48EUs
min:
8 fps, max:
11 fps
10.3 [X] Realme Book (Slim) Intel Core i3-1115G4 3GHz
UHD Graphics Xe G4 48EUs
min:
8 fps, P1:
9 fps, max:
13 fps
~ 8 fps
138%
UHD Graphics 64EUs:
7.1 9.6 [X] NiPoGi CK10 Intel Core i5-12450H 1.5GHz
UHD Graphics 64EUs
min:
4.5 fps, P0.1:
5.38 fps, P1:
5.84 fps, max:
20.2 fps
10 10.2 10.2 [X] Geekom Mini IT12 Intel Core i5-12450H 1.5GHz
UHD Graphics 64EUs
min:
5.61 fps, P0.1:
5.81 fps, P1:
6.02 fps, max:
22.1 fps
11 [X] NiPoGi AD08 Intel Core i7-12650H 1.7GHz
UHD Graphics 64EUs
min:
1.524 fps, P0.1:
4.05 fps, P1:
6.64 fps, max:
69.9 fps
11.4 [X] NiPoGi AD08 Intel Core i7-12650H 1.7GHz
UHD Graphics 64EUs
min:
5.5 fps, P0.1:
6.42 fps, P1:
6.7 fps, max:
26.5 fps
11.4 [X] NiPoGi AD08 Intel Core i7-12650H 1.7GHz
UHD Graphics 64EUs
min:
6.58 fps, P0.1:
6.61 fps, P1:
6.69 fps, max:
25.8 fps
11.9 13.1 [X] Asus TUF Dash F15 FX517ZR Intel Core i7-12650H 1.7GHz
UHD Graphics 64EUs
min:
3.48 fps, P0.1:
4.99 fps, P1:
10.7 fps, max:
39 fps
13.8 ~ 11 fps
138%
Iris Xe G7 80EUs:
6.3 6.6 6.7 6.8 6.8 7 7 7.9 [X] Lenovo ThinkPad L14 G4 21H1003DGE Intel Core i5-1335U 0.9GHz
Iris Xe G7 80EUs
8 8.2 8.4 8.4 8.4 8.5 8.5 9 9.5 9.5 9.5 9.5 9.5 9.5 [X] LG Gram 17 (2022) Intel Core i5-1240P 1.2GHz
Iris Xe G7 80EUs
min:
4.59 fps, P0.1:
4.84 fps, P1:
7.56 fps, max:
17.5 fps
9.7 9.7 9.8 [X] Asus F415EA-EK115W Intel Core i5-1135G7 2.4GHz
Iris Xe G7 80EUs
min:
4.4 fps, P0.1:
4.9 fps, P1:
6.4 fps, max:
31.3 fps
9.8 9.9 10 10 10.2 10.3 [X] Dynabook Portégé X30W-J-10H Intel Core i5-1135G7 2.4GHz
Iris Xe G7 80EUs
10.4 10.4 10.5 10.5 10.6 10.6 10.6 10.7 10.8 10.9 10.9 11 11 [X] Acer TravelMate P4 TMP414-51-59MR Dual-Channel
Intel Core i5-1135G7 2.4GHz
Iris Xe G7 80EUs
min:
3.3 fps, P0.1:
4.73 fps, P1:
8.21 fps, max:
33.4 fps
11 11 11.1 11.1 11.2 11.3 11.5 11.5 [X] Beelink GTI 11 Intel Core i5-1135G7 2.4GHz
Iris Xe G7 80EUs
min:
10 fps, max:
14 fps
11.5 11.6 12 12 12.2 12.2 12.2 12.2 12.3 12.3 12.4 12.4 12.5 12.5 12.6 12.9 13.1 13.1 13.2 13.4 13.4 13.4 13.4 13.5 13.5 13.5 13.6 13.6 13.7 [X] LG Gram 17 (2022) Hoch
Intel Core i5-1240P 1.2GHz
Iris Xe G7 80EUs
min:
6.51 fps, P0.1:
6.63 fps, P1:
10.9 fps, max:
29 fps
13.8 13.9 14 14.1 [X] GPD Win 3 Intel Core i5-1135G7 2.4GHz
Iris Xe G7 80EUs
min:
13 fps, max:
15 fps
14.1 [X] LG Gram 14T90P Intel Core i5-1135G7 2.4GHz
Iris Xe G7 80EUs
min:
12 fps, max:
16 fps
14.4 14.9 15.7 ~ 11 fps
100%
UHD Graphics Xe G4 48EUs:
36.7 [X] Lenovo ThinkBook 14 G2 ITL 20VDS02G00 Intel Core i3-1115G4 3GHz
UHD Graphics Xe G4 48EUs
min:
2.88 fps, P1:
20.8 fps, max:
111 fps
41.6 41.8 43.2 [X] Lenovo IdeaPad 3 14ITL6 82H700CCGE Dual-Channel
Intel Celeron 6305 1.8GHz
UHD Graphics Xe G4 48EUs
min:
1.948 fps, P1:
7.87 fps, max:
116.3 fps
53.7 61.3 [X] Acer Aspire 5 A515-56-P8NZ Dual-Channel
Intel Pentium Gold 7505 2GHz
UHD Graphics Xe G4 48EUs
min:
20.6 fps, P1:
38.5 fps, max:
99.5 fps
66.3 [X] Asus P1511CEA-BQ753R Intel Core i3-1115G4 3GHz
UHD Graphics Xe G4 48EUs
min:
2.52 fps, P1:
33.3 fps, max:
197.2 fps
106.7 [X] GMK NucBox M3 Intel Core i5-12450H 1.5GHz
UHD Graphics Xe G4 48EUs
min:
12.9 fps, P1:
71.4 fps, max:
253 fps
~ 56 fps
195%
UHD Graphics 64EUs:
55.6 [X] HP 250 G9 7N029ES Intel Core i3-1215U 0.9GHz
UHD Graphics 64EUs
min:
1.809 fps, P1:
28.6 fps, max:
86.7 fps
92.6 97.7 [X] NiPoGi AD08 Intel Core i7-12650H 1.7GHz
UHD Graphics 64EUs
min:
29.9 fps, P1:
62.5 fps, max:
254 fps
108.8 [X] NiPoGi CK10 Intel Core i5-12450H 1.5GHz
UHD Graphics 64EUs
min:
14.4 fps, P1:
71.4 fps, max:
217 fps
108.9 [X] Geekom Mini IT12 Intel Core i5-12450H 1.5GHz
UHD Graphics 64EUs
min:
9.13 fps, P1:
71.4 fps, max:
273 fps
116.1 117.3 [X] NiPoGi AD08 Intel Core i7-12650H 1.7GHz
UHD Graphics 64EUs
min:
38 fps, P1:
71.4 fps, max:
196.3 fps
118.3 [X] NiPoGi AD08 Intel Core i7-12650H 1.7GHz
UHD Graphics 64EUs
min:
10.2 fps, P1:
76.9 fps, max:
249 fps
129.9 141.9 [X] Asus TUF Dash F15 FX517ZR Intel Core i7-12650H 1.7GHz
UHD Graphics 64EUs
min:
4.66 fps, P1:
90.9 fps, max:
326 fps
~ 109 fps
148%
Iris Xe G7 80EUs:
36.5 37.2 41.2 [X] Dell Latitude 3520 Intel Core i5-1135G7 2.4GHz
Iris Xe G7 80EUs
min:
7.26 fps, P1:
23.8 fps, max:
74.8 fps
42.3 45.2 48 50 55.5 57.2 57.9 59.5 59.9 60.1 60.9 61.9 62.3 62.9 63.8 64.4 64.7 64.8 [X] Asus F415EA-EK115W Intel Core i5-1135G7 2.4GHz
Iris Xe G7 80EUs
min:
7.45 fps, P1:
30.3 fps, max:
109.4 fps
66.6 [X] LG Gram 14Z90Q Intel Core i5-1240P 1.2GHz
Iris Xe G7 80EUs
min:
10.2 fps, P1:
38.5 fps, max:
116.5 fps
68.8 69 69 69.3 72 73.6 [X] GPD Win 3 Intel Core i5-1135G7 2.4GHz
Iris Xe G7 80EUs
min:
8.49 fps, P1:
50 fps, max:
178 fps
74.6 74.8 75.1 78 78.5 80.5 [X] Acer Extensa 15 EX215-54-5103 Dual-Channel
Intel Core i5-1135G7 2.4GHz
Iris Xe G7 80EUs
min:
7.73 fps, P1:
50 fps, max:
229 fps
80.8 [X] Acer TravelMate P4 TMP414-51-59MR Dual-Channel
Intel Core i5-1135G7 2.4GHz
Iris Xe G7 80EUs
min:
22 fps, P1:
52.6 fps, max:
141 fps
81 83.3 [X] LG Gram 14T90P Intel Core i5-1135G7 2.4GHz
Iris Xe G7 80EUs
min:
16.3 fps, P1:
52.6 fps, max:
141 fps
83.3 84 [X] Dell Latitude 3440 Intel Core i5-1345U 1.2GHz
Iris Xe G7 80EUs
min:
17.2 fps, P1:
50 fps, max:
138.8 fps
84.2 84.3 84.5 85.9 86 87.9 88.7 89.6 [X] LG Gram 17 (2022) Intel Core i5-1240P 1.2GHz
Iris Xe G7 80EUs
min:
11.4 fps, P1:
47.6 fps, max:
140.1 fps
90.9 [X] LG Gram 15Z90Q Intel Core i5-1240P 1.2GHz
Iris Xe G7 80EUs
min:
15.8 fps, P1:
40 fps, max:
147.1 fps
91.2 93.4 94.4 [X] LG Gram 17 (2022) Hoch
Intel Core i5-1240P 1.2GHz
Iris Xe G7 80EUs
min:
18.1 fps, P1:
58.8 fps, max:
147 fps
94.4 95.1 [X] Beelink GTI 11 Intel Core i5-1135G7 2.4GHz
Iris Xe G7 80EUs
min:
21.9 fps, P1:
55.6 fps, max:
151 fps
95.2 97 97.6 98.4 99.1 101.5 101.5 102 102 103.3 104 104.8 107.6 108.2 111.5 111.8 113.1 114.8 114.9 117.5 117.8 119.9 134.7 144.6 ~ 83 fps
100%
UHD Graphics Xe G4 48EUs:
28.1 [X] Lenovo ThinkBook 14 G2 ITL 20VDS02G00 Intel Core i3-1115G4 3GHz
UHD Graphics Xe G4 48EUs
min:
0.3094 fps, P1:
14.5 fps, max:
112 fps
34.9 37.3 45 45.9 [X] Lenovo IdeaPad 3 14ITL6 82H700CCGE Dual-Channel
Intel Celeron 6305 1.8GHz
UHD Graphics Xe G4 48EUs
min:
1.044 fps, P1:
5.05 fps, max:
118.1 fps
51.9 [X] Acer Aspire 5 A515-56-P8NZ Dual-Channel
Intel Pentium Gold 7505 2GHz
UHD Graphics Xe G4 48EUs
min:
17.8 fps, P1:
33.3 fps, max:
79.9 fps
57.1 [X] Asus P1511CEA-BQ753R Intel Core i3-1115G4 3GHz
UHD Graphics Xe G4 48EUs
min:
6.49 fps, P1:
27.8 fps, max:
169.3 fps
90.7 [X] GMK NucBox M3 Intel Core i5-12450H 1.5GHz
UHD Graphics Xe G4 48EUs
min:
31.1 fps, P1:
55.6 fps, max:
153.1 fps
~ 49 fps
186%
UHD Graphics 64EUs:
42.5 [X] HP 250 G9 7N029ES Intel Core i3-1215U 0.9GHz
UHD Graphics 64EUs
min:
6.28 fps, P1:
23.3 fps, max:
109.5 fps
71.8 83 [X] NiPoGi AD08 Intel Core i7-12650H 1.7GHz
UHD Graphics 64EUs
min:
23.4 fps, P1:
50 fps, max:
143.6 fps
90.1 [X] Geekom Mini IT12 Intel Core i5-12450H 1.5GHz
UHD Graphics 64EUs
min:
34.3 fps, P1:
62.5 fps, max:
189 fps
91.9 [X] NiPoGi CK10 Intel Core i5-12450H 1.5GHz
UHD Graphics 64EUs
min:
52.8 fps, P1:
62.5 fps, max:
157.6 fps
97.1 [X] NiPoGi AD08 Intel Core i7-12650H 1.7GHz
UHD Graphics 64EUs
min:
7.77 fps, P1:
62.5 fps, max:
187.8 fps
97.4 100.9 [X] NiPoGi AD08 Intel Core i7-12650H 1.7GHz
UHD Graphics 64EUs
min:
8.17 fps, P1:
62.5 fps, max:
234 fps
113.4 121.2 [X] Asus TUF Dash F15 FX517ZR Intel Core i7-12650H 1.7GHz
UHD Graphics 64EUs
min:
24.1 fps, P1:
76.9 fps, max:
206 fps
~ 91 fps
143%
Iris Xe G7 80EUs:
28.9 31 31.9 32.1 [X] Dell Latitude 3520 Intel Core i5-1135G7 2.4GHz
Iris Xe G7 80EUs
min:
5.01 fps, P1:
17.9 fps, max:
70 fps
34.6 38.4 39.2 41 43.8 44.1 44.9 45.9 46.2 46.4 48.8 50.1 51.2 52.2 54.6 55.5 56.1 [X] Asus F415EA-EK115W Intel Core i5-1135G7 2.4GHz
Iris Xe G7 80EUs
min:
12.4 fps, P1:
31.3 fps, max:
103.8 fps
56.4 57.1 57.6 57.9 [X] LG Gram 14Z90Q Intel Core i5-1240P 1.2GHz
Iris Xe G7 80EUs
min:
13 fps, P1:
32.3 fps, max:
114.8 fps
59 59.5 59.9 60.5 60.9 [X] GPD Win 3 Intel Core i5-1135G7 2.4GHz
Iris Xe G7 80EUs
min:
7.66 fps, P1:
41.7 fps, max:
200 fps
64.4 64.5 [X] Acer TravelMate P4 TMP414-51-59MR Dual-Channel
Intel Core i5-1135G7 2.4GHz
Iris Xe G7 80EUs
min:
20.3 fps, P1:
41.7 fps, max:
105 fps
64.6 [X] Acer Extensa 15 EX215-54-5103 Dual-Channel
Intel Core i5-1135G7 2.4GHz
Iris Xe G7 80EUs
min:
5.99 fps, P1:
41.7 fps, max:
205 fps
64.9 65.4 67.2 [X] Dell Latitude 3440 Intel Core i5-1345U 1.2GHz
Iris Xe G7 80EUs
min:
21.2 fps, P1:
43.5 fps, max:
103.6 fps
68.4 68.8 70 71.3 71.3 71.4 72 74.7 74.9 75.1 [X] LG Gram 14T90P Intel Core i5-1135G7 2.4GHz
Iris Xe G7 80EUs
min:
13.2 fps, P1:
41.7 fps, max:
125.5 fps
76 76.1 [X] LG Gram 17 (2022) Intel Core i5-1240P 1.2GHz
Iris Xe G7 80EUs
min:
12.4 fps, P1:
32.3 fps, max:
123.7 fps
77 79.2 79.5 [X] Beelink GTI 11 Intel Core i5-1135G7 2.4GHz
Iris Xe G7 80EUs
min:
21.5 fps, P1:
50 fps, max:
150 fps
80.1 [X] LG Gram 17 (2022) Hoch
Intel Core i5-1240P 1.2GHz
Iris Xe G7 80EUs
min:
15.6 fps, P1:
41.7 fps, max:
126.4 fps
80.3 82.2 82.2 83.5 [X] LG Gram 15Z90Q Intel Core i5-1240P 1.2GHz
Iris Xe G7 80EUs
min:
16 fps, P1:
45.5 fps, max:
139.1 fps
84 84.3 85.4 86.2 86.9 87 87.2 88.8 89.4 90.5 91 92.5 93.1 [X] Dell Latitude 7440 Intel Core i5-1345U 1.2GHz
Iris Xe G7 80EUs
min:
7.31 fps, P1:
47.6 fps, max:
224 fps
93.3 94.1 95.2 97 98.7 98.7 101 104.6 105.8 111.6 133.8 ~ 70 fps
100%
UHD Graphics Xe G4 48EUs:
8.7 12.4 13.4 14.3 [X] Lenovo IdeaPad 3 14ITL6 82H700CCGE Dual-Channel
Intel Celeron 6305 1.8GHz
UHD Graphics Xe G4 48EUs
min:
0.491 fps, P1:
4.85 fps, max:
94.5 fps
14.7 [X] Acer Aspire 5 A515-56-P8NZ Dual-Channel
Intel Pentium Gold 7505 2GHz
UHD Graphics Xe G4 48EUs
min:
7.6 fps, P1:
10.9 fps, max:
26.9 fps
14.9 [X] Asus P1511CEA-BQ753R Intel Core i3-1115G4 3GHz
UHD Graphics Xe G4 48EUs
min:
0.1323 fps, P1:
5.41 fps, max:
58.3 fps
15 [X] GMK NucBox M3 Intel Core i5-12450H 1.5GHz
UHD Graphics Xe G4 48EUs
min:
10 fps, P1:
11.4 fps, max:
135.2 fps
~ 13 fps
123%
UHD Graphics 64EUs:
8.6 [X] HP 250 G9 7N029ES Intel Core i3-1215U 0.9GHz
UHD Graphics 64EUs
min:
1.921 fps, P1:
4.33 fps, max:
48.3 fps
14.4 [X] Geekom Mini IT12 Intel Core i5-12450H 1.5GHz
UHD Graphics 64EUs
min:
7.59 fps, P1:
11 fps, max:
44.3 fps
14.6 16.4 [X] NiPoGi AD08 Intel Core i7-12650H 1.7GHz
UHD Graphics 64EUs
min:
7.58 fps, P1:
12.8 fps, max:
38.2 fps
16.9 [X] NiPoGi AD08 Intel Core i7-12650H 1.7GHz
UHD Graphics 64EUs
min:
5.82 fps, P1:
13 fps, max:
41.6 fps
17.1 17.6 [X] NiPoGi AD08 Intel Core i7-12650H 1.7GHz
UHD Graphics 64EUs
min:
5.86 fps, P1:
13.2 fps, max:
271 fps
18.5 20.8 [X] Asus TUF Dash F15 FX517ZR Intel Core i7-12650H 1.7GHz
UHD Graphics 64EUs
min:
6.16 fps, P1:
15.6 fps, max:
187.3 fps
~ 16 fps
138%
Iris Xe G7 80EUs:
7.8 8.2 8.5 [X] Dell Latitude 3520 Intel Core i5-1135G7 2.4GHz
Iris Xe G7 80EUs
min:
2.1 fps, P1:
4.76 fps, max:
38.2 fps
8.6 8.8 9.5 9.9 10 10 10 11.1 11.7 11.9 12.3 12.4 13.2 13.2 13.4 13.8 14.2 [X] Dell Latitude 3440 Intel Core i5-1345U 1.2GHz
Iris Xe G7 80EUs
min:
9.29 fps, P1:
10.9 fps, max:
93.5 fps
14.5 [X] LG Gram 14Z90Q Intel Core i5-1240P 1.2GHz
Iris Xe G7 80EUs
min:
5.29 fps, P1:
9.8 fps, max:
45.5 fps
14.8 [X] Asus F415EA-EK115W Intel Core i5-1135G7 2.4GHz
Iris Xe G7 80EUs
min:
0.933 fps, P1:
6.67 fps, max:
89.4 fps
15.2 15.3 15.4 16.2 16.2 16.4 16.6 16.8 16.9 17.1 17.2 17.3 [X] Acer TravelMate P4 TMP414-51-59MR Dual-Channel
Intel Core i5-1135G7 2.4GHz
Iris Xe G7 80EUs
min:
8.84 fps, P1:
13.5 fps, max:
38.1 fps
17.6 [X] Acer Extensa 15 EX215-54-5103 Dual-Channel
Intel Core i5-1135G7 2.4GHz
Iris Xe G7 80EUs
min:
8.95 fps, P1:
13 fps, max:
31.2 fps
17.7 17.9 [X] LG Gram 17 (2022) Intel Core i5-1240P 1.2GHz
Iris Xe G7 80EUs
min:
5.96 fps, P1:
12.8 fps, max:
40.4 fps
18 18.3 18.5 18.7 19.3 19.5 [X] LG Gram 15Z90Q Intel Core i5-1240P 1.2GHz
Iris Xe G7 80EUs
min:
6.61 fps, P1:
13.7 fps, max:
44.3 fps
19.5 19.6 19.9 20 20 20 20.3 [X] LG Gram 17 (2022) Hoch
Intel Core i5-1240P 1.2GHz
Iris Xe G7 80EUs
min:
8.63 fps, P1:
15.6 fps, max:
53 fps
20.7 [X] Dell Latitude 7440 Intel Core i5-1345U 1.2GHz
Iris Xe G7 80EUs
min:
7.69 fps, P1:
15.4 fps, max:
64.5 fps
20.9 21.1 [X] Beelink GTI 11 Intel Core i5-1135G7 2.4GHz
Iris Xe G7 80EUs
min:
8.42 fps, P1:
14.9 fps, max:
119 fps
21.5 21.7 21.8 21.8 22 22.1 22.2 22.5 22.7 23 23.4 23.5 [X] GPD Win 3 Intel Core i5-1135G7 2.4GHz
Iris Xe G7 80EUs
min:
7.14 fps, P1:
14.7 fps, max:
97 fps
23.8 24.3 24.9 24.9 25 25.3 25.7 25.9 [X] LG Gram 14T90P Intel Core i5-1135G7 2.4GHz
Iris Xe G7 80EUs
min:
6.56 fps, P1:
20.4 fps, max:
120.4 fps
26.4 26.5 28.2 29 29.5 32 ~ 18 fps
100%
UHD Graphics Xe G4 48EUs:
5.1 5.2 [X] Asus P1511CEA-BQ753R Intel Core i3-1115G4 3GHz
UHD Graphics Xe G4 48EUs
min:
1.552 fps, P1:
3.44 fps, max:
15.2 fps
6.3 [X] GMK NucBox M3 Intel Core i5-12450H 1.5GHz
UHD Graphics Xe G4 48EUs
min:
3.91 fps, P1:
4.98 fps, max:
34.6 fps
~ 6 fps
117%
UHD Graphics 64EUs:
6.2 [X] Geekom Mini IT12 Intel Core i5-12450H 1.5GHz
UHD Graphics 64EUs
min:
2.8 fps, P1:
3.44 fps, max:
21.6 fps
6.3 7.1 [X] NiPoGi AD08 Intel Core i7-12650H 1.7GHz
UHD Graphics 64EUs
min:
4.34 fps, P1:
5.75 fps, max:
15.9 fps
7.1 [X] NiPoGi AD08 Intel Core i7-12650H 1.7GHz
UHD Graphics 64EUs
min:
3.36 fps, P1:
5.71 fps, max:
35.1 fps
7.4 8 8.9 [X] Asus TUF Dash F15 FX517ZR Intel Core i7-12650H 1.7GHz
UHD Graphics 64EUs
min:
3.82 fps, P1:
4.88 fps, max:
35.4 fps
~ 7 fps
133%
Iris Xe G7 80EUs:
3.1 3.4 [X] Dell Latitude 3520 Intel Core i5-1135G7 2.4GHz
Iris Xe G7 80EUs
min:
0.749 fps, P1:
2.38 fps, max:
7.21 fps
3.4 3.4 4.4 4.4 4.9 4.9 5 5.4 5.7 5.7 5.7 [X] Asus F415EA-EK115W Intel Core i5-1135G7 2.4GHz
Iris Xe G7 80EUs
min:
1.273 fps, P1:
3.98 fps, max:
12.6 fps
6 [X] Dell Latitude 3440 Intel Core i5-1345U 1.2GHz
Iris Xe G7 80EUs
min:
2.98 fps, P1:
3.75 fps, max:
82.9 fps
6 6.1 6.2 6.2 6.5 6.6 [X] Acer TravelMate P4 TMP414-51-59MR Dual-Channel
Intel Core i5-1135G7 2.4GHz
Iris Xe G7 80EUs
min:
3.2 fps, P1:
4.13 fps, max:
16.7 fps
6.7 [X] Acer Extensa 15 EX215-54-5103 Dual-Channel
Intel Core i5-1135G7 2.4GHz
Iris Xe G7 80EUs
min:
3.4 fps, P1:
4.18 fps, max:
18.2 fps
7.2 7.2 7.3 [X] LG Gram 17 (2022) Intel Core i5-1240P 1.2GHz
Iris Xe G7 80EUs
min:
3.57 fps, P1:
4.52 fps, max:
135.5 fps
7.4 7.4 7.4 7.6 7.7 7.8 8.2 [X] Beelink GTI 11 Intel Core i5-1135G7 2.4GHz
Iris Xe G7 80EUs
min:
3.68 fps, P1:
5.03 fps, max:
25.9 fps
8.2 8.4 8.4 8.5 [X] LG Gram 17 (2022) Hoch
Intel Core i5-1240P 1.2GHz
Iris Xe G7 80EUs
min:
3.82 fps, P1:
5.13 fps, max:
27.8 fps
8.5 8.6 8.7 8.7 8.8 [X] Dell Latitude 7440 Intel Core i5-1345U 1.2GHz
Iris Xe G7 80EUs
min:
4.42 fps, P1:
5.46 fps, max:
36.6 fps
8.8 8.8 8.9 9.2 9.2 9.4 9.4 9.5 9.5 9.6 9.7 9.7 9.8 9.9 9.9 9.9 10 10.2 10.3 10.4 10.5 10.5 10.7 11.3 11.4 [X] LG Gram 14T90P Intel Core i5-1135G7 2.4GHz
Iris Xe G7 80EUs
min:
3.49 fps, P1:
9.17 fps, max:
55.5 fps
11.6 ~ 8 fps
UHD Graphics 64EUs:
5.6 [X] Asus TUF Dash F15 FX517ZR Intel Core i7-12650H 1.7GHz
UHD Graphics 64EUs
min:
2.21 fps, P1:
3 fps, max:
30.7 fps
fps
100%
UHD Graphics Xe G4 48EUs:
141.4 fps
100%
UHD Graphics Xe G4 48EUs:
87 fps
100%
UHD Graphics Xe G4 48EUs:
73.3 fps
100%
UHD Graphics Xe G4 48EUs:
22.3 fps
100%
UHD Graphics Xe G4 48EUs:
112.8 [X] Lenovo IdeaPad 3 14ITL6 82H700CCGE Intel Celeron 6305 1.8GHz
UHD Graphics Xe G4 48EUs
min:
62 fps, max:
140 fps
fps
100%
UHD Graphics Xe G4 48EUs:
78 [X] Lenovo IdeaPad 3 14ITL6 82H700CCGE Intel Celeron 6305 1.8GHz
UHD Graphics Xe G4 48EUs
min:
52 fps, max:
96 fps
fps
100%
UHD Graphics Xe G4 48EUs:
47.2 [X] Lenovo IdeaPad 3 14ITL6 82H700CCGE Intel Celeron 6305 1.8GHz
UHD Graphics Xe G4 48EUs
min:
38.8 fps, max:
58 fps
fps
100%
UHD Graphics Xe G4 48EUs:
24.2 [X] Lenovo IdeaPad 3 14ITL6 82H700CCGE Intel Celeron 6305 1.8GHz
UHD Graphics Xe G4 48EUs
min:
20.7 fps, max:
29.7 fps
fps
100%
UHD Graphics Xe G4 48EUs:
86.6 [X] Lenovo ThinkBook 14 G2 ITL 20VDS02G00 Intel Core i3-1115G4 3GHz
UHD Graphics Xe G4 48EUs
fps
100%
UHD Graphics Xe G4 48EUs:
71.6 [X] Lenovo ThinkBook 14 G2 ITL 20VDS02G00 Intel Core i3-1115G4 3GHz
UHD Graphics Xe G4 48EUs
fps
100%
UHD Graphics Xe G4 48EUs:
50.6 [X] Lenovo ThinkBook 14 G2 ITL 20VDS02G00 Intel Core i3-1115G4 3GHz
UHD Graphics Xe G4 48EUs
fps
100%
UHD Graphics Xe G4 48EUs:
25.2 [X] Lenovo ThinkBook 14 G2 ITL 20VDS02G00 Intel Core i3-1115G4 3GHz
UHD Graphics Xe G4 48EUs
fps
100%
UHD Graphics Xe G4 48EUs:
79.7 [X] Lenovo IdeaPad 3 14ITL6 82H700CCGE Intel Celeron 6305 1.8GHz
UHD Graphics Xe G4 48EUs
min:
18.8 fps, P0.1:
34.2 fps, P1:
50.6 fps, max:
113.9 fps
fps
100%
UHD Graphics Xe G4 48EUs:
69.1 [X] Lenovo IdeaPad 3 14ITL6 82H700CCGE Intel Celeron 6305 1.8GHz
UHD Graphics Xe G4 48EUs
min:
33.8 fps, P0.1:
38.2 fps, P1:
51.1 fps, max:
86.9 fps
fps
100%
UHD Graphics Xe G4 48EUs:
64.1 [X] Lenovo IdeaPad 3 14ITL6 82H700CCGE Intel Celeron 6305 1.8GHz
UHD Graphics Xe G4 48EUs
min:
11.6 fps, P0.1:
24.7 fps, P1:
41.7 fps, max:
79.7 fps
fps
100%
UHD Graphics Xe G4 48EUs:
52.1 [X] Lenovo IdeaPad 3 14ITL6 82H700CCGE Intel Celeron 6305 1.8GHz
UHD Graphics Xe G4 48EUs
min:
17.3 fps, P0.1:
23 fps, P1:
37.8 fps, max:
66.8 fps
fps
100%
UHD Graphics Xe G4 48EUs:
138.3 [X] Lenovo IdeaPad 3 14ITL6 82H700CCGE Intel Celeron 6305 1.8GHz
UHD Graphics Xe G4 48EUs
min:
4.63 fps, P0.1:
23.3 fps, P1:
32.9 fps, max:
457 fps
fps
100%
UHD Graphics Xe G4 48EUs:
45.7 [X] Lenovo IdeaPad 3 14ITL6 82H700CCGE Intel Celeron 6305 1.8GHz
UHD Graphics Xe G4 48EUs
min:
2.69 fps, P0.1:
10.1 fps, P1:
18.4 fps, max:
104.3 fps
fps
100%
UHD Graphics Xe G4 48EUs:
37.8 [X] Lenovo IdeaPad 3 14ITL6 82H700CCGE Intel Celeron 6305 1.8GHz
UHD Graphics Xe G4 48EUs
min:
4.48 fps, P0.1:
6.12 fps, P1:
16.3 fps, max:
92 fps
fps
100%
UHD Graphics Xe G4 48EUs:
27.6 [X] Lenovo IdeaPad 3 14ITL6 82H700CCGE Intel Celeron 6305 1.8GHz
UHD Graphics Xe G4 48EUs
min:
2.47 fps, P0.1:
5.08 fps, P1:
19.4 fps, max:
78.6 fps
fps
Average Gaming Intel UHD Graphics Xe G4 48EUs → 100% Average Gaming 30-70 fps → 100%
Average Gaming Intel UHD Graphics 64EUs (Alder Lake 12th Gen) → 159% Average Gaming 30-70 fps → 166%
Average Gaming Intel Iris Xe Graphics G7 80EUs → 139% Average Gaming 30-70 fps → 147%
For more games that might be playable and a list of all games and graphics cards visit our Gaming List
v1.26
log 26. 08:33:57
#0 checking url part for id 10397 +0s ... 0s
#1 checking url part for id 11122 +0s ... 0s
#2 checking url part for id 10395 +0s ... 0s
#3 not redirecting to Ajax server +0s ... 0s
#4 did not recreate cache, as it is less than 5 days old! Created at Thu, 25 Apr 2024 05:40:10 +0200 +0.001s ... 0.001s
#5 composed specs +0.17s ... 0.171s
#6 did output specs +0s ... 0.171s
#7 start showIntegratedCPUs +0s ... 0.171s
#8 getting avg benchmarks for device 10397 +0.065s ... 0.236s
#9 got single benchmarks 10397 +0.105s ... 0.341s
#10 getting avg benchmarks for device 11122 +0.017s ... 0.358s
#11 got single benchmarks 11122 +0.07s ... 0.428s
#12 getting avg benchmarks for device 10395 +0.016s ... 0.445s
#13 got single benchmarks 10395 +0.555s ... 1s
#14 got avg benchmarks for devices +0s ... 1s
#15 min, max, avg, median took s +0.7s ... 1.699s
#16 before gaming benchmark output +0s ... 1.699s
#17 Got 3776 rows for game benchmarks. +0.543s ... 2.243s
#18 composed SQL query for gamebenchmarks +0s ... 2.243s
#19 got data and put it in $dataArray +0.083s ... 2.326s
#20 benchmarks composed for output. +0.264s ... 2.59s
#21 calculated avg scores. +0s ... 2.59s
#22 return log +0.011s ... 2.601s
Please share our article, every link counts!
Redaktion, 2017-09- 8 (Update: 2023-07- 1)
 Deutsch
 English
 Español
 Français
 Italiano
 Nederlands
 Polski
 Português
 Русский
 Türkçe
 Svenska
 Chinese
 Magyar