Intel HD Graphics 4000 vs Intel HD Graphics 4600 vs Intel HD Graphics (Ivy Bridge)
Intel HD Graphics 4000 ► remove from comparison
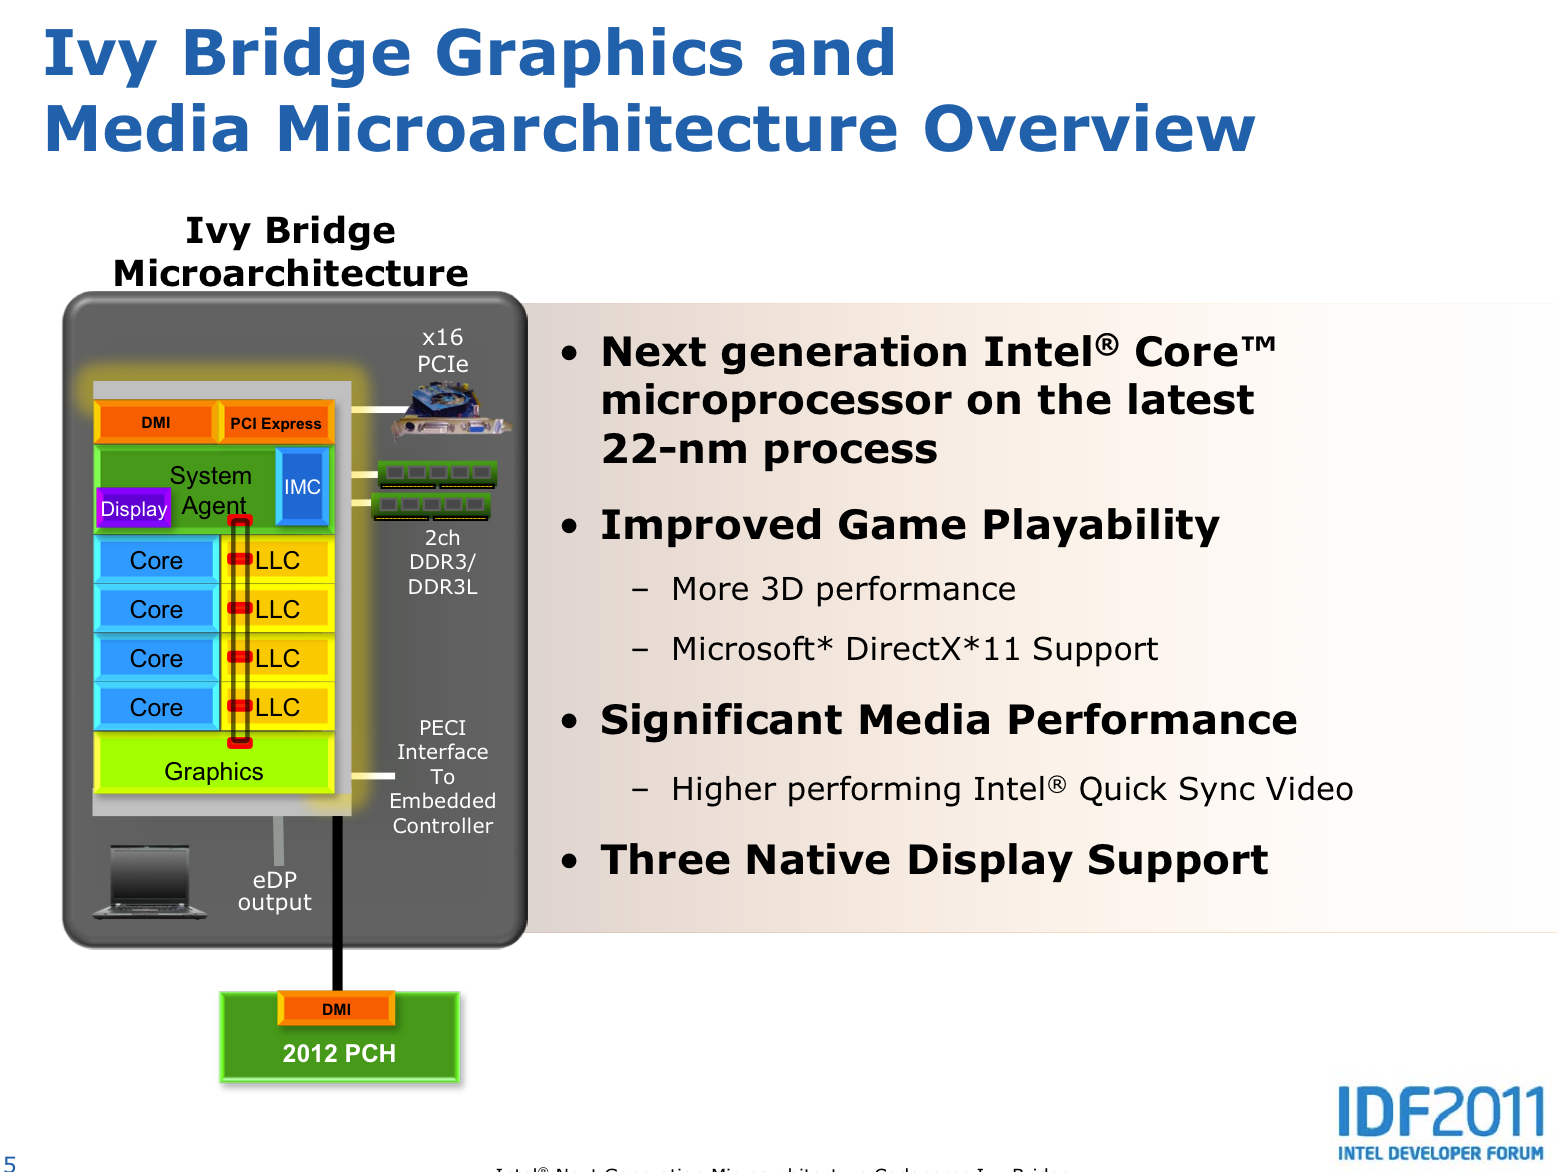
The Intel HD Graphics 4000 (GT2) is a processor graphics card that is included in the Ivy Bridge processors of 2012 (3rd generation of core, e.g. Core i7-3770). The base clock can be automatically overclocked using Turbo Boost technology. Depending on the processor model, the base and turbo clock rate may differ greatly resulting in different graphics performance of ULV parts compared to high-end desktop and laptop quad-core parts.
Compared to the Intel HD Graphics 3000 in Sandy Bridge CPUs , the HD 4000 card was completely redesigned and offers improved DirectX 11 capable shaders, Hardware Tessellation, a dedicated level 3 cache (before the Last Level Cache LLC of the CPU) and DirectCompute support. The IPC (instructions per clock) can therefore be even 2x as fast as with Sandy Bridge and overall up to 60% more performance (3DMark Vantage) should be possible.
First benchmarks position the HD Graphics 4000 (in a fast quad core desktop CPU) on a level with a dedicated Nvidia GeForce GT 330M and therefore above the AMD processor graphics Radeon HD 6620G . In our extensive tests with games the HD Graphics 4000 was able to beat the HD 6620G in a fast Core i7-3820QM by about 15%. In the slower i7-3610QM and a dual core i5 it was on a similar level as the 6620G. Therefore, casual gamers that wont mind reducing the quality settings in high end games, may be happy with the performance of the HD Graphics 4000. Beware, that the HD Graphics 4000 is used with different clock speeds depending on the CPU model. The ULV CPUs (Core ix-3xx7U) for example feature lower clock speeds and cant maintain the Turbo frequency as good as the 35 - 55 Watt models. Therefore, the ULV version is about 30% slower on average.
A speciality of the Ivy Bridge GPUs is that 4x MSAA is supported in hardware now. However, 2x is only supported through software. The algorithm to support 2x is going through the 4x pipeline with a software algorithm, so performance is similar to 4x MSAA.
The integrated video decoder called Multi Format Codec Engine (MFX) was also improved and should allow even simultaneus 4K video decoding. DXVAChecker lists MPEG2, VC1, WMV9, and H264 as supported codecs. QuickSync for fast transcoding of videos was also optimized for higher performance and better image quality.
Another new feature is the support for up to 3 independent displays (depends on how the HD 4000 is used in the laptop - maybe only with a DisplayPort / eDP) as AMD offers with theirs Eyefinity support (up to 6 displays). DisplayPort 1.1 (max 2560x1600) and HDMI 1.4 (max 1920x1080 without hacks ) are supported by the chip according to Intel .
Due to the 22nm 3D Tri-Gate production process, the power consumption should be relatively low (the development was focused on performance per Watt). The TDP of the whole package (including processor and memory controller) varies between 18 Watt (ULV) up to 45 Watt (mobile quad core) for the consumer laptop CPUs.
Intel HD Graphics 4600 ► remove from comparison
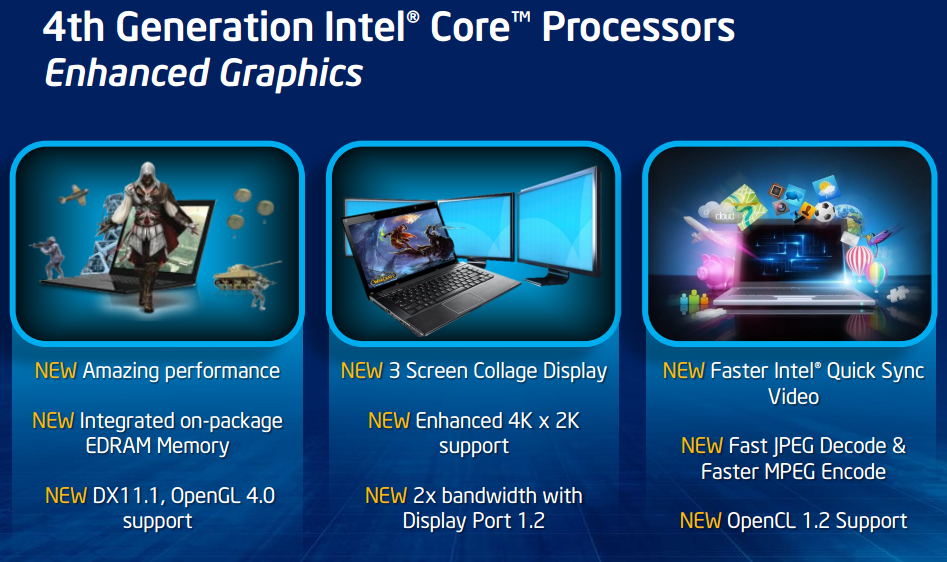
The Intel HD Graphics 4600 (GT2) is a processor graphics card included in some of the Haswell processors of 2013. The base clock can be automatically overclocked using Turbo Boost technology.
Intel HD Graphics (Ivy Bridge) ► remove from comparison
The Intel HD Graphics (Ivy Bridge) is an integrated graphics card in the mobile Ivy Bridge codenamed processors (Celeron and Pentium). It is the successor the the Intel HD Graphics 2000 in the Sandy Bridge CPUs and performs between the old HD 2000 and 3000 GPU .
Compared to the faster HD Graphics 4000 , the HD Graphics features less Execution Units (6 versus 16) and only one texture sampler. Therefore, the performance is clearly worse and only suited for low demanding gaming. Intel states a 10 to 15% higher performance compared to the old Sandy Bridge based HD Graphics 2000 (see our benchmarks below), which is similar to AMDs low-end GPUs like the integrated Radeon HD 8210 . Therefore, only casual games with low requirements are playable.
A speciality of the Ivy Bridge GPUs is that 4x MSAA is supported in hardware now. However, 2x is only supported through software. The algorithm to support 2x is going through the 4x pipeline with a software algorithm, so performance is similar to 4x MSAA.
The integrated video decoder called Multi Format Codec Engine (MFX) was also improved and should allow even simultaneus 4K video decoding. DXVAChecker lists MPEG2, VC1, WMV9, and H264 as supported codecs. QuickSync for fast transcoding of videos was also optimized for higher performance and better image quality.
Another new feature is the support for up to 3 independent displays (maybe only with a DisplayPort) as AMD offers with theirs Eyefinity support (up to 6 displays).
Due to the 22nm 3D Tri-Gate production process, the power consumption should be relatively low (the development was focused on performance per Watt).
Intel HD Graphics 4000 Intel HD Graphics 4600 Intel HD Graphics (Ivy Bridge) HD Graphics Series Codename Ivy Bridge Haswell GT2 Ivy Bridge GT1 Architecture Gen. 7 Ivy Bridge Gen. 7.5 Haswell Gen. 7 Ivy Bridge Pipelines 16 - unified 20 - unified 6 - unified Core Speed 350 - 1350 (Boost) MHz 200 - 1350 (Boost) MHz 350 - 1100 (Boost) MHz Memory Bus Width 64/128 Bit 64/128 Bit 64/128 Bit Shared Memory yes yes yes API DirectX 11, Shader 5.0, OpenGL 3.1 DirectX 11.1, Shader 5.0, OpenGL 4.0 DirectX 11.0, Shader 5.0 technology 22 nm 22 nm 22 nm Features QuickSync QuickSync Date of Announcement 23.03.2011 01.06.2013 01.10.2012
CPU in HD Graphics 4000 GPU Base Speed GPU Boost / Turbo Intel Core i7-3770K 4 x 3500 MHz, 77 W 650 MHz 1150 MHz Intel Core i7-3940XM 4 x 3000 MHz, 55 W 650 MHz 1350 MHz Intel Core i7-3920XM 4 x 2900 MHz, 55 W 650 MHz 1300 MHz » show 36 more Intel Core i7-3840QM 4 x 2800 MHz, 45 W 650 MHz 1300 MHz Intel Core i7-3820QM 4 x 2700 MHz, 45 W 650 MHz 1250 MHz Intel Core i7-3740QM 4 x 2700 MHz, 45 W 650 MHz 1300 MHz Intel Core i7-3720QM 4 x 2600 MHz, 45 W 650 MHz 1250 MHz Intel Core i5-3570K 4 x 3400 MHz, 77 W 650 MHz 1150 MHz Intel Core i7-3635QM 4 x 2400 MHz, 45 W 650 MHz 1200 MHz Intel Core i7-3630QM 4 x 2400 MHz, 45 W 650 MHz 1150 MHz Intel Core i7-3615QM 4 x 2300 MHz, 45 W 650 MHz 1200 MHz Intel Core i7-3610QM 4 x 2300 MHz, 45 W 650 MHz 1100 MHz Intel Core i7-3632QM 4 x 2200 MHz, 35 W 650 MHz 1150 MHz Intel Core i7-3612QM 4 x 2100 MHz, 35 W 650 MHz 1100 MHz Intel Core i7-3540M 2 x 3000 MHz, 35 W 650 MHz 1300 MHz Intel Core i7-3520M 2 x 2900 MHz, 35 W 650 MHz 1250 MHz Intel Core i5-3380M 2 x 2900 MHz, 35 W 650 MHz 1250 MHz Intel Core i5-3360M 2 x 2800 MHz, 35 W 650 MHz 1200 MHz Intel Core i5-3340M 2 x 2700 MHz, 35 W 650 MHz 1250 MHz Intel Core i5-3320M 2 x 2600 MHz, 35 W 650 MHz 1200 MHz Intel Core i5-3230M 2 x 2600 MHz, 35 W 650 MHz 1100 MHz Intel Core i7-3687U 2 x 2100 MHz, 17 W 350 MHz 1200 MHz Intel Core i5-3210M 2 x 2500 MHz, 35 W 650 MHz 1100 MHz Intel Core i7-3667U 2 x 2000 MHz, 17 W 350 MHz 1150 MHz Intel Core i7-3537U 2 x 2000 MHz, 17 W 350 MHz 1200 MHz Intel Core i7-3517U 2 x 1900 MHz, 17 W 350 MHz 1150 MHz Intel Core i3-3130M 2 x 2600 MHz, 35 W 650 MHz 1100 MHz Intel Core i5-3437U 2 x 1900 MHz, 17 W 650 MHz 1200 MHz Intel Core i3-3120M 2 x 2500 MHz, 35 W 650 MHz 1100 MHz Intel Core i5-3427U 2 x 1800 MHz, 17 W 350 MHz 1150 MHz Intel Core i5-3337U 2 x 1800 MHz, 17 W 350 MHz 1100 MHz Intel Core i3-3110M 2 x 2400 MHz, 35 W 650 MHz 1000 MHz Intel Core i5-3317U 2 x 1700 MHz, 17 W 350 MHz 1050 MHz Intel Core i7-3689Y 2 x 1500 MHz, 13 W 350 MHz 850 MHz Intel Core i5-3439Y 2 x 1500 MHz, 13 W 350 MHz 850 MHz Intel Core i3-3227U 2 x 1900 MHz, 17 W 350 MHz 1100 MHz Intel Core i5-3339Y 2 x 1500 MHz, 13 W 350 MHz 850 MHz Intel Core i3-3217U 2 x 1800 MHz, 17 W 350 MHz 1050 MHz Intel Core i3-3229Y 2 x 1400 MHz, 13 W 350 MHz 850 MHz min. - max. 350 - 650 MHz 850 - 1350 MHz
CPU in HD Graphics 4600 GPU Base Speed GPU Boost / Turbo Intel Core i7-4790K 4 x 4000 MHz, 88 W 350 MHz 1250 MHz Intel Core i7-4790 4 x 3600 MHz, 84 W 350 MHz 1200 MHz Intel Core i7-4770K 4 x 3500 MHz, 84 W 400 MHz 1200 MHz » show 40 more Intel Core i7-4790S 4 x 3200 MHz, 65 W 350 MHz 1200 MHz Intel Core i7-4940MX 4 x 3100 MHz, 57 W 400 MHz 1350 MHz Intel Core i7-4930MX 4 x 3000 MHz, 57 W 400 MHz 1350 MHz Intel Core i7-4980HQ 4 x 2800 MHz, 47 W 200 MHz 1300 MHz Intel Core i7-4910MQ 4 x 2900 MHz, 47 W 400 MHz 1300 MHz Intel Core i7-4790T 4 x 2700 MHz, 45 W 350 MHz 1200 MHz Intel Core i7-4900MQ 4 x 2800 MHz, 47 W 400 MHz 1300 MHz Intel Core i7-4960HQ 4 x 2600 MHz, 47 W 200 MHz 1300 MHz Intel Core i7-4810MQ 4 x 2800 MHz, 47 W 400 MHz 1300 MHz Intel Core i7-4800MQ 4 x 2700 MHz, 47 W 400 MHz 1300 MHz Intel Core i7-4720HQ 4 x 2600 MHz, 47 W 400 MHz 1200 MHz Intel Core i7-4710HQ 4 x 2500 MHz, 47 W 400 MHz 1200 MHz Intel Core i7-4710MQ 4 x 2500 MHz, 47 W 400 MHz 1150 MHz Intel Core i7-4700HQ 4 x 2400 MHz, 47 W 400 MHz 1200 MHz Intel Core i7-4700MQ 4 x 2400 MHz, 47 W 400 MHz 1150 MHz Intel Core i7-4722HQ 4 x 2400 MHz, 37 W 400 MHz 1150 MHz Intel Core i5-4590 4 x 3300 MHz, 84 W 350 MHz 1150 MHz Intel Core i7-4712HQ 4 x 2300 MHz, 37 W 400 MHz 1150 MHz Intel Core i7-4712MQ 4 x 2300 MHz, 37 W 400 MHz 1150 MHz Intel Core i7-4702HQ 4 x 2200 MHz, 37 W 400 MHz 1150 MHz Intel Core i7-4702MQ 4 x 2200 MHz, 37 W 400 MHz 1150 MHz Intel Core i5-4460 4 x 3200 MHz, 84 W 350 MHz 1100 MHz Intel Core i5-4430 4 x 3000 MHz, 84 W 350 MHz 1100 MHz Intel Core i7-4610M 2 x 3000 MHz, 37 W 400 MHz 1300 MHz Intel Core i7-4600M 2 x 2900 MHz, 37 W 400 MHz 1300 MHz Intel Core i5-4340M 2 x 2900 MHz, 37 W 400 MHz 1250 MHz Intel Core i5-4210H 2 x 2900 MHz, 47 W 400 MHz 1150 MHz Intel Core i5-4330M 2 x 2800 MHz, 37 W 400 MHz 1250 MHz Intel Core i5-4200H 2 x 2800 MHz, 47 W 400 MHz 1150 MHz Intel Core i5-4310M 2 x 2700 MHz, 37 W 400 MHz 1250 MHz Intel Core i5-4400E 2 x 2700 MHz, 37 W 400 MHz 1000 MHz Intel Core i5-4300M 2 x 2600 MHz, 37 W 400 MHz 1250 MHz Intel Core i5-4210M 2 x 2600 MHz, 37 W 400 MHz 1150 MHz Intel Core i5-4200M 2 x 2500 MHz, 37 W 400 MHz 1150 MHz Intel Core i3-4110M 2 x 2600 MHz, 37 W 400 MHz 1100 MHz Intel Core i3-4100M 2 x 2500 MHz, 37 W 400 MHz 1100 MHz Intel Core i3-4000M 2 x 2400 MHz, 37 W 400 MHz 1100 MHz Intel Core i3-4100E 2 x 2400 MHz, 37 W 400 MHz 900 MHz Intel Core i5-4402E 2 x 1600 MHz, 25 W 400 MHz 900 MHz Intel Core i3-4102E 2 x 1600 MHz, 25 W 400 MHz 900 MHz min. - max. 200 - 650 MHz 850 - 1350 MHz
CPU in HD Graphics (Ivy Bridge) GPU Base Speed GPU Boost / Turbo Intel Pentium 2030M 2 x 2500 MHz, 35 W 650 MHz 1100 MHz Intel Pentium 2020M 2 x 2400 MHz, 35 W 650 MHz 1100 MHz Intel Celeron 1020E 2 x 2200 MHz, 35 W 650 MHz 1000 MHz » show 12 more Intel Celeron 1020M 2 x 2100 MHz, 35 W 650 MHz 1000 MHz Intel Pentium 2127U 2 x 1900 MHz, 17 W 350 MHz 1100 MHz Intel Celeron 1005M 2 x 1900 MHz, 35 W 650 MHz 1000 MHz Intel Pentium 2117U 2 x 1800 MHz, 17 W 350 MHz 1000 MHz Intel Celeron 1000M 2 x 1800 MHz, 35 W 650 MHz 1000 MHz Intel Celeron 1037U 2 x 1800 MHz, 17 W 350 MHz 1000 MHz Intel Celeron 1017U 2 x 1600 MHz, 17 W 350 MHz 1000 MHz Intel Celeron 1007U 2 x 1500 MHz, 17 W 350 MHz 1000 MHz Intel Celeron 1047UE 2 x 1400 MHz, 17 W 350 MHz 900 MHz Intel Pentium 2129Y 2 x 1100 MHz, 10 W 350 MHz 850 MHz Intel Celeron 1019Y 2 x 1000 MHz, 10 W 350 MHz 800 MHz Intel Celeron 927UE 1 x 1500 MHz, 17 W 350 MHz 900 MHz min. - max. 200 - 650 MHz 800 - 1350 MHz
Benchmarks Performance Rating - 3DMark 11 + Fire Strike + Time Spy - HD Graphics 4000
0.2 pt (1%)
...
...
max:
Performance Rating - 3DMark 11 + Fire Strike + Time Spy - HD Graphics 4600
0.3 pt (1%)
...
...
max:
Performance Rating - 3DMark 11 + Fire Strike + Time Spy - HD Graphics (Ivy Bridge)
0.1 pt (0%)
...
Intel HD Graphics (Ivy Bridge)
...
max:
3DMark - 3DMark Ice Storm Unlimited Graphics
min: 43759 avg: 44324 median: 44323.5 (5%) max: 44888 Points
min: 42224 avg: 42243 median: 42242.5 (5%) max: 42261 Points
3DMark - 3DMark Ice Storm Extreme Graphics
min: 20514 avg: 24179 median: 24426 (3%) max: 28772 Points
min: 20937 avg: 25956 median: 22583 (3%) max: 34347 Points
3DMark - 3DMark Cloud Gate Score
min: 1469 avg: 3380 median: 3282.5 (4%) max: 5946 Points
min: 3322 avg: 5276 median: 5040.5 (5%) max: 7233 Points
min: 1478 avg: 1898 median: 1906.5 (2%) max: 2207 Points
3DMark - 3DMark Cloud Gate Graphics
min: 1619 avg: 3850 median: 3768.5 (1%) max: 5761 Points
min: 3892 avg: 5865 median: 5613 (1%) max: 7536 Points
min: 2116 avg: 2283 median: 2286 (1%) max: 2470 Points
3DMark - 3DMark Fire Strike Standard Score
min: 168 avg: 446.5 median: 444 (1%) max: 647 Points
min: 432 avg: 650 median: 592.5 (1%) max: 904 Points
min: 208 avg: 253.6 median: 254.5 (0%) max: 275 Points
3DMark - 3DMark Fire Strike Standard Graphics
min: 191 avg: 486.1 median: 480 (1%) max: 705 Points
min: 499 avg: 703 median: 635.5 (1%) max: 978 Points
min: 248 avg: 286.2 median: 285.5 (0%) max: 305 Points
3DMark - 3DMark Ice Storm Graphics
min: 11232 avg: 31858 median: 31598 (4%) max: 48923 Points
min: 31725 avg: 47455 median: 48631 (6%) max: 64426 Points
min: 22834 avg: 24734 median: 24209.5 (3%) max: 29149 Points
3DMark 11 - 3DM11 Performance Score
min: 248 avg: 603 median: 603 (1%) max: 802 Points
min: 655 avg: 1060 median: 1041 (1%) max: 1464 Points
min: 258 avg: 363.3 median: 370.5 (1%) max: 413 Points
3DMark 11 - 3DM11 Performance GPU
min: 216 avg: 522 median: 523 (0%) max: 684 Points
min: 572 avg: 926 median: 910.5 (1%) max: 1258 Points
min: 218 avg: 310.6 median: 315 (0%) max: 352 Points
3DMark Vantage + Intel HD Graphics 4000 3DMark Vantage - 3DM Vant. Perf. total
min: 830 avg: 2985 median: 2959 (1%) max: 4433 Points
3DM Vant. Perf. total + Intel HD Graphics 4600
min: 3077 avg: 4802 median: 5203 (2%) max: 6304 Points
3DM Vant. Perf. total + Intel HD Graphics (Ivy Bridge) min: 930 avg: 1465 median: 1491 (0%) max: 1691 Points
3DM Vant. Perf. GPU no PhysX + Intel HD Graphics 4000 3DMark Vantage - 3DM Vant. Perf. GPU no PhysX
min: 659 avg: 2441 median: 2415 (1%) max: 3488 Points
3DM Vant. Perf. GPU no PhysX + Intel HD Graphics 4600
min: 2504 avg: 3860 median: 4132 (2%) max: 5041 Points
3DM Vant. Perf. GPU no PhysX + Intel HD Graphics (Ivy Bridge)
min: 728 avg: 1186 median: 1213 (1%) max: 1360 Points
3DMark 2001SE - 3DMark 2001 - Standard
min: 8967 avg: 14343 median: 15220 (16%) max: 16933 Points
38441 Points (40%)
min: 8075 avg: 9212 median: 9212 (10%) max: 10349 Points
3DMark 03 - 3DMark 03 - Standard
min: 7402 avg: 11805 median: 12768 (7%) max: 19294 Points
min: 18916 avg: 21326 median: 22200 (12%) max: 22861 Points
min: 5909 avg: 7584 median: 7434 (4%) max: 10124 Points
3DMark 05 - 3DMark 05 - Standard
min: 5239 avg: 8296 median: 8393 (9%) max: 11948 Points
min: 13616 avg: 15058 median: 15760 (17%) max: 15797 Points
min: 3839 avg: 5085 median: 5186 (6%) max: 6252 Points
3DMark 06 3DMark 06 - Score Unknown Settings + Intel HD Graphics 4000
4276 Points (6%)
3DMark 06 - Standard 1280x1024 + Intel HD Graphics 4000
min: 1605 avg: 4588 median: 4412.5 (6%) max: 7159 Points
3DMark 06 - Standard 1280x1024 + Intel HD Graphics 4600
min: 4468 avg: 6795 median: 7362 (10%) max: 8819 Points
3DMark 06 - Standard 1280x1024 + Intel HD Graphics (Ivy Bridge)
min: 2186 avg: 2949 median: 2930 (4%) max: 3573 Points
Unigine Heaven 3.0 - Unigine Heaven 3.0 DX 11
min: 6.9 avg: 7.6 median: 7.4 (2%) max: 8.9 fps
min: 13.5 avg: 14.4 median: 14.4 (5%) max: 15.2 fps
Unigine Heaven 3.0 - Unigine Heaven 3.0 OpenGL
min: 7.7 avg: 8.1 median: 8.1 (4%) max: 8.4 fps
min: 15.2 avg: 15.5 median: 15.5 (7%) max: 15.8 fps
Unigine Heaven 2.1 - Heaven 2.1 high
min: 6 avg: 9.6 median: 9.4 (2%) max: 13 fps
15.3 fps (3%)
SPECviewperf 11 + Intel HD Graphics 4000 SPECviewperf 11 - specvp11 snx-01
min: 0.69 avg: 1.1 median: 1.2 (1%) max: 1.47 fps
specvp11 snx-01 + Intel HD Graphics 4600
min: 2.26 avg: 2.4 median: 2.4 (1%) max: 2.64 fps
specvp11 snx-01 + Intel HD Graphics (Ivy Bridge)
min: 0.75 avg: 0.8 median: 0.8 (0%) max: 0.87 fps
specvp11 tcvis-02 + Intel HD Graphics 4000 SPECviewperf 11 - specvp11 tcvis-02
min: 1.43 avg: 1.9 median: 2.1 (1%) max: 2.27 fps
specvp11 tcvis-02 + Intel HD Graphics 4600
min: 2.77 avg: 3.3 median: 3.3 (2%) max: 3.9 fps
specvp11 tcvis-02 + Intel HD Graphics (Ivy Bridge)
min: 1.31 avg: 1.5 median: 1.5 (1%) max: 1.66 fps
specvp11 sw-02 + Intel HD Graphics 4000 SPECviewperf 11 - specvp11 sw-02
min: 3.98 avg: 6.9 median: 7.5 (6%) max: 8.45 fps
specvp11 sw-02 + Intel HD Graphics 4600
min: 11.97 avg: 13.3 median: 13.4 (10%) max: 14.48 fps
specvp11 sw-02 + Intel HD Graphics (Ivy Bridge)
min: 4.68 avg: 5.3 median: 5.3 (4%) max: 5.88 fps
specvp11 proe-05 + Intel HD Graphics 4000 SPECviewperf 11 - specvp11 proe-05
min: 0.62 avg: 1.1 median: 1.2 (1%) max: 1.47 fps
specvp11 proe-05 + Intel HD Graphics 4600
min: 2.26 avg: 2.5 median: 2.5 (3%) max: 2.69 fps
specvp11 proe-05 + Intel HD Graphics (Ivy Bridge)
min: 0.91 avg: 1.1 median: 1.1 (1%) max: 1.19 fps
specvp11 maya-03 + Intel HD Graphics 4000 SPECviewperf 11 - specvp11 maya-03
min: 7.12 avg: 10.2 median: 9.7 (7%) max: 13.09 fps
specvp11 maya-03 + Intel HD Graphics 4600
min: 10.22 avg: 14.8 median: 15.2 (11%) max: 18.57 fps
specvp11 maya-03 + Intel HD Graphics (Ivy Bridge)
min: 8.71 avg: 8.8 median: 8.8 (7%) max: 8.93 fps
specvp11 lightwave-01 + Intel HD Graphics 4000 SPECviewperf 11 - specvp11 lightwave-01
min: 5.67 avg: 10.2 median: 11.1 (12%) max: 12.55 fps
specvp11 lightwave-01 + Intel HD Graphics 4600
min: 14.77 avg: 17.8 median: 18.2 (20%) max: 20.05 fps
specvp11 lightwave-01 + Intel HD Graphics (Ivy Bridge)
min: 7.83 avg: 8.9 median: 8.9 (10%) max: 10.03 fps
specvp11 ensight-04 + Intel HD Graphics 4000 SPECviewperf 11 - specvp11 ensight-04
min: 1.06 avg: 1.6 median: 1.7 (1%) max: 2.24 fps
specvp11 ensight-04 + Intel HD Graphics 4600
min: 1.94 avg: 2.3 median: 2.4 (1%) max: 2.47 fps
specvp11 ensight-04 + Intel HD Graphics (Ivy Bridge)
min: 1.27 avg: 1.4 median: 1.4 (1%) max: 1.51 fps
specvp11 catia-03 + Intel HD Graphics 4000 SPECviewperf 11 - specvp11 catia-03
0 fps (0%)
specvp11 catia-03 + Intel HD Graphics 4600
6.6 fps (3%)
specvp11 catia-03 + Intel HD Graphics (Ivy Bridge) 0 fps (0%)
SPECviewperf 12 + Intel HD Graphics 4600 SPECviewperf 12 - specvp12 sw-03
2 fps (1%)
specvp12 snx-02 + Intel HD Graphics 4600 SPECviewperf 12 - specvp12 snx-02
2.6 fps (0%)
specvp12 showcase-01 + Intel HD Graphics 4600 SPECviewperf 12 - specvp12 showcase-01
11.8 fps (3%)
specvp12 mediacal-01 + Intel HD Graphics 4600 SPECviewperf 12 - specvp12 mediacal-01
2.1 fps (1%)
specvp12 maya-04 + Intel HD Graphics 4600 SPECviewperf 12 - specvp12 maya-04
10.9 fps (3%)
specvp12 energy-01 + Intel HD Graphics 4600 SPECviewperf 12 - specvp12 energy-01
14.9 fps (13%)
specvp12 creo-01 + Intel HD Graphics 4600 SPECviewperf 12 - specvp12 creo-01
2.4 fps (1%)
Windows 7 Experience Index - Win7 Gaming graphics
min: 5.9 avg: 6.4 median: 6.4 (81%) max: 6.6 Points
min: 6.5 avg: 6.6 median: 6.5 (82%) max: 6.7 Points
6.2 Points (78%)
Windows 7 Experience Index - Win7 Graphics
min: 4.7 avg: 5.6 median: 5.1 (65%) max: 6.6 Points
min: 5 avg: 5.5 median: 5.2 (66%) max: 6.7 Points
min: 4.6 avg: 4.7 median: 4.7 (59%) max: 4.7 Points
Cinebench R10 Cinebench R10 Shading (32bit) + Intel HD Graphics 4000 Cinebench R10 - Cinebench R10 Shading (32bit)
min: 2447 avg: 5020 median: 5157 (4%) max: 8562 Points
Cinebench R10 Shading (32bit) + Intel HD Graphics 4600
min: 5784 avg: 7238 median: 7168.5 (5%) max: 9402 Points
Cinebench R10 Shading (32bit) + Intel HD Graphics (Ivy Bridge)
min: 2410 avg: 3337 median: 3382 (2%) max: 4037 Points
Cinebench R11.5 Cinebench R11.5 OpenGL 64 Bit + Intel HD Graphics 4000 Cinebench R11.5 - Cinebench R11.5 OpenGL 64 Bit
min: 5.58 avg: 14.4 median: 13.6 (5%) max: 22.54 fps
Cinebench R11.5 OpenGL 64 Bit + Intel HD Graphics 4600
min: 12.85 avg: 20.3 median: 20.7 (7%) max: 33.19 fps
Cinebench R11.5 OpenGL 64 Bit + Intel HD Graphics (Ivy Bridge)
min: 6.62 avg: 9.1 median: 9.2 (3%) max: 11.32 fps
Cinebench R15 + Intel HD Graphics 4000 Cinebench R15 - Cinebench R15 OpenGL 64 Bit
min: 8.47 avg: 11.9 median: 11.9 (1%) max: 15.35 fps
Cinebench R15 OpenGL 64 Bit + Intel HD Graphics 4600
min: 17.03 avg: 20.9 median: 18.8 (1%) max: 33.96 fps
Cinebench R15 OpenGL Ref. Match 64 Bit + Intel HD Graphics 4000 Cinebench R15 - Cinebench R15 OpenGL Ref. Match 64 Bit
min: 32.2 avg: 50.9 median: 32.2 (32%) max: 97.8 %
Cinebench R15 OpenGL Ref. Match 64 Bit + Intel HD Graphics 4600
min: 63.3 avg: 92.9 median: 98 (98%) max: 99.6 %
GFXBench (DX / GLBenchmark) 2.7 + Intel HD Graphics 4000 GFXBench (DX / GLBenchmark) 2.7 - GFXBench T-Rex HD Offscreen C24Z16
min: 31 avg: 40.1 median: 39 (0%) max: 49 fps
GFXBench T-Rex HD Offscreen C24Z16 + Intel HD Graphics 4600
78 fps (1%)
GFXBench T-Rex HD Offscreen C24Z16 + Intel HD Graphics (Ivy Bridge) 27 fps (0%)
LuxMark v2.0 64Bit - LuxMark v2.0 Room GPU
min: 31 avg: 46.9 median: 34 (0%) max: 163 Samples/s
min: 166 avg: 197 median: 185 (1%) max: 252 Samples/s
min: 27 avg: 38.3 median: 44 (0%) max: 44 Samples/s
LuxMark v2.0 64Bit - LuxMark v2.0 Sala GPU
min: 50 avg: 79.4 median: 66 (0%) max: 251 Samples/s
min: 262 avg: 305.5 median: 284.5 (0%) max: 391 Samples/s
44 Samples/s (0%)
ComputeMark v2.1 - ComputeMark v2.1 Result
min: 31 avg: 514 median: 537 (1%) max: 630 Points
min: 665 avg: 741 median: 767 (1%) max: 816 Points
min: 190 avg: 266.4 median: 275 (0%) max: 290 Points
Power Consumption - Furmark Stress Test Power Consumption - external Monitor *
97 Watt (14%)
Power Consumption - The Witcher 3 Power Consumption - external Monitor *
90 Watt (13%)
Average Benchmarks Intel HD Graphics 4000 → 100% n=28 Average Benchmarks Intel HD Graphics 4600 → 186% n=28 Average Benchmarks Intel HD Graphics (Ivy Bridge) → 70% n=28
- Range of benchmark values for this graphics card
- Average benchmark values for this graphics card
* Smaller numbers mean a higher performance
1 This benchmark is not used for the average calculation
Game Benchmarks The following benchmarks stem from our benchmarks of review laptops. The performance depends on the used graphics memory, clock rate, processor, system settings, drivers, and operating systems. So the results don't have to be representative for all laptops with this GPU. For detailed information on the benchmark results, click on the fps number.
HD Graphics 4600:
6.6 [X] MSI CX61-i572M281BW7 Intel Core i5-4200M 2.5GHz
HD Graphics 4600
min:
1.899 fps, P0.1:
1.96 fps, P1:
3.76 fps, max:
18.1 fps
fps
HD Graphics 4600:
27.7 [X] MSI CX61-i572M281BW7 Intel Core i5-4200M 2.5GHz
HD Graphics 4600
min:
21.4 fps, P0.1:
21.4 fps, P1:
23 fps, max:
34.7 fps
fps
HD Graphics 4600:
13.8 [X] MSI CX61-i572M281BW7 Intel Core i5-4200M 2.5GHz
HD Graphics 4600
min:
9.76 fps, P0.1:
10.1 fps, P1:
11.9 fps, max:
16.1 fps
fps
HD Graphics 4600:
7.1 (!) [X] MSI CX61-i572M281BW7 Intel Core i5-4200M 2.5GHz
HD Graphics 4600
min:
2.26 fps, P0.1:
2.71 fps, P1:
5.43 fps, max:
32.6 fps
fps
HD Graphics 4600:
14.3 [X] MSI CX61-i572M281BW7 Intel Core i5-4200M 2.5GHz
HD Graphics 4600
min:
0.532 fps, P0.1:
1.007 fps, P1:
4.05 fps, max:
35.1 fps
fps
HD Graphics 4600:
8.7 [X] MSI CX61-i572M281BW7 Intel Core i5-4200M 2.5GHz
HD Graphics 4600
min:
3.1 fps, P0.1:
3.13 fps, P1:
3.49 fps, max:
17.7 fps
fps
HD Graphics 4600:
11 [X] MSI CX61-i572M281BW7 Intel Core i5-4200M 2.5GHz
HD Graphics 4600
min:
3.89 fps, P0.1:
4.03 fps, P1:
8.19 fps, max:
27.8 fps
fps
HD Graphics 4600:
8.3 [X] MSI CX61-i572M281BW7 Intel Core i5-4200M 2.5GHz
HD Graphics 4600
min:
4.87 fps, P0.1:
5.74 fps, P1:
6.87 fps, max:
20.4 fps
fps
HD Graphics 4600:
8.7 [X] MSI CX61-i572M281BW7 Intel Core i5-4200M 2.5GHz
HD Graphics 4600
fps
HD Graphics 4600:
9.7 [X] MSI CX61-i572M281BW7 Intel Core i5-4200M 2.5GHz
HD Graphics 4600
fps
HD Graphics 4600:
5.6 [X] MSI CX61-i572M281BW7 Intel Core i5-4200M 2.5GHz
HD Graphics 4600
fps
HD Graphics 4600:
11.6 [X] MSI CX61-i572M281BW7 Intel Core i5-4200M 2.5GHz
HD Graphics 4600
fps
HD Graphics 4600:
32.1 [X] MSI CX61-i572M281BW7 Intel Core i5-4200M 2.5GHz
HD Graphics 4600
fps
HD Graphics 4600:
9.3 [X] MSI CX61-i572M281BW7 Intel Core i5-4200M 2.5GHz
HD Graphics 4600
fps
HD Graphics 4600:
10.4 [X] MSI CX61-i572M281BW7 Intel Core i5-4200M 2.5GHz
HD Graphics 4600
fps
HD Graphics 4600:
15 [X] MSI CX61-i572M281BW7 Intel Core i5-4200M 2.5GHz
HD Graphics 4600
fps
HD Graphics 4600:
15.9 [X] MSI CX61-i572M281BW7 Intel Core i5-4200M 2.5GHz
HD Graphics 4600
min:
14 fps, max:
17 fps
fps
HD Graphics 4600:
14.7 [X] MSI CX61-i572M281BW7 Intel Core i5-4200M 2.5GHz
HD Graphics 4600
fps
HD Graphics 4600:
12 [X] MSI CX61-i572M281BW7 Intel Core i5-4200M 2.5GHz
HD Graphics 4600
fps
HD Graphics 4600:
23.5 [X] MSI CX61-i572M281BW7 Intel Core i5-4200M 2.5GHz
HD Graphics 4600
fps
HD Graphics 4600:
6 [X] MSI CX61-i572M281BW7 Intel Core i5-4200M 2.5GHz
HD Graphics 4600
fps
HD Graphics 4600:
9 [X] MSI CX61-i572M281BW7 Intel Core i5-4200M 2.5GHz
HD Graphics 4600
fps
HD Graphics 4600:
5 [X] MSI CX61-i572M281BW7 Intel Core i5-4200M 2.5GHz
HD Graphics 4600
fps
HD Graphics 4600:
16.8 [X] MSI CX61-i572M281BW7 Intel Core i5-4200M 2.5GHz
HD Graphics 4600
fps
HD Graphics 4600:
10.5 [X] MSI CX61-i572M281BW7 Intel Core i5-4200M 2.5GHz
HD Graphics 4600
fps
HD Graphics 4600:
18.7 [X] MSI CX61-i572M281BW7 Intel Core i5-4200M 2.5GHz
HD Graphics 4600
fps
HD Graphics 4600:
7.9 [X] MSI CX61-i572M281BW7 Intel Core i5-4200M 2.5GHz
HD Graphics 4600
fps
HD Graphics 4600:
12 [X] MSI CX61-i572M281BW7 Intel Core i5-4200M 2.5GHz
HD Graphics 4600
fps
HD Graphics 4600:
32.1 [X] MSI CX61-i572M281BW7 Intel Core i5-4200M 2.5GHz
HD Graphics 4600
fps
HD Graphics 4600:
10.1 [X] MSI CX61-i572M281BW7 Intel Core i5-4200M 2.5GHz
HD Graphics 4600
fps
HD Graphics 4600:
8.2 [X] MSI CX61-i572M281BW7 Intel Core i5-4200M 2.5GHz
HD Graphics 4600
fps
HD Graphics 4600:
13.7 [X] MSI CX61-i572M281BW7 Intel Core i5-4200M 2.5GHz
HD Graphics 4600
fps
HD Graphics 4600:
6 [X] MSI CX61-i572M281BW7 Intel Core i5-4200M 2.5GHz
HD Graphics 4600
fps
HD Graphics 4600:
7 [X] MSI CX61-i572M281BW7 Intel Core i5-4200M 2.5GHz
HD Graphics 4600
fps
HD Graphics 4600:
45.7 (!) [X] MSI CX61-i572M281BW7 Intel Core i5-4200M 2.5GHz
HD Graphics 4600
fps
HD Graphics 4600:
11 [X] MSI CX61-i572M281BW7 Intel Core i5-4200M 2.5GHz
HD Graphics 4600
fps
HD Graphics 4600:
15 [X] MSI CX61-i572M281BW7 Intel Core i5-4200M 2.5GHz
HD Graphics 4600
fps
HD Graphics 4600:
9.1 [X] MSI CX61-i572M281BW7 Intel Core i5-4200M 2.5GHz
HD Graphics 4600
fps
HD Graphics 4600:
15.2 [X] MSI CX61-i572M281BW7 Intel Core i5-4200M 2.5GHz
HD Graphics 4600
fps
HD Graphics 4600:
9 [X] MSI CX61-i572M281BW7 Intel Core i5-4200M 2.5GHz
HD Graphics 4600
fps
HD Graphics 4600:
146.4 [X] MSI CX61-i572M281BW7 Intel Core i5-4200M 2.5GHz
HD Graphics 4600
fps
HD Graphics 4600:
14.6 [X] MSI CX61-i572M281BW7 Intel Core i5-4200M 2.5GHz
HD Graphics 4600
fps
HD Graphics 4600:
20.8 [X] MSI CX61-i572M281BW7 Intel Core i5-4200M 2.5GHz
HD Graphics 4600
fps
HD Graphics 4600:
13.6 [X] MSI CX61-i572M281BW7 Intel Core i5-4200M 2.5GHz
HD Graphics 4600
fps
HD Graphics 4600:
11.7 [X] MSI CX61-i572M281BW7 Intel Core i5-4200M 2.5GHz
HD Graphics 4600
fps
HD Graphics 4600:
9.6 [X] MSI CX61-i572M281BW7 Intel Core i5-4200M 2.5GHz
HD Graphics 4600
fps
HD Graphics 4600:
39.6 [X] MSI CX61-i572M281BW7 Intel Core i5-4200M 2.5GHz
HD Graphics 4600
fps
HD Graphics 4600:
12.4 [X] MSI CX61-i572M281BW7 Intel Core i5-4200M 2.5GHz
HD Graphics 4600
fps
HD Graphics 4600:
16.3 [X] MSI CX61-i572M281BW7 Intel Core i5-4200M 2.5GHz
HD Graphics 4600
fps
HD Graphics 4600:
21.5 [X] MSI CX61-i572M281BW7 Intel Core i5-4200M 2.5GHz
HD Graphics 4600
fps
HD Graphics 4600:
7 [X] MSI CX61-i572M281BW7 Intel Core i5-4200M 2.5GHz
HD Graphics 4600
fps
HD Graphics 4600:
13.7 [X] MSI CX61-i572M281BW7 Intel Core i5-4200M 2.5GHz
HD Graphics 4600
fps
HD Graphics 4600:
10.4 [X] MSI CX61-i572M281BW7 Intel Core i5-4200M 2.5GHz
HD Graphics 4600
fps
HD Graphics 4600:
9.2 [X] MSI CX61-i572M281BW7 Intel Core i5-4200M 2.5GHz
HD Graphics 4600
fps
HD Graphics 4600:
10 [X] MSI CX61-i572M281BW7 Intel Core i5-4200M 2.5GHz
HD Graphics 4600
fps
HD Graphics 4600:
7 [X] MSI CX61-i572M281BW7 Intel Core i5-4200M 2.5GHz
HD Graphics 4600
fps
HD Graphics 4600:
59.2 [X] MSI CX61-i572M281BW7 Intel Core i5-4200M 2.5GHz
HD Graphics 4600
fps
HD Graphics 4600:
30.4 [X] MSI CX61-i572M281BW7 Intel Core i5-4200M 2.5GHz
HD Graphics 4600
fps
HD Graphics 4600:
9.6 [X] MSI CX61-i572M281BW7 Intel Core i5-4200M 2.5GHz
HD Graphics 4600
fps
HD Graphics 4600:
19 [X] MSI CX61-i572M281BW7 Intel Core i5-4200M 2.5GHz
HD Graphics 4600
fps
HD Graphics 4600:
13 [X] MSI CX61-i572M281BW7 Intel Core i5-4200M 2.5GHz
HD Graphics 4600
fps
HD Graphics 4600:
17.5 [X] MSI CX61-i572M281BW7 Intel Core i5-4200M 2.5GHz
HD Graphics 4600
fps
100%
HD Graphics 4000:
68 [X] Asus N56VM Intel Core i7-3720QM 2.6GHz
HD Graphics 4000
min:
63 fps
fps
103%
HD Graphics 4600:
70 [X] MSI CX61-i572M281BW7 Intel Core i5-4200M 2.5GHz
HD Graphics 4600
fps
HD Graphics 4600:
65.3 [X] MSI CX61-i572M281BW7 Intel Core i5-4200M 2.5GHz
HD Graphics 4600
fps
HD Graphics 4600:
30 [X] MSI CX61-i572M281BW7 Intel Core i5-4200M 2.5GHz
HD Graphics 4600
fps
100%
HD Graphics 4000:
13.3 [X] Asus N56VM Intel Core i7-3720QM 2.6GHz
HD Graphics 4000
fps
HD Graphics 4600:
25.8 [X] MSI CX61-i572M281BW7 Intel Core i5-4200M 2.5GHz
HD Graphics 4600
30.9 [X] Schenker W504 Intel Core i7-4700MQ 2.4GHz
HD Graphics 4600
min:
27 fps
~ 28 fps
HD Graphics 4600:
43.6 [X] MSI CX61-i572M281BW7 Intel Core i5-4200M 2.5GHz
HD Graphics 4600
70.8 [X] Schenker W504 Intel Core i7-4700MQ 2.4GHz
HD Graphics 4600
min:
61 fps
~ 57 fps
HD Graphics 4600:
15.3 [X] MSI CX61-i572M281BW7 Intel Core i5-4200M 2.5GHz
HD Graphics 4600
24.7 [X] Schenker W504 Intel Core i7-4700MQ 2.4GHz
HD Graphics 4600
min:
19 fps
~ 20 fps
HD Graphics 4600:
15.9 [X] Schenker W504 Intel Core i7-4700MQ 2.4GHz
HD Graphics 4600
min:
13 fps
fps
HD Graphics 4600:
16.7 [X] MSI CX61-i572M281BW7 Intel Core i5-4200M 2.5GHz
HD Graphics 4600
23.9 [X] Schenker W504 Intel Core i7-4700MQ 2.4GHz
HD Graphics 4600
min:
13 fps
~ 20 fps
HD Graphics 4600:
6.5 [X] MSI CX61-i572M281BW7 Intel Core i5-4200M 2.5GHz
HD Graphics 4600
9.3 [X] Schenker W504 Intel Core i7-4700MQ 2.4GHz
HD Graphics 4600
min:
3 fps
~ 8 fps
HD Graphics 4600:
14.3 [X] MSI CX61-i572M281BW7 Intel Core i5-4200M 2.5GHz
HD Graphics 4600
15.2 [X] Schenker W504 Intel Core i7-4700MQ 2.4GHz
HD Graphics 4600
min:
12 fps
~ 15 fps
HD Graphics 4600:
0 (!) [X] Schenker W504 Intel Core i7-4700MQ 2.4GHz
HD Graphics 4600
11.6 [X] MSI CX61-i572M281BW7 Intel Core i5-4200M 2.5GHz
HD Graphics 4600
~ 6 fps
HD Graphics 4600:
9.4 [X] MSI CX61-i572M281BW7 Intel Core i5-4200M 2.5GHz
HD Graphics 4600
11.3 [X] Schenker W504 Intel Core i7-4700MQ 2.4GHz
HD Graphics 4600
min:
8 fps
~ 10 fps
HD Graphics 4600:
11.1 [X] MSI CX61-i572M281BW7 Intel Core i5-4200M 2.5GHz
HD Graphics 4600
fps
HD Graphics 4600:
29.5 [X] MSI CX61-i572M Intel Core i5-4200M 2.5GHz
HD Graphics 4600
32.6 [X] Schenker W504 Intel Core i7-4700MQ 2.4GHz
HD Graphics 4600
min:
28 fps
~ 31 fps
HD Graphics 4600:
13.5 [X] MSI CX61-i572M Intel Core i5-4200M 2.5GHz
HD Graphics 4600
14 [X] Schenker W504 Intel Core i7-4700MQ 2.4GHz
HD Graphics 4600
min:
9 fps
~ 14 fps
HD Graphics 4600:
0 (!) [X] Schenker W504 Intel Core i7-4700MQ 2.4GHz
HD Graphics 4600
9.9 [X] MSI CX61-i572M Intel Core i5-4200M 2.5GHz
HD Graphics 4600
~ 5 fps
HD Graphics 4600:
0 (!) [X] Schenker W504 Intel Core i7-4700MQ 2.4GHz
HD Graphics 4600
8.3 [X] MSI CX61-i572M Intel Core i5-4200M 2.5GHz
HD Graphics 4600
~ 4 fps
HD Graphics 4600:
0 (!) [X] Schenker W504 Intel Core i7-4700MQ 2.4GHz
HD Graphics 4600
fps
HD Graphics 4600:
0 (!) [X] Schenker W504 Intel Core i7-4700MQ 2.4GHz
HD Graphics 4600
fps
HD Graphics 4600:
0 (!) [X] Schenker W504 Intel Core i7-4700MQ 2.4GHz
HD Graphics 4600
16.4 [X] MSI CX61-i572M Intel Core i5-4200M 2.5GHz
HD Graphics 4600
~ 8 fps
HD Graphics 4600:
0 (!) [X] Schenker W504 Intel Core i7-4700MQ 2.4GHz
HD Graphics 4600
13.9 [X] MSI CX61-i572M Intel Core i5-4200M 2.5GHz
HD Graphics 4600
~ 7 fps
HD Graphics 4600:
25.9 [X] MSI CX61-i572M Intel Core i5-4200M 2.5GHz
HD Graphics 4600
30 [X] Schenker W504 Intel Core i7-4700MQ 2.4GHz
HD Graphics 4600
min:
24 fps
~ 28 fps
HD Graphics 4600:
15.8 [X] MSI CX61-i572M Intel Core i5-4200M 2.5GHz
HD Graphics 4600
18.7 [X] Schenker W504 Intel Core i7-4700MQ 2.4GHz
HD Graphics 4600
min:
14 fps
~ 17 fps
HD Graphics 4600:
6.6 [X] Schenker W504 Intel Core i7-4700MQ 2.4GHz
HD Graphics 4600
min:
4 fps
fps
100%
HD Graphics 4000:
43 [X] Asus N56VM Intel Core i7-3720QM 2.6GHz
HD Graphics 4000
min:
39 fps, max:
51 fps
fps
163%
HD Graphics 4600:
69.3 [X] Schenker W504 Intel Core i7-4700MQ 2.4GHz
HD Graphics 4600
min:
58 fps
71.1 [X] MSI CX61-i572M Intel Core i5-4200M 2.5GHz
HD Graphics 4600
~ 70 fps
100%
HD Graphics 4000:
25.1 [X] Asus N56VM Intel Core i7-3720QM 2.6GHz
HD Graphics 4000
min:
23 fps, max:
30 fps
fps
167%
HD Graphics 4600:
37.9 [X] Schenker W504 Intel Core i7-4700MQ 2.4GHz
HD Graphics 4600
min:
30 fps
47 [X] MSI CX61-i572M Intel Core i5-4200M 2.5GHz
HD Graphics 4600
~ 42 fps
HD Graphics 4600:
11 [X] Schenker W504 Intel Core i7-4700MQ 2.4GHz
HD Graphics 4600
min:
9 fps
18.9 [X] MSI CX61-i572M Intel Core i5-4200M 2.5GHz
HD Graphics 4600
~ 15 fps
HD Graphics 4600:
8 [X] Schenker W504 Intel Core i7-4700MQ 2.4GHz
HD Graphics 4600
min:
6 fps
11.1 [X] MSI CX61-i572M Intel Core i5-4200M 2.5GHz
HD Graphics 4600
~ 10 fps
HD Graphics 4600:
18 [X] MSI CX61-i572M Intel Core i5-4200M 2.5GHz
HD Graphics 4600
24.2 [X] Schenker W504 Intel Core i7-4700MQ 2.4GHz
HD Graphics 4600
min:
23 fps
~ 21 fps
HD Graphics 4600:
11.8 [X] MSI CX61-i572M Intel Core i5-4200M 2.5GHz
HD Graphics 4600
15 [X] Schenker W504 Intel Core i7-4700MQ 2.4GHz
HD Graphics 4600
min:
13 fps
~ 13 fps
HD Graphics 4600:
5.2 [X] MSI CX61-i572M Intel Core i5-4200M 2.5GHz
HD Graphics 4600
fps
HD Graphics 4600:
24.2 [X] MSI CX61-i572M Intel Core i5-4200M 2.5GHz
HD Graphics 4600
30.9 [X] Schenker W504 Intel Core i7-4700MQ 2.4GHz
HD Graphics 4600
min:
28 fps
~ 28 fps
HD Graphics 4600:
7.1 [X] MSI CX61-i572M Intel Core i5-4200M 2.5GHz
HD Graphics 4600
10 [X] Schenker W504 Intel Core i7-4700MQ 2.4GHz
HD Graphics 4600
min:
8 fps
~ 9 fps
HD Graphics 4600:
5.8 [X] MSI CX61-i572M Intel Core i5-4200M 2.5GHz
HD Graphics 4600
7.8 [X] Schenker W504 Intel Core i7-4700MQ 2.4GHz
HD Graphics 4600
min:
5 fps
~ 7 fps
HD Graphics 4600:
55 [X] MSI CX61-i572M Intel Core i5-4200M 2.5GHz
HD Graphics 4600
59.1 [X] Schenker W504 Intel Core i7-4700MQ 2.4GHz
HD Graphics 4600
min:
46 fps
~ 57 fps
HD Graphics 4600:
42.2 [X] Schenker W504 Intel Core i7-4700MQ 2.4GHz
HD Graphics 4600
min:
36 fps
43 [X] MSI CX61-i572M Intel Core i5-4200M 2.5GHz
HD Graphics 4600
~ 43 fps
HD Graphics 4600:
22 [X] MSI CX61-i572M Intel Core i5-4200M 2.5GHz
HD Graphics 4600
fps
HD Graphics 4600:
9.4 [X] MSI CX61-i572M Intel Core i5-4200M 2.5GHz
HD Graphics 4600
11.1 [X] Schenker W504 Intel Core i7-4700MQ 2.4GHz
HD Graphics 4600
min:
9 fps
~ 10 fps
HD Graphics 4600:
7.6 [X] Schenker W504 Intel Core i7-4700MQ 2.4GHz
HD Graphics 4600
min:
6 fps
fps
HD Graphics 4600:
0 (!) [X] Schenker W504 Intel Core i7-4700MQ 2.4GHz
HD Graphics 4600
12 [X] MSI CX61-i572M Intel Core i5-4200M 2.5GHz
HD Graphics 4600
~ 6 fps
HD Graphics 4600:
0 (!) [X] Schenker W504 Intel Core i7-4700MQ 2.4GHz
HD Graphics 4600
fps
HD Graphics 4600:
0 (!) [X] Schenker W504 Intel Core i7-4700MQ 2.4GHz
HD Graphics 4600
fps
HD Graphics 4600:
0 (!) [X] Schenker W504 Intel Core i7-4700MQ 2.4GHz
HD Graphics 4600
fps
HD Graphics 4600:
0 (!) [X] Schenker W504 Intel Core i7-4700MQ 2.4GHz
HD Graphics 4600
fps
HD Graphics 4000:
0 (!) [X] Asus N56VM Intel Core i7-3720QM 2.6GHz
HD Graphics 4000
fps
HD Graphics 4600:
15.7 [X] MSI CX61-i572M Intel Core i5-4200M 2.5GHz
HD Graphics 4600
21.3 [X] Schenker W504 Intel Core i7-4700MQ 2.4GHz
HD Graphics 4600
min:
19 fps
~ 19 fps
HD Graphics 4600:
9.9 [X] MSI CX61-i572M Intel Core i5-4200M 2.5GHz
HD Graphics 4600
12.2 [X] Schenker W504 Intel Core i7-4700MQ 2.4GHz
HD Graphics 4600
min:
11 fps
~ 11 fps
100%
HD Graphics 4000:
25.6 [X] Asus N56VM Intel Core i7-3720QM 2.6GHz
HD Graphics 4000
min:
19 fps, max:
31 fps
fps
152%
HD Graphics 4600:
34.7 [X] MSI CX61-i572M281BW7 Intel Core i5-4200M 2.5GHz
HD Graphics 4600
42.3 [X] Schenker W504 Intel Core i7-4700MQ 2.4GHz
HD Graphics 4600
min:
31 fps
~ 39 fps
HD Graphics 4600:
23.4 [X] MSI CX61-i572M281BW7 Intel Core i5-4200M 2.5GHz
HD Graphics 4600
24.8 [X] Schenker W504 Intel Core i7-4700MQ 2.4GHz
HD Graphics 4600
min:
19 fps
~ 24 fps
HD Graphics 4600:
10.3 [X] MSI CX61-i572M Intel Core i5-4200M 2.5GHz
HD Graphics 4600
fps
HD Graphics 4600:
14.3 [X] MSI CX61-i572M Intel Core i5-4200M 2.5GHz
HD Graphics 4600
16.5 (!) [X] Schenker W504 Intel Core i7-4700MQ 2.4GHz
HD Graphics 4600
min:
14 fps
~ 15 fps
HD Graphics 4600:
10.1 [X] MSI CX61-i572M Intel Core i5-4200M 2.5GHz
HD Graphics 4600
fps
HD Graphics 4600:
8.7 [X] MSI CX61-i572M Intel Core i5-4200M 2.5GHz
HD Graphics 4600
9.7 [X] Schenker W504 DX11
Intel Core i7-4700MQ 2.4GHz
HD Graphics 4600
min:
6 fps
~ 9 fps
HD Graphics 4600:
6.1 [X] MSI CX61-i572M Intel Core i5-4200M 2.5GHz
HD Graphics 4600
10.4 [X] Schenker W504 DX11
Intel Core i7-4700MQ 2.4GHz
HD Graphics 4600
min:
8 fps
~ 8 fps
HD Graphics 4600:
10.8 [X] MSI CX61-i572M Intel Core i5-4200M 2.5GHz
HD Graphics 4600
14 [X] Schenker W504 Intel Core i7-4700MQ 2.4GHz
HD Graphics 4600
min:
9 fps
~ 12 fps
HD Graphics 4600:
9.3 [X] Schenker W504 Intel Core i7-4700MQ 2.4GHz
HD Graphics 4600
min:
6 fps
fps
HD Graphics 4600:
11 [X] MSI CX61-i572M Intel Core i5-4200M 2.5GHz
HD Graphics 4600
15 [X] Schenker W504 Intel Core i7-4700MQ 2.4GHz
HD Graphics 4600
min:
12 fps
~ 13 fps
HD Graphics 4600:
5 [X] MSI CX61-i572M Intel Core i5-4200M 2.5GHz
HD Graphics 4600
7 [X] Schenker W504 Intel Core i7-4700MQ 2.4GHz
HD Graphics 4600
min:
6 fps
~ 6 fps
HD Graphics 4600:
11.3 [X] MSI CX61-i572M Intel Core i5-4200M 2.5GHz
HD Graphics 4600
16.8 [X] Schenker W504 Intel Core i7-4700MQ 2.4GHz
HD Graphics 4600
min:
12 fps
~ 14 fps
HD Graphics 4600:
5.1 [X] Schenker W504 Intel Core i7-4700MQ 2.4GHz
HD Graphics 4600
min:
4 fps
fps
100%
HD Graphics 4000:
10 [X] Asus N56VM Intel Core i7-3720QM 2.6GHz
HD Graphics 4000
min:
9 fps, max:
11 fps
fps
150%
HD Graphics 4600:
15 [X] MSI CX61-i572M Intel Core i5-4200M 2.5GHz
HD Graphics 4600
15.5 [X] Schenker W504 Intel Core i7-4700MQ 2.4GHz
HD Graphics 4600
min:
14 fps
~ 15 fps
HD Graphics 4600:
8.9 [X] Schenker W504 Intel Core i7-4700MQ 2.4GHz
HD Graphics 4600
min:
7 fps
9.7 [X] MSI CX61-i572M Intel Core i5-4200M 2.5GHz
HD Graphics 4600
~ 9 fps
HD Graphics 4600:
18.9 [X] MSI CX61-i572M Intel Core i5-4200M 2.5GHz
HD Graphics 4600
25.7 [X] Schenker W504 Intel Core i7-4700MQ 2.4GHz
HD Graphics 4600
min:
10 fps
~ 22 fps
HD Graphics 4600:
12 [X] MSI CX61-i572M Intel Core i5-4200M 2.5GHz
HD Graphics 4600
14.6 [X] Schenker W504 Intel Core i7-4700MQ 2.4GHz
HD Graphics 4600
min:
6 fps
~ 13 fps
HD Graphics 4600:
7.8 [X] Schenker W504 Intel Core i7-4700MQ 2.4GHz
HD Graphics 4600
min:
4 fps
fps
HD Graphics 4600:
16.2 [X] MSI CX61-i572M Intel Core i5-4200M 2.5GHz
HD Graphics 4600
19.3 [X] Schenker W504 Intel Core i7-4700MQ 2.4GHz
HD Graphics 4600
min:
16 fps
~ 18 fps
HD Graphics 4600:
12.3 [X] MSI CX61-i572M Intel Core i5-4200M 2.5GHz
HD Graphics 4600
15.1 [X] Schenker W504 Intel Core i7-4700MQ 2.4GHz
HD Graphics 4600
min:
12 fps
~ 14 fps
HD Graphics 4600:
6.8 [X] Schenker W504 Intel Core i7-4700MQ 2.4GHz
HD Graphics 4600
min:
3 fps
fps
HD Graphics 4600:
21.5 [X] MSI CX61-i572M Intel Core i5-4200M 2.5GHz
HD Graphics 4600
30.8 [X] Schenker W504 Intel Core i7-4700MQ 2.4GHz
HD Graphics 4600
min:
24 fps
~ 26 fps
HD Graphics 4600:
12.6 [X] MSI CX61-i572M Intel Core i5-4200M 2.5GHz
HD Graphics 4600
16.8 [X] Schenker W504 Intel Core i7-4700MQ 2.4GHz
HD Graphics 4600
min:
14 fps
~ 15 fps
HD Graphics 4600:
6.1 [X] MSI CX61-i572M Intel Core i5-4200M 2.5GHz
HD Graphics 4600
7.9 [X] Schenker W504 Intel Core i7-4700MQ 2.4GHz
HD Graphics 4600
min:
6 fps
~ 7 fps
HD Graphics 4600:
6.5 [X] MSI CX61-i572M Intel Core i5-4200M 2.5GHz
HD Graphics 4600
7.1 (!) [X] Schenker W504 Intel Core i7-4700MQ 2.4GHz
HD Graphics 4600
min:
4 fps
~ 7 fps
HD Graphics 4600:
4.6 (!) [X] Schenker W504 Intel Core i7-4700MQ 2.4GHz
HD Graphics 4600
min:
2 fps
fps
HD Graphics 4600:
15.8 [X] Schenker W504 Intel Core i7-4700MQ 2.4GHz
HD Graphics 4600
min:
9 fps
19.8 [X] MSI CX61-i572M Intel Core i5-4200M 2.5GHz
HD Graphics 4600
~ 18 fps
HD Graphics 4600:
9.4 [X] Schenker W504 Intel Core i7-4700MQ 2.4GHz
HD Graphics 4600
min:
5 fps
12.4 [X] MSI CX61-i572M Intel Core i5-4200M 2.5GHz
HD Graphics 4600
~ 11 fps
HD Graphics 4600:
5.4 [X] Schenker W504 Intel Core i7-4700MQ 2.4GHz
HD Graphics 4600
min:
2 fps
6.8 [X] MSI CX61-i572M Intel Core i5-4200M 2.5GHz
HD Graphics 4600
~ 6 fps
HD Graphics 4600:
20.7 [X] MSI CX61-i572M Intel Core i5-4200M 2.5GHz
HD Graphics 4600
26.1 [X] Schenker W504 Intel Core i7-4700MQ 2.4GHz
HD Graphics 4600
min:
22 fps
~ 23 fps
HD Graphics 4600:
11.7 [X] MSI CX61-i572M Intel Core i5-4200M 2.5GHz
HD Graphics 4600
15 [X] Schenker W504 Intel Core i7-4700MQ 2.4GHz
HD Graphics 4600
min:
10 fps
~ 13 fps
HD Graphics 4600:
12.8 [X] MSI CX61-i572M Intel Core i5-4200M 2.5GHz
HD Graphics 4600
14.4 [X] Schenker W504 Intel Core i7-4700MQ 2.4GHz
HD Graphics 4600
min:
12 fps
~ 14 fps
HD Graphics 4600:
5.2 [X] MSI CX61-i572M Intel Core i5-4200M 2.5GHz
HD Graphics 4600
6.5 [X] Schenker W504 Intel Core i7-4700MQ 2.4GHz
HD Graphics 4600
min:
4 fps
~ 6 fps
HD Graphics 4600:
3 [X] MSI CX61-i572M Intel Core i5-4200M 2.5GHz
HD Graphics 4600
3.7 [X] Schenker W504 Intel Core i7-4700MQ 2.4GHz
HD Graphics 4600
min:
1 fps
~ 3 fps
100%
HD Graphics 4000:
60 [X] Asus N56VM Intel Core i7-3720QM 2.6GHz
HD Graphics 4000
min:
53 fps, max:
62 fps
fps
98%
HD Graphics 4600:
41.1 [X] MSI CX61-i572M Intel Core i5-4200M 2.5GHz
HD Graphics 4600
min:
34 fps, max:
44 fps
77.1 [X] Schenker W504 Intel Core i7-4700MQ 2.4GHz
HD Graphics 4600
min:
69 fps
~ 59 fps
100%
HD Graphics 4000:
26 [X] Asus N56VM Intel Core i7-3720QM 2.6GHz
HD Graphics 4000
min:
23 fps, max:
30 fps
fps
119%
HD Graphics 4600:
24.6 [X] MSI CX61-i572M Intel Core i5-4200M 2.5GHz
HD Graphics 4600
min:
21 fps, max:
27 fps
37.4 [X] Schenker W504 Intel Core i7-4700MQ 2.4GHz
HD Graphics 4600
min:
35 fps
~ 31 fps
100%
HD Graphics 4000:
16 [X] Asus N56VM Intel Core i7-3720QM 2.6GHz
HD Graphics 4000
min:
13 fps, max:
18 fps
fps
113%
HD Graphics 4600:
14.8 [X] MSI CX61-i572M Intel Core i5-4200M 2.5GHz
HD Graphics 4600
min:
9 fps, max:
17 fps
20.3 [X] Schenker W504 Intel Core i7-4700MQ 2.4GHz
HD Graphics 4600
min:
16 fps
~ 18 fps
100%
HD Graphics 4000:
56.7 [X] Asus N56VM Intel Core i7-3720QM 2.6GHz
HD Graphics 4000
min:
44 fps, max:
71 fps
fps
73%
HD Graphics 4600:
41.6 [X] MSI CX61-i572M Intel Core i5-4200M 2.5GHz
HD Graphics 4600
fps
100%
HD Graphics 4000:
36 [X] Asus N56VM Intel Core i7-3720QM 2.6GHz
HD Graphics 4000
min:
25 fps, max:
48 fps
fps
82%
HD Graphics 4600:
29.5 [X] MSI CX61-i572M Intel Core i5-4200M 2.5GHz
HD Graphics 4600
fps
100%
HD Graphics 4000:
17.1 [X] Asus N56VM Intel Core i7-3720QM 2.6GHz
HD Graphics 4000
min:
11 fps, max:
26 fps
fps
84%
HD Graphics 4600:
14.4 [X] MSI CX61-i572M Intel Core i5-4200M 2.5GHz
HD Graphics 4600
fps
100%
HD Graphics 4000:
12.4 [X] Asus N56VM Intel Core i7-3720QM 2.6GHz
HD Graphics 4000
min:
7 fps, max:
20 fps
fps
89%
HD Graphics 4600:
11 [X] MSI CX61-i572M Intel Core i5-4200M 2.5GHz
HD Graphics 4600
fps
100%
HD Graphics 4000:
41 [X] Asus N56VM Intel Core i7-3720QM 2.6GHz
HD Graphics 4000
min:
37 fps, max:
45 fps
fps
93%
HD Graphics 4600:
29.9 [X] MSI CX61-i572M Intel Core i5-4200M 2.5GHz
HD Graphics 4600
45.1 [X] Schenker W504 Intel Core i7-4700MQ 2.4GHz
HD Graphics 4600
min:
40 fps
~ 38 fps
100%
HD Graphics 4000:
25.2 [X] Asus N56VM Intel Core i7-3720QM 2.6GHz
HD Graphics 4000
min:
24 fps, max:
27 fps
fps
95%
HD Graphics 4600:
19.2 [X] MSI CX61-i572M Intel Core i5-4200M 2.5GHz
HD Graphics 4600
28.2 [X] Schenker W504 Intel Core i7-4700MQ 2.4GHz
HD Graphics 4600
min:
25 fps
~ 24 fps
100%
HD Graphics 4000:
9.6 [X] Asus N56VM Intel Core i7-3720QM 2.6GHz
HD Graphics 4000
min:
7 fps, max:
12 fps
fps
83%
HD Graphics 4600:
6.4 [X] MSI CX61-i572M Intel Core i5-4200M 2.5GHz
HD Graphics 4600
9.9 [X] Schenker W504 Intel Core i7-4700MQ 2.4GHz
HD Graphics 4600
min:
8 fps
~ 8 fps
100%
HD Graphics 4000:
14.6 [X] Asus N56VM Intel Core i7-3720QM 2.6GHz
HD Graphics 4000
min:
8 fps, max:
20 fps
fps
110%
HD Graphics 4600:
13.2 [X] MSI CX61-i572M Intel Core i5-4200M 2.5GHz
HD Graphics 4600
19.2 [X] Schenker W504 Intel Core i7-4700MQ 2.4GHz
HD Graphics 4600
min:
15 fps
~ 16 fps
HD Graphics 4600:
5.7 [X] MSI CX61-i572M Intel Core i5-4200M 2.5GHz
HD Graphics 4600
8.3 [X] Schenker W504 Intel Core i7-4700MQ 2.4GHz
HD Graphics 4600
min:
4 fps
~ 7 fps
HD Graphics 4600:
3.9 [X] MSI CX61-i572M Intel Core i5-4200M 2.5GHz
HD Graphics 4600
7.2 [X] Schenker W504 Intel Core i7-4700MQ 2.4GHz
HD Graphics 4600
min:
3 fps
~ 6 fps
100%
HD Graphics 4000:
96 [X] Asus N56VM Intel Core i7-3720QM 2.6GHz
HD Graphics 4000
min:
81 fps
fps
104%
HD Graphics 4600:
99.4 [X] MSI CX61-i572M Intel Core i5-4200M 2.5GHz
HD Graphics 4600
fps
100%
HD Graphics 4000:
40.2 [X] Asus N56VM Intel Core i7-3720QM 2.6GHz
HD Graphics 4000
min:
36 fps
fps
154%
HD Graphics 4600:
62.1 [X] MSI CX61-i572M Intel Core i5-4200M 2.5GHz
HD Graphics 4600
fps
100%
HD Graphics 4000:
16.9 [X] Asus N56VM Intel Core i7-3720QM 2.6GHz
HD Graphics 4000
min:
14 fps
fps
129%
HD Graphics 4600:
21.8 [X] MSI CX61-i572M Intel Core i5-4200M 2.5GHz
HD Graphics 4600
fps
HD Graphics 4600:
11 [X] MSI CX61-i572M Intel Core i5-4200M 2.5GHz
HD Graphics 4600
12 [X] Schenker W504 Intel Core i7-4700MQ 2.4GHz
HD Graphics 4600
min:
9 fps
~ 12 fps
HD Graphics 4600:
9 [X] MSI CX61-i572M Intel Core i5-4200M 2.5GHz
HD Graphics 4600
10 [X] Schenker W504 Intel Core i7-4700MQ 2.4GHz
HD Graphics 4600
min:
7 fps
~ 10 fps
HD Graphics 4600:
4 [X] MSI CX61-i572M Intel Core i5-4200M 2.5GHz
HD Graphics 4600
fps
HD Graphics 4600:
10.7 [X] MSI CX61-i572M Intel Core i5-4200M 2.5GHz
HD Graphics 4600
13.1 [X] Schenker W504 Intel Core i7-4700MQ 2.4GHz
HD Graphics 4600
min:
10 fps
~ 12 fps
HD Graphics 4600:
6.6 [X] MSI CX61-i572M Intel Core i5-4200M 2.5GHz
HD Graphics 4600
8.4 [X] Schenker W504 Intel Core i7-4700MQ 2.4GHz
HD Graphics 4600
min:
4 fps
~ 8 fps
HD Graphics 4600:
3.8 [X] MSI CX61-i572M Intel Core i5-4200M 2.5GHz
HD Graphics 4600
fps
100%
HD Graphics 4000:
53.7 [X] Bullman Dirtbook S12 Touch Intel Core i5-3337U 1.8GHz
HD Graphics 4000
91 (!) [X] Asus N56VM Intel Core i7-3720QM 2.6GHz
HD Graphics 4000
min:
66 fps, max:
128 fps
~ 72 fps
142%
HD Graphics 4600:
77.7 [X] MSI CX61-i572M Intel Core i5-4200M 2.5GHz
HD Graphics 4600
125.8 [X] Schenker W504 Intel Core i7-4700MQ 2.4GHz
HD Graphics 4600
min:
102 fps
~ 102 fps
100%
HD Graphics 4000:
16.4 [X] Bullman Dirtbook S12 Touch Intel Core i5-3337U 1.8GHz
HD Graphics 4000
21 [X] Asus N56VM Intel Core i7-3720QM 2.6GHz
HD Graphics 4000
min:
15 fps, max:
27 fps
~ 19 fps
121%
HD Graphics 4600:
20.3 [X] MSI CX61-i572M Intel Core i5-4200M 2.5GHz
HD Graphics 4600
25.3 [X] Schenker W504 Intel Core i7-4700MQ 2.4GHz
HD Graphics 4600
min:
21 fps
~ 23 fps
100%
HD Graphics 4000:
12.5 [X] Bullman Dirtbook S12 Touch Intel Core i5-3337U 1.8GHz
HD Graphics 4000
12.6 [X] Asus N56VM Intel Core i7-3720QM 2.6GHz
HD Graphics 4000
min:
12.5 fps, max:
15.2 fps
~ 13 fps
100%
HD Graphics 4600:
12.5 [X] MSI CX61-i572M Intel Core i5-4200M 2.5GHz
HD Graphics 4600
12.7 [X] Schenker W504 Intel Core i7-4700MQ 2.4GHz
HD Graphics 4600
min:
12 fps
~ 13 fps
100%
HD Graphics 4000:
12.5 [X] Bullman Dirtbook S12 Touch Intel Core i5-3337U 1.8GHz
HD Graphics 4000
fps
104%
HD Graphics 4600:
12.5 [X] Schenker W504 Intel Core i7-4700MQ 2.4GHz
HD Graphics 4600
min:
12 fps
12.5 [X] MSI CX61-i572M Intel Core i5-4200M 2.5GHz
HD Graphics 4600
~ 13 fps
100%
HD Graphics 4000:
26.8 [X] Asus N56VM Intel Core i7-3720QM 2.6GHz
HD Graphics 4000
min:
5 fps, max:
81 fps
fps
97%
HD Graphics 4600:
19.4 [X] MSI CX61-i572M Intel Core i5-4200M 2.5GHz
HD Graphics 4600
33.3 [X] Schenker W504 Intel Core i7-4700MQ 2.4GHz
HD Graphics 4600
min:
10 fps
~ 26 fps
HD Graphics 4600:
16.5 [X] MSI CX61-i572M Intel Core i5-4200M 2.5GHz
HD Graphics 4600
29.4 [X] Schenker W504 Intel Core i7-4700MQ 2.4GHz
HD Graphics 4600
min:
10 fps
~ 23 fps
HD Graphics 4600:
4.3 [X] MSI CX61-i572M Intel Core i5-4200M 2.5GHz
HD Graphics 4600
5.7 [X] Schenker W504 Intel Core i7-4700MQ 2.4GHz
HD Graphics 4600
min:
1 fps
~ 5 fps
HD Graphics 4600:
2.1 [X] MSI CX61-i572M Intel Core i5-4200M 2.5GHz
HD Graphics 4600
fps
100%
HD Graphics 4000:
21.2 [X] Asus N56VM Intel Core i7-3720QM 2.6GHz
HD Graphics 4000
min:
10 fps, max:
33 fps
fps
146%
HD Graphics 4600:
29.8 [X] MSI CX61-i572M Intel Core i5-4200M 2.5GHz
HD Graphics 4600
32.1 [X] Schenker W503 Intel Core i7-4700MQ 2.4GHz
HD Graphics 4600
min:
27 fps
~ 31 fps
HD Graphics 4600:
21.3 [X] MSI CX61-i572M Intel Core i5-4200M 2.5GHz
HD Graphics 4600
22.1 [X] Schenker W503 Intel Core i7-4700MQ 2.4GHz
HD Graphics 4600
min:
18 fps
~ 22 fps
HD Graphics 4600:
9.2 [X] Schenker W503 Intel Core i7-4700MQ 2.4GHz
HD Graphics 4600
min:
7 fps
9.9 [X] MSI CX61-i572M Intel Core i5-4200M 2.5GHz
HD Graphics 4600
~ 10 fps
HD Graphics 4600:
5.3 [X] Schenker W503 Intel Core i7-4700MQ 2.4GHz
HD Graphics 4600
min:
3 fps
fps
100%
HD Graphics 4000:
12.2 [X] Asus N56VM Intel Core i7-3720QM 2.6GHz
HD Graphics 4000
min:
9 fps, max:
16 fps
fps
107%
HD Graphics 4600:
11.9 [X] MSI CX61-i572M Intel Core i5-4200M 2.5GHz
HD Graphics 4600
14.7 [X] Schenker W503 Intel Core i7-4700MQ 2.4GHz
HD Graphics 4600
min:
12 fps
~ 13 fps
HD Graphics 4600:
8.6 [X] MSI CX61-i572M Intel Core i5-4200M 2.5GHz
HD Graphics 4600
11 [X] Schenker W503 Intel Core i7-4700MQ 2.4GHz
HD Graphics 4600
min:
9 fps
~ 10 fps
100%
HD Graphics 4000:
15 [X] Asus N56VM Intel Core i7-3720QM 2.6GHz
HD Graphics 4000
min:
6 fps, max:
25 fps
fps
153%
HD Graphics 4600:
16.8 [X] MSI CX61-i572M Intel Core i5-4200M 2.5GHz
HD Graphics 4600
29 [X] Schenker W503 Intel Core i7-4700MQ 2.4GHz
HD Graphics 4600
min:
20 fps
~ 23 fps
HD Graphics 4600:
12.8 [X] MSI CX61-i572M Intel Core i5-4200M 2.5GHz
HD Graphics 4600
20.1 [X] Schenker W503 Intel Core i7-4700MQ 2.4GHz
HD Graphics 4600
min:
16 fps
~ 16 fps
HD Graphics 4600:
10.2 [X] Schenker W503 Intel Core i7-4700MQ 2.4GHz
HD Graphics 4600
min:
7 fps
fps
HD Graphics 4600:
5.3 [X] Schenker W503 Intel Core i7-4700MQ 2.4GHz
HD Graphics 4600
min:
2 fps
fps
100%
HD Graphics 4000:
18.5 [X] Asus N56VM Intel Core i7-3720QM 2.6GHz
HD Graphics 4000
min:
14 fps
fps
119%
HD Graphics 4600:
22.1 [X] Schenker W503 Intel Core i7-4700MQ 2.4GHz
HD Graphics 4600
min:
17 fps
fps
100%
HD Graphics 4000:
11.7 [X] Asus N56VM Intel Core i7-3720QM 2.6GHz
HD Graphics 4000
min:
9 fps
fps
124%
HD Graphics 4600:
14.5 [X] Schenker W503 Intel Core i7-4700MQ 2.4GHz
HD Graphics 4600
min:
11 fps
fps
HD Graphics 4600:
5.8 [X] Schenker W503 Intel Core i7-4700MQ 2.4GHz
HD Graphics 4600
min:
5 fps
fps
HD Graphics 4600:
3.8 [X] Schenker W503 Intel Core i7-4700MQ 2.4GHz
HD Graphics 4600
min:
3 fps
fps
100%
HD Graphics 4000:
13.2 [X] Asus N56VM Intel Core i7-3720QM 2.6GHz
HD Graphics 4000
min:
2 fps, max:
24 fps
fps
144%
HD Graphics 4600:
17.9 [X] MSI CX61-i572M Intel Core i5-4200M 2.5GHz
HD Graphics 4600
19.9 [X] Schenker W503 Intel Core i7-4700MQ 2.4GHz
HD Graphics 4600
min:
12 fps
~ 19 fps
HD Graphics 4600:
12 [X] MSI CX61-i572M Intel Core i5-4200M 2.5GHz
HD Graphics 4600
14.3 [X] Schenker W503 Intel Core i7-4700MQ 2.4GHz
HD Graphics 4600
min:
9 fps
~ 13 fps
HD Graphics 4600:
5.6 [X] MSI CX61-i572M Intel Core i5-4200M 2.5GHz
HD Graphics 4600
7 [X] Schenker W503 Intel Core i7-4700MQ 2.4GHz
HD Graphics 4600
min:
3 fps
~ 6 fps
HD Graphics 4600:
5.3 [X] Schenker W503 Intel Core i7-4700MQ 2.4GHz
HD Graphics 4600
min:
2 fps
fps
100%
HD Graphics 4000:
3 (!) [X] Asus N56VM Intel Core i7-3720QM 2.6GHz
HD Graphics 4000
fps
267%
HD Graphics 4600:
7 [X] MSI CX61-i572M Intel Core i5-4200M 2.5GHz
HD Graphics 4600
8.5 [X] Schenker W503 Intel Core i7-4700MQ 2.4GHz
HD Graphics 4600
min:
6 fps
~ 8 fps
HD Graphics 4600:
4.6 [X] MSI CX61-i572M Intel Core i5-4200M 2.5GHz
HD Graphics 4600
5.4 [X] Schenker W503 Intel Core i7-4700MQ 2.4GHz
HD Graphics 4600
min:
2 fps
~ 5 fps
HD Graphics 4000:
0 (!) [X] Asus N56VM Intel Core i7-3720QM 2.6GHz
HD Graphics 4000
fps
HD Graphics 4600:
29.1 [X] MSI CX61-i572M Intel Core i5-4200M 2.5GHz
HD Graphics 4600
33.4 [X] Schenker W503 Intel Core i7-4700MQ 2.4GHz
HD Graphics 4600
min:
26 fps
~ 31 fps
HD Graphics 4600:
14.4 [X] MSI CX61-i572M Intel Core i5-4200M 2.5GHz
HD Graphics 4600
17.4 [X] Schenker W503 Intel Core i7-4700MQ 2.4GHz
HD Graphics 4600
min:
14 fps
~ 16 fps
HD Graphics 4600:
7.9 [X] MSI CX61-i572M Intel Core i5-4200M 2.5GHz
HD Graphics 4600
10.1 [X] Schenker W503 Intel Core i7-4700MQ 2.4GHz
HD Graphics 4600
min:
8 fps
~ 9 fps
HD Graphics 4600:
4.4 [X] Schenker W503 Intel Core i7-4700MQ 2.4GHz
HD Graphics 4600
min:
2 fps
fps
100%
HD Graphics 4000:
18.2 [X] Asus N56VM Intel Core i7-3720QM 2.6GHz
HD Graphics 4000
min:
4 fps, max:
100 fps
fps
198%
HD Graphics 4600:
34.3 [X] MSI CX61-i572M Intel Core i5-4200M 2.5GHz
HD Graphics 4600
37 [X] Schenker W503 Intel Core i7-4700MQ 2.4GHz
HD Graphics 4600
min:
18 fps
~ 36 fps
100%
HD Graphics 4000:
8.1 [X] Asus N56VM Intel Core i7-3720QM 2.6GHz
HD Graphics 4000
min:
2 fps, max:
73 fps
fps
160%
HD Graphics 4600:
13 [X] MSI CX61-i572M Intel Core i5-4200M 2.5GHz
HD Graphics 4600
13.7 [X] Schenker W503 Intel Core i7-4700MQ 2.4GHz
HD Graphics 4600
min:
8 fps
~ 13 fps
HD Graphics 4600:
8.4 [X] MSI CX61-i572M Intel Core i5-4200M 2.5GHz
HD Graphics 4600
8.9 [X] Schenker W503 Intel Core i7-4700MQ 2.4GHz
HD Graphics 4600
min:
5 fps
~ 9 fps
HD Graphics 4600:
7.4 [X] Schenker W503 Intel Core i7-4700MQ 2.4GHz
HD Graphics 4600
min:
5 fps
fps
100%
HD Graphics 4000:
38 [X] Bullman Dirtbook S12 Touch Intel Core i5-3337U 1.8GHz
HD Graphics 4000
55 [X] Asus N56VM Intel Core i7-3720QM 2.6GHz
HD Graphics 4000
min:
26 fps
~ 47 fps
132%
HD Graphics 4600:
42 [X] MSI CX61-i572M Intel Core i5-4200M 2.5GHz
HD Graphics 4600
81 [X] Schenker W503 Intel Core i7-4700MQ 2.4GHz
HD Graphics 4600
min:
56 fps
~ 62 fps
100%
HD Graphics 4000:
23 [X] Bullman Dirtbook S12 Touch Intel Core i5-3337U 1.8GHz
HD Graphics 4000
33 [X] Asus N56VM Intel Core i7-3720QM 2.6GHz
HD Graphics 4000
min:
16 fps
~ 28 fps
150%
HD Graphics 4600:
30 [X] MSI CX61-i572M Intel Core i5-4200M 2.5GHz
HD Graphics 4600
54 [X] Schenker W503 Intel Core i7-4700MQ 2.4GHz
HD Graphics 4600
min:
36 fps
~ 42 fps
100%
HD Graphics 4000:
16 [X] Bullman Dirtbook S12 Touch Intel Core i5-3337U 1.8GHz
HD Graphics 4000
18 [X] Asus N56VM Intel Core i7-3720QM 2.6GHz
HD Graphics 4000
min:
12 fps
~ 17 fps
141%
HD Graphics 4600:
19 [X] MSI CX61-i572M Intel Core i5-4200M 2.5GHz
HD Graphics 4600
28 [X] Schenker W503 Intel Core i7-4700MQ 2.4GHz
HD Graphics 4600
min:
24 fps
~ 24 fps
100%
HD Graphics 4000:
12 [X] Asus N56VM Intel Core i7-3720QM 2.6GHz
HD Graphics 4000
min:
12 fps
12.5 [X] Bullman Dirtbook S12 Touch Intel Core i5-3337U 1.8GHz
HD Graphics 4000
~ 12 fps
108%
HD Graphics 4600:
12 [X] MSI CX61-i572M Intel Core i5-4200M 2.5GHz
HD Graphics 4600
13 [X] Schenker W503 Intel Core i7-4700MQ 2.4GHz
HD Graphics 4600
min:
12 fps
~ 13 fps
100%
HD Graphics 4000:
8.8 [X] Asus N56VM Intel Core i7-3720QM 2.6GHz
HD Graphics 4000
max:
18 fps
fps
170%
HD Graphics 4600:
13.2 [X] MSI CX61-i572M Intel Core i5-4200M 2.5GHz
HD Graphics 4600
16.9 [X] Schenker W503 Intel Core i7-4700MQ 2.4GHz
HD Graphics 4600
min:
13 fps
~ 15 fps
HD Graphics 4600:
8.9 [X] MSI CX61-i572M Intel Core i5-4200M 2.5GHz
HD Graphics 4600
11.8 [X] Schenker W503 Intel Core i7-4700MQ 2.4GHz
HD Graphics 4600
min:
8 fps
~ 10 fps
HD Graphics 4600:
6.7 [X] Schenker W503 Intel Core i7-4700MQ 2.4GHz
HD Graphics 4600
min:
4 fps
fps
100%
HD Graphics 4000:
11.4 [X] Asus N56VM Intel Core i7-3720QM 2.6GHz
HD Graphics 4000
min:
1 fps, max:
18 fps
fps
114%
HD Graphics 4600:
12.5 [X] MSI CX61-i572M Intel Core i5-4200M 2.5GHz
HD Graphics 4600
13.4 [X] Schenker W503 Intel Core i7-4700MQ 2.4GHz
HD Graphics 4600
min:
9 fps
~ 13 fps
HD Graphics 4600:
8.2 [X] MSI CX61-i572M Intel Core i5-4200M 2.5GHz
HD Graphics 4600
9.2 [X] Schenker W503 Intel Core i7-4700MQ 2.4GHz
HD Graphics 4600
min:
6 fps
~ 9 fps
HD Graphics 4600:
4.4 [X] Schenker W503 Intel Core i7-4700MQ 2.4GHz
HD Graphics 4600
min:
2 fps
fps
HD Graphics 4600:
4.2 [X] Schenker W503 Intel Core i7-4700MQ 2.4GHz
HD Graphics 4600
min:
2 fps
fps
100%
HD Graphics 4000:
28.6 [X] Asus N56VM Intel Core i7-3720QM 2.6GHz
HD Graphics 4000
fps
126%
HD Graphics 4600:
29.7 [X] MSI CX61-i572M Intel Core i5-4200M 2.5GHz
HD Graphics 4600
42 [X] Schenker W503 Intel Core i7-4700MQ 2.4GHz
HD Graphics 4600
~ 36 fps
100%
HD Graphics 4000:
18.2 [X] Asus N56VM Intel Core i7-3720QM 2.6GHz
HD Graphics 4000
fps
126%
HD Graphics 4600:
19.5 [X] MSI CX61-i572M Intel Core i5-4200M 2.5GHz
HD Graphics 4600
26 [X] Schenker W503 Intel Core i7-4700MQ 2.4GHz
HD Graphics 4600
~ 23 fps
HD Graphics 4600:
9.9 [X] MSI CX61-i572M Intel Core i5-4200M 2.5GHz
HD Graphics 4600
13.4 [X] Schenker W503 Intel Core i7-4700MQ 2.4GHz
HD Graphics 4600
~ 12 fps
HD Graphics 4600:
6.8 [X] MSI CX61-i572M Intel Core i5-4200M 2.5GHz
HD Graphics 4600
8.8 [X] Schenker W503 Intel Core i7-4700MQ 2.4GHz
HD Graphics 4600
~ 8 fps
100%
HD Graphics 4000:
13 [X] Asus N56VM Intel Core i7-3720QM 2.6GHz
HD Graphics 4000
min:
8 fps
fps
169%
HD Graphics 4600:
18 [X] MSI CX61-i572M Intel Core i5-4200M 2.5GHz
HD Graphics 4600
26.8 [X] Schenker W503 Intel Core i7-4700MQ 2.4GHz
HD Graphics 4600
min:
17 fps
~ 22 fps
HD Graphics 4600:
12 [X] MSI CX61-i572M Intel Core i5-4200M 2.5GHz
HD Graphics 4600
17.4 [X] Schenker W503 Intel Core i7-4700MQ 2.4GHz
HD Graphics 4600
min:
9 fps
~ 15 fps
100%
HD Graphics 4000:
32.4 [X] Asus N56VM Intel Core i7-3720QM 2.6GHz
HD Graphics 4000
min:
24 fps, max:
42 fps
fps
142%
HD Graphics 4600:
39 [X] MSI CX61-i572M Intel Core i5-4200M 2.5GHz
HD Graphics 4600
52.3 [X] Schenker W503 Intel Core i7-4700MQ 2.4GHz
HD Graphics 4600
min:
45 fps
~ 46 fps
100%
HD Graphics 4000:
24.6 [X] Asus N56VM Intel Core i7-3720QM 2.6GHz
HD Graphics 4000
min:
19 fps, max:
30 fps
fps
126%
HD Graphics 4600:
25.6 [X] MSI CX61-i572M Intel Core i5-4200M 2.5GHz
HD Graphics 4600
36 [X] Schenker W503 Intel Core i7-4700MQ 2.4GHz
HD Graphics 4600
min:
31 fps
~ 31 fps
100%
HD Graphics 4000:
15.7 [X] Asus N56VM Intel Core i7-3720QM 2.6GHz
HD Graphics 4000
min:
12 fps, max:
19 fps
fps
121%
HD Graphics 4600:
16.1 [X] MSI CX61-i572M Intel Core i5-4200M 2.5GHz
HD Graphics 4600
20.9 [X] Schenker W503 Intel Core i7-4700MQ 2.4GHz
HD Graphics 4600
min:
18 fps
~ 19 fps
HD Graphics 4600:
130.4 [X] MSI CX61-i572M Intel Core i5-4200M 2.5GHz
HD Graphics 4600
139.8 [X] Schenker W503 Intel Core i7-4700MQ 2.4GHz
HD Graphics 4600
min:
125 fps
146.3 ~ 139 fps
HD Graphics 4600:
28.4 32.5 [X] MSI CX61-i572M Intel Core i5-4200M 2.5GHz
HD Graphics 4600
40.3 [X] Schenker W503 Intel Core i7-4700MQ 2.4GHz
HD Graphics 4600
min:
32 fps
~ 34 fps
HD Graphics 4600:
13.6 [X] MSI CX61-i572M Intel Core i5-4200M 2.5GHz
HD Graphics 4600
18.8 [X] Schenker W503 Intel Core i7-4700MQ 2.4GHz
HD Graphics 4600
min:
14 fps
~ 16 fps
HD Graphics 4600:
9.5 [X] MSI CX61-i572M Intel Core i5-4200M 2.5GHz
HD Graphics 4600
12.4 [X] Schenker W503 Intel Core i7-4700MQ 2.4GHz
HD Graphics 4600
min:
8 fps
~ 11 fps
100%
HD Graphics 4000:
36.4 [X] Asus N56VM Intel Core i7-3720QM 2.6GHz
HD Graphics 4000
min:
24 fps, max:
43 fps
fps
85%
HD Graphics 4600:
20.5 [X] MSI CX61-i572M Intel Core i5-4200M 2.5GHz
HD Graphics 4600
41.8 [X] Schenker W503 Intel Core i7-4700MQ 2.4GHz
HD Graphics 4600
min:
35 fps
~ 31 fps
100%
HD Graphics 4000:
17.6 [X] Asus N56VM Intel Core i7-3720QM 2.6GHz
HD Graphics 4000
min:
9 fps, max:
22 fps
fps
108%
HD Graphics 4600:
14 [X] MSI CX61-i572M Intel Core i5-4200M 2.5GHz
HD Graphics 4600
23.8 [X] Schenker W503 Intel Core i7-4700MQ 2.4GHz
HD Graphics 4600
min:
19 fps
~ 19 fps
100%
HD Graphics 4000:
7.2 [X] Asus N56VM Intel Core i7-3720QM 2.6GHz
HD Graphics 4000
min:
5 fps, max:
9 fps
fps
97%
HD Graphics 4600:
5.7 [X] MSI CX61-i572M Intel Core i5-4200M 2.5GHz
HD Graphics 4600
8.3 [X] Schenker W503 Intel Core i7-4700MQ 2.4GHz
HD Graphics 4600
min:
7 fps
~ 7 fps
HD Graphics 4600:
6.4 [X] Schenker W503 Intel Core i7-4700MQ 2.4GHz
HD Graphics 4600
min:
5 fps
fps
100%
HD Graphics 4000:
83 [X] Asus N56VM Intel Core i7-3720QM 2.6GHz
HD Graphics 4000
min:
46 fps, max:
137 fps
fps
114%
HD Graphics 4600:
79.7 [X] MSI CX61-i572M Intel Core i5-4200M 2.5GHz
HD Graphics 4600
80.9 98.4 119.5 [X] Schenker W503 Intel Core i7-4700MQ 2.4GHz
HD Graphics 4600
min:
97 fps
~ 95 fps
100%
HD Graphics 4000:
25 [X] Asus N56VM Intel Core i7-3720QM 2.6GHz
HD Graphics 4000
min:
14 fps, max:
42 fps
fps
124%
HD Graphics 4600:
12.6 28 [X] MSI CX61-i572M Intel Core i5-4200M 2.5GHz
HD Graphics 4600
36.6 45.8 [X] Schenker W503 Intel Core i7-4700MQ 2.4GHz
HD Graphics 4600
min:
36 fps
~ 31 fps
100%
HD Graphics 4000:
14 [X] Asus N56VM Intel Core i7-3720QM 2.6GHz
HD Graphics 4000
fps
121%
HD Graphics 4600:
13.3 [X] MSI CX61-i572M Intel Core i5-4200M 2.5GHz
HD Graphics 4600
17.2 19.7 [X] Schenker W503 Intel Core i7-4700MQ 2.4GHz
HD Graphics 4600
min:
16 fps
~ 17 fps
HD Graphics 4600:
12.5 [X] Schenker W503 Intel Core i7-4700MQ 2.4GHz
HD Graphics 4600
min:
12.5 fps
12.5 [X] MSI CX61-i572M Intel Core i5-4200M 2.5GHz
HD Graphics 4600
12.5 ~ 13 fps
100%
HD Graphics 4000:
12.7 [X] Asus N56VM Intel Core i7-3720QM 2.6GHz
HD Graphics 4000
max:
26 fps
fps
192%
HD Graphics 4600:
24.4 [X] Schenker W503 Intel Core i7-4700MQ 2.4GHz
HD Graphics 4600
min:
22 fps
fps
HD Graphics 4600:
14.1 [X] Schenker W503 Intel Core i7-4700MQ 2.4GHz
HD Graphics 4600
min:
12 fps
fps
HD Graphics 4600:
3.6 [X] Schenker W503 Intel Core i7-4700MQ 2.4GHz
HD Graphics 4600
min:
2 fps
fps
100%
HD Graphics 4000:
31 [X] Asus N56VM Intel Core i7-3720QM 2.6GHz
HD Graphics 4000
min:
15 fps, max:
47 fps
fps
126%
HD Graphics 4600:
36.4 [X] MSI CX61-i572M Intel Core i5-4200M 2.5GHz
HD Graphics 4600
42.3 [X] Schenker W503 Intel Core i7-4700MQ 2.4GHz
HD Graphics 4600
min:
34 fps
~ 39 fps
100%
HD Graphics 4000:
21.9 [X] Asus N56VM Intel Core i7-3720QM 2.6GHz
HD Graphics 4000
min:
6 fps, max:
46 fps
fps
160%
HD Graphics 4600:
33.6 [X] MSI CX61-i572M Intel Core i5-4200M 2.5GHz
HD Graphics 4600
37.2 [X] Schenker W503 Intel Core i7-4700MQ 2.4GHz
HD Graphics 4600
min:
31 fps
~ 35 fps
100%
HD Graphics 4000:
9.1 [X] Asus N56VM Intel Core i7-3720QM 2.6GHz
HD Graphics 4000
max:
15 fps
fps
154%
HD Graphics 4600:
14.1 [X] Schenker W503 Intel Core i7-4700MQ 2.4GHz
HD Graphics 4600
min:
12 fps
14.2 [X] MSI CX61-i572M Intel Core i5-4200M 2.5GHz
HD Graphics 4600
~ 14 fps
100%
HD Graphics 4000:
40 [X] Asus N56VM Intel Core i7-3720QM 2.6GHz
HD Graphics 4000
min:
26 fps, max:
60 fps
fps
148%
HD Graphics 4600:
56.9 [X] MSI CX61-i572M Intel Core i5-4200M 2.5GHz
HD Graphics 4600
60.8 [X] Schenker W503 Intel Core i7-4700MQ 2.4GHz
HD Graphics 4600
~ 59 fps
86%
HD Graphics (Ivy Bridge):
34.5 fps
100%
HD Graphics 4000:
23.1 [X] Asus N56VM Intel Core i7-3720QM 2.6GHz
HD Graphics 4000
min:
17 fps, max:
32 fps
fps
117%
HD Graphics 4600:
21.8 [X] MSI CX61-i572M Intel Core i5-4200M 2.5GHz
HD Graphics 4600
31.3 [X] Schenker W503 Intel Core i7-4700MQ 2.4GHz
HD Graphics 4600
~ 27 fps
62%
HD Graphics (Ivy Bridge):
14.3 fps
100%
HD Graphics 4000:
13.9 [X] Asus N56VM Intel Core i7-3720QM 2.6GHz
HD Graphics 4000
min:
9 fps, max:
19 fps
fps
115%
HD Graphics 4600:
13.6 [X] MSI CX61-i572M Intel Core i5-4200M 2.5GHz
HD Graphics 4600
19.3 [X] Schenker W503 Intel Core i7-4700MQ 2.4GHz
HD Graphics 4600
~ 16 fps
62%
HD Graphics (Ivy Bridge):
8.6 fps
100%
HD Graphics 4000:
7.2 [X] Asus N56VM Intel Core i7-3720QM 2.6GHz
HD Graphics 4000
min:
3 fps, max:
11 fps
fps
129%
HD Graphics 4600:
9.3 [X] Schenker W503 Intel Core i7-4700MQ 2.4GHz
HD Graphics 4600
fps
100%
HD Graphics 4000:
20.4 [X] Schenker XMG P502 Intel Core i7-3610QM 2.3GHz
HD Graphics 4000
fps
211%
HD Graphics 4600:
39.6 [X] MSI CX61-i572M Intel Core i5-4200M 2.5GHz
HD Graphics 4600
46.4 [X] Schenker W503 Intel Core i7-4700MQ 2.4GHz
HD Graphics 4600
~ 43 fps
100%
HD Graphics 4000:
10.9 [X] Schenker XMG P502 Intel Core i7-3610QM 2.3GHz
HD Graphics 4000
fps
202%
HD Graphics 4600:
20.8 [X] MSI CX61-i572M Intel Core i5-4200M 2.5GHz
HD Graphics 4600
23.3 [X] Schenker W503 Intel Core i7-4700MQ 2.4GHz
HD Graphics 4600
~ 22 fps
100%
HD Graphics 4000:
6.7 [X] Schenker XMG P502 Intel Core i7-3610QM 2.3GHz
HD Graphics 4000
fps
209%
HD Graphics 4600:
13.3 [X] MSI CX61-i572M Intel Core i5-4200M 2.5GHz
HD Graphics 4600
14.4 [X] Schenker W503 Intel Core i7-4700MQ 2.4GHz
HD Graphics 4600
~ 14 fps
100%
HD Graphics 4000:
4.9 [X] Schenker XMG P502 Intel Core i7-3610QM 2.3GHz
HD Graphics 4000
fps
186%
HD Graphics 4600:
9.1 [X] Schenker W503 Intel Core i7-4700MQ 2.4GHz
HD Graphics 4600
fps
100%
HD Graphics 4000:
19 [X] Schenker XMG P502 Intel Core i7-3610QM 2.3GHz
HD Graphics 4000
fps
84%
HD Graphics 4600:
13.6 13.7 14.3 14.9 [X] MSI CX61-i572M Intel Core i5-4200M 2.5GHz
HD Graphics 4600
16.2 16.5 19.1 21.3 [X] Schenker W503 Intel Core i7-4700MQ 2.4GHz
HD Graphics 4600
~ 16 fps
31%
HD Graphics (Ivy Bridge):
5.9 fps
100%
HD Graphics 4000:
10.9 [X] Schenker XMG P502 Intel Core i7-3610QM 2.3GHz
HD Graphics 4000
fps
83%
HD Graphics 4600:
8 8 8.2 9.1 9.3 [X] MSI CX61-i572M Intel Core i5-4200M 2.5GHz
HD Graphics 4600
9.3 11 12.2 [X] Schenker W503 Intel Core i7-4700MQ 2.4GHz
HD Graphics 4600
~ 9 fps
33%
HD Graphics (Ivy Bridge):
3.6 fps
100%
HD Graphics 4000:
8.8 [X] Schenker XMG P502 Intel Core i7-3610QM 2.3GHz
HD Graphics 4000
fps
91%
HD Graphics 4600:
5.1 7.3 7.5 [X] MSI CX61-i572M Intel Core i5-4200M 2.5GHz
HD Graphics 4600
7.5 9.1 9.9 [X] Schenker W503 Intel Core i7-4700MQ 2.4GHz
HD Graphics 4600
~ 8 fps
100%
HD Graphics 4000:
4.3 [X] Schenker XMG P502 Intel Core i7-3610QM 2.3GHz
HD Graphics 4000
fps
112%
HD Graphics 4600:
4.8 [X] Schenker W503 Intel Core i7-4700MQ 2.4GHz
HD Graphics 4600
fps
100%
HD Graphics 4000:
23.6 [X] Schenker XMG P502 Intel Core i7-3610QM 2.3GHz
HD Graphics 4000
fps
105%
HD Graphics 4600:
24.8 [X] Schenker M503 Intel Core i7-4702MQ 2.2GHz
HD Graphics 4600
fps
100%
HD Graphics 4000:
17.4 [X] Schenker XMG P502 Intel Core i7-3610QM 2.3GHz
HD Graphics 4000
fps
106%
HD Graphics 4600:
18.4 [X] Schenker M503 Intel Core i7-4702MQ 2.2GHz
HD Graphics 4600
fps
100%
HD Graphics 4000:
7.4 [X] Schenker XMG P502 Intel Core i7-3610QM 2.3GHz
HD Graphics 4000
fps
120%
HD Graphics 4600:
8.9 [X] Schenker M503 Intel Core i7-4702MQ 2.2GHz
HD Graphics 4600
fps
100%
HD Graphics 4000:
3.6 [X] Schenker XMG P502 Intel Core i7-3610QM 2.3GHz
HD Graphics 4000
fps
131%
HD Graphics 4600:
4.7 [X] Schenker M503 Intel Core i7-4702MQ 2.2GHz
HD Graphics 4600
fps
100%
HD Graphics 4000:
37.7 [X] Asus N56VM Intel Core i7-3720QM 2.6GHz
HD Graphics 4000
46 [X] Schenker XMG P502 Intel Core i7-3610QM 2.3GHz
HD Graphics 4000
~ 42 fps
102%
HD Graphics 4600:
35.5 [X] MSI CX61-i572M Intel Core i5-4200M 2.5GHz
HD Graphics 4600
51.2 [X] Schenker W503 Intel Core i7-4700MQ 2.4GHz
HD Graphics 4600
~ 43 fps
36%
HD Graphics (Ivy Bridge):
15 fps
100%
HD Graphics 4000:
14.6 [X] Asus N56VM Intel Core i7-3720QM 2.6GHz
HD Graphics 4000
18.1 [X] Schenker XMG P502 Intel Core i7-3610QM 2.3GHz
HD Graphics 4000
~ 16 fps
156%
HD Graphics 4600:
21 [X] MSI CX61-i572M Intel Core i5-4200M 2.5GHz
HD Graphics 4600
28.8 [X] Schenker W503 Intel Core i7-4700MQ 2.4GHz
HD Graphics 4600
~ 25 fps
48%
HD Graphics (Ivy Bridge):
7.6 fps
100%
HD Graphics 4000:
6.6 [X] Asus N56VM Intel Core i7-3720QM 2.6GHz
HD Graphics 4000
7.4 [X] Schenker XMG P502 Intel Core i7-3610QM 2.3GHz
HD Graphics 4000
~ 7 fps
143%
HD Graphics 4600:
8.1 [X] MSI CX61-i572M Intel Core i5-4200M 2.5GHz
HD Graphics 4600
12.1 [X] Schenker W503 Intel Core i7-4700MQ 2.4GHz
HD Graphics 4600
~ 10 fps
100%
HD Graphics 4000:
4.4 [X] Asus N56VM Intel Core i7-3720QM 2.6GHz
HD Graphics 4000
4.7 [X] Schenker XMG P502 Intel Core i7-3610QM 2.3GHz
HD Graphics 4000
~ 5 fps
188%
HD Graphics 4600:
9.4 [X] Schenker W503 Intel Core i7-4700MQ 2.4GHz
HD Graphics 4600
fps
100%
HD Graphics 4000:
12.6 [X] Asus N56VM Intel Core i7-3720QM 2.6GHz
HD Graphics 4000
min:
5 fps, max:
27 fps
fps
135%
HD Graphics 4600:
14.3 [X] MSI CX61-i572M Intel Core i5-4200M 2.5GHz
HD Graphics 4600
20.1 [X] Schenker M503 Intel Core i7-4702MQ 2.2GHz
HD Graphics 4600
min:
13 fps
~ 17 fps
HD Graphics 4600:
11.4 [X] MSI CX61-i572M Intel Core i5-4200M 2.5GHz
HD Graphics 4600
15.4 [X] Schenker M503 Intel Core i7-4702MQ 2.2GHz
HD Graphics 4600
min:
10 fps
~ 13 fps
HD Graphics 4600:
8.8 [X] MSI CX61-i572M Intel Core i5-4200M 2.5GHz
HD Graphics 4600
12.7 [X] Schenker M503 Intel Core i7-4702MQ 2.2GHz
HD Graphics 4600
min:
9 fps
~ 11 fps
100%
HD Graphics 4000:
40.6 [X] Schenker XMG P502 Intel Core i7-3610QM 2.3GHz
HD Graphics 4000
fps
100%
HD Graphics 4600:
40.8 [X] Schenker M503 Intel Core i7-4702MQ 2.2GHz
HD Graphics 4600
fps
100%
HD Graphics 4000:
24.3 [X] Schenker XMG P502 Intel Core i7-3610QM 2.3GHz
HD Graphics 4000
fps
113%
HD Graphics 4600:
27.4 [X] Schenker M503 Intel Core i7-4702MQ 2.2GHz
HD Graphics 4600
fps
100%
HD Graphics 4000:
7.2 [X] Schenker XMG P502 Intel Core i7-3610QM 2.3GHz
HD Graphics 4000
fps
140%
HD Graphics 4600:
10.1 [X] Schenker M503 Intel Core i7-4702MQ 2.2GHz
HD Graphics 4600
fps
100%
HD Graphics 4000:
4 [X] Schenker XMG P502 Intel Core i7-3610QM 2.3GHz
HD Graphics 4000
fps
130%
HD Graphics 4600:
5.2 [X] Schenker M503 Intel Core i7-4702MQ 2.2GHz
HD Graphics 4600
fps
100%
HD Graphics 4000:
32.2 [X] Schenker XMG P502 Intel Core i7-3610QM 2.3GHz
HD Graphics 4000
fps
114%
HD Graphics 4600:
36.6 [X] Schenker M503 Intel Core i7-4702MQ 2.2GHz
HD Graphics 4600
fps
100%
HD Graphics 4000:
19.7 [X] Schenker XMG P502 Intel Core i7-3610QM 2.3GHz
HD Graphics 4000
fps
126%
HD Graphics 4600:
24.8 [X] Schenker M503 Intel Core i7-4702MQ 2.2GHz
HD Graphics 4600
fps
100%
HD Graphics 4000:
12.2 [X] Schenker XMG P502 Intel Core i7-3610QM 2.3GHz
HD Graphics 4000
fps
125%
HD Graphics 4600:
15.3 [X] Schenker M503 Intel Core i7-4702MQ 2.2GHz
HD Graphics 4600
fps
100%
HD Graphics 4000:
4.7 [X] Schenker XMG P502 Intel Core i7-3610QM 2.3GHz
HD Graphics 4000
fps
117%
HD Graphics 4600:
5.5 [X] Schenker M503 Intel Core i7-4702MQ 2.2GHz
HD Graphics 4600
fps
100%
HD Graphics 4000:
52 [X] Schenker XMG P502 Intel Core i7-3610QM 2.3GHz
HD Graphics 4000
fps
108%
HD Graphics 4600:
56 [X] Schenker M503 Intel Core i7-4702MQ 2.2GHz
HD Graphics 4600
fps
100%
HD Graphics 4000:
30 [X] Schenker XMG P502 Intel Core i7-3610QM 2.3GHz
HD Graphics 4000
fps
107%
HD Graphics 4600:
32 [X] Schenker M503 Intel Core i7-4702MQ 2.2GHz
HD Graphics 4600
fps
100%
HD Graphics 4000:
12 [X] Schenker XMG P502 Intel Core i7-3610QM 2.3GHz
HD Graphics 4000
fps
125%
HD Graphics 4600:
15 [X] Schenker M503 Intel Core i7-4702MQ 2.2GHz
HD Graphics 4600
fps
100%
HD Graphics 4000:
6 [X] Schenker XMG P502 Intel Core i7-3610QM 2.3GHz
HD Graphics 4000
fps
117%
HD Graphics 4600:
7 [X] Schenker M503 Intel Core i7-4702MQ 2.2GHz
HD Graphics 4600
fps
100%
HD Graphics 4000:
34 34 48 76 [X] Asus N56VM Intel Core i7-3720QM 2.6GHz
HD Graphics 4000
85 [X] Schenker XMG P502 Intel Core i7-3610QM 2.3GHz
HD Graphics 4000
~ 55 fps
109%
HD Graphics 4600:
40 50 [X] MSI CX61-i572M Intel Core i5-4200M 2.5GHz
HD Graphics 4600
90 [X] Schenker W503 Intel Core i7-4700MQ 2.4GHz
HD Graphics 4600
~ 60 fps
36%
HD Graphics (Ivy Bridge):
20 fps
100%
HD Graphics 4000:
28 28 33 46 [X] Schenker XMG P502 Intel Core i7-3610QM 2.3GHz
HD Graphics 4000
~ 34 fps
106%
HD Graphics 4600:
26 31 [X] MSI CX61-i572M Intel Core i5-4200M 2.5GHz
HD Graphics 4600
52 [X] Schenker W503 Intel Core i7-4700MQ 2.4GHz
HD Graphics 4600
~ 36 fps
41%
HD Graphics (Ivy Bridge):
14 fps
100%
HD Graphics 4000:
24 25 26 33 [X] Schenker XMG P502 Intel Core i7-3610QM 2.3GHz
HD Graphics 4000
~ 27 fps
104%
HD Graphics 4600:
22 25 [X] MSI CX61-i572M Intel Core i5-4200M 2.5GHz
HD Graphics 4600
36 [X] Schenker W503 Intel Core i7-4700MQ 2.4GHz
HD Graphics 4600
~ 28 fps
100%
HD Graphics 4000:
12 [X] Schenker XMG P502 Intel Core i7-3610QM 2.3GHz
HD Graphics 4000
12 12 ~ 12 fps
108%
HD Graphics 4600:
12 14 [X] Schenker W503 Intel Core i7-4700MQ 2.4GHz
HD Graphics 4600
~ 13 fps
100%
HD Graphics 4000:
87.1 182 207.4 [X] Schenker XMG P502 Intel Core i7-3610QM 2.3GHz
HD Graphics 4000
~ 159 fps
106%
HD Graphics 4600:
112 226 [X] Schenker W503 Intel Core i7-4700MQ 2.4GHz
HD Graphics 4600
~ 169 fps
100%
HD Graphics 4000:
56.7 97 112.1 [X] Schenker XMG P502 Intel Core i7-3610QM 2.3GHz
HD Graphics 4000
~ 89 fps
100%
HD Graphics 4600:
64.5 85.8 [X] MSI CX61-i572M Intel Core i5-4200M 2.5GHz
HD Graphics 4600
116.4 [X] Schenker W503 Intel Core i7-4700MQ 2.4GHz
HD Graphics 4600
~ 89 fps
61%
HD Graphics (Ivy Bridge):
54.4 fps
100%
HD Graphics 4000:
33.7 48 84 [X] Asus N56VM Intel Core i7-3720QM 2.6GHz
HD Graphics 4000
85.4 [X] Schenker XMG P502 Intel Core i7-3610QM 2.3GHz
HD Graphics 4000
~ 63 fps
94%
HD Graphics 4600:
41.9 49.4 [X] MSI CX61-i572M Intel Core i5-4200M 2.5GHz
HD Graphics 4600
86 [X] Schenker W503 Intel Core i7-4700MQ 2.4GHz
HD Graphics 4600
~ 59 fps
51%
HD Graphics (Ivy Bridge):
32 fps
100%
HD Graphics 4000:
18 26 44.7 [X] Schenker XMG P502 Intel Core i7-3610QM 2.3GHz
HD Graphics 4000
49.6 [X] Asus N56VM Intel Core i7-3720QM 2.6GHz
HD Graphics 4000
~ 35 fps
137%
HD Graphics 4600:
48 [X] Schenker W503 Intel Core i7-4700MQ 2.4GHz
HD Graphics 4600
fps
100%
HD Graphics 4000:
20 [X] Wortmann Terra Mobile Pad 1160 Pro Intel Core i5-3337U 1.8GHz
HD Graphics 4000
25.6 29.9 42 [X] Schenker XMG P502 Intel Core i7-3610QM 2.3GHz
HD Graphics 4000
~ 29 fps
134%
HD Graphics 4600:
32 35.4 35.9 [X] MSI CX61-i572M Intel Core i5-4200M 2.5GHz
HD Graphics 4600
52.1 [X] Schenker W503 Intel Core i7-4700MQ 2.4GHz
HD Graphics 4600
~ 39 fps
100%
HD Graphics 4000:
14 [X] Wortmann Terra Mobile Pad 1160 Pro Intel Core i5-3337U 1.8GHz
HD Graphics 4000
19.4 21.6 30.9 [X] Schenker XMG P502 Intel Core i7-3610QM 2.3GHz
HD Graphics 4000
~ 21 fps
133%
HD Graphics 4600:
23 24 26.7 [X] MSI CX61-i572M Intel Core i5-4200M 2.5GHz
HD Graphics 4600
39 [X] Schenker W503 Intel Core i7-4700MQ 2.4GHz
HD Graphics 4600
~ 28 fps
HD Graphics 4600:
18 18.8 27.7 [X] Schenker W503 Intel Core i7-4700MQ 2.4GHz
HD Graphics 4600
~ 22 fps
HD Graphics 4600:
6 8.1 [X] Schenker W503 Intel Core i7-4700MQ 2.4GHz
HD Graphics 4600
~ 7 fps
100%
HD Graphics 4000:
28.6 [X] Asus N56VM Intel Core i7-3720QM 2.6GHz
HD Graphics 4000
30.8 [X] Schenker XMG P502 Intel Core i7-3610QM 2.3GHz
HD Graphics 4000
~ 30 fps
87%
HD Graphics 4600:
21.1 [X] MSI CX61-i572M Intel Core i5-4200M 2.5GHz
HD Graphics 4600
30.9 [X] Schenker W503 Intel Core i7-4700MQ 2.4GHz
HD Graphics 4600
~ 26 fps
100%
HD Graphics 4000:
20.6 [X] Schenker XMG P502 Intel Core i7-3610QM 2.3GHz
HD Graphics 4000
21.8 [X] Asus N56VM Intel Core i7-3720QM 2.6GHz
HD Graphics 4000
~ 21 fps
90%
HD Graphics 4600:
15.7 [X] MSI CX61-i572M Intel Core i5-4200M 2.5GHz
HD Graphics 4600
22.4 [X] Schenker W503 Intel Core i7-4700MQ 2.4GHz
HD Graphics 4600
~ 19 fps
100%
HD Graphics 4000:
9.4 [X] Schenker XMG P502 Intel Core i7-3610QM 2.3GHz
HD Graphics 4000
9.6 [X] Asus N56VM Intel Core i7-3720QM 2.6GHz
HD Graphics 4000
~ 10 fps
109%
HD Graphics 4600:
10.9 [X] Schenker W503 Intel Core i7-4700MQ 2.4GHz
HD Graphics 4600
fps
100%
HD Graphics 4000:
5.5 [X] Schenker XMG P502 Intel Core i7-3610QM 2.3GHz
HD Graphics 4000
5.5 [X] Asus N56VM Intel Core i7-3720QM 2.6GHz
HD Graphics 4000
~ 6 fps
105%
HD Graphics 4600:
6.3 [X] Schenker W503 Intel Core i7-4700MQ 2.4GHz
HD Graphics 4600
fps
100%
HD Graphics 4000:
38.2 [X] Schenker XMG P502 Intel Core i7-3610QM 2.3GHz
HD Graphics 4000
fps
104%
HD Graphics 4600:
39.8 [X] Schenker W503 Intel Core i7-4700MQ 2.4GHz
HD Graphics 4600
fps
100%
HD Graphics 4000:
16.4 [X] Schenker XMG P502 Intel Core i7-3610QM 2.3GHz
HD Graphics 4000
fps
104%
HD Graphics 4600:
17.1 [X] Schenker W503 Intel Core i7-4700MQ 2.4GHz
HD Graphics 4600
fps
100%
HD Graphics 4000:
8.9 [X] Schenker XMG P502 Intel Core i7-3610QM 2.3GHz
HD Graphics 4000
fps
109%
HD Graphics 4600:
9.7 [X] Schenker W503 Intel Core i7-4700MQ 2.4GHz
HD Graphics 4600
fps
100%
HD Graphics 4000:
5.9 [X] Schenker XMG P502 Intel Core i7-3610QM 2.3GHz
HD Graphics 4000
fps
112%
HD Graphics 4600:
6.6 [X] Schenker W503 Intel Core i7-4700MQ 2.4GHz
HD Graphics 4600
fps
100%
HD Graphics 4000:
40.7 [X] Schenker XMG P502 Intel Core i7-3610QM 2.3GHz
HD Graphics 4000
fps
128%
HD Graphics 4600:
52.1 [X] Schenker W503 Intel Core i7-4700MQ 2.4GHz
HD Graphics 4600
fps
100%
HD Graphics 4000:
32.8 97.3 [X] Schenker XMG P502 Intel Core i7-3610QM 2.3GHz
HD Graphics 4000
~ 65 fps
111%
HD Graphics 4600:
41.5 72.3 74.5 [X] Fujitsu LifeBook E744 Intel Core i5-4200M 2.5GHz
HD Graphics 4600
98.3 [X] Schenker W503 Intel Core i7-4700MQ 2.4GHz
HD Graphics 4600
~ 72 fps
37%
HD Graphics (Ivy Bridge):
18.4 30.5 ~ 24 fps
100%
HD Graphics 4000:
21.1 53.9 [X] Schenker XMG P502 Intel Core i7-3610QM 2.3GHz
HD Graphics 4000
~ 38 fps
108%
HD Graphics 4600:
26.5 30.3 [X] Fujitsu LifeBook E744 Intel Core i5-4200M 2.5GHz
HD Graphics 4600
47 59.7 [X] Schenker W503 Intel Core i7-4700MQ 2.4GHz
HD Graphics 4600
~ 41 fps
42%
HD Graphics (Ivy Bridge):
8.2 24.5 ~ 16 fps
100%
HD Graphics 4000:
10.3 19.4 [X] Schenker XMG P502 Intel Core i7-3610QM 2.3GHz
HD Graphics 4000
~ 15 fps
140%
HD Graphics 4600:
14.4 23.9 24.4 [X] Schenker W503 Intel Core i7-4700MQ 2.4GHz
HD Graphics 4600
~ 21 fps
100%
HD Graphics 4000:
4 5 14.9 [X] Schenker XMG A502 Intel Core i5-3360M 2.8GHz
HD Graphics 4000
15 [X] Schenker XMG P502 Intel Core i7-3610QM 2.3GHz
HD Graphics 4000
~ 10 fps
150%
HD Graphics 4600:
14.7 [X] One K56-3F Intel Core i7-4700MQ 2.4GHz
HD Graphics 4600
15 [X] Wortmann Terra Mobile 1529H Intel Core i5-4200M 2.5GHz
HD Graphics 4600
~ 15 fps
100%
HD Graphics 4000:
5 11.5 [X] Schenker XMG A502 Intel Core i5-3360M 2.8GHz
HD Graphics 4000
11.7 [X] Schenker XMG P502 Intel Core i7-3610QM 2.3GHz
HD Graphics 4000
~ 9 fps
122%
HD Graphics 4600:
11 [X] Wortmann Terra Mobile 1529H Intel Core i5-4200M 2.5GHz
HD Graphics 4600
11.4 [X] One K56-3F Intel Core i7-4700MQ 2.4GHz
HD Graphics 4600
~ 11 fps
100%
HD Graphics 4000:
6.2 [X] Schenker XMG A502 Intel Core i5-3360M 2.8GHz
HD Graphics 4000
6.3 [X] Schenker XMG P502 Intel Core i7-3610QM 2.3GHz
HD Graphics 4000
~ 6 fps
100%
HD Graphics 4600:
6 [X] Wortmann Terra Mobile 1529H Intel Core i5-4200M 2.5GHz
HD Graphics 4600
6.6 [X] One K56-3F Intel Core i7-4700MQ 2.4GHz
HD Graphics 4600
~ 6 fps
100%
HD Graphics 4000:
2.9 [X] Schenker XMG P502 Intel Core i7-3610QM 2.3GHz
HD Graphics 4000
2.9 [X] Schenker XMG A502 Intel Core i5-3360M 2.8GHz
HD Graphics 4000
~ 3 fps
97%
HD Graphics 4600:
2.9 [X] One K56-3F Intel Core i7-4700MQ 2.4GHz
HD Graphics 4600
fps
100%
HD Graphics 4000:
72.6 [X] Schenker XMG P502 Intel Core i7-3610QM 2.3GHz
HD Graphics 4000
fps
85%
HD Graphics 4600:
50 [X] Wortmann Terra Mobile 1529H Intel Core i5-4200M 2.5GHz
HD Graphics 4600
54.2 [X] MSI CX61-i572M Intel Core i5-4200M 2.5GHz
HD Graphics 4600
56.4 63.7 84.5 [X] Toshiba Satellite P70-A-104 Intel Core i7-4700MQ 2.4GHz
HD Graphics 4600
~ 62 fps
38%
HD Graphics (Ivy Bridge):
27.5 fps
100%
HD Graphics 4000:
37.8 [X] Schenker XMG P502 Intel Core i7-3610QM 2.3GHz
HD Graphics 4000
fps
87%
HD Graphics 4600:
27 [X] Wortmann Terra Mobile 1529H Intel Core i5-4200M 2.5GHz
HD Graphics 4600
29.3 29.8 [X] MSI CX61-i572M Intel Core i5-4200M 2.5GHz
HD Graphics 4600
34.6 43.9 [X] Toshiba Satellite P70-A-104 Intel Core i7-4700MQ 2.4GHz
HD Graphics 4600
~ 33 fps
34%
HD Graphics (Ivy Bridge):
12.8 fps
100%
HD Graphics 4000:
20.2 [X] Schenker XMG P502 Intel Core i7-3610QM 2.3GHz
HD Graphics 4000
fps
109%
HD Graphics 4600:
18.7 [X] MSI CX61-i572M Intel Core i5-4200M 2.5GHz
HD Graphics 4600
19.7 22.7 23 [X] Wortmann Terra Mobile 1529H Intel Core i5-4200M 2.5GHz
HD Graphics 4600
25.3 [X] Toshiba Satellite P70-A-104 Intel Core i7-4700MQ 2.4GHz
HD Graphics 4600
~ 22 fps
62%
HD Graphics (Ivy Bridge):
12.5 fps
HD Graphics 4600:
12.5 fps
100%
HD Graphics 4000:
16.6 [X] Schenker XMG A502 Intel Core i5-3360M 2.8GHz
HD Graphics 4000
26.4 [X] Schenker XMG P502 Intel Core i7-3610QM 2.3GHz
HD Graphics 4000
~ 22 fps
127%
HD Graphics 4600:
16 34 [X] no model Intel Core i7-4770K 3.5GHz
HD Graphics 4600
34 [X] Core i7-4930MX (Clevo P150SM) Intel Core i7-4930MX 3GHz
HD Graphics 4600
~ 28 fps
48%
HD Graphics (Ivy Bridge):
10.5 fps
100%
HD Graphics 4000:
11.4 [X] Schenker XMG A502 Intel Core i5-3360M 2.8GHz
HD Graphics 4000
17.6 [X] Schenker XMG P502 Intel Core i7-3610QM 2.3GHz
HD Graphics 4000
~ 15 fps
133%
HD Graphics 4600:
12 23.3 [X] no model Intel Core i7-4770K 3.5GHz
HD Graphics 4600
23.7 [X] Core i7-4930MX (Clevo P150SM) Intel Core i7-4930MX 3GHz
HD Graphics 4600
~ 20 fps
54%
HD Graphics (Ivy Bridge):
8.1 fps
100%
HD Graphics 4000:
6.3 [X] Schenker XMG A502 Intel Core i5-3360M 2.8GHz
HD Graphics 4000
10.1 [X] Schenker XMG P502 Intel Core i7-3610QM 2.3GHz
HD Graphics 4000
~ 8 fps
138%
HD Graphics 4600:
8 13.2 [X] no model Intel Core i7-4770K 3.5GHz
HD Graphics 4600
13.2 [X] Core i7-4930MX (Clevo P150SM) Intel Core i7-4930MX 3GHz
HD Graphics 4600
~ 11 fps
54%
HD Graphics (Ivy Bridge):
4.4 fps
100%
HD Graphics 4000:
3.3 [X] Schenker XMG A502 Intel Core i5-3360M 2.8GHz
HD Graphics 4000
5.1 [X] Schenker XMG P502 Intel Core i7-3610QM 2.3GHz
HD Graphics 4000
~ 4 fps
150%
HD Graphics 4600:
4 6.5 [X] no model Intel Core i7-4770K 3.5GHz
HD Graphics 4600
6.6 [X] Core i7-4930MX (Clevo P150SM) Intel Core i7-4930MX 3GHz
HD Graphics 4600
~ 6 fps
137%
HD Graphics 4600:
23 24.1 27.2 28.2 29.3 30 [X] Wortmann Terra Mobile 1529H Intel Core i5-4200M 2.5GHz
HD Graphics 4600
34.7 35.2 40.7 43 44 46 52.4 [X] no model Intel Core i7-4770K 3.5GHz
HD Graphics 4600
57 [X] Core i7-4930MX (Clevo P150SM) Intel Core i7-4930MX 3GHz
HD Graphics 4600
~ 37 fps
63%
HD Graphics (Ivy Bridge):
16 16.4 19.1 ~ 17 fps
64%
HD Graphics (Ivy Bridge):
8.6 8.9 9 ~ 9 fps
125%
HD Graphics 4600:
10.5 11.7 11.9 12 [X] Wortmann Terra Mobile 1529H Intel Core i5-4200M 2.5GHz
HD Graphics 4600
12.3 13.4 13.8 16.1 17.5 17.7 18.7 20.5 [X] no model Intel Core i7-4770K 3.5GHz
HD Graphics 4600
21.8 [X] Core i7-4930MX (Clevo P150SM) Intel Core i7-4930MX 3GHz
HD Graphics 4600
~ 15 fps
64%
HD Graphics (Ivy Bridge):
7.7 fps
100%
HD Graphics 4000:
3 3.4 3.6 5 [X] Schenker XMG P502 Intel Core i7-3610QM 2.3GHz
HD Graphics 4000
6.5 ~ 4 fps
200%
HD Graphics 4600:
5.3 6.6 [X] no model Intel Core i7-4770K 3.5GHz
HD Graphics 4600
7 [X] Core i7-4930MX (Clevo P150SM) Intel Core i7-4930MX 3GHz
HD Graphics 4600
12.2 ~ 8 fps
228%
HD Graphics 4600:
253 [X] no model Intel Core i7-4770K 3.5GHz
HD Graphics 4600
fps
86%
HD Graphics (Ivy Bridge):
80.8 112 [X] Medion Akoya E7221-MD98297 Intel Pentium 2020M 2.4GHz
HD Graphics (Ivy Bridge)
~ 96 fps
173%
HD Graphics 4600:
52 [X] no model Intel Core i7-4770K 3.5GHz
HD Graphics 4600
fps
73%
HD Graphics (Ivy Bridge):
19.3 24 [X] Medion Akoya E7221-MD98297 Intel Pentium 2020M 2.4GHz
HD Graphics (Ivy Bridge)
~ 22 fps
100%
HD Graphics 4000:
11.4 14 15 15.4 15.5 19 21 22 [X] Schenker XMG P502 Intel Core i7-3610QM 2.3GHz
HD Graphics 4000
~ 17 fps
194%
HD Graphics 4600:
33 [X] no model Intel Core i7-4770K 3.5GHz
HD Graphics 4600
fps
76%
HD Graphics (Ivy Bridge):
10.8 15 [X] Medion Akoya E7221-MD98297 Intel Pentium 2020M 2.4GHz
HD Graphics (Ivy Bridge)
~ 13 fps
100%
HD Graphics 4000:
7.6 [X] Schenker XMG P502 Intel Core i7-3610QM 2.3GHz
HD Graphics 4000
fps
145%
HD Graphics 4600:
11 [X] no model Intel Core i7-4770K 3.5GHz
HD Graphics 4600
fps
53%
HD Graphics (Ivy Bridge):
4 [X] Medion Akoya E7221-MD98297 Intel Pentium 2020M 2.4GHz
HD Graphics (Ivy Bridge)
fps
100%
HD Graphics 4000:
21 28.9 [X] Schenker XMG P502 Intel Core i7-3610QM 2.3GHz
HD Graphics 4000
37 ~ 29 fps
255%
HD Graphics 4600:
50.2 [X] no model Intel Core i7-4770K 3.5GHz
HD Graphics 4600
97.6 [X] MSI CX61-i572M Intel Core i5-4200M 2.5GHz
HD Graphics 4600
~ 74 fps
100%
HD Graphics 4000:
11 15 15.2 [X] Schenker XMG P502 Intel Core i7-3610QM 2.3GHz
HD Graphics 4000
~ 14 fps
129%
HD Graphics 4600:
15.2 [X] MSI CX61-i572M Intel Core i5-4200M 2.5GHz
HD Graphics 4600
21.7 [X] no model Intel Core i7-4770K 3.5GHz
HD Graphics 4600
~ 18 fps
100%
HD Graphics 4000:
8 11 11.1 [X] Schenker XMG P502 Intel Core i7-3610QM 2.3GHz
HD Graphics 4000
~ 10 fps
150%
HD Graphics 4600:
15 [X] no model Intel Core i7-4770K 3.5GHz
HD Graphics 4600
fps
100%
HD Graphics 4000:
5.4 [X] Schenker XMG P502 Intel Core i7-3610QM 2.3GHz
HD Graphics 4000
fps
130%
HD Graphics 4600:
7 [X] no model Intel Core i7-4770K 3.5GHz
HD Graphics 4600
fps
100%
HD Graphics 4000:
7.7 9 9.5 9.6 10 10.4 10.8 [X] Bullman Dirtbook S12 Touch Intel Core i5-3337U 1.8GHz
HD Graphics 4000
10.9 11.3 13.1 [X] Schenker XMG P502 Intel Core i7-3610QM 2.3GHz
HD Graphics 4000
15.3 ~ 11 fps
64%
HD Graphics (Ivy Bridge):
5.1 7.4 7.6 8 [X] Medion Akoya E7221-MD98297 Intel Pentium 2020M 2.4GHz
HD Graphics (Ivy Bridge)
~ 7 fps
100%
HD Graphics 4000:
6.4 [X] Schenker XMG P502 Intel Core i7-3610QM 2.3GHz
HD Graphics 4000
7.1 [X] Bullman Dirtbook S12 Touch Intel Core i5-3337U 1.8GHz
HD Graphics 4000
7.7 ~ 7 fps
57%
HD Graphics 4600:
0 (!) [X] no model Intel Core i7-4770K 3.5GHz
HD Graphics 4600
4.3 8.5 ~ 4 fps
100%
HD Graphics 4000:
19 22 [X] Asus N56VM Intel Core i7-3720QM 2.6GHz
HD Graphics 4000
24.8 [X] Schenker XMG P502 Intel Core i7-3610QM 2.3GHz
HD Graphics 4000
~ 22 fps
109%
HD Graphics 4600:
16.8 [X] MSI CX61-i572M Intel Core i5-4200M 2.5GHz
HD Graphics 4600
30.4 [X] Core i7-4930MX (Clevo P150SM) Intel Core i7-4930MX 3GHz
HD Graphics 4600
~ 24 fps
100%
HD Graphics 4000:
9 13.4 [X] Schenker XMG P502 Intel Core i7-3610QM 2.3GHz
HD Graphics 4000
~ 11 fps
175%
HD Graphics 4600:
19.3 [X] Core i7-4930MX (Clevo P150SM) Intel Core i7-4930MX 3GHz
HD Graphics 4600
fps
100%
HD Graphics 4000:
7 8.3 [X] Schenker XMG P502 Intel Core i7-3610QM 2.3GHz
HD Graphics 4000
~ 8 fps
169%
HD Graphics 4600:
13.5 [X] Core i7-4930MX (Clevo P150SM) Intel Core i7-4930MX 3GHz
HD Graphics 4600
fps
100%
HD Graphics 4000:
3.2 [X] Schenker XMG P502 Intel Core i7-3610QM 2.3GHz
HD Graphics 4000
fps
147%
HD Graphics 4600:
4.7 [X] Core i7-4930MX (Clevo P150SM) Intel Core i7-4930MX 3GHz
HD Graphics 4600
fps
100%
HD Graphics 4000:
37.3 42.7 69.4 [X] Schenker XMG A502 Intel Core i5-3360M 2.8GHz
HD Graphics 4000
79.7 [X] Schenker XMG P502 Intel Core i7-3610QM 2.3GHz
HD Graphics 4000
80.4 [X] Intel Core i7-3770K, Intel DZ77GA-70K Desktop, DDR3-1600 Intel Core i7-3770K 3.5GHz
HD Graphics 4000
86 [X] Asus N56VM Intel Core i7-3720QM 2.6GHz
HD Graphics 4000
~ 66 fps
153%
HD Graphics 4600:
101.2 [X] Core i7-4930MX (Clevo P150SM) Intel Core i7-4930MX 3GHz
HD Graphics 4600
fps
64%
HD Graphics (Ivy Bridge):
42 [X] Medion Akoya E7221-MD98297 Intel Pentium 2020M 2.4GHz
HD Graphics (Ivy Bridge)
fps
100%
HD Graphics 4000:
17.4 19.4 30.2 [X] Schenker XMG A502 Intel Core i5-3360M 2.8GHz
HD Graphics 4000
32.8 [X] Schenker XMG P502 Intel Core i7-3610QM 2.3GHz
HD Graphics 4000
34.3 [X] Asus N56VM Intel Core i7-3720QM 2.6GHz
HD Graphics 4000
34.5 [X] Intel Core i7-3770K, Intel DZ77GA-70K Desktop, DDR3-1600 Intel Core i7-3770K 3.5GHz
HD Graphics 4000
~ 28 fps
150%
HD Graphics 4600:
41.9 [X] Core i7-4930MX (Clevo P150SM) Intel Core i7-4930MX 3GHz
HD Graphics 4600
fps
61%
HD Graphics (Ivy Bridge):
17 [X] Medion Akoya E7221-MD98297 Intel Pentium 2020M 2.4GHz
HD Graphics (Ivy Bridge)
fps
100%
HD Graphics 4000:
14.2 14.9 23.7 [X] Schenker XMG A502 Intel Core i5-3360M 2.8GHz
HD Graphics 4000
26 [X] Schenker XMG P502 Intel Core i7-3610QM 2.3GHz
HD Graphics 4000
27.2 [X] Asus N56VM Intel Core i7-3720QM 2.6GHz
HD Graphics 4000
27.4 [X] Intel Core i7-3770K, Intel DZ77GA-70K Desktop, DDR3-1600 Intel Core i7-3770K 3.5GHz
HD Graphics 4000
~ 22 fps
143%
HD Graphics 4600:
31.4 [X] Core i7-4930MX (Clevo P150SM) Intel Core i7-4930MX 3GHz
HD Graphics 4600
fps
55%
HD Graphics (Ivy Bridge):
12 [X] Medion Akoya E7221-MD98297 Intel Pentium 2020M 2.4GHz
HD Graphics (Ivy Bridge)
fps
100%
HD Graphics 4000:
13.6 [X] Schenker XMG A502 Intel Core i5-3360M 2.8GHz
HD Graphics 4000
14.6 [X] Schenker XMG P502 Intel Core i7-3610QM 2.3GHz
HD Graphics 4000
15.1 [X] Asus N56VM Intel Core i7-3720QM 2.6GHz
HD Graphics 4000
15.2 [X] Intel Core i7-3770K, Intel DZ77GA-70K Desktop, DDR3-1600 Intel Core i7-3770K 3.5GHz
HD Graphics 4000
~ 15 fps
116%
HD Graphics 4600:
17.4 [X] Core i7-4930MX (Clevo P150SM) Intel Core i7-4930MX 3GHz
HD Graphics 4600
fps
40%
HD Graphics (Ivy Bridge):
6 [X] Medion Akoya E7221-MD98297 Intel Pentium 2020M 2.4GHz
HD Graphics (Ivy Bridge)
fps
100%
HD Graphics 4000:
31.7 [X] Schenker XMG A502 Intel Core i5-3360M 2.8GHz
HD Graphics 4000
32.1 [X] Asus N56VM Intel Core i7-3720QM 2.6GHz
HD Graphics 4000
~ 32 fps
119%
HD Graphics 4600:
38.1 [X] Toshiba Satellite P70-A-104 Intel Core i7-4700MQ 2.4GHz
HD Graphics 4600
fps
100%
HD Graphics 4000:
20.1 [X] Schenker XMG A502 Intel Core i5-3360M 2.8GHz
HD Graphics 4000
22.6 [X] Asus N56VM Intel Core i7-3720QM 2.6GHz
HD Graphics 4000
~ 21 fps
111%
HD Graphics 4600:
23.4 [X] Toshiba Satellite P70-A-104 Intel Core i7-4700MQ 2.4GHz
HD Graphics 4600
fps
100%
HD Graphics 4000:
7.8 [X] Schenker XMG A502 Intel Core i5-3360M 2.8GHz
HD Graphics 4000
fps
100%
HD Graphics 4000:
17.2 [X] Schenker XMG A502 Intel Core i5-3360M 2.8GHz
HD Graphics 4000
17.5 [X] Asus N56VM Intel Core i7-3720QM 2.6GHz
HD Graphics 4000
~ 17 fps
88%
HD Graphics 4600:
14.9 fps
100%
HD Graphics 4000:
15.5 [X] Schenker XMG A502 Intel Core i5-3360M 2.8GHz
HD Graphics 4000
fps
100%
HD Graphics 4000:
3.7 [X] Schenker XMG A502 Intel Core i5-3360M 2.8GHz
HD Graphics 4000
fps
100%
HD Graphics 4000:
10.8 11 17 18 [X] Tarox Modula Ultrabook i7 Intel Core i7-3517U 1.9GHz
HD Graphics 4000
21.5 21.6 [X] Schenker XMG A502 Intel Core i5-3360M 2.8GHz
HD Graphics 4000
23.9 [X] Asus N56VM Intel Core i7-3720QM 2.6GHz
HD Graphics 4000
min:
16 fps, max:
28.2 fps
~ 18 fps
111%
HD Graphics 4600:
19.4 21.2 [X] MSI CX61-i572M Intel Core i5-4200M 2.5GHz
HD Graphics 4600
~ 20 fps
72%
HD Graphics (Ivy Bridge):
13 [X] Medion Akoya E7221-MD98297 Intel Pentium 2020M 2.4GHz
HD Graphics (Ivy Bridge)
fps
100%
HD Graphics 4000:
8 8.6 14 [X] Tarox Modula Ultrabook i7 Intel Core i7-3517U 1.9GHz
HD Graphics 4000
14 17 [X] Schenker XMG A502 Intel Core i5-3360M 2.8GHz
HD Graphics 4000
17.8 18.6 [X] Asus N56VM Intel Core i7-3720QM 2.6GHz
HD Graphics 4000
~ 14 fps
100%
HD Graphics 4600:
13 14.5 [X] MSI CX61-i572M Intel Core i5-4200M 2.5GHz
HD Graphics 4600
~ 14 fps
79%
HD Graphics (Ivy Bridge):
11 [X] Medion Akoya E7221-MD98297 Intel Pentium 2020M 2.4GHz
HD Graphics (Ivy Bridge)
fps
100%
HD Graphics 4000:
3 5 5.6 [X] Schenker XMG A502 Intel Core i5-3360M 2.8GHz
HD Graphics 4000
6 [X] Tarox Modula Ultrabook i7 Intel Core i7-3517U 1.9GHz
HD Graphics 4000
6.1 [X] Asus N56VM Intel Core i7-3720QM 2.6GHz
HD Graphics 4000
6.2 ~ 5 fps
140%
HD Graphics 4600:
5.4 [X] MSI CX61-i572M Intel Core i5-4200M 2.5GHz
HD Graphics 4600
9.2 ~ 7 fps
80%
HD Graphics (Ivy Bridge):
4 [X] Medion Akoya E7221-MD98297 Intel Pentium 2020M 2.4GHz
HD Graphics (Ivy Bridge)
fps
100%
HD Graphics 4000:
2.8 [X] Schenker XMG A502 Intel Core i5-3360M 2.8GHz
HD Graphics 4000
3 [X] Asus N56VM Intel Core i7-3720QM 2.6GHz
HD Graphics 4000
3 [X] Tarox Modula Ultrabook i7 Intel Core i7-3517U 1.9GHz
HD Graphics 4000
3.1 ~ 3 fps
100%
HD Graphics 4000:
29.6 31 31.8 [X] Schenker XMG A502 Intel Core i5-3360M 2.8GHz
HD Graphics 4000
36.1 [X] Asus N56VM Intel Core i7-3720QM 2.6GHz
HD Graphics 4000
~ 32 fps
194%
HD Graphics 4600:
62 [X] Core i7-4930MX (Clevo P150SM) Intel Core i7-4930MX 3GHz
HD Graphics 4600
fps
100%
HD Graphics 4000:
19 19.7 22.1 [X] Schenker XMG A502 Intel Core i5-3360M 2.8GHz
HD Graphics 4000
25.2 [X] Asus N56VM Intel Core i7-3720QM 2.6GHz
HD Graphics 4000
~ 22 fps
186%
HD Graphics 4600:
40.9 [X] Core i7-4930MX (Clevo P150SM) Intel Core i7-4930MX 3GHz
HD Graphics 4600
fps
100%
HD Graphics 4000:
5.5 6 7.2 [X] Schenker XMG A502 Intel Core i5-3360M 2.8GHz
HD Graphics 4000
8.7 [X] Asus N56VM Intel Core i7-3720QM 2.6GHz
HD Graphics 4000
~ 7 fps
250%
HD Graphics 4600:
17.5 [X] Core i7-4930MX (Clevo P150SM) Intel Core i7-4930MX 3GHz
HD Graphics 4600
fps
100%
HD Graphics 4000:
6.6 [X] Asus N56VM Intel Core i7-3720QM 2.6GHz
HD Graphics 4000
fps
161%
HD Graphics 4600:
10.6 [X] Core i7-4930MX (Clevo P150SM) Intel Core i7-4930MX 3GHz
HD Graphics 4600
fps
100%
HD Graphics 4000:
17 27.7 [X] Schenker XMG A502 Intel Core i5-3360M 2.8GHz
HD Graphics 4000
32.5 ~ 26 fps
133%
HD Graphics 4600:
34.7 [X] Toshiba Satellite P70-A-104 Intel Core i7-4700MQ 2.4GHz
HD Graphics 4600
fps
100%
HD Graphics 4000:
10 11 19.9 [X] Schenker XMG A502 Intel Core i5-3360M 2.8GHz
HD Graphics 4000
~ 14 fps
172%
HD Graphics 4600:
24.1 [X] Toshiba Satellite P70-A-104 Intel Core i7-4700MQ 2.4GHz
HD Graphics 4600
fps
100%
HD Graphics 4000:
5 12.6 [X] Schenker XMG A502 Intel Core i5-3360M 2.8GHz
HD Graphics 4000
~ 9 fps
100%
HD Graphics 4000:
7.7 [X] Schenker XMG A502 Intel Core i5-3360M 2.8GHz
HD Graphics 4000
fps
100%
HD Graphics 4000:
9 [X] Medion Akoya S4216 MD 99080 Intel Core i3-3217U 1.8GHz
HD Graphics 4000
14 19 30.6 [X] Schenker XMG A502 Intel Core i5-3360M 2.8GHz
HD Graphics 4000
~ 18 fps
137%
HD Graphics 4600:
24.6 fps
100%
HD Graphics 4000:
7.4 [X] Medion Akoya S4216 MD 99080 Intel Core i3-3217U 1.8GHz
HD Graphics 4000
12 13 19.8 [X] Schenker XMG A502 Intel Core i5-3360M 2.8GHz
HD Graphics 4000
~ 13 fps
125%
HD Graphics 4600:
16.3 fps
100%
HD Graphics 4000:
9.6 16 [X] Schenker XMG A502 Intel Core i5-3360M 2.8GHz
HD Graphics 4000
~ 13 fps
100%
HD Graphics 4000:
5.1 [X] Schenker XMG A502 Intel Core i5-3360M 2.8GHz
HD Graphics 4000
fps
100%
HD Graphics 4000:
9.5 20.5 [X] Fujitsu Lifebook P702 P702XM25S1DE Intel Core i5-3210M 2.5GHz
HD Graphics 4000
32.1 35.2 35.8 [X] Schenker XMG A502 Intel Core i5-3360M 2.8GHz
HD Graphics 4000
40.1 [X] Asus N56VM Intel Core i7-3720QM 2.6GHz
HD Graphics 4000
~ 29 fps
145%
HD Graphics 4600:
25.9 57.9 [X] Core i7-4930MX (Clevo P150SM) Intel Core i7-4930MX 3GHz
HD Graphics 4600
~ 42 fps
66%
HD Graphics (Ivy Bridge):
18 19 ~ 19 fps
100%
HD Graphics 4000:
19.5 [X] Fujitsu Lifebook P702 P702XM25S1DE Intel Core i5-3210M 2.5GHz
HD Graphics 4000
20.5 26.5 32.7 [X] Schenker XMG A502 Intel Core i5-3360M 2.8GHz
HD Graphics 4000
36 [X] Asus N56VM Intel Core i7-3720QM 2.6GHz
HD Graphics 4000
~ 27 fps
119%
HD Graphics 4600:
20.7 43.8 [X] Core i7-4930MX (Clevo P150SM) Intel Core i7-4930MX 3GHz
HD Graphics 4600
~ 32 fps
56%
HD Graphics (Ivy Bridge):
14 15.2 ~ 15 fps
100%
HD Graphics 4000:
18 [X] Fujitsu Lifebook P702 P702XM25S1DE Intel Core i5-3210M 2.5GHz
HD Graphics 4000
20.2 29.2 [X] Schenker XMG A502 Intel Core i5-3360M 2.8GHz
HD Graphics 4000
32 [X] Asus N56VM Intel Core i7-3720QM 2.6GHz
HD Graphics 4000
min:
30 fps, max:
54 fps
~ 25 fps
112%
HD Graphics 4600:
18.1 38.5 [X] Core i7-4930MX (Clevo P150SM) Intel Core i7-4930MX 3GHz
HD Graphics 4600
~ 28 fps
100%
HD Graphics 4000:
16.4 [X] Schenker XMG A502 Intel Core i5-3360M 2.8GHz
HD Graphics 4000
17.7 [X] Asus N56VM Intel Core i7-3720QM 2.6GHz
HD Graphics 4000
~ 17 fps
116%
HD Graphics 4600:
19.7 [X] Core i7-4930MX (Clevo P150SM) Intel Core i7-4930MX 3GHz
HD Graphics 4600
fps
100%
HD Graphics 4000:
38.9 41 55 64.3 [X] Schenker XMG A502 Intel Core i5-3360M 2.8GHz
HD Graphics 4000
~ 50 fps
100%
HD Graphics 4000:
19 21.7 [X] Schenker XMG A502 Intel Core i5-3360M 2.8GHz
HD Graphics 4000
22.2 26.2 ~ 22 fps
100%
HD Graphics 4000:
15.3 [X] Schenker XMG A502 Intel Core i5-3360M 2.8GHz
HD Graphics 4000
18.9 21.6 ~ 19 fps
100%
HD Graphics 4000:
8.4 [X] Schenker XMG A502 Intel Core i5-3360M 2.8GHz
HD Graphics 4000
fps
60%
HD Graphics (Ivy Bridge):
18.3 52 69.7 90 [X] Medion Akoya E7221-MD98297 Intel Pentium 2020M 2.4GHz
HD Graphics (Ivy Bridge)
~ 58 fps
59%
HD Graphics (Ivy Bridge):
13.2 32.8 42.7 54 [X] Medion Akoya E7221-MD98297 Intel Pentium 2020M 2.4GHz
HD Graphics (Ivy Bridge)
~ 36 fps
54%
HD Graphics (Ivy Bridge):
8.6 20.9 23 29 [X] Medion Akoya E7221-MD98297 Intel Pentium 2020M 2.4GHz
HD Graphics (Ivy Bridge)
~ 20 fps
100%
HD Graphics 4000:
9.3 15 15 18 20.2 22 25 26 [X] Tarox Modula Ultrabook i7 Intel Core i7-3517U 1.9GHz
HD Graphics 4000
27 27.3 [X] Schenker XMG A502 Intel Core i5-3360M 2.8GHz
HD Graphics 4000
29 29.1 [X] Asus N56VM Intel Core i7-3720QM 2.6GHz
HD Graphics 4000
~ 22 fps
59%
HD Graphics (Ivy Bridge):
13 [X] Medion Akoya E7221-MD98297 Intel Pentium 2020M 2.4GHz
HD Graphics (Ivy Bridge)
fps
68%
HD Graphics (Ivy Bridge):
20 25 [X] Medion Akoya E7221-MD98297 Intel Pentium 2020M 2.4GHz
HD Graphics (Ivy Bridge)
~ 23 fps
70%
HD Graphics (Ivy Bridge):
18 20 [X] Medion Akoya E7221-MD98297 Intel Pentium 2020M 2.4GHz
HD Graphics (Ivy Bridge)
~ 19 fps
76%
HD Graphics (Ivy Bridge):
16 [X] Medion Akoya E7221-MD98297 Intel Pentium 2020M 2.4GHz
HD Graphics (Ivy Bridge)
16 ~ 16 fps
100%
HD Graphics 4000:
12 [X] Schenker XMG A502 Intel Core i5-3360M 2.8GHz
HD Graphics 4000
12 12 ~ 12 fps
100%
HD Graphics (Ivy Bridge):
12 [X] Medion Akoya E7221-MD98297 Intel Pentium 2020M 2.4GHz
HD Graphics (Ivy Bridge)
fps
100%
HD Graphics 4000:
27.2 32.7 [X] Schenker XMG A502 Intel Core i5-3360M 2.8GHz
HD Graphics 4000
41 ~ 34 fps
100%
HD Graphics 4000:
21.7 23.2 26.2 [X] Schenker XMG A502 Intel Core i5-3360M 2.8GHz
HD Graphics 4000
~ 24 fps
100%
HD Graphics 4000:
15.7 15.8 19.3 [X] Schenker XMG A502 Intel Core i5-3360M 2.8GHz
HD Graphics 4000
~ 17 fps
100%
HD Graphics 4000:
10.3 [X] Schenker XMG A502 Intel Core i5-3360M 2.8GHz
HD Graphics 4000
fps
100%
HD Graphics 4000:
58.7 64.7 [X] Schenker XMG A502 Intel Core i5-3360M 2.8GHz
HD Graphics 4000
~ 62 fps
100%
HD Graphics 4000:
34 [X] Schenker XMG A502 Intel Core i5-3360M 2.8GHz
HD Graphics 4000
36.7 ~ 35 fps
100%
HD Graphics 4000:
18.8 [X] Schenker XMG A502 Intel Core i5-3360M 2.8GHz
HD Graphics 4000
22.7 ~ 21 fps
100%
HD Graphics 4000:
17.9 21.6 25 32 34 35 35 44 [X] Schenker XMG A502 Intel Core i5-3360M 2.8GHz
HD Graphics 4000
44 45 45.3 49.4 [X] Asus N56VM Intel Core i7-3720QM 2.6GHz
HD Graphics 4000
~ 36 fps
83%
HD Graphics (Ivy Bridge):
30 [X] Medion Akoya E7221-MD98297 Intel Pentium 2020M 2.4GHz
HD Graphics (Ivy Bridge)
fps
100%
HD Graphics 4000:
5.8 7.3 11 12 13 14 14.8 15 15.1 [X] Asus N56VM Intel Core i7-3720QM 2.6GHz
HD Graphics 4000
15.8 [X] Schenker XMG A502 Intel Core i5-3360M 2.8GHz
HD Graphics 4000
~ 12 fps
67%
HD Graphics (Ivy Bridge):
8 [X] Medion Akoya E7221-MD98297 Intel Pentium 2020M 2.4GHz
HD Graphics (Ivy Bridge)
fps
100%
HD Graphics 4000:
5 [X] Schenker XMG A502 Intel Core i5-3360M 2.8GHz
HD Graphics 4000
5 5.3 [X] Asus N56VM Intel Core i7-3720QM 2.6GHz
HD Graphics 4000
11 12 ~ 8 fps
63%
HD Graphics (Ivy Bridge):
5 [X] Medion Akoya E7221-MD98297 Intel Pentium 2020M 2.4GHz
HD Graphics (Ivy Bridge)
fps
100%
HD Graphics 4000:
55.3 62 77.7 78.6 105.5 [X] Schenker XMG A502 Intel Core i5-3360M 2.8GHz
HD Graphics 4000
144.7 [X] Asus N56VM Intel Core i7-3720QM 2.6GHz
HD Graphics 4000
~ 87 fps
215%
HD Graphics 4600:
186.9 [X] Core i7-4930MX (Clevo P150SM) Intel Core i7-4930MX 3GHz
HD Graphics 4600
fps
100%
HD Graphics 4000:
35.5 37.3 43.9 49.7 63.2 [X] Schenker XMG A502 Intel Core i5-3360M 2.8GHz
HD Graphics 4000
64 [X] Asus N56VM Intel Core i7-3720QM 2.6GHz
HD Graphics 4000
~ 49 fps
202%
HD Graphics 4600:
99.2 [X] Core i7-4930MX (Clevo P150SM) Intel Core i7-4930MX 3GHz
HD Graphics 4600
fps
76%
HD Graphics (Ivy Bridge):
37 [X] Medion Akoya E7221-MD98297 Intel Pentium 2020M 2.4GHz
HD Graphics (Ivy Bridge)
fps
100%
HD Graphics 4000:
20.3 21.3 25.2 28.2 33.5 [X] Schenker XMG A502 Intel Core i5-3360M 2.8GHz
HD Graphics 4000
39 [X] Asus N56VM Intel Core i7-3720QM 2.6GHz
HD Graphics 4000
~ 28 fps
186%
HD Graphics 4600:
49 [X] no model Intel Core i7-4770K 3.5GHz
HD Graphics 4600
55.5 [X] Core i7-4930MX (Clevo P150SM) Intel Core i7-4930MX 3GHz
HD Graphics 4600
~ 52 fps
71%
HD Graphics (Ivy Bridge):
20 [X] Medion Akoya E7221-MD98297 Intel Pentium 2020M 2.4GHz
HD Graphics (Ivy Bridge)
fps
100%
HD Graphics 4000:
13.1 20.9 [X] Schenker XMG A502 Intel Core i5-3360M 2.8GHz
HD Graphics 4000
26 [X] Asus N56VM Intel Core i7-3720QM 2.6GHz
HD Graphics 4000
~ 20 fps
135%
HD Graphics 4600:
26 [X] no model Intel Core i7-4770K 3.5GHz
HD Graphics 4600
28.3 [X] Core i7-4930MX (Clevo P150SM) Intel Core i7-4930MX 3GHz
HD Graphics 4600
~ 27 fps
55%
HD Graphics (Ivy Bridge):
11 [X] Medion Akoya E7221-MD98297 Intel Pentium 2020M 2.4GHz
HD Graphics (Ivy Bridge)
fps
100%
HD Graphics 4000:
21 27.2 [X] Schenker XMG A502 Intel Core i5-3360M 2.8GHz
HD Graphics 4000
~ 24 fps
100%
HD Graphics 4000:
12 15.3 [X] Schenker XMG A502 Intel Core i5-3360M 2.8GHz
HD Graphics 4000
~ 14 fps
165%
HD Graphics 4600:
30.1 [X] MSI CX61-i572M Intel Core i5-4200M 2.5GHz
HD Graphics 4600
45.5 [X] Core i7-4930MX (Clevo P150SM) Intel Core i7-4930MX 3GHz
HD Graphics 4600
~ 38 fps
100%
HD Graphics 4000:
9.2 14 14.9 15 17.2 22.3 [X] Schenker XMG A502 Intel Core i5-3360M 2.8GHz
HD Graphics 4000
~ 15 fps
180%
HD Graphics 4600:
21.2 [X] MSI CX61-i572M Intel Core i5-4200M 2.5GHz
HD Graphics 4600
32.8 [X] Core i7-4930MX (Clevo P150SM) Intel Core i7-4930MX 3GHz
HD Graphics 4600
~ 27 fps
100%
HD Graphics 4000:
5 7 7.5 7.6 7.9 9.2 [X] Schenker XMG A502 Intel Core i5-3360M 2.8GHz
HD Graphics 4000
~ 7 fps
157%
HD Graphics 4600:
9.7 [X] MSI CX61-i572M Intel Core i5-4200M 2.5GHz
HD Graphics 4600
12.6 [X] Core i7-4930MX (Clevo P150SM) Intel Core i7-4930MX 3GHz
HD Graphics 4600
~ 11 fps
100%
HD Graphics 4000:
5 fps
130%
HD Graphics 4600:
6.5 [X] Core i7-4930MX (Clevo P150SM) Intel Core i7-4930MX 3GHz
HD Graphics 4600
fps
100%
HD Graphics 4000:
23.5 [X] Schenker XMG P502 Intel Core i7-3610QM 2.3GHz
HD Graphics 4000
fps
100%
HD Graphics 4000:
17.8 [X] Schenker XMG P502 Intel Core i7-3610QM 2.3GHz
HD Graphics 4000
fps
100%
HD Graphics 4000:
11.6 [X] Schenker XMG P502 Intel Core i7-3610QM 2.3GHz
HD Graphics 4000
fps
100%
HD Graphics 4000:
14.1 [X] Schenker XMG P502 Intel Core i7-3610QM 2.3GHz
HD Graphics 4000
15.5 [X] Asus N56VM Intel Core i7-3720QM 2.6GHz
HD Graphics 4000
~ 15 fps
100%
HD Graphics 4000:
8.3 [X] Schenker XMG P502 Intel Core i7-3610QM 2.3GHz
HD Graphics 4000
fps
100%
HD Graphics 4000:
22.3 [X] Schenker XMG P502 Intel Core i7-3610QM 2.3GHz
HD Graphics 4000
fps
87%
HD Graphics 4600:
19.4 [X] MSI CX61-i572M Intel Core i5-4200M 2.5GHz
HD Graphics 4600
fps
100%
HD Graphics 4000:
33 39.6 51 [X] Alienware M17x R4 Intel Core i7-3610QM 2.3GHz
HD Graphics 4000
54.3 54.5 [X] Schenker XMG A502 Intel Core i7-3610QM 2.3GHz
HD Graphics 4000
60 [X] Asus N56VM Intel Core i7-3720QM 2.6GHz
HD Graphics 4000
~ 49 fps
73%
HD Graphics (Ivy Bridge):
33.3 [X] Wortmann Terra Mobile 1512 Intel Celeron 1037U 1.8GHz
HD Graphics (Ivy Bridge)
38 ~ 36 fps
100%
HD Graphics 4000:
20.3 21 24.5 31.1 [X] Alienware M17x R4 Intel Core i7-3610QM 2.3GHz
HD Graphics 4000
31.6 [X] Schenker XMG A502 Intel Core i7-3610QM 2.3GHz
HD Graphics 4000
33 [X] Asus N56VM Intel Core i7-3720QM 2.6GHz
HD Graphics 4000
~ 27 fps
185%
HD Graphics 4600:
49.9 [X] Toshiba Satellite P70-A-104 Intel Core i7-4700MQ 2.4GHz
HD Graphics 4600
fps
48%
HD Graphics (Ivy Bridge):
13.2 [X] Wortmann Terra Mobile 1512 Intel Celeron 1037U 1.8GHz
HD Graphics (Ivy Bridge)
13.5 ~ 13 fps
100%
HD Graphics 4000:
12.8 16 17.2 [X] Schenker XMG A502 Intel Core i7-3610QM 2.3GHz
HD Graphics 4000
19 [X] Alienware M17x R4 Intel Core i7-3610QM 2.3GHz
HD Graphics 4000
21 [X] Asus N56VM Intel Core i7-3720QM 2.6GHz
HD Graphics 4000
~ 17 fps
156%
HD Graphics 4600:
26.6 [X] Toshiba Satellite P70-A-104 Intel Core i7-4700MQ 2.4GHz
HD Graphics 4600
fps
100%
HD Graphics 4000:
5.7 [X] Schenker XMG A502 Intel Core i7-3610QM 2.3GHz
HD Graphics 4000
6 [X] Alienware M17x R4 Intel Core i7-3610QM 2.3GHz
HD Graphics 4000
6 [X] Alienware M17x R4 Intel Core i7-3610QM 2.3GHz
HD Graphics 4000
7 [X] Asus N56VM Intel Core i7-3720QM 2.6GHz
HD Graphics 4000
7 ~ 6 fps
149%
HD Graphics 4600:
45.1 72 72.9 78 [X] no model 1.08
Intel Core i7-4770K 3.5GHz
HD Graphics 4600
82.2 [X] Core i7-4930MX (Clevo P150SM) Intel Core i7-4930MX 3GHz
HD Graphics 4600
~ 70 fps
62%
HD Graphics (Ivy Bridge):
29.2 fps
169%
HD Graphics 4600:
28.6 45.1 46 50.3 [X] Core i7-4930MX (Clevo P150SM) Intel Core i7-4930MX 3GHz
HD Graphics 4600
51 [X] no model 1.08
Intel Core i7-4770K 3.5GHz
HD Graphics 4600
~ 44 fps
67%
HD Graphics (Ivy Bridge):
17.5 fps
176%
HD Graphics 4600:
23.2 38 38.8 42 [X] no model 1.08
Intel Core i7-4770K 3.5GHz
HD Graphics 4600
42.6 [X] Core i7-4930MX (Clevo P150SM) Intel Core i7-4930MX 3GHz
HD Graphics 4600
~ 37 fps
70%
HD Graphics (Ivy Bridge):
14.6 fps
100%
HD Graphics 4000:
10.8 [X] Asus UX32VD Intel Core i5-3317U 1.7GHz
HD Graphics 4000
11 11.2 [X] Schenker XMG A502 Intel Core i7-3610QM 2.3GHz
HD Graphics 4000
11.6 13 [X] Asus N56VM Intel Core i7-3720QM 2.6GHz
HD Graphics 4000
13 13.2 14 14.4 15 16 16 16 17 ~ 14 fps
164%
HD Graphics 4600:
13.9 24 24 26 [X] no model 1.08
Intel Core i7-4770K 3.5GHz
HD Graphics 4600
26.5 [X] Core i7-4930MX (Clevo P150SM) Intel Core i7-4930MX 3GHz
HD Graphics 4600
~ 23 fps
100%
HD Graphics 4000:
16 21 25 25.3 [X] One M73-2O Intel Core i7-3520M 2.9GHz
HD Graphics 4000
33 [X] Asus N56VM Intel Core i7-3720QM 2.6GHz
HD Graphics 4000
~ 24 fps
63%
HD Graphics 4600:
0 (!) [X] no model Intel Core i7-4770K 3.5GHz
HD Graphics 4600
29.7 [X] Toshiba Satellite P70-A-104 Intel Core i7-4700MQ 2.4GHz
HD Graphics 4600
~ 15 fps
100%
HD Graphics 4000:
10 13 16.8 [X] One M73-2O Intel Core i7-3520M 2.9GHz
HD Graphics 4000
17 [X] Asus N56VM Intel Core i7-3720QM 2.6GHz
HD Graphics 4000
~ 14 fps
129%
HD Graphics 4600:
18.1 [X] Toshiba Satellite P70-A-104 Intel Core i7-4700MQ 2.4GHz
HD Graphics 4600
fps
100%
HD Graphics 4000:
8 10 12.8 [X] One M73-2O Intel Core i7-3520M 2.9GHz
HD Graphics 4000
13 [X] Asus N56VM Intel Core i7-3720QM 2.6GHz
HD Graphics 4000
~ 11 fps
100%
HD Graphics 4000:
5.9 [X] One M73-2O Intel Core i7-3520M 2.9GHz
HD Graphics 4000
6 [X] Asus N56VM Intel Core i7-3720QM 2.6GHz
HD Graphics 4000
~ 6 fps
100%
HD Graphics 4000:
15.9 [X] Medion Akoya S4216 MD 99080 Intel Core i3-3217U 1.8GHz
HD Graphics 4000
18 20 21.1 21.2 25.4 27.4 27.7 [X] Fujitsu Lifebook P702 P702XM25S1DE Intel Core i5-3210M 2.5GHz
HD Graphics 4000
42.4 [X] MSI GT70 Intel Core i7-3610QM 2.3GHz
HD Graphics 4000
42.5 [X] One M73-2N Intel Core i5-3320M 2.6GHz
HD Graphics 4000
48.3 [X] Intel Core i7-3820QM 2.7GHz
HD Graphics 4000
~ 28 fps
115%
HD Graphics 4600:
32.1 fps
100%
HD Graphics 4000:
11 [X] Medion Akoya S4216 MD 99080 Intel Core i3-3217U 1.8GHz
HD Graphics 4000
11 11.7 15.3 16.2 19 19.9 [X] Fujitsu Lifebook P702 P702XM25S1DE Intel Core i5-3210M 2.5GHz
HD Graphics 4000
20.1 30.7 [X] MSI GT70 Intel Core i7-3610QM 2.3GHz
HD Graphics 4000
30.9 [X] One M73-2N Intel Core i5-3320M 2.6GHz
HD Graphics 4000
33.9 [X] Intel Core i7-3820QM 2.7GHz
HD Graphics 4000
~ 20 fps
112%
HD Graphics 4600:
22.4 fps
100%
HD Graphics 4000:
8.3 12.3 18.1 [X] MSI GT70 Intel Core i7-3610QM 2.3GHz
HD Graphics 4000
18.2 [X] One M73-2N Intel Core i5-3320M 2.6GHz
HD Graphics 4000
18.8 [X] Intel Core i7-3820QM 2.7GHz
HD Graphics 4000
~ 15 fps
100%
HD Graphics 4000:
10 11.5 13.6 [X] One M73-2N Intel Core i5-3320M 2.6GHz
HD Graphics 4000
14.4 [X] MSI GT70 Intel Core i7-3610QM 2.3GHz
HD Graphics 4000
16.2 [X] Intel Core i7-3820QM 2.7GHz
HD Graphics 4000
~ 13 fps
142%
HD Graphics 4600:
18.5 [X] Toshiba Satellite P70-A-104 Intel Core i7-4700MQ 2.4GHz
HD Graphics 4600
fps
100%
HD Graphics 4000:
8 10.3 [X] One M73-2N Intel Core i5-3320M 2.6GHz
HD Graphics 4000
10.6 [X] MSI GT70 Intel Core i7-3610QM 2.3GHz
HD Graphics 4000
11.8 [X] Intel Core i7-3820QM 2.7GHz
HD Graphics 4000
~ 10 fps
100%
HD Graphics 4000:
4.8 [X] One M73-2N Intel Core i5-3320M 2.6GHz
HD Graphics 4000
4.8 [X] MSI GT70 Intel Core i7-3610QM 2.3GHz
HD Graphics 4000
5.3 [X] Intel Core i7-3820QM 2.7GHz
HD Graphics 4000
~ 5 fps
169%
HD Graphics 4600:
47.6 [X] Fujitsu LifeBook E744 Intel Core i5-4200M 2.5GHz
HD Graphics 4600
55 59 66.1 77.1 92.3 [X] Core i7-4930MX (Clevo P150SM) Intel Core i7-4930MX 3GHz
HD Graphics 4600
~ 66 fps
67%
HD Graphics (Ivy Bridge):
11.1 23.1 26 26.5 27.6 27.8 28.4 28.5 [X] Wortmann Terra Mobile 1512 Intel Celeron 1037U 1.8GHz
HD Graphics (Ivy Bridge)
37.1 [X] Lenovo B590 (59-362559) Intel Pentium 2020M 2.4GHz
HD Graphics (Ivy Bridge)
~ 26 fps
150%
HD Graphics 4600:
20.6 [X] Fujitsu LifeBook E744 Intel Core i5-4200M 2.5GHz
HD Graphics 4600
25.5 27.4 28.3 35.1 42.1 [X] Core i7-4930MX (Clevo P150SM) Intel Core i7-4930MX 3GHz
HD Graphics 4600
~ 30 fps
60%
HD Graphics (Ivy Bridge):
5.5 11.2 11.4 11.5 [X] Wortmann Terra Mobile 1512 Intel Celeron 1037U 1.8GHz
HD Graphics (Ivy Bridge)
11.7 11.9 13 15.4 16.8 [X] Lenovo B590 (59-362559) Intel Pentium 2020M 2.4GHz
HD Graphics (Ivy Bridge)
~ 12 fps
146%
HD Graphics 4600:
15.4 16.3 16.7 17.6 [X] Fujitsu LifeBook E744 Intel Core i5-4200M 2.5GHz
HD Graphics 4600
21.7 25.4 [X] Core i7-4930MX (Clevo P150SM) Intel Core i7-4930MX 3GHz
HD Graphics 4600
~ 19 fps
100%
HD Graphics 4000:
3.2 5.4 5.5 5.8 6.2 6.4 6.4 6.6 7 7.2 7.7 [X] MSI GT70 Intel Core i7-3610QM 2.3GHz
HD Graphics 4000
7.8 7.9 8 8.1 [X] One M73-2N Intel Core i5-3320M 2.6GHz
HD Graphics 4000
8.7 [X] Intel Core i7-3820QM 2.7GHz
HD Graphics 4000
15 [X] Maxdata M-Book 4000 U G1 Select Intel Core i5-3317U 1.7GHz
HD Graphics 4000
20 ~ 8 fps
143%
HD Graphics 4600:
11.4 [X] Core i7-4930MX (Clevo P150SM) Intel Core i7-4930MX 3GHz
HD Graphics 4600
fps
139%
HD Graphics 4600:
29.3 31.9 33 48 [X] no model Intel Core i7-4770K 3.5GHz
HD Graphics 4600
51.1 [X] Core i7-4930MX (Clevo P150SM) Intel Core i7-4930MX 3GHz
HD Graphics 4600
~ 39 fps
57%
HD Graphics (Ivy Bridge):
12.7 16.9 17.4 18.3 [X] Wortmann Terra Mobile 1512 Intel Celeron 1037U 1.8GHz
HD Graphics (Ivy Bridge)
~ 16 fps
120%
HD Graphics 4600:
14 15 15.5 23 [X] no model Intel Core i7-4770K 3.5GHz
HD Graphics 4600
24.2 [X] Core i7-4930MX (Clevo P150SM) Intel Core i7-4930MX 3GHz
HD Graphics 4600
~ 18 fps
60%
HD Graphics (Ivy Bridge):
7.3 9.4 9.6 [X] Wortmann Terra Mobile 1512 Intel Celeron 1037U 1.8GHz
HD Graphics (Ivy Bridge)
~ 9 fps
122%
HD Graphics 4600:
8 8.4 13 [X] no model Intel Core i7-4770K 3.5GHz
HD Graphics 4600
13.8 [X] Core i7-4930MX (Clevo P150SM) Intel Core i7-4930MX 3GHz
HD Graphics 4600
~ 11 fps
51%
HD Graphics (Ivy Bridge):
4.6 fps
100%
HD Graphics 4000:
5.4 [X] MSI GT70 Intel Core i7-3610QM 2.3GHz
HD Graphics 4000
5.5 [X] One M73-2N Intel Core i5-3320M 2.6GHz
HD Graphics 4000
6.1 [X] Intel Core i7-3820QM 2.7GHz
HD Graphics 4000
~ 6 fps
100%
HD Graphics 4600:
4 7.3 [X] Core i7-4930MX (Clevo P150SM) Intel Core i7-4930MX 3GHz
HD Graphics 4600
~ 6 fps
100%
HD Graphics 4000:
23 69.7 [X] One M73-2N Intel Core i5-3320M 2.6GHz
HD Graphics 4000
78.8 [X] MSI GT70 Intel Core i7-3610QM 2.3GHz
HD Graphics 4000
84.5 [X] Intel Core i7-3820QM 2.7GHz
HD Graphics 4000
~ 64 fps
222%
HD Graphics 4600:
141.9 [X] Toshiba Satellite P70-A-104 Intel Core i7-4700MQ 2.4GHz
HD Graphics 4600
fps
100%
HD Graphics 4000:
14 37.2 [X] One M73-2N Intel Core i5-3320M 2.6GHz
HD Graphics 4000
42.8 [X] MSI GT70 Intel Core i7-3610QM 2.3GHz
HD Graphics 4000
47 [X] Intel Core i7-3820QM 2.7GHz
HD Graphics 4000
~ 35 fps
180%
HD Graphics 4600:
63.1 [X] Toshiba Satellite P70-A-104 Intel Core i7-4700MQ 2.4GHz
HD Graphics 4600
fps
100%
HD Graphics 4000:
12 17.5 [X] MSI GT70 Intel Core i7-3610QM 2.3GHz
HD Graphics 4000
18 [X] One M73-2N Intel Core i5-3320M 2.6GHz
HD Graphics 4000
19.9 [X] Intel Core i7-3820QM 2.7GHz
HD Graphics 4000
~ 17 fps
162%
HD Graphics 4600:
27.5 [X] Toshiba Satellite P70-A-104 Intel Core i7-4700MQ 2.4GHz
HD Graphics 4600
fps
100%
HD Graphics 4000:
12.3 [X] MSI GT70 Intel Core i7-3610QM 2.3GHz
HD Graphics 4000
12.7 [X] One M73-2N Intel Core i5-3320M 2.6GHz
HD Graphics 4000
14.2 [X] Intel Core i7-3820QM 2.7GHz
HD Graphics 4000
~ 13 fps
181%
HD Graphics 4600:
20.4 32.4 [X] Core i7-4930MX (Clevo P150SM) Intel Core i7-4930MX 3GHz
HD Graphics 4600
35 [X] no model Intel Core i7-4770K 3.5GHz
HD Graphics 4600
~ 29 fps
100%
HD Graphics 4000:
6.4 [X] Medion Akoya S4216 MD 99080 Intel Core i3-3217U 1.8GHz
HD Graphics 4000
9 9.1 9.3 [X] Wortmann Terra 1450 II Intel Core i3-3217U 1.8GHz
HD Graphics 4000
9.7 11 12.2 12.2 12.3 17.3 17.5 [X] One M73-2N Intel Core i5-3320M 2.6GHz
HD Graphics 4000
18.2 18.5 [X] MSI GT70 Intel Core i7-3610QM 2.3GHz
HD Graphics 4000
20.4 [X] Intel Core i7-3820QM 2.7GHz
HD Graphics 4000
~ 13 fps
154%
HD Graphics 4600:
14 22.7 [X] Core i7-4930MX (Clevo P150SM) Intel Core i7-4930MX 3GHz
HD Graphics 4600
23.7 [X] no model Intel Core i7-4770K 3.5GHz
HD Graphics 4600
~ 20 fps
100%
HD Graphics 4000:
7.5 8 9.7 9.8 10.2 13.8 [X] MSI GT70 Intel Core i7-3610QM 2.3GHz
HD Graphics 4000
13.9 14.1 [X] One M73-2N Intel Core i5-3320M 2.6GHz
HD Graphics 4000
15.3 [X] Intel Core i7-3820QM 2.7GHz
HD Graphics 4000
~ 11 fps
164%
HD Graphics 4600:
18 [X] no model Intel Core i7-4770K 3.5GHz
HD Graphics 4600
18.6 [X] Core i7-4930MX (Clevo P150SM) Intel Core i7-4930MX 3GHz
HD Graphics 4600
~ 18 fps
100%
HD Graphics 4000:
3.2 5.1 [X] MSI GT70 Intel Core i7-3610QM 2.3GHz
HD Graphics 4000
5.4 [X] One M73-2N Intel Core i5-3320M 2.6GHz
HD Graphics 4000
5.8 [X] Intel Core i7-3820QM 2.7GHz
HD Graphics 4000
~ 5 fps
140%
HD Graphics 4600:
6.7 [X] Core i7-4930MX (Clevo P150SM) Intel Core i7-4930MX 3GHz
HD Graphics 4600
7 [X] no model Intel Core i7-4770K 3.5GHz
HD Graphics 4600
~ 7 fps
100%
HD Graphics 4000:
61 [X] MSI GT70 Intel Core i7-3610QM 2.3GHz
HD Graphics 4000
fps
108%
HD Graphics 4600:
66 [X] Toshiba Satellite P70-A-104 Intel Core i7-4700MQ 2.4GHz
HD Graphics 4600
fps
100%
HD Graphics 4000:
45 [X] MSI GT70 Intel Core i7-3610QM 2.3GHz
HD Graphics 4000
fps
104%
HD Graphics 4600:
47 [X] Toshiba Satellite P70-A-104 Intel Core i7-4700MQ 2.4GHz
HD Graphics 4600
fps
100%
HD Graphics 4000:
13 [X] MSI GT70 Intel Core i7-3610QM 2.3GHz
HD Graphics 4000
fps
100%
HD Graphics 4000:
8 [X] MSI GT70 Intel Core i7-3610QM 2.3GHz
HD Graphics 4000
fps
100%
HD Graphics 4000:
37 58.9 62 [X] Wortmann Terra 1450 II Intel Core i3-3217U 1.8GHz
HD Graphics 4000
79 105.9 108 115.2 [X] Lenovo ThinkPad T430 (N1T4ZPB) Intel Core i5-3210M 2.5GHz
HD Graphics 4000
127 136.2 143 [X] One M73-2N Intel Core i5-3320M 2.6GHz
HD Graphics 4000
189.4 [X] MSI GT70 Intel Core i7-3610QM 2.3GHz
HD Graphics 4000
192.1 [X] Intel Core i7-3820QM 2.7GHz
HD Graphics 4000
~ 113 fps
100%
HD Graphics 4000:
21 38.2 39.8 [X] Wortmann Terra 1450 II Intel Core i3-3217U 1.8GHz
HD Graphics 4000
49 57.9 60.3 62.1 [X] HP EliteBook 8470p (B6Q14EA) Intel Core i5-3360M 2.8GHz
HD Graphics 4000
63.6 [X] Lenovo ThinkPad T430 (N1T4ZPB) Intel Core i5-3210M 2.5GHz
HD Graphics 4000
65.8 [X] HP ProBook 6570b (B6P81EA) Intel Core i5-3210M 2.5GHz
HD Graphics 4000
68 76 85.4 [X] One M73-2N Intel Core i5-3320M 2.6GHz
HD Graphics 4000
99.2 [X] MSI GT70 Intel Core i7-3610QM 2.3GHz
HD Graphics 4000
106.4 [X] Intel Core i7-3820QM 2.7GHz
HD Graphics 4000
~ 64 fps
87%
HD Graphics (Ivy Bridge):
55.8 [X] Lenovo B590 (59-362559) Intel Pentium 2020M 2.4GHz
HD Graphics (Ivy Bridge)
fps
100%
HD Graphics 4000:
18.4 19.1 [X] HP EliteBook 8470p (B6Q14EA) Intel Core i5-3360M 2.8GHz
HD Graphics 4000
22 23.7 [X] HP ProBook 6570b (B6P81EA) Intel Core i5-3210M 2.5GHz
HD Graphics 4000
26 29.9 [X] Lenovo ThinkPad T430 (N1T4ZPB) Intel Core i5-3210M 2.5GHz
HD Graphics 4000
30.8 31 33.9 37.9 38.3 44.1 [X] One M73-2N Intel Core i5-3320M 2.6GHz
HD Graphics 4000
47.8 [X] MSI GT70 Intel Core i7-3610QM 2.3GHz
HD Graphics 4000
50.8 [X] Intel Core i7-3820QM 2.7GHz
HD Graphics 4000
~ 32 fps
66%
HD Graphics (Ivy Bridge):
21.2 [X] Lenovo B590 (59-362559) Intel Pentium 2020M 2.4GHz
HD Graphics (Ivy Bridge)
fps
100%
HD Graphics 4000:
18.3 24.5 25 [X] One M73-2N Intel Core i5-3320M 2.6GHz
HD Graphics 4000
26.5 [X] MSI GT70 Intel Core i7-3610QM 2.3GHz
HD Graphics 4000
28.3 [X] Intel Core i7-3820QM 2.7GHz
HD Graphics 4000
~ 25 fps
100%
HD Graphics 4000:
32 33 48 61 [X] One M73-2N Intel Core i5-3320M 2.6GHz
HD Graphics 4000
70 [X] MSI GT70 Intel Core i7-3610QM 2.3GHz
HD Graphics 4000
70 78 [X] Intel Core i7-3820QM 2.7GHz
HD Graphics 4000
~ 56 fps
100%
HD Graphics 4000:
22 24 26 34 [X] One M73-2N Intel Core i5-3320M 2.6GHz
HD Graphics 4000
38 40 [X] MSI GT70 Intel Core i7-3610QM 2.3GHz
HD Graphics 4000
42 [X] Intel Core i7-3820QM 2.7GHz
HD Graphics 4000
~ 32 fps
100%
HD Graphics 4000:
12 15 [X] One M73-2N Intel Core i5-3320M 2.6GHz
HD Graphics 4000
16 [X] MSI GT70 Intel Core i7-3610QM 2.3GHz
HD Graphics 4000
16 17 [X] Intel Core i7-3820QM 2.7GHz
HD Graphics 4000
18 ~ 16 fps
100%
HD Graphics 4000:
12 [X] Intel Core i7-3820QM 2.7GHz
HD Graphics 4000
12 [X] One M73-2N Intel Core i5-3320M 2.6GHz
HD Graphics 4000
12 [X] MSI GT70 Intel Core i7-3610QM 2.3GHz
HD Graphics 4000
~ 12 fps
176%
HD Graphics 4600:
84.7 [X] Toshiba Satellite P70-A-104 Intel Core i7-4700MQ 2.4GHz
HD Graphics 4600
fps
53%
HD Graphics (Ivy Bridge):
25.4 fps
148%
HD Graphics 4600:
36.9 [X] Toshiba Satellite P70-A-104 Intel Core i7-4700MQ 2.4GHz
HD Graphics 4600
fps
46%
HD Graphics (Ivy Bridge):
11.4 fps
100%
HD Graphics 4000:
11.1 [X] One M73-2N Intel Core i5-3320M 2.6GHz
HD Graphics 4000
12.6 [X] Intel Core i7-3820QM 2.7GHz
HD Graphics 4000
13 [X] MSI GT70 Intel Core i7-3610QM 2.3GHz
HD Graphics 4000
13.3 ~ 13 fps
100%
HD Graphics 4000:
51.6 60.1 [X] One M73-2N Intel Core i5-3320M 2.6GHz
HD Graphics 4000
68.6 [X] MSI GT70 Intel Core i7-3610QM 2.3GHz
HD Graphics 4000
77.5 [X] Intel Core i7-3820QM 2.7GHz
HD Graphics 4000
~ 64 fps
65%
HD Graphics (Ivy Bridge):
41.4 fps
100%
HD Graphics 4000:
27.4 36.7 [X] One M73-2N Intel Core i5-3320M 2.6GHz
HD Graphics 4000
38.2 [X] MSI GT70 Intel Core i7-3610QM 2.3GHz
HD Graphics 4000
45 [X] Intel Core i7-3820QM 2.7GHz
HD Graphics 4000
~ 37 fps
166%
HD Graphics 4600:
61.3 [X] Toshiba Satellite P70-A-104 Intel Core i7-4700MQ 2.4GHz
HD Graphics 4600
fps
45%
HD Graphics (Ivy Bridge):
16.5 fps
100%
HD Graphics 4000:
17.6 22.3 [X] MSI GT70 Intel Core i7-3610QM 2.3GHz
HD Graphics 4000
22.4 [X] One M73-2N Intel Core i5-3320M 2.6GHz
HD Graphics 4000
25.1 [X] Intel Core i7-3820QM 2.7GHz
HD Graphics 4000
~ 22 fps
127%
HD Graphics 4600:
27.9 [X] Toshiba Satellite P70-A-104 Intel Core i7-4700MQ 2.4GHz
HD Graphics 4600
fps
100%
HD Graphics 4000:
12.8 [X] Intel Core i7-3820QM 2.7GHz
HD Graphics 4000
12.8 [X] One M73-2N Intel Core i5-3320M 2.6GHz
HD Graphics 4000
12.8 [X] MSI GT70 Intel Core i7-3610QM 2.3GHz
HD Graphics 4000
~ 13 fps
100%
HD Graphics 4000:
21 [X] Asus N56VM Intel Core i7-3720QM 2.6GHz
HD Graphics 4000
fps
100%
HD Graphics 4000:
13 [X] Asus N56VM Intel Core i7-3720QM 2.6GHz
HD Graphics 4000
fps
100%
HD Graphics 4000:
29.1 40.6 [X] One M73-2N Intel Core i5-3320M 2.6GHz
HD Graphics 4000
43.7 [X] MSI GT70 Intel Core i7-3610QM 2.3GHz
HD Graphics 4000
49.5 [X] Intel Core i7-3820QM 2.7GHz
HD Graphics 4000
~ 41 fps
100%
HD Graphics 4000:
19.5 27.2 [X] One M73-2N Intel Core i5-3320M 2.6GHz
HD Graphics 4000
27.7 [X] MSI GT70 Intel Core i7-3610QM 2.3GHz
HD Graphics 4000
31.1 [X] Intel Core i7-3820QM 2.7GHz
HD Graphics 4000
~ 26 fps
100%
HD Graphics 4000:
11.2 19.2 [X] One M73-2N Intel Core i5-3320M 2.6GHz
HD Graphics 4000
19.2 [X] MSI GT70 Intel Core i7-3610QM 2.3GHz
HD Graphics 4000
21.3 [X] Intel Core i7-3820QM 2.7GHz
HD Graphics 4000
~ 18 fps
100%
HD Graphics 4000:
4.7 7 [X] MSI GT70 Intel Core i7-3610QM 2.3GHz
HD Graphics 4000
7.2 [X] One M73-2N Intel Core i5-3320M 2.6GHz
HD Graphics 4000
7.7 [X] Intel Core i7-3820QM 2.7GHz
HD Graphics 4000
~ 7 fps
100%
HD Graphics 4000:
47.1 74.2 113 [X] Asus N56VM Intel Core i7-3720QM 2.6GHz
HD Graphics 4000
~ 78 fps
87%
HD Graphics 4600:
0 (!) [X] no model Intel Core i7-4770K 3.5GHz
HD Graphics 4600
66.1 137.9 [X] Toshiba Satellite P70-A-104 Intel Core i7-4700MQ 2.4GHz
HD Graphics 4600
~ 68 fps
HD Graphics 4600:
0 (!) [X] no model Intel Core i7-4770K 3.5GHz
HD Graphics 4600
fps
HD Graphics 4600:
0 (!) [X] no model Intel Core i7-4770K 3.5GHz
HD Graphics 4600
fps
100%
HD Graphics 4000:
44.8 [X] One M73-2N Intel Core i5-3320M 2.6GHz
HD Graphics 4000
51.5 [X] MSI GT70 Intel Core i7-3610QM 2.3GHz
HD Graphics 4000
53 [X] Asus N56VM Intel Core i7-3720QM 2.6GHz
HD Graphics 4000
54.5 [X] Intel Core i7-3820QM 2.7GHz
HD Graphics 4000
~ 51 fps
100%
HD Graphics 4000:
30.6 [X] One M73-2N Intel Core i5-3320M 2.6GHz
HD Graphics 4000
34.1 [X] MSI GT70 Intel Core i7-3610QM 2.3GHz
HD Graphics 4000
36 [X] Asus N56VM Intel Core i7-3720QM 2.6GHz
HD Graphics 4000
36.5 [X] Intel Core i7-3820QM 2.7GHz
HD Graphics 4000
~ 34 fps
100%
HD Graphics 4000:
19.5 [X] One M73-2N Intel Core i5-3320M 2.6GHz
HD Graphics 4000
20.5 [X] MSI GT70 Intel Core i7-3610QM 2.3GHz
HD Graphics 4000
22 [X] Asus N56VM Intel Core i7-3720QM 2.6GHz
HD Graphics 4000
22.5 [X] Intel Core i7-3820QM 2.7GHz
HD Graphics 4000
~ 21 fps
100%
HD Graphics 4000:
15.7 [X] One M73-2N Intel Core i5-3320M 2.6GHz
HD Graphics 4000
16.2 [X] MSI GT70 Intel Core i7-3610QM 2.3GHz
HD Graphics 4000
16.9 [X] Intel Core i7-3820QM 2.7GHz
HD Graphics 4000
~ 16 fps
HD Graphics 4600:
55.8 [X] Toshiba Satellite P70-A-104 Intel Core i7-4700MQ 2.4GHz
HD Graphics 4600
fps
100%
HD Graphics 4000:
21.3 26.6 29.1 35.6 [X] MSI GT70 Intel Core i7-3610QM 2.3GHz
HD Graphics 4000
38.8 [X] One M73-2N Intel Core i5-3320M 2.6GHz
HD Graphics 4000
40.5 [X] Intel Core i7-3820QM 2.7GHz
HD Graphics 4000
~ 32 fps
100%
HD Graphics 4000:
19.8 22.1 22.4 27.1 [X] MSI GT70 Intel Core i7-3610QM 2.3GHz
HD Graphics 4000
30.8 [X] Intel Core i7-3820QM 2.7GHz
HD Graphics 4000
32.1 [X] One M73-2N Intel Core i5-3320M 2.6GHz
HD Graphics 4000
~ 26 fps
133%
HD Graphics 4600:
34.5 [X] Toshiba Satellite P70-A-104 Intel Core i7-4700MQ 2.4GHz
HD Graphics 4600
fps
100%
HD Graphics 4000:
17.5 18.7 18.7 20.6 [X] MSI GT70 Intel Core i7-3610QM 2.3GHz
HD Graphics 4000
23.4 [X] Intel Core i7-3820QM 2.7GHz
HD Graphics 4000
26.2 [X] One M73-2N Intel Core i5-3320M 2.6GHz
HD Graphics 4000
~ 21 fps
133%
HD Graphics 4600:
27.9 [X] Toshiba Satellite P70-A-104 Intel Core i7-4700MQ 2.4GHz
HD Graphics 4600
fps
100%
HD Graphics 4000:
12.8 [X] MSI GT70 Intel Core i7-3610QM 2.3GHz
HD Graphics 4000
14.6 [X] Intel Core i7-3820QM 2.7GHz
HD Graphics 4000
16.3 [X] One M73-2N Intel Core i5-3320M 2.6GHz
HD Graphics 4000
~ 15 fps
150%
HD Graphics 4600:
142.7 [X] MSI CX61-i572M281BW7 Intel Core i5-4200M 2.5GHz
HD Graphics 4600
198 ~ 170 fps
172%
HD Graphics 4600:
38.6 [X] MSI CX61-i572M281BW7 Intel Core i5-4200M 2.5GHz
HD Graphics 4600
48 ~ 43 fps
163%
HD Graphics 4600:
26 fps
100%
HD Graphics 4000:
5 9 10.8 [X] MSI GT70 Intel Core i7-3610QM 2.3GHz
HD Graphics 4000
10.9 [X] One M73-2N Intel Core i5-3320M 2.6GHz
HD Graphics 4000
10.9 12 [X] Intel Core i7-3820QM 2.7GHz
HD Graphics 4000
12 ~ 10 fps
140%
HD Graphics 4600:
14 fps
100%
HD Graphics 4000:
11.2 [X] Asus N56VM Intel Core i7-3720QM 2.6GHz
HD Graphics 4000
fps
100%
HD Graphics 4000:
19 19 22.4 [X] Toshiba Satellite U940-100 Intel Core i3-3217U 1.8GHz
HD Graphics 4000
25.3 [X] HP ProBook 6570b (B6P81EA) Intel Core i5-3210M 2.5GHz
HD Graphics 4000
30 38.1 [X] One M73-2N Intel Core i5-3320M 2.6GHz
HD Graphics 4000
41.2 [X] MSI GT70 Intel Core i7-3610QM 2.3GHz
HD Graphics 4000
44.3 [X] Intel Core i7-3820QM 2.7GHz
HD Graphics 4000
51 [X] Asus N56VM Intel Core i7-3720QM 2.6GHz
HD Graphics 4000
~ 32 fps
125%
HD Graphics 4600:
40.1 [X] Fujitsu LifeBook E744 Intel Core i5-4200M 2.5GHz
HD Graphics 4600
fps
100%
HD Graphics 4000:
9 12.7 14 15 20.1 [X] One M73-2N Intel Core i5-3320M 2.6GHz
HD Graphics 4000
21.5 [X] MSI GT70 Intel Core i7-3610QM 2.3GHz
HD Graphics 4000
23.7 [X] Intel Core i7-3820QM 2.7GHz
HD Graphics 4000
25 [X] Asus N56VM Intel Core i7-3720QM 2.6GHz
HD Graphics 4000
~ 18 fps
128%
HD Graphics 4600:
20.6 [X] Fujitsu LifeBook E744 Intel Core i5-4200M 2.5GHz
HD Graphics 4600
24.5 ~ 23 fps
100%
HD Graphics 4000:
5.3 12.1 [X] One M73-2N Intel Core i5-3320M 2.6GHz
HD Graphics 4000
12.5 [X] MSI GT70 Intel Core i7-3610QM 2.3GHz
HD Graphics 4000
13.6 [X] Intel Core i7-3820QM 2.7GHz
HD Graphics 4000
~ 11 fps
127%
HD Graphics 4600:
12.1 [X] Fujitsu LifeBook E744 Intel Core i5-4200M 2.5GHz
HD Graphics 4600
16.5 ~ 14 fps
100%
HD Graphics 4000:
4.1 [X] MSI GT70 Intel Core i7-3610QM 2.3GHz
HD Graphics 4000
4.3 [X] One M73-2N Intel Core i5-3320M 2.6GHz
HD Graphics 4000
4.6 [X] Intel Core i7-3820QM 2.7GHz
HD Graphics 4000
4.7 ~ 4 fps
225%
HD Graphics 4600:
9 fps
100%
HD Graphics 4000:
78.8 [X] Asus N56VM Intel Core i7-3720QM 2.6GHz
HD Graphics 4000
fps
100%
HD Graphics 4000:
34.2 [X] Asus N56VM Intel Core i7-3720QM 2.6GHz
HD Graphics 4000
fps
100%
HD Graphics 4000:
19.4 [X] Asus N56VM Intel Core i7-3720QM 2.6GHz
HD Graphics 4000
fps
100%
HD Graphics 4000:
8.2 [X] Asus N56VM Intel Core i7-3720QM 2.6GHz
HD Graphics 4000
fps
HD Graphics 4600:
96.7 [X] Toshiba Satellite P70-A-104 Intel Core i7-4700MQ 2.4GHz
HD Graphics 4600
fps
HD Graphics 4600:
74.3 [X] Toshiba Satellite P70-A-104 Intel Core i7-4700MQ 2.4GHz
HD Graphics 4600
fps
HD Graphics 4600:
56.5 [X] Toshiba Satellite P70-A-104 Intel Core i7-4700MQ 2.4GHz
HD Graphics 4600
fps
100%
HD Graphics 4000:
20.5 [X] Medion Akoya S4216 MD 99080 Intel Core i3-3217U 1.8GHz
HD Graphics 4000
27.3 28.6 29.3 29.6 38.8 39.5 [X] Wortmann Terra 1450 II Intel Core i3-3217U 1.8GHz
HD Graphics 4000
42.4 58.6 ~ 35 fps
100%
HD Graphics 4000:
9.4 [X] Medion Akoya S4216 MD 99080 Intel Core i3-3217U 1.8GHz
HD Graphics 4000
14.9 16.6 16.8 18.1 19.6 22.5 26.1 [X] Wortmann Terra 1450 II Intel Core i3-3217U 1.8GHz
HD Graphics 4000
26.5 ~ 19 fps
100%
HD Graphics 4000:
6.1 [X] Medion Akoya S4216 MD 99080 Intel Core i3-3217U 1.8GHz
HD Graphics 4000
11 13.1 13.3 13.7 [X] Wortmann Terra 1450 II Intel Core i3-3217U 1.8GHz
HD Graphics 4000
14 14.5 ~ 12 fps
100%
HD Graphics 4000:
8.6 10 ~ 9 fps
100%
HD Graphics 4000:
93.6 [X] Asus N56VM Intel Core i7-3720QM 2.6GHz
HD Graphics 4000
fps
187%
HD Graphics 4600:
175 [X] no model Intel Core i7-4770K 3.5GHz
HD Graphics 4600
fps
100%
HD Graphics 4000:
39.1 [X] Asus N56VM Intel Core i7-3720QM 2.6GHz
HD Graphics 4000
fps
102%
HD Graphics 4600:
39.9 [X] no model Intel Core i7-4770K 3.5GHz
HD Graphics 4600
fps
100%
HD Graphics 4000:
16.4 [X] Asus N56VM Intel Core i7-3720QM 2.6GHz
HD Graphics 4000
fps
107%
HD Graphics 4600:
17.6 [X] no model Intel Core i7-4770K 3.5GHz
HD Graphics 4600
fps
100%
HD Graphics 4000:
20.3 [X] Lenovo ThinkPad T430 (N1T4ZPB) Intel Core i5-3210M 2.5GHz
HD Graphics 4000
44.7 [X] HP ProBook 6570b (B6P81EA) Intel Core i5-3210M 2.5GHz
HD Graphics 4000
~ 33 fps
100%
HD Graphics 4000:
18.6 [X] Lenovo ThinkPad T430 (N1T4ZPB) Intel Core i5-3210M 2.5GHz
HD Graphics 4000
34.1 [X] HP ProBook 6570b (B6P81EA) Intel Core i5-3210M 2.5GHz
HD Graphics 4000
~ 26 fps
100%
HD Graphics 4000:
12.8 [X] Lenovo ThinkPad T430 (N1T4ZPB) Intel Core i5-3210M 2.5GHz
HD Graphics 4000
fps
100%
HD Graphics 4000:
33 [X] Asus N56VM Intel Core i7-3720QM 2.6GHz
HD Graphics 4000
fps
100%
HD Graphics 4000:
21 [X] Asus N56VM Intel Core i7-3720QM 2.6GHz
HD Graphics 4000
fps
61%
HD Graphics (Ivy Bridge):
90 fps
178%
HD Graphics 4600:
65.9 [X] no model Intel Core i7-4770K 3.5GHz
HD Graphics 4600
fps
56%
HD Graphics (Ivy Bridge):
20.7 fps
100%
HD Graphics 4000:
18 22.1 ~ 20 fps
156%
HD Graphics 4600:
31.2 [X] no model Intel Core i7-4770K 3.5GHz
HD Graphics 4600
fps
100%
HD Graphics 4000:
100.6 [X] Lenovo ThinkPad T430 (N1T4ZPB) Intel Core i5-3210M 2.5GHz
HD Graphics 4000
fps
100%
HD Graphics 4000:
43.3 [X] Lenovo ThinkPad T430 (N1T4ZPB) Intel Core i5-3210M 2.5GHz
HD Graphics 4000
fps
HD Graphics 4600:
50.5 [X] Toshiba Satellite P70-A-104 Intel Core i7-4700MQ 2.4GHz
HD Graphics 4600
fps
HD Graphics 4600:
27.7 [X] Toshiba Satellite P70-A-104 Intel Core i7-4700MQ 2.4GHz
HD Graphics 4600
fps
HD Graphics 4600:
46.4 [X] Toshiba Satellite P70-A-104 Intel Core i7-4700MQ 2.4GHz
HD Graphics 4600
fps
HD Graphics 4600:
24.6 [X] Toshiba Satellite P70-A-104 Intel Core i7-4700MQ 2.4GHz
HD Graphics 4600
fps
100%
HD Graphics 4000:
49 84 ~ 67 fps
100%
HD Graphics 4000:
20 35 ~ 28 fps
100%
HD Graphics 4000:
12 14 ~ 13 fps
100%
HD Graphics 4000:
15.4 [X] Lenovo ThinkPad T430 (N1T4ZPB) Intel Core i5-3210M 2.5GHz
HD Graphics 4000
fps
99%
HD Graphics 4600:
100.1 [X] MSI CX61-i572M Intel Core i5-4200M 2.5GHz
HD Graphics 4600
fps
78%
HD Graphics (Ivy Bridge):
78.3 fps
100%
HD Graphics 4000:
58 62 62 63 65 65 76 [X] Asus N56VM Intel Core i7-3720QM 2.6GHz
HD Graphics 4000
83 ~ 67 fps
94%
HD Graphics 4600:
56.6 [X] MSI CX61-i572M Intel Core i5-4200M 2.5GHz
HD Graphics 4600
69 [X] no model Intel Core i7-4770K 3.5GHz
HD Graphics 4600
~ 63 fps
42%
HD Graphics (Ivy Bridge):
28.3 fps
100%
HD Graphics 4000:
12 15 16 17 20 [X] Asus N56VM Intel Core i7-3720QM 2.6GHz
HD Graphics 4000
20 21 ~ 17 fps
135%
HD Graphics 4600:
11.2 [X] MSI CX61-i572M Intel Core i5-4200M 2.5GHz
HD Graphics 4600
34 [X] no model Intel Core i7-4770K 3.5GHz
HD Graphics 4600
~ 23 fps
100%
HD Graphics 4000:
8 fps
125%
HD Graphics 4600:
10 [X] no model Intel Core i7-4770K 3.5GHz
HD Graphics 4600
fps
Average Gaming Intel HD Graphics 4000 → 100% Average Gaming 30-70 fps → 100%
Average Gaming Intel HD Graphics 4600 → 135% Average Gaming 30-70 fps → 136%
Average Gaming Intel HD Graphics (Ivy Bridge) → 60% Average Gaming 30-70 fps → 68%
For more games that might be playable and a list of all games and graphics cards visit our Gaming List
v1.26
log 27. 00:13:12
#0 checking url part for id 2822 +0s ... 0s
#1 checking url part for id 3567 +0s ... 0s
#2 checking url part for id 3563 +0s ... 0s
#3 not redirecting to Ajax server +0s ... 0s
#4 did not recreate cache, as it is less than 5 days old! Created at Thu, 25 Apr 2024 05:40:10 +0200 +0.001s ... 0.001s
#5 composed specs +0.124s ... 0.125s
#6 did output specs +0s ... 0.125s
#7 start showIntegratedCPUs +0s ... 0.125s
#8 getting avg benchmarks for device 2822 +0.093s ... 0.218s
#9 got single benchmarks 2822 +0.505s ... 0.723s
#10 getting avg benchmarks for device 3567 +0.018s ... 0.742s
#11 got single benchmarks 3567 +0.072s ... 0.814s
#12 getting avg benchmarks for device 3563 +0.019s ... 0.832s
#13 got single benchmarks 3563 +0.044s ... 0.876s
#14 got avg benchmarks for devices +0s ... 0.876s
#15 No cached benchmark found, getting uncached values +0.459s ... 1.335s
#16 No cached benchmark found, getting uncached values +0.004s ... 1.338s
#17 min, max, avg, median took s +0.091s ... 1.43s
#18 before gaming benchmark output +0s ... 1.43s
#19 Got 2562 rows for game benchmarks. +0.157s ... 1.587s
#20 composed SQL query for gamebenchmarks +0s ... 1.587s
#21 got data and put it in $dataArray +0.154s ... 1.741s
#22 benchmarks composed for output. +0.452s ... 2.193s
#23 calculated avg scores. +0s ... 2.193s
#24 return log +0.007s ... 2.2s
Please share our article, every link counts!
Redaktion, 2017-09- 8 (Update: 2023-07- 1)
 Deutsch
 English
 Español
 Français
 Italiano
 Nederlands
 Polski
 Português
 Русский
 Türkçe
 Svenska
 Chinese
 Magyar