Notebookcheck Logo

Final Fantasy XV Laptop and Desktop Benchmarks

Heavyweight. Final Fantasy XV is due for release on PC next month, after console owners have been enjoying the open-world roleplaying game since the end of 2016. In the meantime, Square Enix have released a benchmarking tool as a way to shorten the wait for fans of the series. Update: Benchmarks of the final version
Final Fantasy XV

Technology

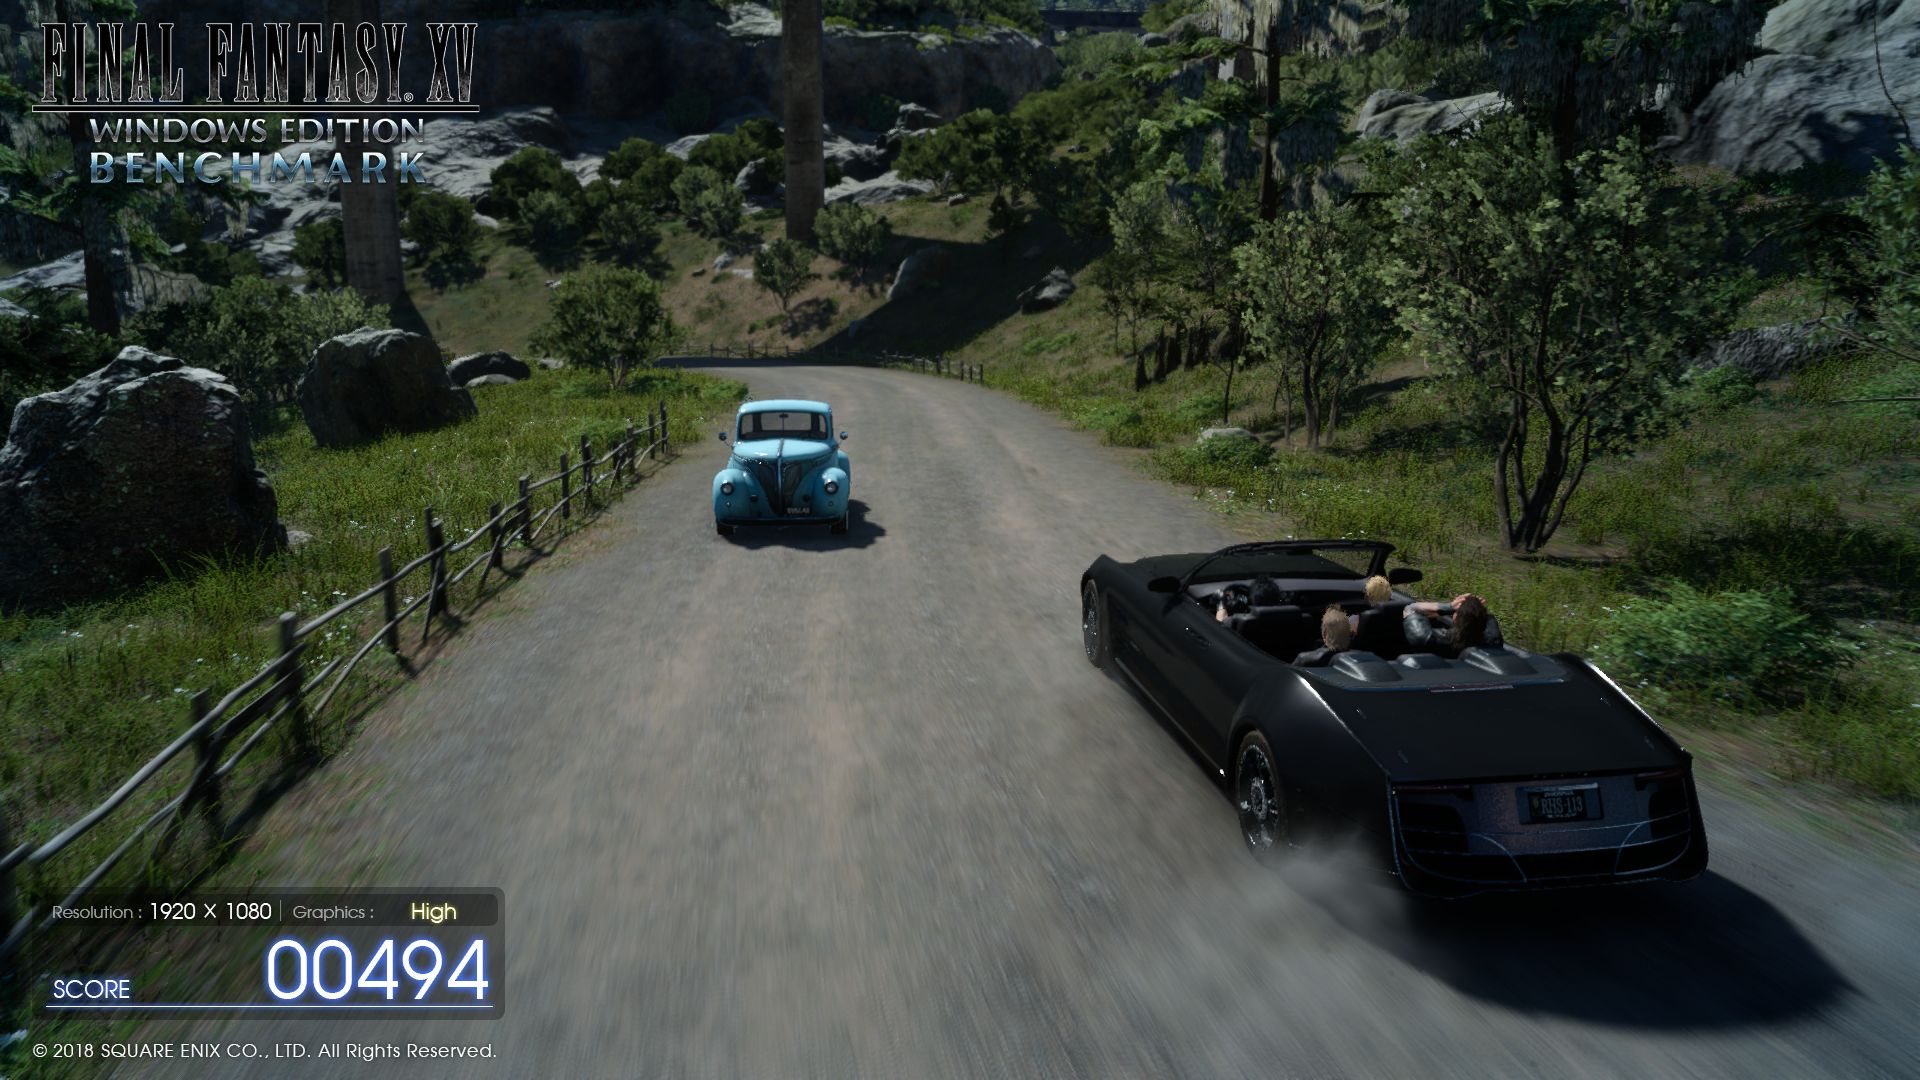
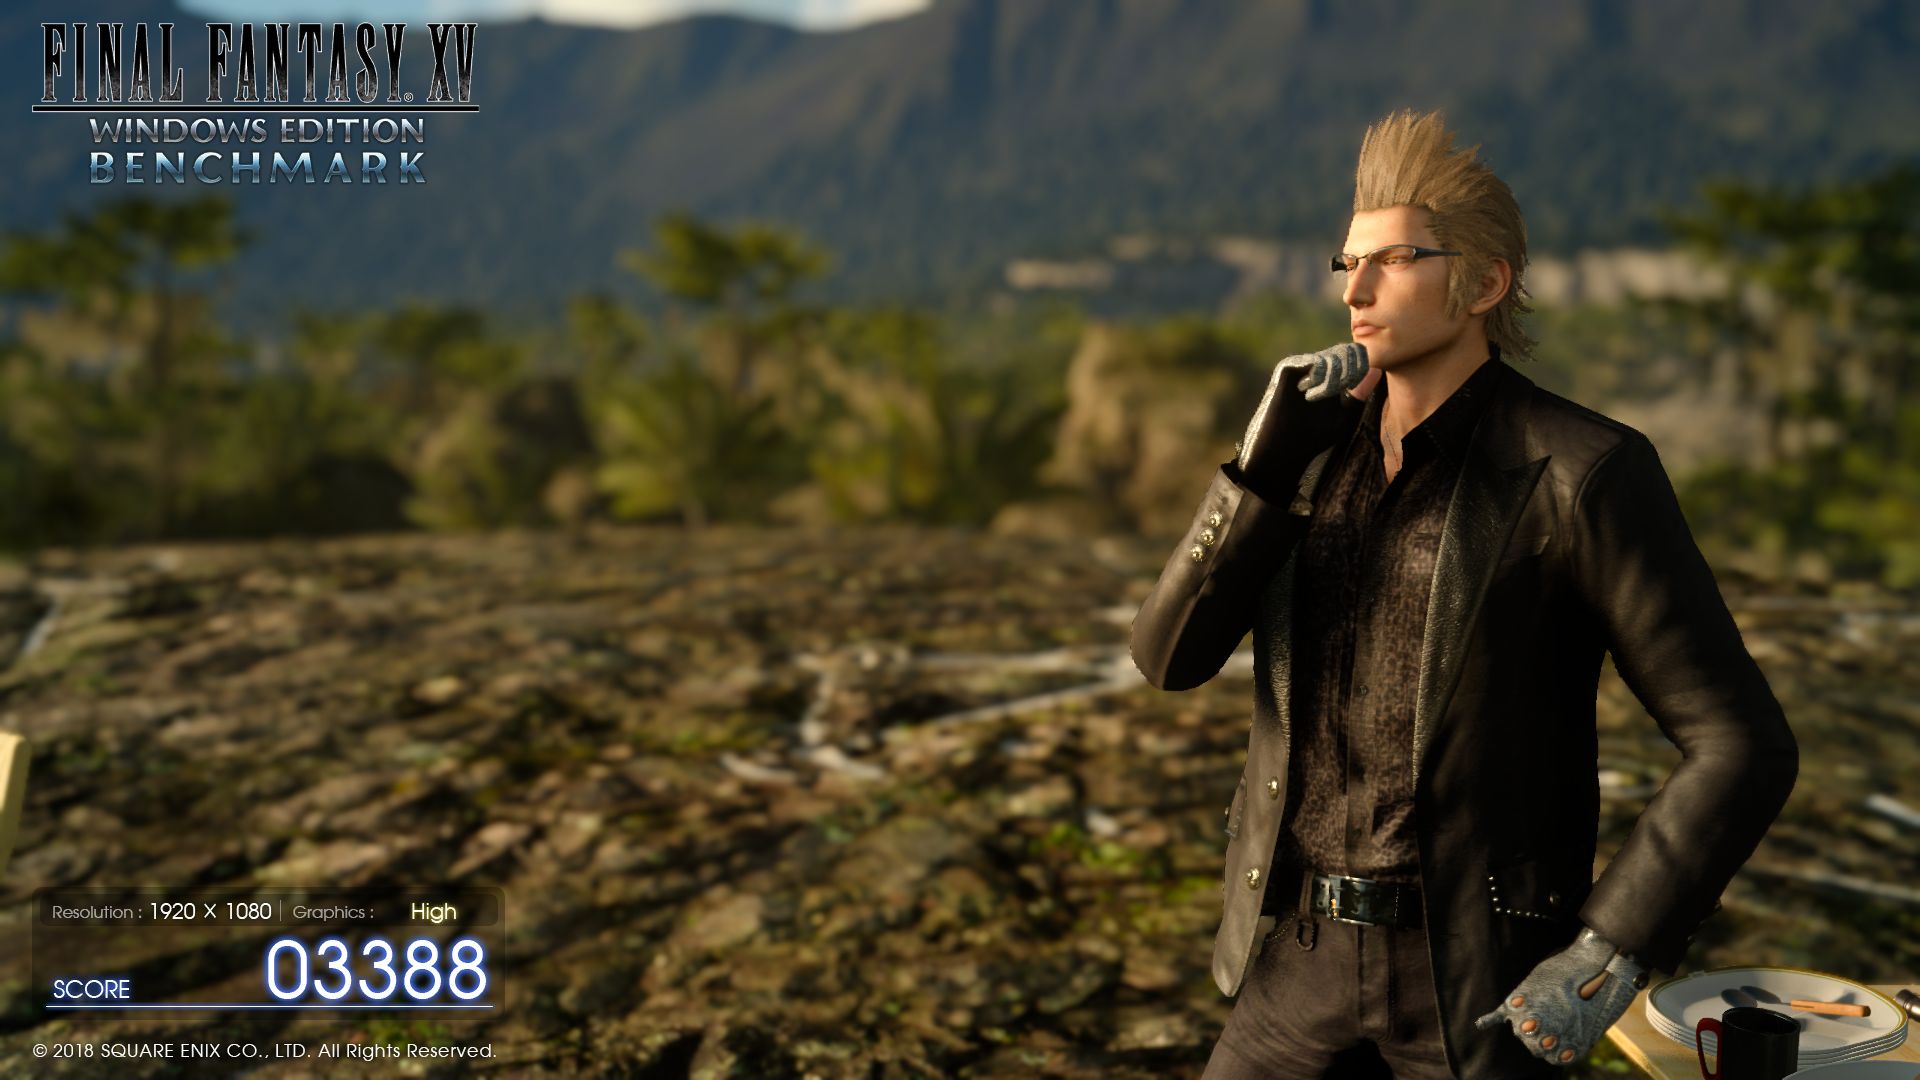
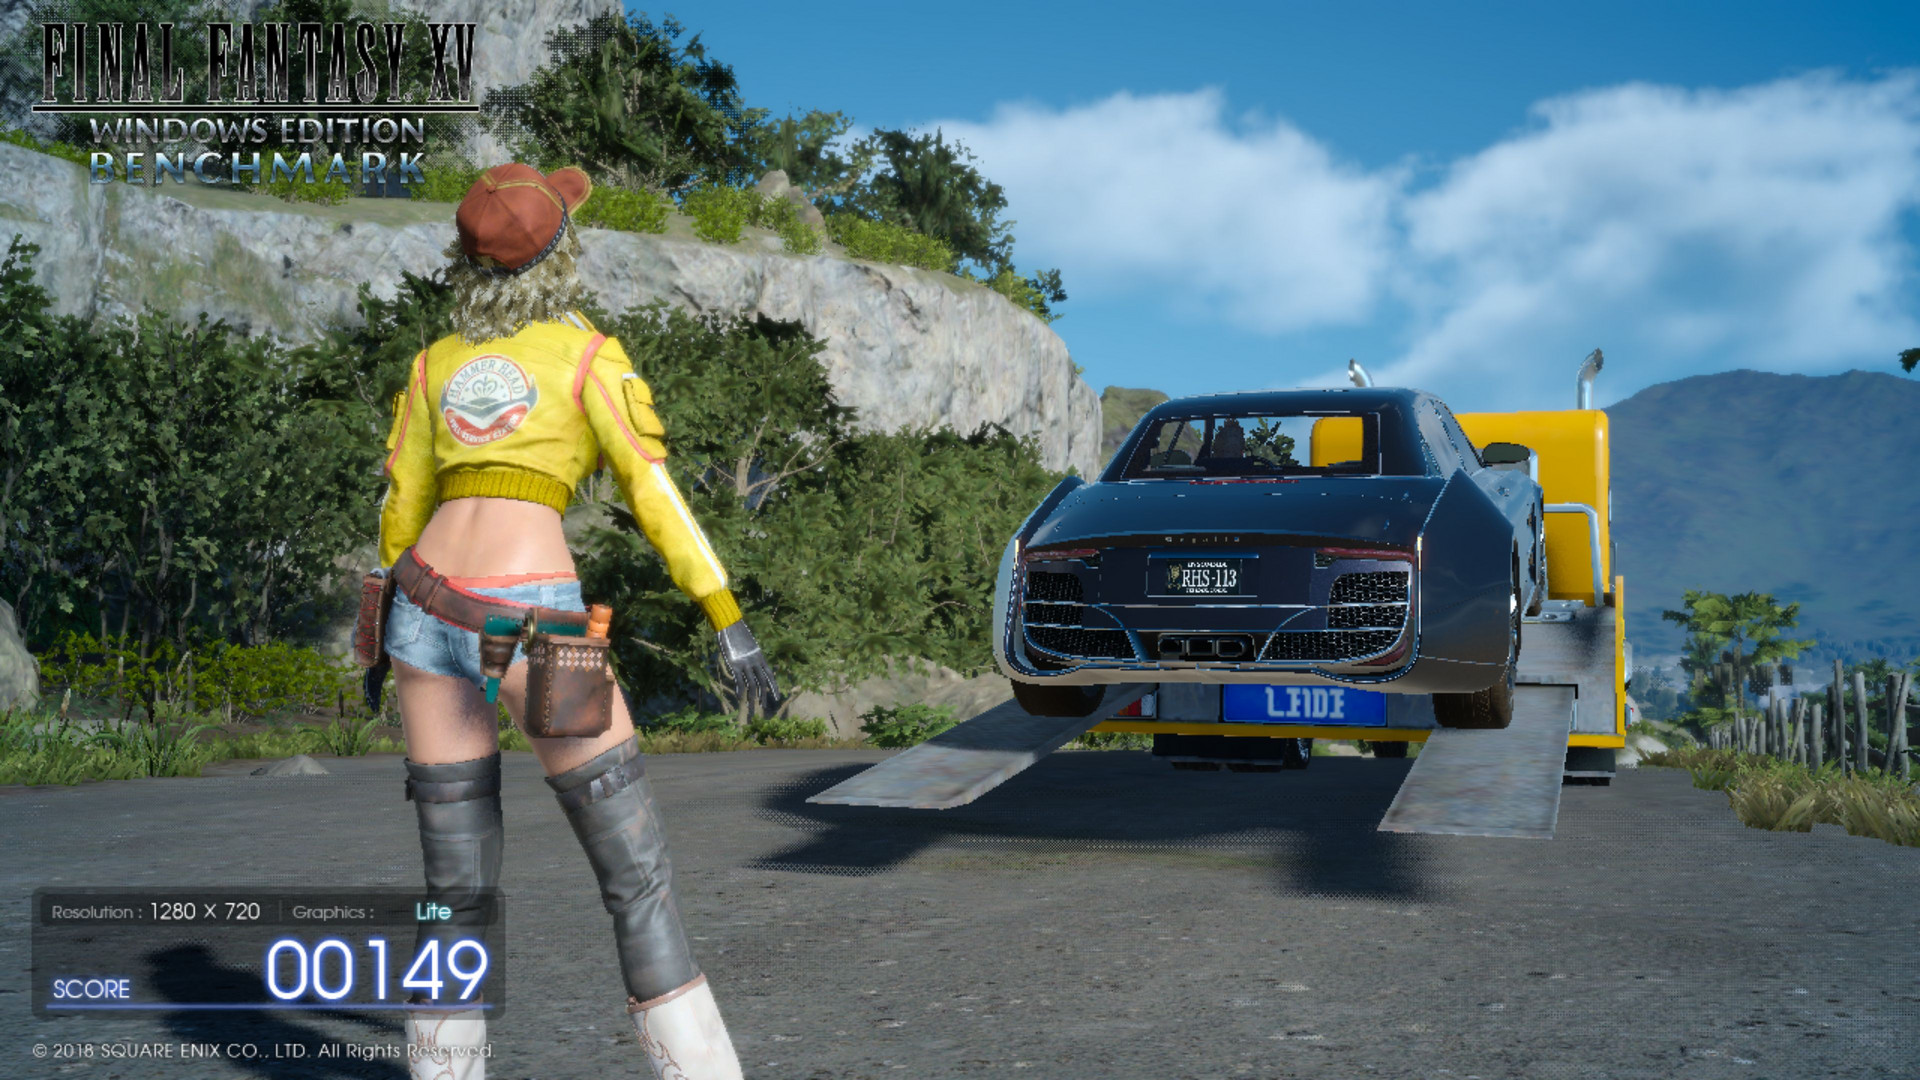
While we cannot yet judge the Windows version of the Luminous Engine which underpins Final Fantasy XV, such as the implementation of keyboard controls, the engine convinces us visually despite its hefty System requirements. As demonstrated in the screenshots and video below, Final Fantasy XV impresses on the PC with its enormous draw distance, thick vegetation and its attention to detail.

Added to that is the unique design, which while potentially looking somewhat strange for Western gamers at first, feels fresh and atmospheric. Moreover, when the texture quality is set to higher levels, Final Fantasy XV competes with the open-world competition, examples being Assassin's Creed Origins, Ghost Recon Wildlands and The Witcher 3.

Final Fantasy XV
Final Fantasy XV
Final Fantasy XV
Final Fantasy XV
Final Fantasy XV
Final Fantasy XV

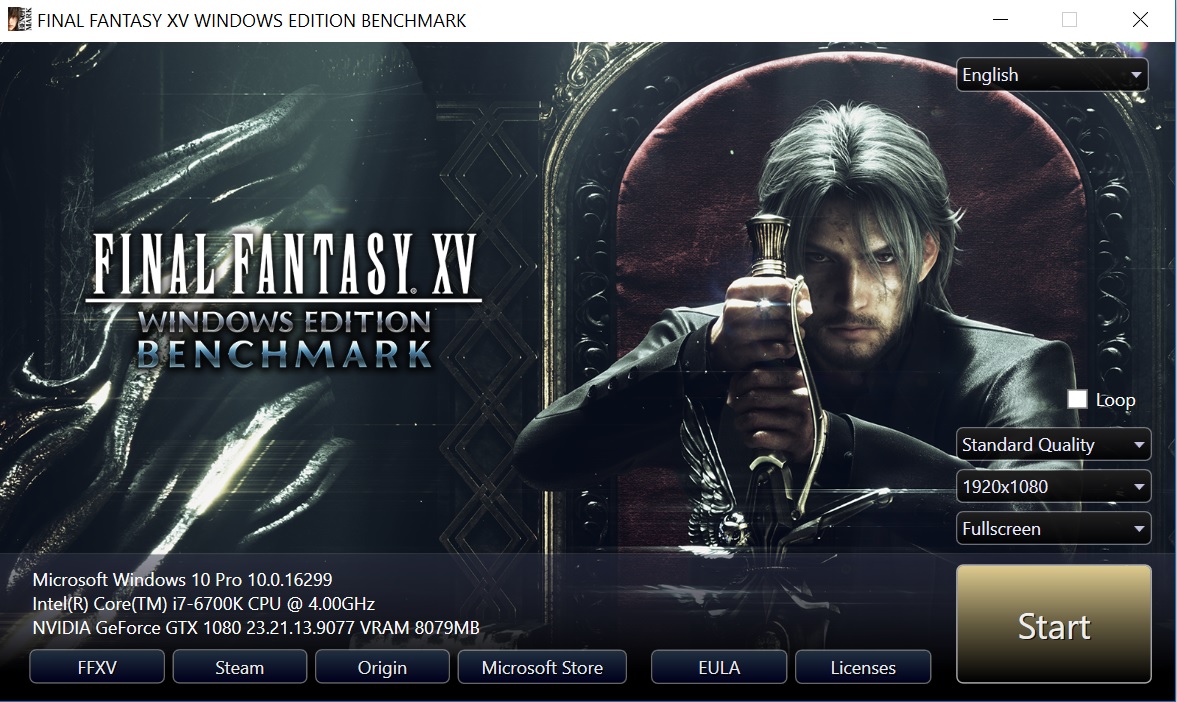
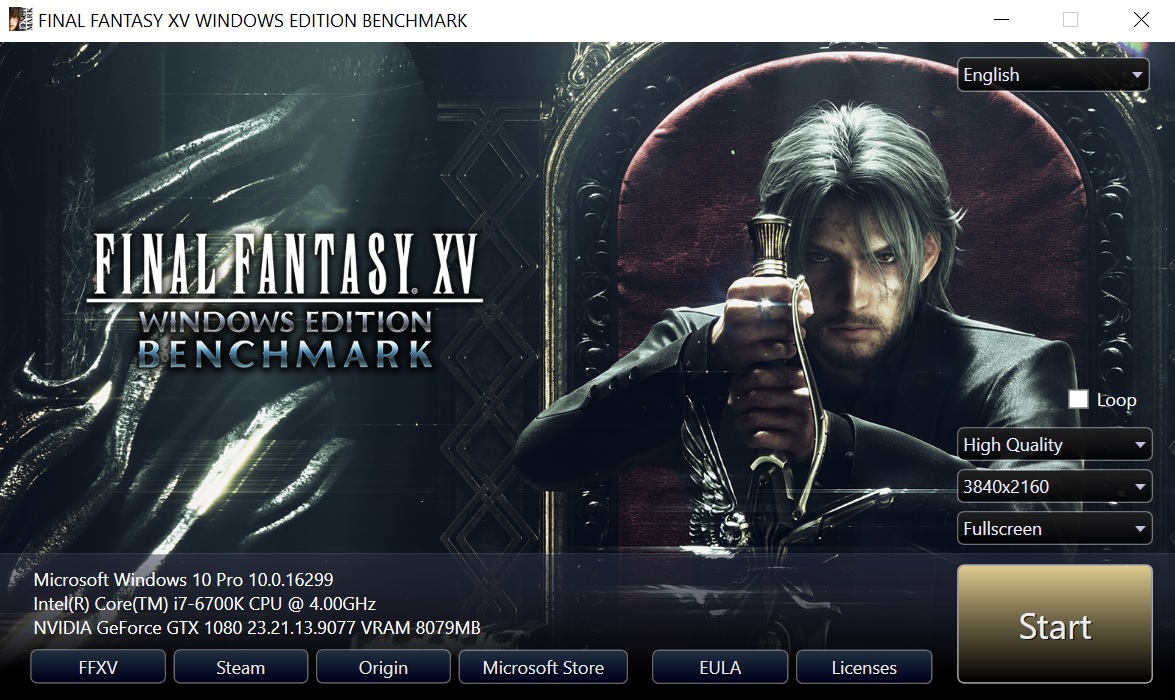
If you would like to get a better idea of the expected performance of Final Fantasy on your Laptop or PC then go ahead and download the recently released free benchmarking tool. At just under 4 GB in size the tool offers only a handful of settings, but these should be enough to judge approximate framerates provided that performance does not markedly change upon release.

Final Fantasy XV
Final Fantasy XV
Final Fantasy XV
Final Fantasy XV
Final Fantasy XV
Final Fantasy XV

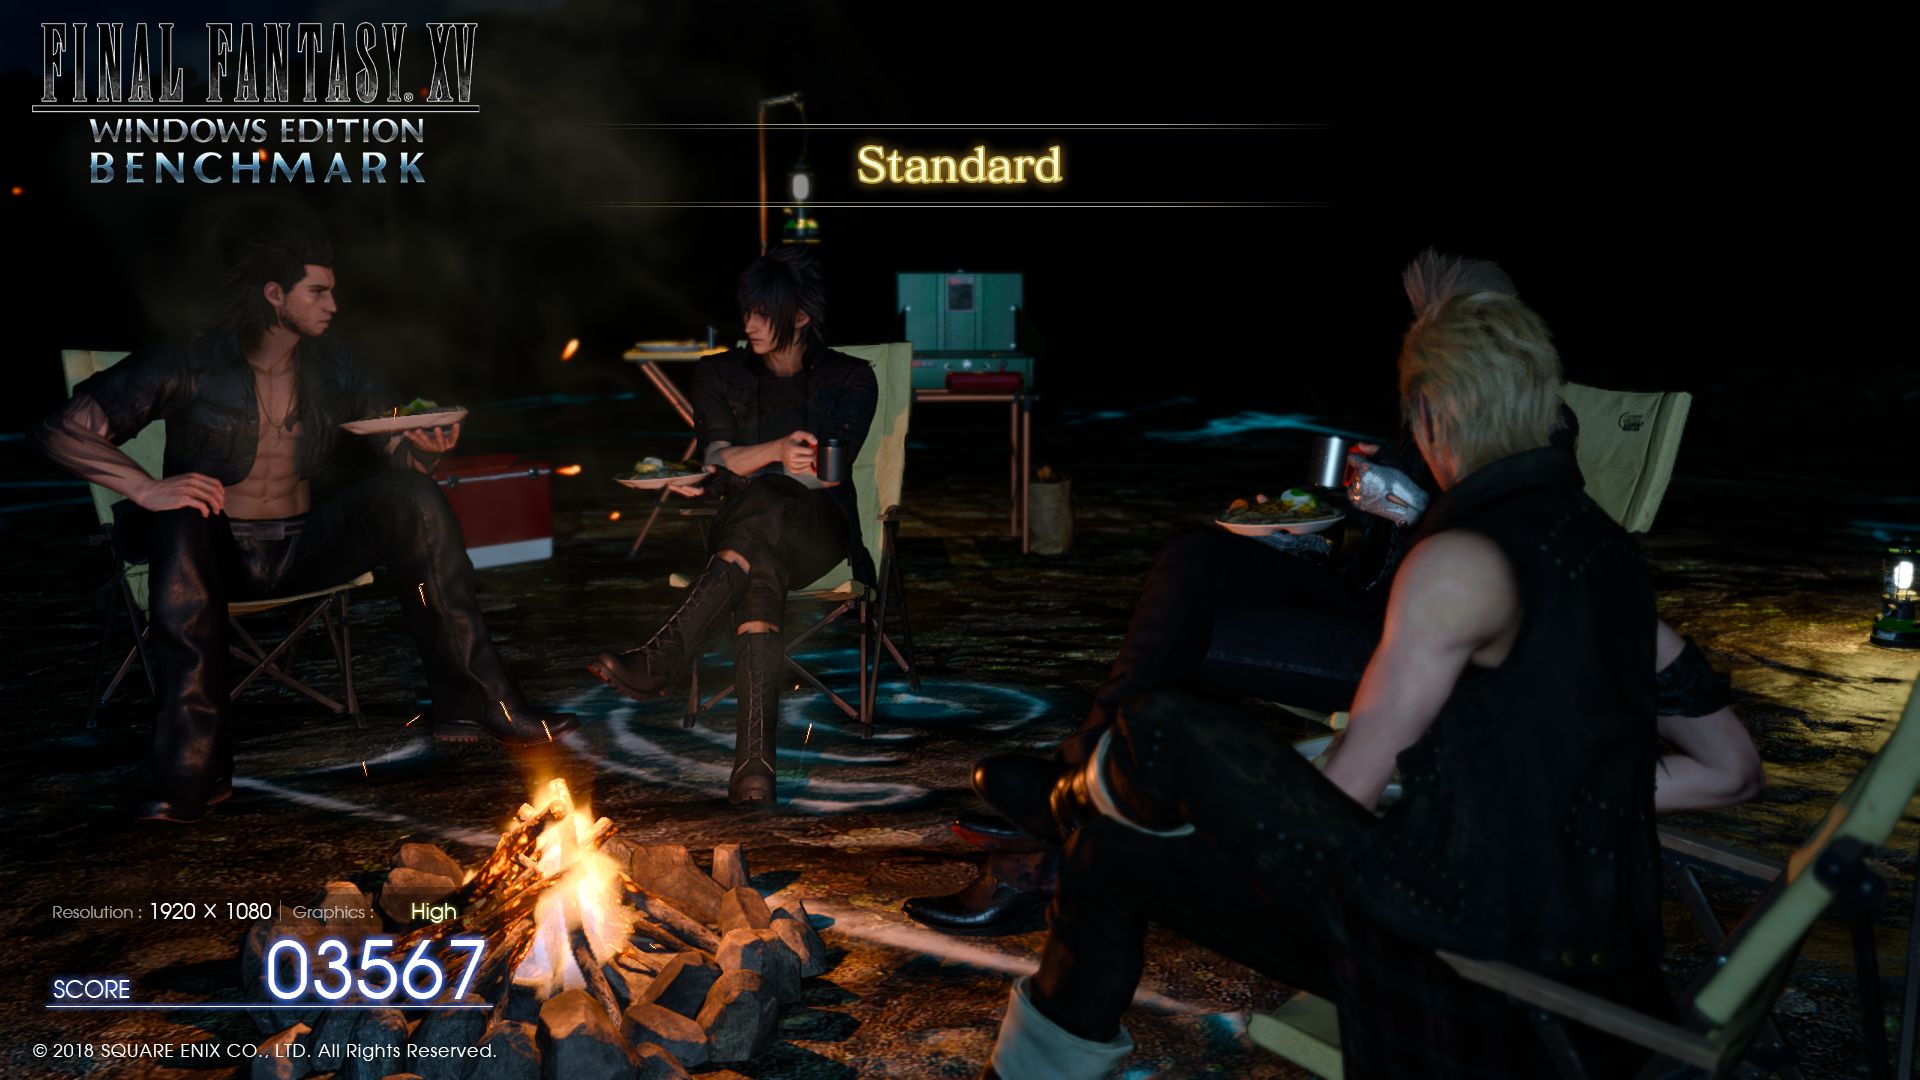
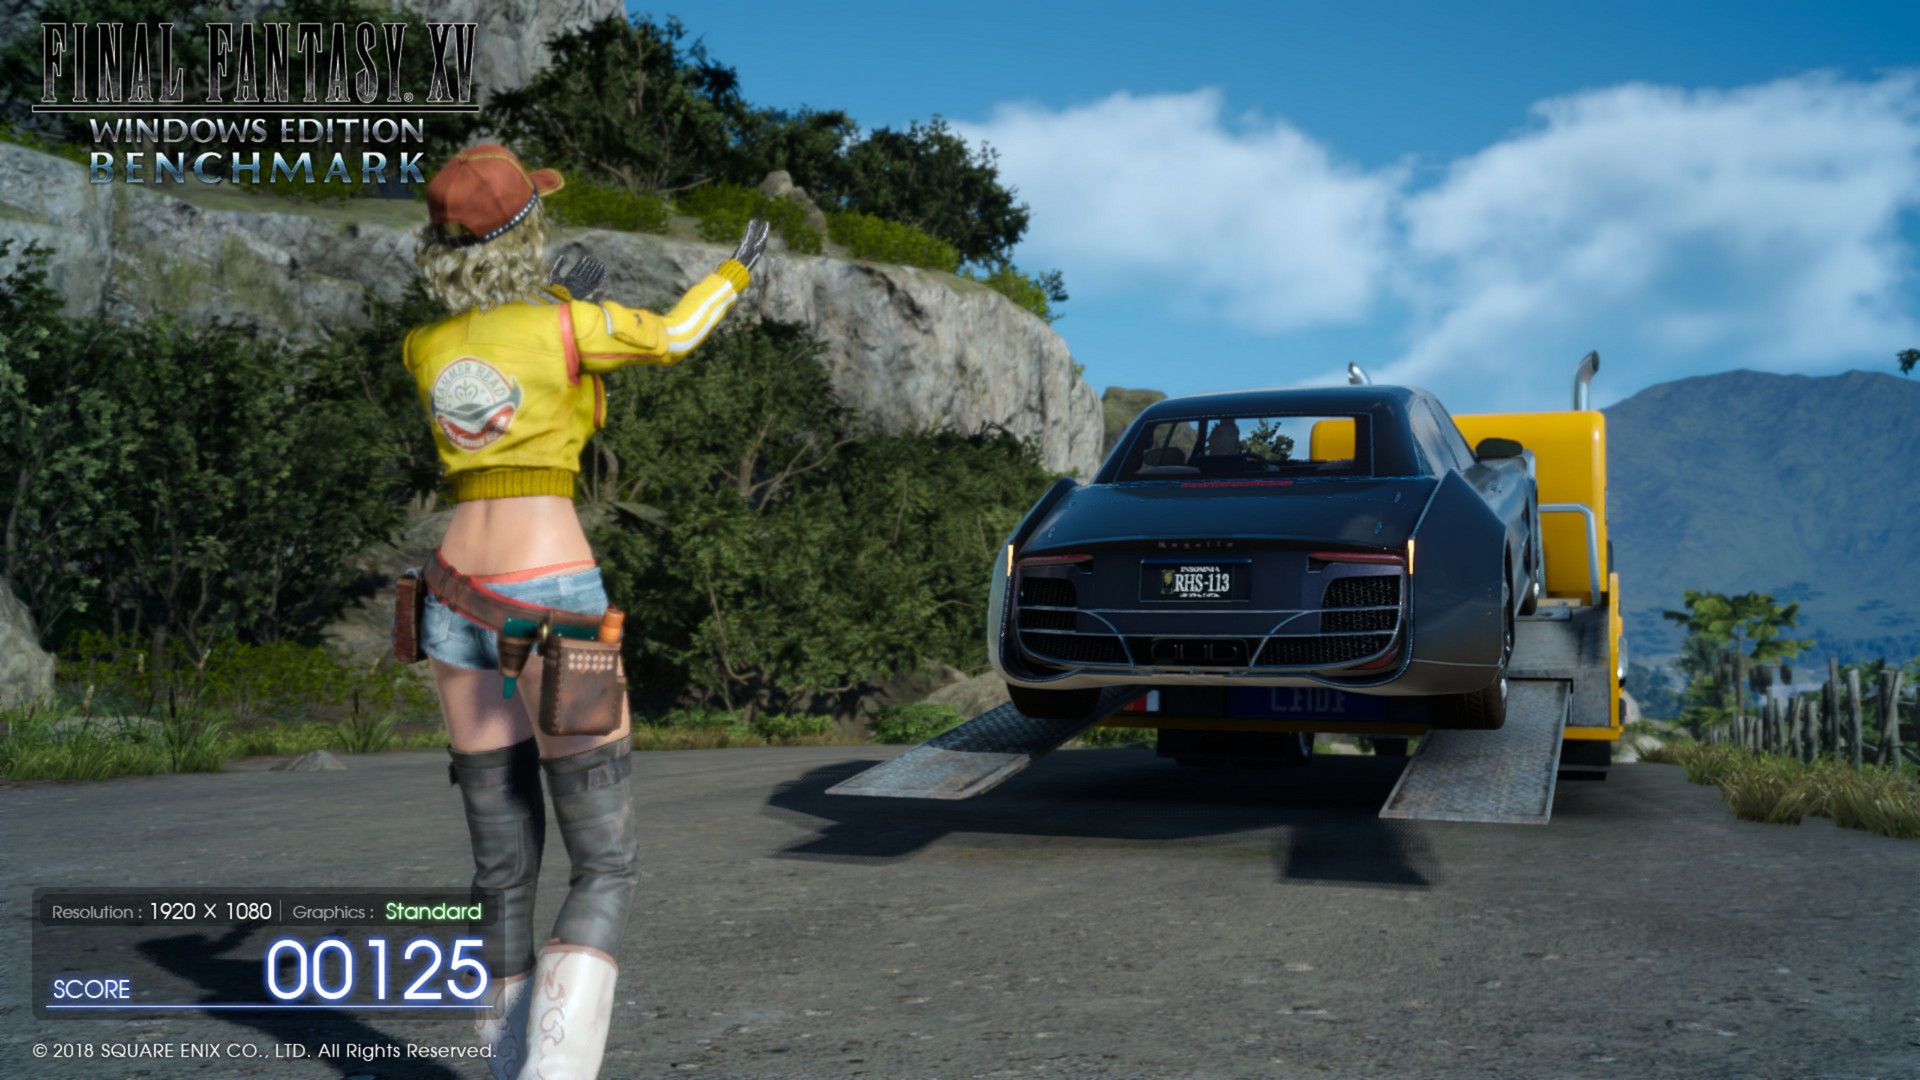
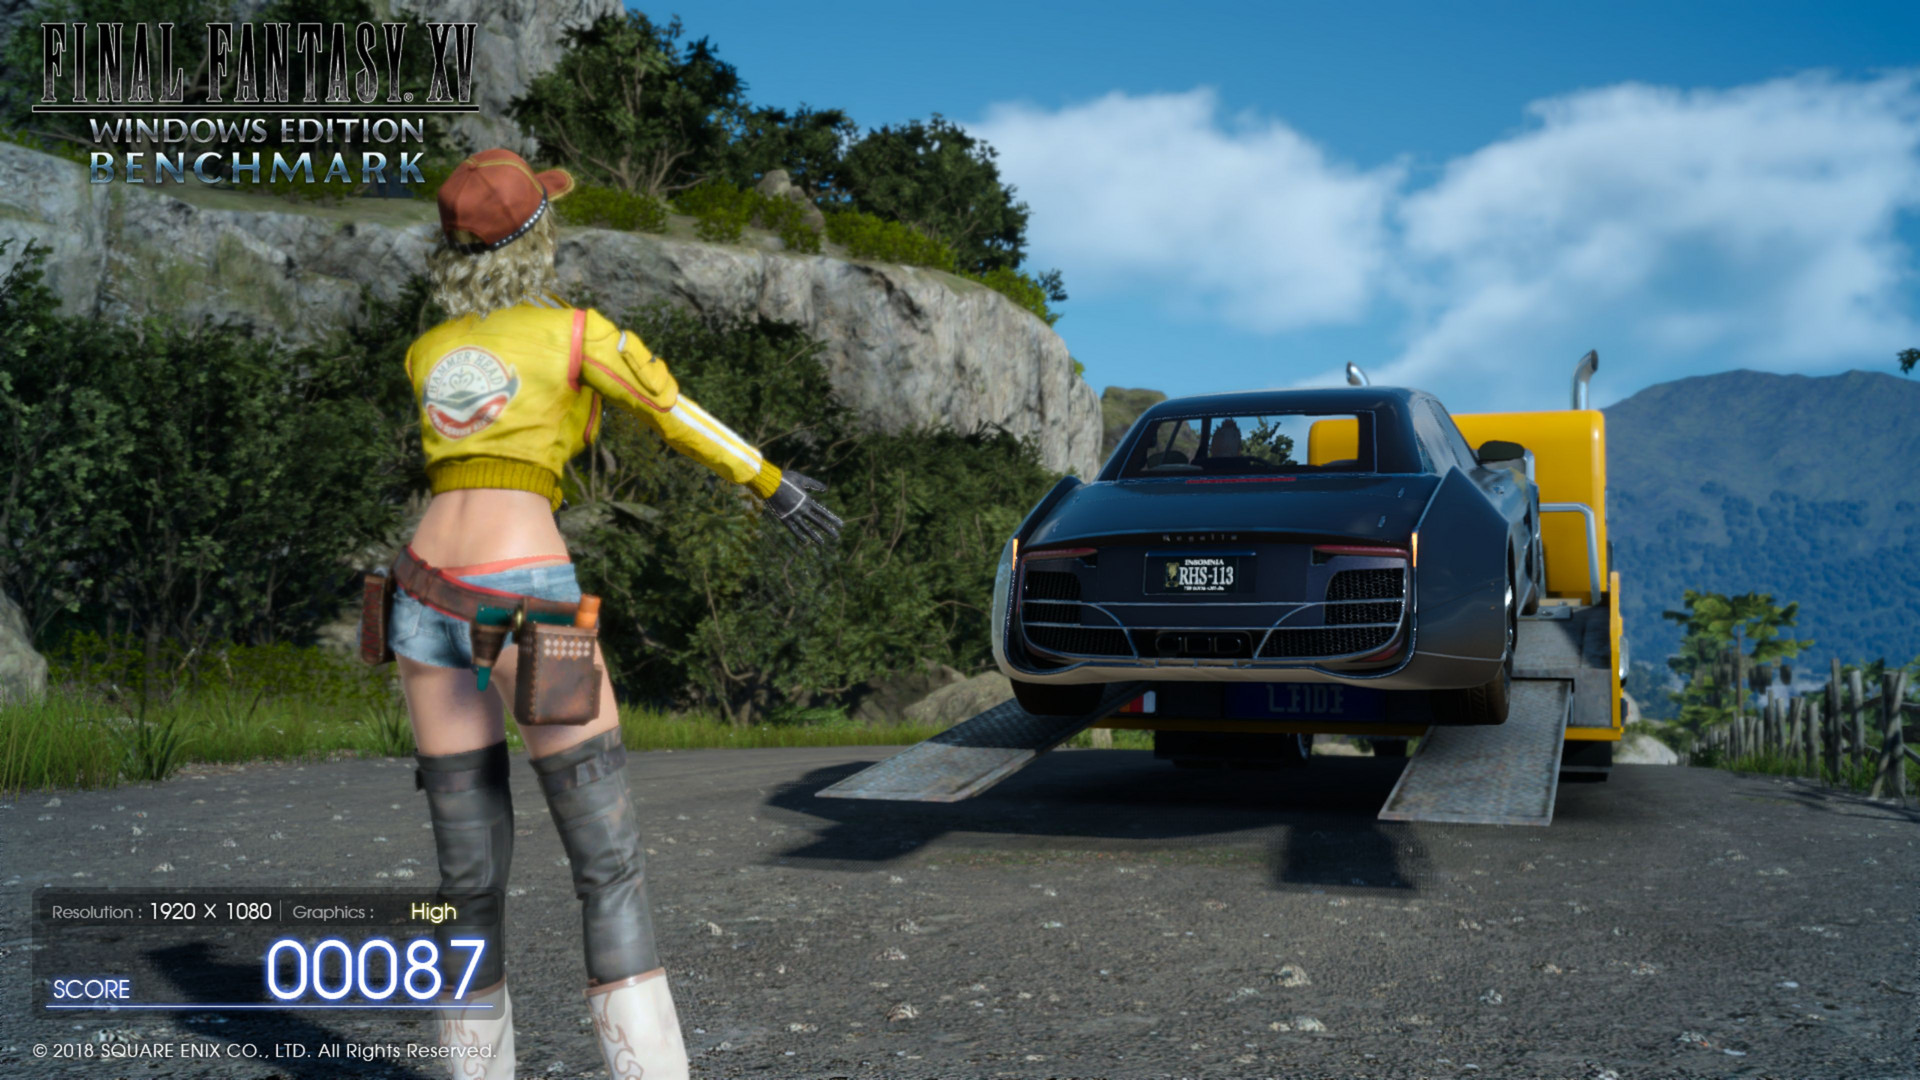
The benchmark tool includes options to test at three resolutions and with three qualitative presets. The resolutions are 1,280 x 720, 1,920 x 1,080, or 3,840 x 2,160 in windowed or full screen mode, and Lite, Standard and High qualitative presets. These vary the levels of antialiasing, draw distance, effects, lighting, shadows, and sharpness among others. Our editorial staff would consider good graphics to be at medium settings, while they consider high to maximum settings look first-class save for minor exceptions.

Final Fantasy XV
Final Fantasy XV
Final Fantasy XV
Final Fantasy XV
Final Fantasy XV
Final Fantasy XV

Meanwhile, the benchmark's built-in scoring system is contentious. Unusually, instead of distributing the refresh rate, the benchmark calculates a score and splits benchmarked machines into eight categories. The benchmark considers a system with a score of under two thousand points to render Final Fantasy XV unplayable, whereas a score of twelve thousand points is recommended for optimum performance. In our editorial staff's experience, a score of four and half thousand points or more is needed to play the game at relatively high settings and still at over forty frames per second.

There are several tables on the Square Enix benchmark homepage, which can compare your system's score with other graphics cards. This makes it easy to see whether your system's score is normal or below average.

Final Fantasy XV
Final Fantasy XV
Final Fantasy XV
Final Fantasy XV
Final Fantasy XV
Final Fantasy XV

As is the case with most games, Final Fantasy is GPU-heavy, with the CPU being a limiting factor when playing at lower qualities and resolutions. Bear in mind that one pass of the benchmark took, on average, in excess of six minutes. Integrated benchmarks typically are finished in under half that time. Our editorial staff would therefore recommend a greater degree of patience than usual when letting the Final Fantasy XV benchmark run.

Benchmarks

The high system requirements mean that Final Fantasy XV is unsuitable to be played on budget office and multimedia devices that have only a processor based or low-end dedicated GPU. Even a GeForce GTX 960M or GTX 1050 can only comfortably manage minimal details set at a resolution of 1,280 x 720. Moreover, our editorial staff could only consistently achieve forty FPS at 1,920 x 1,080 on Standard when using a minimum of a GeForce GTX 980M.

Lite Quality 720p
Lite Quality 720p
Standard Quality 1080p
High Quality 1080p
High Quality 1080p
High Quality 2160p
High Quality 2160p
Lite Quality 720p
Lite Quality 720p
Standard Quality 1080p
High Quality 1080p
High Quality 1080p
High Quality 2160p
High Quality 2160p

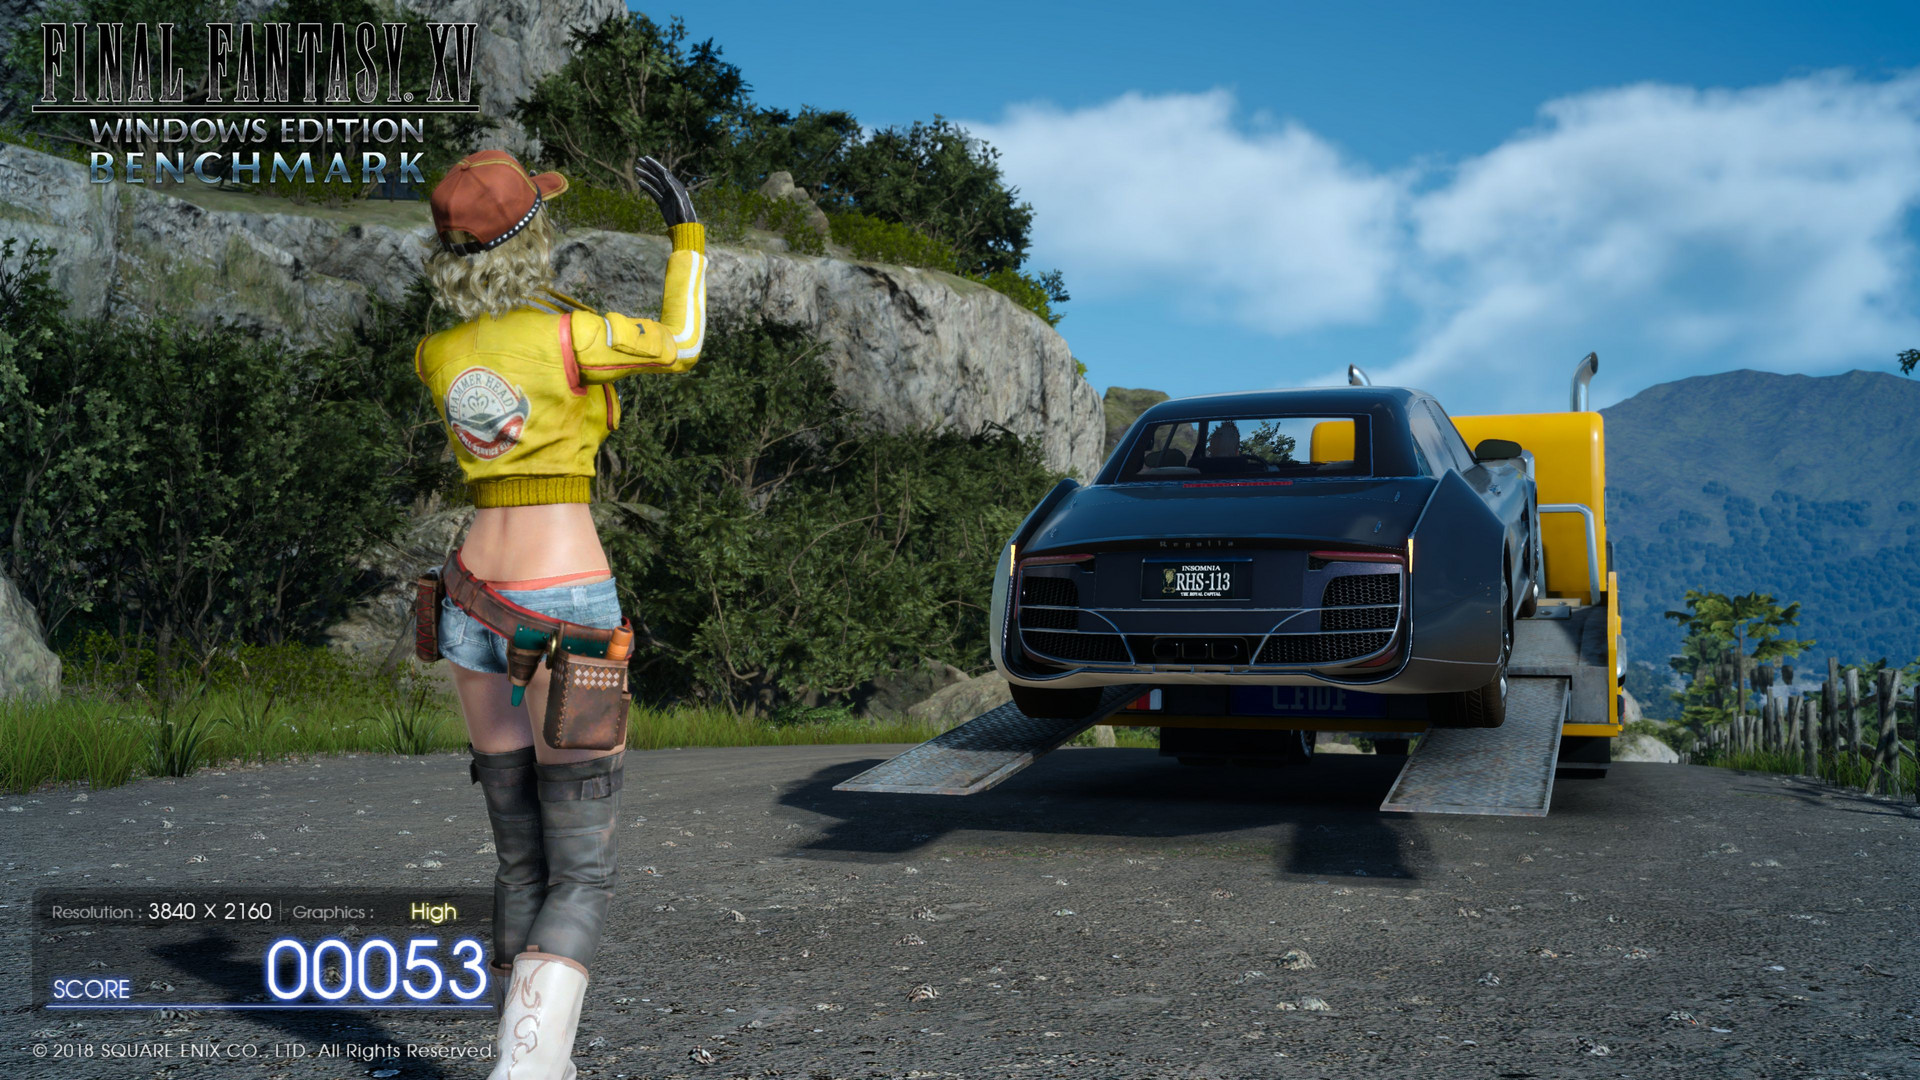
As may be expected, playing the game at the highest settings is out of reach for all but a few graphics cards. Playing comfortably at 1,920 x 1,080 on High required at least a GeForce GTX 980 or GTX 1060. While not officially supported by the benchmark, laptops with a GeForce GTX 1070 or GTX 1080 should sufficiently run at 2,560 x 1,440. By contrast, 3,840 x 2,160 currently overwhelms all notebook GPUs and even gives a GeForce GTX 1080 Ti a run for its money.

Final Fantasy XV Benchmark
    3840x2160 High Quality     1920x1080 High Quality     1920x1080 Standard Quality     1280x720 Lite Quality
NVIDIA GeForce GTX 1080 Ti (Desktop), 4790K
Nvidia GeForce GTX 1080 Ti Founders Edition
42.3 (31min) fps ∼26%
92 (0min) fps ∼39%
129 (89min) fps ∼52%
173 (112min) fps ∼70%
NVIDIA GeForce GTX 1080 (Desktop), 6700K
Desktop PC
34 (0min) fps ∼21%
77.2 (24min) fps ∼33%
108 (76min) fps ∼44%
160 (115min) fps ∼65%
NVIDIA GeForce GTX 1080 (Desktop), 4790K
Nvidia GeForce GTX 1080 Founders Edition
30.4 (22min) fps ∼19%
69 (0min) fps ∼29%
NVIDIA GeForce GTX 1080 Mobile, i7-7820HK
Alienware 17 R4
31.8 (0min) fps ∼20%
64.2 (23min) fps ∼27%
83.3 (61min) fps ∼34%
97.6 (63min) fps ∼40%
NVIDIA GeForce GTX 1070 (Desktop), 6700K
Nvidia GeForce GTX 1070
28.1 (0min) fps ∼17%
63 (19min) fps ∼27%
89.9 (68min) fps ∼36%
149 (106min) fps ∼60%
NVIDIA GeForce GTX 1070 Mobile, 6820HK
Asus G752VS
24.9 (0min) fps ∼15%
58.2 (17min) fps ∼25%
82.8 (54min) fps ∼33%
134 (88min) fps ∼54%
NVIDIA GeForce GTX 980 Ti, 4790K
Asus Strix GTX 980 Ti Desktop PC
24.8 (0min) fps ∼15%
55.1 (35min) fps ∼23%
78 (52min) fps ∼31%
136 (92min) fps ∼55%
NVIDIA GeForce GTX 1060 (Desktop), 6700K
Desktop PC
18.4 (0min) fps ∼11%
43.4 (12min) fps ∼18%
61.5 (50min) fps ∼25%
118 (84min) fps ∼48%
NVIDIA GeForce GTX 980, 6700K
Desktop PC
17.1 (0min) fps ∼11%
44.6 (10min) fps ∼19%
63 (46min) fps ∼25%
121 (80min) fps ∼49%
NVIDIA GeForce GTX 1060 Mobile, 6820HK
MSI GT62VR
16.7 (0min) fps ∼10%
41 (3min) fps ∼17%
58.6 (46min) fps ∼24%
110 (54min) fps ∼45%
AMD Radeon RX 480 (Desktop), 4790K
AMD Radeon RX 480 8 GB Reference
14.2 (2min) fps ∼9%
30.4 (3min) fps ∼13%
55.9 (41min) fps ∼23%
98 (39min) fps ∼40%
NVIDIA GeForce GTX 970, 4790K
MSI Gaming Z GeForce GTX 970 Desktop PC
12.8 (0min) fps ∼8%
35.6 (21min) fps ∼15%
55.3 (40min) fps ∼22%
101 (74min) fps ∼41%
NVIDIA GeForce GTX 980M, 6700HQ
Asus G752VY
12.7 (0min) fps ∼8%
34.2 (3min) fps ∼14%
50.2 (39min) fps ∼20%
95.4 (56min) fps ∼39%
AMD Radeon RX 470 (Desktop), 4790K
MSI RX 470 Gaming X 4GB
25.6 (3min) fps ∼11%
50.2 (36min) fps ∼20%
AMD Radeon R9 280X, 4790K
Asus Z97 Deluxe Desktop i7-4790K, R9 280X
40.8 (27min) fps ∼16%
NVIDIA GeForce GTX 970M, 6700HQ
MSI GS60 6QE
9.1 (0min) fps ∼6%
25.3 (4min) fps ∼11%
37.1 (27min) fps ∼15%
74.2 (37min) fps ∼30%
NVIDIA GeForce GTX 1050 Ti Mobile, i7-7700HQ
MSI GE72 7RE-046
23.4 (0min) fps ∼10%
37.1 (25min) fps ∼15%
74 (54min) fps ∼30%
NVIDIA GeForce GTX 1050 Ti (Desktop), 4790K
MSI GeForce GTX 1050 Ti
22.7 (0min) fps ∼10%
33.3 (26min) fps ∼13%
62 (41min) fps ∼25%
NVIDIA GeForce GTX 965M, 6700HQ
MSI GE72 965M Ti
20 (0min) fps ∼8%
30.7 (23min) fps ∼12%
62 (37min) fps ∼25%
NVIDIA GeForce GTX 1050 Mobile, i7-7700HQ
Asus GL753VD
7.6 (0min) fps ∼5%
19.7 (2min) fps ∼8%
30.7 (21min) fps ∼12%
56.1 (24min) fps ∼23%
NVIDIA GeForce GTX 1050 Mobile, i7-7700HQ
MSI GL62M 7RD-077
18.6 (0min) fps ∼8%
30.2 (22min) fps ∼12%
62 (27min) fps ∼25%
NVIDIA GeForce GTX 1050 (Desktop), 4790K
Zotac GeForce GTX 1050 2GB
3 (0min) fps ∼2%
15.5 (0min) fps ∼7%
26.2 (20min) fps ∼11%
54 (39min) fps ∼22%
NVIDIA GeForce GTX 960M, i7-7700HQ
MSI GL72 7QF
3.9 (0min) fps ∼2%
13.8 (0min) fps ∼6%
22.6 (15min) fps ∼9%
44.7 (16min) fps ∼18%
AMD Radeon RX 460 (Desktop), 4790K
XFX RX-460P4DFG5 Double Dissipation 4 GB
12.9 (2min) fps ∼5%
26.4 (16min) fps ∼11%
52.3 (38min) fps ∼21%
AMD Radeon R7 370, 4790K
MSI Gaming R7 370 2GB
21.4 (16min) fps ∼9%
51.8 (34min) fps ∼21%
NVIDIA GeForce GTX 950M, 6700HQ
MSI PE60 2QD
11.9 (0min) fps ∼5%
19 (14min) fps ∼8%
38 (22min) fps ∼15%
NVIDIA GeForce MX150, i7-7700HQ
MSI PL62
10 (0min) fps ∼4%
17.3 (12min) fps ∼7%
35 (15min) fps ∼14%
NVIDIA GeForce 940MX, 6700HQ
MSI CX72 6QD
5.9 (0min) fps ∼2%
8.9 (7min) fps ∼4%
18.1 (4min) fps ∼7%
NVIDIA GeForce 940M, 5700HQ
MSI GP62 2QD
17.9 (0min) fps ∼7%
NVIDIA GeForce 920M, 2970M
MSI CX61 2QC 2970M MS-16GD
13.4 (0min) fps ∼5%
AMD Radeon R9 M280X, FX-7600P
Asus N551ZU-CN007H
18.3 fps ∼7%
30.7 fps ∼12%
10.3 (2min) fps ∼4%
Intel HD Graphics 630, i7-7700HQ
MSI PL62
4.3 (0min) fps ∼2%
8.3 (0min) fps ∼3%

Update

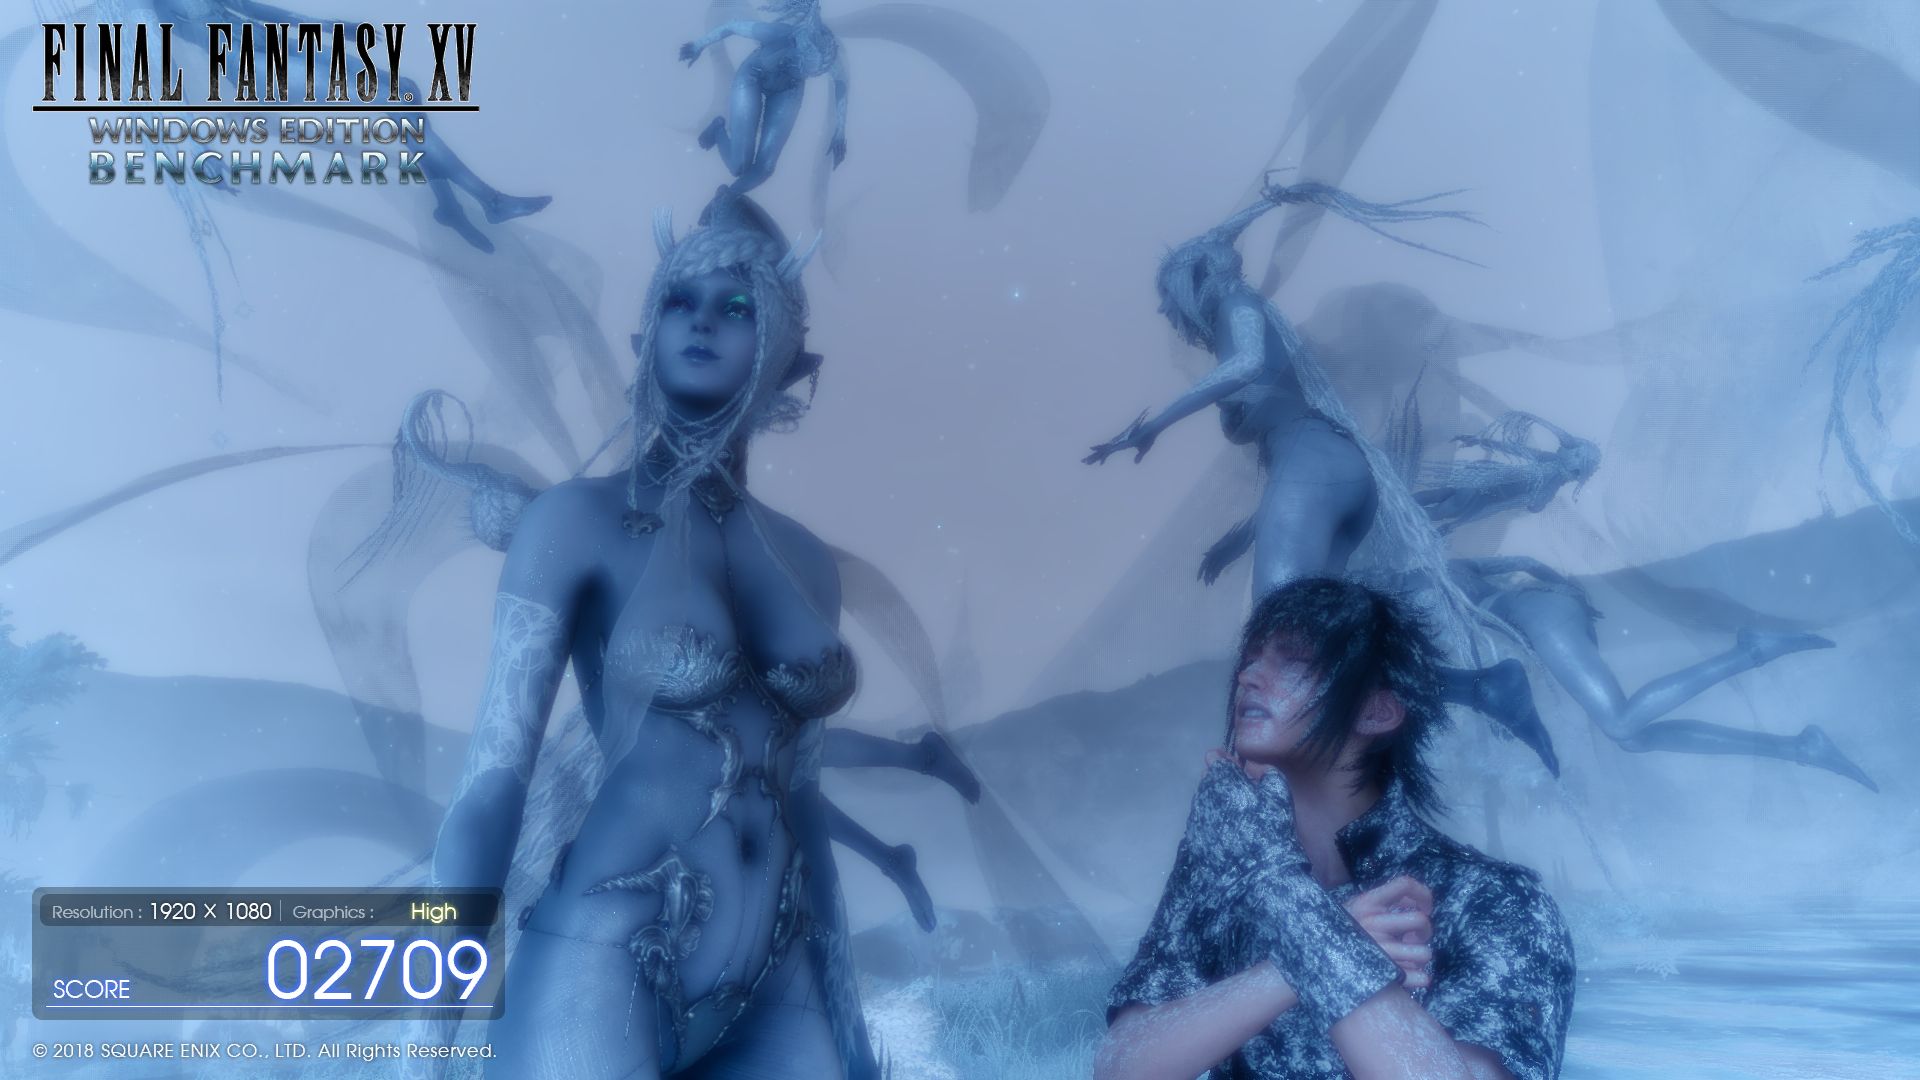
We have been able to look at the final version of the game given that Final Fantasy XV has now been released on PC. As the benchmark had already suggested, graphically Final Fantasy XV looks first-class. The screenshots below are at maximum details.

It is worth bearing in mind that you will need to have plenty of storage to appreciate the full Final Fantasy XV experience. The game requires 148 GB of storage including the freely available high-resolution DLC. Because of this record-breaking storage requirement, we installed Final Fantasy XV onto an external HDD rather than on our test equipment SSDs. This resulted in extremely high load times.

Final Fantasy XV
Final Fantasy XV
Final Fantasy XV

Conversely, the retail version has many graphics options, all of which can be applied without restarting the game and are outlined by text. NVIDIA GPU owners should be pleased by the Gameworks effects, which include HairWorks, VXAO, TurfEffects, and ShadowLibs.

Together with the aforementioned high-resolution content, Final Fantasy XV is a beautiful game which tests hardware to its limits. Accordingly, Final Fantasy XV is heavy on RAM and video memory. Konami includes an optional FPS counter which provides various information to better understand the extent to which your system is being tested.

Final Fantasy XV
Final Fantasy XV
Final Fantasy XV

Speaking of that: Konami has implemented maximum frame rate limit of 120 FPS. During our testing, we rarely encountered technical problems, although on some devices we noticed strong stutters every now and again irrespective of settings.

We have re-tested Final Fantasy XV against some graphics cards to give you a better impression of the game’s final performance. We tested performance at medium to high quality, driving between the ‘Outpost Hammerhead’ and the quest location ‘The Errand Prince’. The settings used in this test are listed in the leftmost section of the table below.

Graphics card HD Graphics 630 (7700HQ) GeForce GTX 960M (2 GB GDDR5) GeForce GTX 970M (3 GB GDDR5) GeForce GTX 980M (4 GB GDDR5) GeForce GTX 1060 (6 GB GDDR5) GeForce GTX 1070 (8 GB GDDR5) GeForce GTX 1080 Max-Q GeForce GTX 1080 (8 GB GDDR5X)
1.920 x 1.080, Highest Preset, High-Res DLC, Nvidia Gameworks Effects 1.2 FPS 12 FPS 24 FPS 30 FPS 39 FPS 54 FPS 57 FPS 59 FPS
2.560 x 1.440, Highest Preset, High-Res DLC, Nvidia Gameworks Effects - 9 FPS 17 FPS 20 FPS 25 FPS 37 FPS 42 FPS 41 FPS

Overview

Show Restrictions
PosModel< PrevNext >Final Fantasy XV Benchmark
 Final Fantasy XV Benchmark (2018)
low
1280x720
Lite Quality
med.
1920x1080
Standard Quality
high
1920x1080
High Quality
QHD
2560x1440
High Quality
4K
3840x2160
High Quality
NVIDIA GeForce RTX 4090
236n21
234n21
228n21
221n20
157.9n21
AMD Radeon RX 7900 XTX
235n2
233.5n2
220.5n2
181.25n2
107.55n2
NVIDIA GeForce RTX 4080 Super
234.5n2
233n2
230n2
203n2
121.5n2
NVIDIA GeForce RTX 4080
236n3
235n3
224n3
195.7n3
115.4n3
NVIDIA GeForce RTX 3090 Ti
222n2
226n2
186.1n2
151.6n2
96.3n2
NVIDIA GeForce RTX 4070 Ti SUPER
235
235
209
168.8
98.9
AMD Radeon RX 7900 XT
234
233
197.2
149.9
84.9
NVIDIA GeForce RTX 4070 Ti
236.5n4
236n4
208n4
165.15n4
89.05n4
AMD Radeon RX 7900 GRE
230.5n2
231n2
168.55n2
129.65n2
74.85n2
AMD Radeon RX 6950 XT
233.5n2
220n2
188.35n2
152.7n2
85.8n2
NVIDIA GeForce RTX 4090 Laptop GPU
224n19
208n23
180n33
151n33
91.5n17
NVIDIA GeForce RTX 3090
234.5n14
229n13
187.4n15
144.2n14
87.7n14
NVIDIA GeForce RTX 3080 Ti
234n3
229n3
180.6n3
141n3
84.2n3
AMD Radeon RX 7800 XT
234
226
162.6
124.6
70.5
NVIDIA GeForce RTX 4070 SUPER
239.5n2
234.5n2
195.55n2
149.25n2
85n2
NVIDIA RTX A6000
176
168
135
127
82.4
AMD Radeon RX 7900M
152.8
114.6
69.3
NVIDIA GeForce RTX 4080 Laptop GPU
208n11
193.5n12
160n17
120.6n15
75.15n10
NVIDIA GeForce RTX 3080 12 GB
223
196.5
156.2
125.5
76.7
PosModel< PrevNext >Final Fantasy XV Benchmark
low med. high QHD 4K
NVIDIA GeForce RTX 3080
188n2
168.5n2
134.5n2
107.5n2
71.05n2
NVIDIA GeForce RTX 4070
236n2
233n2
179.2n2
134.45n2
74.4n2
AMD Radeon RX 6800 XT
231
211
149
113
65.2
AMD Radeon RX 6800
234n3
209n3
150.7n3
112.5n3
63.8n3
AMD Radeon RX 7700 XT
235
203
139.5
103.1
57.4
NVIDIA Titan RTX
201n31
174n32
133.5n32
105.5n20
63.15n32
NVIDIA GeForce RTX 3070 Ti
235
204
148.9
112.7
64.9
NVIDIA GeForce RTX 4060 Ti 16G
235
177
124.6
90.5
51.2
NVIDIA GeForce RTX 4060 Ti 8G
235n3
193.5n3
131.9n3
95.9n3
52.4n3
NVIDIA GeForce RTX 3080 Ti Laptop GPU
194.15n24
155n27
118.5n42
89.55n34
55.45n18
NVIDIA GeForce RTX 4070 Laptop GPU
213n21
156.65n34
114.5n38
83.75n34
47.1n17
NVIDIA GeForce RTX 3070
192.9n4
153.5n4
118.5n4
94n4
57.25n4
AMD Radeon RX 6750 XT
232n3
179.6n3
127.8n3
94.9n3
53.6n3
NVIDIA GeForce RTX 2080 Ti (Desktop)
197.5n2
161.5n2
121n2
57.7n3
AMD Radeon RX 6700 XT
235n3
169.7n3
121.9n3
88.1n3
48.1n3
NVIDIA GeForce RTX 3080 Laptop GPU
177.8n26
136n28
105n33
80.6n17
44.7n15
NVIDIA GeForce RTX 3060 Ti
199.85n6
150.05n6
106.95n6
82.55n6
50n6
Intel Arc A770
127.7
90.7
51
44.7
32.1
NVIDIA GeForce RTX 4060
234
156.5
109.3
79.3
43
AMD Radeon RX 7600
235
146.9
103.6
74.2
39.3
PosModel< PrevNext >Final Fantasy XV Benchmark
low med. high QHD 4K
AMD Radeon RX 6850M XT
180.6
148.5
112.75n2
84.15n2
48.8
NVIDIA GeForce RTX 3070 Ti Laptop GPU
185.1n20
132.15n24
99.6n35
75.7n24
43.9n5
NVIDIA GeForce RTX 4060 Laptop GPU
201.45n22
138.3n26
100.1n29
73.05n22
34.3n7
NVIDIA GeForce RTX 2080 Super (Desktop)
159
130
100.5n2
46.8n2
AMD Radeon RX 6800M
151.4n2
121.8n2
98.6n2
71
41.3
AMD Radeon RX 6650 XT
234n3
141.2n3
100.6n3
71.4n3
36.9n3
AMD Radeon RX 6600 XT
225
129
94.5
66.9
36
NVIDIA GeForce RTX 2080 (Desktop)
163.25n2
125.4n2
96.35n2
44.35n2
NVIDIA GeForce RTX 2080 Super Mobile
194.5n2
134n3
103n3
80.2
44.5n2
NVIDIA GeForce RTX 3070 Laptop GPU
159.8n30
118n32
90.2n49
71.4n25
42.2n8
AMD Radeon RX 6800S
177.9
121.05n2
88.65n2
62.1
AMD Radeon RX 7600M XT
222n5
129.2n5
92.4n5
67.1n5
35.8n5
Intel Arc A750
124.5
86.6
48.2
41.4
28.8
NVIDIA GeForce RTX 3060
196n5
120n5
88.6n5
64.35n4
38n4
AMD Radeon RX 7700S
206
106
74.8
54.5
29
NVIDIA GeForce RTX 2080 Mobile
150
123n2
99n3
67.7
40.9n2
AMD Radeon RX 6700M
113
83.8
NVIDIA GeForce GTX 1080 Ti (Desktop)
166.5n2
130n2
96.5n2
76.3
42.9n4
NVIDIA Titan X Pascal
231n3
140.5n3
104.7n3
77.05n2
43.5n3
NVIDIA GeForce RTX 2070 Super (Desktop)
164.5n6
124n6
101.7n6
78n3
41.6n5
PosModel< PrevNext >Final Fantasy XV Benchmark
low med. high QHD 4K
AMD Radeon VII
130
69
48.7
35.1
19.2
AMD Radeon RX 5700 XT (Desktop)
224n3
123n3
87.4n3
65.25n2
37.4n3
NVIDIA GeForce RTX 2070 (Desktop)
160.1n5
117.3n5
85.7n5
38.25n4
NVIDIA GeForce RTX 3060 Laptop GPU
153n33
105n37
78.75n42
60.5n25
34.6n11
AMD Radeon RX 7600S
215
110.3n2
81.7n2
NVIDIA GeForce RTX 2070 Super Mobile
121
85.4n2
37.7
NVIDIA GeForce GTX 1080 (Desktop)
160
108
69n3
32.2n2
NVIDIA GeForce RTX 2080 Super Max-Q
103
73.9n2
37.6
NVIDIA GeForce RTX 2060 Super (Desktop)
201.5n4
117.1n4
86.35n4
67.95n2
36.5n4
Intel Arc A770M
132.4
91.3
50.7
41.6
28.6
AMD Radeon RX 6600
227n3
113.8n3
83n3
57n3
30.4n3
AMD Radeon RX 5700 (Desktop)
205n3
107.8n3
78.1n3
58n2
32.8n3
AMD Radeon RX 6650M
164.7
113.3
83.2
AMD Radeon RX 6600M
197.7n5
110.4n5
79.7n6
56.3n4
30.6n3
AMD Radeon RX 6700S
106.7
78.6
NVIDIA GeForce RTX 2070 Mobile
154.5n2
103n3
78.1n3
32.2
NVIDIA GeForce RTX 2080 Max-Q
126.3n2
103n5
77.3n5
34.3n2
NVIDIA GeForce RTX 2060 (Desktop)
151.9
99.6
72.6
30.8
AMD Radeon RX Vega 64
143.75n12
88.15n12
58.9n13
27.9n13
NVIDIA GeForce GTX 1080 Mobile
97.6
83.3
76n4
31.8n2
PosModel< PrevNext >Final Fantasy XV Benchmark
low med. high QHD 4K
NVIDIA GeForce RTX 2070 Super Max-Q
162
107n2
81.85n2
33
NVIDIA GeForce GTX 1070 Ti (Desktop)
146
87
63
27.7
NVIDIA GeForce RTX 2070 Max-Q
117.6
83.95n2
61n3
25.15n2
NVIDIA GeForce RTX 2060 Mobile
115.1n4
85.6n5
63.9n7
25.1
NVIDIA GeForce RTX 3050
170.55n2
91.4n2
66.9n2
48.75n2
28.2n2
NVIDIA GeForce GTX 1070 (Desktop)
147.2n2
87.45n2
61.3n2
27.55n2
AMD Radeon RX 5600 XT (Desktop)
195.65n2
104.35n2
73.95n2
54.4n2
31.6n2
NVIDIA GeForce GTX 1080 Max-Q
120n2
87.8n2
67.4n2
54
28.55n2
NVIDIA GeForce GTX 1070 Mobile
137n2
82.4n2
57.7n6
24.5n2
NVIDIA GeForce RTX 2060 Max-Q
139n3
79n3
61.3n3
43.6
24.9
NVIDIA GeForce GTX 1660 Ti (Desktop)
159.3n2
88.65n2
64.2n2
49.5
26.15n2
NVIDIA GeForce GTX 1660 Super (Desktop)
101.2n2
90.4n2
77.4n2
68.8n2
58.35n2
AMD Radeon RX 6500 XT
147.9n3
72.6n3
47n3
30.6n3
12.1n3
AMD Radeon RX 5500 XT (Desktop)
136n3
70.9n3
50.7n3
36.8n3
21.3n3
NVIDIA GeForce RTX 4050 Laptop GPU
183n21
115.5n27
82n33
55.9n18
27.9n2
Intel Arc A730M
104n2
71n3
41.6n3
33.7
21.8
AMD Radeon RX 5600M
129
78
51.1
NVIDIA GeForce GTX 1660 Ti Mobile
131n4
80.5n5
58.7n5
24
NVIDIA GeForce RTX 3050 Ti Laptop GPU
111.35n18
72.4n24
51.65n24
34.1n11
16.6n3
NVIDIA GeForce RTX 3050 6GB Laptop GPU
128.2n3
70.3n3
51.2n3
34.7n2
PosModel< PrevNext >Final Fantasy XV Benchmark
low med. high QHD 4K
NVIDIA GeForce GTX 980 Ti
136
78
56.75n2
25.45n2
NVIDIA GeForce GTX 1660 (Desktop)
158.5n2
80.05n2
56.35n2
41.3n2
23n2
NVIDIA GeForce GTX 1070 Max-Q
49.5n3
NVIDIA GeForce GTX 1650 Super (Desktop)
142.1n3
72.6n3
50.6n3
35.9n3
19.1n3
NVIDIA GeForce GTX 980
121
63
44.6
17.1
NVIDIA GeForce RTX 3050 4GB Laptop GPU
113.5n13
66.1n17
47.4n19
33n6
17.1n4
NVIDIA GeForce GTX 1660 Ti Max-Q
106.4n3
70.3n3
50n3
AMD Radeon RX 6550M
129.3
67.4
47.8
31.2
AMD Radeon RX 6500M
126.6
65.8
46.9
AMD Radeon RX 590 (Desktop)
116.9
64.8
43.3
19.6
AMD Radeon RX 580 (Desktop)
104.65n2
58.75n2
34.6n2
15.95n2
NVIDIA GeForce GTX 1060 (Desktop)
118
61.5
43.4
18.4
AMD Radeon RX 570 (Desktop)
96
54
35.2
16.4
AMD Radeon RX 480 (Desktop)
98
55.9
30.4
14.2
NVIDIA GeForce GTX 1060 Mobile
110
60.5n2
41n5
16.55n2
NVIDIA GeForce GTX 1650 Ti Mobile
105.5n2
55.2n3
40.9n3
14.6
Intel Arc A370M
70.3n3
37.9n3
26.3n3
19.55n4
AMD Radeon RX 5500M
102.05n2
58.15n2
35n2
AMD Radeon Pro 5500M
48.4
20.4
NVIDIA GeForce RTX 2050 Mobile
90.5n7
49n7
35n7
25n3
13.4
PosModel< PrevNext >Final Fantasy XV Benchmark
low med. high QHD 4K
NVIDIA GeForce GTX 1650 (Desktop)
82.6n2
52.7n2
38.45n2
28.9
14.15n2
NVIDIA GeForce GTX 1650 Mobile
74.65n4
50.2n5
35.65n6
24.75n2
13.8n3
AMD Radeon RX 5300M
98.4
51.6
29.3
NVIDIA GeForce GTX 970
101
55.3
35.6
12.8
NVIDIA GeForce GTX 1060 Max-Q
91n2
53.1n2
38.45n2
14.6
NVIDIA GeForce GTX 1650 Ti Max-Q
90.1n3
46.3n3
32.5n3
19.3
10.1
AMD Radeon RX 470 (Desktop)
105
51.3n2
30.15n2
25.3
13.4
NVIDIA GeForce GTX 1650 Max-Q
71.45n2
41.7n3
29.4n3
23.4
9.15n2
NVIDIA T1200 Laptop GPU
102n3
56.5n3
37n3
26.3n2
NVIDIA Quadro T1000 (Laptop)
66.75n2
45.55n2
32.55n2
Intel Arc 8-Cores iGPU
57.2n11
36n11
23.55n12
14
Intel Arc A350M
62.05n2
31.5n2
19.45n2
13.6
7.17n2
Intel Arc 7-Cores iGPU
64.8
35.8
25.3
NVIDIA T600 Laptop GPU
86
43.9
31
NVIDIA T550 Laptop GPU
60.7n3
30.5n3
22.2n3
NVIDIA GeForce GTX 980M
95.4
50.2
34.2
12.7
AMD Radeon RX Vega M GH
81.8
41.2
20.4
AMD Radeon 780M
70.45n26
35.2n27
26.5n28
19.55n6
11.2
AMD Radeon R9 280X
40.8
NVIDIA GeForce MX550
74.75n2
36.25n2
22.35n2
PosModel< PrevNext >Final Fantasy XV Benchmark
low med. high QHD 4K
NVIDIA GeForce GTX 1050 Ti Mobile
65.8n2
38.15n4
25.1n4
NVIDIA GeForce GTX 1050 Ti (Desktop)
62
33.3
22.7
AMD Radeon 680M
61.3n31
32.45n32
23.4n32
17n3
NVIDIA GeForce GTX 970M
74.2
37.1
25.3
9.1
NVIDIA T500 Laptop GPU
50.5n3
23.9n3
16.7n3
12.4
5.73
NVIDIA GeForce MX450
57.25n16
27.5n13
16.15n10
12.5n3
2.8
NVIDIA GeForce GTX 1050 Ti Max-Q
68.3n2
37.15n2
24.15n2
9.2
AMD Radeon RX Vega M GL / 870
33.15n2
31.3
20.7
8.2
AMD Radeon Pro WX Vega M GL
63
32.5
21.8
8.3
NVIDIA GeForce GTX 1050 (Desktop)
54
26.2
15.5
3
NVIDIA GeForce GTX 1050 Mobile
62.75n6
31.45n6
21.2n6
7.6
AMD Radeon R7 370
51.8
21.4
NVIDIA GeForce GTX 1050 Max-Q
56.9
29.3
20.6
7.9
AMD Radeon 760M
58.2n2
29.2n2
21.95n2
AMD Radeon Steam Deck 8CU
51.94
18.12n3
AMD Radeon 660M
44.65n6
21.3n6
15.5n6
AMD Radeon RX 460 (Desktop)
56.6n2
28.15n2
16.85n2
15.1
7.82
NVIDIA GeForce GTX 965M
62
30.7
20
AMD Radeon RX 560X (Laptop)
53.8n2
28.25n2
16.15n2
AMD Radeon RX 560 (Laptop)
54.4
26.1
6.5
PosModel< PrevNext >Final Fantasy XV Benchmark
low med. high QHD 4K
Intel Iris Xe MAX Graphics
46.1
25.2n2
17.6n2
AMD Radeon Pro 560X
44.4
23.6
14.3
5.8
Intel Iris Xe Graphics G7 96EUs
40.55n172
22.15n168
16.2n161
12n28
7.54n5
NVIDIA GeForce MX350
46.3n5
23n5
14.5n5
NVIDIA GeForce GTX 960M
44.7
22.6
13.8
3.9
AMD Radeon RX 550 (Laptop)
30.5
14.8
5.23
AMD Radeon Pro WX 3200
26.3
9.7
6.3
AMD Radeon Pro 555
35.5
16.7
3.7
NVIDIA GeForce GT 1030 (Desktop)
32
15.3
NVIDIA GeForce MX250
36.7n5
18.3n5
11.5n4
NVIDIA GeForce MX330
37.1
18
11.2
NVIDIA GeForce MX150
29.3n7
14.65n6
8.3n5
6.68
2.52
Intel Iris Xe Graphics G7 80EUs
31.25n100
17.7n93
13.45n84
10n15
5.31n3
NVIDIA GeForce GT 710
8.41
3.68
2.93
1.89
1.89
AMD Radeon RX 540
17.75n2
6.1n2
3.05n2
NVIDIA GeForce GTX 950M
38
19
11.9
AMD Radeon 540X
26.9
13.3
AMD Radeon RX Vega 11
29.15n4
15.55n4
7.74
5.75
3.33
AMD Radeon R9 M280X
20.5n2
18.3
Intel UHD Graphics 64EUs (Alder Lake 12th Gen)
33.95n10
18.25n10
13.25n10
PosModel< PrevNext >Final Fantasy XV Benchmark
low med. high QHD 4K
Intel Iris Plus Graphics G7 (Ice Lake 64 EU)
19.2n6
10.2n6
7.58n5
AMD Radeon RX Vega 10
16.3n3
8.1n3
6.8
Intel UHD Graphics Xe G4 48EUs
23.35n12
13.1n7
10.6n5
Intel UHD Graphics 32EUs (Alder Lake)
18n3
9.31n3
6.45n3
Intel UHD Graphics Xe 32EUs (Tiger Lake-H)
23.6n3
12.7n2
8.85n2
Intel UHD Graphics 770
27.7n2
14.6n2
10.07n2
Intel UHD Graphics Xe 750 32EUs (Rocket Lake)
23n3
12.3n3
8.35n3
6
3.48
Intel UHD Graphics 730 (Rocket Lake)
16.6
8.13
8.13
NVIDIA GeForce MX230
26
11.4
7.4
AMD Radeon RX Vega 8 (Ryzen 4000/5000)
35.3n51
17.65n46
12.3n45
8.78n10
5.76n4
AMD Radeon RX Vega 7
31.6n40
15.95n40
10.9n37
8.66
4.83
NVIDIA GeForce MX130
25.25n4
12.2n3
7n3
NVIDIA GeForce 940MX
17.95n2
9.8n2
6.1n2
AMD Radeon RX Vega 8 (Ryzen 2000/3000)
22.96n11
12.51n10
7.77n8
NVIDIA GeForce 940M
17.9
Intel Iris Plus Graphics G4 (Ice Lake 48 EU)
17.3
9.5
NVIDIA GeForce 930MX
17.6
8.5
Intel Iris Plus Graphics 655
16.75n8
8.94n4
6.06n4
NVIDIA GeForce 930M
15.7
Intel Iris Graphics 550
17.3
8.73
PosModel< PrevNext >Final Fantasy XV Benchmark
low med. high QHD 4K
AMD Radeon 530
15.5
7.2
AMD Radeon RX Vega 6 (Ryzen 4000/5000)
26.7n9
13.45n8
9.32n6
4.87
1.99
NVIDIA GeForce MX110
18.3
8.7
4.9
NVIDIA GeForce 920MX
17.3
8.2
5
Intel UHD Graphics 24EUs (Alder Lake-N)
12.85n8
6.16n7
4.41n6
NVIDIA GeForce 920M
13.4
AMD Radeon Graphics (Ryzen 7000)
19.3
19.3
5.74
AMD Radeon 610M
26.8
12.3
8.79
AMD Radeon RX Vega 5
23.4
11.7
8.08
Intel UHD Graphics G1 (Ice Lake 32 EU)
14.45n8
7.45n6
5.81n3
Intel UHD Graphics 630
11.3n3
4.8
Intel UHD Graphics Xe 16EUs (Tiger Lake-H)
14.3n4
6.55n3
4.66n3
Intel HD Graphics 630
9.75n2
4.3
Intel HD Graphics 530
9.3
AMD Radeon R5 (Bristol Ridge)
8
4
Intel UHD Graphics 620
11.6n14
6n8
5.04n7
Intel HD Graphics 620
8.9
Qualcomm Adreno 690
19
12.3
7.29
Intel HD Graphics 5600
8.7
AMD Radeon R5 M255
12.55n2
6.02
PosModel< PrevNext >Final Fantasy XV Benchmark
low med. high QHD 4K
AMD Radeon RX Vega 3
12.9n6
5.83n5
4.13n3
Intel HD Graphics 520
7
Intel Iris Graphics 6100
9.4
NVIDIA GeForce GT 720M
10.45n2
AMD Radeon R5 (Stoney Ridge)
8.1
4.3
Intel HD Graphics 4600
9.6
Intel HD Graphics 5500
11.52n2
Intel UHD Graphics (Jasper Lake 32 EU)
9.84n6
4.74n6
2.03n3
Intel UHD Graphics 615
6.1
3.3
Intel UHD Graphics (Jasper Lake 24 EU)
13.7
Intel UHD Graphics 610
7.73
3.53
3.53
Intel HD Graphics 610
6.87n2
Intel HD Graphics 4400
9.1
Intel UHD Graphics (Elkhart Lake 16 EU)
3.45
1.66
Intel UHD Graphics (Jasper Lake 16 EU)
6.93n6
3.27n3
2.27n2
Intel UHD Graphics 605
4.4n5
3.27
AMD Radeon R4 (Stoney Ridge)
6.8
AMD Radeon R5 (Beema/Carrizo-L)
5.5
Intel UHD Graphics 600
4.52n9
2.25n4
1.55n3
1.12
(-) * Smaller values are better. / n123 Number of benchmarks for this median value / * Approximate position


Legend
5Stutters – This game is very likely to stutter and have poor frame rates. Based on all known benchmarks using the specified graphical settings, average frame rates are expected to fall below 25fps
May Stutter – This graphics card has not been explicitly tested on this game. Based on interpolated information from surrounding graphics cards of similar performance levels, stutters and poor frame rates are expected.
30Fluent – Based on all known benchmarks using the specified graphical settings, this game should run at or above 25fps
40Fluent – Based on all known benchmarks using the specified graphical settings, this game should run at or above 35fps
60Fluent – Based on all known benchmarks using the specified graphical settings, this game should run at or above 58fps
May Run Fluently – This graphics card has not been explicitly tested on this game. Based on interpolated information from surrounding graphics cards of similar performance levels, fluent frame rates are expected.
?Uncertain – This graphics card experienced unexpected performance issues during testing for this game. A slower card may be able to achieve better and more consistent frame rates than this particular GPU running the same benchmark scene.
Uncertain – This graphics card has not been explicitly tested on this game and no reliable interpolation can be made based on the performances of surrounding cards of the same class or family.
The value in the fields displays the average frame rate of all values in the database. Move your cursor over the value to see individual results.

Test Systems

Device Graphics Card Processor RAM Operating System
Desktop-PC I MSI GeForce GTX 1080 (8 GB GDDR5X)
MSI GeForce GTX 1070 (8 GB GDDR5)
Nvidia GeForce GTX 1060 (6 GB GDDR5)
Nvidia GeForce GTX 980 (4 GB GDDR5)
Intel Core i7-6700K 2 x 8 GB DDR4 Windows 10 64 Bit
Desktop-PC II Nvidia GeForce GTX 1080 Ti (11 GB GDDR5X)
Asus GeForce GTX 980 Ti (6 GB GDDR5)
XFX Radeon R9 Fury (4 GB HBM)
Sapphire Radeon R9 290X (4 GB GDDR5)
Sapphire Radeon R9 280X (3 GB GDDR5)
MSI Radeon R7 370 (2 GB GDDR5)
Intel Core i7-4790K 2 x 4 GB DDR3 Windows 10 64 Bit
Alienware 17 R4 Nvidia GeForce GTX 1080 (8 GB GDDR5X) Intel Core i7-7820HK 1 x 16 GB DDR4 Windows 10 64 Bit
Asus G752VS Nvidia GeForce GTX 1070 (8 GB GDDR5) Intel Core i7-6820HK 2 x 16 GB DDR4 Windows 10 64 Bit
MSI GT62VR Nvidia GeForce GTX 1060 (6 GB GDDR5) Intel Core i7-6820HK 2 x 8 GB DDR4 Windows 10 64 Bit
MSI GE72 Nvidia GeForce GTX 1050 Ti (4 GB GDDR5) Intel Core i7-7700HQ 2 x 4 GB DDR4 Windows 10 64 Bit
Asus GL753VD Nvidia GeForce GTX 1050 (4 GB GDDR5) Intel Core i7-7700HQ 1 x 8 GB DDR4 Windows 10 64 Bit
MSI GL62 Nvidia GeForce GTX 1050 (2 GB GDDR5) Intel Core i7-7700HQ 2 x 4 GB DDR4 Windows 10 64 Bit
Asus G752VY Nvidia GeForce GTX 980M (4 GB GDDR5) Intel Core i7-6700HQ 2 x 16 GB DDR4 Windows 10 64 Bit
MSI GS60 Nvidia GeForce GTX 970M (3 GB GDDR5) Intel Core i7-6700HQ 2 x 4 GB DDR4 Windows 10 64 Bit
MSI GE72 Nvidia GeForce GTX 965M (2 GB GDDR5) Intel Core i7-6700HQ 1 x 8 GB DDR4 Windows 10 64 Bit
MSI GL72 Nvidia GeForce GTX 960M (2 GB GDDR5) Intel Core i7-7700HQ 1 x 8 GB DDR4 Windows 10 64 Bit
MSI PE60 Nvidia GeForce GTX 950M (2 GB GDDR5) Intel Core i7-6700HQ 2 x 4 GB DDR4 Windows 10 64 Bit
MSI PL62 Nvidia GeForce MX150 (2 GB GDDR5) Intel Core i7-7700HQ 1 x 8 GB DDR4 Windows 10 64 Bit
MSI CX72 Nvidia GeForce 940MX (2 GB DDR3) Intel Core i7-6700HQ 2 x 8 GB DDR4 Windows 10 64 Bit
MSI GP62 Nvidia GeForce 940M (2 GB DDR3) Intel Core i7-5700HQ 1 x 8 GB DDR3 Windows 10 64 Bit
MSI CX61 Nvidia GeForce 920M (2 GB DDR3) Intel Celeron 2970M 1 x 8 GB DDR3 Windows 10 64 Bit
Asus N551ZU AMD Radeon R9 M280X (4 GB GDDR5) AMD FX-7600P 2 x 4 GB DDR3 Windows 10 64 Bit
4K Monitor Nvidia Driver AMD Driver
2 x Asus PB287Q, Philips 328P6VJEB ForceWare 390.77 Adrenalin 18.2.1
static version load dynamic
Loading Comments
Comment on this article
Please share our article, every link counts!
> Expert Reviews and News on Laptops, Smartphones and Tech Innovations > Reviews > Final Fantasy XV Laptop and Desktop Benchmarks
Florian Glaser, 2018-02- 7 (Update: 2022-01-21)