Notebookcheck Logo

Intel Core i5-8250U vs Intel Core i5-7200U vs AMD A10-9620P

Intel Core i5-8250U

► remove from comparison Intel i5-8250U

The Intel Core i5-8250U is a power efficient quad-core SoC for notebooks and Ultrabooks based on the Kaby Lake Refresh generation and was announced in August 2017. Contrary to its direct predecessor the Core i5-7200U, which were still dual-cores, the i7-8250U is equipped with four cores but at a lower base frequency of 1.6 GHz. The Turbo Boost can go up to 3,4 GHz and therefore also offer good short term single core speeds. The GPU is now named Intel UHD Graphics 620 but otherwise identical to the Intel HD Graphics 620. The integrated memory controller supports DDR4-2400 / LPDDR3-2133 and dual channel memory.

Architecture

Intel basically uses the same micro architecture compared to Skylake, so the per-MHz performance does not differ. The manufacturer only reworked the Speed Shift technology for faster dynamic adjustments of voltages and clocks, and the improved 14nm process allows much higher frequencies combined with better efficiency than before.

Performance

According to Intel, the new quad core models are up to 40% faster than their dual core predecessors. Due to the reduced TDP and the same 14nm+ process, the long term performance and throttling behavior will be interesting and depending on the laptop design. Therefore, the older 35 Watt quad-core models should be faster in applications that demand longer CPU loads.

Graphics

The integrated Intel UHD Graphics 620 (Intel Gen 9.5) is untouched from the 8th Gen Kaby Lake chips. With fast dual-channel memory it can reach the performance of a dedicated GeForce 920M.

Contrary to Skylake, Kaby lake now also supports H.265/HEVC Main 10 with a 10-bit color depth as well as Google's VP9 codec. The dual-core Kaby Lake processors announced in January should also support HDCP 2.2.

Power Consumption

The chip is manufactured in an improved 14nm process with FinFET transistors (14nm+), the same as the 7th Gen Kaby Lake processors. Intel still specifies the TDP with 15 Watts, which is typical for ULV chips. Depending on the usage scenario, the TDP can vary between 7.5 (cTDP Down) and 25 Watts.

Intel Core i5-7200U

► remove from comparison Intel i5-7200U

The Intel Core i5-7200U is a dual-core processor of the Kaby Lake architecture. It offers two CPU cores clocked at 2.5 - 3.1 GHz and integrates HyperThreading to work with up to 4 threads at once. The architectural differences are rather small compared to the Skylake generation, therefore the performance per MHz is very similar. The SoC includes a dual channel DDR4 memory controller and Intel HD Graphics 620 graphics card (clocked at 300 - 1000 MHz). It is manufactured in an improved 14nm FinFET process at Intel. Compared to the old Skylake based Core i5-6200U, the i5-7200U offers a 300 MHz higher clock speed.

AMD A10-9620P

► remove from comparison AMD A10-9620P

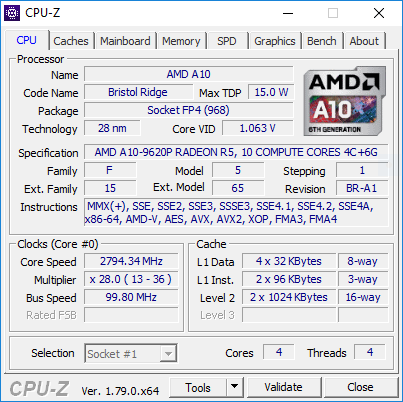
The AMD A10-9620P is a mid-range APU of the Bristol Ridge series (7th generation of APUs) with 4 CPU-cores (two Excavator modules) clocked at 2.5 - 3.4 GHz. In our tests the A10-9620P even hit 3.6 GHz.

It was announced in 2017 and is based on the same silicon as Carrizo but with more and refined features. It is a ULV-chip with a TDP of 15 Watt and integrates a Radeon R5 graphics card (384 shader cores / 6 compute cores) and a dual-channel DDR4-18600 memory controller. As Carrizo its a full featured SoC that offers all I/O ports on the chip.

The A10-9620P is a bit faster than the old 15-Watt top model of Carrizo, the FX-8800P. See our Bristol Ridge article for more information on the architecture and improvements compared to Carrizo.

ModelIntel Core i5-8250UIntel Core i5-7200UAMD A10-9620P
SeriesIntel Kaby Lake RefreshIntel Kaby LakeAMD Bristol Ridge
CodenameKaby Lake RefreshKaby LakeBristol Ridge
Series: Bristol Ridge Bristol Ridge
Intel Core i7-8650U1.9 - 4.2 GHz4 / 8 cores8 MB L3
Intel Core i7-8550U1.8 - 4 GHz4 / 8 cores8 MB L3
Intel Core i5-8350U1.7 - 3.6 GHz4 / 8 cores6 MB L3
Intel Core i5-8250U « 1.6 - 3.4 GHz4 / 8 cores6 MB L3
Intel Core i3-8130U2.2 - 3.4 GHz2 / 4 cores4 MB L3
Intel Pentium Gold 4417U2.3 GHz2 / 4 cores2 MB L3
Intel Core i7-7700K4.2 - 4.5 GHz4 / 8 cores8 MB L3
Intel Core i7-77003.6 - 4.2 GHz4 / 8 cores8 MB L3
Intel Xeon E3-1535M v63.1 - 4.2 GHz4 / 8 cores8 MB L3
Intel Core i7-7920HQ3.1 - 4.1 GHz4 / 8 cores8 MB L3
Intel Core i7-7700T2.9 - 3.8 GHz4 / 8 cores8 MB L3
Intel Core i5-7600K3.8 - 4.2 GHz4 / 4 cores8 MB L3
Intel Xeon E3-1505M v63 - 4 GHz4 / 8 cores8 MB L3
Intel Core i7-7820HQ2.9 - 3.9 GHz4 / 8 cores8 MB L3
Intel Core i7-7820HK2.9 - 3.9 GHz4 / 8 cores8 MB L3
Intel Core i7-7700HQ2.8 - 3.8 GHz4 / 8 cores6 MB L3
Intel Core i5-75003.4 - 3.8 GHz4 / 4 cores6 MB L3
Intel Core i5-7440HQ2.8 - 3.8 GHz4 / 4 cores6 MB L3
Intel Core i7-7567U3.5 - 4 GHz2 / 4 cores4 MB L3
Intel Core i7-7660U2.5 - 4 GHz2 / 4 cores4 MB L3
Intel Core i7-7600U2.8 - 3.9 GHz2 / 4 cores4 MB L3
Intel Core i5-7300HQ2.5 - 3.5 GHz4 / 4 cores6 MB L3
Intel Core i5-7500T2.7 - 3.3 GHz4 / 4 cores6 MB L3
Intel Core i5-7287U3.3 - 3.7 GHz2 / 4 cores4 MB L3
Intel Core i7-7560U2.4 - 3.8 GHz2 / 4 cores4 MB L3
Intel Core i5-7267U3.1 - 3.5 GHz2 / 4 cores4 MB L3
Intel Core i5-7360U2.3 - 3.6 GHz2 / 4 cores4 MB L3
Intel Core i7-7500U2.7 - 3.5 GHz2 / 4 cores4 MB L3
Intel Core i5-7300U2.6 - 3.5 GHz2 / 4 cores3 MB L3
Intel Core i5-7260U2.2 - 3.4 GHz2 / 4 cores4 MB L3
Intel Core i5-7200U « 2.5 - 3.1 GHz2 / 4 cores3 MB L3
Intel Core i3-7100H3 GHz2 / 4 cores3 MB L3
Intel Core i3-7167U2.8 GHz2 / 4 cores3 MB L3
Intel Core i7-7Y751.3 - 3.6 GHz2 / 4 cores4 MB L3
Intel Core i5-7Y571.2 - 3.3 GHz2 / 4 cores4 MB L3
Intel Core i5-7Y541.2 - 3.2 GHz2 / 4 cores4 MB L3
Intel Core i3-7100U2.4 GHz2 / 4 cores3 MB L3
Intel Core m3-7Y321 - 3 GHz2 / 4 cores4 MB L3
Intel Pentium Gold 4415U2.3 GHz2 / 4 cores2 MB L3
Intel Core m3-7Y301 - 2.6 GHz2 / 4 cores4 MB L3
Intel Celeron 3965U2.2 GHz2 / 2 cores2 MB L3
Intel Core i3-7020U2.3 GHz2 / 4 cores3 MB L3
Intel Celeron 3867U1.8 GHz2 / 2 cores2 MB L3
Intel Celeron 3865U1.8 GHz2 / 2 cores2 MB L3
Intel Pentium Gold 4425Y1.7 GHz2 / 4 cores2 MB L3
Intel Pentium Gold 4415Y1.6 GHz2 / 4 cores2 MB L3
Intel Pentium Gold 4410Y1.5 GHz2 / 4 cores2 MB L3
Intel Celeron 3965Y1.5 GHz2 / 2 cores2 MB L3
AMD FX-9830P3 - 3.7 GHz4 / 4 cores
AMD PRO A12-9830B3 - 3.7 GHz4 / 4 cores
AMD FX-9800P2.7 - 3.6 GHz4 / 4 cores
AMD PRO A12-9800B2.7 - 3.6 GHz4 / 4 cores
AMD A12-9720P2.7 - 3.6 GHz4 / 4 cores
AMD A12-9700P2.5 - 3.4 GHz4 / 4 cores
AMD A10-9620P « 2.5 - 3.4 GHz4 / 4 cores
AMD A10-9600P2.4 - 3.3 GHz4 / 4 cores
AMD PRO A8-9600B2.4 - 3.3 GHz4 / 4 cores
Clock1600 - 3400 MHz2500 - 3100 MHz2500 - 3400 MHz
L1 Cache256 KB128 KB
L2 Cache1 MB512 KB2 MB
L3 Cache6 MB3 MB
Cores / Threads4 / 82 / 44 / 4
TDP15 Watt15 Watt15 Watt
Technology14 nm14 nm28 nm
SocketBGA1356BGA1356FP4
FeaturesDual-Channel DDR4 Memory Controller, HyperThreading, AVX, AVX2, Quick Sync, Virtualization, AES-NIDual-Channel DDR4 Memory Controller, HyperThreading, AVX, AVX2, Quick Sync, Virtualization, AES-NIDual-Channel DDR3/DDR4-1866 Memory Controller, PCIe 3.0 x8
iGPUIntel UHD Graphics 620 (300 - 1100 MHz)Intel HD Graphics 620 (300 - 1000 MHz)AMD Radeon R5 (Bristol Ridge) ( - 758 MHz)
Architecturex86x86x86
$297 U.S.$281 U.S.
Announced
max. Temp.100 °C90 °C
Manufacturerark.intel.com
Transistors3100 Million
Die Size250 mm2

Benchmarks

Performance Rating - CB R15 + R20 + 7-Zip + X265 + Blender + 3DM11 CPU - i5-8250U
26.2 pt (36%)
Cinebench R23 - Cinebench R23 Multi Core
min: 3022     avg: 3108     median: 3108 (3%)     max: 3194 Points
Cinebench R23 - Cinebench R23 Single Core
min: 840     avg: 874     median: 873.5 (37%)     max: 907 Points
Cinebench R20 - Cinebench R20 CPU (Single Core)
min: 332     avg: 349.2     median: 353 (39%)     max: 355 Points
Cinebench R20 - Cinebench R20 CPU (Multi Core)
min: 846     avg: 1148     median: 1171 (3%)     max: 1325 Points
Cinebench R15 - Cinebench R15 CPU Multi 64 Bit
min: 320     avg: 570     median: 562 (4%)     max: 730 Points
min: 268     avg: 324.5     median: 327 (2%)     max: 337 Points
230 Points (1%)
Cinebench R15 - Cinebench R15 CPU Single 64 Bit
min: 81     avg: 141.1     median: 143 (43%)     max: 147 Points
min: 88     avg: 126.3     median: 128 (39%)     max: 132 Points
72 Points (22%)
Cinebench R11.5 - Cinebench R11.5 CPU Multi 64 Bit
min: 3.15     avg: 6     median: 5.9 (8%)     max: 7.76 Points
min: 2.85     avg: 3.6     median: 3.7 (5%)     max: 3.7 Points
2.7 Points (3%)
Cinebench R11.5 - Cinebench R11.5 CPU Single 64 Bit
min: 0.91     avg: 1.6     median: 1.6 (41%)     max: 1.79 Points
min: 1.2     avg: 1.4     median: 1.5 (36%)     max: 1.49 Points
0.8 Points (20%)
Cinebench R10 - Cinebench R10 Rend. Single (32bit)
min: 5349     avg: 5631     median: 5533 (33%)     max: 8356 Points
min: 4787     avg: 4976     median: 4985.5 (30%)     max: 5022 Points
2277 Points (14%)
Cinebench R10 - Cinebench R10 Rend. Multi (32bit)
min: 14148     avg: 18261     median: 17987 (13%)     max: 22097 Points
min: 9213     avg: 11161     median: 11308 (8%)     max: 11955 Points
7420 Points (5%)
wPrime 2.10 - wPrime 2.0 1024m *
min: 243.3     avg: 308.6     median: 306.2 (4%)     max: 402.1 s
min: 460.9     avg: 495     median: 491.2 (6%)     max: 537 s
470.9 s (6%)
wPrime 2.10 - wPrime 2.0 32m *
min: 7.394     avg: 8.9     median: 8.1 (2%)     max: 13.75 s
min: 14.66     avg: 15.6     median: 15.5 (3%)     max: 17.62 s
14.4 s (3%)
wPrime 1.55 - wPrime 1.55 1024m *
464.8 s (2%)
wPrime 1.55 - wPrime 1.55 32m *
14.9 s (8%)
WinRAR - WinRAR 4.0
min: 3632     avg: 3991     median: 3991 (6%)     max: 4350 Points
7-Zip 18.03 - 7-Zip 18.03 Multli Thread 4 runs
min: 11546     avg: 15262     median: 15365.5 (9%)     max: 17405 MIPS
7-Zip 18.03 - 7-Zip 18.03 Single Thread 4 runs
min: 3641     avg: 3726     median: 3706 (44%)     max: 3925 MIPS
X264 HD Benchmark 4.0 - x264 Pass 2
min: 29.5     avg: 32.8     median: 32 (11%)     max: 37.7 fps
min: 19     avg: 21.3     median: 21.6 (8%)     max: 22 fps
16.3 fps (6%)
X264 HD Benchmark 4.0 - x264 Pass 1
min: 124.6     avg: 139.3     median: 137.5 (32%)     max: 157.6 fps
min: 100     avg: 112.7     median: 113.1 (26%)     max: 117 fps
76.6 fps (18%)
HWBOT x265 Benchmark v2.2 - HWBOT x265 4k Preset
min: 3.02     avg: 4.2     median: 4.3 (8%)     max: 4.78 fps
TrueCrypt - TrueCrypt Serpent
min: 0.336     avg: 0.4     median: 0.4 (0%)     max: 0.415 GB/s
TrueCrypt - TrueCrypt Twofish
min: 0.58     avg: 0.6     median: 0.7 (12%)     max: 0.714 GB/s
TrueCrypt - TrueCrypt AES
min: 2.9     avg: 3.5     median: 3.5 (9%)     max: 4 GB/s
Blender - Blender 2.79 BMW27 CPU *
min: 813     avg: 948     median: 899.5 (6%)     max: 1209 Seconds
R Benchmark 2.5 - R Benchmark 2.5 *
min: 0.818     avg: 0.8     median: 0.8 (18%)     max: 0.843 sec
3DMark 06 - CPU - 3DMark 06 - CPU
min: 4775     avg: 6370     median: 6348 (14%)     max: 7575 Points
Super Pi mod 1.5 XS 1M - Super Pi mod 1.5 XS 1M *
min: 10.9     avg: 11.7     median: 11.1 (2%)     max: 15.77 s
min: 12     avg: 12.3     median: 12.3 (3%)     max: 12.61 s
18.2 s (4%)
Super Pi mod 1.5 XS 2M - Super Pi mod 1.5 XS 2M *
min: 24.9     avg: 26.3     median: 25.2 (1%)     max: 34.28 s
min: 27.36     avg: 28.2     median: 28 (1%)     max: 29.69 s
40.3 s (2%)
Super Pi Mod 1.5 XS 32M - Super Pi mod 1.5 XS 32M *
min: 601     avg: 631     median: 613 (3%)     max: 783 s
min: 610     avg: 645     median: 643.5 (3%)     max: 722 s
977 s (4%)
3DMark Vantage - 3DM Vant. Perf. CPU no Physx
min: 15198     avg: 20933     median: 21899 (19%)     max: 24736 Points
min: 9939     avg: 11370     median: 11779 (10%)     max: 12049 Points
3DMark 11 - 3DM11 Performance Physics
min: 3233     avg: 6318     median: 6276 (17%)     max: 8014 Points
min: 3242     avg: 4145     median: 4107 (11%)     max: 4695 Points
2399 Points (6%)
3DMark - 3DMark Ice Storm Physics
min: 24077     avg: 44593     median: 45968.5 (37%)     max: 50962 Points
min: 28394     avg: 37794     median: 37804 (31%)     max: 42974 Points
22553 Points (18%)
3DMark - 3DMark Ice Storm Extreme Physics
min: 24155     avg: 44127     median: 45251 (37%)     max: 50910 Points
min: 26941     avg: 36877     median: 37260 (30%)     max: 42166 Points
24032 Points (19%)
3DMark - 3DMark Ice Storm Unlimited Physics
min: 34294     avg: 49389     median: 50347.5 (42%)     max: 52066 Points
min: 36369     avg: 41562     median: 42260 (36%)     max: 43942 Points
3DMark - 3DMark Cloud Gate Physics
min: 3002     avg: 5863     median: 5774 (15%)     max: 7695 Points
min: 2622     avg: 3414     median: 3503 (9%)     max: 3684 Points
2338 Points (6%)
3DMark - 3DMark Fire Strike Standard Physics
min: 4495     avg: 8511     median: 8453 (15%)     max: 10727 Points
min: 3866     avg: 4887     median: 4979 (9%)     max: 5252 Points
3175 Points (6%)
3DMark - 3DMark Time Spy CPU
min: 1956     avg: 2709     median: 2663 (11%)     max: 3723 Points
Geekbench 5.5 - Geekbench 5.1 - 5.4 64 Bit Single-Core
min: 882     avg: 914     median: 925 (39%)     max: 936 Points
Geekbench 5.5 - Geekbench 5.1 - 5.4 64 Bit Multi-Core
min: 2265     avg: 3162     median: 3427 (6%)     max: 3516 Points
Geekbench 5.0 - Geekbench 5.0 64 Bit Single-Core
min: 923     avg: 927     median: 927 (4%)     max: 931 Points
Geekbench 5.0 - Geekbench 5.0 64 Bit Multi-Core
min: 3105     avg: 3298     median: 3298 (10%)     max: 3491 Points
Geekbench 4.4 - Geekbench 4.1 - 4.4 64 Bit Single-Core
min: 3453     avg: 4116     median: 4095 (41%)     max: 4330 Points
Geekbench 4.4 - Geekbench 4.1 - 4.4 64 Bit Multi-Core
min: 11269     avg: 12833     median: 12751 (14%)     max: 14228 Points
Geekbench 4.0 - Geekbench 4.0 64 Bit Single-Core
min: 3924     avg: 4076     median: 4029 (55%)     max: 4243 Points
min: 3484     avg: 3661     median: 3630 (49%)     max: 3902 Points
Geekbench 4.0 - Geekbench 4.0 64 Bit Multi-Core
min: 10751     avg: 12210     median: 12131 (30%)     max: 13486 Points
min: 6425     avg: 6947     median: 6806 (17%)     max: 7439 Points
Geekbench 3 - Geekbench 3 32 Bit Multi-Core
min: 10893     avg: 12606     median: 12742 (23%)     max: 13553 Points
min: 6297     avg: 6584     median: 6480.5 (12%)     max: 6932 Points
Geekbench 3 - Geekbench 3 32 Bit Single-Core
min: 3148     avg: 3302     median: 3242 (63%)     max: 3503 Points
min: 2812     avg: 2983     median: 2906 (57%)     max: 3209 Points
Geekbench 3 - Geekbench 3 64 Bit Multi-Core
min: 14363     avg: 14408     median: 14407.5 (23%)     max: 14452 Points
min: 6695     avg: 6772     median: 6772 (11%)     max: 6849 Points
Geekbench 3 - Geekbench 3 64 Bit Single-Core
min: 3759     avg: 3829     median: 3828.5 (57%)     max: 3898 Points
min: 3037     avg: 3144     median: 3143.5 (47%)     max: 3250 Points
PassMark PerformanceTest 9 - PerformanceTest 9.0 CPU Mark
4907 Points (26%)
Mozilla Kraken 1.1 - Kraken 1.1 Total Score *
min: 986     avg: 1221     median: 1259 (1%)     max: 1532 ms
min: 1109     avg: 1211     median: 1196 (1%)     max: 1542 ms
Sunspider - Sunspider 1.0 Total Score *
min: 74.8     avg: 107.9     median: 91 (1%)     max: 265.6 ms
min: 77.7     avg: 124.3     median: 86.3 (1%)     max: 826 ms
Octane V2 - Octane V2 Total Score
min: 22772     avg: 30123     median: 29871 (27%)     max: 35817 Points
min: 21890     avg: 29883     median: 30957 (28%)     max: 32838 Points
WebXPRT 3 - WebXPRT 3 Score
min: 163     avg: 169.5     median: 167.5 (35%)     max: 180 Points
CrossMark - CrossMark Overall
768 Points (29%)
Power Consumption - Prime95 Power Consumption - external Monitor *
min: 25.9     avg: 27.9     median: 28.3 (5%)     max: 29.3 Watt
26.8 Watt (5%)
Power Consumption - Cinebench R15 Multi Power Consumption - external Monitor *
min: 27.7     avg: 29.5     median: 29.8 (5%)     max: 30.8 Watt
25.5 Watt (5%)
Power Consumption - Cinebench R15 Multi Power Efficiency - external Monitor
min: 16.8     avg: 18.1     median: 18.4 (14%)     max: 18.8 Points per Watt
12.8 Points per Watt (10%)

Average Benchmarks Intel Core i5-8250U → 100% n=19

Average Benchmarks Intel Core i5-7200U → 79% n=19

Average Benchmarks AMD A10-9620P → 59% n=19

- Range of benchmark values for this graphics card
- Average benchmark values for this graphics card
* Smaller numbers mean a higher performance
1 This benchmark is not used for the average calculation

v1.26
log 27. 01:46:01

#0 checking url part for id 9206 +0s ... 0s

#1 checking url part for id 8152 +0s ... 0s

#2 checking url part for id 9188 +0s ... 0s

#3 not redirecting to Ajax server +0s ... 0s

#4 did not recreate cache, as it is less than 5 days old! Created at Thu, 25 Apr 2024 05:38:32 +0200 +0.001s ... 0.001s

#5 composed specs +0.047s ... 0.048s

#6 did output specs +0s ... 0.048s

#7 getting avg benchmarks for device 9206 +0.022s ... 0.07s

#8 got single benchmarks 9206 +0.485s ... 0.555s

#9 getting avg benchmarks for device 8152 +0.004s ... 0.559s

#10 got single benchmarks 8152 +0.419s ... 0.978s

#11 getting avg benchmarks for device 9188 +0.003s ... 0.981s

#12 got single benchmarks 9188 +0.011s ... 0.992s

#13 got avg benchmarks for devices +0s ... 0.992s

#14 min, max, avg, median took s +0.579s ... 1.571s

#15 return log +0s ... 1.571s

Please share our article, every link counts!
> Expert Reviews and News on Laptops, Smartphones and Tech Innovations > Benchmarks / Tech > Processor Comparison - Head 2 Head
Redaktion, 2017-09- 8 (Update: 2023-07- 1)