Lenovo ThinkPad X1 Yoga 2017 20JD0015US (i5-7200U, FHD) Convertible Review

A little over a month ago, we posted our comprehensive review of Lenovo’s ThinkPad X1 Yoga 2017. The model we reviewed boasted some seriously high-end specs: a Core i7 CPU, 16 GB of RAM, 1 TB NVMe SSD, and—last but certainly not least—an extremely high-quality WQHD OLED display. Naturally, alongside these mind-boggling specifications came an equally shocking price: somewhere around $3,700 to be exact, which surely positions the configuration outside the realm of possibility for most consumers.
Today, we’ve got a much more affordable and practically-appointed configuration, starting with a (still capable) Intel Core i5-7200U CPU, 8 GB of dual-channel memory, a 1080p multi-touch display, and a 256 GB NVMe SSD. The price is still not cheap, but at around $2,267, it’s at least attainable for the average business user. How does today’s review candidate stack up against our previous top-end configuration—as well as the rest of the competitors? We’ll take a detailed look today in our review.
Please Note: We will be skipping or truncating the earlier sections accordingly today since we’ve just covered them extensively in our previous review. For much more information on the case design, connectivity, ports, and other such items, please reference that article.
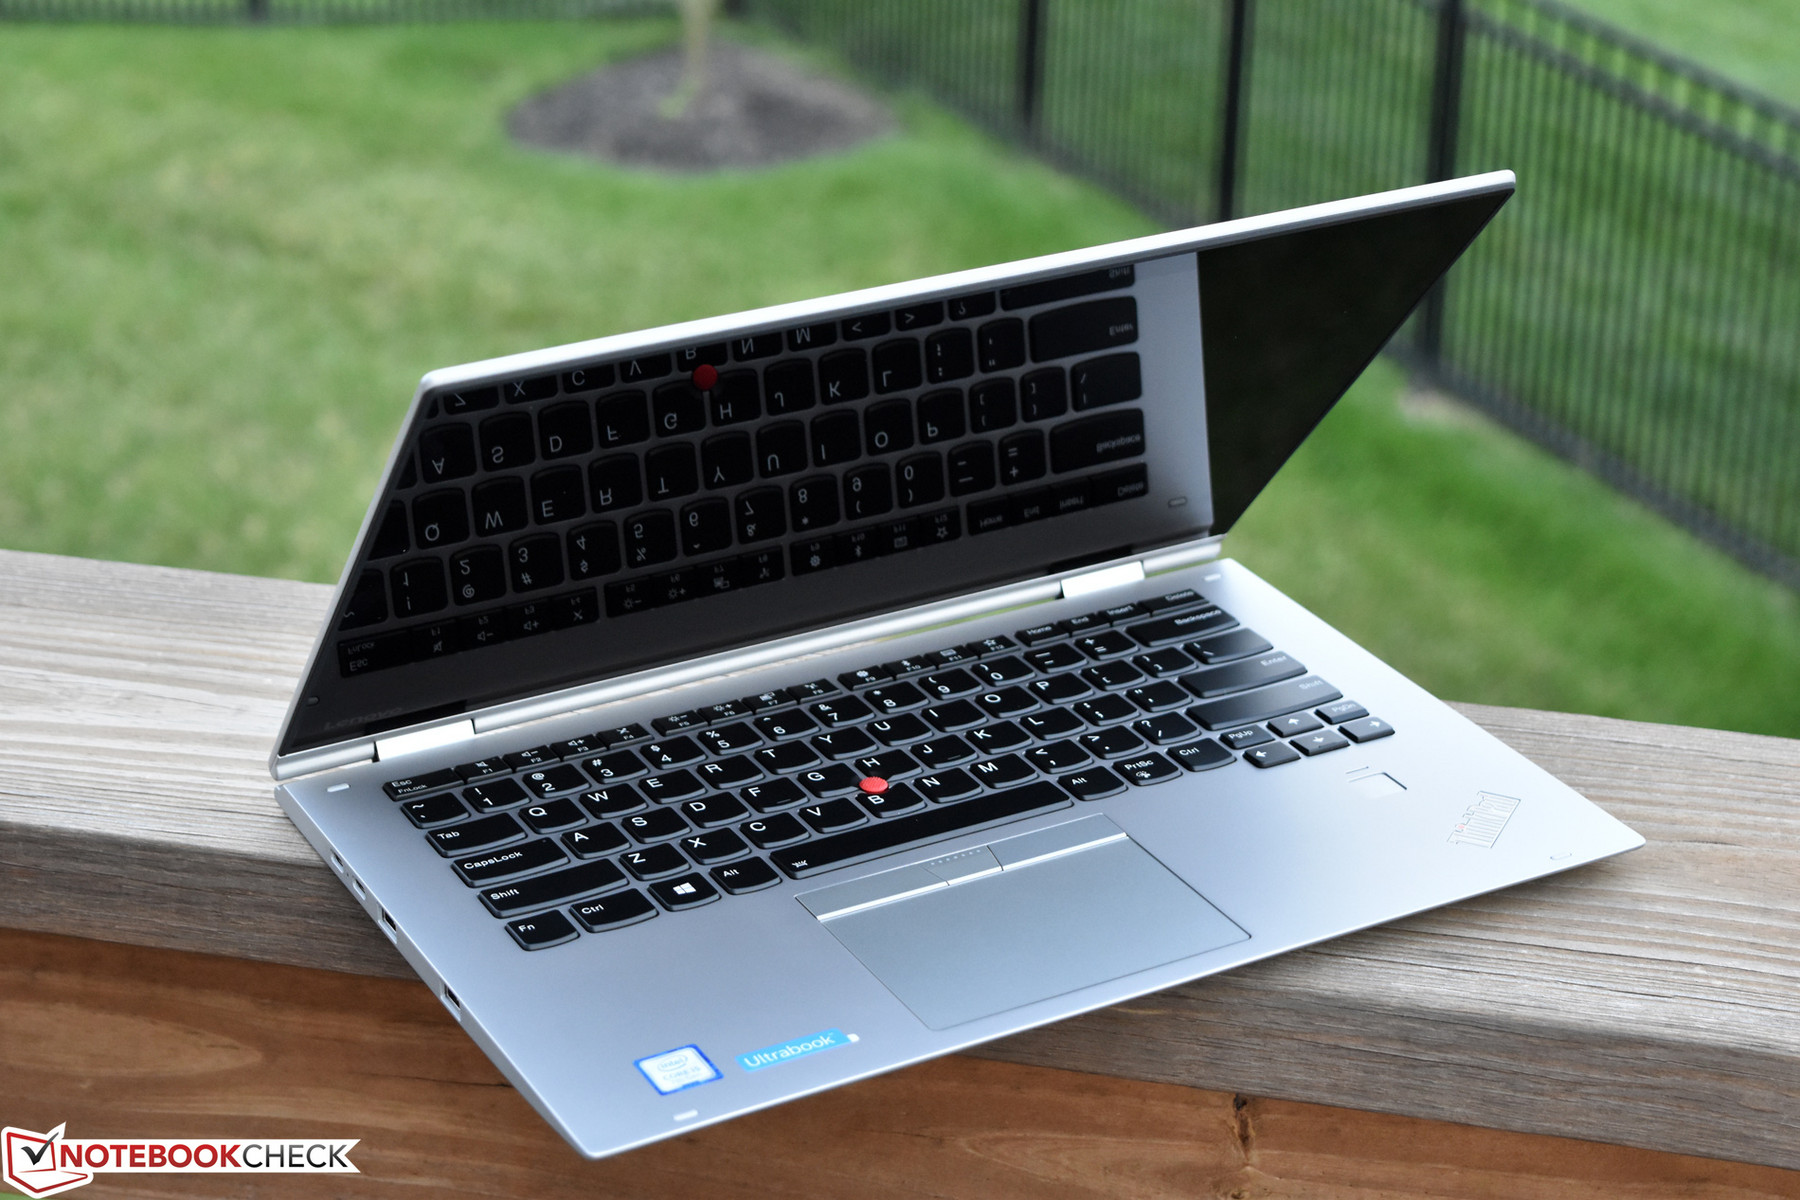
Case
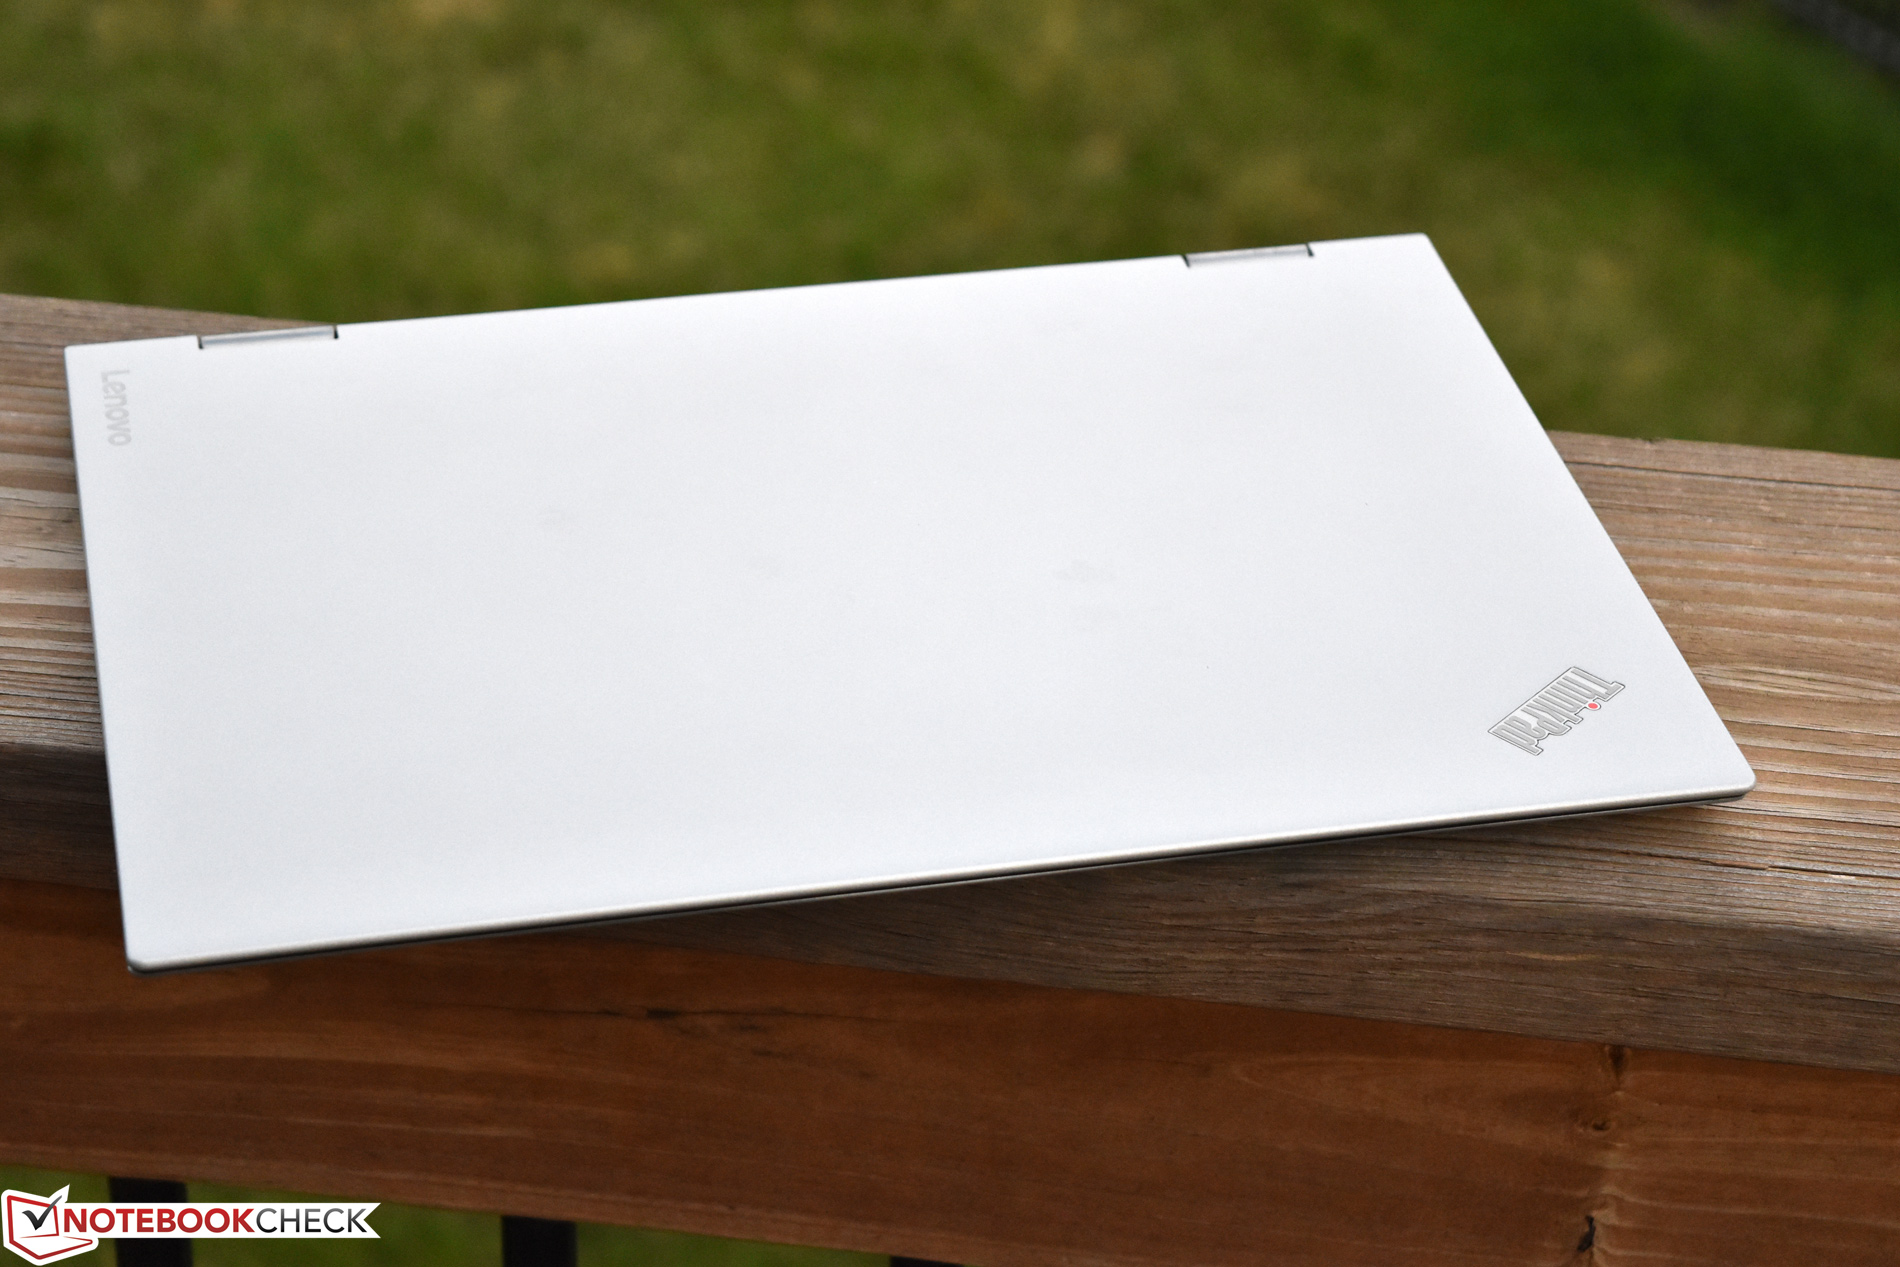
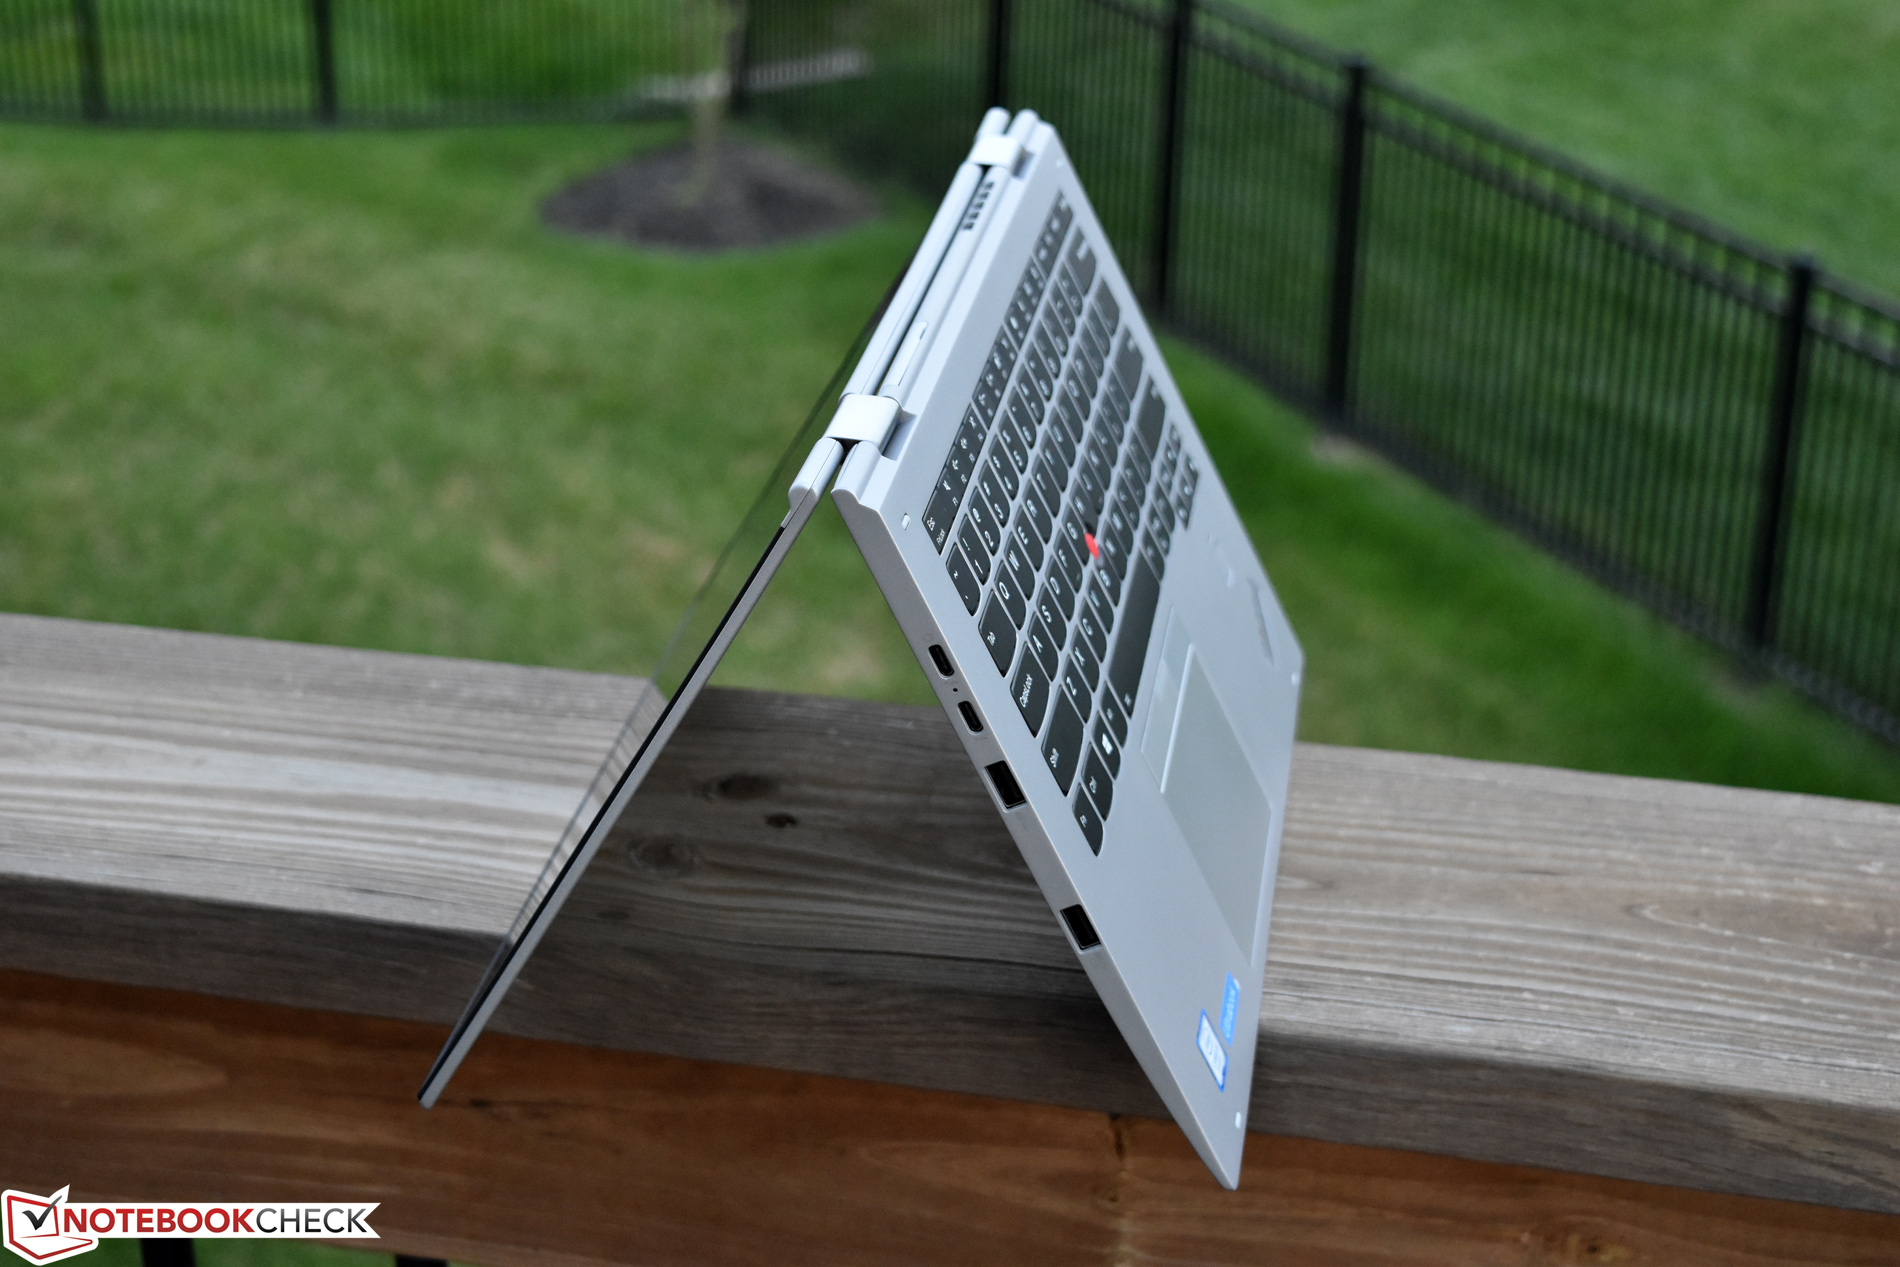
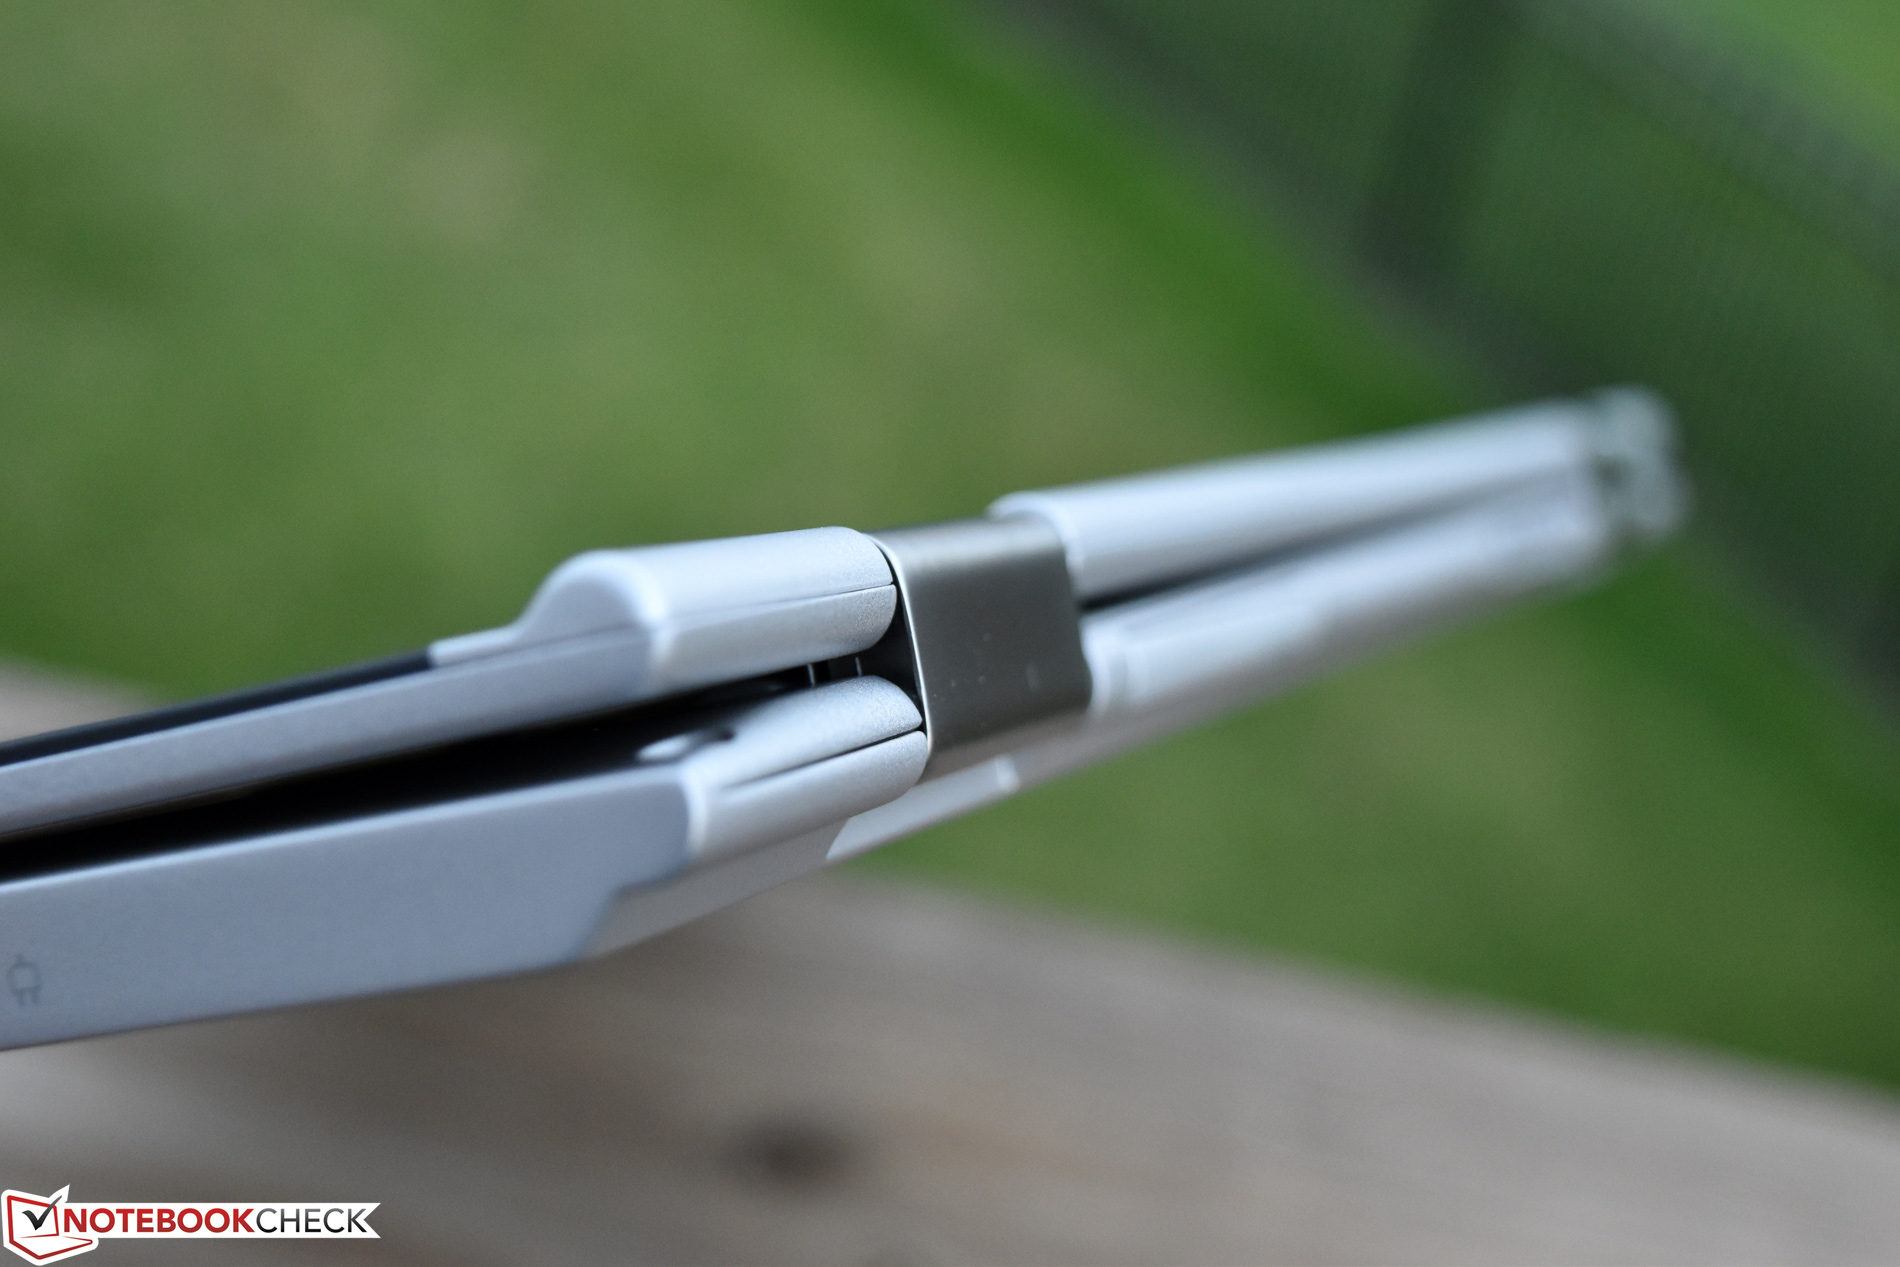
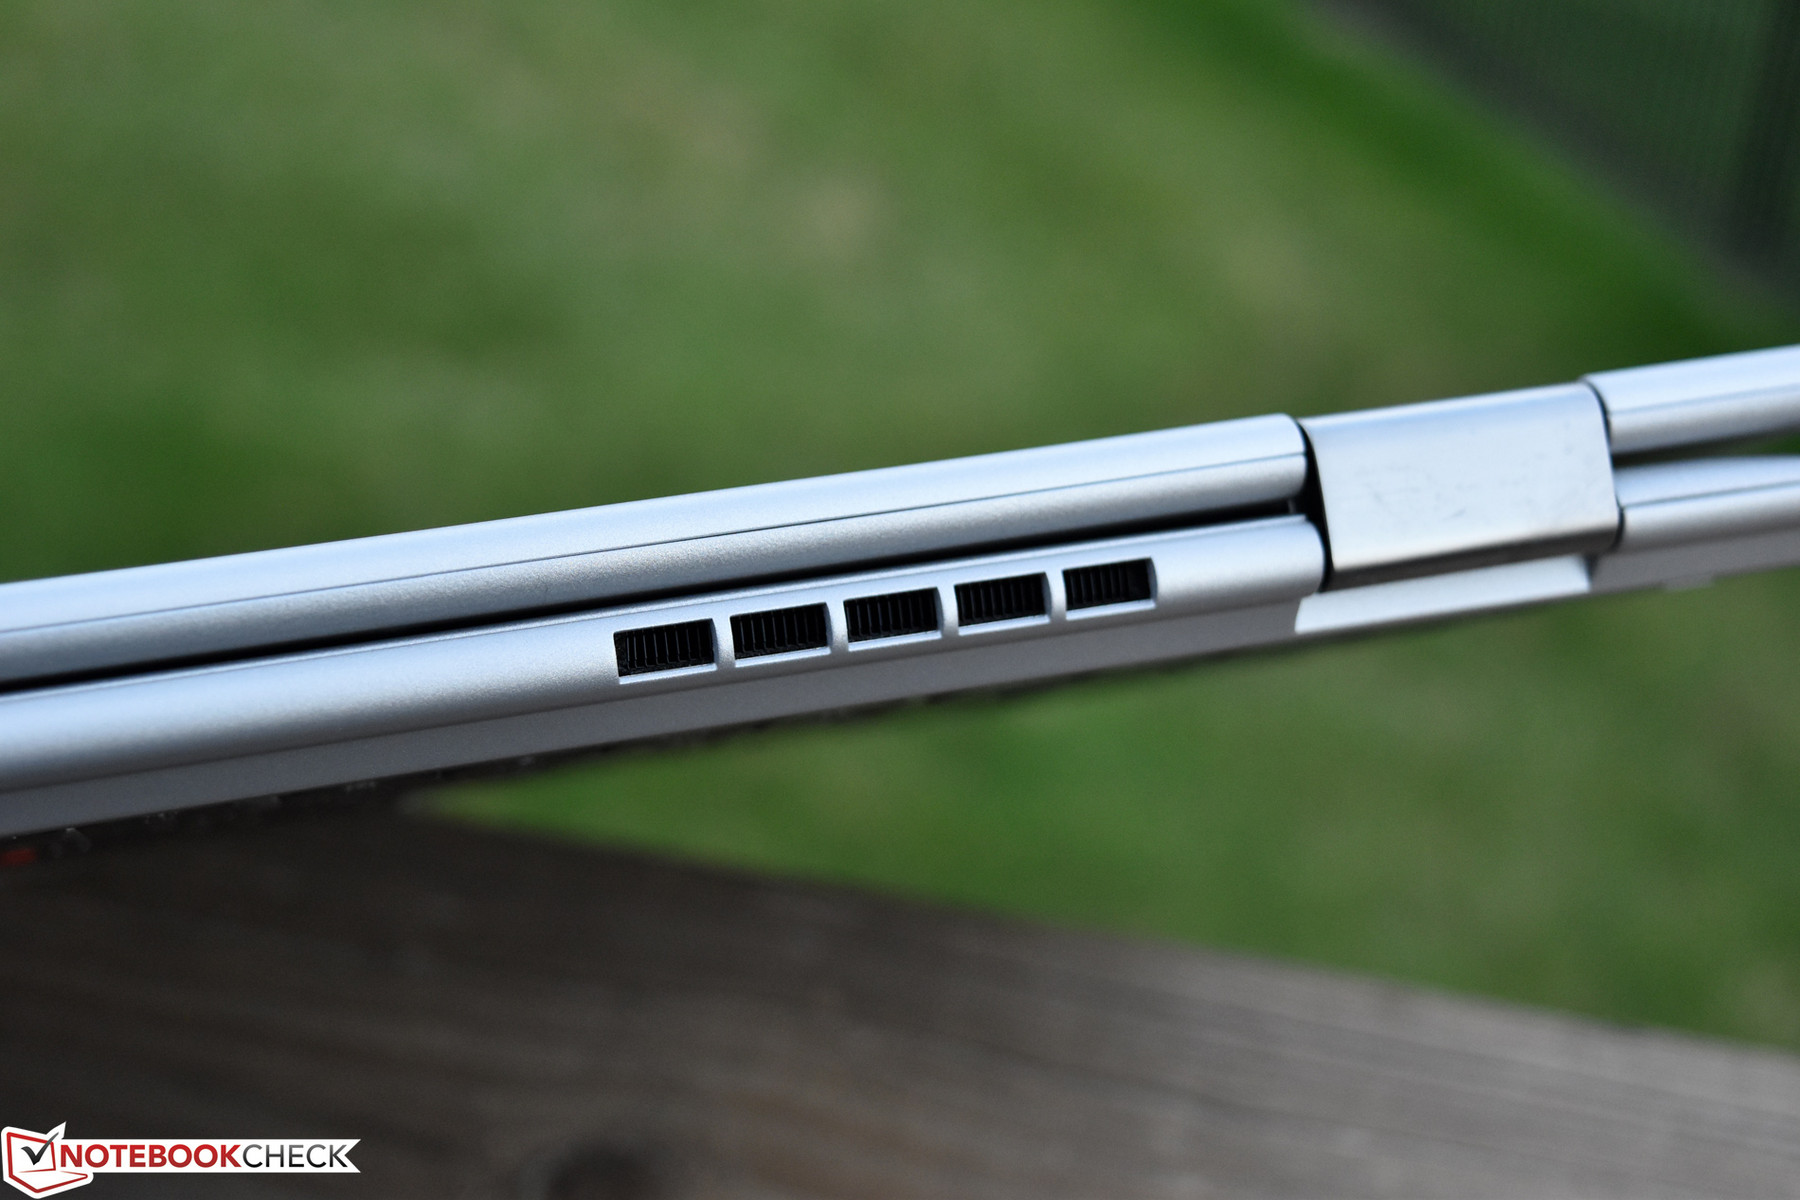
The only major difference between the case of the previous X1 Yoga we reviewed and today’s unit is the color; while the former unit was classic ThinkPad black, today’s is silver. It’s attractive without a doubt, and functionally, one other benefit which many people may not initially consider is that it happens to absorb less heat from sunlight—so if outdoor use is a common occurrence, it might actually make sense to choose the silver color simply thanks to that. Otherwise, everything is identical, including the construction materials, hinge design and tuning, and so on. Again, please see our previous review for much more information on these items.


Communication
The WLAN adapter (Intel Dual Band Wireless-AC 8265) is as that of our previous ThinkPad X1 Yoga review unit, but we retested the performance just for sake of thoroughness. Throughput is nearly identical to that of the previous device, with very good transfer rates of 623 Mb/s and 495 Mb/s receive/transmit, respectively.
Input Devices
Keyboard
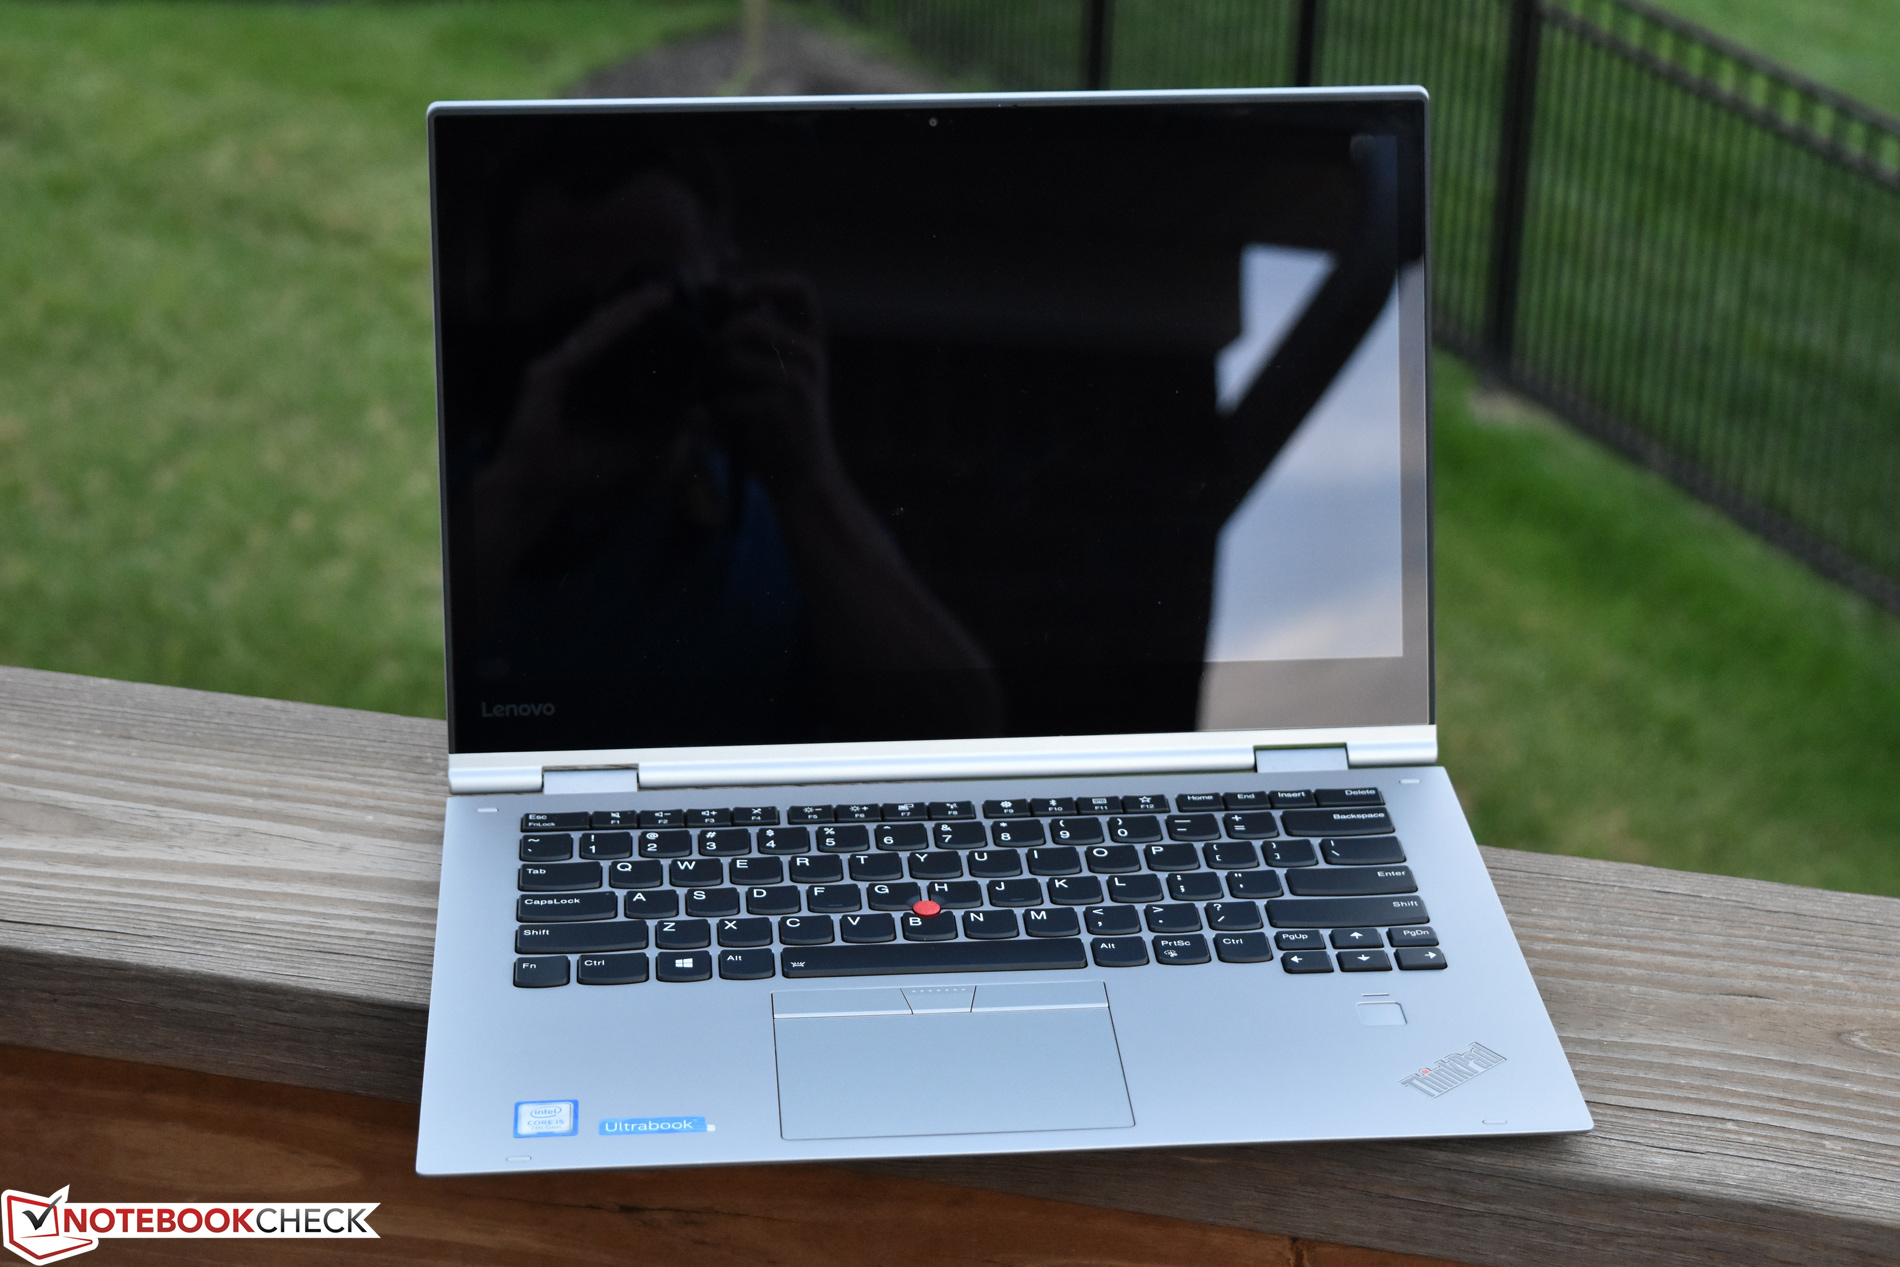
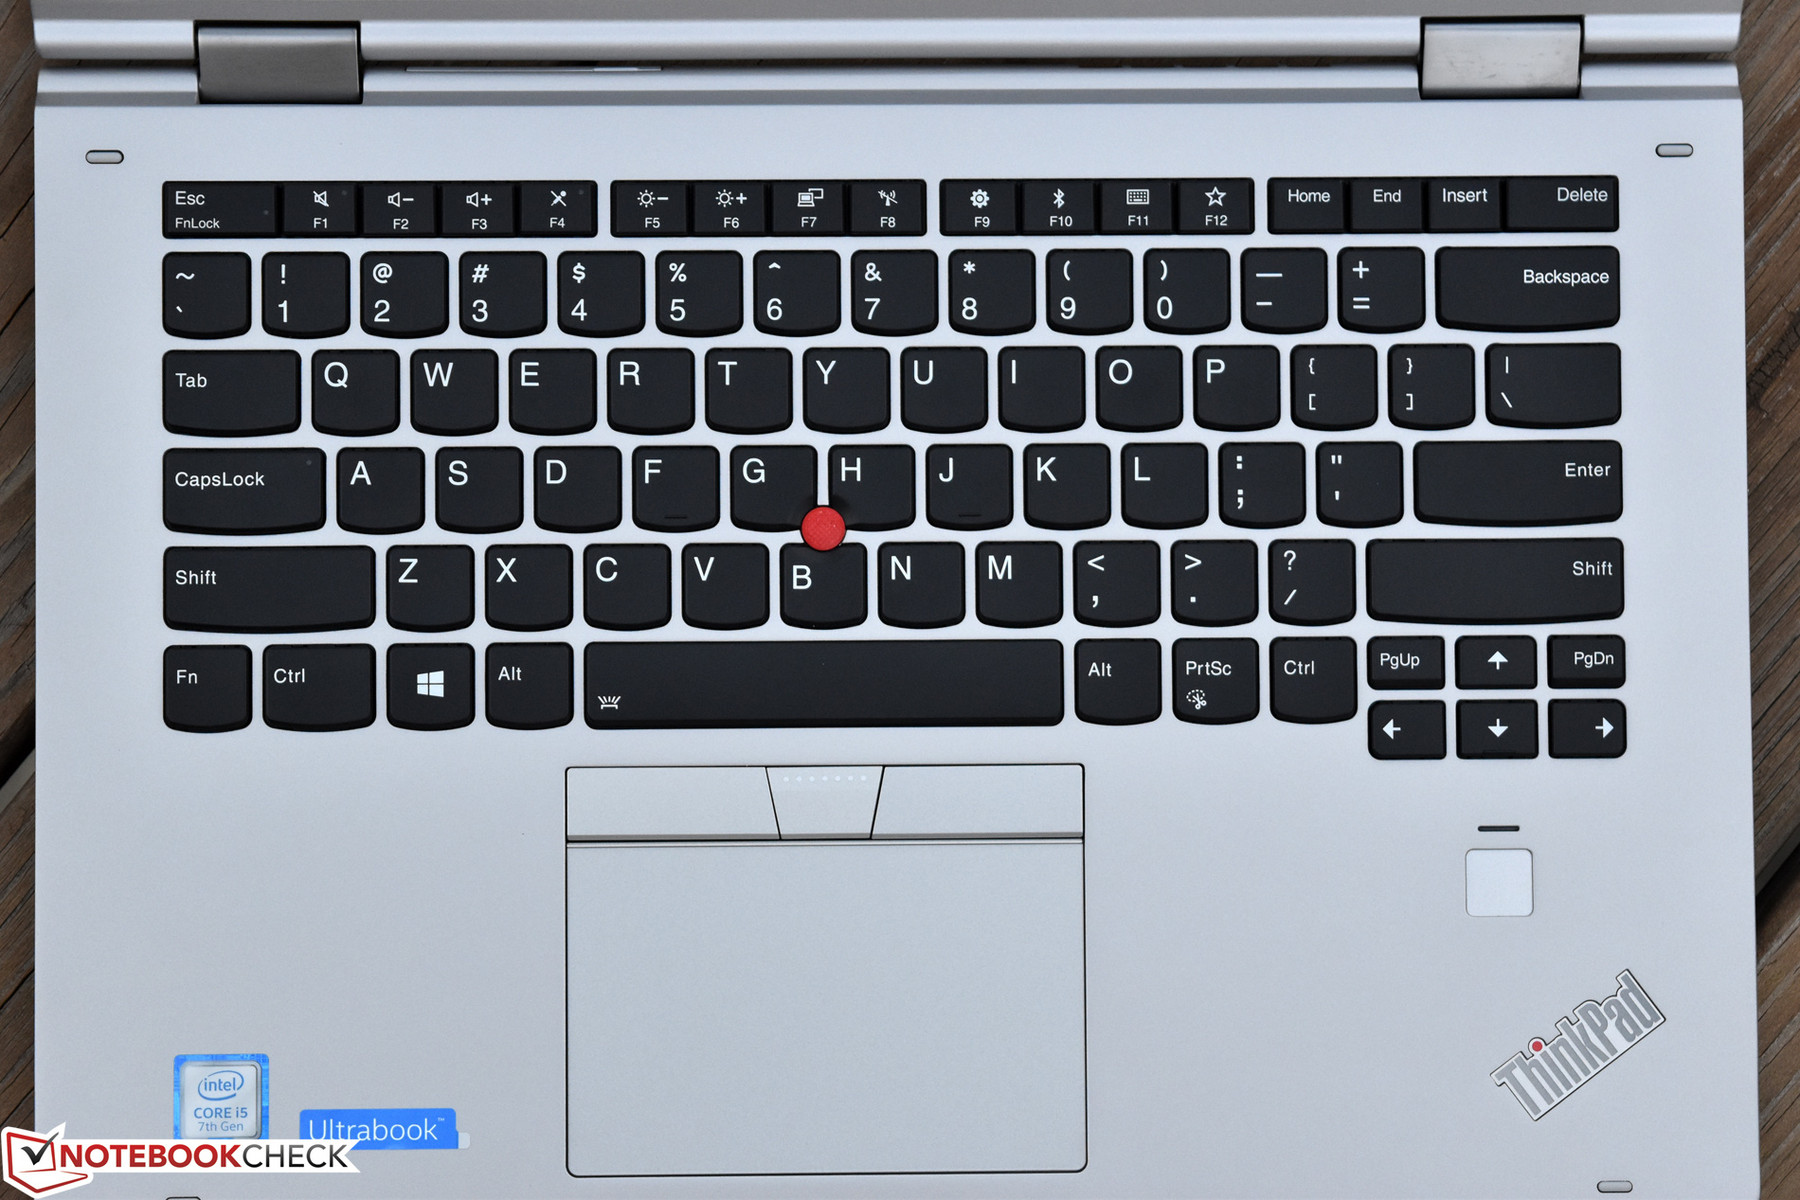
As before, the Lift’n’Lock keyboard design is still in play in our review unit here, and it works well, though we once again did detect a slight bit of clattering while operating in laptop mode. In spite of the case color change, the keyboard color has not changed, so key visibility is not affected.
Touchpad and Touchscreen
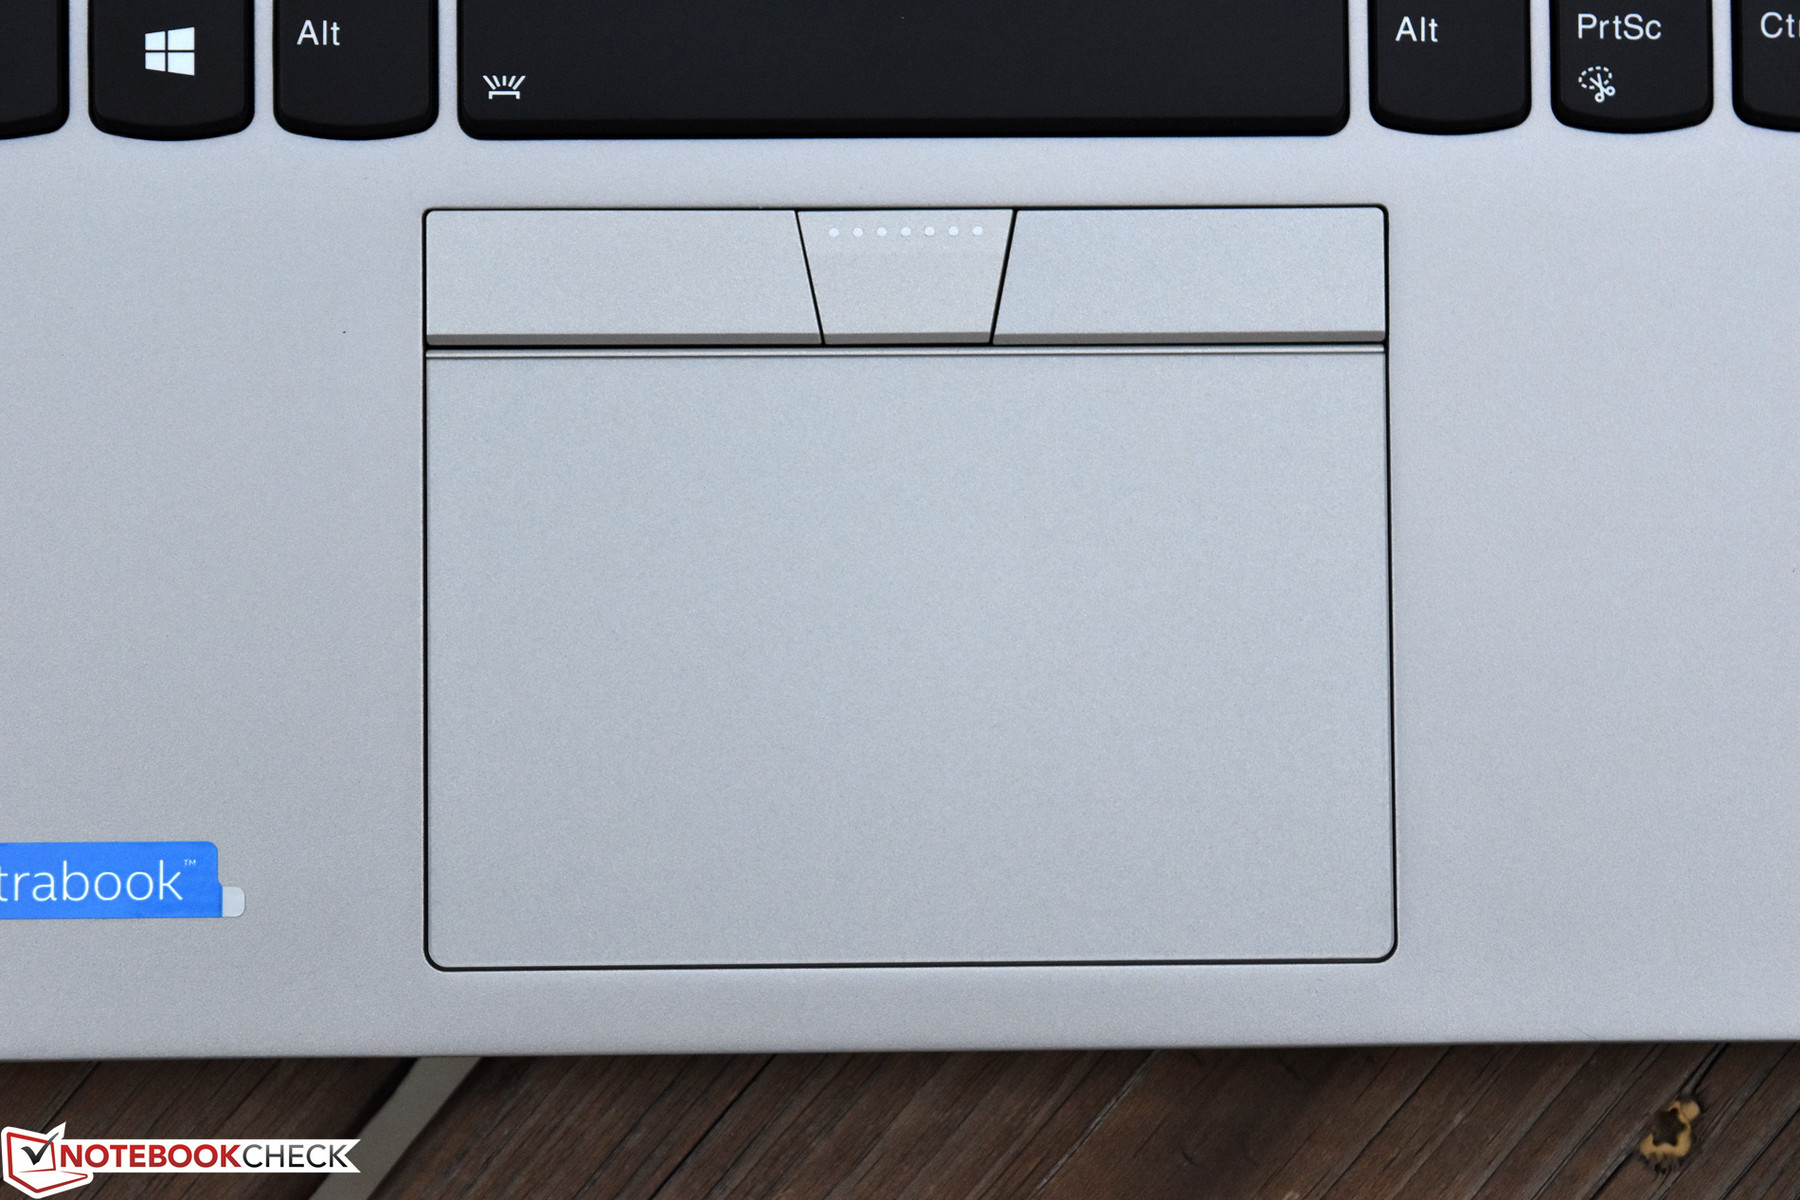
The touchpad and touchscreen also remain the same, which is to say, both work well. The touchpad is still one of the best clickpads we’ve had the pleasure of using in recent memory.
Display
Apart from case color, the first major difference between last month’s review model and today’s unit is the choice of display. Whereas the previous unit featured a WQHD OLED touchscreen, this one packs a mere FHD (1920x1080) IPS display. Both displays (in fact, all display options for the ThinkPad X1 Yoga) are glossy, but fortunately, even ours today—in spite of its obvious inferiority as compared to the WQHD OLED option in terms of resolution and contrast—remains apparently very good indeed for an IPS panel. Besides, in terms of resolution, the PPI of 157 is at least still fine by most standards.
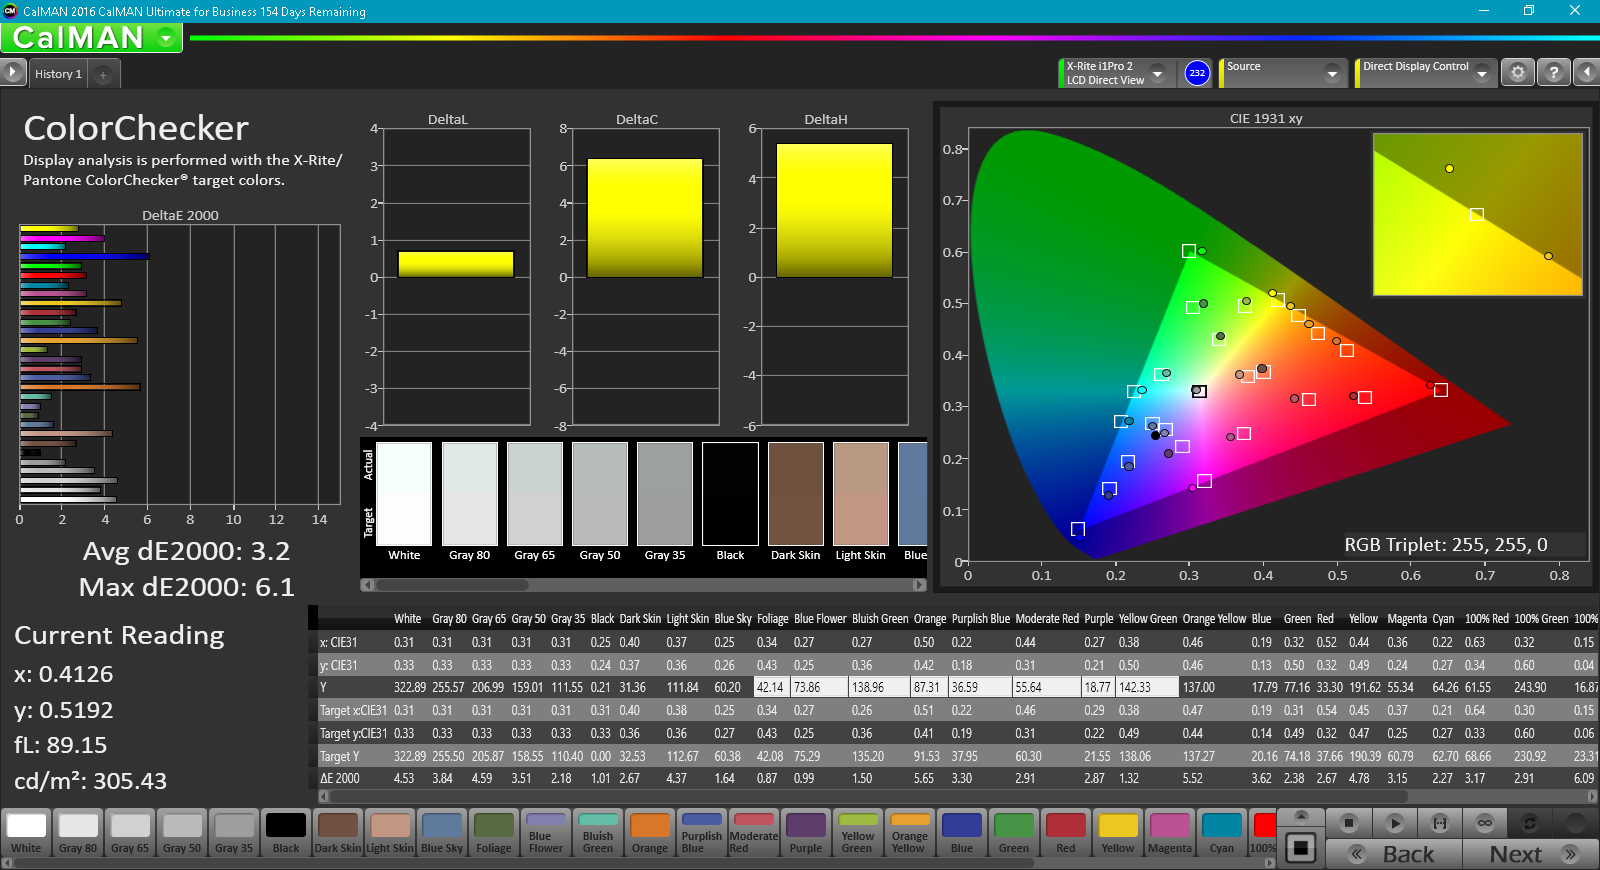
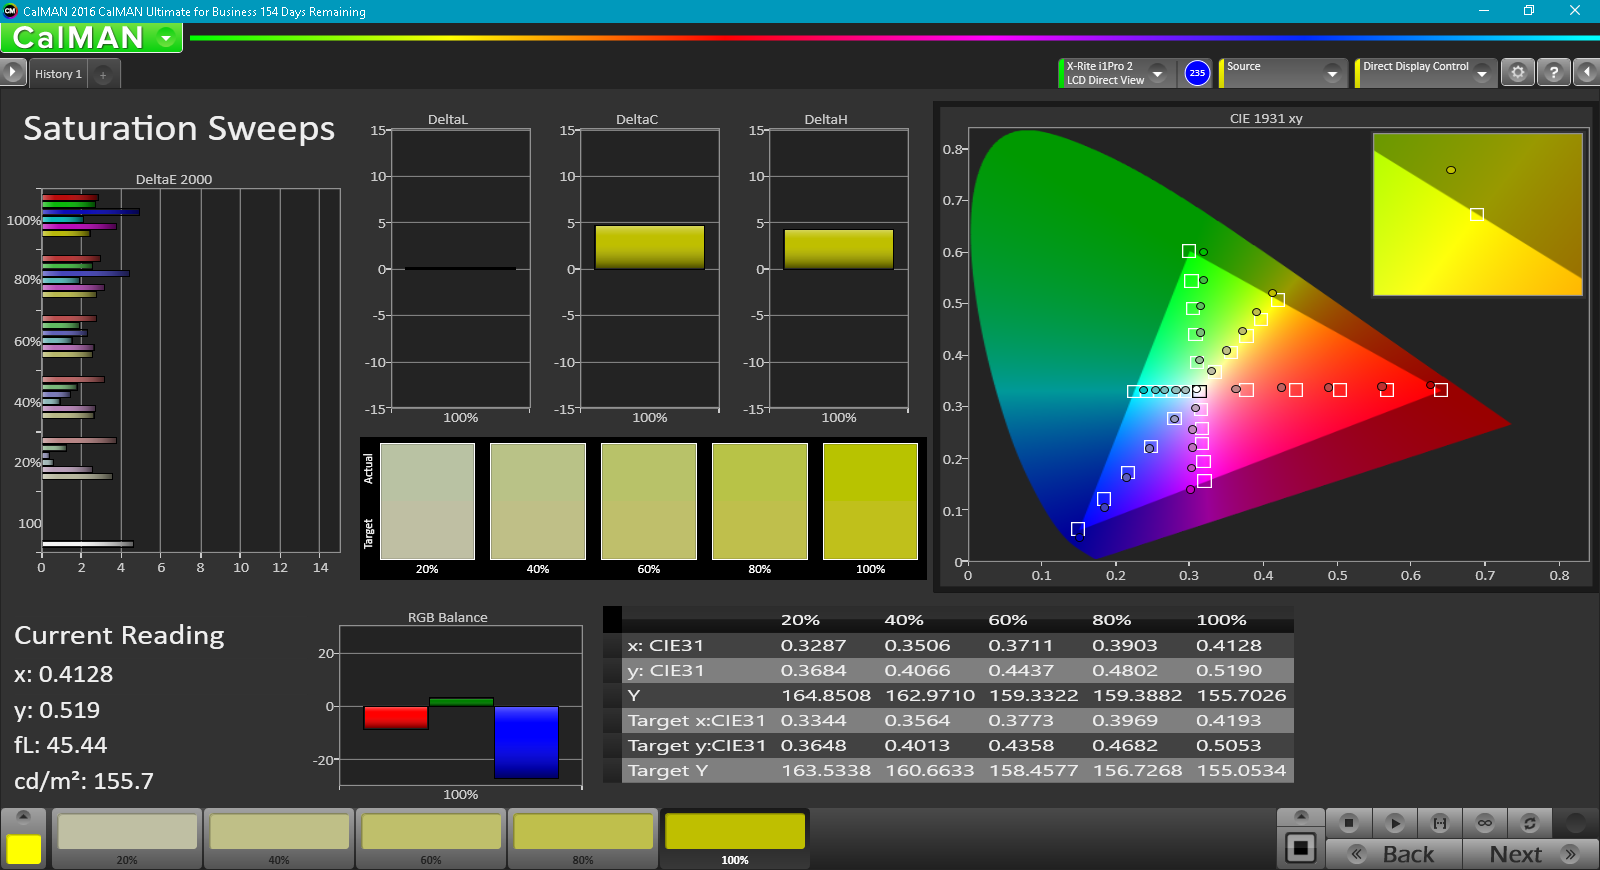
Subjectively speaking, brightness is good and contrast seems strong. However, the first notable discrepancy (apart from obviously resolution) is that of color saturation, a category in which the screen on our review unit today seems to lack.
| |||||||||||||||||||||||||
Brightness Distribution: 83 %
Center on Battery: 336.5 cd/m²
Contrast: 1346:1 (Black: 0.25 cd/m²)
ΔE ColorChecker Calman: 4 | ∀{0.5-29.43 Ø4.71}
ΔE Greyscale Calman: 2.9 | ∀{0.09-98 Ø4.96}
58.8% sRGB (Argyll 1.6.3 3D)
37.4% AdobeRGB 1998 (Argyll 1.6.3 3D)
58.9% AdobeRGB 1998 (Argyll 3D)
84.4% sRGB (Argyll 3D)
57.9% Display P3 (Argyll 3D)
Gamma: 2.22
CCT: 6487 K
| Lenovo ThinkPad X1 Yoga 2017 20JD0015US B140HAN03.6, IPS, 14", 1920x1080 | Lenovo ThinkPad X1 Yoga 2017 20JES03T00 LEN4140, OLED, 14", 2560x1440 | Dell Latitude 12 5285 2-in-1 BOE06DC, IPS, 12.3", 1920x1280 | Toshiba Portege X20W-D-10R Toshiba TOS508F, IPS, 12.5", 1920x1080 | HP EliteBook x360 1030 G2 CMN1374, IPS, 13.3", 1920x1080 | |
|---|---|---|---|---|---|
| Display | 10% | 18% | 9% | ||
| Display P3 Coverage (%) | 57.9 | 62.8 8% | 68.7 19% | 65.5 13% | |
| sRGB Coverage (%) | 84.4 | 94 11% | 96.8 15% | 88.8 5% | |
| AdobeRGB 1998 Coverage (%) | 58.9 | 64.7 10% | 70.4 20% | 64.9 10% | |
| Response Times | 91% | 4% | -36% | -4% | |
| Response Time Grey 50% / Grey 80% * (ms) | 45.6 ? | 3.6 ? 92% | 42.4 ? 7% | 67 ? -47% | 55.2 ? -21% |
| Response Time Black / White * (ms) | 31.2 ? | 3.2 ? 90% | 30.8 ? 1% | 39 ? -25% | 27.2 ? 13% |
| PWM Frequency (Hz) | 240.4 ? | 210.1 ? | |||
| Screen | 8% | 7% | -2% | -14% | |
| Brightness middle (cd/m²) | 336.5 | 243 -28% | 523.2 55% | 442 31% | 262 -22% |
| Brightness (cd/m²) | 305 | 240 -21% | 522 71% | 410 34% | 256 -16% |
| Brightness Distribution (%) | 83 | 95 14% | 88 6% | 86 4% | 83 0% |
| Black Level * (cd/m²) | 0.25 | 0.42 -68% | 0.22 12% | 0.25 -0% | |
| Contrast (:1) | 1346 | 1246 -7% | 2009 49% | 1048 -22% | |
| Colorchecker dE 2000 * | 4 | 5.3 -33% | 4 -0% | 5.22 -31% | 5.13 -28% |
| Colorchecker dE 2000 max. * | 6.5 | 8.9 -37% | 8.6 -32% | 11.84 -82% | 9.46 -46% |
| Greyscale dE 2000 * | 2.9 | 3.7 -28% | 5.5 -90% | 7.88 -172% | 6.23 -115% |
| Gamma | 2.22 99% | 1.78 124% | 2.16 102% | 2.51 88% | 2.45 90% |
| CCT | 6487 100% | 6202 105% | 7546 86% | 6756 96% | 6413 101% |
| Color Space (Percent of AdobeRGB 1998) (%) | 37.4 | 84.8 127% | 64.86 73% | 64 71% | 57.84 55% |
| Color Space (Percent of sRGB) (%) | 58.8 | 100 70% | 93.97 60% | 97 65% | 88.57 51% |
| Total Average (Program / Settings) | 50% /
25% | 7% /
7% | -7% /
-2% | -3% /
-8% |
* ... smaller is better
We measured an average brightness of 305 cd/m² (with a maximum of 336.5 cd/m²)—perfectly adequate for most purposes, though the glossy screen finish does inherently demand a higher compensatory brightness to help offset the inevitable reflections. Brightness distribution of 83% could be better, but as is typically the case, illumination inconsistencies are difficult to notice in practice. There was no conspicuous backlight bleed on our particular review unit. Contrast, meanwhile, remains very high (though, of course, lower than the infinite value from our OLED candidate) at 1346:1, thanks to a black level of 0.25 cd/m².
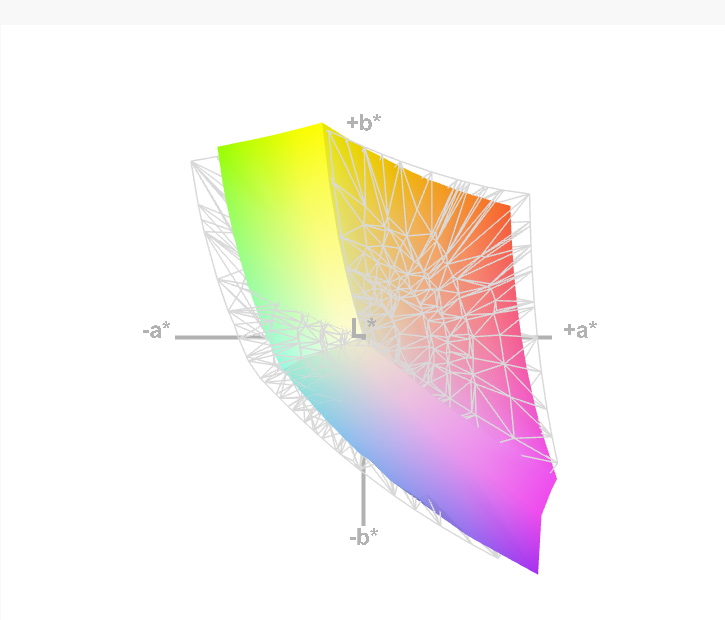
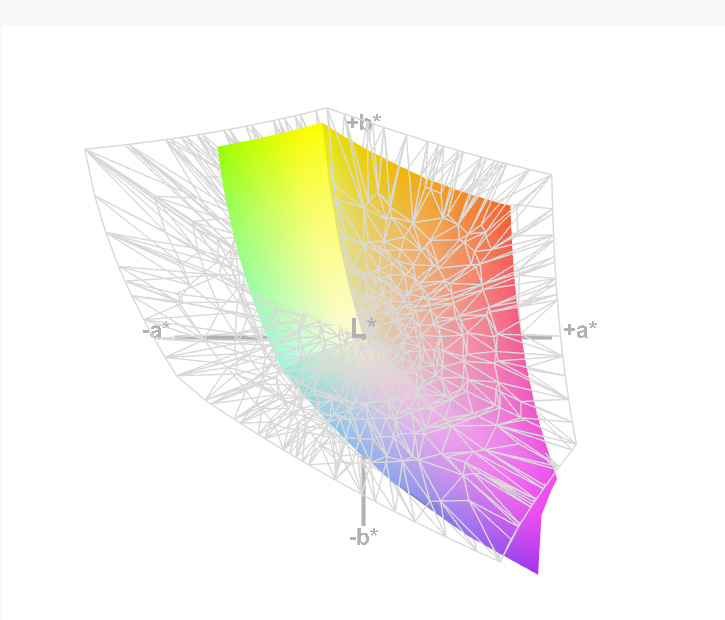
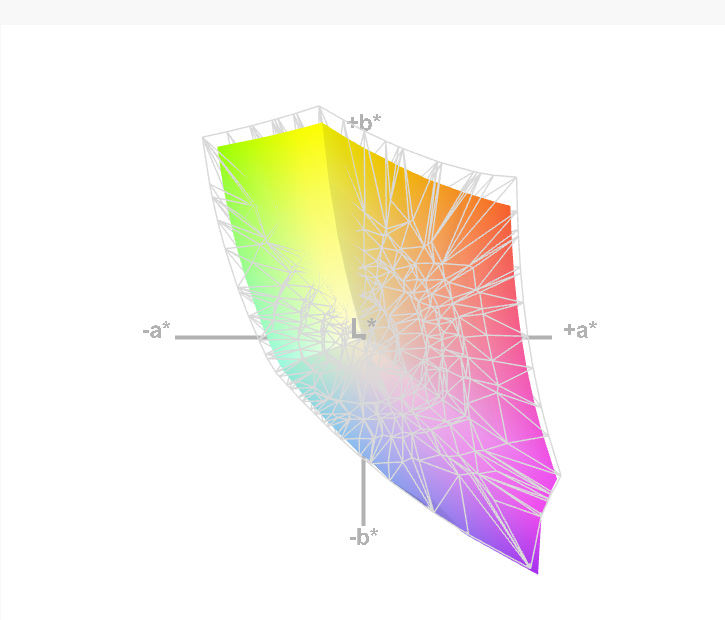
We mentioned the apparent lack of saturation earlier in our subjective impressions, and that observation is borne out in the form of our color coverage analysis, where the ThinkPad X1 Yoga FHD IPS panel manages a paltry 58.8% of sRGB and 37.4% of AdobeRGB—far below that of the OLED panel’s 100%/84.8%, and well below even the rest of today’s comparison field. This is consequently not the panel to select if you intend to do any serious photo editing or graphic design work.

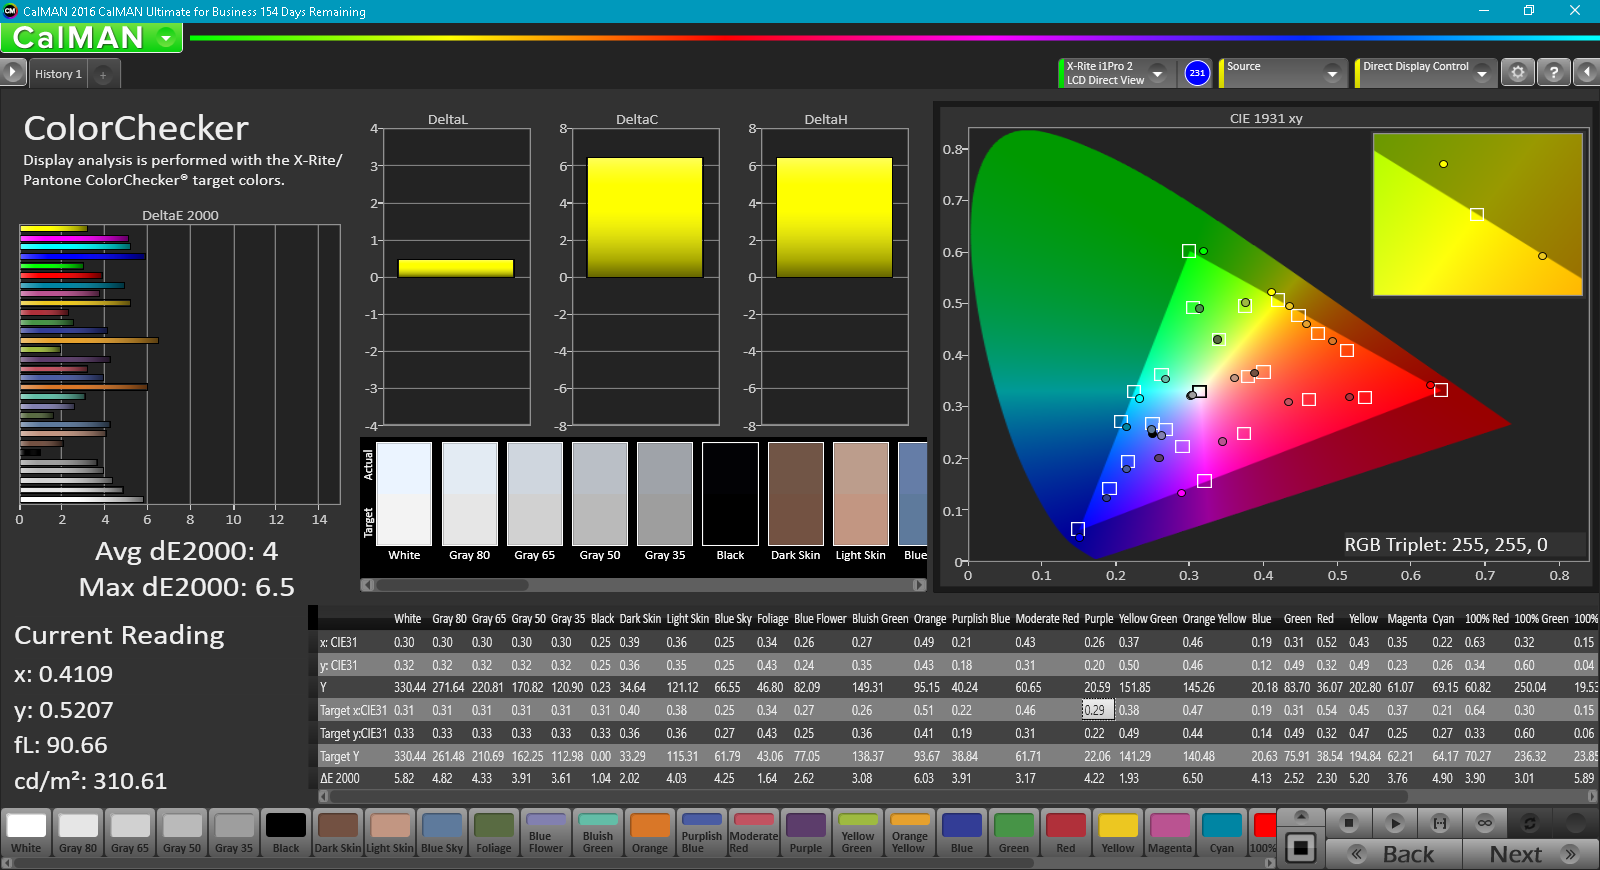
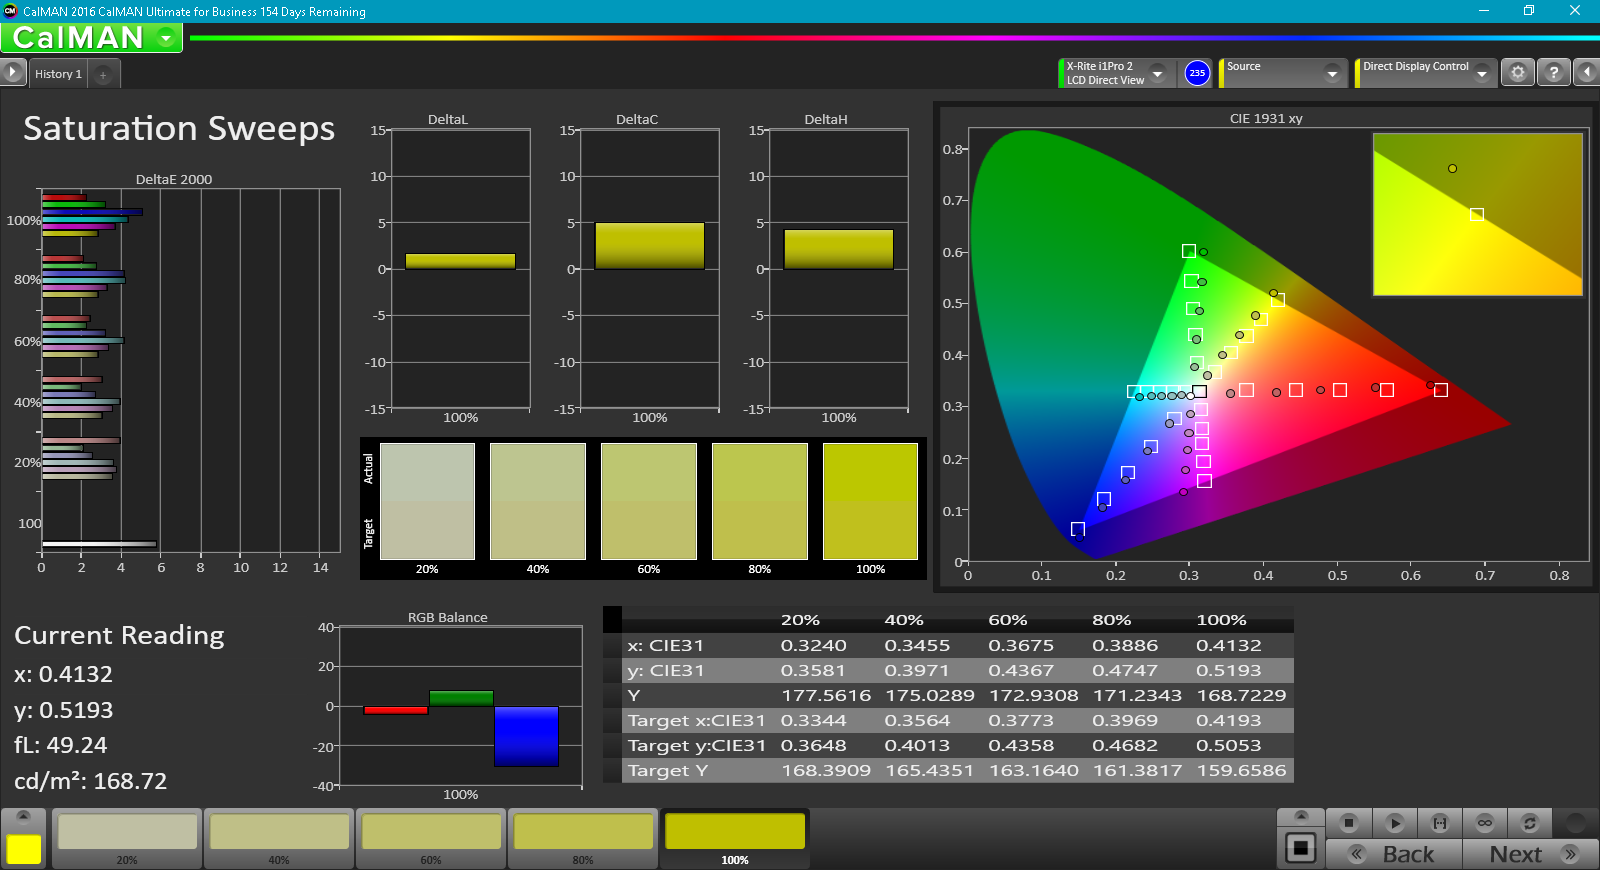
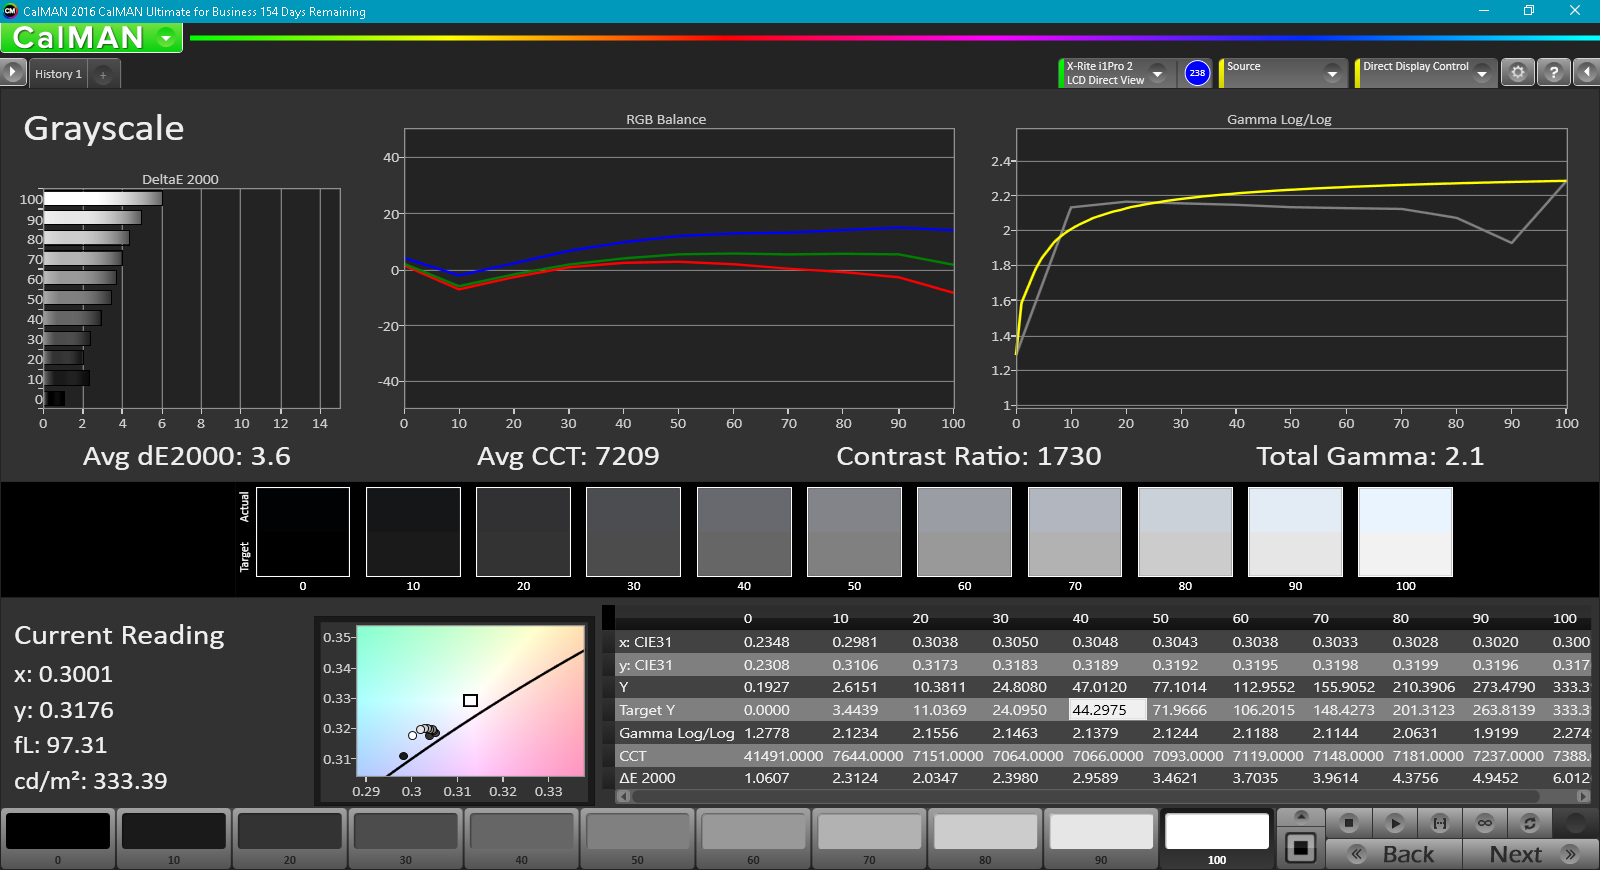
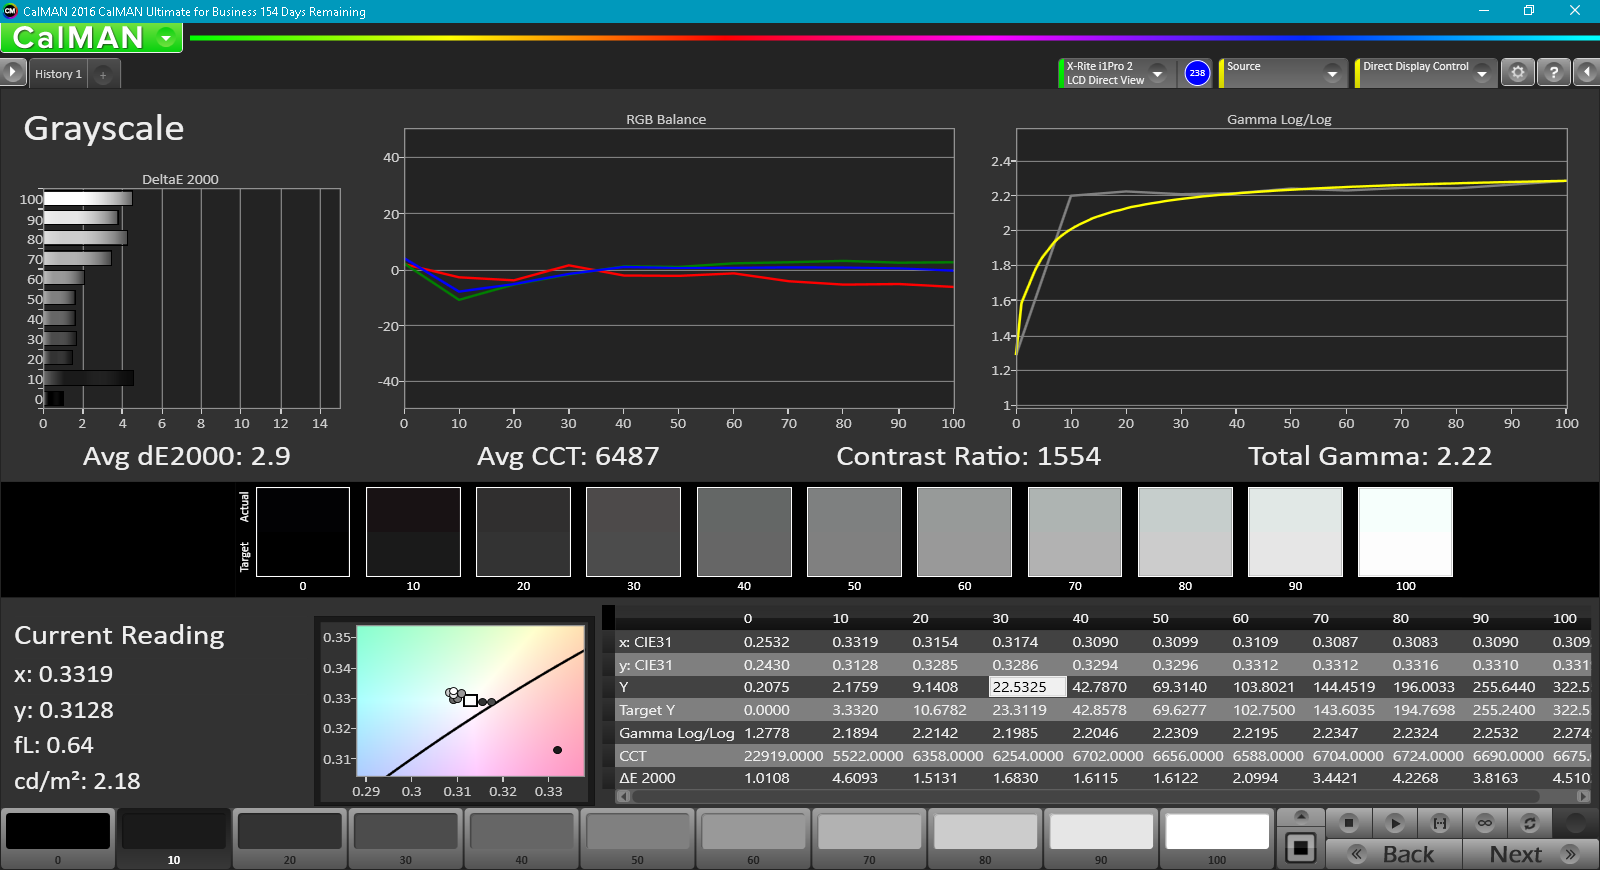
Measurements from CalMAN are much more positive; we recorded DeltaE2000 values of 4 and 2.9 (ideal: 0) in ColorChecker and Greyscale respectively, as well as a Total Gamma of 2.2 (ideal: 2.4) and CCT Average of 6487K (ideal: 6500K), all of which are quite good for precalibration results.
Display Response Times
| ↔ Response Time Black to White | ||
|---|---|---|
| 31.2 ms ... rise ↗ and fall ↘ combined | ↗ 18 ms rise | 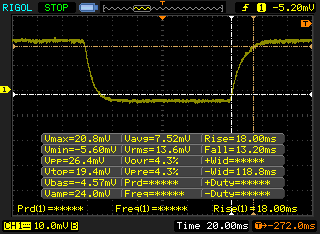 |
| ↘ 13.2 ms fall | ||
| The screen shows slow response rates in our tests and will be unsatisfactory for gamers. In comparison, all tested devices range from 0.1 (minimum) to 240 (maximum) ms. » 84 % of all devices are better. This means that the measured response time is worse than the average of all tested devices (19.8 ms). | ||
| ↔ Response Time 50% Grey to 80% Grey | ||
| 45.6 ms ... rise ↗ and fall ↘ combined | ↗ 22.4 ms rise | 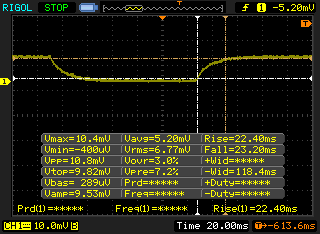 |
| ↘ 23.2 ms fall | ||
| The screen shows slow response rates in our tests and will be unsatisfactory for gamers. In comparison, all tested devices range from 0.165 (minimum) to 636 (maximum) ms. » 78 % of all devices are better. This means that the measured response time is worse than the average of all tested devices (30.9 ms). | ||
Screen Flickering / PWM (Pulse-Width Modulation)
| Screen flickering / PWM not detected | 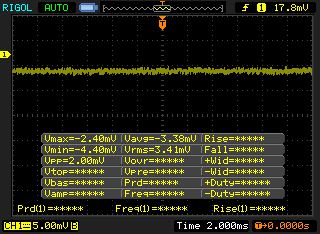 | ||
In comparison: 52 % of all tested devices do not use PWM to dim the display. If PWM was detected, an average of 7741 (minimum: 5 - maximum: 343500) Hz was measured. | |||
We did not detect any PWM from our review unit. The OLED panel, meanwhile, did employ low-frequency PWM for dimming, so that's an important consideration in terms of panel choice for those sensitive to the flickering to make during purchasing.
Outdoors, the display struggles in the sunlight because of its glossy finish; it’s practically unusable. However, in the shade, when positioned properly, the brightness and contrast are more than sufficient to support comfortable usage. Viewing angles are very good, as is expected of an IPS panel.
Performance
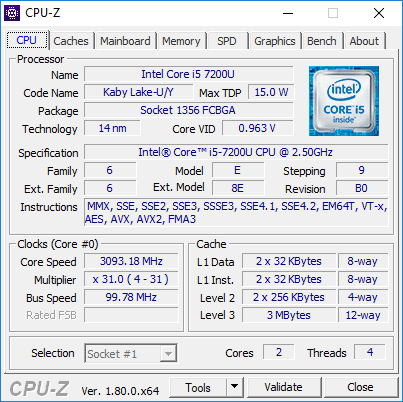
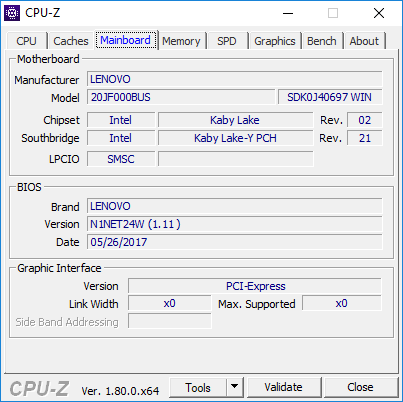
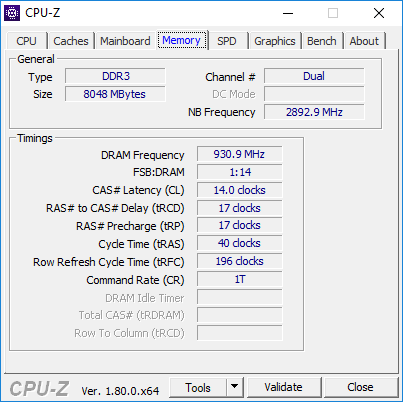
Processor options for the ThinkPad X1 Yoga range from the Core i5-7200U up to the Core i7-7600U; the former is the CPU we received in today’s review unit, and the latter is what we evaluated in last month’s configuration. RAM options are partially correlated with the choice of CPU: at the higher end of the spectrum, the user can also choose 16 GB of dual-channel memory—but our review unit today features 8 GB (also dual-channel). Memory is soldered to the board and thus cannot be upgraded aftermarket. Finally, in terms of storage, both machines boast NVMe SSDs, so we ought to see good performance there.
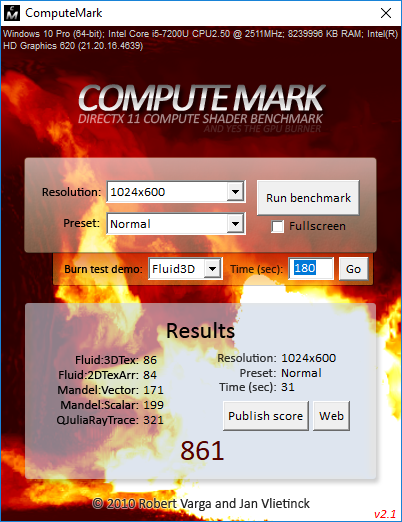
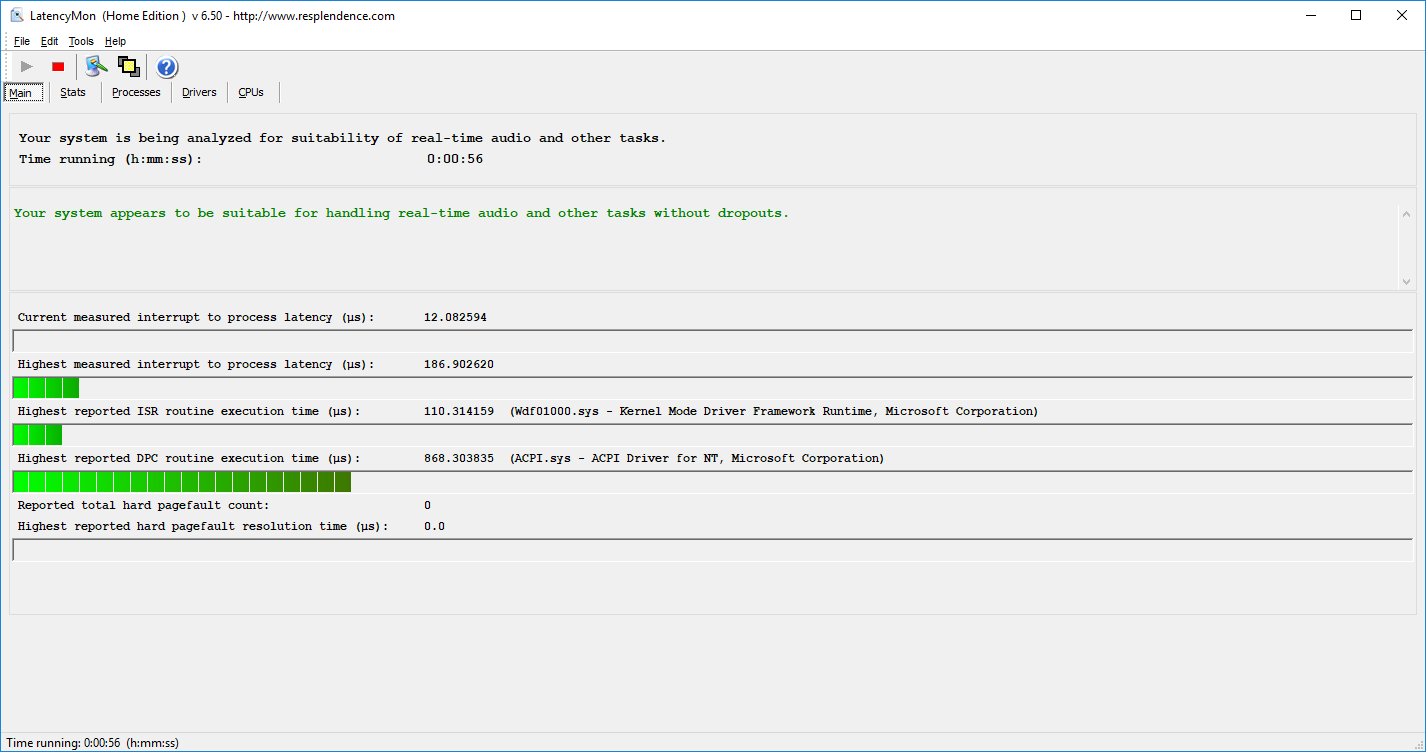
LatencyMon detected no trouble playing real-time streaming audio and video. Meanwhile, performance while unplugged (battery only) is considerably lower than while plugged in; a second run of 3DMark 11 produced a score of 867, half that of the original score (1732).
Processor
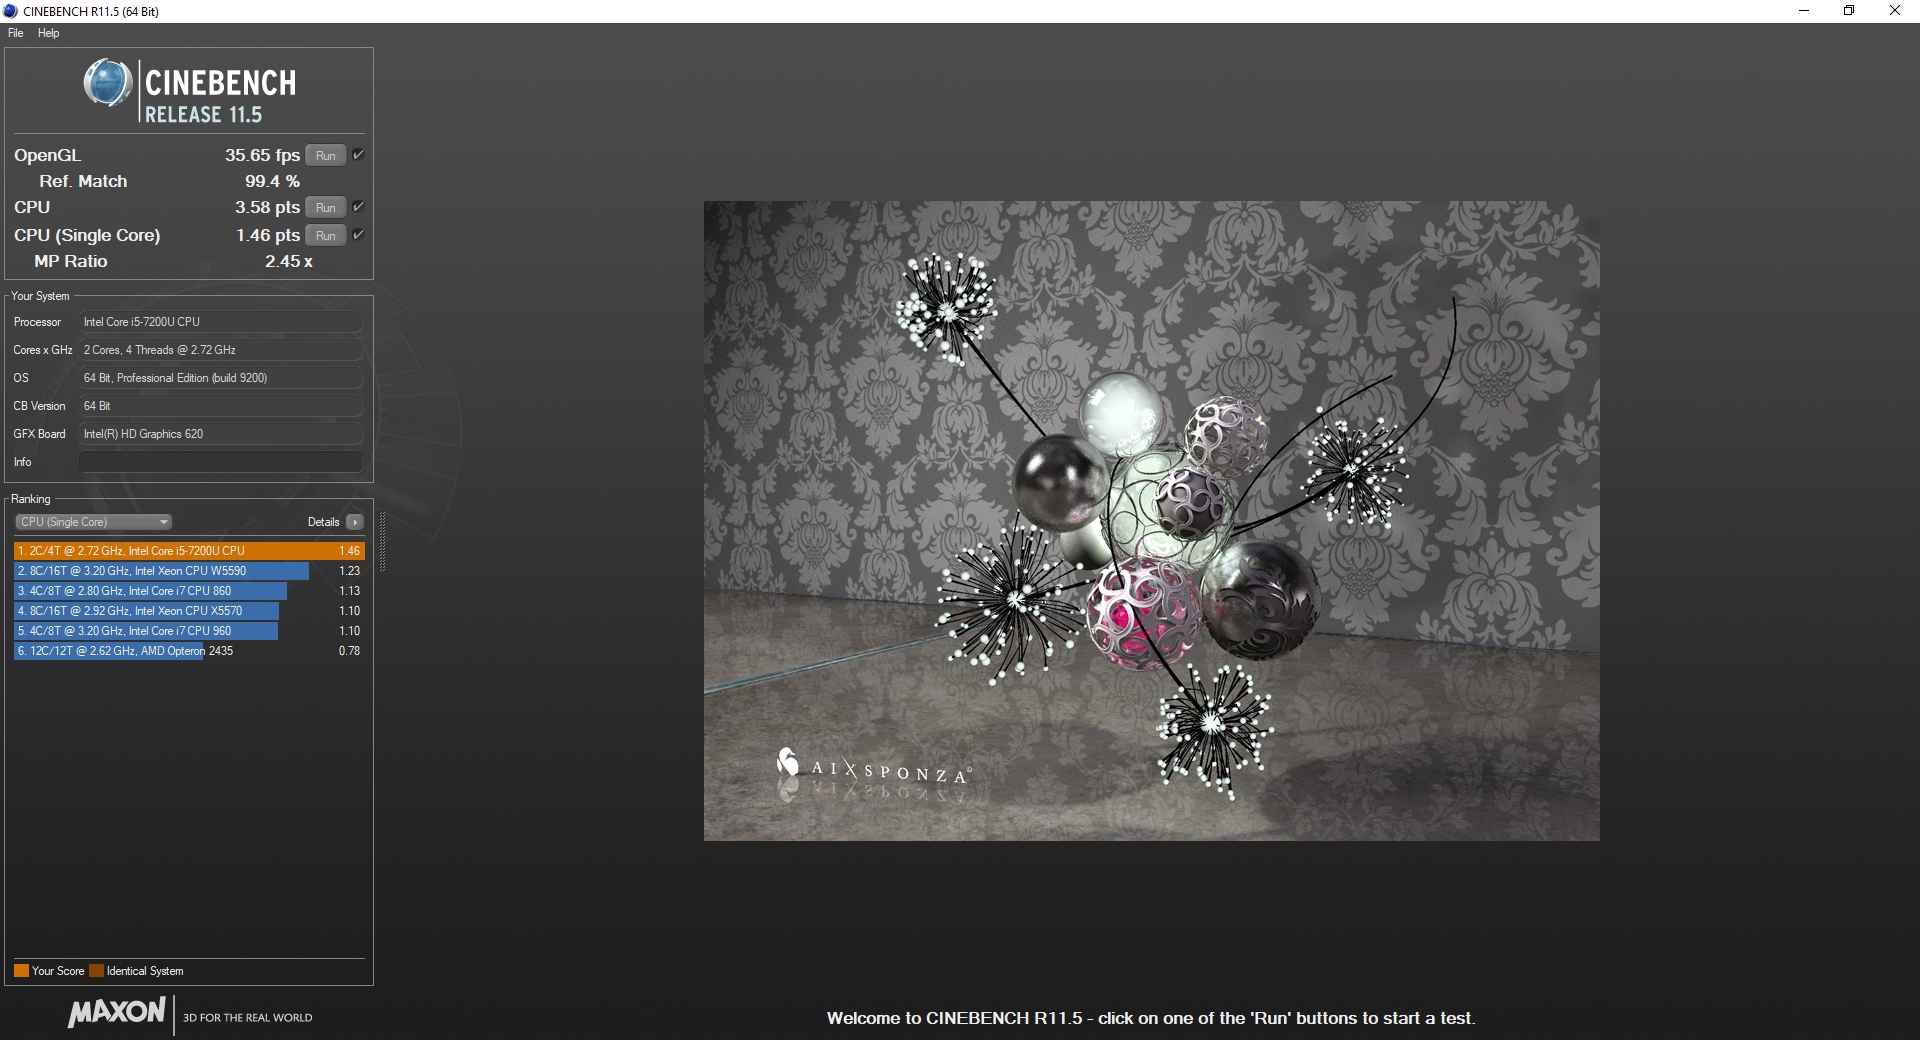
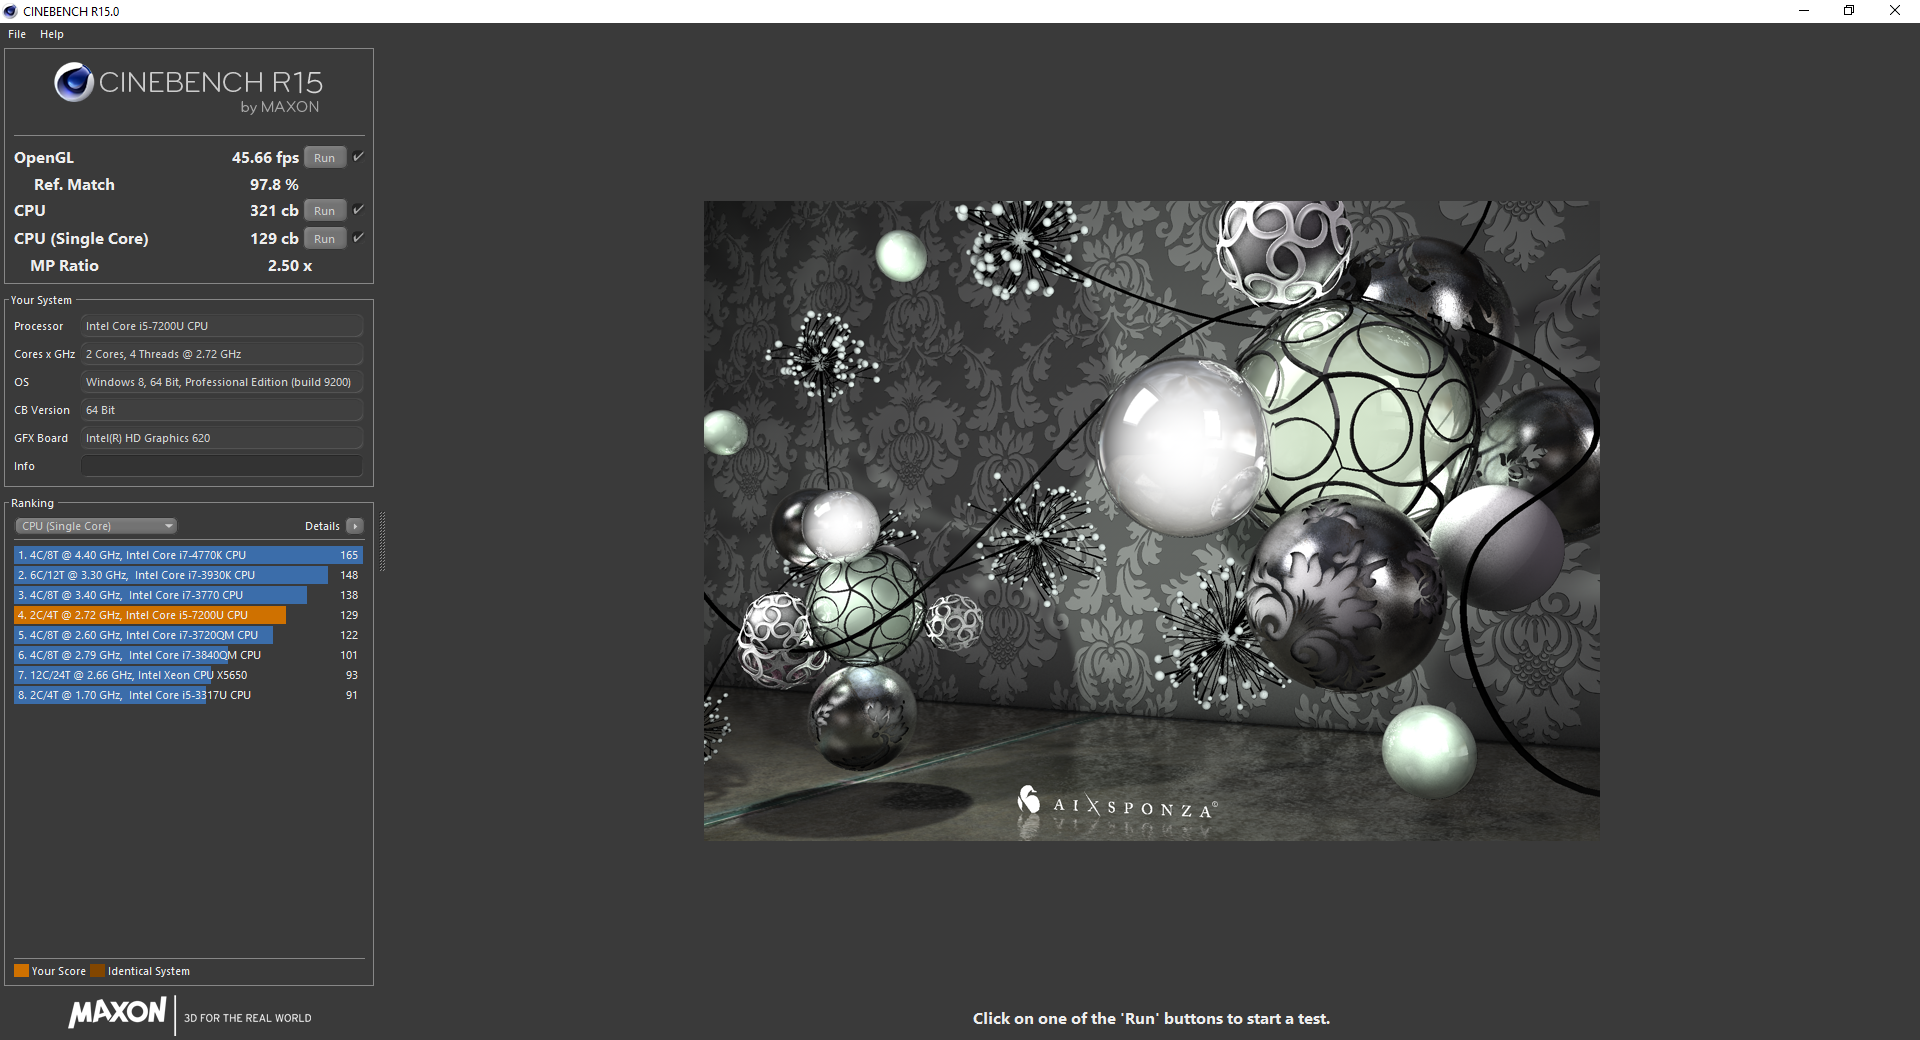
In spite of the fact that we’ve taken a step down from last month’s model’s Core i7-7600U to the Core i5-7200U, it will be interesting to see how real-world performance differs between the two models considering that there was already a small drop in sustained performance in play in the previous model (as detected in our Cinebench R15 loop test). To summarize what we found in our testing of that unit, repeated runs of Cinebench R15 multi-CPU resulted in fluctuating results between 370 (initially) all the way down to 342, with scores eventually leveling out around the 355 mark. In realistic terms, that’s around a 4 percent performance drop over the long term on average.
If our synthetic benchmarks are any indication, however, the answer is likely that there are few surprises with the Core i5-7200U: even despite the minor turbo frequency constraints we experienced with the i7 unit, its performance is clearly and consistently above that of the Core i5 model, the latter which can barely come within 90% of the multi-core performance of the i7. Still, however, the Core i5-7200U does have one significant advantage on its side: its performance in our tests was stable and unyielding. We witnessed absolutely no performance drop, with scores averaging 321 over a long period of repeated testing. Overall, this means that the actual real-world multi-core performance difference between the Core i7-7600U and Core i5-7200U ThinkPad X1 Yoga models, as tested, is likely close to 9%, give or take a little (versus what would normally be a margin of around 13% if performance was ideal and stable on the Core i7 model).
Regardless of all this nitpicking, neither of these processors is a slouch, and in the world of business computing, both would likely be perfectly adequate for just about any task. Rarely in general use is the CPU the prevailing bottleneck these days, so although this is an interesting analysis, we wouldn’t concern ourselves too heavily over the discrepancies in processor performance between these two configurations.
| wPrime 2.10 - 1024m | |
| Dell Latitude 12 5285 2-in-1 | |
| Lenovo ThinkPad X1 Yoga 2017 20JD0015US | |
* ... smaller is better
System Performance
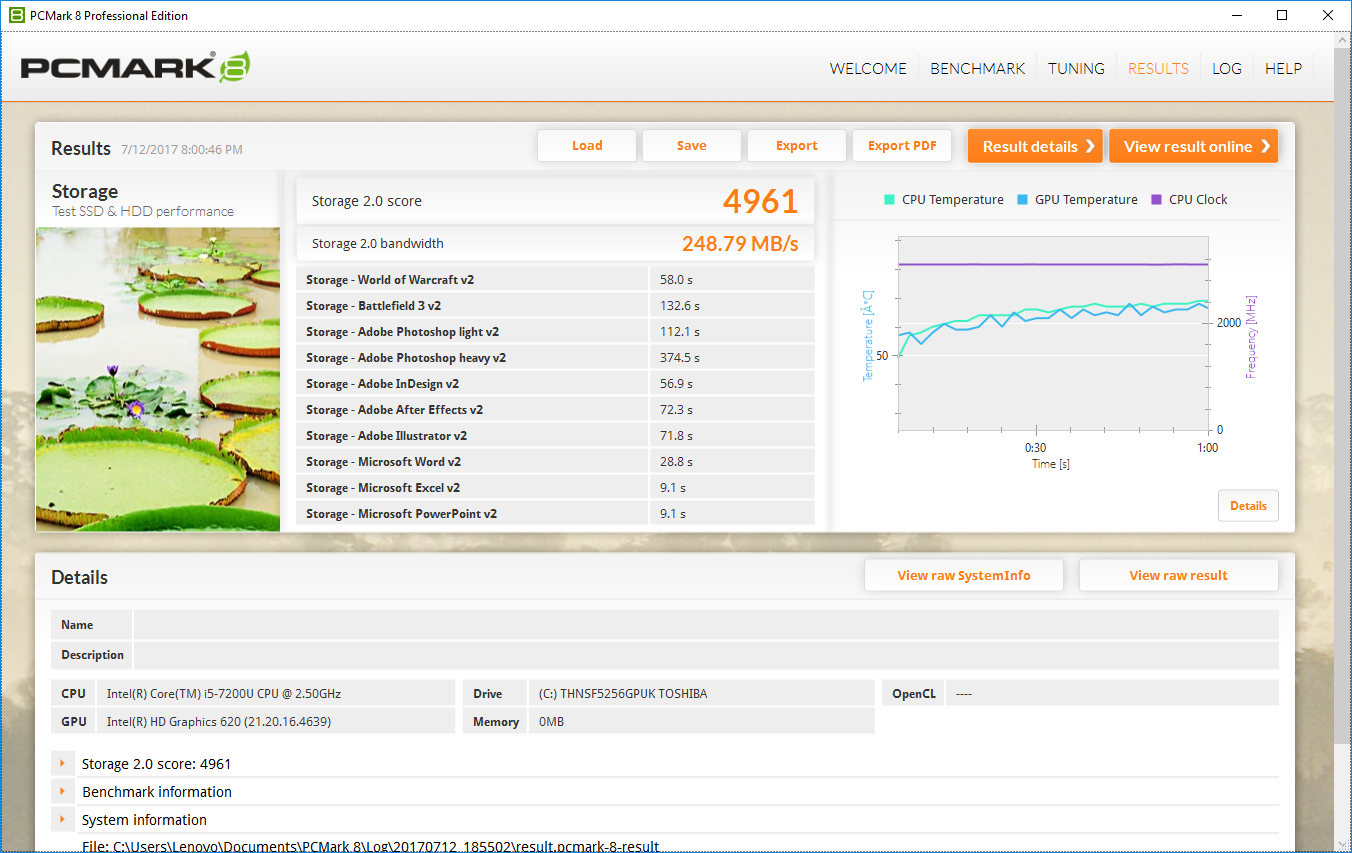
Our synthetic system performance benchmarks offer a solid endorsement of the ThinkPad X1 Yoga’s capabilities. Processor differences notwithstanding, the only other major contributing factor to application performance discrepancies is likely the choice of storage drive—but we’ll cover that in more detail in a moment. Scores of 4687 and 4599 in PCMark 8 Work and Home Accelerated respectively are very good results overall. In real terms, they’re just 4% and 10% below that of the i7/1 TB SSD model, which is encouraging to say the least. For all practical everyday purposes, the ThinkPad X1 Yoga’s performance should prove to be more than satisfactory.
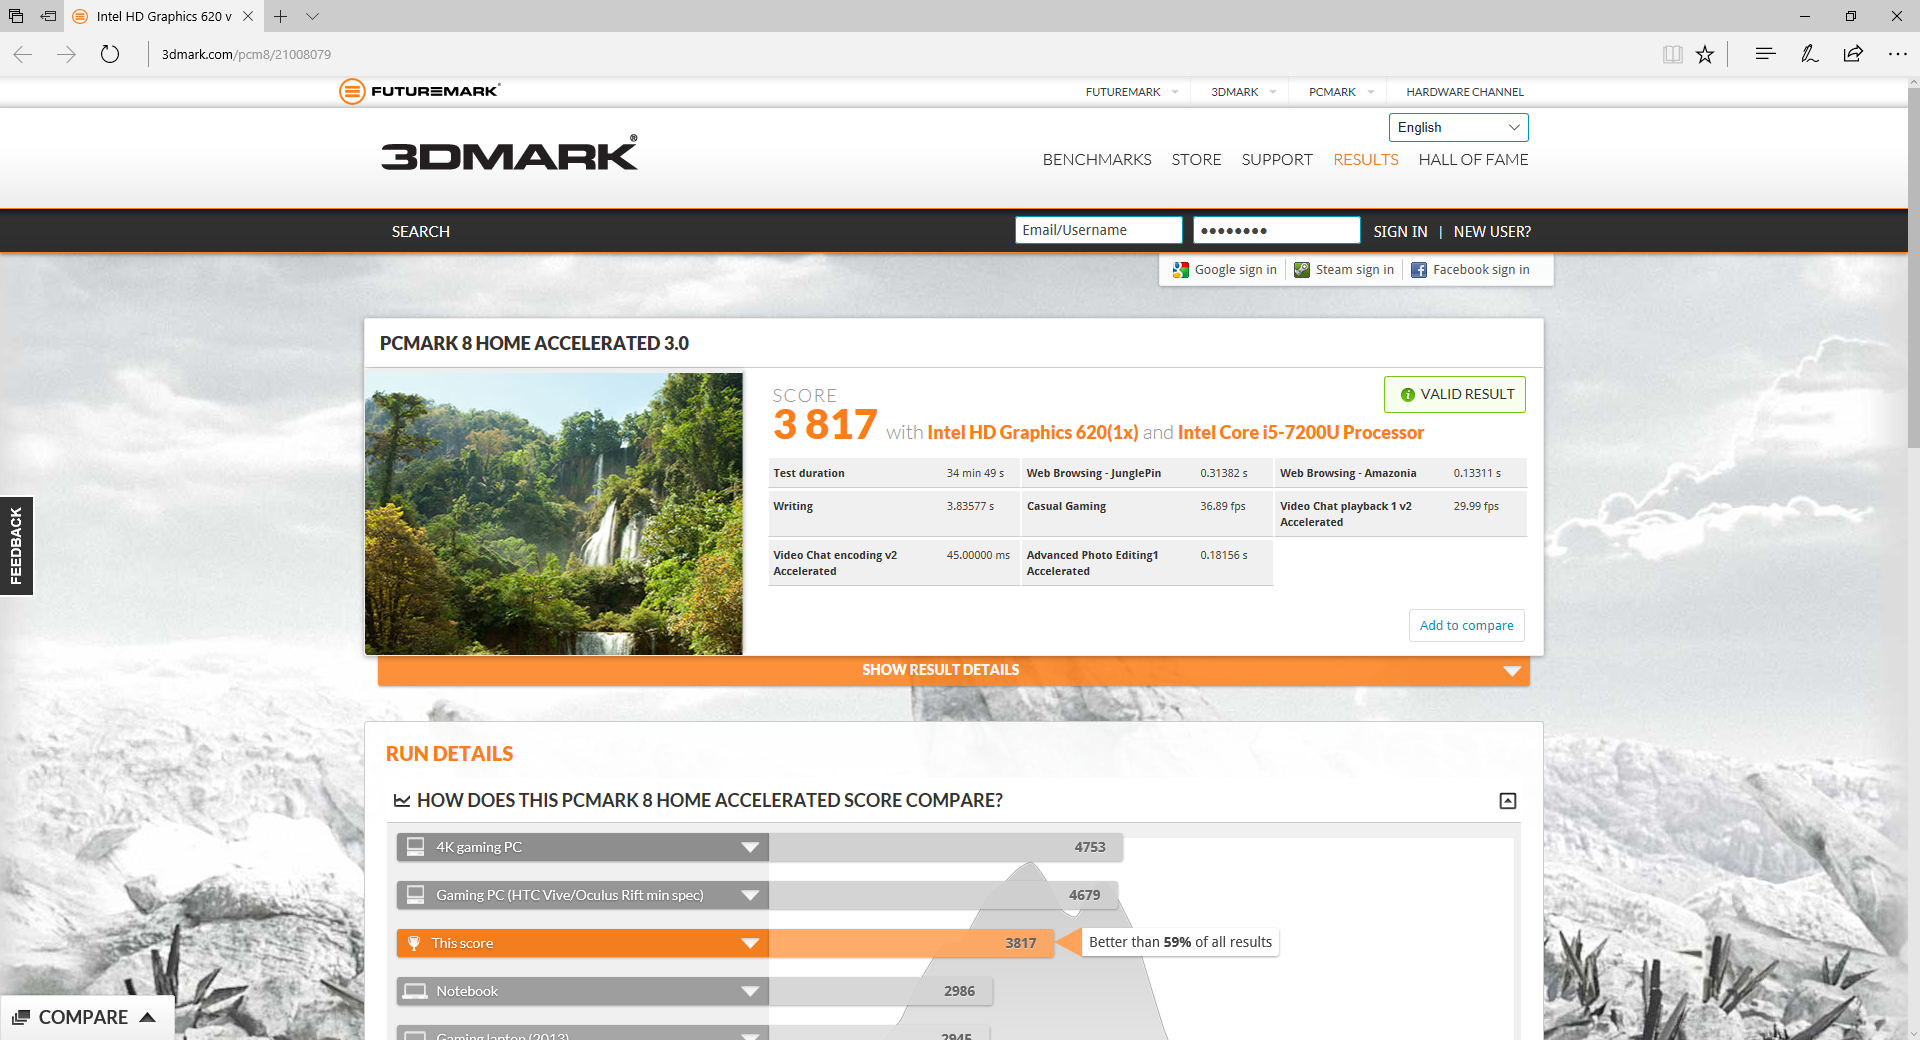
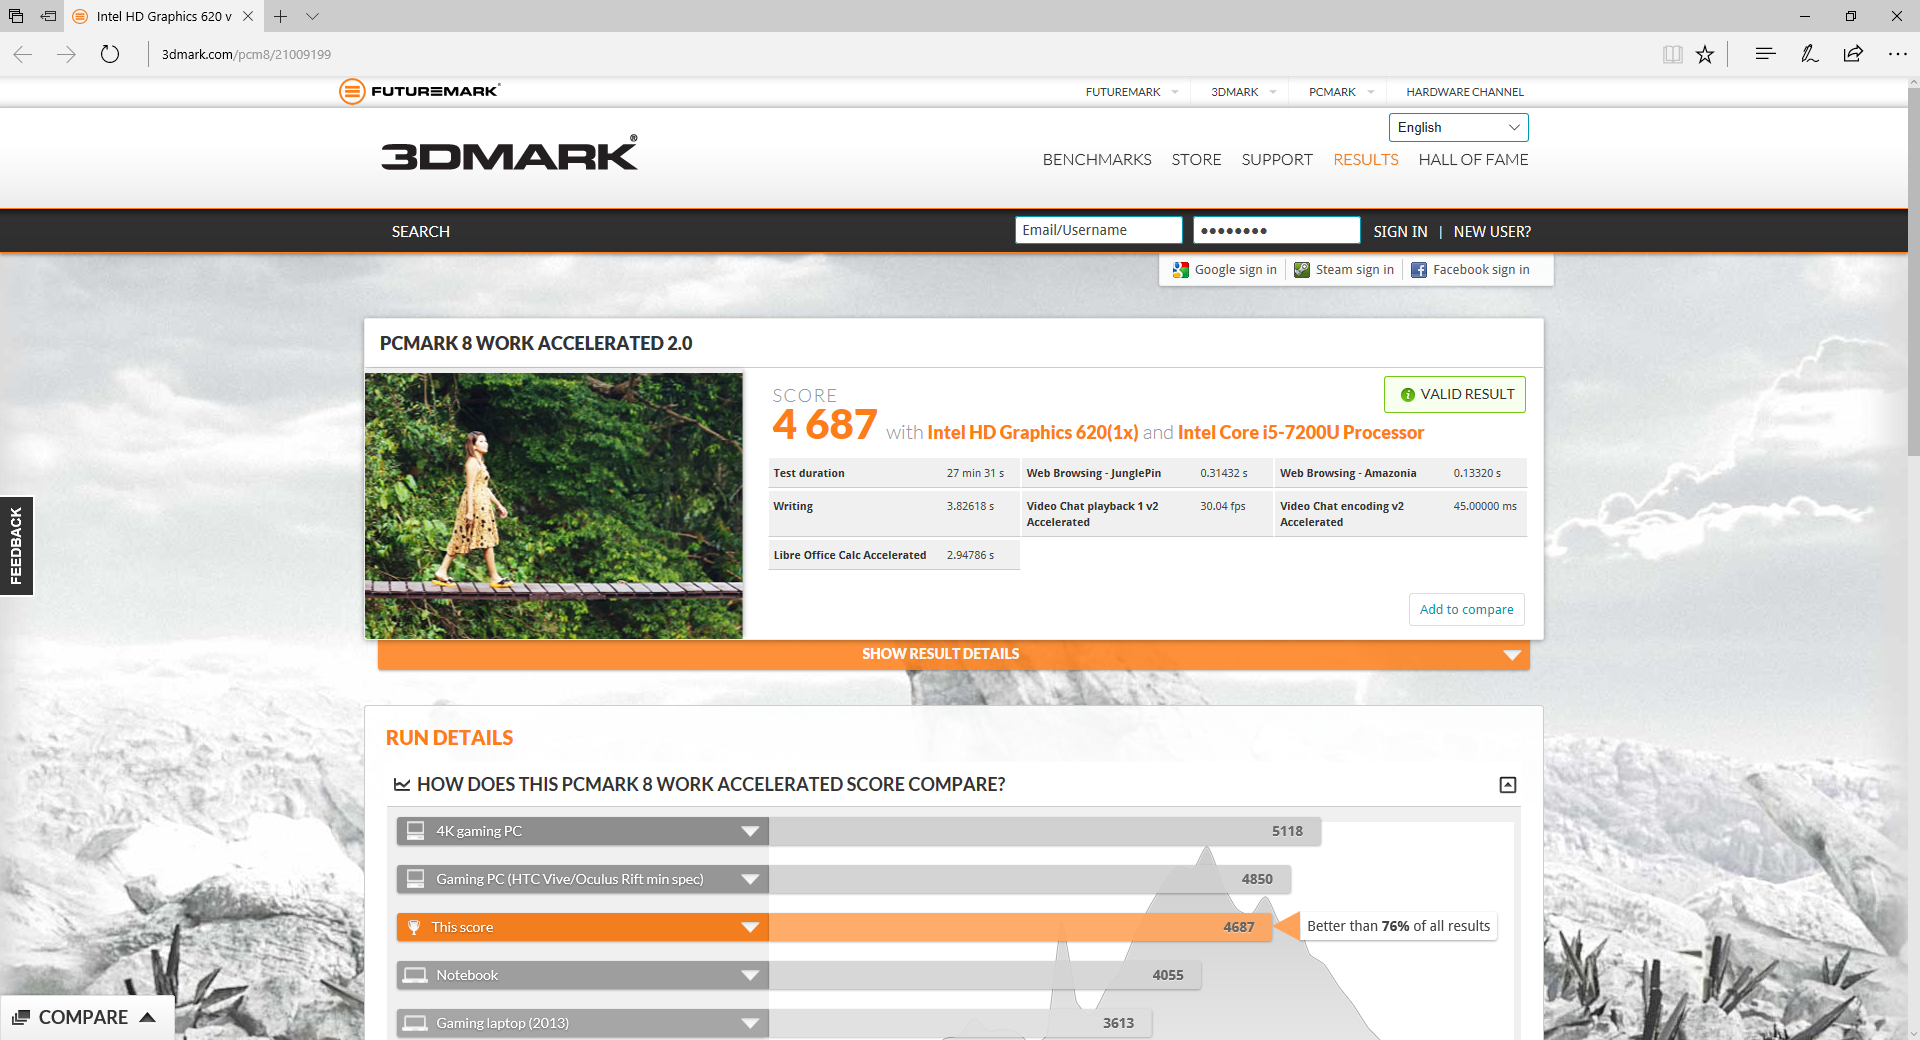
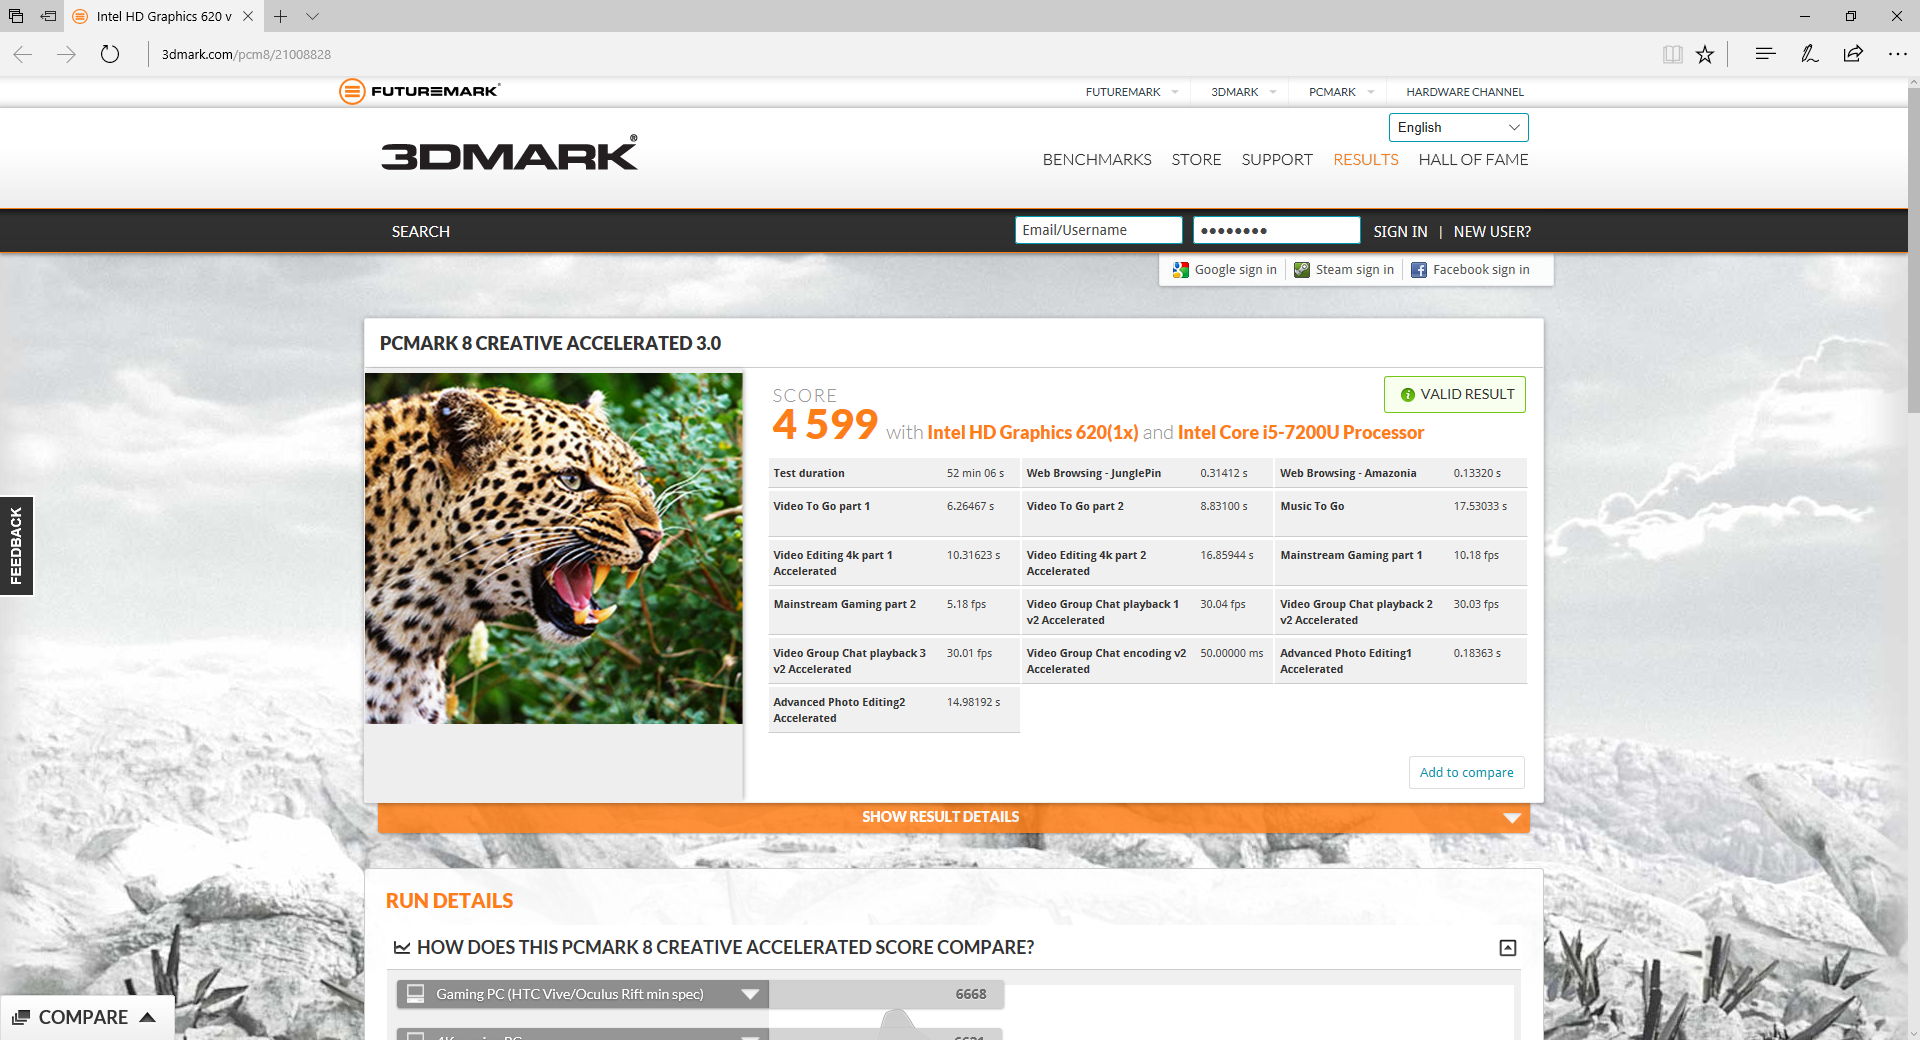
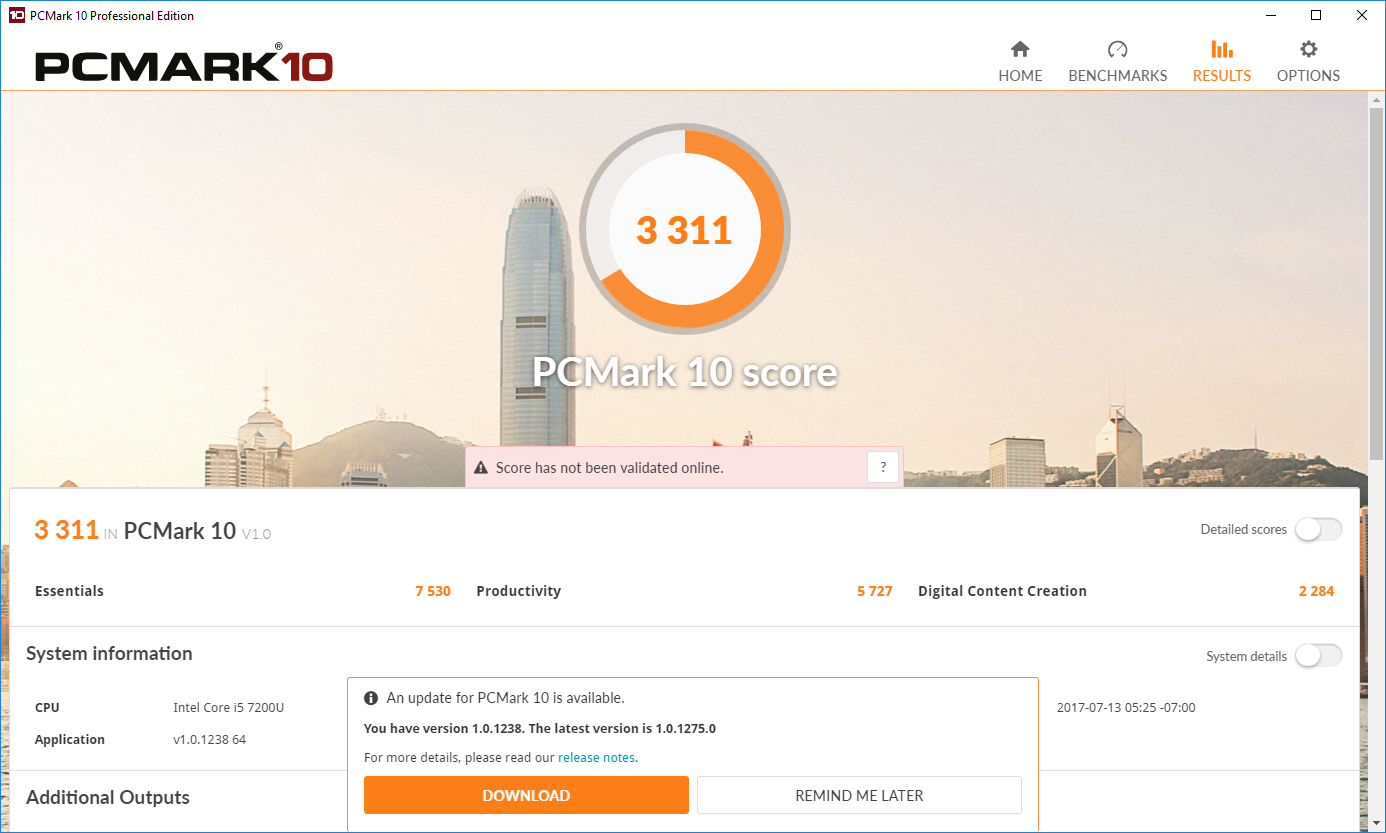
| PCMark 8 Home Score Accelerated v2 | 3817 points | |
| PCMark 8 Creative Score Accelerated v2 | 4599 points | |
| PCMark 8 Work Score Accelerated v2 | 4687 points | |
| PCMark 10 Score | 3311 points | |
Help | ||
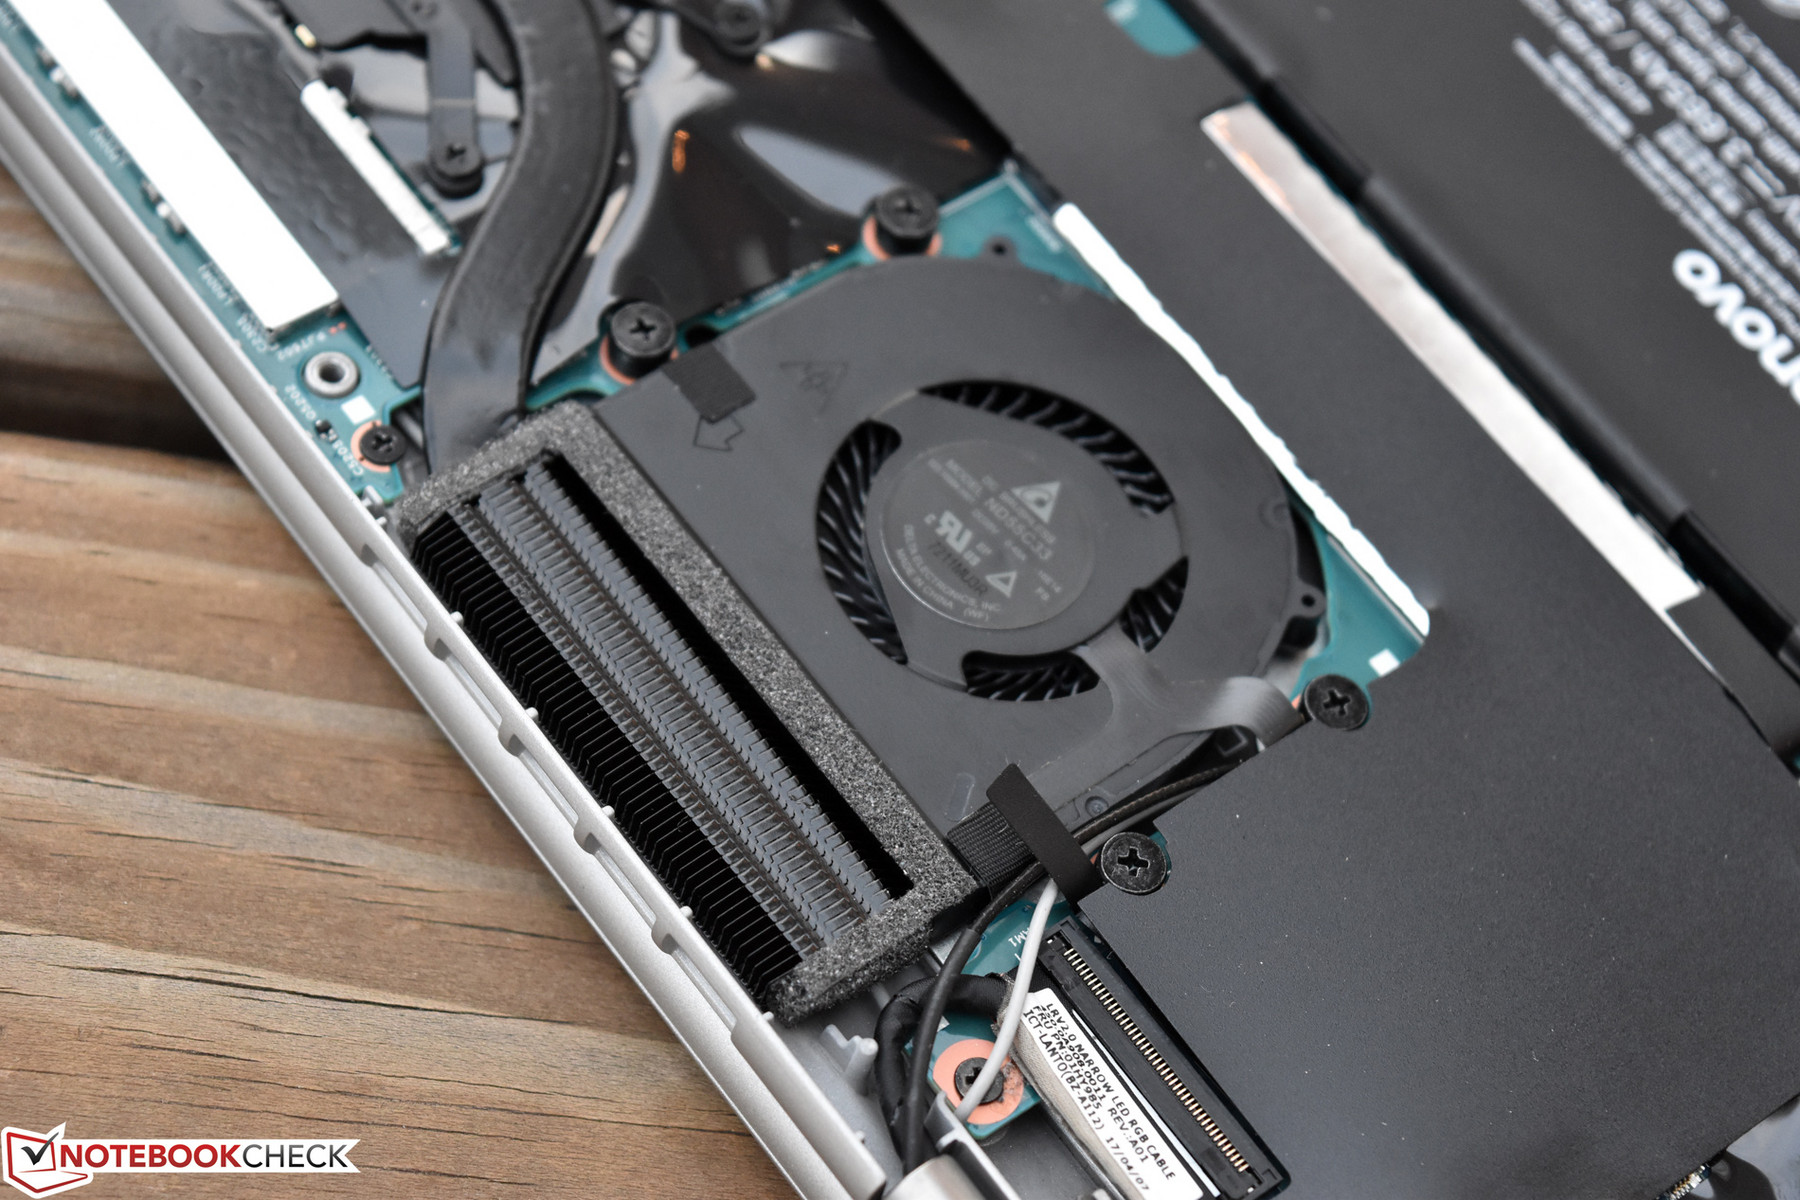
Storage Devices
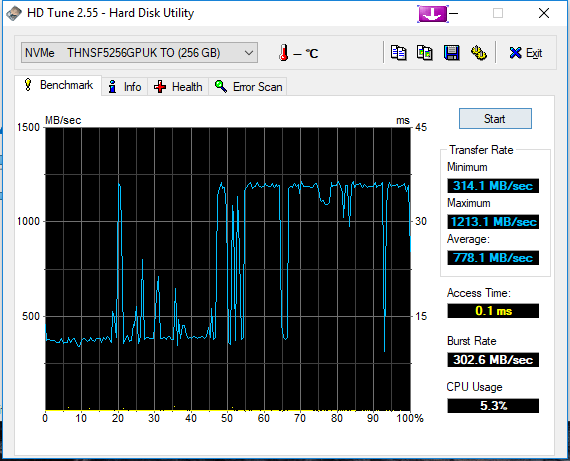
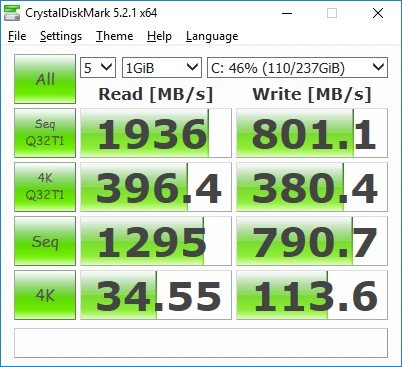
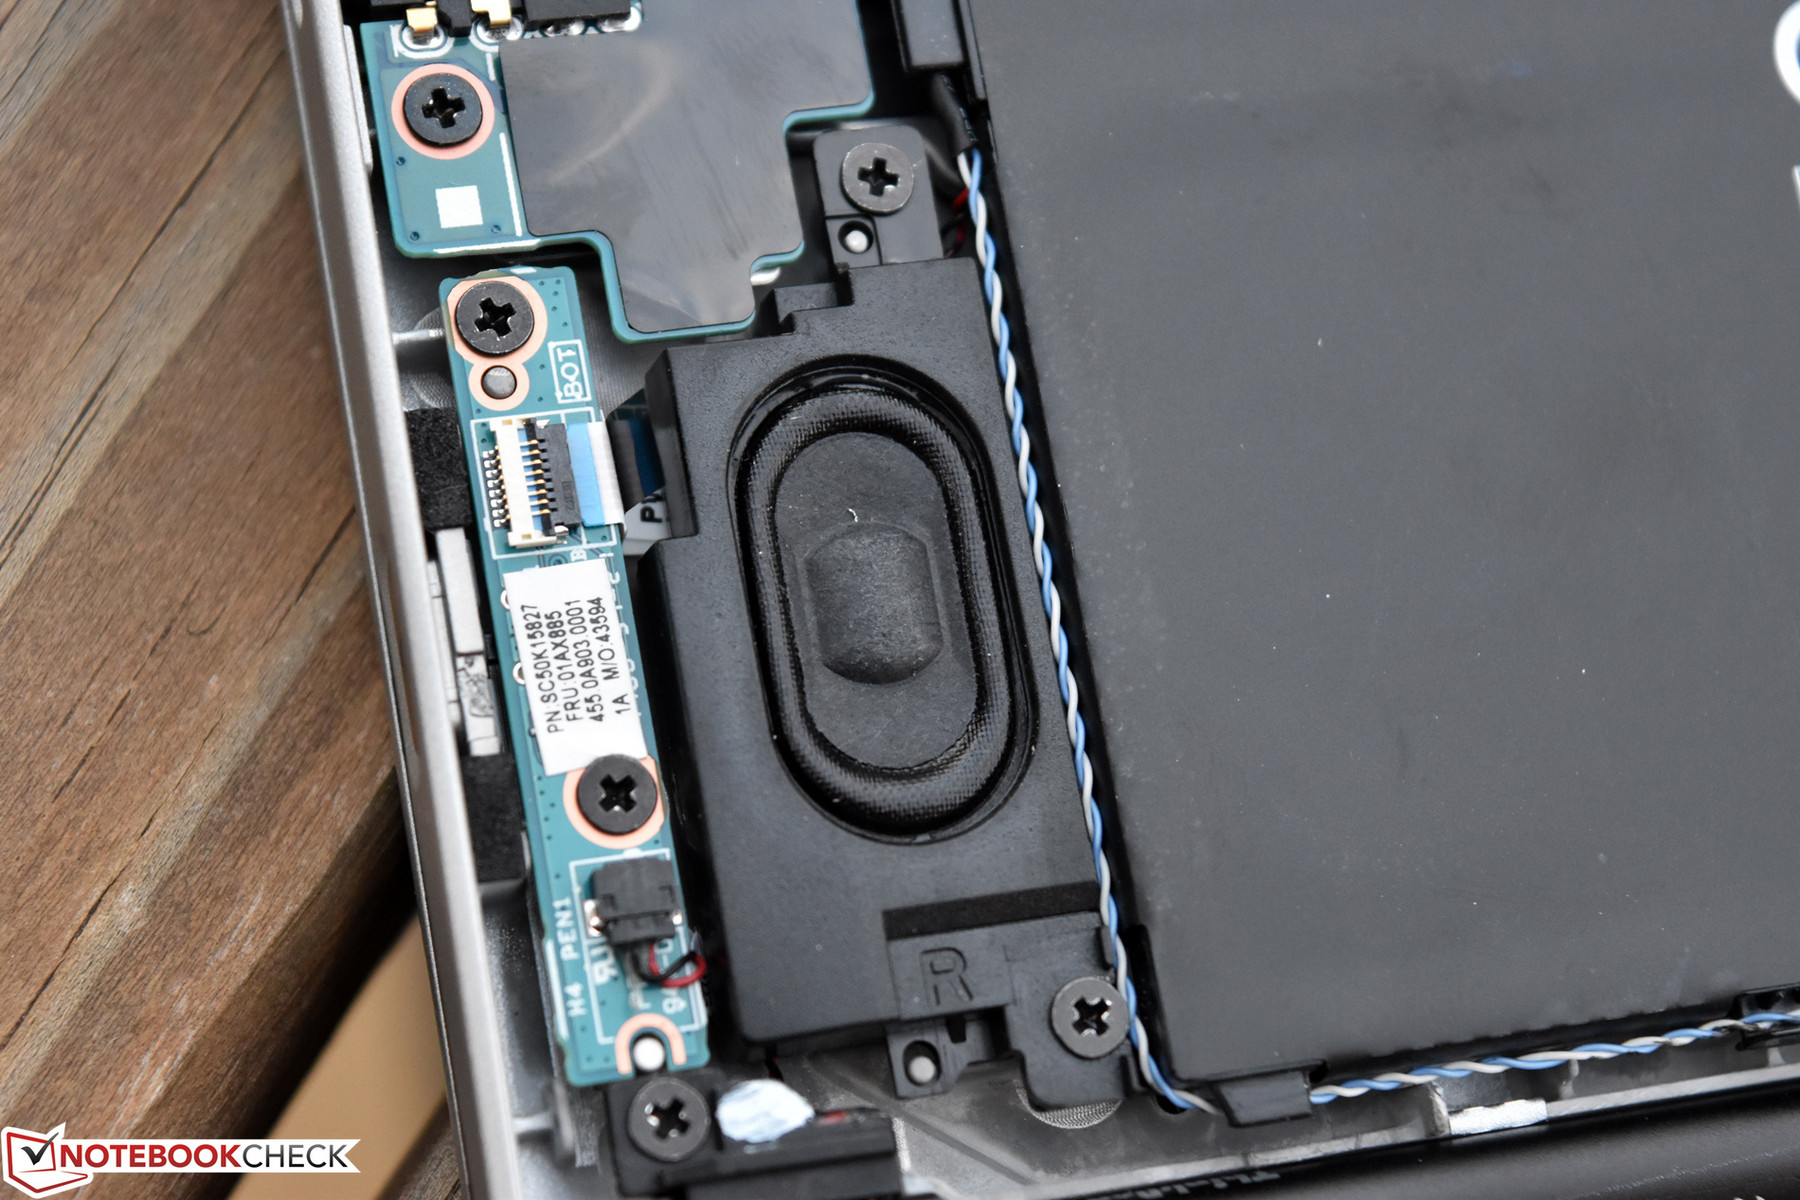
Although the Samsung PM961 NVMe SSD we tested in our previous review unit is considerably faster overall than today’s Toshiba 256 GB NVMe drive, both are still very fast overall. The latter produced sequential QD32 read/write speeds of 1936 MB/s and 801.1 MB/s in CDM 5.0 as well as decent 4K QD32 R/W values of 396.4 MB/s and 380.4 MB/s. In real-world terms, it’s not a huge step down in terms of performance versus the Samsung PM961, so choose based on your capacity needs rather than your performance concerns.
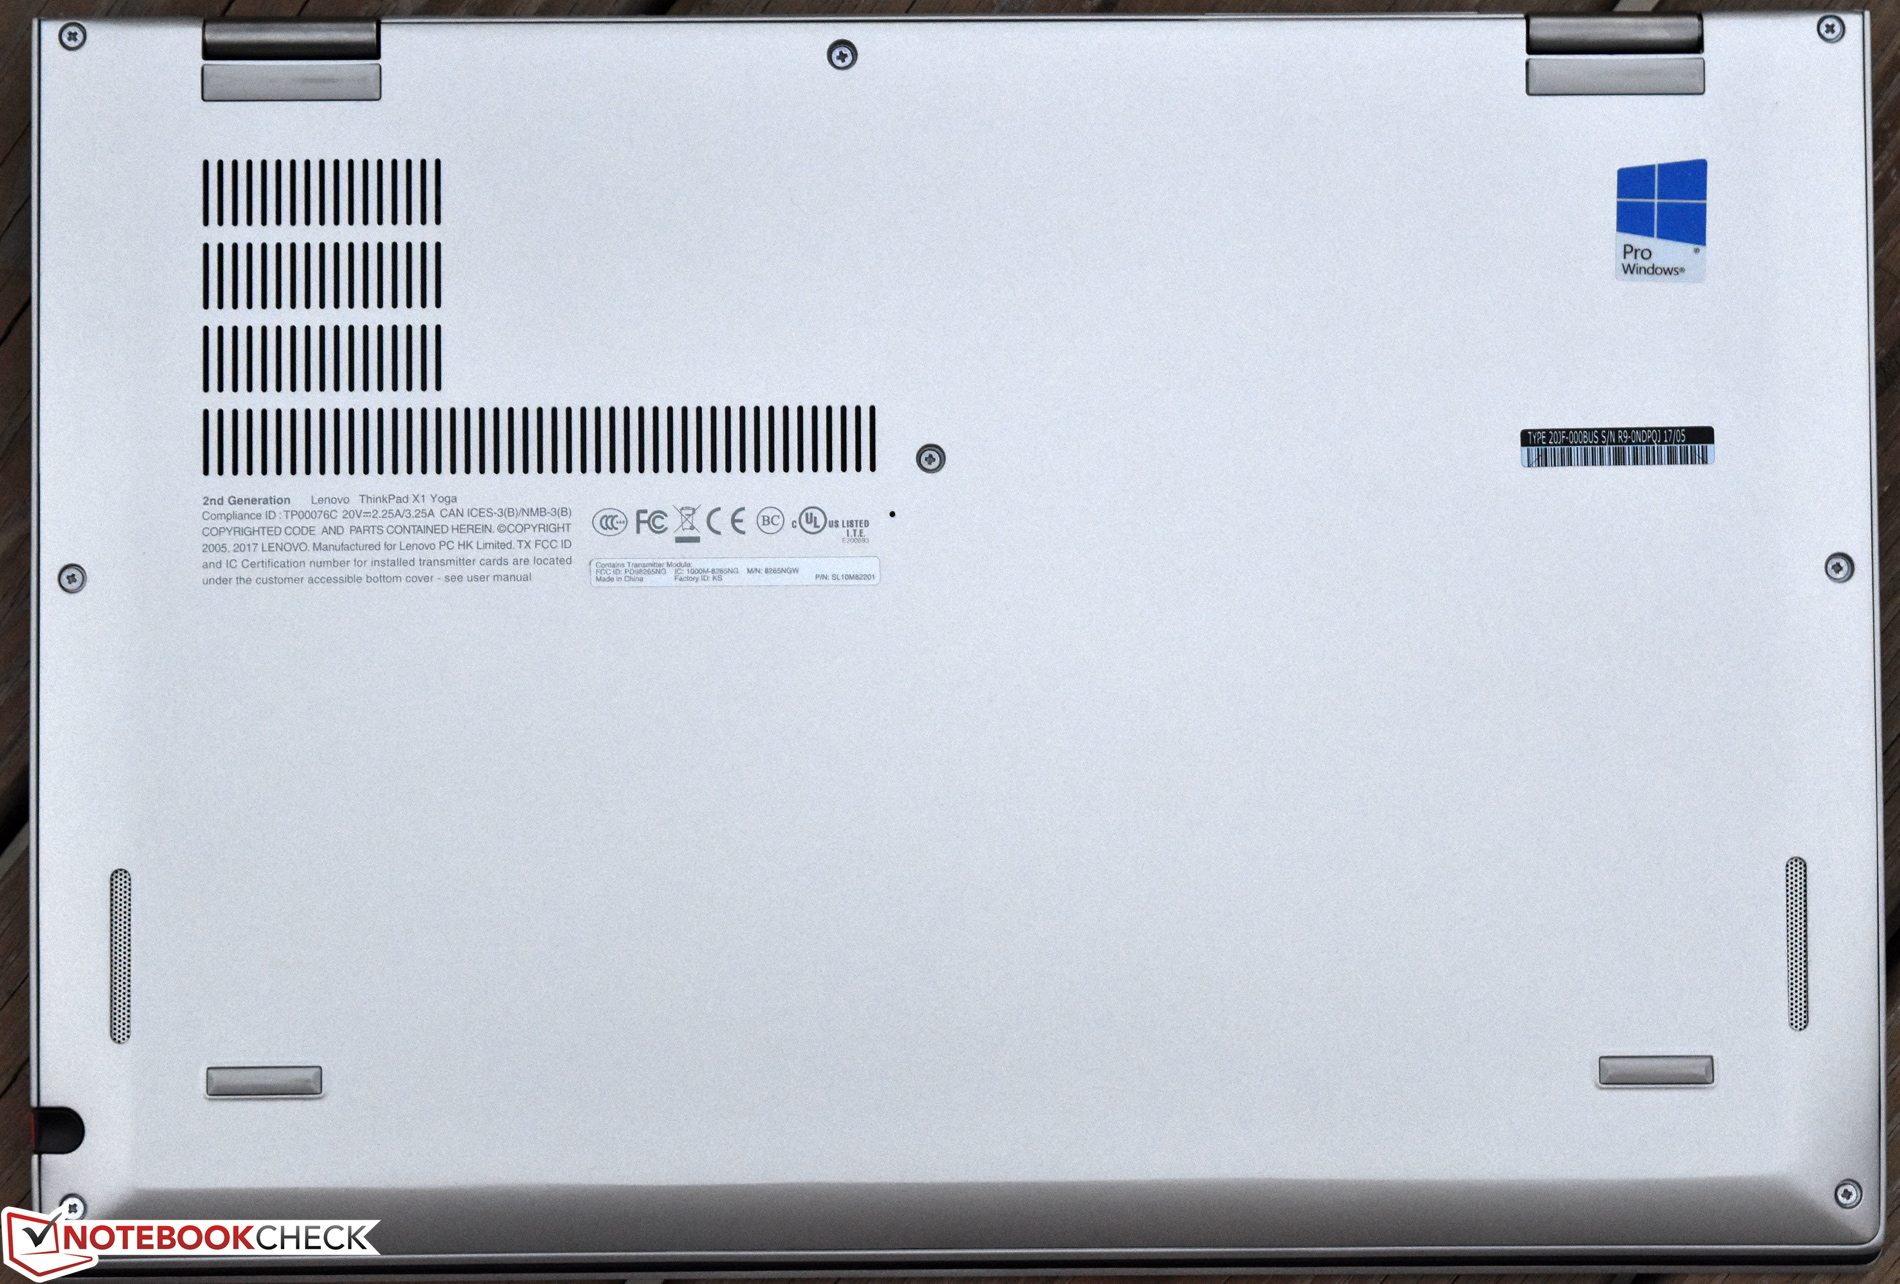
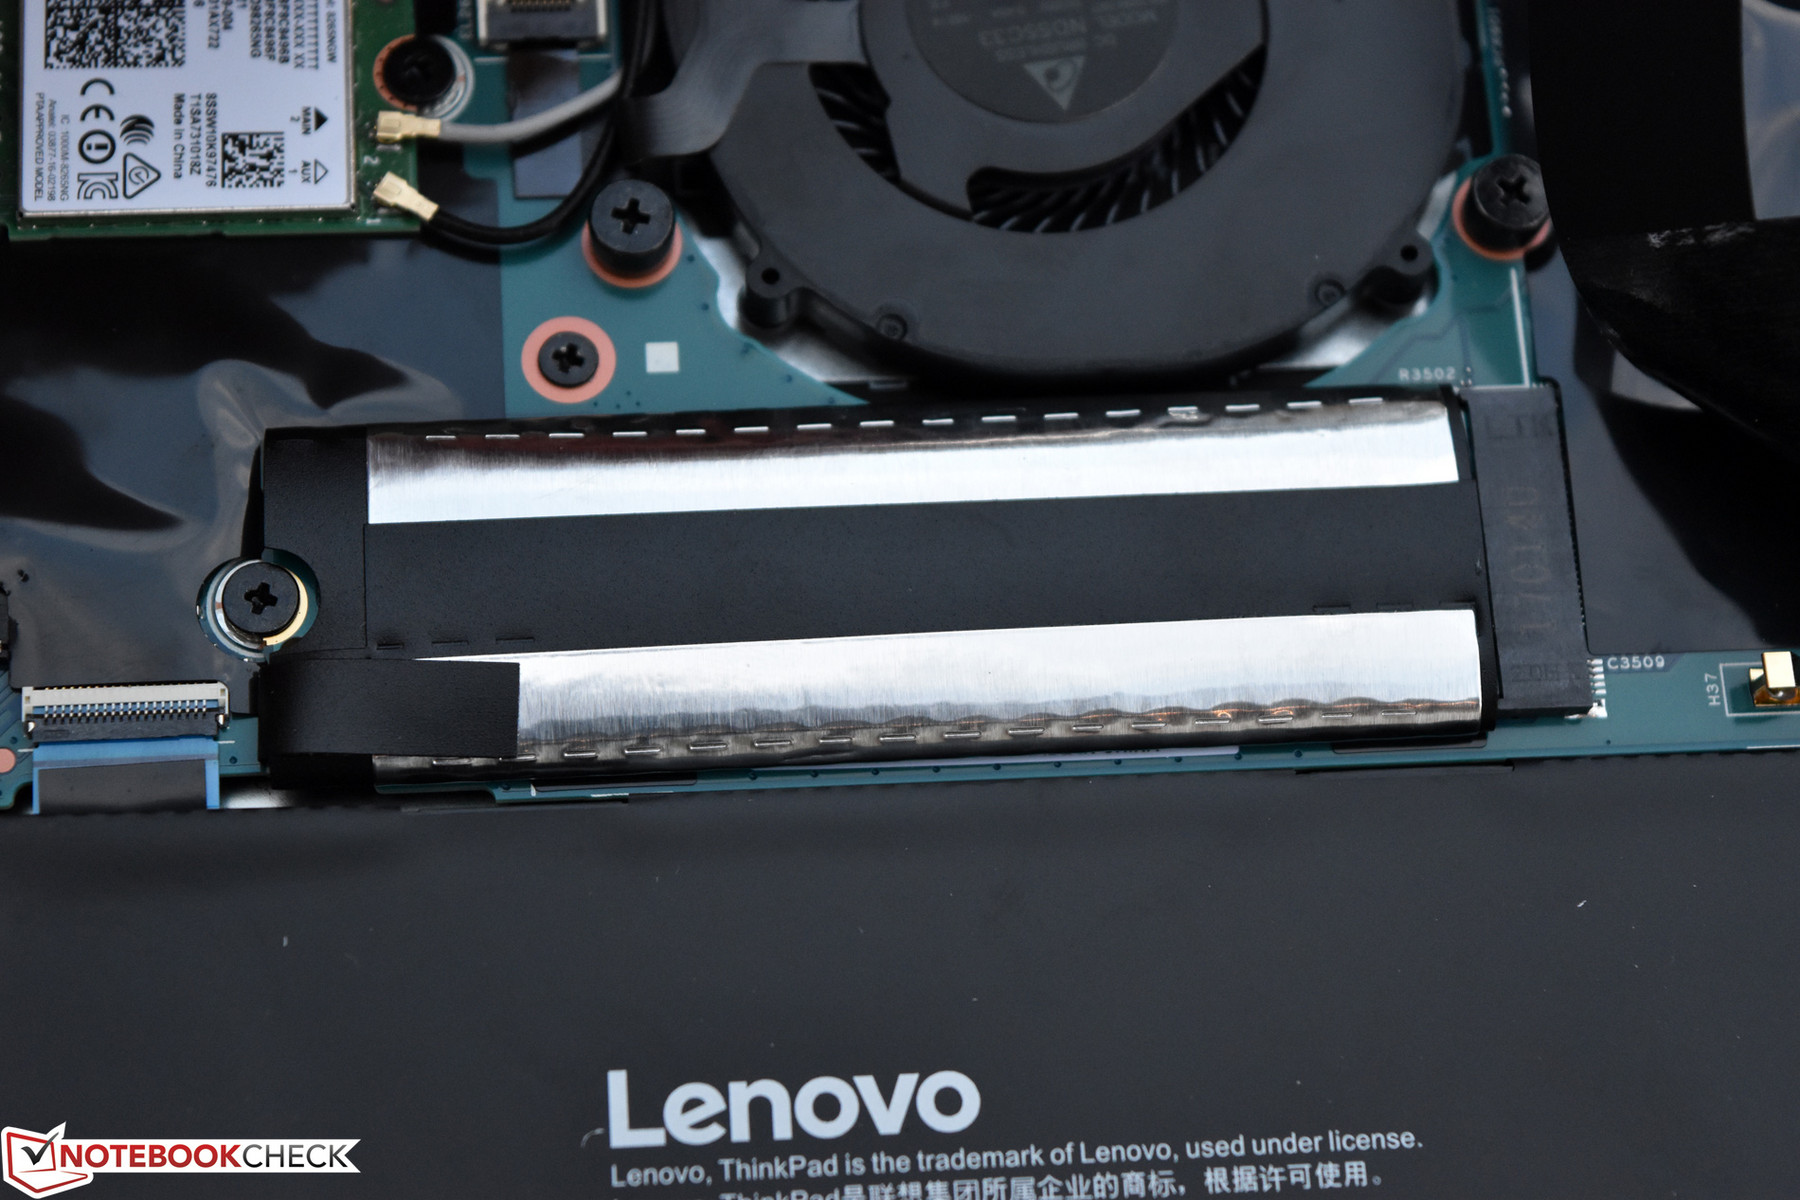
Drive replacements are relatively easy in the ThinkPad X1 Yoga thanks to its removable rear cover.
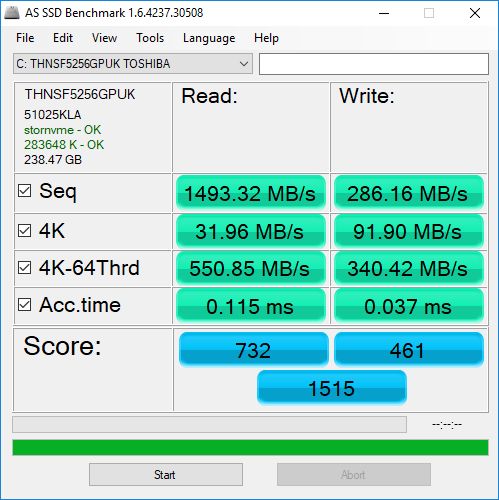
| Lenovo ThinkPad X1 Yoga 2017 20JD0015US Toshiba THNSF5256GPUK | Lenovo ThinkPad X1 Yoga 2017 20JES03T00 Samsung SSD PM961 1TB M.2 PCIe 3.0 x4 NVMe (MZVLW1T0) | Dell Latitude 12 5285 2-in-1 Samsung PM961 MZVLW256HEHP | Toshiba Portege X20W-D-10R Toshiba SG5 THNSNK512GVN8 | HP EliteBook x360 1030 G2 Sandisk SD8TN8U-256G-1006 | |
|---|---|---|---|---|---|
| AS SSD | 221% | 16% | -38% | -47% | |
| Seq Read (MB/s) | 1493 | 2783 86% | 1328 -11% | 485.8 -67% | 486.9 -67% |
| Seq Write (MB/s) | 286.2 | 1734 506% | 223.1 -22% | 243.6 -15% | 201.9 -29% |
| 4K Read (MB/s) | 31.96 | 56.4 76% | 27.6 -14% | 23.06 -28% | 27.37 -14% |
| 4K Write (MB/s) | 91.9 | 158.1 72% | 1.23 -99% | 76.7 -17% | 52.6 -43% |
| 4K-64 Read (MB/s) | 551 | 2140 288% | 1607 192% | 358 -35% | 286.2 -48% |
| 4K-64 Write (MB/s) | 340.4 | 1196 251% | 126.1 -63% | 160.9 -53% | 120.9 -64% |
| Score Read (Points) | 732 | 2475 238% | 1768 142% | 430 -41% | 362 -51% |
| Score Write (Points) | 461 | 1527 231% | 150 -67% | 262 -43% | 194 -58% |
| Score Total (Points) | 1515 | 5215 244% | 2760 82% | 906 -40% | 736 -51% |

GPU Performance
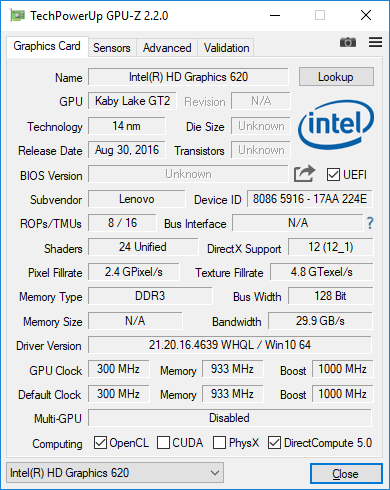
There are few if any significant GPU performance differences between the Core i7-7600U equipped X1 Yoga and our Core i5-7200U review unit. Both pack Intel HD Graphics 620, and although the i7’s is clocked higher (at 300 – 1150 MHz versus the 300 – 1000 MHz of the Core i5 chip), our benchmarks reveal nearly identical performance across the board in the X1.
| 3DMark | |
| 1280x720 Cloud Gate Standard Graphics | |
| Dell Latitude 12 5285 2-in-1 | |
| Lenovo ThinkPad X1 Yoga 2017 20JD0015US | |
| HP EliteBook x360 1030 G2 | |
| Lenovo ThinkPad X1 Yoga 2017 20JES03T00 | |
| Toshiba Portege X20W-D-10R | |
| 1920x1080 Fire Strike Graphics | |
| Dell Latitude 12 5285 2-in-1 | |
| Lenovo ThinkPad X1 Yoga 2017 20JD0015US | |
| Lenovo ThinkPad X1 Yoga 2017 20JES03T00 | |
| HP EliteBook x360 1030 G2 | |
| 1920x1080 Ice Storm Extreme Graphics | |
| Lenovo ThinkPad X1 Yoga 2017 20JD0015US | |
| HP EliteBook x360 1030 G2 | |
| Dell Latitude 12 5285 2-in-1 | |
| 3DMark 06 Standard Score | 10136 points | |
| 3DMark 11 Performance | 1732 points | |
| 3DMark Ice Storm Standard Score | 49899 points | |
| 3DMark Cloud Gate Standard Score | 6530 points | |
| 3DMark Fire Strike Score | 933 points | |
| 3DMark Time Spy Score | 374 points | |
Help | ||
| low | med. | high | ultra | |
|---|---|---|---|---|
| BioShock Infinite (2013) | 61 | 33 | 27 | 8 |
Stress Test
Synthetic stress tests are helpful for hypothetical purposes just to see how far a machine can be pushed before it buckles. As with most ultraportable devices with integrated graphics, the ThinkPad X1 Yoga can’t handle combined CPU + GPU stress without throttling its CPU frequency to below the base frequency (in this case, to 1.5 GHz). GPU in this instance remains around 900 MHz, with the CPU/GPU package temperature resting at around 75 °C, which seems to be the thermal limit set by the Yoga firmware.
On the other hand, individual CPU/GPU stress is handled surprisingly smoothly. The notebook still achieves a 3.1 GHz average clock rate during Prime95 CPU stress and a 950 MHz GPU frequency, with temperatures in both scenarios averaging, once again, 75 °C.
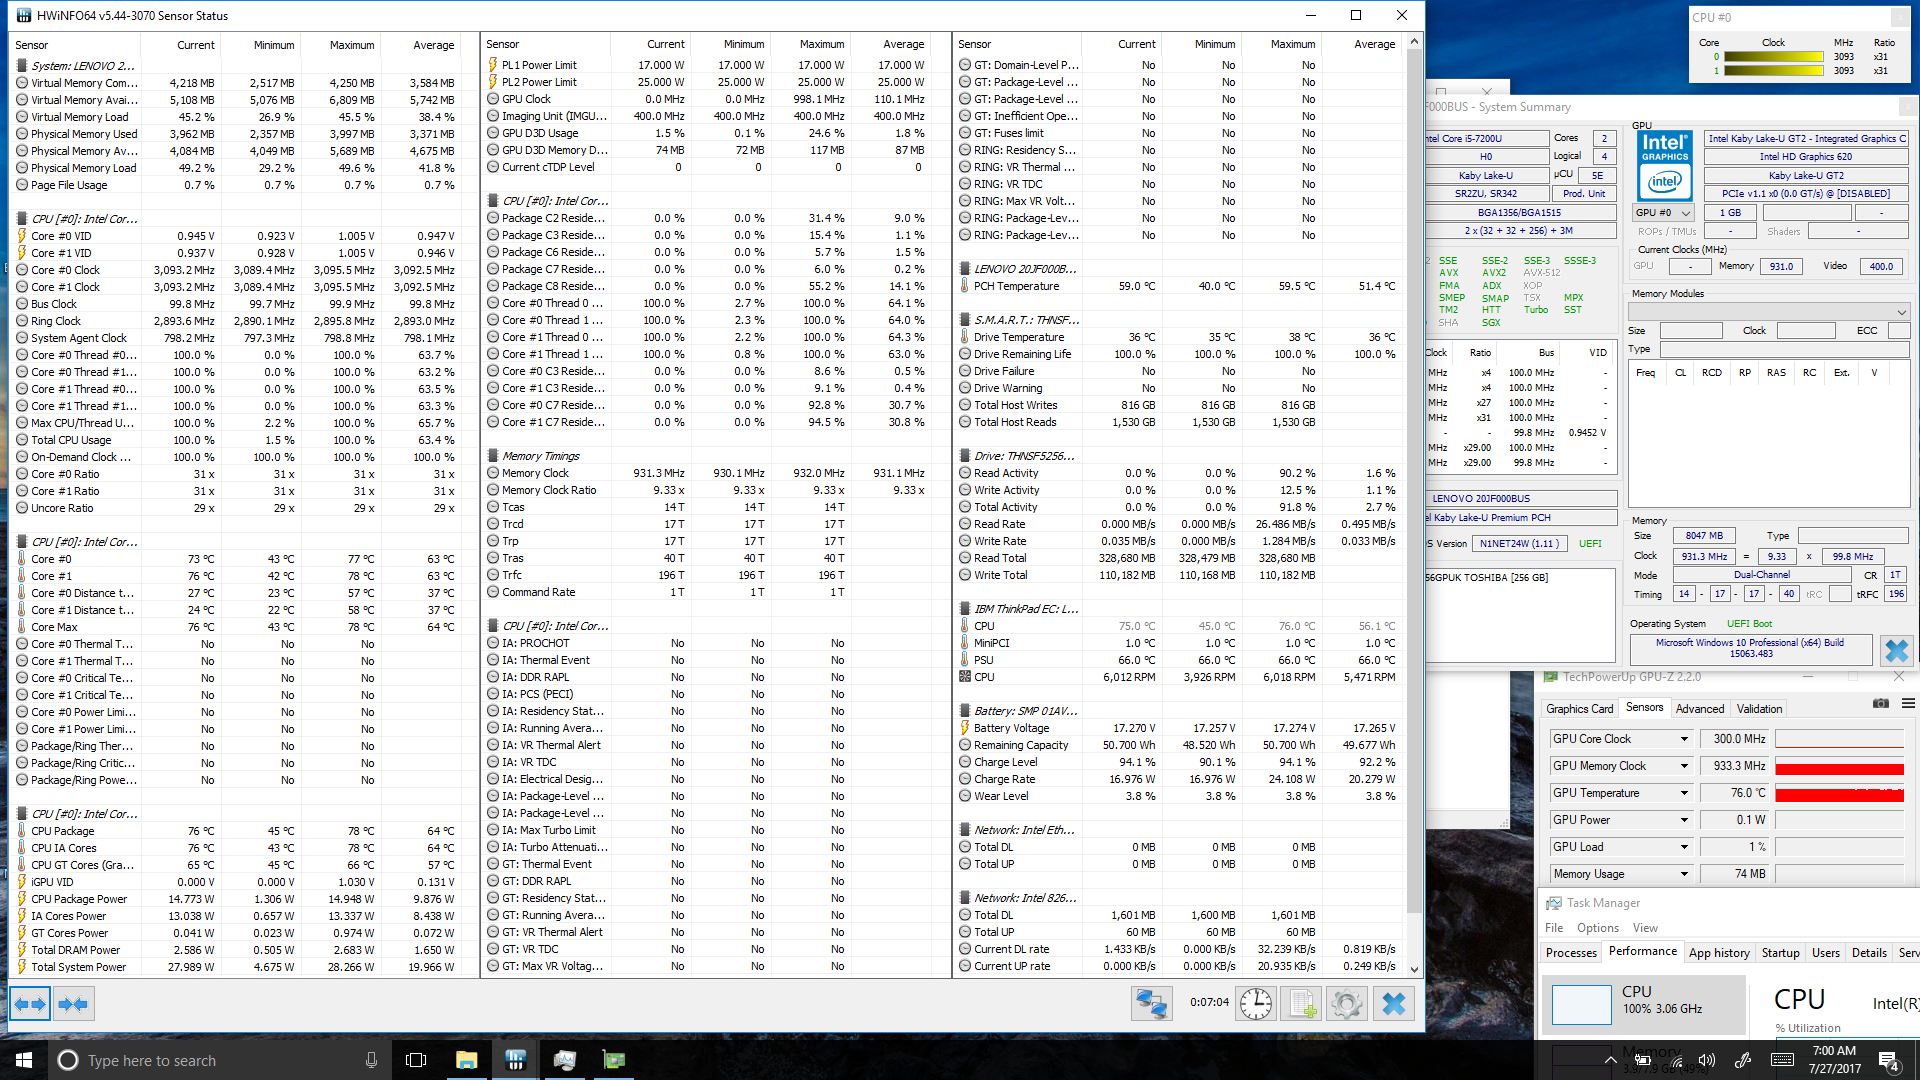
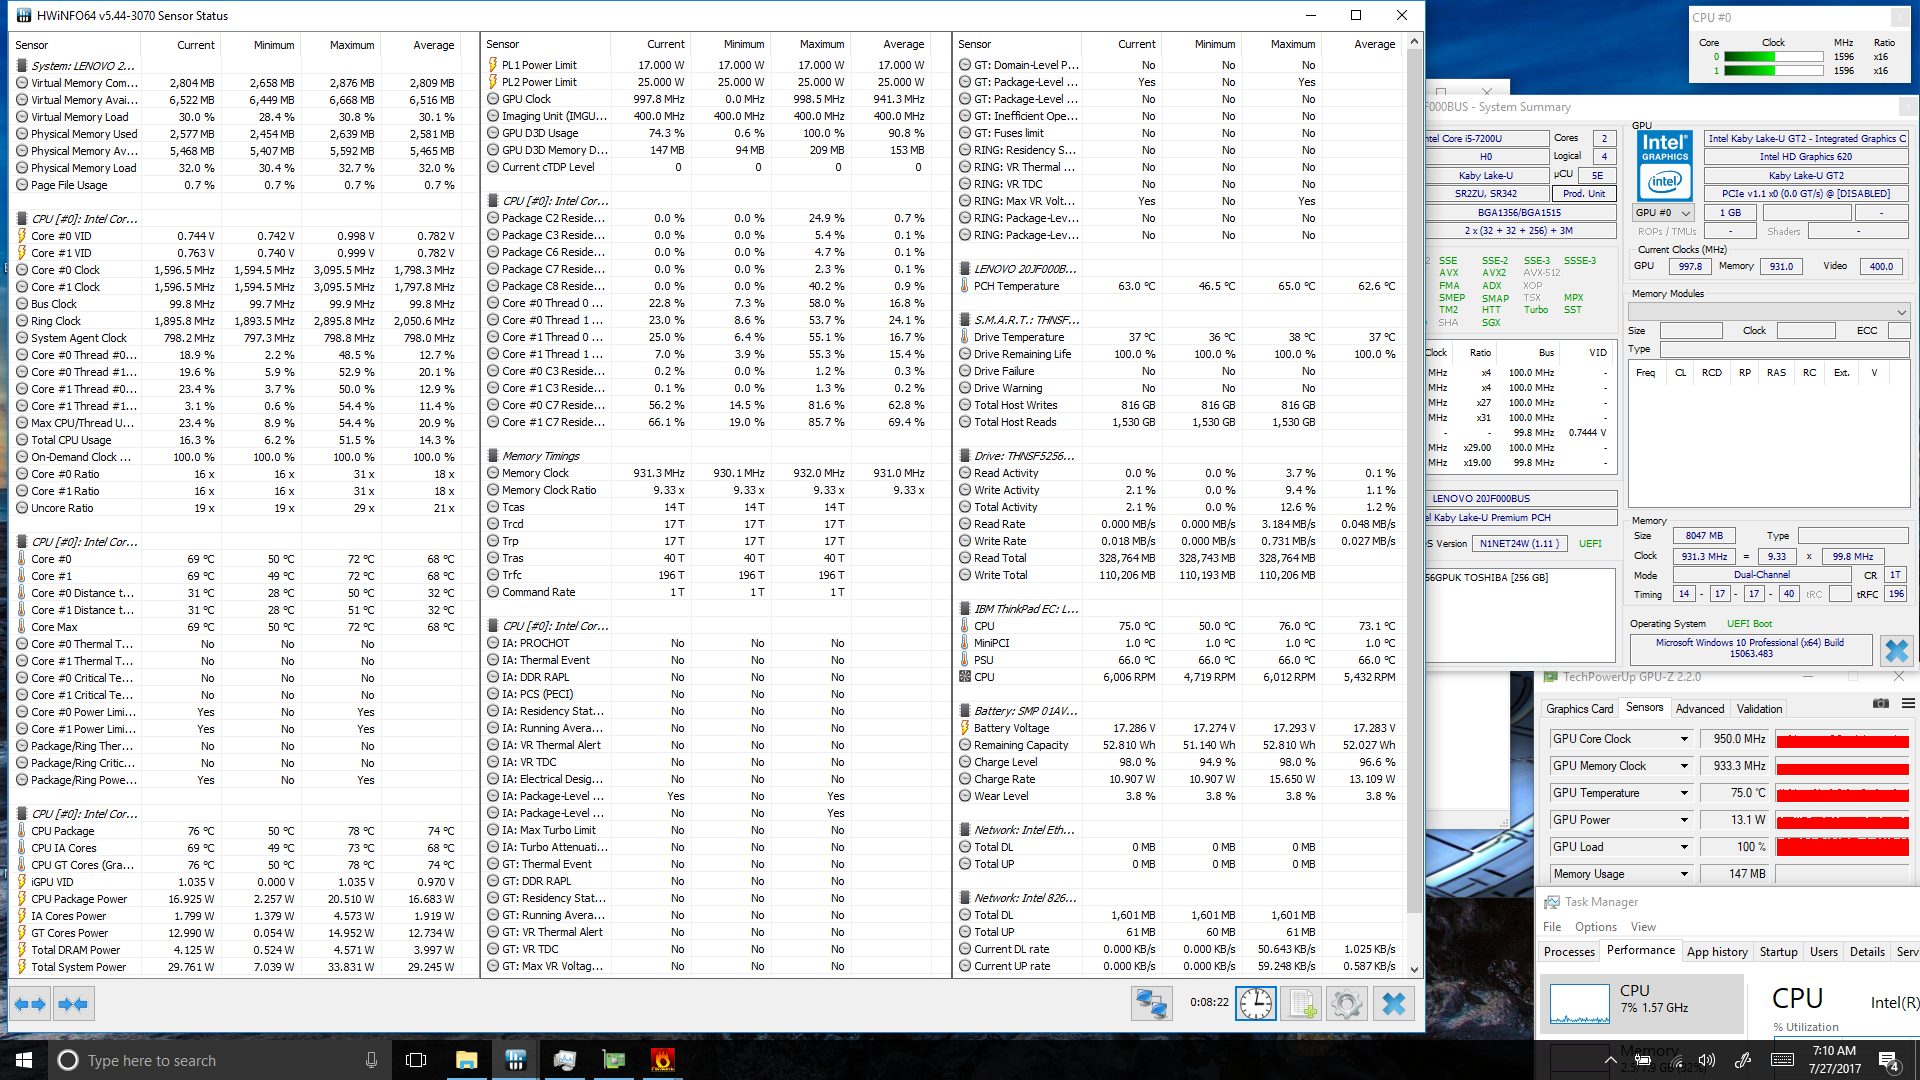
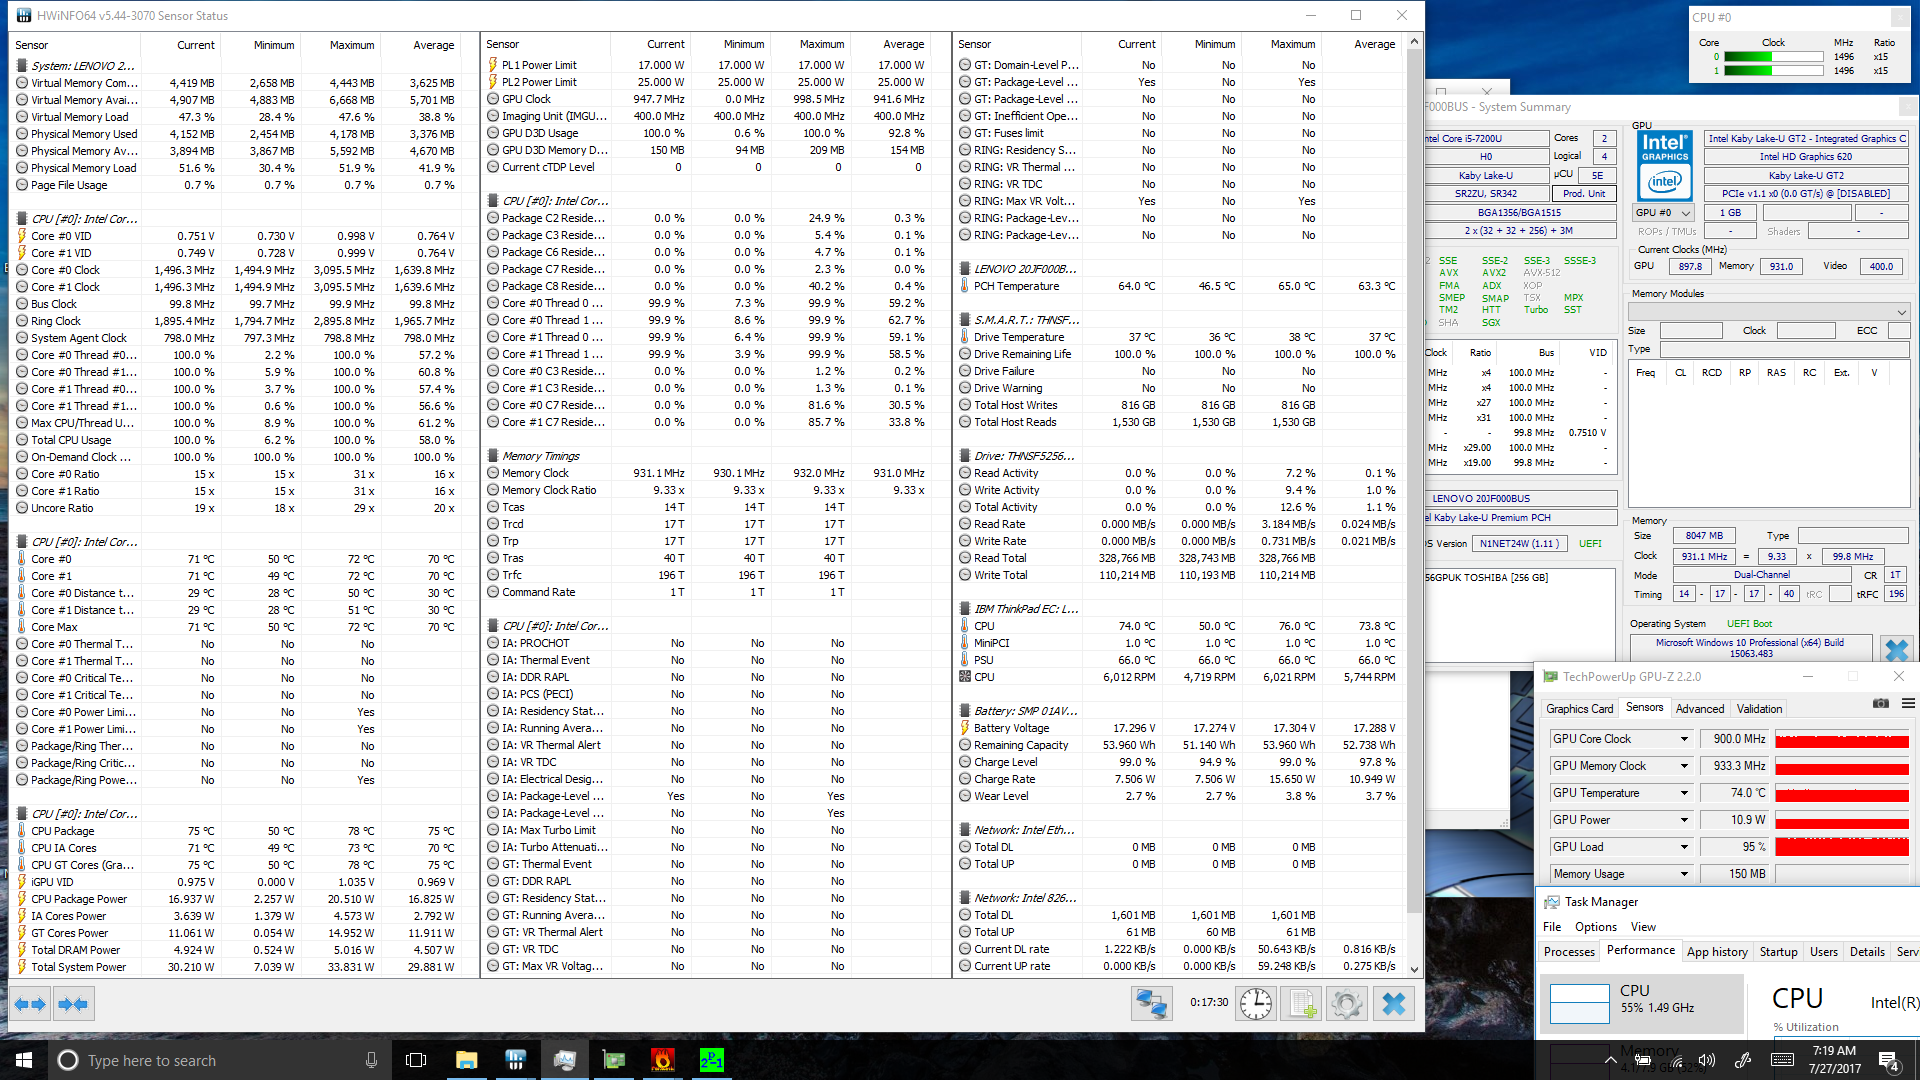
| CPU Clock (GHz) | GPU Clock (MHz) | Average CPU Temperature (°C) | Average GPU Temperature (°C) | |
| Prime95 Stress | 3.1 | - | 75 | - |
| FurMark Stress | - | 950 | - | 75 |
| Prime95 + FurMark Stress | 1.5 | 900 | 75 | 75 |
Emissions
System Noise
The ThinkPad X1 Yoga is a very quiet and unobtrusive machine overall; it’s essentially silent while idling, as the measurements across the board under those conditions match that of our environmental ambient noise level. Load conditions do produce a bit of noise, but it’s hardly anything bothersome: we recorded an overall maximum noise level of 33.6 dB(A), which is only 5.7 dB(A) above ambient noise levels.
It’s also worth pointing out that due to slight discrepancies in background noise levels, our previous Core i7 review unit was comparably quiet—though perhaps slightly noisier overall—even despite somewhat larger differences in absolute measurements as displayed in our table below.
Noise level
| Idle |
| 27.9 / 27.9 / 27.9 dB(A) |
| Load |
| 33.6 / 33.6 dB(A) |
 | ||
30 dB silent 40 dB(A) audible 50 dB(A) loud |
||
min: | ||
| Lenovo ThinkPad X1 Yoga 2017 20JD0015US HD Graphics 620, i5-7200U, Toshiba THNSF5256GPUK | Lenovo ThinkPad X1 Yoga 2017 20JES03T00 HD Graphics 620, i7-7600U, Samsung SSD PM961 1TB M.2 PCIe 3.0 x4 NVMe (MZVLW1T0) | Dell Latitude 12 5285 2-in-1 HD Graphics 620, i7-7600U, Samsung PM961 MZVLW256HEHP | Toshiba Portege X20W-D-10R HD Graphics 620, i7-7600U, Toshiba SG5 THNSNK512GVN8 | HP EliteBook x360 1030 G2 HD Graphics 620, i5-7300U, Sandisk SD8TN8U-256G-1006 | |
|---|---|---|---|---|---|
| Noise | -9% | 1% | -4% | -4% | |
| off / environment * (dB) | 27.9 | 29.3 -5% | 28.2 -1% | 30.4 -9% | 29 -4% |
| Idle Minimum * (dB) | 27.9 | 29.3 -5% | 28.2 -1% | 30.5 -9% | 29 -4% |
| Idle Average * (dB) | 27.9 | 31.1 -11% | 28.2 -1% | 30.5 -9% | 29 -4% |
| Idle Maximum * (dB) | 27.9 | 33.3 -19% | 28.2 -1% | 30.5 -9% | 29 -4% |
| Load Average * (dB) | 33.6 | 33.3 1% | 30.4 10% | 31.2 7% | 33.6 -0% |
| Load Maximum * (dB) | 33.6 | 38.9 -16% | 34 -1% | 31.3 7% | 35.8 -7% |
* ... smaller is better
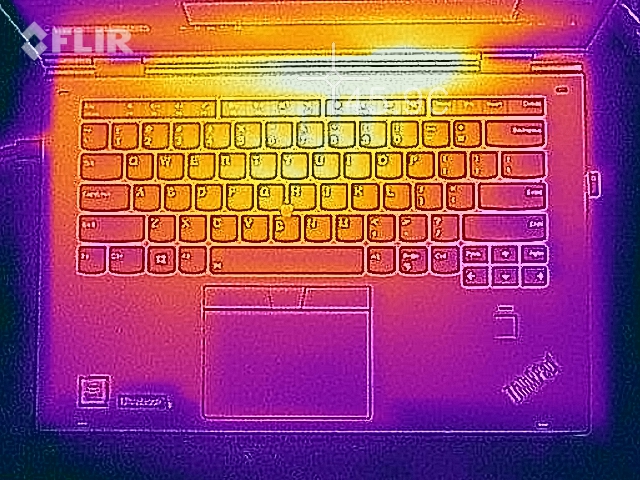
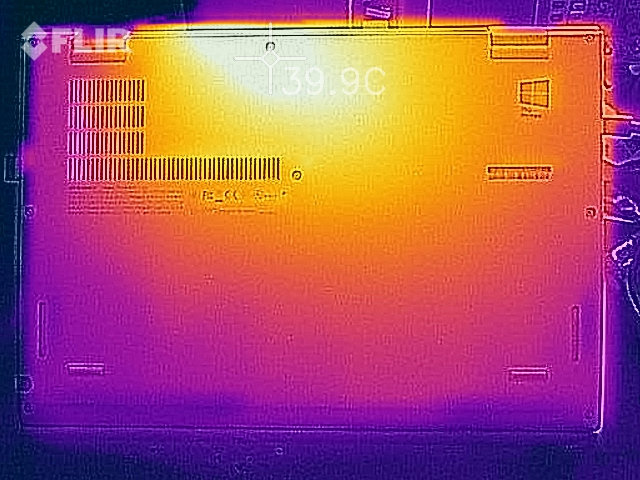
Temperature
Our temperature measurements revealed the next major difference between the Core i5 and Core i7 ThinkPad X1 Yoga configurations. Whereas our previous unit witnessed average case temperatures under load of around 37 °C and 36 °C on top and bottom respectively, the Core i5 model sees these values plummet to just 31.2 °C / 27.9 °C. Room temperatures are nearly identical in both cases, too (20.4 °C before vs. 20 °C today), so the inconsistency can’t be explained away in that manner. The Core i5 is quite simply a cooler machine.
(-) The maximum temperature on the upper side is 45.4 °C / 114 F, compared to the average of 35.4 °C / 96 F, ranging from 19.6 to 60 °C for the class Convertible.
(±) The bottom heats up to a maximum of 40 °C / 104 F, compared to the average of 36.9 °C / 98 F
(+) In idle usage, the average temperature for the upper side is 27.2 °C / 81 F, compared to the device average of 30.3 °C / 87 F.
(+) The palmrests and touchpad are cooler than skin temperature with a maximum of 26.8 °C / 80.2 F and are therefore cool to the touch.
(±) The average temperature of the palmrest area of similar devices was 28 °C / 82.4 F (+1.2 °C / 2.2 F).
Speakers
Speakers, of course, are identical across the two review units. To quickly reiterate our previous impressions, volume is adequate, overall sound quality is decent, and voices are clear and easy to understand.
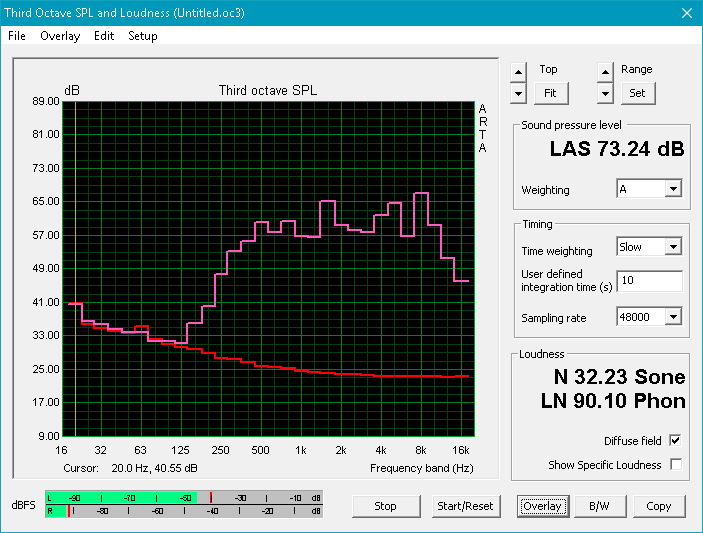
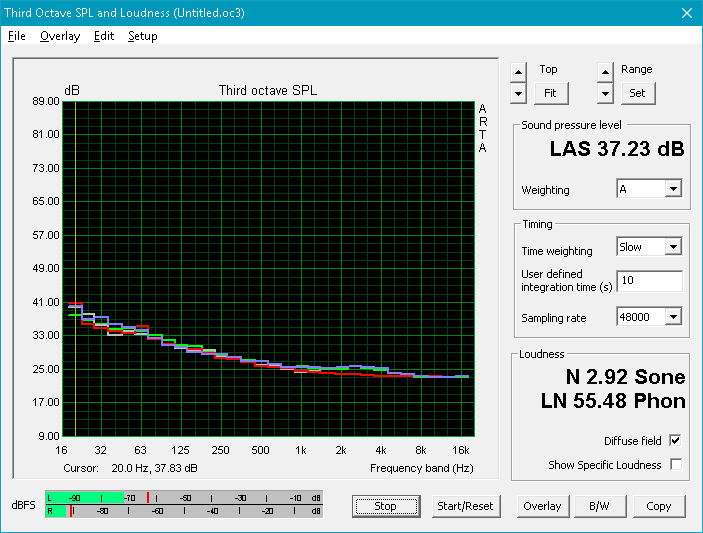
Lenovo ThinkPad X1 Yoga 2017 20JD0015US audio analysis
(±) | speaker loudness is average but good (73.2 dB)
Bass 100 - 315 Hz
(-) | nearly no bass - on average 16.8% lower than median
(±) | linearity of bass is average (11.5% delta to prev. frequency)
Mids 400 - 2000 Hz
(+) | balanced mids - only 2.6% away from median
(±) | linearity of mids is average (11.6% delta to prev. frequency)
Highs 2 - 16 kHz
(+) | balanced highs - only 4.1% away from median
(-) | highs are not linear (15.1% delta to prev. frequency)
Overall 100 - 16.000 Hz
(±) | linearity of overall sound is average (25.5% difference to median)
Compared to same class
» 78% of all tested devices in this class were better, 5% similar, 17% worse
» The best had a delta of 6%, average was 20%, worst was 57%
Compared to all devices tested
» 78% of all tested devices were better, 4% similar, 17% worse
» The best had a delta of 4%, average was 23%, worst was 134%
Toshiba Portege X20W-D-10R audio analysis
(-) | not very loud speakers (64 dB)
Bass 100 - 315 Hz
(-) | nearly no bass - on average 24.3% lower than median
(±) | linearity of bass is average (11.3% delta to prev. frequency)
Mids 400 - 2000 Hz
(+) | balanced mids - only 3.5% away from median
(±) | linearity of mids is average (7.9% delta to prev. frequency)
Highs 2 - 16 kHz
(+) | balanced highs - only 4.8% away from median
(+) | highs are linear (6.2% delta to prev. frequency)
Overall 100 - 16.000 Hz
(±) | linearity of overall sound is average (27% difference to median)
Compared to same class
» 83% of all tested devices in this class were better, 3% similar, 14% worse
» The best had a delta of 6%, average was 20%, worst was 57%
Compared to all devices tested
» 83% of all tested devices were better, 4% similar, 14% worse
» The best had a delta of 4%, average was 23%, worst was 134%
Frequency Comparison (Checkbox selectable!)
Graph 1: Pink Noise 100% Vol.; Graph 2: Audio off
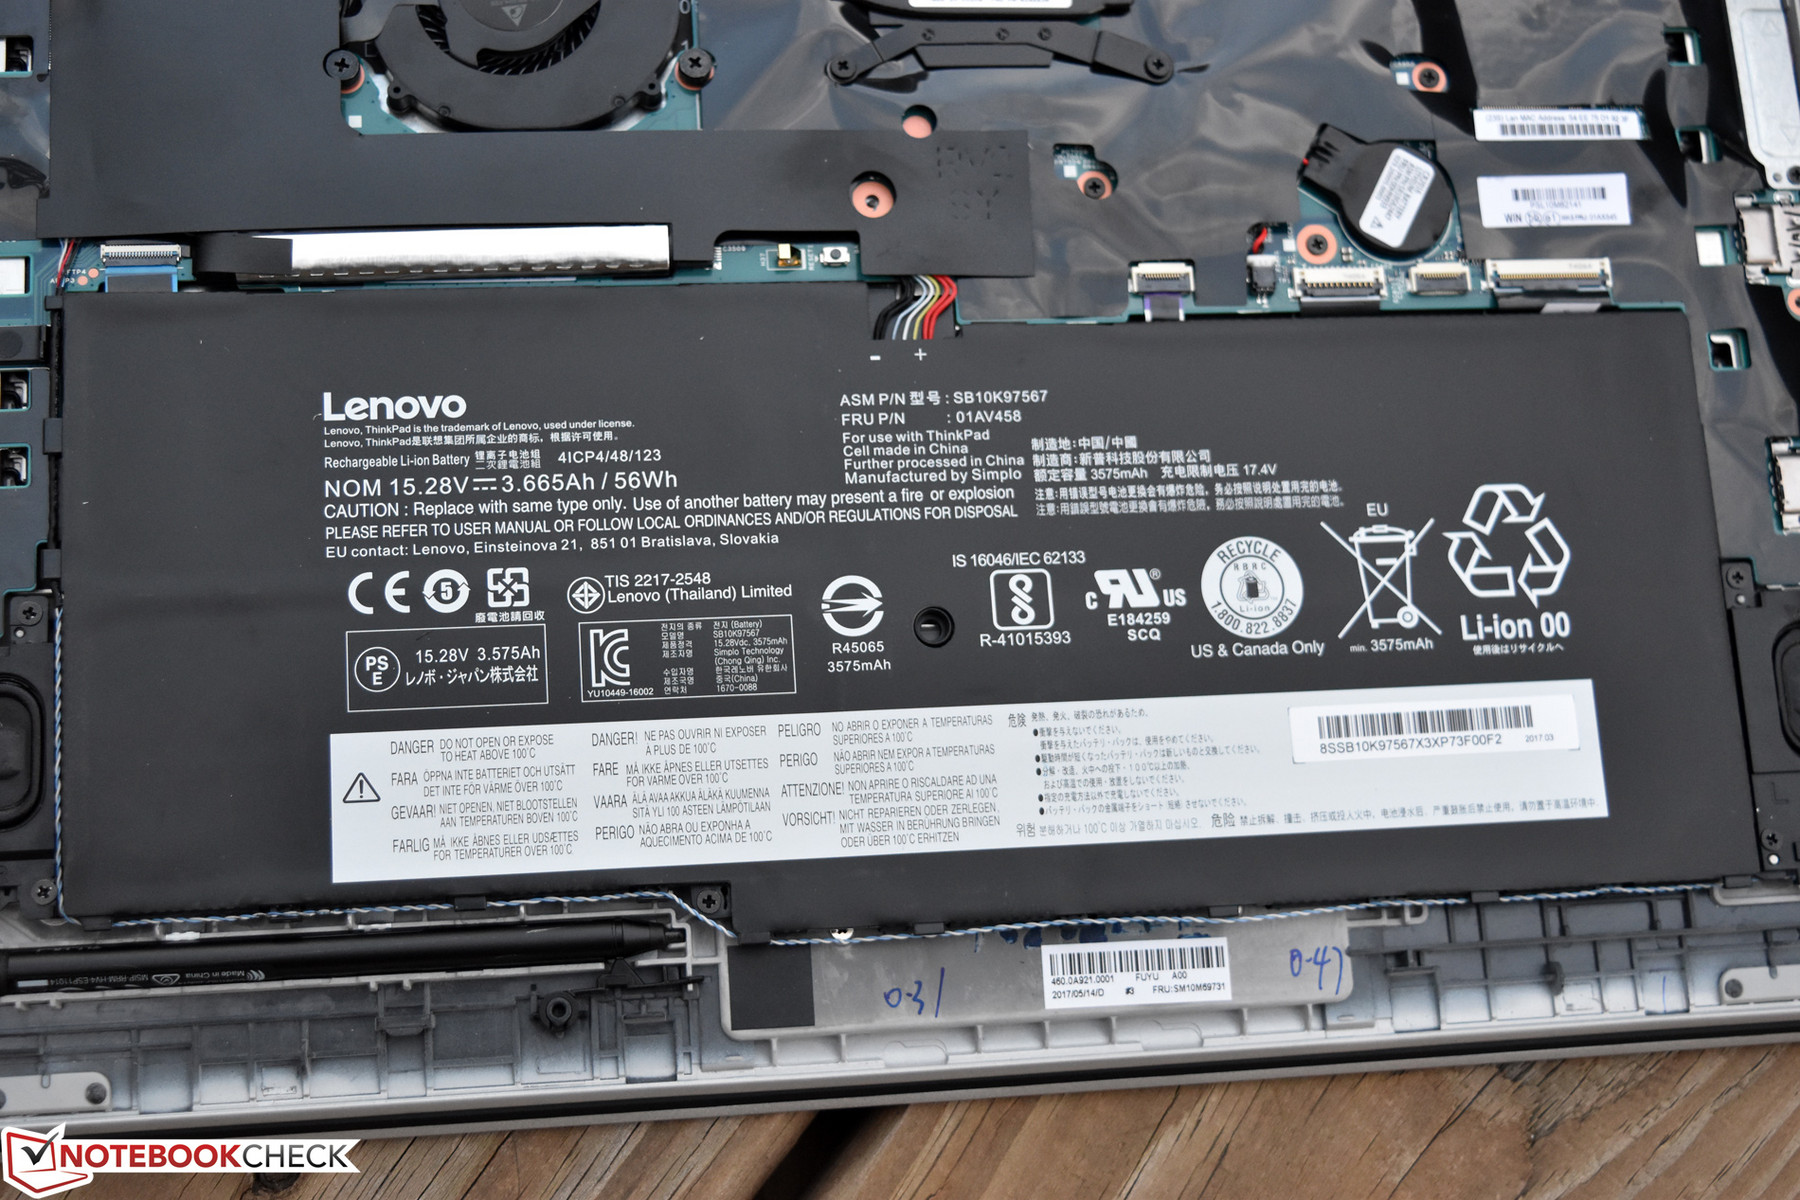
Energy Management
Power Consumption
Undoubtedly thanks in large part to the step down to the FHD IPS display (from the Core i7 model’s WQHD OLED panel), today’s ThinkPad X1 Yoga review candidate boasts somewhat lower power consumption than the previous configuration. We measured an idle average of 7.4 W, slightly below the 7.6 W of the OLED model—but we also witnessed a maximum of just 7.6 W from today’s unit versus 13.8 W from the previous one. Load average and max values are also similarly correlated: 31.3 / 34.4 W on the Core i5 model versus 33.4 W / 46.5 W on the Core i7 unit. Regardless, however, neither unit is particularly efficient as compared to other machines in today’s comparison field: the Dell Latitude, HP Elitebook, and Toshiba Portege models we’ve included for context are around 10% to 25% more efficient while idling and (in the case of the Toshiba) as much as 32% more efficient under load.
| Off / Standby | |
| Idle | |
| Load |
|
Key:
min: | |
| Lenovo ThinkPad X1 Yoga 2017 20JD0015US i5-7200U, HD Graphics 620, Toshiba THNSF5256GPUK, IPS, 1920x1080, 14" | Lenovo ThinkPad X1 Yoga 2017 20JES03T00 i7-7600U, HD Graphics 620, Samsung SSD PM961 1TB M.2 PCIe 3.0 x4 NVMe (MZVLW1T0), OLED, 2560x1440, 14" | Dell Latitude 12 5285 2-in-1 i7-7600U, HD Graphics 620, Samsung PM961 MZVLW256HEHP, IPS, 1920x1280, 12.3" | Toshiba Portege X20W-D-10R i7-7600U, HD Graphics 620, Toshiba SG5 THNSNK512GVN8, IPS, 1920x1080, 12.5" | HP EliteBook x360 1030 G2 i5-7300U, HD Graphics 620, Sandisk SD8TN8U-256G-1006, IPS, 1920x1080, 13.3" | |
|---|---|---|---|---|---|
| Power Consumption | -28% | 8% | 25% | 10% | |
| Idle Minimum * (Watt) | 4.4 | 4.9 -11% | 2.85 35% | 3.4 23% | 3.2 27% |
| Idle Average * (Watt) | 7.4 | 7.6 -3% | 6.76 9% | 5.8 22% | 5.5 26% |
| Idle Maximum * (Watt) | 7.6 | 13.8 -82% | 6.91 9% | 6.7 12% | 6.5 14% |
| Load Average * (Watt) | 31.3 | 33.4 -7% | 32.88 -5% | 21.4 32% | 29.7 5% |
| Load Maximum * (Watt) | 34.4 | 46.5 -35% | 37.41 -9% | 21.6 37% | 41.3 -20% |
* ... smaller is better
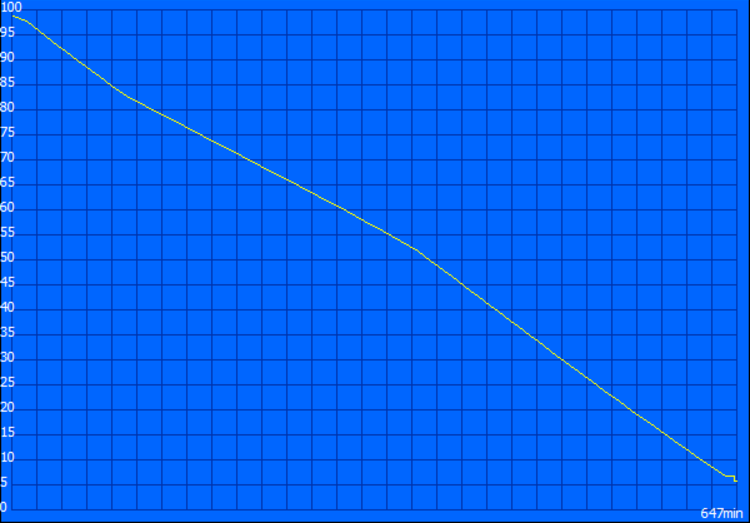
Battery Life
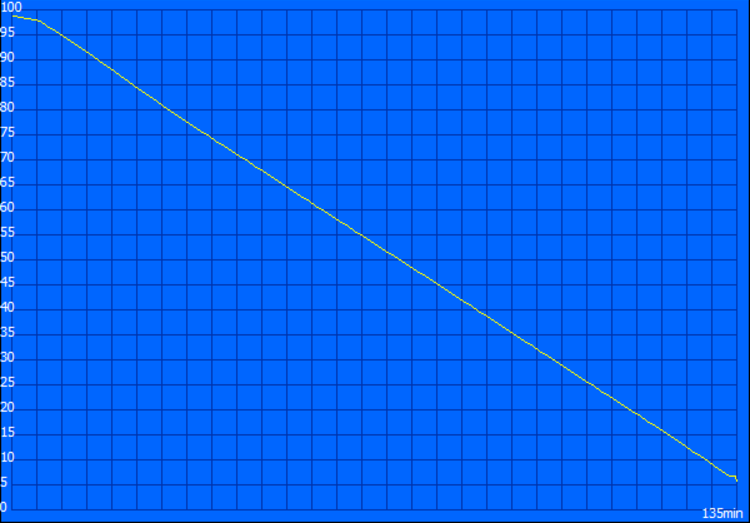
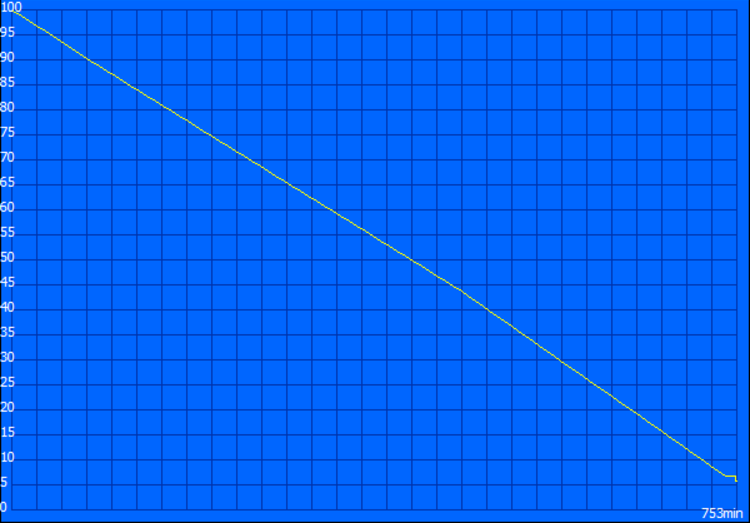
The ThinkPad X1 Yoga did well in our Wi-Fi Surfing benchmark with a result of 10 hours and 47 minutes—quite a bit longer than the 6 hours and 8 minutes of the Core i7/WQHD OLED version of the machine. On the other hand, thanks certainly to the power efficiency of OLED at low brightness values, the latter model actually does better in the Idle benchmark with over 13 hours—whereas today’s review unit managed “only” 12 hours and 33 minutes.
| Lenovo ThinkPad X1 Yoga 2017 20JD0015US i5-7200U, HD Graphics 620, 56 Wh | Lenovo ThinkPad X1 Yoga 2017 20JES03T00 i7-7600U, HD Graphics 620, 56 Wh | Dell Latitude 12 5285 2-in-1 i7-7600U, HD Graphics 620, 42 Wh | Toshiba Portege X20W-D-10R i7-7600U, HD Graphics 620, 44 Wh | HP EliteBook x360 1030 G2 i5-7300U, HD Graphics 620, 57 Wh | |
|---|---|---|---|---|---|
| Battery runtime | -18% | -2% | 18% | 53% | |
| Reader / Idle (h) | 12.6 | 13.1 4% | 17.9 42% | 16.7 33% | 23.1 83% |
| WiFi v1.3 (h) | 10.8 | 6.1 -44% | 8.1 -25% | 12 11% | 10.5 -3% |
| Load (h) | 2.3 | 2 -13% | 1.8 -22% | 2.5 9% | 4.1 78% |
Pros
Cons
Verdict
The ThinkPad X1 Yoga is not a cheap machine no matter how it’s equipped, with prices just above $2,000 for most configurations (today’s: $2,267). However, with a cost more than $1,500 lower than our Core i7/OLED review candidate, this unit probably seems far more attainable for the average business user. And that’s not the only thing that renders it potentially even more enticing than its WQHD peer: there’s also no CPU sustained performance reduction, it’s quieter, battery life is considerably longer in most cases, and thermals are much more in line. There's also no PWM in play, unlike what we discovered on our OLED review unit.
There’s not really a whole lot wrong with the ThinkPad X1 Yoga; if a 360-degree hinge convertible is what you’re after, it really ought to be on your short list.
In fact, apart from the lack of OLED and WQHD resolution (this one’s Full HD), slightly less capable CPU, and slower SSD, these are practically the same machine. And because of that, there’s not really a whole lot wrong with the ThinkPad X1 Yoga: it’s a well-rounded, quiet, cool-running, nimble, attractive piece of technology. If a 360-degree hinge convertible is what you’re after, it really ought to be on your short list.
Lenovo ThinkPad X1 Yoga 2017 20JD0015US
- 07/29/2017 v6 (old)
Steve Schardein
Price comparison
