

Intel UHD Graphics 630 vs NVIDIA GeForce RTX 2070 Super Max-Q vs Intel UHD Graphics 617
Intel UHD Graphics 630
► remove from comparisonThe Intel UHD Graphics 630 (GT2) is an integrated graphics card, which can be found in various desktop and notebook processors of the Coffee-Lake generation. The "GT2" version of the GPU offers 24 Execution Units (EUs) and the clocks depend on the CPU model. Due to its lack of dedicated graphics memory or eDRAM cache, the UHD 630 has to access the main memory (2x 64-bit DDR3L-1600 / DDR4-2133). Compared to the older HD Graphics 630 (Kaby-Lake), the newer UHD GPU is identical but can be clocked slightly higher.
Performance
The exact performance of the UHD Graphics 630 depends on various factors like TDP, L3 Cache, memory (DDR3/DDR4) and maximum clock rate of the specific model. However, it should be fairly similar to the HD Graphics 530 and HD Graphics 630 and therefore only suited for low demanding games like Overwatch or Farming Simulator 2017 (low details).
Features
The features of the UHD 630 are the same as for the HD 630 and therefore H.265/HEVC Main10 profile at 10-bit color depth are supported in hardware. Furthermore, HDCP 2.2 is also supported in all chips, which allows Netflix 4K videos, for instance. HDMI 2.0 however is still only supported with an external converter chip (LSPCon).
Power Consumption
The UHD Graphics 630 can be found in several notebook and desktop processors of different TDP classes (35 - 91 W).
NVIDIA GeForce RTX 2070 Super Max-Q
► remove from comparison
The NVIDIA GeForce RTX 2070 Super with Max-Q design is the power saving variant of the mobile GeForce RTX 2070 Super with reduced clock speeds, performance and of course power consumption. It is intended for thin gaming laptops. It is based on the same TU104-725-A1 chip with 2,560 shaders, 8 GB GDDR6 memory and a 256 Bit memory bus. Currently we know of three variants with a TGP of 80, 85 and 90 Watt, base clock speeds of 930, 1005, and 1080 MHz, and turbo clock speeds of 1155, 1230 and 1290 MHz. The mobile variant for comparison is rated at 115 W and 1140 - 1380 MHz.
With the refresh, Nvidia also reworked the Max-Q technologies for more efficiency. Low Voltage GDDR6 (lower clocked but more headroom for the GPU) and improved regulator efficiency should improve the performance per Watt. Two new optional features can also be implemented by the OEM. Max-Q Dynamic Boost is able to shift power from the CPU to the GPU on a per frame basis to increase overall performance. Furthermore, the laptop manufacturer can also implement Advanced Optimus with a dynamic display switch (hardware) to enable Optimus, G-SYNC and high refresh rate displays (up to 4K 120 Hz).
Features
NVIDIA manufacturers the TU104 chip on a 12 nm FinFET process and includes features like Deep Learning Super Sampling (DLSS) and Real-Time Ray Tracing (RTRT), which should combine to create more realistic lighting effects than older GPUs based on the company's Pascal architecture (if the games supports it). The RTX 2070 Super Max-Q is also DisplayPort 1.4 ready, while there is also support for HDMI 2.0b, HDR, Simultaneous Multi-Projection (SMP) and H.265 video en/decoding (PlayReady 3.0).
Performance
Due to the lower clock rates, the Max-Q variant is clearly slower than the mobile RTX 2070 Super. The difference depends on the used variant, where the 90 W version is only slightly slower. Therefore, the performance should be sufficient for maximum detail settings at a QHD resolution. With raytracing enabled, you may have to reduce settings or resolution. Less demanding games can be easily played in 4k.
The power consumption of the card is between 80 - 90 Watt TGP and therefore clearly lower than the RTX 2070 Super Mobile (115 Watt).
Intel UHD Graphics 617
► remove from comparisonThe Intel UHD Graphics 617 (GT2) is a low-end integrated graphics unit, which can be found in the Y-series of the Amber-Lake generation. This "GT2" version offers 24 Execution Units (EUs) clocked at up to 1050 MHz (depending on the CPU model). Due to its lack of dedicated graphics memory or eDRAM cache, the UHD 617 has to access the main memory (2x 64bit DDR3L/LPDDR3). Compared to the old HD Graphics 615 in Kaby-Lake-Y CPUs, the UHD 617 is the same GPU with slightly different clock speeds (depending on the model) and slight power/performance improvements due to the improved 14nm++ process. Compared to the similar UHD Graphics 615 in other Amber Lake models, the 617 looks to be higher clocked (+50 MHz) and has more headroom due to the higher TDP of 7 versus 5 Watt.
Performance
The 3D performance of the UHD 617 depends on the CPU model and the cooling / TDP-setting of the laptop. Furthermore, the used main memory (single channel, DDR3(L), amount) is influencing performance. On average the UHD graphics 617 should be very similar to the Kaby-Lake HD Graphics 615 due to the same architecture and similar speeds. That means that only low demanding games like Farming Simulator 17 or Rocket League are playable in lowest detail settings.
Features
The revised video engine in the HD 615 and UHD 615 / 617 now supports H.265/HEVC Main10 profile in hardware with 10 bit colors. Furthermore, Googles VP9 codec can also be hardware decoded. The UHD 617 should support HDCP 2.2 and therefore Netflix 4K. HDMI 2.0 however is still only supported with an external converter chip (LSPCon).
Power Consumption
The UHD Graphics 617 can be found in Y processors with 7 W TDP and is therefore suited for very thin, mostly passively cooled subnotebooks like the MacBook Air 2018.
| Intel UHD Graphics 630 | NVIDIA GeForce RTX 2070 Super Max-Q | Intel UHD Graphics 617 | ||||||||||||||||||||||||||||||||||||||||||||||||||||||||||||||||||||||||||||||||||||||||||||||||||||||||||||||||||||||||||||||||||||||||
| Gen. 9.5 Series |
|
|
| |||||||||||||||||||||||||||||||||||||||||||||||||||||||||||||||||||||||||||||||||||||||||||||||||||||||||||||||||||||||||||||||||||||||
| Codename | Kaby-Lake-H-GT2 | N18E-G2R | Kaby-Lake GT2 | |||||||||||||||||||||||||||||||||||||||||||||||||||||||||||||||||||||||||||||||||||||||||||||||||||||||||||||||||||||||||||||||||||||||
| Architecture | Gen. 9.5 | Turing | Gen. 9 Amber Lake | |||||||||||||||||||||||||||||||||||||||||||||||||||||||||||||||||||||||||||||||||||||||||||||||||||||||||||||||||||||||||||||||||||||||
| Pipelines | 24 - unified | 2560 - unified | 24 - unified | |||||||||||||||||||||||||||||||||||||||||||||||||||||||||||||||||||||||||||||||||||||||||||||||||||||||||||||||||||||||||||||||||||||||
| Core Speed | 300 - 1150 (Boost) MHz | 930 - 1155 (Boost) MHz | 300 - 1150 (Boost) MHz | |||||||||||||||||||||||||||||||||||||||||||||||||||||||||||||||||||||||||||||||||||||||||||||||||||||||||||||||||||||||||||||||||||||||
| Memory Bus Width | 64/128 Bit | 256 Bit | 64/128 Bit | |||||||||||||||||||||||||||||||||||||||||||||||||||||||||||||||||||||||||||||||||||||||||||||||||||||||||||||||||||||||||||||||||||||||
| Shared Memory | yes | no | yes | |||||||||||||||||||||||||||||||||||||||||||||||||||||||||||||||||||||||||||||||||||||||||||||||||||||||||||||||||||||||||||||||||||||||
| API | DirectX 12_1, OpenGL 4.4 | DirectX 12_1, OpenGL 4.6 | DirectX 12_1, OpenGL 4.4 | |||||||||||||||||||||||||||||||||||||||||||||||||||||||||||||||||||||||||||||||||||||||||||||||||||||||||||||||||||||||||||||||||||||||
| technology | 14 nm | 12 nm | 14 nm | |||||||||||||||||||||||||||||||||||||||||||||||||||||||||||||||||||||||||||||||||||||||||||||||||||||||||||||||||||||||||||||||||||||||
| Features | QuickSync | DLSS, Raytraycing, VR Ready, G-SYNC, Vulkan, Multi Monitor, 550 Watt system power recommended | QuickSync | |||||||||||||||||||||||||||||||||||||||||||||||||||||||||||||||||||||||||||||||||||||||||||||||||||||||||||||||||||||||||||||||||||||||
| Date of Announcement | 01.10.2017 | 02.04.2020 | 30.10.2018 | |||||||||||||||||||||||||||||||||||||||||||||||||||||||||||||||||||||||||||||||||||||||||||||||||||||||||||||||||||||||||||||||||||||||
| Memory Speed | 11000 MHz | |||||||||||||||||||||||||||||||||||||||||||||||||||||||||||||||||||||||||||||||||||||||||||||||||||||||||||||||||||||||||||||||||||||||||
| Memory Type | GDDR6 | DDR3L/LPDDR3 | ||||||||||||||||||||||||||||||||||||||||||||||||||||||||||||||||||||||||||||||||||||||||||||||||||||||||||||||||||||||||||||||||||||||||
| Max. Amount of Memory | 8 GB | |||||||||||||||||||||||||||||||||||||||||||||||||||||||||||||||||||||||||||||||||||||||||||||||||||||||||||||||||||||||||||||||||||||||||
| Power Consumption | 80 Watt | |||||||||||||||||||||||||||||||||||||||||||||||||||||||||||||||||||||||||||||||||||||||||||||||||||||||||||||||||||||||||||||||||||||||||
| Notebook Size | large |
|
| |||||||||||||||||||||||||||||||||||||||||
Benchmarks
3DM Vant. Perf. total + Intel UHD Graphics 630
specvp12 sw-03 + Intel UHD Graphics 630
Cinebench R15 OpenGL 64 Bit + Intel UHD Graphics 630
Average Benchmarks Intel UHD Graphics 630 → 100% n=12
Average Benchmarks NVIDIA GeForce RTX 2070 Super Max-Q → 1030% n=12
Average Benchmarks Intel UHD Graphics 617 → 76% n=12
* Smaller numbers mean a higher performance
1 This benchmark is not used for the average calculation
Game Benchmarks
The following benchmarks stem from our benchmarks of review laptops. The performance depends on the used graphics memory, clock rate, processor, system settings, drivers, and operating systems. So the results don't have to be representative for all laptops with this GPU. For detailed information on the benchmark results, click on the fps number.


Ready or Not
2023
Total War Pharaoh
2023
EA Sports FC 24
2023
Counter-Strike 2
2023

Armored Core 6
2023
Atlas Fallen
2023


Dead Island 2
2023

Atomic Heart
2023
Hogwarts Legacy
2023
High On Life
2023


Vampire Bloodhunt
2022

Cyberpunk 2077 1.6
2022
GRID Legends
2022

Farming Simulator 22
2021
Forza Horizon 5
2021
Riders Republic
2021
Back 4 Blood
2021
Alan Wake Remastered
2021


Outriders
2021
Hitman 3
2021
Cyberpunk 2077 1.0
2020
Yakuza Like a Dragon
2020


Dirt 5
2020
Watch Dogs Legion
2020
FIFA 21
2020

Serious Sam 4
2020
Crysis Remastered
2020

Horizon Zero Dawn
2020
Death Stranding
2020
F1 2020
2020
Gears Tactics
2020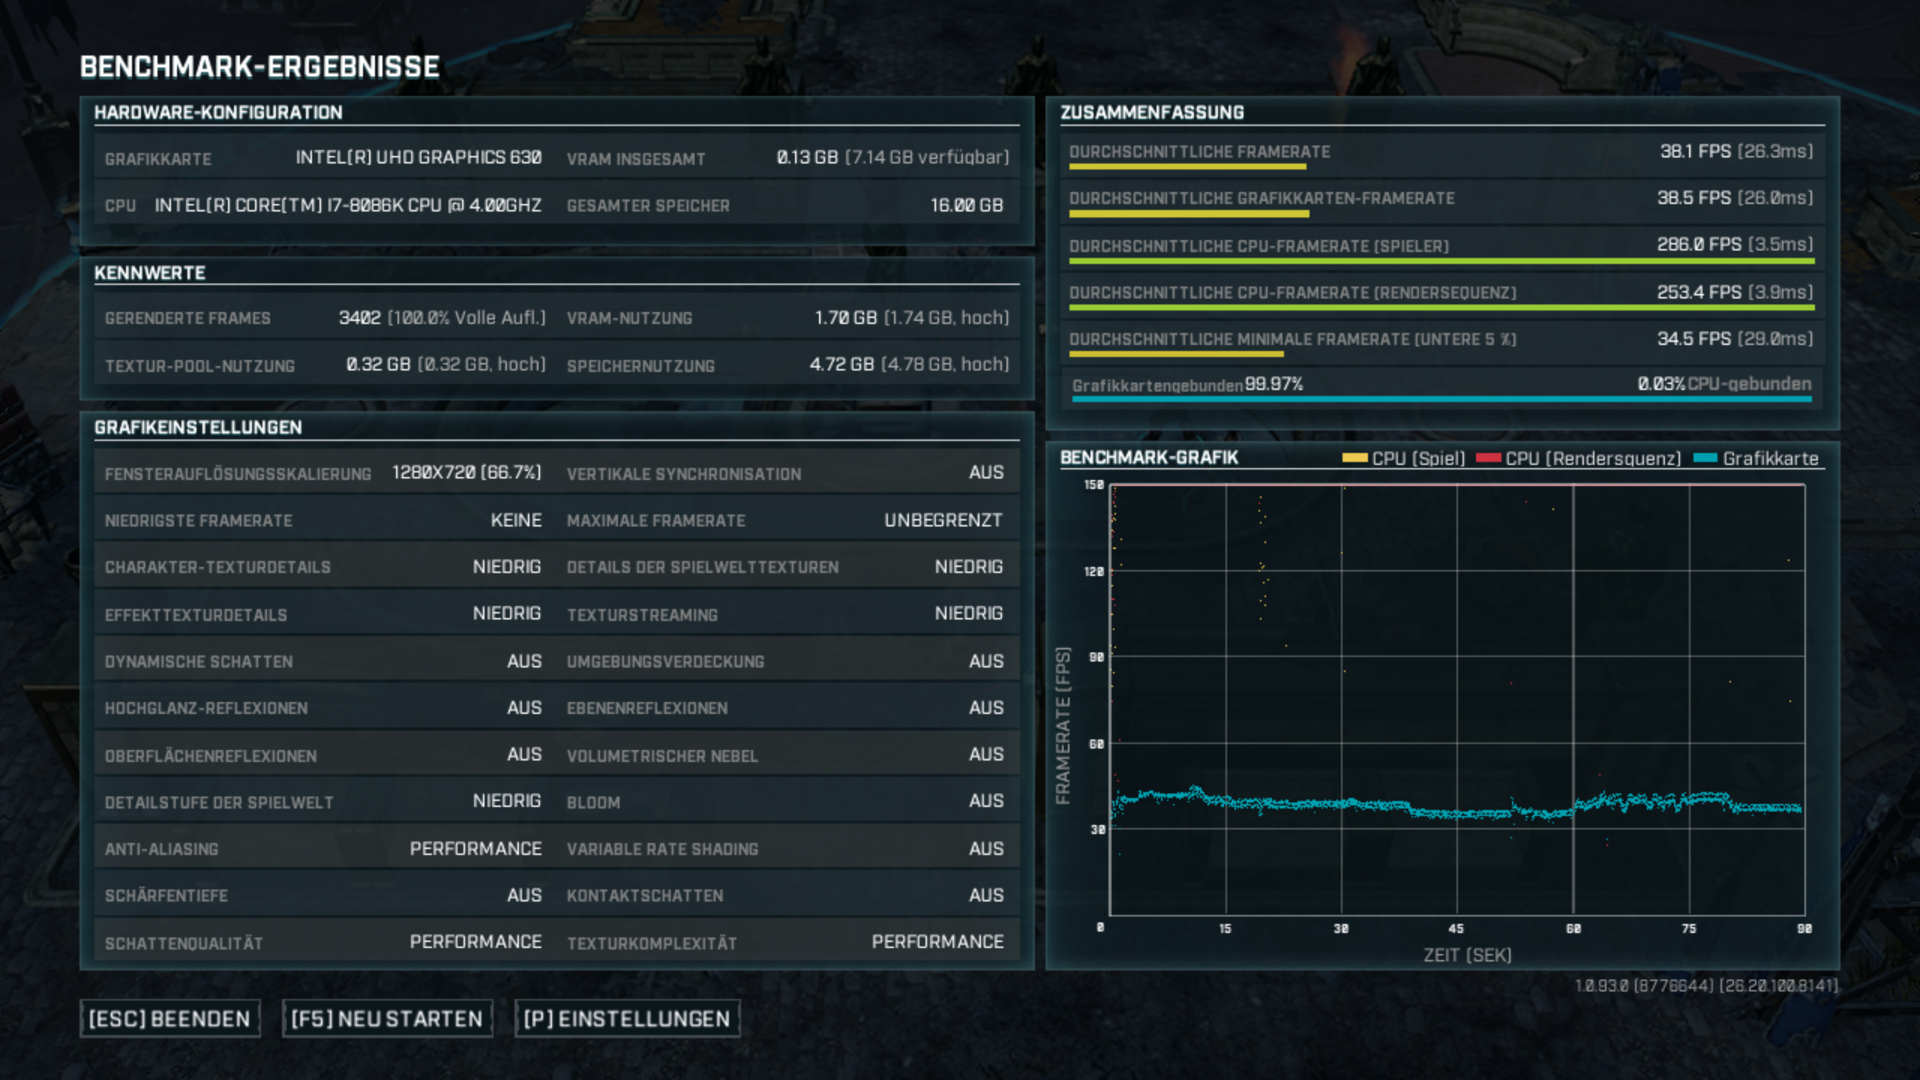

Doom Eternal
2020
Hunt Showdown
2020
Escape from Tarkov
2020


Need for Speed Heat
2019

GRID 2019
2019

FIFA 20
2019
Borderlands 3
2019
Control
2019
F1 2019
2019
League of Legends
2019

Rage 2
2019
Anno 1800
2019
The Division 2
2019
Dirt Rally 2.0
2019

Far Cry New Dawn
2019
Metro Exodus
2019
Apex Legends
2019
Just Cause 4
2018
Darksiders III
2018
Battlefield V
2018
Farming Simulator 19
2018
Fallout 76
2018
Hitman 2
2018


FIFA 19
2018

Strange Brigade
2018

Monster Hunter World
2018
The Crew 2
2018
Far Cry 5
2018
World of Tanks enCore
2018
X-Plane 11.11
2018


Fortnite
2018


Call of Duty WWII
2017


Destiny 2
2017

The Evil Within 2
2017

FIFA 18
2017


Team Fortress 2
2017Rocket League
2017For Honor
2017
Resident Evil 7
2017Farming Simulator 17
2016
Battlefield 1
2016
Civilization 6
2016

Overwatch
2016

The Division
2016
Far Cry Primal
2016

Rainbow Six Siege
2015
Anno 2205
2015
World of Warships
2015
Metal Gear Solid V
2015Dota 2 Reborn
2015
The Witcher 3
2015
Dirt Rally
2015
GTA V
2015

Sims 4
2014BioShock Infinite
2013
Tomb Raider
2013Counter-Strike: GO
2012
Diablo III
2012

StarCraft 2
2010Average Gaming Intel UHD Graphics 630 → 100%
Average Gaming 30-70 fps → 100%
Average Gaming NVIDIA GeForce RTX 2070 Super Max-Q → 1195%
Average Gaming Intel UHD Graphics 617 → 77%
Average Gaming 30-70 fps → 81%
For more games that might be playable and a list of all games and graphics cards visit our Gaming List