NVIDIA GeForce RTX 2050 Mobile ► remove from comparison The NVIDIA GeForce RTX 2050 for laptops (GN20-S7) is a fast mid-range gaming graphics card for laptops . The RTX 2050 is based on the modern Ampere GA107 chip (like the RTX 3050 ) which is manufactured on an 8nm Samsung process (8N). Compared to the similar GeForce MX570 , the RTX2050 offers Raytracing and DLSS support.
Compared to the old Geforce RTX 2060 Mobile, the 2050 offers more shaders (2,048) but a greatly reduced memory bus (64 Bit). It is available in different versions with with TGPs ranging from 30 to 45 Watt. The maximum boost clock ranges from 1155 to 1477 MHz. It features up to 4 GB GDDR6 graphics memory (14 Gbps leading to 112 GB/s max throughput).
The gaming performance of the mobile RTX 2050 should be clearly lower than the RTX 2060 thanks to the greatly reduced graphics memory bus. First benchmarks position a fast version slightly above a GeForce GTX 1650 and on the same level of a GeForce MX570. However, games that support DLSS can offer clear performance advantages thanks to the Tensor cores.
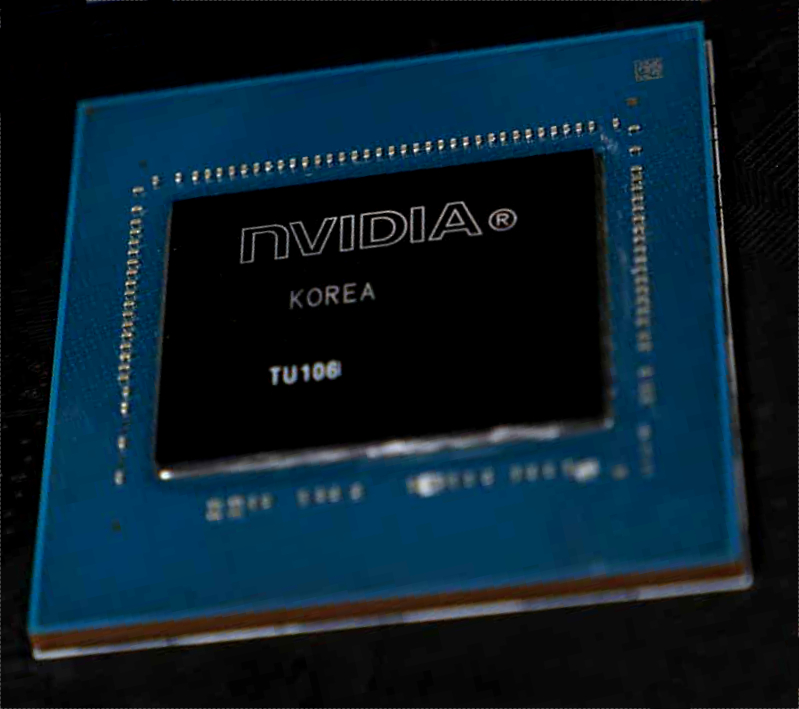
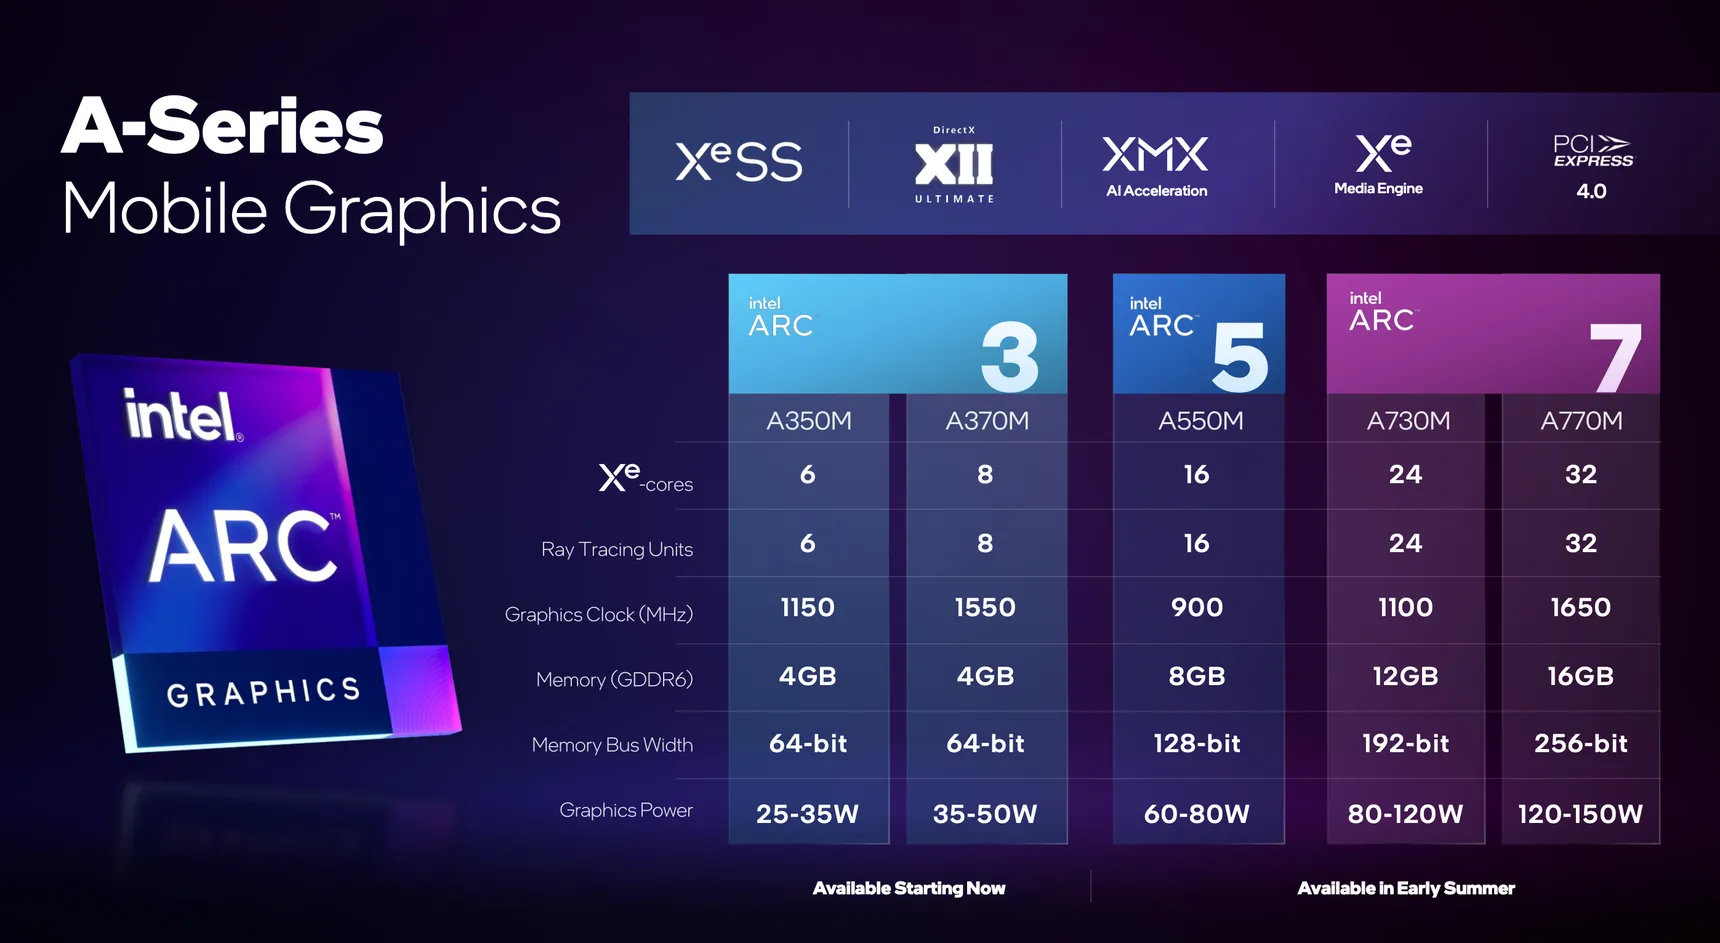
Intel Arc A530M ► remove from comparison The Intel Arc A530M (device ID 5697) is a dedicated mobile lower- mid-range graphics card for laptops based on Xe HPG microarchitecture. It uses the ACM-G12 chip and offers 12 of the 16 Xe-cores (192 ALUs), 12 ray tracing units and a 128-bit memory bus for 8 GB GDDR6 graphics memory. The cores can clock from 300 MHz (low frequency mode) to 1300 MHz (high frequency) or in short bursts 2050+ MHz (short bursts / Turbo).
The performance of the Arc A530M should be slightly below the older Arc A550M (more cores but less clock speed).
The chip also integrates two media engines for VP9, AVC, HEVC, and AV1 8k en- and decoding. The 4 display pipes support up to 4x 4k120 HDR via DMI 2.0B or DisplayPort 2.0 10G.
The A530M is produced in 6nm at TSMC (N6 process) and supports dynamic power share (using Deep Link) with 12th gen Intel CPUs (Alder Lake).
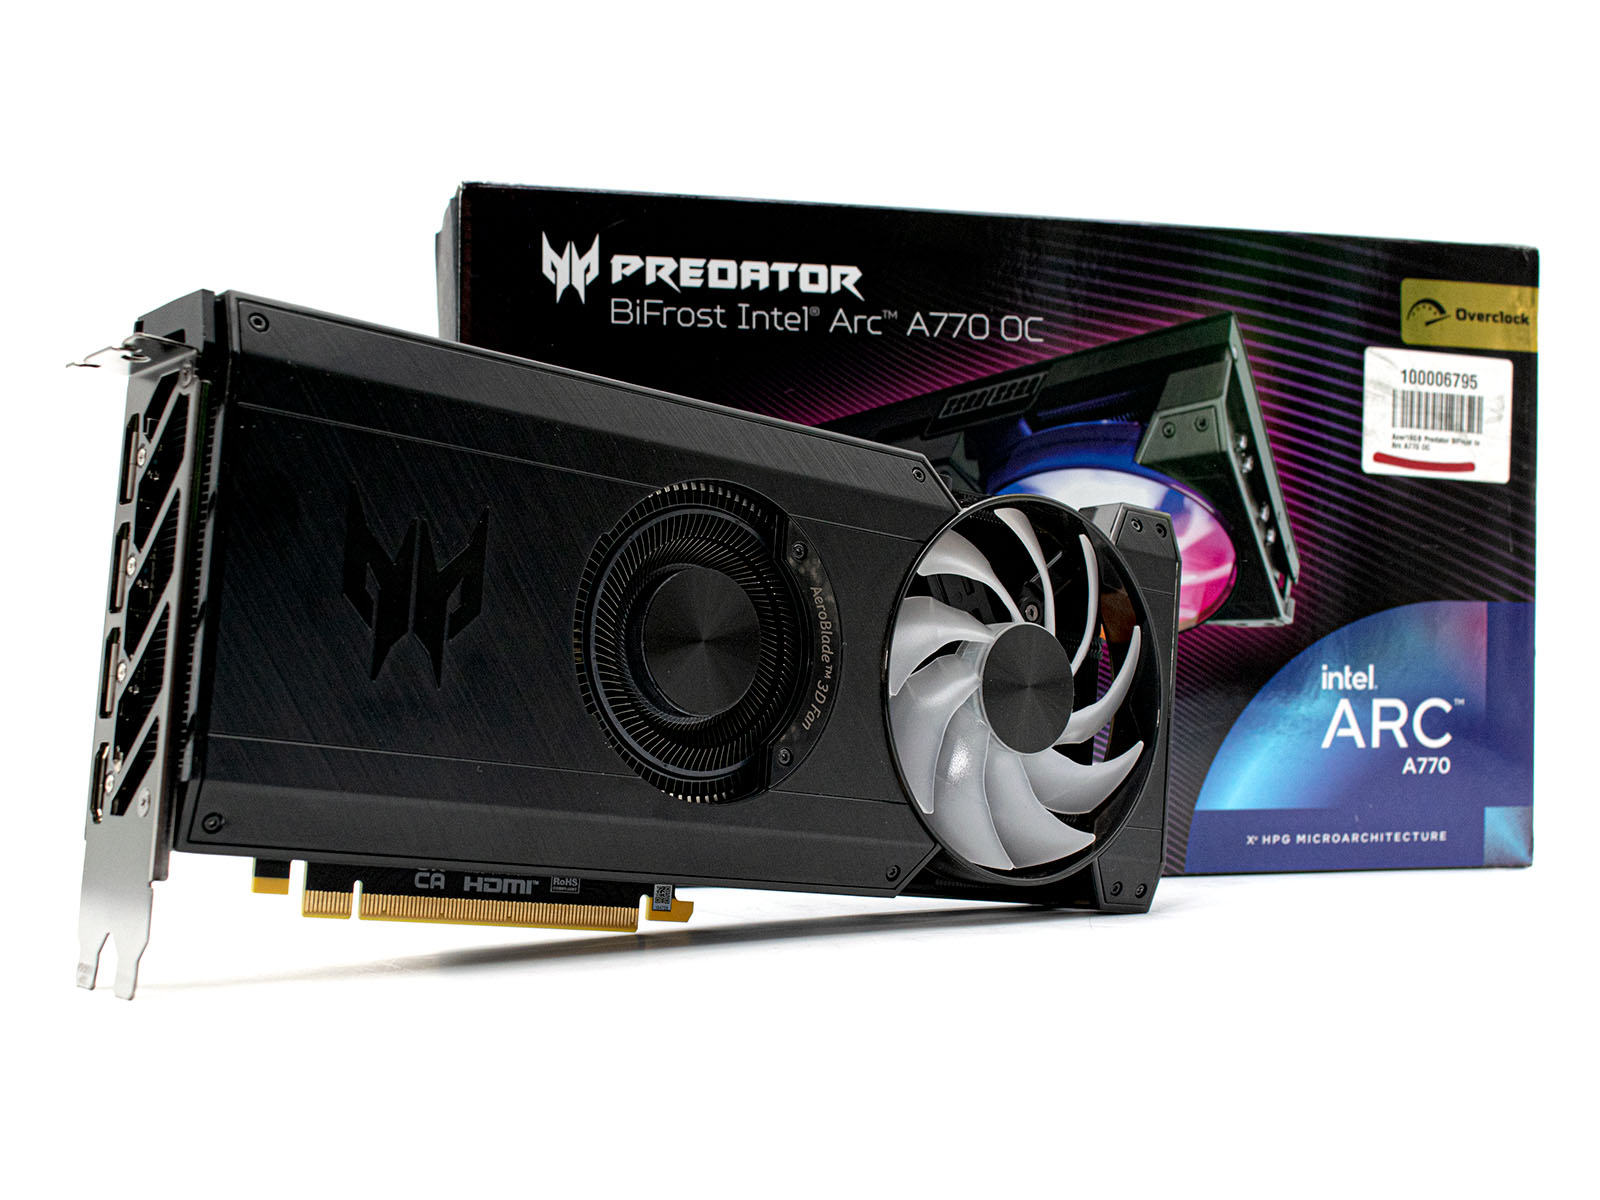
Intel Arc A770 ► remove from comparison The Intel Arc A770 is a mid-range desktop GPU and is manufactured using the 6 nm process at TSMC. The graphics processor has 4,096 shader units and 8 or 16 GB GDDR6 VRAM with a 256-bit interface (16 Gbps, 512 GB/s).
Features
As the top model based on the Alchemist architecture, Intel offers the Arc A770, the top model in the series. As a completely new development, Intel wants to put pressure on AMD and Nvidia with these graphics cards. Features such as ray tracing are supported and the Intel Arc A770 comes with 32 RT cores. Intel is also implementing 512 Tensor Cores, which we can already find in the current graphics cards from Nvidia. With support for AV1, the graphics card is particularly interesting for content creators. Only the Ada Lovelace models from Nvidia and the RDNA3 GPUs from AMD are currently capable of hardware-side encoding and decoding with the new codec.
Performance
The performance of the Intel Arc A770 is comparable with an Nvidia GeForce RTX 4060 or an AMD Radeon RX 7600 comparable. The Intel model copes much better with newer games. With ray tracing enabled, the Intel Arc A770 can even outperform its two competitors. Based on the performance shown, the Intel Arc A770 is ideally suited for 1080p gaming in 2023.
Power consumption
The manufacturer specifies the power consumption of the Intel Arc A770 at 225 watts (TGP). This is slightly more than a Nvidia GeForce RTX 4060 or the AMD Radeon RX 7600 .
NVIDIA GeForce RTX 2050 Mobile Intel Arc A530M Intel Arc A770 Arc Series Arc B580 2560 @ 2.67 - 2.67 GHz 192 Bit @ 19000 MHz Arc A770 4096 @ 2.1 - 2.4 GHz 256 Bit @ 16000 MHz Arc A750 3584 @ 2.05 - 2.4 GHz 256 Bit @ 16000 MHz Arc A580 3072 @ 1.7 - 2 GHz 256 Bit @ 16000 MHz A770M 4096 @ 1.65 GHz 256 Bit @ 16000 MHz A730M 3072 @ 1.1 GHz 192 Bit @ 14000 MHz A570M 16 @ 0.9 - 1.3 GHz 128 Bit @ 14000 MHz A550M 16 @ 0.9 - 2.01 GHz 128 Bit @ 14000 MHz A530M 12 @ 0.9 - 1.3 GHz 128 Bit @ 14000 MHz A370M 8 @ 1.55 GHz 64 Bit @ 14000 MHz Arc A380 1024 @ 2 GHz 96 Bit @ 15500 MHz A310 6 @ 2 GHz 64 Bit @ 15500 MHz A350M 6 @ 1.15 GHz 64 Bit @ 14000 MHz
Arc B580 2560 @ 2.67 - 2.67 GHz 192 Bit @ 19000 MHz Arc A770 4096 @ 2.1 - 2.4 GHz 256 Bit @ 16000 MHz Arc A750 3584 @ 2.05 - 2.4 GHz 256 Bit @ 16000 MHz Arc A580 3072 @ 1.7 - 2 GHz 256 Bit @ 16000 MHz A770M 4096 @ 1.65 GHz 256 Bit @ 16000 MHz A730M 3072 @ 1.1 GHz 192 Bit @ 14000 MHz A570M 16 @ 0.9 - 1.3 GHz 128 Bit @ 14000 MHz A550M 16 @ 0.9 - 2.01 GHz 128 Bit @ 14000 MHz A530M 12 @ 0.9 - 1.3 GHz 128 Bit @ 14000 MHz A370M 8 @ 1.55 GHz 64 Bit @ 14000 MHz Arc A380 1024 @ 2 GHz 96 Bit @ 15500 MHz A310 6 @ 2 GHz 64 Bit @ 15500 MHz A350M 6 @ 1.15 GHz 64 Bit @ 14000 MHz
Codename GN20-S7 Alchemist DG2-512 Architecture Ampere Xe HPG Xe Pipelines 2048 - unified 12 - unified 4096 - unified Core Speed 1477 (Boost) MHz 900 - 1300 (Boost) MHz 2100 - 2400 (Boost) MHz Memory Speed 14000 MHz 14000 effective = 1750 MHz 16000 effective = 2000 MHz Memory Bus Width 64 Bit 128 Bit 256 Bit Memory Type GDDR6 GDDR6 GDDR6 Max. Amount of Memory 4 GB 8 GB 16 GB Shared Memory no no no API DirectX 12_1, OpenGL 4.6 DirectX 12_2, Shader 6.6, OpenGL 4.6, OpenCL 3.0, Vulkan 1.3 DirectX 12 Ultimate (12_2), Shader 6.6, OpenGL 4.6, OpenCL 3.0, Vulkan 1.3 Power Consumption 30-45 Watt 65 Watt (65 - 95 Watt TGP) 225 Watt technology 8 nm 6 nm 6 nm Features DLSS, Raytraycing, VR Ready, G-SYNC, Vulkan, Multi Monitor Notebook Size large Date of Announcement 17.12.2021 31.07.2023 12.10.2022 TMUs 96 256 ROPs 48 128 Raytracing Cores 12 32 Cache L2: 8 MB L2: 16 MB Memory Bandwidth 224 GB/s 512 GB/s PCIe 4 16x 4.0 x16 Displays 4 Displays (max.), HDMI 2.0b, DisplayPort 2.0 10G Ready 4 Displays (max.), HDMI 2.1, DisplayPort 2.0 Link to Manufacturer Page www.intel.com Tensor / AI Cores 512 Theoretical Performance 39.32 TFLOPS FP16, 19.66 TFLOPS FP32 Transistors 21.7 Billion Die Size 406 mm²
Performance Rating - 3DMark 11 + Fire Strike + Time Spy - GeForce RTX 2050 Mobile
...
NVIDIA GeForce RTX 2050 Mobile
...
max:
Performance Rating - 3DMark 11 + Fire Strike + Time Spy - Arc A770
3DMark - 3DMark Speed Way Score
min: 2452 avg: 2464 median: 2463 (17%) max: 2477 Points
3DMark - 3DMark Steel Nomad
min: 2540 avg: 2809 median: 2827 (19%) max: 3041 Points
Model CPU GPU RAM Value Acer Predator BiFrost Arc A770 OC Vulkan i9-14900K 253 W / 253 W Arc A770 210 W 2400 / 2000 MHz 16 GB 32 GB 2540 Acer Predator BiFrost Arc A770 OC Vulkan R7 9800X3D 162 W / 120 W Arc A770 210 W 2400 / 2000 MHz 16 GB 32 GB 2622 Acer Predator BiFrost Arc A770 OC DX12 R7 9800X3D 162 W / 120 W Arc A770 210 W 2400 / 2000 MHz 16 GB 32 GB 3032 Acer Predator BiFrost Arc A770 OC DX12 i9-14900K 253 W / 253 W Arc A770 210 W 2400 / 2000 MHz 16 GB 32 GB 3041
3DMark - 3DMark Wild Life Extreme Unlimited
min: 8064 avg: 8136 median: 8135.5 (9%) max: 8207 Points
3DMark - 3DMark Solar Bay
min: 49731 avg: 52443 median: 52443 (24%) max: 55155 Points
Model CPU GPU RAM Value Acer Predator BiFrost Arc A770 OC i9-14900K 253 W / 253 W Arc A770 210 W 2400 / 2000 MHz 16 GB 32 GB 49731 Acer Predator BiFrost Arc A770 OC R7 9800X3D 162 W / 120 W Arc A770 210 W 2400 / 2000 MHz 16 GB 32 GB 55155
GPU TDP 30 W TDP 210 W 25% 100%
3DMark - 3DMark Fire Strike Standard Score
min: 7230 avg: 8117 median: 7959.5 (12%) max: 9475 Points
GPU TDP ? TDP 30 W TDP 32 W TDP 35 W TDP 40 W TDP 60 W 85% 77% 78% 82% 90% 100%
min: 26251 avg: 28447 median: 28336 (43%) max: 30755 Points
GPU TDP ? TDP 30 W TDP 32 W TDP 35 W TDP 40 W TDP 60 W TDP 210 W 28% 25% 26% 27% 30% 33% 100%
3DMark - 3DMark Fire Strike Standard Graphics
min: 8249 avg: 9219 median: 8964.5 (8%) max: 10621 Points
GPU TDP ? TDP 30 W TDP 32 W TDP 35 W TDP 40 W TDP 60 W 85% 80% 79% 84% 91% 100%
min: 27035 avg: 29903 median: 30008 (28%) max: 32666 Points
GPU TDP ? TDP 30 W TDP 32 W TDP 35 W TDP 40 W TDP 60 W TDP 210 W 30% 28% 28% 30% 32% 35% 100%
3DMark - 3DMark Ice Storm Graphics
min: 112270 avg: 137604 median: 143152 (16%) max: 151843 Points
GPU TDP 32 W TDP 35 W 77% 100%
min: 489026 avg: 564801 median: 597398 (66%) max: 607978 Points
GPU TDP 32 W TDP 35 W TDP 210 W 20% 26% 100%
3DMark - 3DMark Time Spy Score
min: 1230 avg: 3461 median: 3529 (9%) max: 4326 Points
GPU TDP ? TDP 30 W TDP 32 W TDP 35 W TDP 40 W TDP 60 W 86% 73% 29% 80% 85% 100%
min: 5663 avg: 5902 median: 5901.5 (15%) max: 6140 Points
GPU TDP ? TDP 30 W TDP 32 W TDP 35 W TDP 40 W TDP 60 W 100% 65% 26% 71% 76% 90%
min: 14047 avg: 14189 median: 14057 (36%) max: 14463 Points
GPU TDP ? TDP 30 W TDP 32 W TDP 35 W TDP 40 W TDP 60 W TDP 210 W 34% 22% 9% 24% 26% 30% 100%
3DMark - 3DMark Time Spy Graphics
min: 1072 avg: 3155 median: 3220.5 (7%) max: 3938 Points
GPU TDP ? TDP 30 W TDP 32 W TDP 35 W TDP 40 W TDP 60 W 82% 74% 27% 83% 88% 100%
GPU TDP ? TDP 30 W TDP 32 W TDP 35 W TDP 40 W TDP 60 W 100% 64% 24% 71% 76% 86%
min: 13779 avg: 13849 median: 13815 (28%) max: 13953 Points
GPU TDP ? TDP 30 W TDP 32 W TDP 35 W TDP 40 W TDP 60 W TDP 210 W 33% 21% 8% 23% 25% 28% 100%
3DMark - 3DMark Ice Storm Unlimited Graphics
min: 628292 avg: 685325 median: 699999 (71%) max: 727683 Points
3DMark - 3DMark Ice Storm Extreme Graphics
min: 442457 avg: 493853 median: 516087 (60%) max: 523016 Points
3DMark - 3DMark Cloud Gate Score
min: 23186 avg: 29670 median: 26385 (25%) max: 40781 Points
GPU TDP ? TDP 30 W TDP 32 W TDP 35 W TDP 40 W TDP 60 W 72% 64% 58% 68% 66% 100%
min: 69520 avg: 71173 median: 69692 (66%) max: 74307 Points
GPU TDP ? TDP 30 W TDP 32 W TDP 35 W TDP 40 W TDP 60 W TDP 210 W 41% 36% 33% 39% 37% 56% 100%
3DMark - 3DMark Cloud Gate Graphics
min: 47225 avg: 57528 median: 58068 (14%) max: 66365 Points
GPU TDP ? TDP 30 W TDP 32 W TDP 35 W TDP 40 W TDP 60 W 90% 75% 73% 87% 100% 99%
min: 116619 avg: 129692 median: 133291 (33%) max: 139166 Points
GPU TDP ? TDP 30 W TDP 32 W TDP 35 W TDP 40 W TDP 60 W TDP 210 W 45% 38% 36% 43% 50% 50% 100%
3DMark - 3DMark Night Raid
min: 72422 avg: 73990 median: 72638 (69%) max: 76909 Points
GPU TDP ? TDP 210 W 53% 100%
3DMark - 3DMark Night Raid Graphics Score
min: 127190 avg: 129330 median: 129052 (50%) max: 131749 Points
3DMark 11 - 3DM11 Performance Score
min: 9246 avg: 12457 median: 12222.5 (15%) max: 15542 Points
GPU TDP ? TDP 30 W TDP 32 W TDP 35 W TDP 40 W TDP 60 W 81% 71% 60% 75% 86% 100%
min: 32346 avg: 35240 median: 35386 (43%) max: 37987 Points
GPU TDP ? TDP 30 W TDP 32 W TDP 35 W TDP 40 W TDP 60 W TDP 210 W 35% 31% 26% 33% 38% 44% 100%
3DMark 11 - 3DM11 Performance GPU
min: 10598 avg: 12801 median: 12495 (10%) max: 15411 Points
GPU TDP ? TDP 30 W TDP 32 W TDP 35 W TDP 40 W TDP 60 W 81% 74% 70% 81% 88% 100%
min: 34499 avg: 38352 median: 39253 (30%) max: 41303 Points
GPU TDP ? TDP 30 W TDP 32 W TDP 35 W TDP 40 W TDP 60 W TDP 210 W 32% 29% 28% 32% 35% 40% 100%
3DMark Vantage + NVIDIA GeForce RTX 2050 Mobile 3DMark Vantage - 3DM Vant. Perf. total
min: 40973 avg: 46821 median: 46821 (14%) max: 52669 Points
GPU TDP 35 W TDP 60 W 78% 100%
3DM Vant. Perf. total + Intel Arc A770 min: 103295 avg: 106563 median: 106563 (31%) max: 109831 Points
GPU TDP 35 W TDP 60 W TDP 210 W 38% 49% 100%
3DM Vant. Perf. GPU no PhysX + NVIDIA GeForce RTX 2050 Mobile 3DMark Vantage - 3DM Vant. Perf. GPU no PhysX
min: 42344 avg: 45988 median: 45987.5 (25%) max: 49631 Points
GPU TDP 35 W TDP 60 W 85% 100%
3DM Vant. Perf. GPU no PhysX + Intel Arc A770 min: 102514 avg: 105977 median: 105976 (58%) max: 109439 Points
GPU TDP 35 W TDP 60 W TDP 210 W 40% 47% 100%
3DMark 05 - 3DMark 05 - Standard
min: 64907 avg: 68054 median: 68053.5 (75%) max: 71200 Points
3DMark 06 3DMark 06 - Standard 1280x1024 + NVIDIA GeForce RTX 2050 Mobile 3DMark 06
min: 38036 avg: 39263 median: 39263 (51%) max: 40490 Points
GPU TDP 30 W TDP 35 W 94% 100%
3DMark 06 - Standard 1280x1024 + Intel Arc A770 min: 58321 avg: 61381 median: 61380.5 (80%) max: 64440 Points
GPU TDP 30 W TDP 35 W TDP 210 W 62% 66% 100%
Unigine Valley 1.0 - Unigine Valley 1.0 DX
min: 83 avg: 91.9 median: 96.2 (29%) max: 96.5 fps
Blender - Blender 3.3 Classroom CUDA *
min: 126 avg: 148.3 median: 147 (22%) max: 175 Seconds
GPU TDP ? TDP 30 W TDP 32 W TDP 35 W TDP 40 W TDP 60 W 106% 100% 106% 102% 107% 109%
Blender - Blender 3.3 Classroom OPTIX *
min: 76 avg: 90.8 median: 87 (32%) max: 110 Seconds
GPU TDP ? TDP 30 W TDP 32 W TDP 35 W TDP 40 W TDP 60 W 115% 100% 114% 104% 116% 120%
SPECviewperf 12 + Intel Arc A770 SPECviewperf 12 - specvp12 sw-03
min: 72.2 avg: 72.8 median: 72.8 (18%) max: 73.4 fps
specvp12 snx-02 + Intel Arc A770 SPECviewperf 12 - specvp12 snx-02
min: 1.42 avg: 1.5 median: 1.5 (0%) max: 1.67 fps
specvp12 showcase-01 + Intel Arc A770 SPECviewperf 12 - specvp12 showcase-01
min: 119 avg: 130 median: 130 (23%) max: 141 fps
specvp12 mediacal-01 + Intel Arc A770 SPECviewperf 12 - specvp12 mediacal-01
min: 46.7 avg: 47.3 median: 47.3 (12%) max: 47.8 fps
specvp12 maya-04 + Intel Arc A770 SPECviewperf 12 - specvp12 maya-04
min: 172 avg: 177.5 median: 177.5 (48%) max: 183 fps
specvp12 energy-01 + Intel Arc A770 SPECviewperf 12 - specvp12 energy-01
min: 2.24 avg: 2.3 median: 2.3 (2%) max: 2.44 fps
specvp12 creo-01 + Intel Arc A770 SPECviewperf 12 - specvp12 creo-01
min: 45.3 avg: 45.6 median: 45.6 (18%) max: 45.8 fps
specvp12 catia-04 + Intel Arc A770 SPECviewperf 12 - specvp12 catia-04
min: 174 avg: 174.5 median: 174.5 (29%) max: 175 fps
specvp12 3dsmax-05 + Intel Arc A770 SPECviewperf 12 - specvp12 3dsmax-05
min: 179 avg: 183 median: 183 (28%) max: 187 fps
SPECviewperf 13 specvp13 sw-04 + NVIDIA GeForce RTX 2050 Mobile SPECviewperf 13 - specvp13 sw-04
specvp13 sw-04 + Intel Arc A770 min: 77.5 avg: 78.4 median: 78.4 (21%) max: 79.2 fps
GPU TDP 35 W TDP 210 W 86% 100%
specvp13 snx-03 + NVIDIA GeForce RTX 2050 Mobile SPECviewperf 13 - specvp13 snx-03
specvp13 snx-03 + Intel Arc A770 min: 2.55 avg: 2.8 median: 2.8 (0%) max: 3.06 fps
GPU TDP 35 W TDP 210 W 100% 24%
specvp13 showcase-02 + NVIDIA GeForce RTX 2050 Mobile SPECviewperf 13 - specvp13 showcase-02
specvp13 showcase-02 + Intel Arc A770 min: 119 avg: 129.5 median: 129.5 (22%) max: 140 fps
GPU TDP 35 W TDP 210 W 31% 100%
specvp13 medical-02 + NVIDIA GeForce RTX 2050 Mobile SPECviewperf 13 - specvp13 medical-02
specvp13 medical-02 + Intel Arc A770 min: 80.8 avg: 88.2 median: 88.2 (15%) max: 95.6 fps
GPU TDP 35 W TDP 210 W 34% 100%
specvp13 maya-05 + NVIDIA GeForce RTX 2050 Mobile SPECviewperf 13 - specvp13 maya-05
specvp13 maya-05 + Intel Arc A770 min: 319 avg: 324 median: 324 (37%) max: 329 fps
GPU TDP 35 W TDP 210 W 40% 100%
specvp13 energy-02 + NVIDIA GeForce RTX 2050 Mobile SPECviewperf 13 - specvp13 energy-02
specvp13 energy-02 + Intel Arc A770 min: 22.3 avg: 22.4 median: 22.4 (7%) max: 22.5 fps
GPU TDP 35 W TDP 210 W 26% 100%
specvp13 creo-02 + NVIDIA GeForce RTX 2050 Mobile SPECviewperf 13 - specvp13 creo-02
specvp13 creo-02 + Intel Arc A770 min: 90 avg: 90.8 median: 90.8 (13%) max: 91.6 fps
GPU TDP 35 W TDP 210 W 100% 95%
specvp13 catia-05 + NVIDIA GeForce RTX 2050 Mobile SPECviewperf 13 - specvp13 catia-05
specvp13 catia-05 + Intel Arc A770 min: 258 avg: 259 median: 259 (29%) max: 260 fps
GPU TDP 35 W TDP 210 W 25% 100%
specvp13 3dsmax-06 + NVIDIA GeForce RTX 2050 Mobile SPECviewperf 13 - specvp13 3dsmax-06
specvp13 3dsmax-06 + Intel Arc A770 min: 179 avg: 181 median: 181 (28%) max: 183 fps
GPU TDP 35 W TDP 210 W 50% 100%
SPECviewperf 2020 specvp2020 solidworks-05 1080p + NVIDIA GeForce RTX 2050 Mobile SPECviewperf 2020 - specvp2020 solidworks-05 1080p
specvp2020 snx-04 1080p + NVIDIA GeForce RTX 2050 Mobile SPECviewperf 2020 - specvp2020 snx-04 1080p
specvp2020 snx-04 1080p + Intel Arc A770 Model CPU GPU RAM Value Acer Predator BiFrost Arc A770 OC i9-14900K 253 W / 253 W Arc A770 210 W 2400 / 2000 MHz 16 GB 32 GB 3.04
GPU TDP 35 W TDP 210 W 100% 13%
specvp2020 medical-03 1080p + NVIDIA GeForce RTX 2050 Mobile SPECviewperf 2020 - specvp2020 medical-03 1080p
specvp2020 medical-03 1080p + Intel Arc A770 Model CPU GPU RAM Value Acer Predator BiFrost Arc A770 OC i9-14900K 253 W / 253 W Arc A770 210 W 2400 / 2000 MHz 16 GB 32 GB 48.5
GPU TDP 35 W TDP 210 W 64% 100%
specvp2020 maya-06 1080p + NVIDIA GeForce RTX 2050 Mobile SPECviewperf 2020 - specvp2020 maya-06 1080p
specvp2020 maya-06 1080p + Intel Arc A770 Model CPU GPU RAM Value Acer Predator BiFrost Arc A770 OC i9-14900K 253 W / 253 W Arc A770 210 W 2400 / 2000 MHz 16 GB 32 GB 358
GPU TDP 35 W TDP 210 W 91% 100%
specvp2020 energy-03 1080p + NVIDIA GeForce RTX 2050 Mobile SPECviewperf 2020 - specvp2020 energy-03 1080p
specvp2020 energy-03 1080p + Intel Arc A770 Model CPU GPU RAM Value Acer Predator BiFrost Arc A770 OC i9-14900K 253 W / 253 W Arc A770 210 W 2400 / 2000 MHz 16 GB 32 GB 22.3
GPU TDP 35 W TDP 210 W 100% 63%
specvp2020 creo-03 1080p + NVIDIA GeForce RTX 2050 Mobile SPECviewperf 2020 - specvp2020 creo-03 1080p
specvp2020 creo-03 1080p + Intel Arc A770 Model CPU GPU RAM Value Acer Predator BiFrost Arc A770 OC i9-14900K 253 W / 253 W Arc A770 210 W 2400 / 2000 MHz 16 GB 32 GB 70.3
GPU TDP 35 W TDP 210 W 100% 74%
specvp2020 catia-06 1080p + NVIDIA GeForce RTX 2050 Mobile SPECviewperf 2020 - specvp2020 catia-06 1080p
specvp2020 catia-06 1080p + Intel Arc A770 Model CPU GPU RAM Value Acer Predator BiFrost Arc A770 OC i9-14900K 253 W / 253 W Arc A770 210 W 2400 / 2000 MHz 16 GB 32 GB 64.4
GPU TDP 35 W TDP 210 W 91% 100%
specvp2020 3dsmax-07 1080p + NVIDIA GeForce RTX 2050 Mobile SPECviewperf 2020 - specvp2020 3dsmax-07 1080p
specvp2020 3dsmax-07 1080p + Intel Arc A770 Model CPU GPU RAM Value Acer Predator BiFrost Arc A770 OC i9-14900K 253 W / 253 W Arc A770 210 W 2400 / 2000 MHz 16 GB 32 GB 96.3
GPU TDP 35 W TDP 210 W 94% 100%
specvp2020 snx-04 4k + Intel Arc A770 SPECviewperf 2020 - specvp2020 snx-04 4k
min: 2.55 avg: 2.9 median: 3 (0%) max: 3.08 fps
specvp2020 medical-03 4k + Intel Arc A770 SPECviewperf 2020 - specvp2020 medical-03 4k
min: 22.3 avg: 23.1 median: 23.5 (15%) max: 23.5 fps
specvp2020 maya-06 4k + Intel Arc A770 SPECviewperf 2020 - specvp2020 maya-06 4k
min: 195 avg: 196.7 median: 197 (28%) max: 198 fps
specvp2020 energy-03 4k + Intel Arc A770 SPECviewperf 2020 - specvp2020 energy-03 4k
min: 25 avg: 25.2 median: 25.2 (6%) max: 25.3 fps
specvp2020 creo-03 4k + Intel Arc A770 SPECviewperf 2020 - specvp2020 creo-03 4k
min: 52.9 avg: 54.3 median: 55 (25%) max: 55 fps
specvp2020 catia-06 4k + Intel Arc A770 SPECviewperf 2020 - specvp2020 catia-06 4k
min: 38.9 avg: 43.3 median: 44.5 (29%) max: 46.5 fps
specvp2020 3dsmax-07 4k + Intel Arc A770 SPECviewperf 2020 - specvp2020 3dsmax-07 4k
min: 47.4 avg: 58.6 median: 64 (22%) max: 64.3 fps
Cinebench R10 Cinebench R10 Shading (32bit) + NVIDIA GeForce RTX 2050 Mobile Cinebench R10 - Cinebench R10 Shading (32bit)
Cinebench R11.5 Cinebench R11.5 OpenGL 64 Bit + NVIDIA GeForce RTX 2050 Mobile Cinebench R11.5 - Cinebench R11.5 OpenGL 64 Bit
Cinebench R15 + NVIDIA GeForce RTX 2050 Mobile Cinebench R15 - Cinebench R15 OpenGL 64 Bit
min: 142.3 avg: 166 median: 159.8 (9%) max: 211 fps
GPU TDP ? TDP 30 W TDP 32 W TDP 35 W TDP 40 W TDP 60 W 85% 82% 76% 84% 98% 100%
Cinebench R15 OpenGL Ref. Match 64 Bit + NVIDIA GeForce RTX 2050 Mobile Cinebench R15 - Cinebench R15 OpenGL Ref. Match 64 Bit
GPU TDP ? TDP 30 W TDP 32 W TDP 35 W TDP 40 W TDP 60 W 100% 100% 100% 100% 100% 100%
GFXBench - GFXBench 5.0 4K Aztec Ruins High Tier Offscreen
min: 36.93 avg: 39.8 median: 39.8 (15%) max: 42.6 fps
GPU TDP 35 W TDP 60 W 87% 100%
GFXBench - GFXBench 5.0 Aztec Ruins High Tier Offscreen
min: 83.53 avg: 93.2 median: 93.2 (17%) max: 102.8 fps
GPU TDP 35 W TDP 60 W 81% 100%
GPU TDP ? TDP 35 W TDP 60 W 100% 59% 73%
GFXBench - GFXBench 5.0 Aztec Ruins Normal Tier Offscreen
min: 213.05 avg: 231.7 median: 231.7 (17%) max: 250.3 fps
GPU TDP 35 W TDP 60 W 85% 100%
GFXBench - GFXBench Car Chase Offscreen
min: 198.63 avg: 216.2 median: 216.2 (20%) max: 233.8 fps
GPU TDP 35 W TDP 60 W 85% 100%
GPU TDP ? TDP 35 W TDP 60 W 100% 82% 97%
GFXBench 3.0 - GFXBench 3.0 Manhattan Offscreen
GFXBench (DX / GLBenchmark) 2.7 + NVIDIA GeForce RTX 2050 Mobile GFXBench (DX / GLBenchmark) 2.7 - GFXBench T-Rex HD Offscreen C24Z16
Basemark GPU 1.2 - Basemark GPU 1.2 Vulkan Official Medium Offscreen 1080
min: 153.5 avg: 163.7 median: 163.7 (4%) max: 173.8 fps
GPU TDP 35 W TDP 40 W 88% 100%
min: 104.6 avg: 641 median: 640.8 (16%) max: 1177 fps
GPU TDP 35 W TDP 40 W TDP 210 W 24% 27% 100%
Basemark GPU 1.2 - Basemark GPU 1.2 Vulkan Official High Offscreen 2160
min: 3.64 avg: 54 median: 54 (10%) max: 104.4 fps
Geekbench 6.5 - Geekbench 6.5 GPU OpenCL
min: 42076 avg: 43667 median: 43444.5 (11%) max: 45703 Points
GPU TDP 30 W TDP 35 W TDP 40 W 98% 94% 100%
min: 108692 avg: 113475 median: 113475 (29%) max: 118258 Points
GPU TDP 30 W TDP 35 W TDP 40 W TDP 210 W 38% 37% 39% 100%
Geekbench 6.5 - Geekbench 6.5 GPU Vulkan
min: 40112 avg: 41614 median: 41279 (10%) max: 43451 Points
GPU TDP 30 W TDP 40 W 95% 100%
min: 103684 avg: 104221 median: 104220 (26%) max: 104757 Points
GPU TDP 30 W TDP 40 W TDP 210 W 38% 41% 100%
LuxMark v2.0 64Bit - LuxMark v2.0 Room GPU
min: 3249 avg: 3287 median: 3287 (12%) max: 3325 Samples/s
GPU TDP 60 W TDP 210 W 35% 100%
LuxMark v2.0 64Bit - LuxMark v2.0 Sala GPU
min: 10015 avg: 10468 median: 10468 (18%) max: 10921 Samples/s
GPU TDP 60 W TDP 210 W 26% 100%
ComputeMark v2.1 - ComputeMark v2.1 Result
min: 8754 avg: 9237 median: 9236.5 (8%) max: 9719 Points
GPU TDP 35 W TDP 60 W 90% 100%
min: 22732 avg: 23165 median: 22765 (19%) max: 23997 Points
GPU TDP 35 W TDP 60 W TDP 210 W 38% 42% 100%
Power Consumption - Furmark Stress Test Power Consumption - external Monitor *
min: 49.4 avg: 61.5 median: 54.8 (7%) max: 91.6 Watt
GPU TDP ? TDP 30 W TDP 32 W TDP 35 W TDP 40 W TDP 60 W 105% 105% 106% 105% 104% 100%
min: 350 avg: 368 median: 368 (50%) max: 386 Watt
GPU TDP ? TDP 30 W TDP 32 W TDP 35 W TDP 40 W TDP 60 W TDP 210 W 184% 184% 185% 184% 181% 175% 100%
Power Consumption - The Witcher 3 Power Consumption - external Monitor *
min: 44.1 avg: 60.8 median: 59.9 (8%) max: 79.4 Watt
GPU TDP ? TDP 30 W TDP 32 W TDP 35 W TDP 40 W TDP 60 W 102% 105% 104% 103% 102% 100%
min: 287 avg: 292.5 median: 292.5 (41%) max: 298 Watt
GPU TDP ? TDP 30 W TDP 32 W TDP 35 W TDP 40 W TDP 60 W TDP 210 W 153% 159% 158% 156% 154% 151% 100%
Power Consumption - Witcher 3 Power Consumption *
min: 49.3 avg: 64.5 median: 60.4 (13%) max: 85 Watt
GPU TDP ? TDP 30 W TDP 32 W TDP 35 W TDP 40 W TDP 60 W 104% 109% 109% 106% 107% 100%
Power Consumption - Power Efficiency - Witcher 3 ultra
min: 0.4614 avg: 0.5 median: 0.5 (46%) max: 0.55 fps per Watt
GPU TDP 35 W TDP 40 W TDP 60 W 99% 100% 84%
Power Consumption - Power Efficiency - Witcher 3 ultra external Monitor
min: 0.4987 avg: 0.5 median: 0.5 (44%) max: 0.57 fps per Watt
GPU TDP 30 W TDP 35 W TDP 40 W TDP 60 W 97% 100% 92% 90%
GPU TDP 30 W TDP 35 W TDP 40 W TDP 60 W TDP 210 W 97% 100% 92% 90% 44%
Power Consumption - Cyberpunk 2077 Power Consumption 150cd *
min: 57.6 avg: 65.6 median: 65.6 (18%) max: 73.5 Watt
GPU TDP 35 W TDP 40 W 106% 100%
Power Consumption - Cyberpunk 2077 Power Consumption - external Monitor *
min: 54.4 avg: 63.2 median: 63.2 (8%) max: 72 Watt
GPU TDP 35 W TDP 40 W 102% 100%
Model CPU GPU RAM Value Acer Predator BiFrost Arc A770 OC i9-14900K 253 W / 253 W Arc A770 210 W 2400 / 2000 MHz 16 GB 32 GB 448
GPU TDP 35 W TDP 40 W TDP 210 W 216% 211% 100%
Power Consumption - Power Efficiency - Cyberpunk 2077 ultra
Emissions Witcher 3 Fan Noise + NVIDIA GeForce RTX 2050 Mobile Emissions - Witcher 3 Fan Noise
min: 38.2 avg: 43.9 median: 45.4 (65%) max: 47 dB(A)
GPU TDP 30 W TDP 35 W TDP 60 W 83% 96% 100%
Witcher 3 Fan Noise + Intel Arc A770 GPU TDP 30 W TDP 35 W TDP 60 W TDP 210 W 83% 96% 100% 90%
Clock Speed - GPU Clock Witcher 3 ultra
Average Benchmarks NVIDIA GeForce RTX 2050 Mobile → 100% n=2 Average Benchmarks Intel Arc A530M → 174% n=2 Average Benchmarks Intel Arc A770 → 414% n=2
- Range of benchmark values for this graphics card
- Average benchmark values for this graphics card
* Smaller numbers mean a higher performance
1 This benchmark is not used for the average calculation
The following benchmarks stem from our benchmarks of review laptops. The performance depends on the used graphics memory, clock rate, processor, system settings, drivers, and operating systems. So the results don't have to be representative for all laptops with this GPU. For detailed information on the benchmark results, click on the fps number.
NVIDIA GeForce RTX 2050 Mobile Intel Arc A530M Intel Arc A770 low med. high ultra QHD 4K low med. high ultra QHD 4K low med. high ultra QHD 4K F1 25 233 196.1 155.7 20.5 11.1 4.34 Doom: The Dark Ages 49.8 43.6 38.7 37.9 27 14.6 The Elder Scrolls IV Oblivion Remastered 62.9 55.2 38.2 21.8 16.2 9.46 Assassin's Creed Shadows 40 38 32 26 22 Civilization 7 347 184.6 112.1 76.6 39.7 Monster Hunter Wilds 31.2 27.3 22.2 Kingdom Come Deliverance 2 125.6 95.8 80.5 56.1 43.3 26.1 Indiana Jones and the Great Circle 68 54.5 49.4 37.9 22.2 Stalker 2 86.8 80.4 70.8 61.5 47.1 27.3 Call of Duty Black Ops 6 40 37 25 19 89 81 64 61 47 30 Until Dawn 35.5 22.1 14.9 10.6 101.6 57.1 43.1 35.9 26.2 17 God of War Ragnarök 43.6 34.2 31.7 27.4 103.9 87.5 79.9 75.1 58.8 34.6 Final Fantasy XVI 17.4 16.4 15 14.1 55.6 54.6 46.9 42.5 32.1 19.1 Space Marine 2 36.8 31.3 30.6 22.7 59.2 49.6 48.9 45.9 36.1 22.6 Star Wars Outlaws 22.9 20.8 16.2 8.74 48 46.8 43.1 37.6 27 14.5 Black Myth: Wukong 66 50 38 24 19 11 Once Human 96.2 95.9 88.3 80.7 53.6 27.6 The First Descendant 124.7 83.4 69.5 61 44.5 25 F1 24 90 50 49 10 282 246 187 63 43 21 Senua's Saga Hellblade 2 3.71 2.49 1.621 46.8 39.9 33.7 24.9 14.8 Ghost of Tsushima 37.4 27.2 18.5 14.6 99.5 85.6 77.5 63.9 51.3 32.5 Horizon Forbidden West 35.4 26.9 15.1 9.87 80.9 76.5 56.3 54.8 44.9 28.4 Alone in the Dark 188.4 162.7 145.4 83.5 52.1 22.6 Dragon's Dogma 2 15.8 14.5 52.1 47.8 39 24.7 Last Epoch 91.7 64.8 53.8 40.2 233 189.6 163.7 132.3 89.9 44.1 Skull & Bones 53 47 33 23 81 76 64 53 46 32 Helldivers 2 50.4 19.4 18.8 17.4 121.9 94.9 91.4 90.1 69.2 39.8 Enshrouded 34 29.9 24 19.9 74.6 67 58.2 Palworld 57.2 48 37.5 35 127.4 105.8 82 78.8 60.2 33.5 Prince of Persia The Lost Crown 264 195 184.1 358 358 359 351 193.2 Ready or Not 120.7 86.1 74.5 51.5 202 198.3 190.6 134.9 86.6 38 The Finals 107.7 76.4 67.8 50.9 204 161.7 146.2 121.5 83 40.5 Avatar Frontiers of Pandora 20 17 12 10 65 61 52 42 30 16 Call of Duty Modern Warfare 3 2023 106 97 79 75 57 36 EA Sports WRC 33.8 27 20.4 14.9 107.1 77.7 70.1 65.9 52.7 33.2 Alan Wake 2 17.8 15.3 13.8 56.5 55 51.6 36.1 20.1 Lords of the Fallen 19.2 15.4 10.9 100.4 89.8 73.1 59.4 50.4 35.1 Total War Pharaoh 80.7 50.4 29.5 19 386 244 151 119 86 46 Assassin's Creed Mirage 36 31 25 14 77 70 70 64 50 34 EA Sports FC 24 43.2 221 201 161.3 152.5 123 77 Counter-Strike 2 74 67.1 46.3 32.7 317 270 168.1 117 89.6 46.7 Cyberpunk 2077 42 32 25 21 116.3 99 88.3 83.2 58.6 30.4 Baldur's Gate 3 48 38 33 32 130.1 109.6 94.6 90.9 63.8 33.8 Lies of P 37.5 33.1 28.5 25.9 174.5 154.5 136.8 123.6 88.8 47.5 Starfield 24.6 21.4 15.9 13.6 48.9 42.8 36.3 33.6 28.8 20.5 Armored Core 6 42.6 35.9 32 29.6 71.6 69.3 68 67.9 66.9 46.7 Immortals of Aveum 22.7 17 14.3 56.6 49 40.6 30.5 18.3 Atlas Fallen 52.2 42.9 29.7 141.4 133.9 126.3 108.9 79.4 44.3 Ratchet & Clank Rift Apart 18.8 17.9 16.7 113 98 79.2 68.5 56.4 36.2 F1 23 54.8 50.8 36.9 11.3 299 264 196.7 67.2 44.2 21.4 Diablo 4 48.6 42.8 38.8 34.5 213 193.8 177.5 157.1 112.6 61.7 Star Wars Jedi Survivor 21.8 20.1 19.1 81.1 73.1 68.4 65.1 44 22.3 Dead Island 2 57.4 46.2 31.4 25.4 217 187.3 149 117.8 88.2 46 The Last of Us 31.2 23.8 18.3 13.3 69.5 58.5 52.9 45.4 34.3 18.9 Resident Evil 4 Remake 25.2 19.2 17.1 9.16 165.8 119.9 111 75.2 60.7 37.1 Company of Heroes 3 38.5 35 26.5 28.2 182.7 155.2 125.9 123.8 94.4 59 Sons of the Forest 35.9 34.1 33 70.3 54.5 54.2 54 39.5 23 Atomic Heart 48.7 29.5 29.1 179.1 131.9 99.3 72.2 58.3 34.1 Returnal 26 29 26 21 93 90 83 72 58 37 Hogwarts Legacy 34.5 25.9 18.6 125.1 92.2 74 62.2 47 27.4 Dead Space Remake 36 29 23 20 7.4 79.2 76 69.5 67.7 48.8 26.5 The Witcher 3 v4 66.7 46.2 18.8 15.8 154.9 129.7 115.6 104.5 94.8 52.1 High On Life 77.5 41.2 34.6 28.2 268 175.3 142.5 113.7 73 33.7 The Callisto Protocol 46.25 34.95 168.7 128.4 120.5 85.8 68.8 44.9 Need for Speed Unbound 54 27.9 19 114.3 103.4 84.5 84.3 65.1 39.1 Spider-Man Miles Morales 41.6 32 29.6 137.3 124.4 117.4 111.5 87.2 47.2 Uncharted Legacy of Thieves Collection 29 25 13 12.9 63.5 61.4 59.4 57.5 47.8 29.5 A Plague Tale Requiem 33 25.5 21.3 97.3 83.8 66.1 51.1 39.5 23.6 The Quarry 50.7 36.9 30.7 23.6 125.4 100 80.4 61.5 43.4 22.4 F1 22 110 82 68 25 12 296 267 216 73.2 47.4 22.7 Ghostwire Tokyo 53.7 51.5 50.8 45 148.8 146.7 146.3 138.8 99.7 50.3 Tiny Tina's Wonderlands 74.6 59.2 37.8 29.5 203 162.9 114.6 94 65.8 34.1 Cyberpunk 2077 1.6 44 37 27 24 78 70 61.3 58.2 44.5 25.6 GRID Legends 102 76 65 49 39.4 23.3 161.1 133.7 110.5 92.6 81.7 68.4 Elden Ring 50.1 43.1 39 34.9 60 60 60 60 60 50 God of War 42.6 48 37 23 87.8 80.5 69.3 54.3 47.7 34.5 Farming Simulator 22 138.2 89.3 63.1 52.6 362 246 185.9 168.6 143.3 92.3 Forza Horizon 5 111 62 53 18 238 139 127 84 74 54 Guardians of the Galaxy 67 48 47 45 172 129 127 120 92 52 Far Cry 6 81 51 43 27 195.6 134 116.9 100.9 79.3 48.8 F1 2021 223 125 91 44 28 11 562 333 256 124.4 94 54.3 Assassin´s Creed Valhalla 72 42 21 7 116 92 79 72 60 38 Dirt 5 99.7 82.9 66.3 58.3 56.5 54.9 Watch Dogs Legion 64 46 39 18 102.9 101.7 93.3 73.6 58.5 36.6 Horizon Zero Dawn 135 126 115 103 84 47 Death Stranding 68.3 54.2 49.8 48.3 191.1 143.2 136.1 134 102 61.4 F1 2020 277 203 171.1 121.1 99.7 65.2 Borderlands 3 116.7 100.4 95.8 84.3 65.4 35.5 Control 212 108.5 89.4 65.1 34.9 Anno 1800 140.1 102.5 66.7 38.2 27.4 17.2 Far Cry New Dawn 144 120 114 103 91 56 Metro Exodus 204 149.2 103.4 84.9 70.7 46.7 Apex Legends 143.9 144 143.5 143.6 132.9 83.2 Assassin´s Creed Odyssey 78 65 56 45 40 30 Forza Horizon 4 73 33 31 23 15 8 Shadow of the Tomb Raider 269 139 129.6 115.8 86.2 48.8 Strange Brigade 175 77 64 56 46.5 666 304 258 216 157.8 89.2 Far Cry 5 108 59 55 52 37 18 156 117 109 104 82 49 X-Plane 11.11 106 89 73 55 114 102 83 67 Final Fantasy XV Benchmark 89 50 35 25 13.4 174 116 69 66 38 Assassin´s Creed Origins 78 66 64 57 52 38 Rise of the Tomb Raider 63.2 59.2 62 62.5 62.1 Dota 2 Reborn 150 131 115 107 44 155 121 112 118 83 The Witcher 3 179 102 60 33 460 323 196.1 71.5 59.6 73 GTA V 162 156 92 46 37.3 187.9 186.8 144.3 65 45 48.2 NVIDIA GeForce RTX 2050 Mobile Intel Arc A530M Intel Arc A770 low med. high ultra QHD 4K low med. high ultra QHD 4K low med. high ultra QHD 4K < 30 fps < 60 fps < 120 fps ≥ 120 fps 12 29 19 7 21 38 11 4 35 28 11 1 47 20 1 1 4 4 4 2 < 30 fps < 60 fps < 120 fps ≥ 120 fps < 30 fps < 60 fps < 120 fps ≥ 120 fps 11 40 53 1 15 44 42 22 51 31 6 23 52 16 11 44 40 5 35 54 12 1
log 14. 19:19:54
#0 ran 0s before starting gpusingle class +0s ... 0s
#1 checking url part for id 11108 +0s ... 0s
#2 checking url part for id 11612 +0s ... 0s
#3 checking url part for id 11616 +0s ... 0s
#4 redirected to Ajax server, took 1768414794s time from redirect:0 +0s ... 0s
#5 did not recreate cache, as it is less than 5 days old! Created at Wed, 14 Jan 2026 11:45:01 +0100 +0s ... 0s
#6 composed specs +0.025s ... 0.025s
#7 did output specs +0s ... 0.025s
#8 start showIntegratedCPUs +0s ... 0.025s
#9 getting avg benchmarks for device 11108 +0.023s ... 0.048s
#10 got single benchmarks 11108 +0.018s ... 0.066s
#11 getting avg benchmarks for device 11612 +0s ... 0.066s
#12 got single benchmarks 11612 +0.003s ... 0.069s
#13 getting avg benchmarks for device 11616 +0.004s ... 0.073s
#14 got single benchmarks 11616 +0.007s ... 0.081s
#15 got avg benchmarks for devices +0s ... 0.081s
#16 min, max, avg, median took s +0.064s ... 0.145s
#17 before gaming benchmark output +0s ... 0.145s
#18 Got 1320 rows for game benchmarks. +0.055s ... 0.2s
#19 composed SQL query for gamebenchmarks +0s ... 0.2s
#20 got data and put it in $dataArray +0.021s ... 0.221s
#21 benchmarks composed for output. +0.051s ... 0.272s
#22 calculated avg scores. +0s ... 0.272s
#23 return log +0.002s ... 0.275s