Notebookcheck Logo

Intel HD Graphics 4000 vs NVIDIA Quadro T1000 (Laptop)

Intel HD Graphics 4000

► remove from comparison Intel HD Graphics 4000

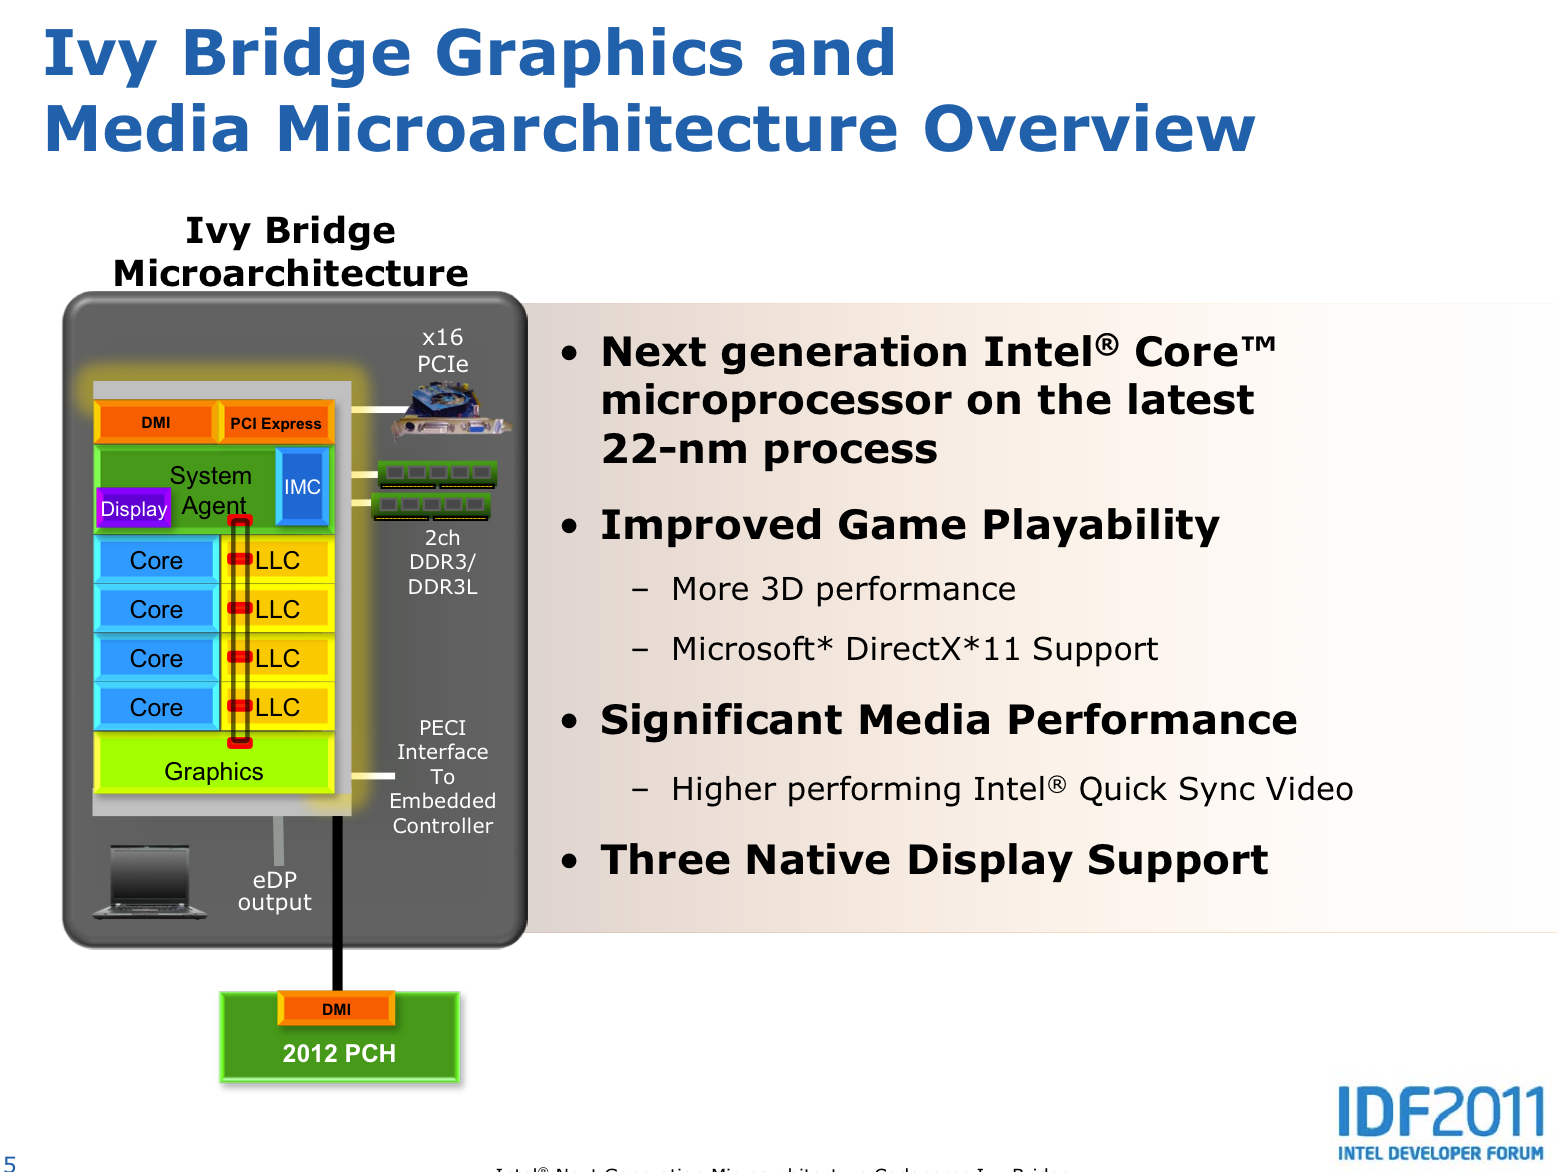
The Intel HD Graphics 4000 (GT2) is a processor graphics card that is included in the Ivy Bridge processors of 2012 (3rd generation of core, e.g. Core i7-3770). The base clock can be automatically overclocked using Turbo Boost technology. Depending on the processor model, the base and turbo clock rate may differ greatly resulting in different graphics performance of ULV parts compared to high-end desktop and laptop quad-core parts.

Compared to the Intel HD Graphics 3000 in Sandy Bridge CPUs, the HD 4000 card was completely redesigned and offers improved DirectX 11 capable shaders, Hardware Tessellation, a dedicated level 3 cache (before the Last Level Cache LLC of the CPU) and DirectCompute support. The IPC (instructions per clock) can therefore be even 2x as fast as with Sandy Bridge and overall up to 60% more performance (3DMark Vantage) should be possible.

First benchmarks position the HD Graphics 4000 (in a fast quad core desktop CPU) on a level with a dedicated Nvidia GeForce GT 330M and therefore above the AMD processor graphics Radeon HD 6620G. In our extensive tests with games the HD Graphics 4000 was able to beat the HD 6620G in a fast Core i7-3820QM by about 15%. In the slower i7-3610QM and a dual core i5 it was on a similar level as the 6620G. Therefore, casual gamers that wont mind reducing the quality settings in high end games, may be happy with the performance of the HD Graphics 4000. Beware, that the HD Graphics 4000 is used with different clock speeds depending on the CPU model. The ULV CPUs (Core ix-3xx7U) for example feature lower clock speeds and cant maintain the Turbo frequency as good as the 35 - 55 Watt models. Therefore, the ULV version is about 30% slower on average.

A speciality of the Ivy Bridge GPUs is that 4x MSAA is supported in hardware now. However, 2x is only supported through software.  The algorithm to support 2x is going through the 4x pipeline with a software algorithm, so performance is similar to 4x MSAA.

The integrated video decoder called Multi Format Codec Engine (MFX) was also improved and should allow even simultaneus 4K video decoding. DXVAChecker lists MPEG2, VC1, WMV9, and H264 as supported codecs. QuickSync for fast transcoding of videos was also optimized for higher performance and better image quality.

Another new feature is the support for up to 3 independent displays (depends on how the HD 4000 is used in the laptop - maybe only with a DisplayPort / eDP) as AMD offers with theirs Eyefinity support (up to 6 displays). DisplayPort 1.1 (max 2560x1600) and HDMI 1.4 (max 1920x1080 without hacks) are supported by the chip according to Intel.

Due to the 22nm 3D Tri-Gate production process, the power consumption should be relatively low (the development was focused on performance per Watt). The TDP of the whole package (including processor and memory controller) varies between 18 Watt (ULV) up to 45 Watt (mobile quad core) for the consumer laptop CPUs.

NVIDIA Quadro T1000 (Laptop)

► remove from comparison NVIDIA Quadro T1000 (Laptop)

The Nvidia Quadro T1000 for laptops is a professional mobile graphics card that is based on the Turing architecture (TU117 chip). Compared to the consumer GTX 1650, the Quadro T1000 features less CUDA cores / shaders (768 versus 896). The Quadro T2000 uses the same TU117 chip, but features all 1024 cores (2x to the T1000) and is therefore significantly faster. The chip is manufactured in 12nm FinFET at TSMC. 

The Turing generation did not only introduce raytracing for the RTX cards, but also optimized the architecture of the cores and caches. According to Nvidia the CUDA cores offer now a concurrent execution of floating point and integer operations for increased performance in compute-heavy workloads of modern games. Furthermore, the caches were reworked (new unified memory architecture with twice the cache compared to Pascal). This leads to up to 50% more instructions per clock and a 40% more power efficient usage compared to Pascal. In contrary to the faster Quadro RTX cards, the T1000 and T2000 don not feature raytracing and Tensor cores.

Intel HD Graphics 4000NVIDIA Quadro T1000 (Laptop)
Quadro Turing Series
HD Graphics P530 compare 24 @ 0.35 - 1.05 GHz64/128 Bit
HD Graphics 5600 compare 24 @ 0.3 - 1.05 GHz64/128 Bit
HD Graphics 6000 compare 48 @ 0.3 - 1 GHz64/128 Bit
HD Graphics 4600 compare 20 @ 0.2 - 1.35 GHz64/128 Bit
HD Graphics 5500 compare 24 @ 0.3 - 0.95 GHz64/128 Bit
HD Graphics 5000 compare 40 @ 0.2 - 1.1 GHz64/128 Bit
HD Graphics 4400 compare 20 @ 0.2 - 1.1 GHz64/128 Bit
HD Graphics 5300 compare 24 @ 0.1 - 0.9 GHz64/128 Bit
HD Graphics 4000 16 @ 0.35 - 1.35 GHz64/128 Bit
HD Graphics (Broadwell) compare 12 @ 0.1 - 0.85 GHz64/128 Bit
HD Graphics 4200 compare 20 @ 0.2 - 0.85 GHz64/128 Bit
HD Graphics (Skylake) compare 12 @ 0.3 - 0.8 GHz64/128 Bit
HD Graphics 405 (Braswell) compare 16 @ 0.32 - 0.7 GHz64/128 Bit
HD Graphics (Braswell) compare 16 @ 0.32 - 0.7 GHz64/128 Bit
HD Graphics 400 (Braswell) compare 12 @ 0.32 - 0.64 GHz64/128 Bit
HD Graphics (Haswell) compare 10 @ 0.2 - 1 GHz64/128 Bit
HD Graphics (Cherry Trail) compare 16 @ 0.2 - 0.6 GHz64/128 Bit
HD Graphics 3000 compare 12 @ 0.35 - 1.35 GHz64/128 Bit
HD Graphics 2500 compare 6 @ 0.65 - 1.15 GHz64/128 Bit
HD Graphics (Ivy Bridge) compare 6 @ 0.35 - 1.1 GHz64/128 Bit
HD Graphics 2000 compare 6 @ 0.85 - 1.35 GHz64/128 Bit
HD Graphics (Sandy Bridge) compare 6 @ 0.35 - 1.1 GHz64/128 Bit
HD Graphics (Bay Trail) compare 4 @ 0.31 - 0.9 GHz32/64/128 Bit
Quadro RTX 6000 (Laptop) compare 4608 @ 1.28 - 1.46 GHz384 Bit @ 14000 MHz
Quadro RTX 5000 (Laptop) compare 3072 @ 1.04 - 1.55 GHz256 Bit @ 14000 MHz
Quadro RTX 5000 Max-Q compare 3072 @ 0.6 - 1.35 GHz256 Bit @ 14000 MHz
Quadro RTX 4000 (Laptop) compare 2560 @ 1.11 - 1.56 GHz256 Bit @ 14000 MHz
Quadro RTX 4000 Max-Q compare 2560 @ 0.78 - 1.38 GHz256 Bit @ 14000 MHz
Quadro RTX 3000 (Laptop) compare 1920 @ 0.95 - 1.38 GHz192 Bit @ 14000 MHz
Quadro RTX 3000 Max-Q compare 1920 @ 0.6 - 1.22 GHz192 Bit @ 14000 MHz
Quadro T2000 (Laptop) compare 1024 @ 1.58 - 1.79 GHz128 Bit @ 8000 MHz
Quadro T2000 Max-Q compare 1024 @ 0.93 - 1.5 GHz128 Bit @ 8000 MHz
Quadro T1000 (Laptop) 768 @ 1.4 - 1.46 GHz128 Bit @ 8000 MHz
T1000 compare 896 @ 1.07 - 1.4 GHz128 Bit @ 10000 MHz
T1200 Laptop GPU compare 1024 @ 0.86 - 1.43 GHz128 Bit @ 10000 MHz
Quadro T1000 Max-Q compare 768 @ 0.8 - 1.46 GHz128 Bit @ 8000 MHz
T600 Laptop GPU compare 896 @ 1.4 GHz128 Bit @ 10000 MHz
T550 Laptop GPU compare 1024 @ 1.07 - 1.67 GHz64 Bit @ 12000 MHz
T500 Laptop GPU compare 896 @ 1.37 - 1.7 GHz64 Bit @ 10000 MHz
T600 compare 640 @ 0.74 - 1.34 GHz128 Bit @ 10000 MHz
CodenameIvy BridgeN19P-Q1
ArchitectureGen. 7 Ivy BridgeTuring
Pipelines16 - unified768 - unified
Core Speed350 - 1350 (Boost) MHz1395 - 1455 (Boost) MHz
Memory Bus Width64/128 Bit128 Bit
Shared Memoryyesno
APIDirectX 11, Shader 5.0, OpenGL 3.1DirectX 12_1, OpenGL 4.6
technology22 nm12 nm
FeaturesQuickSync
Date of Announcement23.03.2011 27.05.2019
Memory Speed8000 MHz
Memory TypeGDDR5
Max. Amount of Memory4 GB
Power Consumption50 Watt
Notebook Sizemedium sized
CPU in HD Graphics 4000GPU Base SpeedGPU Boost / Turbo
Intel Core i7-3770K4 x 3500 MHz, 77 W650 MHz1150 MHz
Intel Core i7-3940XM4 x 3000 MHz, 55 W650 MHz1350 MHz
Intel Core i7-3920XM4 x 2900 MHz, 55 W650 MHz1300 MHz
min. - max.350 - 650 MHz850 - 1350 MHz

Benchmarks

Performance Rating - 3DMark 11 + Fire Strike + Time Spy - HD Graphics 4000
0.2 pt (1%)
Restrict / Search: Model: Max. age: years
Performance Rating - 3DMark 11 + Fire Strike + Time Spy - Quadro T1000 (Laptop)
3.3 pt (10%)
Restrict / Search: Model: Max. age: years
3DMark - 3DMark Time Spy Score
min: 3006     avg: 3348     median: 3474 (9%)     max: 3565 Points
3DMark - 3DMark Time Spy Graphics
min: 2834     avg: 3123     median: 3261 (7%)     max: 3273 Points
3DMark - 3DMark Ice Storm Unlimited Graphics
min: 43759     avg: 44324     median: 44323.5 (4%)     max: 44888 Points
375510 Points (38%)
3DMark - 3DMark Ice Storm Extreme Graphics
min: 20514     avg: 24179     median: 24426 (3%)     max: 28772 Points
122046 Points (14%)
3DMark - 3DMark Cloud Gate Score
min: 1469     avg: 3380     median: 3282.5 (3%)     max: 5946 Points
min: 23601     avg: 25273     median: 25273 (24%)     max: 26945 Points
3DMark - 3DMark Cloud Gate Graphics
min: 1619     avg: 3850     median: 3768.5 (1%)     max: 5761 Points
min: 48965     avg: 53629     median: 53628.5 (13%)     max: 58292 Points
3DMark - 3DMark Fire Strike Standard Score
min: 168     avg: 446.5     median: 444 (1%)     max: 647 Points
min: 6812     avg: 7589     median: 7783 (12%)     max: 8173 Points
3DMark - 3DMark Fire Strike Standard Graphics
min: 191     avg: 486.1     median: 480 (0%)     max: 705 Points
min: 7558     avg: 8347     median: 8727 (8%)     max: 8757 Points
3DMark - 3DMark Ice Storm Graphics
min: 11232     avg: 31858     median: 31598 (3%)     max: 48923 Points
min: 86096     avg: 111211     median: 111211 (12%)     max: 136326 Points
3DMark 11 - 3DM11 Performance Score
min: 248     avg: 603     median: 603 (1%)     max: 802 Points
min: 10211     avg: 11241     median: 11592 (14%)     max: 11919 Points
3DMark 11 - 3DM11 Performance GPU
min: 216     avg: 522     median: 523 (0%)     max: 684 Points
min: 10407     avg: 11305     median: 11377 (9%)     max: 12132 Points
3DMark Vantage
3DM Vant. Perf. total + Intel HD Graphics 4000
3DMark Vantage - 3DM Vant. Perf. total
min: 830     avg: 2985     median: 2959 (1%)     max: 4433 Points
3DM Vant. Perf. total + NVIDIA Quadro T1000 (Laptop)
31509 Points (9%)
3DM Vant. Perf. GPU no PhysX + Intel HD Graphics 4000
3DMark Vantage - 3DM Vant. Perf. GPU no PhysX
min: 659     avg: 2441     median: 2415 (1%)     max: 3488 Points
3DM Vant. Perf. GPU no PhysX + NVIDIA Quadro T1000 (Laptop)
33740 Points (18%)
3DMark 2001SE - 3DMark 2001 - Standard
min: 8967     avg: 14343     median: 15220 (16%)     max: 16933 Points
3DMark 03 - 3DMark 03 - Standard
min: 7402     avg: 11805     median: 12768 (7%)     max: 19294 Points
3DMark 05 - 3DMark 05 - Standard
min: 5239     avg: 8296     median: 8393 (9%)     max: 11948 Points
3DMark 06 3DMark 06 - Score Unknown Settings + Intel HD Graphics 4000
3DMark 06
4276 Points (6%)
3DMark 06 - Standard 1280x1024 + Intel HD Graphics 4000
3DMark 06
min: 1605     avg: 4588     median: 4412.5 (6%)     max: 7159 Points
3DMark 06 - Standard 1280x1024 + NVIDIA Quadro T1000 (Laptop)
min: 33809     avg: 35034     median: 35033.5 (46%)     max: 36258 Points
Unigine Valley 1.0 - Unigine Valley 1.0 DX
min: 36.7     avg: 39.3     median: 39.3 (12%)     max: 41.9 fps
Unigine Heaven 3.0 - Unigine Heaven 3.0 DX 11
min: 6.9     avg: 7.6     median: 7.4 (2%)     max: 8.9 fps
110.3 fps (37%)
Unigine Heaven 3.0 - Unigine Heaven 3.0 OpenGL
min: 7.7     avg: 8.1     median: 8.1 (4%)     max: 8.4 fps
101.1 fps (45%)
Unigine Heaven 2.1 - Heaven 2.1 high
min: 6     avg: 9.6     median: 9.4 (2%)     max: 13 fps
min: 136.9     avg: 149.7     median: 149.7 (28%)     max: 162.4 fps
SPECviewperf 11
specvp11 snx-01 + Intel HD Graphics 4000
SPECviewperf 11 - specvp11 snx-01
min: 0.69     avg: 1.1     median: 1.2 (1%)     max: 1.47 fps
specvp11 tcvis-02 + Intel HD Graphics 4000
SPECviewperf 11 - specvp11 tcvis-02
min: 1.43     avg: 1.9     median: 2.1 (1%)     max: 2.27 fps
specvp11 sw-02 + Intel HD Graphics 4000
SPECviewperf 11 - specvp11 sw-02
min: 3.98     avg: 6.9     median: 7.5 (6%)     max: 8.45 fps
specvp11 proe-05 + Intel HD Graphics 4000
SPECviewperf 11 - specvp11 proe-05
min: 0.62     avg: 1.1     median: 1.2 (1%)     max: 1.47 fps
specvp11 maya-03 + Intel HD Graphics 4000
SPECviewperf 11 - specvp11 maya-03
min: 7.12     avg: 10.2     median: 9.7 (7%)     max: 13.09 fps
specvp11 lightwave-01 + Intel HD Graphics 4000
SPECviewperf 11 - specvp11 lightwave-01
min: 5.67     avg: 10.2     median: 11.1 (12%)     max: 12.55 fps
specvp11 ensight-04 + Intel HD Graphics 4000
SPECviewperf 11 - specvp11 ensight-04
min: 1.06     avg: 1.6     median: 1.7 (1%)     max: 2.24 fps
specvp11 catia-03 + Intel HD Graphics 4000
SPECviewperf 11 - specvp11 catia-03
0 fps (0%)
SPECviewperf 12
specvp12 sw-03 + NVIDIA Quadro T1000 (Laptop)
SPECviewperf 12 - specvp12 sw-03
113.8 fps (28%)
specvp12 snx-02 + NVIDIA Quadro T1000 (Laptop)
SPECviewperf 12 - specvp12 snx-02
82.7 fps (12%)
specvp12 showcase-01 + NVIDIA Quadro T1000 (Laptop)
SPECviewperf 12 - specvp12 showcase-01
40.3 fps (7%)
specvp12 mediacal-01 + NVIDIA Quadro T1000 (Laptop)
SPECviewperf 12 - specvp12 mediacal-01
min: 24.99     avg: 29.9     median: 29.9 (8%)     max: 34.8 fps
specvp12 maya-04 + NVIDIA Quadro T1000 (Laptop)
SPECviewperf 12 - specvp12 maya-04
min: 47.5     avg: 56.3     median: 56.3 (15%)     max: 65.1 fps
specvp12 energy-01 + NVIDIA Quadro T1000 (Laptop)
SPECviewperf 12 - specvp12 energy-01
min: 5.79     avg: 6.8     median: 6.8 (6%)     max: 7.9 fps
specvp12 creo-01 + NVIDIA Quadro T1000 (Laptop)
SPECviewperf 12 - specvp12 creo-01
min: 75     avg: 79.5     median: 79.5 (32%)     max: 83.9 fps
specvp12 catia-04 + NVIDIA Quadro T1000 (Laptop)
SPECviewperf 12 - specvp12 catia-04
min: 82.4     avg: 87.7     median: 87.7 (14%)     max: 93 fps
specvp12 3dsmax-05 + NVIDIA Quadro T1000 (Laptop)
SPECviewperf 12 - specvp12 3dsmax-05
min: 85.5     avg: 93.8     median: 93.8 (14%)     max: 102.1 fps
SPECviewperf 13 specvp13 sw-04 + NVIDIA Quadro T1000 (Laptop)
SPECviewperf 13 - specvp13 sw-04
min: 89.2     avg: 99.7     median: 104.4 (28%)     max: 105.6 fps
specvp13 snx-03 + NVIDIA Quadro T1000 (Laptop)
SPECviewperf 13 - specvp13 snx-03
min: 127.8     avg: 136.4     median: 133.1 (15%)     max: 148.4 fps
specvp13 showcase-02 + NVIDIA Quadro T1000 (Laptop)
SPECviewperf 13 - specvp13 showcase-02
min: 35.27     avg: 40.4     median: 40.2 (7%)     max: 45.71 fps
specvp13 medical-02 + NVIDIA Quadro T1000 (Laptop)
SPECviewperf 13 - specvp13 medical-02
min: 33.45     avg: 41.7     median: 41.6 (7%)     max: 50.1 fps
specvp13 maya-05 + NVIDIA Quadro T1000 (Laptop)
SPECviewperf 13 - specvp13 maya-05
min: 101     avg: 109.6     median: 113.3 (13%)     max: 114.6 fps
specvp13 energy-02 + NVIDIA Quadro T1000 (Laptop)
SPECviewperf 13 - specvp13 energy-02
min: 12     avg: 15.1     median: 15.6 (5%)     max: 17.8 fps
specvp13 creo-02 + NVIDIA Quadro T1000 (Laptop)
SPECviewperf 13 - specvp13 creo-02
min: 99.9     avg: 108.6     median: 109.5 (16%)     max: 116.3 fps
specvp13 catia-05 + NVIDIA Quadro T1000 (Laptop)
SPECviewperf 13 - specvp13 catia-05
min: 121.3     avg: 130     median: 130.5 (15%)     max: 138.3 fps
specvp13 3dsmax-06 + NVIDIA Quadro T1000 (Laptop)
SPECviewperf 13 - specvp13 3dsmax-06
min: 83.9     avg: 94.8     median: 98.5 (15%)     max: 101.9 fps
SPECviewperf 2020 specvp2020 solidworks-05 1080p + NVIDIA Quadro T1000 (Laptop)
SPECviewperf 2020 - specvp2020 solidworks-05 1080p
78.8 fps (15%)
specvp2020 snx-04 1080p + NVIDIA Quadro T1000 (Laptop)
SPECviewperf 2020 - specvp2020 snx-04 1080p
132.7 fps (16%)
specvp2020 medical-03 1080p + NVIDIA Quadro T1000 (Laptop)
SPECviewperf 2020 - specvp2020 medical-03 1080p
19.2 fps (5%)
specvp2020 maya-06 1080p + NVIDIA Quadro T1000 (Laptop)
SPECviewperf 2020 - specvp2020 maya-06 1080p
134.3 fps (14%)
specvp2020 energy-03 1080p + NVIDIA Quadro T1000 (Laptop)
SPECviewperf 2020 - specvp2020 energy-03 1080p
15.6 fps (3%)
specvp2020 creo-03 1080p + NVIDIA Quadro T1000 (Laptop)
SPECviewperf 2020 - specvp2020 creo-03 1080p
67.5 fps (23%)
specvp2020 catia-06 1080p + NVIDIA Quadro T1000 (Laptop)
SPECviewperf 2020 - specvp2020 catia-06 1080p
33.6 fps (16%)
specvp2020 3dsmax-07 1080p + NVIDIA Quadro T1000 (Laptop)
SPECviewperf 2020 - specvp2020 3dsmax-07 1080p
45.3 fps (12%)
Windows 7 Experience Index - Win7 Gaming graphics
min: 5.9     avg: 6.4     median: 6.4 (81%)     max: 6.6 Points
Windows 7 Experience Index - Win7 Graphics
min: 4.7     avg: 5.6     median: 5.1 (65%)     max: 6.6 Points
Cinebench R10 Cinebench R10 Shading (32bit) + Intel HD Graphics 4000
Cinebench R10 - Cinebench R10 Shading (32bit)
min: 2447     avg: 5020     median: 5157 (4%)     max: 8562 Points
Cinebench R10 Shading (32bit) + NVIDIA Quadro T1000 (Laptop)
6818 Points (5%)
Cinebench R11.5 Cinebench R11.5 OpenGL 64 Bit + Intel HD Graphics 4000
Cinebench R11.5 - Cinebench R11.5 OpenGL 64 Bit
min: 5.58     avg: 14.4     median: 13.6 (4%)     max: 22.54 fps
Cinebench R11.5 OpenGL 64 Bit + NVIDIA Quadro T1000 (Laptop)
124 fps (41%)
Cinebench R15
Cinebench R15 OpenGL 64 Bit + Intel HD Graphics 4000
Cinebench R15 - Cinebench R15 OpenGL 64 Bit
min: 8.47     avg: 11.9     median: 11.9 (1%)     max: 15.35 fps
Cinebench R15 OpenGL 64 Bit + NVIDIA Quadro T1000 (Laptop)
min: 166     avg: 182.6     median: 185.7 (11%)     max: 196 fps
Cinebench R15 OpenGL Ref. Match 64 Bit + Intel HD Graphics 4000
Cinebench R15 - Cinebench R15 OpenGL Ref. Match 64 Bit
min: 32.2     avg: 50.9     median: 32.2 (32%)     max: 97.8 %
Cinebench R15 OpenGL Ref. Match 64 Bit + NVIDIA Quadro T1000 (Laptop)
min: 99.6     avg: 99.7     median: 99.6 (100%)     max: 100 %
GFXBench - GFXBench 5.0 Aztec Ruins High Tier Offscreen
89.3 fps (16%)
GFXBench - GFXBench 5.0 Aztec Ruins Normal Tier Offscreen
225.8 fps (17%)
GFXBench - GFXBench Car Chase Offscreen
min: 145.6     avg: 154.9     median: 154.9 (15%)     max: 164.2 fps
GFXBench 3.1 - GFXBench Manhattan ES 3.1 Offscreen
min: 220.2     avg: 243.6     median: 243.6 (5%)     max: 267 fps
GFXBench 3.0 - GFXBench 3.0 Manhattan Offscreen
min: 269     avg: 315.3     median: 315.3 (13%)     max: 361.6 fps
GFXBench (DX / GLBenchmark) 2.7
GFXBench T-Rex HD Offscreen C24Z16 + Intel HD Graphics 4000
GFXBench (DX / GLBenchmark) 2.7 - GFXBench T-Rex HD Offscreen C24Z16
min: 31     avg: 40.1     median: 39 (0%)     max: 49 fps
GFXBench T-Rex HD Offscreen C24Z16 + NVIDIA Quadro T1000 (Laptop)
min: 575     avg: 660     median: 659.5 (5%)     max: 744 fps
LuxMark v2.0 64Bit - LuxMark v2.0 Room GPU
min: 31     avg: 46.9     median: 34 (0%)     max: 163 Samples/s
min: 1375     avg: 1410     median: 1409.5 (5%)     max: 1444 Samples/s
LuxMark v2.0 64Bit - LuxMark v2.0 Sala GPU
min: 50     avg: 79.4     median: 66 (0%)     max: 251 Samples/s
min: 2567     avg: 2768     median: 2768 (5%)     max: 2969 Samples/s
ComputeMark v2.1 - ComputeMark v2.1 Result
min: 31     avg: 514     median: 537 (0%)     max: 630 Points
min: 5376     avg: 5966     median: 5965.5 (5%)     max: 6555 Points
Power Consumption - Furmark Stress Test Power Consumption - external Monitor *
88.8 Watt (12%)
Power Consumption - The Witcher 3 Power Consumption - external Monitor *
93.8 Watt (13%)
Power Consumption - Witcher 3 Power Consumption *
min: 83     avg: 89     median: 89 (20%)     max: 95 Watt
Power Consumption - Power Efficiency - Witcher 3 ultra
min: 0.3684     avg: 0.4     median: 0.4 (37%)     max: 0.4566 fps per Watt
Power Consumption - Power Efficiency - Witcher 3 ultra external Monitor
0.4 fps per Watt (33%)
Emissions Witcher 3 Fan Noise + NVIDIA Quadro T1000 (Laptop)
Emissions - Witcher 3 Fan Noise
min: 36.9     avg: 37.3     median: 37.3 (60%)     max: 37.7 dB(A)
Clock Speed - GPU Clock Witcher 3 ultra
1237 MHz (49%)
Clock Speed - GPU Clock Speed Furmark
1543 MHz (61%)

Average Benchmarks Intel HD Graphics 4000 → 100% n=23

Average Benchmarks NVIDIA Quadro T1000 (Laptop) → 1444% n=23

- Range of benchmark values for this graphics card
red legend - Average benchmark values for this graphics card
* Smaller numbers mean a higher performance
1 This benchmark is not used for the average calculation

Game Benchmarks

The following benchmarks stem from our benchmarks of review laptops. The performance depends on the used graphics memory, clock rate, processor, system settings, drivers, and operating systems. So the results don't have to be representative for all laptops with this GPU. For detailed information on the benchmark results, click on the fps number.

low 1280x720
Quadro T1000 (Laptop):
190.9  fps
med. 1920x1080
Quadro T1000 (Laptop):
91.8  fps
high 1920x1080
Quadro T1000 (Laptop):
58.4  fps
ultra 1920x1080
Quadro T1000 (Laptop):
43.5  fps
low 1280x720
Quadro T1000 (Laptop):
150  fps
med. 1920x1080
Quadro T1000 (Laptop):
78  fps
high 1920x1080
Quadro T1000 (Laptop):
64.3  fps
low 1280x720
Quadro T1000 (Laptop):
134.1  fps
med. 1920x1080
Quadro T1000 (Laptop):
51  fps
high 1920x1080
Quadro T1000 (Laptop):
44.4  fps
low 1280x720
Quadro T1000 (Laptop):
121.4  fps
med. 1920x1080
Quadro T1000 (Laptop):
87.9  fps
high 1920x1080
Quadro T1000 (Laptop):
67.8  fps
ultra 1920x1080
Quadro T1000 (Laptop):
56  fps
low 1280x720
Quadro T1000 (Laptop):
87.9  fps
med. 1920x1080
Quadro T1000 (Laptop):
46.7  fps
high 1920x1080
Quadro T1000 (Laptop):
29.9  fps
ultra 1920x1080
Quadro T1000 (Laptop):
19.4  fps
med. 1920x1080
Quadro T1000 (Laptop):
67.3  fps
high 1920x1080
Quadro T1000 (Laptop):
57.6  fps
ultra 1920x1080
Quadro T1000 (Laptop):
50.4  fps
low 1280x720
Quadro T1000 (Laptop):
86  fps
med. 1920x1080
Quadro T1000 (Laptop):
60.5  fps
high 1920x1080
Quadro T1000 (Laptop):
51.9  fps
ultra 1920x1080
Quadro T1000 (Laptop):
46.9  fps
low 1280x720
Quadro T1000 (Laptop):
96.7  fps
med. 1920x1080
Quadro T1000 (Laptop):
61.2  fps
high 1920x1080
Quadro T1000 (Laptop):
50.8  fps
ultra 1920x1080
Quadro T1000 (Laptop):
44  fps
GRID 2019

GRID 2019

2019
low 1280x720
Quadro T1000 (Laptop):
125.4  fps
med. 1920x1080
Quadro T1000 (Laptop):
76.8  fps
high 1920x1080
Quadro T1000 (Laptop):
65.2  fps
ultra 1920x1080
Quadro T1000 (Laptop):
42.8  fps
low 1280x720
Quadro T1000 (Laptop):
93  fps
med. 1920x1080
Quadro T1000 (Laptop):
53  fps
high 1920x1080
Quadro T1000 (Laptop):
47  fps
ultra 1920x1080
Quadro T1000 (Laptop):
32  fps
FIFA 20

FIFA 20

2019
low 1280x720
Quadro T1000 (Laptop):
208  fps
med. 1920x1080
Quadro T1000 (Laptop):
171.3  fps
high 1920x1080
Quadro T1000 (Laptop):
160.3  fps
ultra 1920x1080
Quadro T1000 (Laptop):
148.9  fps
low 1280x720
Quadro T1000 (Laptop):
117.9  fps
med. 1920x1080
Quadro T1000 (Laptop):
58.7  fps
high 1920x1080
Quadro T1000 (Laptop):
38  fps
ultra 1920x1080
Quadro T1000 (Laptop):
28.5  fps
Control

Control

2019
low 1280x720
Quadro T1000 (Laptop):
136.8  fps
med. 1920x1080
Quadro T1000 (Laptop):
42.4  fps
high 1920x1080
Quadro T1000 (Laptop):
31.2  fps
F1 2019

F1 2019

2019
low 1280x720
Quadro T1000 (Laptop):
118 178 ~ 148 fps
med. 1920x1080
Quadro T1000 (Laptop):
73 105 ~ 89 fps
high 1920x1080
Quadro T1000 (Laptop):
61 92 ~ 77 fps
ultra 1920x1080
Quadro T1000 (Laptop):
49 79 ~ 64 fps
low 1280x720
Quadro T1000 (Laptop):
182.3 189 ~ 186 fps
med. 1920x1080
Quadro T1000 (Laptop):
60.4 62.5 ~ 61 fps
high 1920x1080
Quadro T1000 (Laptop):
37.5 39.1 ~ 38 fps
ultra 1920x1080
Quadro T1000 (Laptop):
24.7 25.6 ~ 25 fps
Rage 2

Rage 2

2019
low 1280x720
Quadro T1000 (Laptop):
123.7  fps
med. 1920x1080
Quadro T1000 (Laptop):
55.2  fps
high 1920x1080
Quadro T1000 (Laptop):
45.7  fps
ultra 1920x1080
Quadro T1000 (Laptop):
45.1  fps
Anno 1800

Anno 1800

2019
low 1280x720
Quadro T1000 (Laptop):
69.6 94.5 ~ 82 fps
med. 1920x1080
Quadro T1000 (Laptop):
52.8 73.4 ~ 63 fps
high 1920x1080
Quadro T1000 (Laptop):
37.2 45.2 ~ 41 fps
ultra 1920x1080
Quadro T1000 (Laptop):
20 23.1 ~ 22 fps
low 1280x720
Quadro T1000 (Laptop):
111  fps
med. 1920x1080
Quadro T1000 (Laptop):
39 61 ~ 50 fps
high 1920x1080
Quadro T1000 (Laptop):
36 48 ~ 42 fps
ultra 1920x1080
Quadro T1000 (Laptop):
29 35 ~ 32 fps
low 1280x720
Quadro T1000 (Laptop):
185.2 232.8 ~ 209 fps
med. 1920x1080
Quadro T1000 (Laptop):
80.7 100.5 ~ 91 fps
high 1920x1080
Quadro T1000 (Laptop):
63.7 79.4 ~ 72 fps
ultra 1920x1080
Quadro T1000 (Laptop):
36.3 42.5 ~ 39 fps
low 1280x720
Quadro T1000 (Laptop):
77  fps
med. 1920x1080
Quadro T1000 (Laptop):
48  fps
high 1920x1080
Quadro T1000 (Laptop):
46  fps
ultra 1920x1080
Quadro T1000 (Laptop):
43  fps
low 1280x720
Quadro T1000 (Laptop):
93.3  fps
med. 1920x1080
Quadro T1000 (Laptop):
43.4  fps
high 1920x1080
Quadro T1000 (Laptop):
31.9  fps
ultra 1920x1080
Quadro T1000 (Laptop):
25.5  fps
low 1280x720
Quadro T1000 (Laptop):
143.7 144 ~ 144 fps
med. 1920x1080
Quadro T1000 (Laptop):
73.8 92.7 ~ 83 fps
high 1920x1080
Quadro T1000 (Laptop):
57.8 69 ~ 63 fps
ultra 1920x1080
Quadro T1000 (Laptop):
55.9 68.7 ~ 62 fps
low 1280x720
Quadro T1000 (Laptop):
61.5 138.1 ~ 100 fps
med. 1920x1080
Quadro T1000 (Laptop):
43.2 76.5 ~ 60 fps
high 1920x1080
Quadro T1000 (Laptop):
37.8 66.6 ~ 52 fps
ultra 1920x1080
Quadro T1000 (Laptop):
35 59.4 ~ 47 fps
low 1280x720
Quadro T1000 (Laptop):
182.4  fps
med. 1920x1080
Quadro T1000 (Laptop):
106.7  fps
high 1920x1080
Quadro T1000 (Laptop):
86.3  fps
ultra 1920x1080
Quadro T1000 (Laptop):
66.5  fps
low 1280x720
Quadro T1000 (Laptop):
57 82 ~ 70 fps
med. 1920x1080
Quadro T1000 (Laptop):
40 55 ~ 48 fps
high 1920x1080
Quadro T1000 (Laptop):
35 50 ~ 43 fps
ultra 1920x1080
Quadro T1000 (Laptop):
29 29 ~ 29 fps
FIFA 19

FIFA 19

2018
low 1280x720
Quadro T1000 (Laptop):
148  fps
med. 1920x1080
Quadro T1000 (Laptop):
119.2  fps
high 1920x1080
Quadro T1000 (Laptop):
113.5  fps
ultra 1920x1080
Quadro T1000 (Laptop):
110.8  fps
low 1280x720
Quadro T1000 (Laptop):
88 101 111 ~ 100 fps
med. 1920x1080
Quadro T1000 (Laptop):
46 56.7 58 ~ 54 fps
high 1920x1080
Quadro T1000 (Laptop):
40 50 54.1 ~ 48 fps
ultra 1920x1080
Quadro T1000 (Laptop):
35 45 46 ~ 42 fps
Far Cry 5

Far Cry 5

2018
low 1280x720
Quadro T1000 (Laptop):
107  fps
med. 1920x1080
Quadro T1000 (Laptop):
62  fps
high 1920x1080
Quadro T1000 (Laptop):
57  fps
ultra 1920x1080
Quadro T1000 (Laptop):
53  fps
World of Tanks enCore

World of Tanks enCore

2018
low 1366x768
Quadro T1000 (Laptop):
491.9  fps
med. 1920x1080
Quadro T1000 (Laptop):
199.3  fps
ultra 1920x1080
Quadro T1000 (Laptop):
77.1  fps
low 1280x720
Quadro T1000 (Laptop):
79.7 91 108 ~ 93 fps
med. 1920x1080
Quadro T1000 (Laptop):
66.2 78 96 ~ 80 fps
high 1920x1080
Quadro T1000 (Laptop):
57.1 69 80.1 ~ 69 fps
low 1280x720
Quadro T1000 (Laptop):
93.7  fps
med. 1920x1080
Quadro T1000 (Laptop):
49.3  fps
high 1920x1080
Quadro T1000 (Laptop):
40.5  fps
ultra 1920x1080
Quadro T1000 (Laptop):
30.7  fps
low 1280x720
Quadro T1000 (Laptop):
56.1 77.4 ~ 67 fps
med. 1920x1080
Quadro T1000 (Laptop):
41.9 49.2 ~ 46 fps
high 1920x1080
Quadro T1000 (Laptop):
31.1 34 ~ 33 fps
low 1280x720
100%
HD Graphics 4000:
68  fps
ultra 1920x1080
100%
HD Graphics 4000:
13.3  fps
low 1280x720
Quadro T1000 (Laptop):
246.4  fps
med. 1920x1080
Quadro T1000 (Laptop):
150.7  fps
high 1920x1080
Quadro T1000 (Laptop):
117  fps
low 1280x720
Quadro T1000 (Laptop):
94  fps
med. 1920x1080
Quadro T1000 (Laptop):
47.2  fps
high 1920x1080
Quadro T1000 (Laptop):
43.9  fps
ultra 1920x1080
Quadro T1000 (Laptop):
24.2  fps
For Honor

For Honor

2017
low 1280x720
Quadro T1000 (Laptop):
163.4 199.8 ~ 182 fps
med. 1920x1080
Quadro T1000 (Laptop):
66.7 77.5 ~ 72 fps
high 1920x1080
Quadro T1000 (Laptop):
63.9 74.3 ~ 69 fps
ultra 1920x1080
Quadro T1000 (Laptop):
48.8 56.7 ~ 53 fps
low 1280x720
100%
HD Graphics 4000:
43  fps
med. 1366x768
100%
HD Graphics 4000:
25.1  fps
low 1280x720
HD Graphics 4000:
0 (!)  fps
Overwatch

Overwatch

2016
low 1280x720
100%
HD Graphics 4000:
25.6  fps
low 1024x768
100%
HD Graphics 4000:
10  fps
1362%
Quadro T1000 (Laptop):
136.2  fps
med. 1366x768
Quadro T1000 (Laptop):
86  fps
high 1920x1080
Quadro T1000 (Laptop):
53.4  fps
ultra 1920x1080
Quadro T1000 (Laptop):
43.8  fps
low 1024x768
Quadro T1000 (Laptop):
190.3 244.3 ~ 217 fps
med. 1366x768
Quadro T1000 (Laptop):
159.6 197.9 ~ 179 fps
high 1920x1080
Quadro T1000 (Laptop):
111.6 139.3 ~ 125 fps
ultra 1920x1080
Quadro T1000 (Laptop):
97.9 117.9 ~ 108 fps
FIFA 16

FIFA 16

2015
low 1280x720
100%
HD Graphics 4000:
60  fps
high 1366x768
100%
HD Graphics 4000:
26  fps
ultra 1920x1080
100%
HD Graphics 4000:
16  fps
low 1366x768
100%
HD Graphics 4000:
56.7  fps
med. 1366x768
100%
HD Graphics 4000:
36  fps
high 1920x1080
100%
HD Graphics 4000:
17.1  fps
ultra 1920x1080
100%
HD Graphics 4000:
12.4  fps
low 1024x768
100%
HD Graphics 4000:
41  fps
med. 1366x768
100%
HD Graphics 4000:
25.2  fps
high 1920x1080
100%
HD Graphics 4000:
9.6  fps
Mad Max

Mad Max

2015
med. 1366x768
100%
HD Graphics 4000:
14.6  fps
low 1280x720
100%
HD Graphics 4000:
96  fps
148%
Quadro T1000 (Laptop):
134 141.4 151 ~ 142 fps
med. 1366x768
100%
HD Graphics 4000:
40.2  fps
311%
Quadro T1000 (Laptop):
115 124.8 136 ~ 125 fps
high 1920x1080
100%
HD Graphics 4000:
16.9  fps
692%
Quadro T1000 (Laptop):
113 113.6 123 ~ 117 fps
ultra 1920x1080
Quadro T1000 (Laptop):
106 106.7 115 ~ 109 fps
4K 3840x2160
Quadro T1000 (Laptop):
47.9  fps
low 1024x768
Quadro T1000 (Laptop):
156.2 189 190.7 ~ 179 fps
med. 1366x768
Quadro T1000 (Laptop):
94.1 114 115.9 ~ 108 fps
high 1920x1080
Quadro T1000 (Laptop):
52.7 62.8 62.9 ~ 59 fps
ultra 1920x1080
Quadro T1000 (Laptop):
30.9 35 37.9 ~ 35 fps
low 1024x768
100%
HD Graphics 4000:
53.7 91 (!) ~ 72 fps
med. 1366x768
100%
HD Graphics 4000:
16.4 21 ~ 19 fps
high 1920x1080
100%
HD Graphics 4000:
12.5 12.6 ~ 13 fps
ultra 1920x1080
100%
HD Graphics 4000:
12.5  fps
GTA V

GTA V

2015
low 1024x768
100%
HD Graphics 4000:
26.8  fps
635%
Quadro T1000 (Laptop):
170.1  fps
med. 1366x768
Quadro T1000 (Laptop):
153.9  fps
high 1920x1080
Quadro T1000 (Laptop):
93.8  fps
ultra 1920x1080
Quadro T1000 (Laptop):
41.7  fps
low 1024x768
100%
HD Graphics 4000:
21.2  fps
Evolve

Evolve

2015
low 1024x768
100%
HD Graphics 4000:
12.2  fps
The Crew

The Crew

2014
low 1280x720
100%
HD Graphics 4000:
15  fps
low 1024x768
100%
HD Graphics 4000:
18.5  fps
med. 1366x768
100%
HD Graphics 4000:
11.7  fps
Far Cry 4

Far Cry 4

2014
low 1024x768
100%
HD Graphics 4000:
13.2  fps
low 1024x768
100%
HD Graphics 4000:
3 (!)  fps
low 1024x768
HD Graphics 4000:
0 (!)  fps
low 1024x768
100%
HD Graphics 4000:
18.2  fps
med. 1366x768
100%
HD Graphics 4000:
8.1  fps
F1 2014

F1 2014

2014
low 1024x768
100%
HD Graphics 4000:
38 55 ~ 47 fps
med. 1366x768
100%
HD Graphics 4000:
23 33 ~ 28 fps
high 1920x1080
100%
HD Graphics 4000:
16 18 ~ 17 fps
ultra 1920x1080
100%
HD Graphics 4000:
12 12.5 ~ 12 fps
low 1024x768
100%
HD Graphics 4000:
8.8  fps
low 1024x768
100%
HD Graphics 4000:
11.4  fps
low 1024x768
100%
HD Graphics 4000:
28.6  fps
med. 1366x768
100%
HD Graphics 4000:
18.2  fps
low 1280x720
100%
HD Graphics 4000:
13  fps
Fifa 15

Fifa 15

2014
low 1280x720
100%
HD Graphics 4000:
32.4  fps
high 1366x768
100%
HD Graphics 4000:
24.6  fps
ultra 1920x1080
100%
HD Graphics 4000:
15.7  fps
low 1024x768
100%
HD Graphics 4000:
36.4  fps
med. 1366x768
100%
HD Graphics 4000:
17.6  fps
high 1920x1080
100%
HD Graphics 4000:
7.2  fps
low 1024x768
100%
HD Graphics 4000:
83  fps
med. 1366x768
100%
HD Graphics 4000:
25  fps
high 1920x1080
100%
HD Graphics 4000:
14  fps
low 1024x768
100%
HD Graphics 4000:
12.7  fps
low 1280x720
100%
HD Graphics 4000:
31  fps
med. 1280x720
100%
HD Graphics 4000:
21.9  fps
high 1920x1080
100%
HD Graphics 4000:
9.1  fps
low 1024x768
100%
HD Graphics 4000:
40  fps
med. 1366x768
100%
HD Graphics 4000:
23.1  fps
high 1366x768
100%
HD Graphics 4000:
13.9  fps
ultra 1920x1080
100%
HD Graphics 4000:
7.2  fps
Titanfall

Titanfall

2014
low 1024x768
100%
HD Graphics 4000:
20.4  fps
med. 1366x768
100%
HD Graphics 4000:
10.9  fps
high 1366x768
100%
HD Graphics 4000:
6.7  fps
ultra 1920x1080
100%
HD Graphics 4000:
4.9  fps
Thief

Thief

2014
low 1024x768
100%
HD Graphics 4000:
19  fps
med. 1366x768
100%
HD Graphics 4000:
10.9  fps
high 1366x768
100%
HD Graphics 4000:
8.8  fps
ultra 1920x1080
100%
HD Graphics 4000:
4.3  fps
low 1024x768
100%
HD Graphics 4000:
23.6  fps
med. 1366x768
100%
HD Graphics 4000:
17.4  fps
high 1366x768
100%
HD Graphics 4000:
7.4  fps
ultra 1920x1080
100%
HD Graphics 4000:
3.6  fps
low 1024x768
100%
HD Graphics 4000:
37.7 46 ~ 42 fps
med. 1366x768
100%
HD Graphics 4000:
14.6 18.1 ~ 16 fps
high 1366x768
100%
HD Graphics 4000:
6.6 7.4 ~ 7 fps
ultra 1920x1080
100%
HD Graphics 4000:
4.4 4.7 ~ 5 fps
low 1024x768
100%
HD Graphics 4000:
12.6  fps
low 1024x768
100%
HD Graphics 4000:
40.6  fps
med. 1366x768
100%
HD Graphics 4000:
24.3  fps
high 1366x768
100%
HD Graphics 4000:
7.2  fps
ultra 1920x1080
100%
HD Graphics 4000:
4  fps
low 1024x768
100%
HD Graphics 4000:
32.2  fps
med. 1366x768
100%
HD Graphics 4000:
19.7  fps
high 1366x768
100%
HD Graphics 4000:
12.2  fps
ultra 1920x1080
100%
HD Graphics 4000:
4.7  fps
low 1024x768
100%
HD Graphics 4000:
52  fps
med. 1366x768
100%
HD Graphics 4000:
30  fps
high 1366x768
100%
HD Graphics 4000:
12  fps
ultra 1920x1080
100%
HD Graphics 4000:
6  fps
F1 2013

F1 2013

2013
low 1024x768
100%
HD Graphics 4000:
34 34 48 76 85 ~ 55 fps
med. 1366x768
100%
HD Graphics 4000:
28 28 33 46 ~ 34 fps
high 1366x768
100%
HD Graphics 4000:
24 25 26 33 ~ 27 fps
ultra 1920x1080
100%
HD Graphics 4000:
12 12 12 ~ 12 fps
Fifa 14

Fifa 14

2013
low 1024x768
100%
HD Graphics 4000:
87.1 182 207.4 ~ 159 fps
med. 1366x768
100%
HD Graphics 4000:
56.7 97 112.1 ~ 89 fps
high 1366x768
100%
HD Graphics 4000:
33.7 48 84 85.4 ~ 63 fps
ultra 1920x1080
100%
HD Graphics 4000:
18 26 44.7 49.6 ~ 35 fps
low 1024x768
100%
HD Graphics 4000:
20 25.6 29.9 42 ~ 29 fps
med. 1366x768
100%
HD Graphics 4000:
14 19.4 21.6 30.9 ~ 21 fps
low 1280x720
100%
HD Graphics 4000:
28.6 30.8 ~ 30 fps
med. 1366x768
100%
HD Graphics 4000:
20.6 21.8 ~ 21 fps
high 1366x768
100%
HD Graphics 4000:
9.4 9.6 ~ 10 fps
ultra 1920x1080
100%
HD Graphics 4000:
5.5 5.5 ~ 6 fps
low 1024x768
100%
HD Graphics 4000:
38.2  fps
med. 1366x768
100%
HD Graphics 4000:
16.4  fps
high 1366x768
100%
HD Graphics 4000:
8.9  fps
ultra 1920x1080
100%
HD Graphics 4000:
5.9  fps
low 1024x768
100%
HD Graphics 4000:
40.7  fps
Dota 2

Dota 2

2013
low 1024x768
100%
HD Graphics 4000:
32.8 97.3 ~ 65 fps
med. 1366x768
100%
HD Graphics 4000:
21.1 53.9 ~ 38 fps
ultra 1920x1080
100%
HD Graphics 4000:
10.3 19.4 ~ 15 fps
low 1024x768
100%
HD Graphics 4000:
4 5 14.9 15 ~ 10 fps
med. 1366x768
100%
HD Graphics 4000:
5 11.5 11.7 ~ 9 fps
high 1366x768
100%
HD Graphics 4000:
6.2 6.3 ~ 6 fps
ultra 1920x1080
100%
HD Graphics 4000:
2.9 2.9 ~ 3 fps
GRID 2

GRID 2

2013
low 1024x768
100%
HD Graphics 4000:
72.6  fps
med. 1366x768
100%
HD Graphics 4000:
37.8  fps
high 1366x768
100%
HD Graphics 4000:
20.2  fps
low 1024x768
100%
HD Graphics 4000:
16.6 26.4 ~ 22 fps
med. 1366x768
100%
HD Graphics 4000:
11.4 17.6 ~ 15 fps
high 1366x768
100%
HD Graphics 4000:
6.3 10.1 ~ 8 fps
ultra 1920x1080
100%
HD Graphics 4000:
3.3 5.1 ~ 4 fps
low 1280x720
100%
HD Graphics 4000:
15.9 17 20.2 20.6 21 23.1 26.8 27.7 32.5 32.6 33 36.5 39.3 ~ 27 fps
1104%
Quadro T1000 (Laptop):
280.4 316.4 ~ 298 fps
med. 1366x768
100%
HD Graphics 4000:
10 10.4 10.7 11 11.6 12.2 12.6 12.7 13.6 17 17.4 18.2 18.6 18.9 ~ 14 fps
1614%
Quadro T1000 (Laptop):
210 241 ~ 226 fps
high 1366x768
100%
HD Graphics 4000:
9 9.1 9.5 9.7 10.2 10.2 11.4 14 14.4 15.3 15.4 16.4 ~ 12 fps
1675%
Quadro T1000 (Laptop):
184.7 216.3 ~ 201 fps
ultra 1920x1080
100%
HD Graphics 4000:
3 3.4 3.6 5 6.5 ~ 4 fps
2000%
Quadro T1000 (Laptop):
72.9 86.6 ~ 80 fps
low 1024x768
100%
HD Graphics 4000:
70 88.9 95 106.1 110 111 129 178 ~ 111 fps
med. 1366x768
100%
HD Graphics 4000:
20.8 25 25.1 28 28.2 31 38 40.9 ~ 30 fps
high 1366x768
100%
HD Graphics 4000:
11.4 14 15 15.4 15.5 19 21 22 ~ 17 fps
ultra 1920x1080
100%
HD Graphics 4000:
7.6  fps
SimCity

SimCity

2013
low 1024x768
100%
HD Graphics 4000:
21 28.9 37 ~ 29 fps
med. 1366x768
100%
HD Graphics 4000:
11 15 15.2 ~ 14 fps
high 1366x768
100%
HD Graphics 4000:
8 11 11.1 ~ 10 fps
ultra 1920x1080
100%
HD Graphics 4000:
5.4  fps
low 1024x768
100%
HD Graphics 4000:
14 27.4 29 30 31.1 31.2 33.2 33.2 33.8 34.8 34.9 35.2 35.8 35.8 37.1 40.1 48.8 52.4 ~ 34 fps
med. 1366x768
100%
HD Graphics 4000:
7 13.2 13.7 15 15.8 16 16.2 16.9 17 17.9 17.9 18.3 18.3 20.2 21.1 22.2 24.4 ~ 17 fps
high 1366x768
100%
HD Graphics 4000:
7.7 9 9.5 9.6 10 10.4 10.8 10.9 11.3 13.1 15.3 ~ 11 fps
ultra 1920x1080
100%
HD Graphics 4000:
6.4 7.1 7.7 ~ 7 fps
Crysis 3

Crysis 3

2013
low 1024x768
100%
HD Graphics 4000:
19 22 24.8 ~ 22 fps
med. 1366x768
100%
HD Graphics 4000:
9 13.4 ~ 11 fps
high 1366x768
100%
HD Graphics 4000:
7 8.3 ~ 8 fps
ultra 1920x1080
100%
HD Graphics 4000:
3.2  fps
low 1024x768
100%
HD Graphics 4000:
37.3 42.7 69.4 79.7 80.4 86 ~ 66 fps
med. 1366x768
100%
HD Graphics 4000:
17.4 19.4 30.2 32.8 34.3 34.5 ~ 28 fps
high 1366x768
100%
HD Graphics 4000:
14.2 14.9 23.7 26 27.2 27.4 ~ 22 fps
ultra 1920x1080
100%
HD Graphics 4000:
13.6 14.6 15.1 15.2 ~ 15 fps
Far Cry 3

Far Cry 3

2012
low 1024x768
100%
HD Graphics 4000:
31.7 32.1 ~ 32 fps
med. 1366x768
100%
HD Graphics 4000:
20.1 22.6 ~ 21 fps
high 1366x768
100%
HD Graphics 4000:
7.8  fps
med. 1366x768
100%
HD Graphics 4000:
17.2 17.5 ~ 17 fps
high 1366x768
100%
HD Graphics 4000:
15.5  fps
ultra 1920x1080
100%
HD Graphics 4000:
3.7  fps
low 1024x768
100%
HD Graphics 4000:
10.8 11 17 18 21.5 21.6 23.9 ~ 18 fps
med. 1366x768
100%
HD Graphics 4000:
8 8.6 14 14 17 17.8 18.6 ~ 14 fps
high 1366x768
100%
HD Graphics 4000:
3 5 5.6 6 6.1 6.2 ~ 5 fps
ultra 1920x1080
100%
HD Graphics 4000:
2.8 3 3 3.1 ~ 3 fps
low 1024x768
100%
HD Graphics 4000:
29.6 31 31.8 36.1 ~ 32 fps
med. 1366x768
100%
HD Graphics 4000:
19 19.7 22.1 25.2 ~ 22 fps
high 1366x768
100%
HD Graphics 4000:
5.5 6 7.2 8.7 ~ 7 fps
ultra 1920x1080
100%
HD Graphics 4000:
6.6  fps
low 1024x768
100%
HD Graphics 4000:
17 27.7 32.5 ~ 26 fps
med. 1366x768
100%
HD Graphics 4000:
10 11 19.9 ~ 14 fps
high 1366x768
100%
HD Graphics 4000:
5 12.6 ~ 9 fps
ultra 1920x1080
100%
HD Graphics 4000:
7.7  fps
low 1024x768
100%
HD Graphics 4000:
9 14 19 30.6 ~ 18 fps
med. 1366x768
100%
HD Graphics 4000:
7.4 12 13 19.8 ~ 13 fps
high 1366x768
100%
HD Graphics 4000:
9.6 16 ~ 13 fps
ultra 1920x1080
100%
HD Graphics 4000:
5.1  fps
low 1024x768
100%
HD Graphics 4000:
9.5 20.5 32.1 35.2 35.8 40.1 ~ 29 fps
med. 1366x768
100%
HD Graphics 4000:
19.5 20.5 26.5 32.7 36 ~ 27 fps
high 1366x768
100%
HD Graphics 4000:
18 20.2 29.2 32 ~ 25 fps
ultra 1920x1080
100%
HD Graphics 4000:
16.4 17.7 ~ 17 fps
low 1024x768
100%
HD Graphics 4000:
38.9 41 55 64.3 ~ 50 fps
med. 1366x768
100%
HD Graphics 4000:
19 21.7 22.2 26.2 ~ 22 fps
high 1366x768
100%
HD Graphics 4000:
15.3 18.9 21.6 ~ 19 fps
ultra 1920x1080
100%
HD Graphics 4000:
8.4  fps
Fifa 13

Fifa 13

2012
low 1024x768
100%
HD Graphics 4000:
32 44 59.1 67.2 73 73.8 75.5 77.2 78 82 83.2 83.6 84 90 96 98.1 100.4 101 101.2 105.8 106 108.1 119 130 130 135.7 148.6 165 172 ~ 97 fps
med. 1366x768
100%
HD Graphics 4000:
26 29 34 37.5 45.5 48 48.5 50.1 51.2 53.3 54 55 55.3 57 58 58.3 59.6 63.9 64 65 67.2 69 71 72 72 89.6 97 105 110.3 ~ 61 fps
high 1366x768
100%
HD Graphics 4000:
18.2 20 22 23.9 26.5 28.4 29 30 30 31 31.6 32 33 33.9 34 34.8 35.4 38 38 38.4 39.1 42 42.6 48 48.2 51.9 52 55 56 57 ~ 37 fps
ultra 1920x1080
100%
HD Graphics 4000:
9.3 15 15 18 20.2 22 25 26 27 27.3 29 29.1 ~ 22 fps
F1 2012

F1 2012

2012
low 1024x768
100%
HD Graphics 4000:
27 28 28 31 31 32 32 32 32 33 33 34 36 40 55 ~ 34 fps
med. 1366x768
100%
HD Graphics 4000:
18 23 23 24 25 26 27 27 28 29 29 33 34 ~ 27 fps
high 1366x768
100%
HD Graphics 4000:
14 15 17 18 18 21 21 22 22 23 24 25 29 ~ 21 fps
ultra 1920x1080
100%
HD Graphics 4000:
12 12 12 ~ 12 fps
low 1024x768
100%
HD Graphics 4000:
27.2 32.7 41 ~ 34 fps
med. 1366x768
100%
HD Graphics 4000:
21.7 23.2 26.2 ~ 24 fps
high 1366x768
100%
HD Graphics 4000:
15.7 15.8 19.3 ~ 17 fps
ultra 1920x1080
100%
HD Graphics 4000:
10.3  fps
Torchlight 2

Torchlight 2

2012
low 1024x768
100%
HD Graphics 4000:
58.7 64.7 ~ 62 fps
med. 1366x768
100%
HD Graphics 4000:
34 36.7 ~ 35 fps
ultra 1920x1080
100%
HD Graphics 4000:
18.8 22.7 ~ 21 fps
low 1024x768
100%
HD Graphics 4000:
17.9 21.6 25 32 34 35 35 44 44 45 45.3 49.4 ~ 36 fps
high 1366x768
100%
HD Graphics 4000:
5.8 7.3 11 12 13 14 14.8 15 15.1 15.8 ~ 12 fps
ultra 1920x1080
100%
HD Graphics 4000:
5 5 5.3 11 12 ~ 8 fps
low 1024x768
100%
HD Graphics 4000:
55.3 62 77.7 78.6 105.5 144.7 ~ 87 fps
med. 1366x768
100%
HD Graphics 4000:
35.5 37.3 43.9 49.7 63.2 64 ~ 49 fps
high 1366x768
100%
HD Graphics 4000:
20.3 21.3 25.2 28.2 33.5 39 ~ 28 fps
ultra 1920x1080
100%
HD Graphics 4000:
13.1 20.9 26 ~ 20 fps
med. 1366x768
100%
HD Graphics 4000:
21 27.2 ~ 24 fps
ultra 1920x1080
100%
HD Graphics 4000:
12 15.3 ~ 14 fps
low 1024x768
100%
HD Graphics 4000:
12.8 21 21.4 24.8 24.8 31.6 ~ 23 fps
med. 1366x768
100%
HD Graphics 4000:
9.2 14 14.9 15 17.2 22.3 ~ 15 fps
high 1366x768
100%
HD Graphics 4000:
5 7 7.5 7.6 7.9 9.2 ~ 7 fps
ultra 1920x1080
100%
HD Graphics 4000:
5  fps
low 1024x768
100%
HD Graphics 4000:
23.5  fps
med. 1366x768
100%
HD Graphics 4000:
17.8  fps
high 1366x768
100%
HD Graphics 4000:
11.6  fps
low 1024x768
100%
HD Graphics 4000:
14.1 15.5 ~ 15 fps
med. 1366x768
100%
HD Graphics 4000:
8.3  fps
low 1024x768
100%
HD Graphics 4000:
22.3  fps
low 1024x768
100%
HD Graphics 4000:
33 39.6 51 54.3 54.5 60 ~ 49 fps
med. 1366x768
100%
HD Graphics 4000:
20.3 21 24.5 31.1 31.6 33 ~ 27 fps
high 1366x768
100%
HD Graphics 4000:
12.8 16 17.2 19 21 ~ 17 fps
ultra 1920x1080
100%
HD Graphics 4000:
5.7 6 6 7 7 ~ 6 fps
low 1024x768
100%
HD Graphics 4000:
14.2 23 28.4 34 35 36 37 37.5 38 39 39.6 39.8 42.4 42.5 43 43 43.2 44 44 45 45.9 46 46.7 47 48 49 50 50 50 50.3 50.6 51 52.3 53 53.1 53.1 53.9 56 58 60 62 65.5 74 80 ~ 47 fps
med. 1366x768
100%
HD Graphics 4000:
14 17.2 19 21 21 21.8 22 22 22.5 22.5 22.8 23 23.3 24.4 24.6 24.6 25 25 25 25 26 26 26 26.4 26.4 26.5 28 29 29 29 29 29.4 29.6 30 30.4 30.6 31 32 32 32.2 36 36 ~ 26 fps
high 1366x768
100%
HD Graphics 4000:
10 11 13.9 14 14 14.6 16 17 17 18 18 18.4 18.6 19 20 20 20 20 20.3 21 21 21 21.4 21.6 22 23.1 23.9 24 24 24 24.5 24.8 25 25.4 26 26 26 26.7 27.3 28 29 ~ 21 fps
ultra 1920x1080
100%
HD Graphics 4000:
10.8 11 11.2 11.6 13 13 13.2 14 14.4 15 16 16 16 17 ~ 14 fps
low 1024x768
100%
HD Graphics 4000:
16 21 25 25.3 33 ~ 24 fps
med. 1366x768
100%
HD Graphics 4000:
10 13 16.8 17 ~ 14 fps
high 1366x768
100%
HD Graphics 4000:
8 10 12.8 13 ~ 11 fps
ultra 1920x1080
100%
HD Graphics 4000:
5.9 6 ~ 6 fps
low 1280x720
100%
HD Graphics 4000:
15.9 18 20 21.1 21.2 25.4 27.4 27.7 42.4 42.5 48.3 ~ 28 fps
high 1366x768
100%
HD Graphics 4000:
11 11 11.7 15.3 16.2 19 19.9 20.1 30.7 30.9 33.9 ~ 20 fps
ultra 1920x1080
100%
HD Graphics 4000:
8.3 12.3 18.1 18.2 18.8 ~ 15 fps
Alan Wake

Alan Wake

2012
low 1024x768
100%
HD Graphics 4000:
10 11.5 13.6 14.4 16.2 ~ 13 fps
med. 1366x768
100%
HD Graphics 4000:
8 10.3 10.6 11.8 ~ 10 fps
ultra 1920x1080
100%
HD Graphics 4000:
4.8 4.8 5.3 ~ 5 fps
Anno 2070

Anno 2070

2011
low 1024x768
100%
HD Graphics 4000:
18.4 19 19.5 20 26.5 27 28.9 29 30.9 31.2 31.9 32.4 32.6 33 33 33 33.1 33.5 33.7 33.7 34 34.2 34.5 35 35.7 36 36.7 37.2 37.3 37.4 37.4 37.4 38.1 38.5 38.5 38.6 38.6 38.8 38.8 39 39 39 39 41.5 42 42 42.2 42.4 42.8 43 43.1 43.2 43.4 44 44.1 44.7 45 45.5 46 46.7 47 47.7 48 50.2 51.7 51.9 52.4 53.5 54.8 55 55.4 58.2 60 ~ 39 fps
med. 1366x768
100%
HD Graphics 4000:
8.5 8.6 9 10.5 13.2 14.4 15 15.7 15.9 15.9 16.4 16.4 16.6 16.7 17 17.3 17.3 17.4 17.5 17.7 17.9 18 18.1 18.1 18.4 18.4 18.5 18.8 18.8 18.8 19 19.1 19.3 19.3 19.4 19.5 19.7 19.7 19.7 19.8 19.9 20 20 20 20 20.1 20.2 20.3 21 21 21.1 21.2 21.7 21.9 22 22 22 22.7 22.7 22.8 23.1 23.8 24.2 24.4 24.9 25.5 25.9 26 26 26.2 26.3 27.9 30 ~ 20 fps
high 1366x768
100%
HD Graphics 4000:
6 6.6 8 9.9 10 10 10.1 10.1 10.1 10.3 10.8 11 11.3 11.4 11.7 11.8 11.8 12 12 12.1 12.2 12.4 12.4 12.4 12.5 12.6 12.6 12.7 12.8 12.9 12.9 12.9 13 13 13 13 13 13 13.2 13.2 13.5 13.6 13.9 14 14 14 14.3 14.4 14.5 14.8 15.5 15.8 16 16.3 16.3 17.8 19 30 ~ 13 fps
ultra 1920x1080
100%
HD Graphics 4000:
3.2 5.4 5.5 5.8 6.2 6.4 6.4 6.6 7 7.2 7.7 7.8 7.9 8 8.1 8.7 15 20 ~ 8 fps
low 1280x720
100%
HD Graphics 4000:
13.6 17 23 24.2 24.5 25 25.4 25.5 26.1 26.8 26.9 27 27.2 27.6 29 29.1 30 30 34.3 35.2 35.9 36 37.9 39.5 ~ 28 fps
med. 1366x768
100%
HD Graphics 4000:
6.2 11.8 12 12 12 12.5 13 13 13.1 13.3 13.3 13.4 14 15.2 15.4 16 16.9 17.4 17.7 17.7 17.8 19.5 26 ~ 15 fps
high 1366x768
100%
HD Graphics 4000:
6.9 7 7 7.5 7.7 7.7 7.8 7.9 9.7 10 10 10.2 10.3 10.3 11.2 14 ~ 9 fps
ultra 1920x1080
100%
HD Graphics 4000:
5.4 5.5 6.1 ~ 6 fps
low 1024x768
100%
HD Graphics 4000:
23 69.7 78.8 84.5 ~ 64 fps
med. 1366x768
100%
HD Graphics 4000:
14 37.2 42.8 47 ~ 35 fps
high 1366x768
100%
HD Graphics 4000:
12 17.5 18 19.9 ~ 17 fps
ultra 1920x1080
100%
HD Graphics 4000:
12.3 12.7 14.2 ~ 13 fps
low 1024x768
100%
HD Graphics 4000:
4.5 9.8 10.7 11.7 11.8 12.1 12.2 14.1 14.4 14.8 14.9 15.1 15.4 15.7 22.9 23.1 24.5 24.8 26.9 ~ 16 fps
med. 1366x768
100%
HD Graphics 4000:
6.4 9 9.1 9.3 9.7 11 12.2 12.2 12.3 17.3 17.5 18.2 18.5 20.4 ~ 13 fps
high 1366x768
100%
HD Graphics 4000:
7.5 8 9.7 9.8 10.2 13.8 13.9 14.1 15.3 ~ 11 fps
ultra 1920x1080
100%
HD Graphics 4000:
3.2 5.1 5.4 5.8 ~ 5 fps
low 1024x768
100%
HD Graphics 4000:
61  fps
med. 1366x768
100%
HD Graphics 4000:
45  fps
high 1366x768
100%
HD Graphics 4000:
13  fps
ultra 1920x1080
100%
HD Graphics 4000:
8  fps
Fifa 12

Fifa 12

2011
low 800x600
100%
HD Graphics 4000:
37 58.9 62 79 105.9 108 115.2 127 136.2 143 189.4 192.1 ~ 113 fps
med. 1024x768
100%
HD Graphics 4000:
21 38.2 39.8 49 57.9 60.3 62.1 63.6 65.8 68 76 85.4 99.2 106.4 ~ 64 fps
high 1360x768
100%
HD Graphics 4000:
18.4 19.1 22 23.7 26 29.9 30.8 31 33.9 37.9 38.3 44.1 47.8 50.8 ~ 32 fps
ultra 1920x1080
100%
HD Graphics 4000:
18.3 24.5 25 26.5 28.3 ~ 25 fps
F1 2011

F1 2011

2011
low 800x600
100%
HD Graphics 4000:
32 33 48 61 70 70 78 ~ 56 fps
med. 1024x768
100%
HD Graphics 4000:
22 24 26 34 38 40 42 ~ 32 fps
high 1366x768
100%
HD Graphics 4000:
12 15 16 16 17 18 ~ 16 fps
ultra 1920x1080
100%
HD Graphics 4000:
12 12 12 ~ 12 fps
low 1024x768
100%
HD Graphics 4000:
28 32.5 37 37.5 38 38.5 41.8 45.8 52.7 54.3 60.2 65.5 66.8 74.5 ~ 48 fps
high 1366x768
100%
HD Graphics 4000:
16.7 16.7 17.6 19 21.3 21.3 22.9 23 28 30.2 30.8 31.1 31.8 32.9 33 ~ 25 fps
ultra 1920x1080
100%
HD Graphics 4000:
11.1 12.6 13 13.3 ~ 13 fps
Dirt 3

Dirt 3

2011
low 800x600
100%
HD Graphics 4000:
51.6 60.1 68.6 77.5 ~ 64 fps
med. 1024x768
100%
HD Graphics 4000:
27.4 36.7 38.2 45 ~ 37 fps
high 1360x768
100%
HD Graphics 4000:
17.6 22.3 22.4 25.1 ~ 22 fps
ultra 1920x1080
100%
HD Graphics 4000:
12.8 12.8 12.8 ~ 13 fps
low 1024x768
100%
HD Graphics 4000:
21  fps
med. 1366x768
100%
HD Graphics 4000:
13  fps
Crysis 2

Crysis 2

2011
low 800x600
100%
HD Graphics 4000:
29.1 40.6 43.7 49.5 ~ 41 fps
med. 1024x768
100%
HD Graphics 4000:
19.5 27.2 27.7 31.1 ~ 26 fps
high 1366x768
100%
HD Graphics 4000:
11.2 19.2 19.2 21.3 ~ 18 fps
ultra 1920x1080
100%
HD Graphics 4000:
4.7 7 7.2 7.7 ~ 7 fps
Total War: Shogun 2

Total War: Shogun 2

2011
low 1024x768
100%
HD Graphics 4000:
47.1 74.2 113 ~ 78 fps
low 800x600
100%
HD Graphics 4000:
44.8 51.5 53 54.5 ~ 51 fps
med. 1024x768
100%
HD Graphics 4000:
30.6 34.1 36 36.5 ~ 34 fps
high 1360x768
100%
HD Graphics 4000:
19.5 20.5 22 22.5 ~ 21 fps
ultra 1920x1080
100%
HD Graphics 4000:
15.7 16.2 16.9 ~ 16 fps
Mafia 2

Mafia 2

2010
low 800x600
100%
HD Graphics 4000:
21.3 26.6 29.1 35.6 38.8 40.5 ~ 32 fps
med. 1024x768
100%
HD Graphics 4000:
19.8 22.1 22.4 27.1 30.8 32.1 ~ 26 fps
high 1360x768
100%
HD Graphics 4000:
17.5 18.7 18.7 20.6 23.4 26.2 ~ 21 fps
ultra 1920x1080
100%
HD Graphics 4000:
12.8 14.6 16.3 ~ 15 fps
low 1024x768
100%
HD Graphics 4000:
62 63.8 64.1 65.6 78 79 82 85.7 89 93.6 96.2 105 108 117 125 126 126 142.4 143 143.3 145 151 152.4 153.1 160.9 186 ~ 113 fps
med. 1360x768
100%
HD Graphics 4000:
10.6 12.6 17.5 18 18 20 21 21 22.6 23.2 24.7 26 26 27 28 28 28.2 29 30 30.8 31.2 32 32.4 33.3 33.4 34.3 ~ 25 fps
high 1360x768
100%
HD Graphics 4000:
6.9 8.9 8.9 10 11 11 11 12 12.9 13.1 13.1 16 17 17 18 18 18.9 19.2 20 20.1 20.3 20.4 20.9 21.2 22 22.4 ~ 16 fps
ultra 1920x1080
100%
HD Graphics 4000:
5 9 10.8 10.9 10.9 12 12 ~ 10 fps
Just Cause 2

Just Cause 2

2010
ultra 1920x1080
100%
HD Graphics 4000:
11.2  fps
low 800x600
100%
HD Graphics 4000:
19 19 22.4 25.3 30 38.1 41.2 44.3 51 ~ 32 fps
med. 1360x768
100%
HD Graphics 4000:
9 12.7 14 15 20.1 21.5 23.7 25 ~ 18 fps
high 1600x900
100%
HD Graphics 4000:
5.3 12.1 12.5 13.6 ~ 11 fps
ultra 1920x1080
100%
HD Graphics 4000:
4.1 4.3 4.6 4.7 ~ 4 fps
low 1024x768
100%
HD Graphics 4000:
78.8  fps
med. 1366x768
100%
HD Graphics 4000:
34.2  fps
high 1366x768
100%
HD Graphics 4000:
19.4  fps
ultra 1920x1080
100%
HD Graphics 4000:
8.2  fps
Risen

Risen

2009
low 800x600
100%
HD Graphics 4000:
20.5 27.3 28.6 29.3 29.6 38.8 39.5 42.4 58.6 ~ 35 fps
med. 1024x768
100%
HD Graphics 4000:
9.4 14.9 16.6 16.8 18.1 19.6 22.5 26.1 26.5 ~ 19 fps
high 1366x768
100%
HD Graphics 4000:
6.1 11 13.1 13.3 13.7 14 14.5 ~ 12 fps
ultra 1920x1080
100%
HD Graphics 4000:
8.6 10 ~ 9 fps
Resident Evil 5

Resident Evil 5

2009
low 800x600
100%
HD Graphics 4000:
93.6  fps
high 1360x768
100%
HD Graphics 4000:
39.1  fps
ultra 1920x1080
100%
HD Graphics 4000:
16.4  fps
Colin McRae: DIRT 2

Colin McRae: DIRT 2

2009
low 800x600
100%
HD Graphics 4000:
20.3 44.7 ~ 33 fps
med. 1024x768
100%
HD Graphics 4000:
18.6 34.1 ~ 26 fps
high 1360x768
100%
HD Graphics 4000:
12.8  fps
Sims 3

Sims 3

2009
med. 1024x768
100%
HD Graphics 4000:
33  fps
high 1280x1024
100%
HD Graphics 4000:
21  fps
Trackmania Nations Forever

Trackmania Nations Forever

2008
low 640x480
100%
HD Graphics 4000:
127 131 135 163 177 ~ 147 fps
high 1024x768
100%
HD Graphics 4000:
26.4 30.5 37.2 45.7 47 ~ 37 fps
ultra 1920x1080
100%
HD Graphics 4000:
18 22.1 ~ 20 fps
Call of Duty 4 - Modern Warfare

Call of Duty 4 - Modern Warfare

2007
low 800x600
100%
HD Graphics 4000:
100.6  fps
med. 1024x768
100%
HD Graphics 4000:
43.3  fps
World in Conflict - Benchmark

World in Conflict - Benchmark

2007
low 800x600
100%
HD Graphics 4000:
49 84 ~ 67 fps
med. 1024x768
100%
HD Graphics 4000:
20 35 ~ 28 fps
high 1024x768
100%
HD Graphics 4000:
12 14 ~ 13 fps
Call of Juarez Benchmark

Call of Juarez Benchmark

2006
high 1024x768
100%
HD Graphics 4000:
15.4  fps
World of Warcraft

World of Warcraft

2005
low 800x600
100%
HD Graphics 4000:
79 81 98 99 112 117 123 ~ 101 fps
med. 1024x768
100%
HD Graphics 4000:
58 62 62 63 65 65 76 83 ~ 67 fps
high 1280x1024
100%
HD Graphics 4000:
12 15 16 17 20 20 21 ~ 17 fps
ultra 1920x1080
100%
HD Graphics 4000:
8  fps

Average Gaming Intel HD Graphics 4000 → 100%

Average Gaming 30-70 fps → 100%

Average Gaming NVIDIA Quadro T1000 (Laptop) → 1060%

Intel HD Graphics 4000NVIDIA Quadro T1000 (Laptop)
lowmed.highultraQHD4Klowmed.highultraQHD4K
Gears Tactics190.991.858.443.5
Doom Eternal1507864.3
Hunt Showdown134.15144.4
Escape from Tarkov121.487.967.856
Red Dead Redemption 287.946.729.919.4
Star Wars Jedi Fallen Order67.357.650.4
Need for Speed Heat8660.551.946.9
Call of Duty Modern Warfare 201996.761.250.844
GRID 2019125.476.865.242.8
Ghost Recon Breakpoint93534732
FIFA 20208171.3160.3148.9
Borderlands 3117.958.73828.5
Control136.842.431.2
F1 2019148897764
Total War: Three Kingdoms186613825
Rage 2123.755.245.745.1
Anno 180082634122
The Division 2111504232
Dirt Rally 2.0209917239
Far Cry New Dawn77484643
Metro Exodus93.343.431.925.5
Apex Legends144836362
Battlefield V100605247
Farming Simulator 19182.4106.786.366.5
Assassin´s Creed Odyssey70484329
FIFA 19148119.2113.5110.8
Shadow of the Tomb Raider100544842
Far Cry 5107625753
World of Tanks enCore491.9199.377.1
X-Plane 11.11938069
Kingdom Come: Deliverance93.749.340.530.7
Final Fantasy XV Benchmark674633
Rocket League246.4150.7117
Ghost Recon Wildlands9447.243.924.2
For Honor182726953
Rise of the Tomb Raider10136.28653.443.8
Rainbow Six Siege217179125108
Dota 2 Reborn9640.216.914212511710947.9
The Witcher 31791085935
GTA V26.8170.1153.993.841.7
BioShock Infinite271412429822620180
Intel HD Graphics 4000NVIDIA Quadro T1000 (Laptop)
lowmed.highultraQHD4Klowmed.highultraQHD4K
< 30 fps
< 60 fps
< 120 fps
≥ 120 fps
3

1
1
1

2


1


< 30 fps
< 60 fps
< 120 fps
≥ 120 fps


17
23

14
20
7
1
23
13
3
7
19
8
1


1

For more games that might be playable and a list of all games and graphics cards visit our Gaming List

Add one or more devices and compare

In the following list you can select (and also search for) devices that should be added to the comparison. You can select more than one device.

restrict list:
v1.33
log 24. 05:57:28

#0 ran 0s before starting gpusingle class +0s ... 0s

#1 checking url part for id 2822 +0s ... 0s

#2 checking url part for id 9860 +0s ... 0s

#3 redirected to Ajax server, took 1753329447s time from redirect:0 +0s ... 0s

#4 did not recreate cache, as it is less than 5 days old! Created at Wed, 23 Jul 2025 13:17:33 +0200 +0s ... 0s

#5 composed specs +0.032s ... 0.032s

#6 did output specs +0s ... 0.032s

#7 start showIntegratedCPUs +0s ... 0.032s

#8 getting avg benchmarks for device 2822 +0.02s ... 0.053s

#9 got single benchmarks 2822 +0.122s ... 0.175s

#10 getting avg benchmarks for device 9860 +0.004s ... 0.178s

#11 got single benchmarks 9860 +0.007s ... 0.185s

#12 got avg benchmarks for devices +0s ... 0.185s

#13 No cached benchmark found, getting uncached values +0.029s ... 0.215s

#14 min, max, avg, median took s +0.025s ... 0.24s

#15 before gaming benchmark output +0s ... 0.24s

#16 Got 1844 rows for game benchmarks. +0.056s ... 0.297s

#17 composed SQL query for gamebenchmarks +0s ... 0.297s

#18 got data and put it in $dataArray +0.011s ... 0.308s

#19 benchmarks composed for output. +0.05s ... 0.357s

#20 calculated avg scores. +0s ... 0.357s

#21 return log +0.002s ... 0.359s

Please share our article, every link counts!
Mail Logo
> Expert Reviews and News on Laptops, Smartphones and Tech Innovations > Benchmarks / Tech > Graphics Card Comparison - Head 2 Head
Redaktion, 2017-09- 8 (Update: 2023-07- 1)